Abstract
Southern China is the birthplace of rice-cultivating agriculture and different language families and has also witnessed various human migrations that facilitated cultural diffusions. The fine-scale demographic history in situ that forms present-day local populations, however, remains unclear. To comprehensively cover the genetic diversity in East and Southeast Asia, we generated genome-wide SNP data from 211 present-day Southern Chinese and co-analyzed them with ∼1,200 ancient and modern genomes. In Southern China, language classification is significantly associated with genetic variation but with a different extent of predictability, and there is strong evidence for recent shared genetic history particularly in Hmong–Mien and Austronesian speakers. A geography-related genetic sub-structure that represents the major genetic variation in Southern East Asians is established pre-Holocene and its extremes are represented by Neolithic Fujianese and First Farmers in Mainland Southeast Asia. This sub-structure is largely reduced by admixture in ancient Southern Chinese since > ∼2,000 BP, which forms a “Southern Chinese Cluster” with a high level of genetic homogeneity. Further admixture characterizes the demographic history of the majority of Hmong–Mien speakers and some Kra-Dai speakers in Southwest China happened ∼1,500–1,000 BP, coeval to the reigns of local chiefdoms. In Yellow River Basin, we identify a connection of local populations to genetic sub-structure in Southern China with geographical correspondence appearing > ∼9,000 BP, while the gene flow likely closely related to “Southern Chinese Cluster” since the Longshan period (∼5,000–4,000 BP) forms ancestry profile of Han Chinese Cline.
Introduction
The recent advance in ancient DNA (aDNA) studies has substantially extended our knowledge about the demographic history of modern human in East and Southeast Asia. To date, the oldest ancient genomes with a closer relationship to present-day East Asians than West Eurasians are three individuals from Bacho Kiro Cave in Bulgaria ranging ∼46,000–42,500 years before present (BP) (Hajdinjak et al., 2021). In East and Southeast Asia, the only three genomes available from pre-Last Glacial Maximum [LGM, ∼26,500–19,000 BP (Clark et al., 2009)], i.e., ∼39,500-year-old Tianyuan (Yang et al., 2017), ∼34,000-year-old Salkhit (Massilani et al., 2020), and ∼33,000-year-old AR33K (Mao et al., 2021), represent a deeply diverged East Asian-related lineage that is now extinct. Regarding the post-LGM history, especially those since the dawn of Holocene [∼11,500 BP (Mayewski et al., 2004)], ≥ 200 ancient genomes already reported document at least four major transformations shaping the genomic structure of present-day East and Southeast Asians. First, the ancestry of indigenous Jomon hunter-gatherers in the Japanese archipelago was substantially replaced by migrants from Mainland East Asia < 3,000 BP, who putatively carry a genetic profile (i.e., the composition of ancestries) similar to farmers from West Liao River ∼3,800 BP (Gakuhari et al., 2020; Ning et al., 2020; Wang C. C. et al., 2021). Second, the expansion of farmers from Upper and Middle Yellow River Basin ∼5,000 BP likely contributed to the spread of Sino-Tibetan languages (Wang C. C. et al., 2021). Third, the continuous gene flow between northern and southern China since Holocene shaped the genetic profile of many East Asian populations, especially Han Chinese (Ning et al., 2020; Yang et al., 2020; Wang C. C. et al., 2021; Wang T. et al., 2021). Fourth, the migrants out of southern China since ∼4,000 BP, who carry a shared ancestry putatively related to unsampled farmers from Yangtze River, likely facilitated the diffusion of wet-rice agriculture and language families, such as Austronesian and Austroasiatic languages (Skoglund et al., 2016; Lipson et al., 2018a,b, 2020; McColl et al., 2018; Yang et al., 2020; Pugach et al., 2021; Wang C. C. et al., 2021).
However, the low coverage of many ancient genomes makes it hard to apply the methods based on high-coverage phased data (e.g., haplotype-based ones) to infer fine-scale demographic history. Meanwhile, recent genetic studies based on present-day populations have documented many demographic events that are underrepresented in aDNA studies, such as West Eurasian-related gene flow in Hui populations (Ma et al., 2021), recent history of Mongols (Zhao et al., 2020) and Tujia people (He G. L. et al., 2020), and recent genetic drifts of populations in Mainland Southeast Asia (Kutanan et al., 2020, 2021; Liu et al., 2020; Changmai et al., 2021). Therefore, generating and analyzing present-day genomic data from East Asia, especially currently underrepresented sub-regions (e.g., Southwest China), is necessary for the in-depth understanding of demographic history in this region.
Particularly for Southern China, which has a profound ethnolinguistic diversity with > 100 languages covering five language families (Sino-Tibetan, Austronesian, Austroasiatic, Kra-Dai, and Hmong–Mien) (Institute of Linguistics [IOL], 2012), there has been a long-lasting interest in the demographic history of local populations (The HUGO Pan-Asian SNP Consortium, 2009; Xu et al., 2009) even before the massive aDNA sequencing is feasible. However, since many ethnolinguistic groups in Southern China are underrepresented in previous aDNA studies, the demographic events pertinent to the formation of current ancestry characteristics for these groups, such as recent migrations and admixtures, are less understood. Accordingly, there is still no very clear picture of how and to what extent these demographic events are related to the diffusion of various cultural features, such as language families and archeological traditions.
In this study, we generated new genome-wide data of 211 present-day Southern Chinese individuals, who belong to 30 geographic subgroups that have not yet been represented in genomic studies (Figure 1A and Supplementary Tables 1, 2). To thoroughly reconstruct the demographic history of Southern Chinese in relation to other East Asians, we co-analyzed them with ∼1,200 modern and high-coverage ancient samples from East and Southeast Asia, which cover the main ethnolinguistic and archeological diversity in East Asia that is accessible till now with a high resolution (Supplementary Table 3).
FIGURE 1
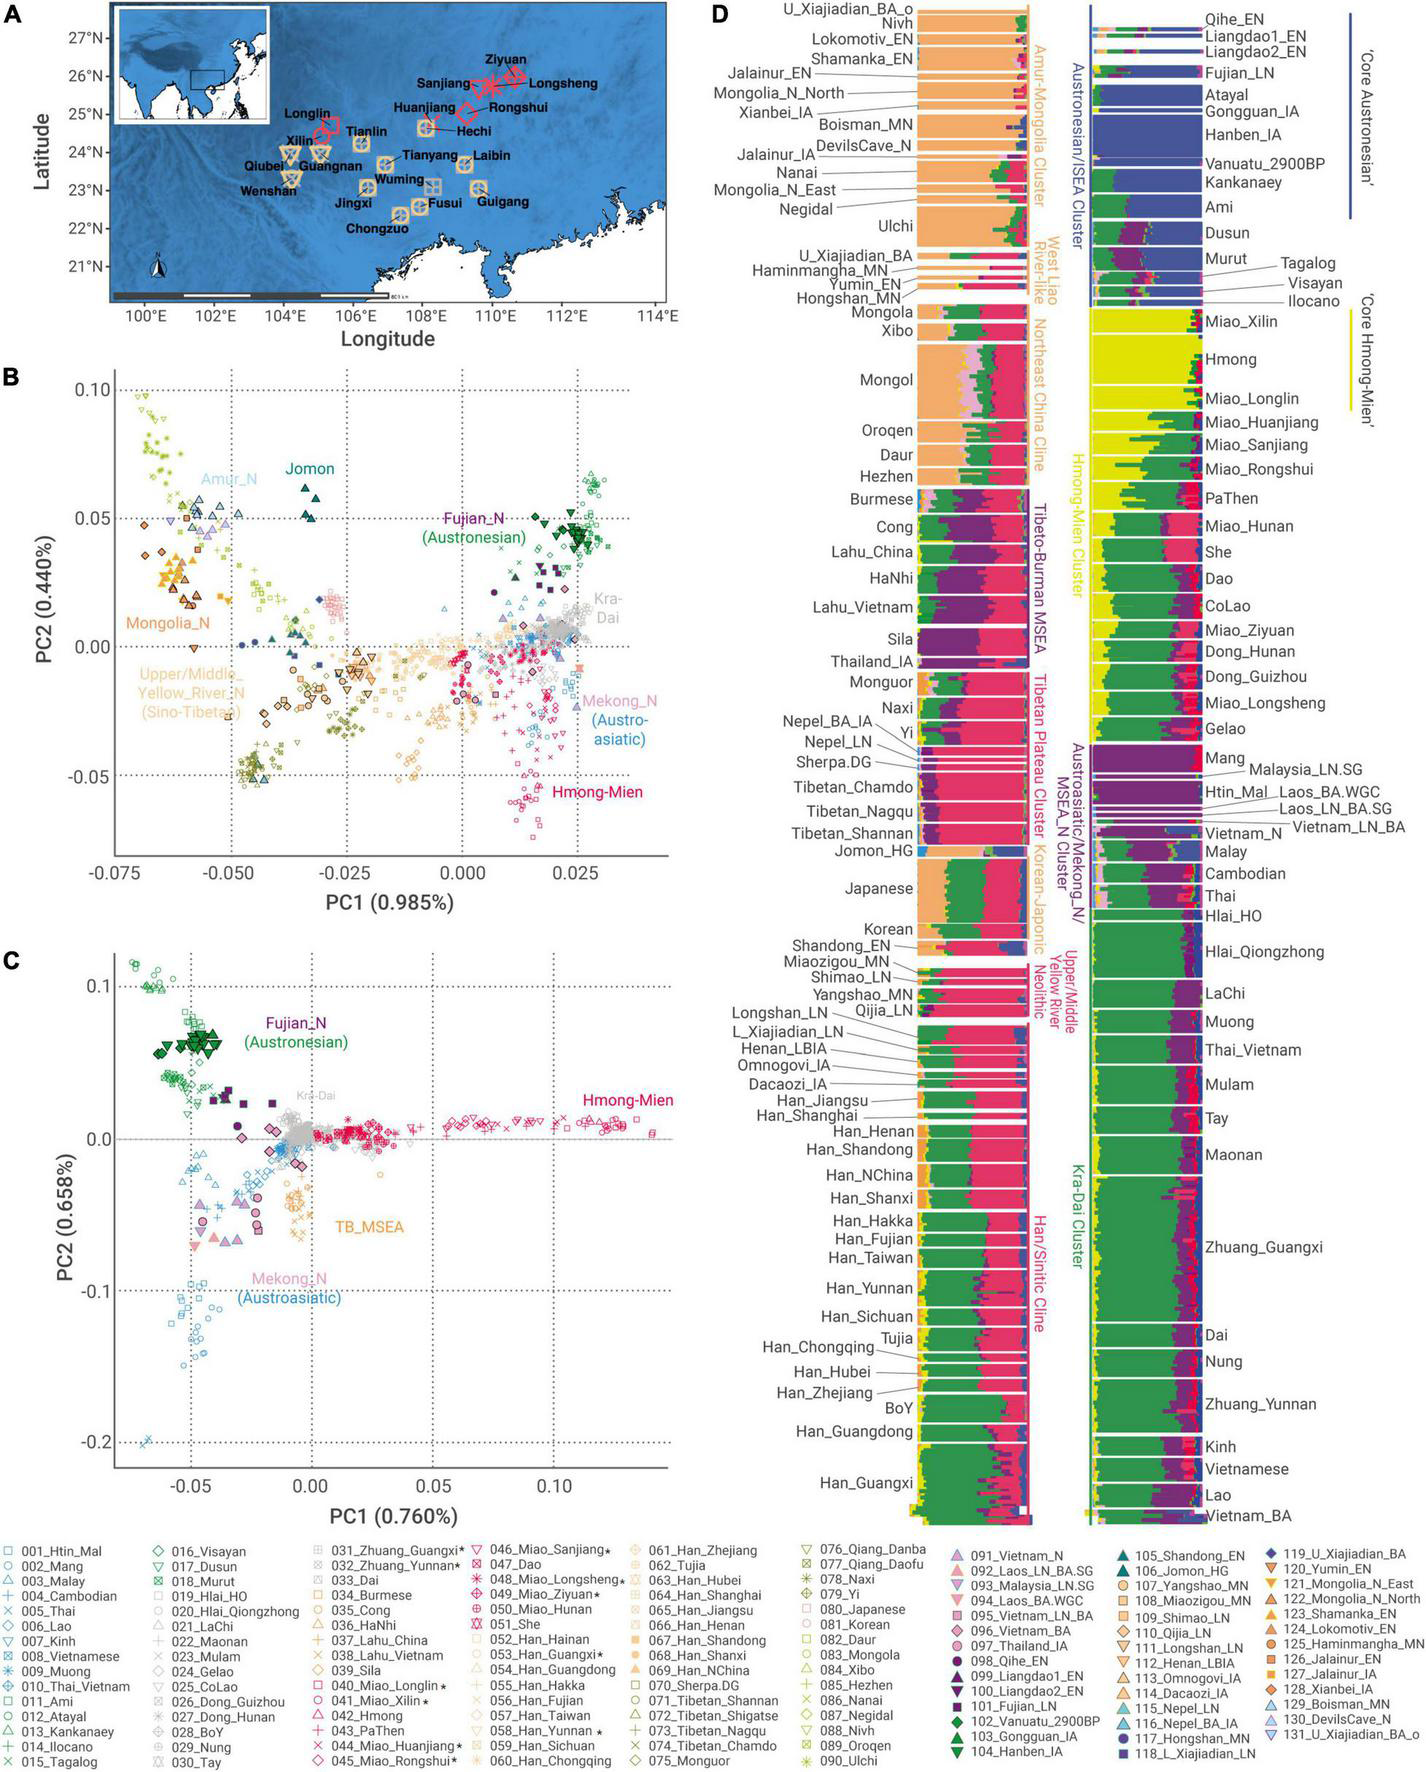
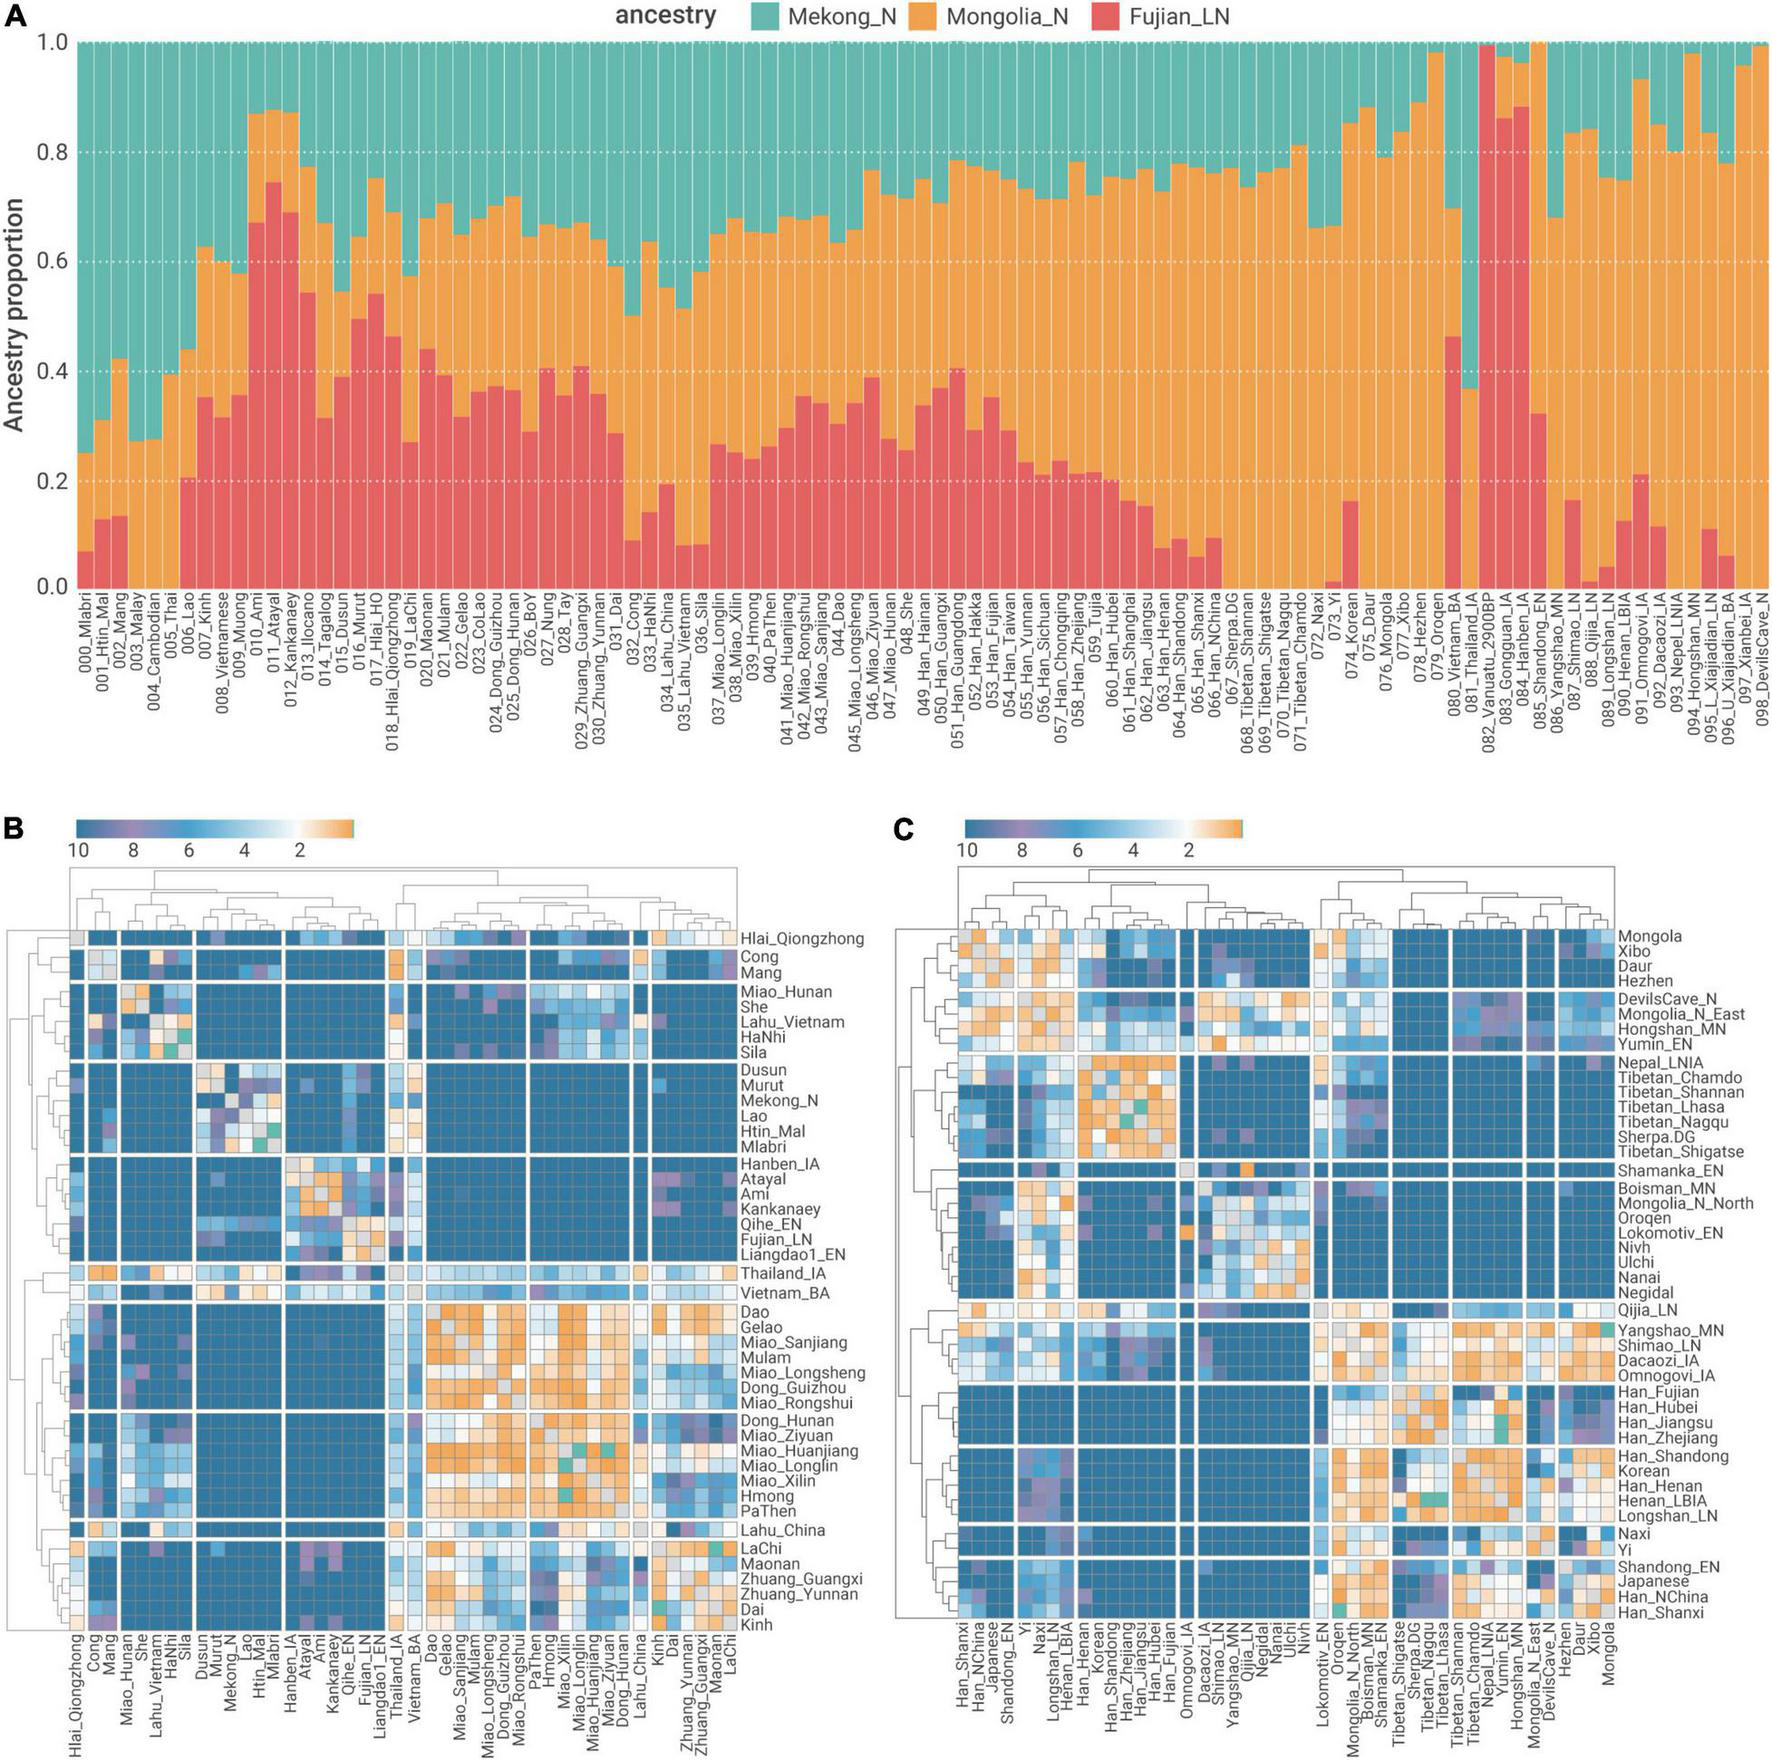
An overview of newly reported samples and genetic structure of East Asians (A) locations of newly reported individuals in this study. (B,C) Principal component analysis for (B) all the East-Asians and (C) Southern East Asians. We projected ancient samples to principal components (PCs) constructed by modern samples. TB_MSEA, Tibeto-Burman speakers in Mainland Southeast Asia. (D) Unsupervised ADMIXTURE plot at K = 10, identifying six major ancestries in East Asia: orange, Tungusic/Northeast Asian-related; red, Sino-Tibetan-related; blue, Austronesian-related; green, Kra-Dai-related; yellow, Hmong–Mien-related; purple, Austroasiatic-related. Newly sampled populations are in asterisk (*).
Materials and Methods
Sampling and Genotyping
We collected blood and saliva samples from 211 unrelated individuals affiliated to Miao, Zhuang, and Han ethnicities from 30 subgroups in Guangxi and Yunnan of Southern China (Supplementary Tables 1, 2). The study was approved by the Ethical Committee of Youjiang Medical University for Nationalities and Xiamen University (approval number: XDYX2019009). All the processes involved were consistent with the corresponding ethical principles. All the participants read and signed the informed content. Then, we achieved the genotyped data of these samples using the Affymetrix WeGene V1 Array, which includes 492,683 genome-wide SNPs and is referred to as the “500K dataset” elsewhere in this article. Other experimental and bioinformatic procedures for genotyping were consistent with the protocol documented in the previous studies (Huang et al., 2018; He G. et al., 2020).
Dataset Arrangement
We merged our 500K dataset with published present-day and ancient genomic data (Patterson et al., 2012; Fu et al., 2014; Lazaridis et al., 2014, 2016; Prüfer et al., 2014, 2017; Jones et al., 2015; Mathieson et al., 2015; Skoglund et al., 2015, 2016; The 1000 Genomes Project Consortium, 2015; Jeong et al., 2016, 2019; Mallick et al., 2016; Mondal et al., 2016; Schlebusch et al., 2017; Siska et al., 2017, Prüfer et al., 2017; de Barros Damgaard et al., 2018a,b; Lipson et al., 2018a,b; McColl et al., 2018; Mittnik et al., 2018; Moreno-Mayar et al., 2018a,b; Flegontov et al., 2019; Narasimhan et al., 2019; Ning et al., 2019, 2020; Sikora et al., 2019; He G. et al., 2020; Liu et al., 2020; Yang et al., 2020; Wang C. C. et al., 2021), resulting in two types of panel: (1) merged panel of 500K dataset and 1240K-capture dataset (1,233,013 SNPs, including all the ancient samples and shotgun-sequenced modern samples) with 372,929 SNPs, which is to maximize the number of informative SNPs; (2) merged panel of the panel above and 600K Human Origin Array dataset (597,573 SNPs, including other modern samples) with 110,931 SNPs, which is to maximize the number and size of populations. Detailed information about genome-wide SNP samples co-analyzed in this study and corresponding population labels is listed in Supplementary Table 3. For Rarecoal analysis, we used 56 whole-genome sequences from Simons Genome Diversity Project (SGDP) (Mallick et al., 2016), whose detailed information was listed in Supplementary Table 4.
Abbreviations
We used the following abbreviations throughout our article: BP, years before present; cal, calibrated (radiocarbon date); LP, Late Pleistocene; M, Mesolithic; N, Neolithic; EN, Early Neolithic; MN, Middle Neolithic; LN, Late Neolithic; BA, Bronze Age; IA, Iron Age; o, outlier; low_cov, low coverage; hq, high quality; HG, hunter-gatherer; MSEA, Mainland Southeast Asia; ISEA, Island Southeast Asia; AN, Austronesian; AA, Austroasiatic; HM, Hmong–Mien; KD, Kra-Dai; HO, Human Origin Array. Particularly, Mongolia_N refers to Mongolia_N_East unless otherwise specified.
Principal Component Analysis
We performed principal component analysis (PCA) by smartpca program of EIGENSOFT (Patterson et al., 2006) with parameters lsqproject: YES, shrinkmode: YES, numoutlieriter: 0, killr2: YES, r2thresh: 0.4, r2genlim: 0.1. We only used modern samples to construct PCs with ancient samples projected.
ADMIXTURE Analysis
We first used PLINK (Purcell et al., 2007) to prune the linkage disequilibrium (LD) by parameters—indep-pairwise 200 20 0.4. Then, we ran ADMIXTURE (Alexander et al., 2009) with unsupervised mode and default parameters from K = 2–20. We reported the result when K = 10 as it reaches the lowest cross-validation error (Supplementary Figure 2). Detailed results from K = 2 to K = 15 are presented in Supplementary Figure 3. Restricted to all the modern East Asian samples in our study as they have explicit information of language classification, we performed linear regression using the proportion of each of the six ancestry components in East Asians at K = 10 as the predicted variables and candidate corresponding language classification as predictors, which aims to assess whether and to what extent population structure is explainable by language classification.
Outlier Removal and Sample Pooling
Given the dimension reduction results from PCA and genetic clustering in ADMIXTURE, we removed genetic outliers (labels as “_o”) from our newly reported (Supplementary Table 2) and published (Supplementary Table 3) genomes. We pooled some samples into new pooled groups in qpGraph, qpAdm, qpWave, and ALDER analyses (Supplementary Tables 2, 3). Particularly, Hanben_IA_hq refers to the five high-quality Hanben_IA genomes analyzed in qpGraph.
f-Statistics
We used ADMIXTOOLS (Patterson et al., 2012) to compute f3-statistics and D-statistics (Supplementary Tables 11–13) with the estimation of standard error by a jackknife. We used Mbuti as an outgroup for Eurasian populations in outgroup-f3 and D-statistics.
Admixture Graph Modeling by qpGraph
We used the qpGraph program of ADMIXTOOLS (Patterson et al., 2012) to reconstruct the phylogeny with admixture by default parameters. We exhausted different feasible graph models and select the optimal model based on the following criteria: (1) smallest | log-likelihood| (i.e., maximum likelihood as all the likelihoods are negative) and (2) smallest worst-fitting | Z| -score (which should also be < 3). If two criteria pick up different optimal graphs, we used the first criterion unless when the difference of two log-likelihood values are < 0.1 (i.e., 1 < likelihood ratio < 1.25), which means that the fitness of two graphs is nearly indistinguishable and we tentatively chose the optimal graph with smallest worst-fitting | Z| -score instead. We started from the model with South_Africa_HG (representing sub-Saharan), Loschbour (representing West Eurasian), Andaman_HG, and Mongolia_N_East (Supplementary Figure 5), which fits well with the genetic data (max | Z| = 1.199, log-likelihood = 1.438) and is consistent with a previous study (Wang C. C. et al., 2021). Then, we sequentially added Alaska_LP (Supplementary Figure 6), Hlai_Qiongzhong (Supplementary Figure 7), Sherpa (Supplementary Figure 8), Jomon (Supplementary Figure 9), Boisman_MN (Supplementary Figure 10), Hanben_IA_hq (Supplementary Figure 11), Miao_Longlin (Supplementary Figure 12), and MSEA_N (Supplementary Figure 13) into the model. We enumerated all the possible graphs with either 0 or 1 additional admixture event when incorporating a new group into the graph in every step and used the best-fitting graph selected by the two criteria above as the basal graph in the next step. Likelihood and worst-fitting | Z| -score of all the possible graphs (| Z| < 3) are shown in Supplementary Table 19. As there is a branch with zero length in Andaman-related lineage in the best-fitting model after adding MSEA_N (Supplementary Figure 13), we enumerated all the possible topologies in Andaman-related lineage and obtained the best-fitting model that we presented in Figure 4.
Admixture Coefficient Modeling by qpAdm
We used qpAdm (Haak et al., 2015) to compute the ancestral coefficient based on f-statistics to different outgroups. We chose the optimal model for a given target population based on the following criteria, sorted by priority. (1) The model is feasible if and only if all the ancestral coefficients fall within the range [0, 1]. (2) The full model is chosen if both full and nested models are feasible. (3) If the full model is infeasible and more than one nested models are feasible, then the nested model with the highest p-value is chosen. We applied the “proximal model” and “distal model” (Narasimhan et al., 2019) to model the ancestry contribution in a different period.
Proximal Model
We used Mongolia_N_East, Mekong_N (pooled population of Vietnam_N, Laos_LN_BA.SG, and Laos_BA.WGC) and Fujian_LN as surrogates to model the ancestries within the East Asian lineage. The initial outgroups that we used are South_Africa_2000BP.SG, Ust_Ishim.DG, Yana_UP.SG, Alaska_LP, Kolyma_M, Andaman_HG, Jomon_HG, Liangdao2_EN, and Malaysia_LN.SG. We also used the “rotating” strategy (Skoglund et al., 2017) to further verify the nested models, in which we moved one of the proxies into the set of outgroups by turn. Since there is no high-coverage ancient sample that is sufficiently older than Mekong_N in Austroasiatic-related lineage, we expediently used Malaysia_LN.SG who closely related to Mekong_N as an outgroup but we caution that it tends to underestimate p-values. Therefore, we also calculated relative likelihood ratios to test whether a full model is better than its nested models and we find the ratios are usually higher than 100 (Supplementary Table 7). Original results of the proximal model are presented in Supplementary Table 6.
Distal Model
We used Mongolia_N_East and Andaman_HG/Hoabinhian as surrogates to model the ancestries related to “interior” and “coastal” expansions of East Eurasians proposed in Wang C. C. et al. (2021). We used the following outgroups in the distal model: South_Africa_2000BP.SG, Ust_Ishim.DG, Georgia_Kotias.SG, Loschbour.DG, Yana_UP.SG, Botai_EN, Russia_BA_Okunevo.SG, Russia_EHG_Karelia, Tianyuan, Papuan.DG, Mala.DG, Australian.DG, and Hoabinhian.
Genetic Continuity Testing by qpWave
We used qpWave (Reich et al., 2012) to formally test whether pairwise populations are homogeneous in relation to a series of outgroups. We used the following outgroups for Southern East Asian populations: South_Africa_2000BP.SG, Ust_Ishim.DG, Loschbour.DG, Yana_UP.SG, Alaska_LP, Kolyma_M, Andaman_ HG, Liangdao2_EN, Jomon_HG, Malaysia_LN.SG, Nepal_LN_ BA_IA, DevilsCave_N, and Shamanka_EN. We used the following outgroups for Northern East Asian populations: South_ Africa_2000BP.SG, Ust_Ishim.DG, Loschbour.DG, Yana_UP.SG, Alaska_LP, Kolyma_M, Andaman_HG, Liangdao2_EN, Jomon_ HG, Malaysia_LN.SG, Nepal_LN_BA_IA, DevilsCave_N, and Shamanka_EN.
Demographic Modeling Implemented by Rarecoal
We used the Rarecoal program based on the site frequency spectrum (SFS) (Schiffels et al., 2016; Flegontov et al., 2019) to obtain a phylogeny with time estimates using default parameters. We used mutation rate in every generation (Scally and Durbin, 2012) of 1.25 × 10⁻⁸, 29 years per generation (Fenner, 2005), and N0 = 20,000 (Schiffels et al., 2016) to scale the time. We set each modeled group with ≥ 4 individuals (i.e., ≥ 8 haplotypes) and maximum allele count = 4 to decrease the potential effect of incomplete lineage sorting that can bias the assumption of rare alleles, so that groups with fewer individuals (e.g., Onge in SGDP) were discarded. We first started from the model with European, Northern East Asian, and Coastal Southern East Asian (Supplementary Table 15), following the phylogeny obtained from qpGraph i.e., [European, (Northern East Asian, Coastal Southern East Asian)]. Then, we added Inland Southern East Asian (Supplementary Table 15), under the phylogeny [European, Northern East Asian, (Coastal Southern East Asian, Inland Southern East Asian)]. Given that the individuals used to represent Inland Southern East Asians (e.g., Thai and Cambodian in SGDP) have a small amount (< 5%) of West Eurasian ancestry in our ADMIXTURE results (Figure 1C, for corresponding HGDP individuals), which is consistent with the contribution to be able to surrogate by Chalcolithic Central Asian (Namazga) (Xia et al., 2019) or South Asian (Changmai et al., 2021) in present-day MSEA populations but is missing in all the reported ancient samples from MSEA (Lipson et al., 2018a; McColl et al., 2018), we modeled West Eurasian gene flow to these individuals surrogated by Europeans restricted to historical time (≈ 600 BP). Finally, we added Central Americas and we set the input coalescence events of Rarecoal (Supplementary Table 15), so that it can tolerate possible phylogenies of both [Central Americas, (Northern East Asian, Southern East Asian)] and [(Central Americas, Northern East Asian), Southern East Asian]. We used the date of Tianyuan (39,475 BP) (Yang et al., 2017) as the lower bound for the coalescence of European and East Asian and the date of Anzick (12,644 BP) (Rasmussen et al., 2014) as the lower bound of the coalescence of Northern East Asian and Central Americas. We used 5% as the lower bound of the proportion of European-related ancestry in Central Americas that represents the gene flow from Ancient North Siberians (Raghavan et al., 2014; Sikora et al., 2019).
Admixture Time Estimation by ALDER
We used LD-based ALDER (Loh et al., 2013) to estimate admixture time using default parameters and checkmap: YES, mindis: 0.004 (minimal distance of 0.4 cM), binsize: 0.0001 (bin size of 0.01 cM). We used 29 years per generation (Fenner, 2005) to scale time. We only report results with two reference Z-score > 3 and p < 0.001 from raw results (Supplementary Table 10), so that the inferred admixture events and corresponding admixture time estimates have sufficient statistical significance regarding the decay of admixture LD.
Identity-by-Descent Analysis
We first used SHAPEIT v2 (O’Connell et al., 2014) to phase modern individuals in our dataset. Then, we used Refine IBD software (Browning and Browning, 2013) to obtain pairwise sharing of IBD segments among individuals and used IBD segments > 0.29 cM in all the subsequent analyses involving IBD, which corresponds to the history of recent 50/0.29≈172 generations and 172 × 29 ≈ 5,000 years (Yunusbayev et al., 2015). We normalized the results in the population level by dividing them by the product of the sample size of pairwise populations.
Correlation Between NE and FST to Ust’-Ishim
We used equations 18 and 20 in Palamara et al. (2012) to estimate NE from shared IBD within a population estimated in the previous part of IBD analysis. We computed FST by smartpca (Patterson et al., 2006) with default parameters and fst only: YES.
Uniparental Haplogroup Analysis
Y-chromosomal haplogroups of newly reported samples from male individuals were assigned according to SNP state in ISOGG v.15.561; mitochondrial haplogroups of all the individuals were determined according to PhyloTree Build 17 (van Oven and Kayser, 2009; Supplementary Table 20).
Results
Genetic Structure in East Asia Highly Corresponds to Linguistic Affiliations
An Overview of Genetic Structure in East Asia
To explore the genetic structure in different geographical scales, we carried out PCA using the following two sets of populations: (1) all the East and Southeast Asians (termed as “all-East-Asian” PCA, Figure 1B); (2) only populations with PC1 > −0.010 in “all-East-Asian” PCA (termed as “Southern-East-Asian-only” PCA, Figure 1C), which intends to disentangle genetic variation within the Southern East Asians. In “all-East-Asian” PCA (Figure 1B), we replicate the geography-related genetic pattern similar to those reported in previous studies (Yang et al., 2020; Mao et al., 2021; Wang C. C. et al., 2021; Wang T. et al., 2021). In Northern East Asia, the majority of individuals fall within the gradient between the following two clusters of ancient individuals: (1) a cluster consisting of individuals from Neolithic Upper and Middle Yellow River Basin, termed as “Upper/Middle_Yellow_River_N”; (2) a cluster consisting of individuals from Neolithic Amur Basin and Mongolia Plateau, termed as “Amur_N/Mongolia_N” (Figure 1B and Supplementary Table 3). Ancient Nepali genomes and present-day Tibetans are closely clustered with Neolithic Upper and Middle Yellow River Basin individuals but fall outside the gradient.
In “Southern-East-Asian-only” PCA (Figure 1C), the clustering of present-day populations generally resembles the language classifications: Austronesian, Austroasiatic, and Hmong–Mien speakers, respectively, form one corner of a triangle, whereas Kra-Dai speakers gather at the center. Consistent with the previously reported manner, the First Farmers in Mainland Southeast Asia (MSEA) around the Mekong Basin (termed as “Mekong_N”) (Lipson et al., 2018a; McColl et al., 2018) cluster with present-day Austroasiatic speakers in MSEA (e.g., Htin_Mal), whereas Neolithic Fujianese (termed as “Fujian_N”) (Yang et al., 2020) and Iron Age Taiwanese cluster with present-day Austronesian speakers (e.g., Ami, Atayal, and Kankanaey).
We also identified some intriguing exceptions of such a language-genetic correspondence (Figure 1C). First, Austronesian-speaking Malay is positioned between Austronesian and Austroasiatic clusters, which is in accordance with the wide distribution of First MSEA Farmer-like ancestry in this region prior to the arrival of Austronesian speakers (Lipson et al., 2014; McColl et al., 2018). Second, Austroasiatic speakers affiliating to Vietic branch (i.e., Kinh and Muong) cluster with Kra-Dai speakers. Third, some Kra-Dai-speaking populations (e.g., Gelao and CoLao) cluster toward Hmong–Mien speakers, whereas some Hmong–Mien-speaking groups (e.g., Dao and Miao_Longsheng) cluster toward Kra-Dai speakers, indicating the gene flow between the speakers of both language families.
Ancestry Component Proportions Significantly Correlate With Language Classifications
In the best-fitting ADMIXTURE plot at K = 10 (Figure 1D), there is a significant correlation between the six ancestry components maximizing in East Asians and the six major language families presented in our dataset (p < 0.0001 for all the components, Supplementary Figure 4), but the proportion of genetic variation predicable by language classification varies for each language family. For all the six language families (Supplementary Figure 4), Austronesian (r2 = 0.848), Hmong–Mien (r2 = 0.582), and Tungusic (r2 = 0.513) account for a larger proportion of the genetic variation represented by corresponding ancestry components. In comparison, Kra-Dai (r2 = 0.415), Sino-Tibetan (r2 = 0.397), and Austroasiatic (r2 = 0.288) have lower predictability to the distribution of corresponding ancestry components, which suggests that some extent of language shifts or admixture of previously isolated populations may have occurred during the history of these language families.
Allele and Haplotype Sharing
Genetic structure inferred by STRUCTURE/ADMIXTURE-like algorithm can be biased by recent genetic isolation of individual populations (Lawson et al., 2018). To measure the pattern of genetic similarity for pairwise populations, we performed allele sharing-based outgroup-f3 analysis (Figure 2) and haplotype sharing-based identity-by-descent (IBD) analysis (Figure 3) as both methods are less biased by recent genetic isolation.
FIGURE 2
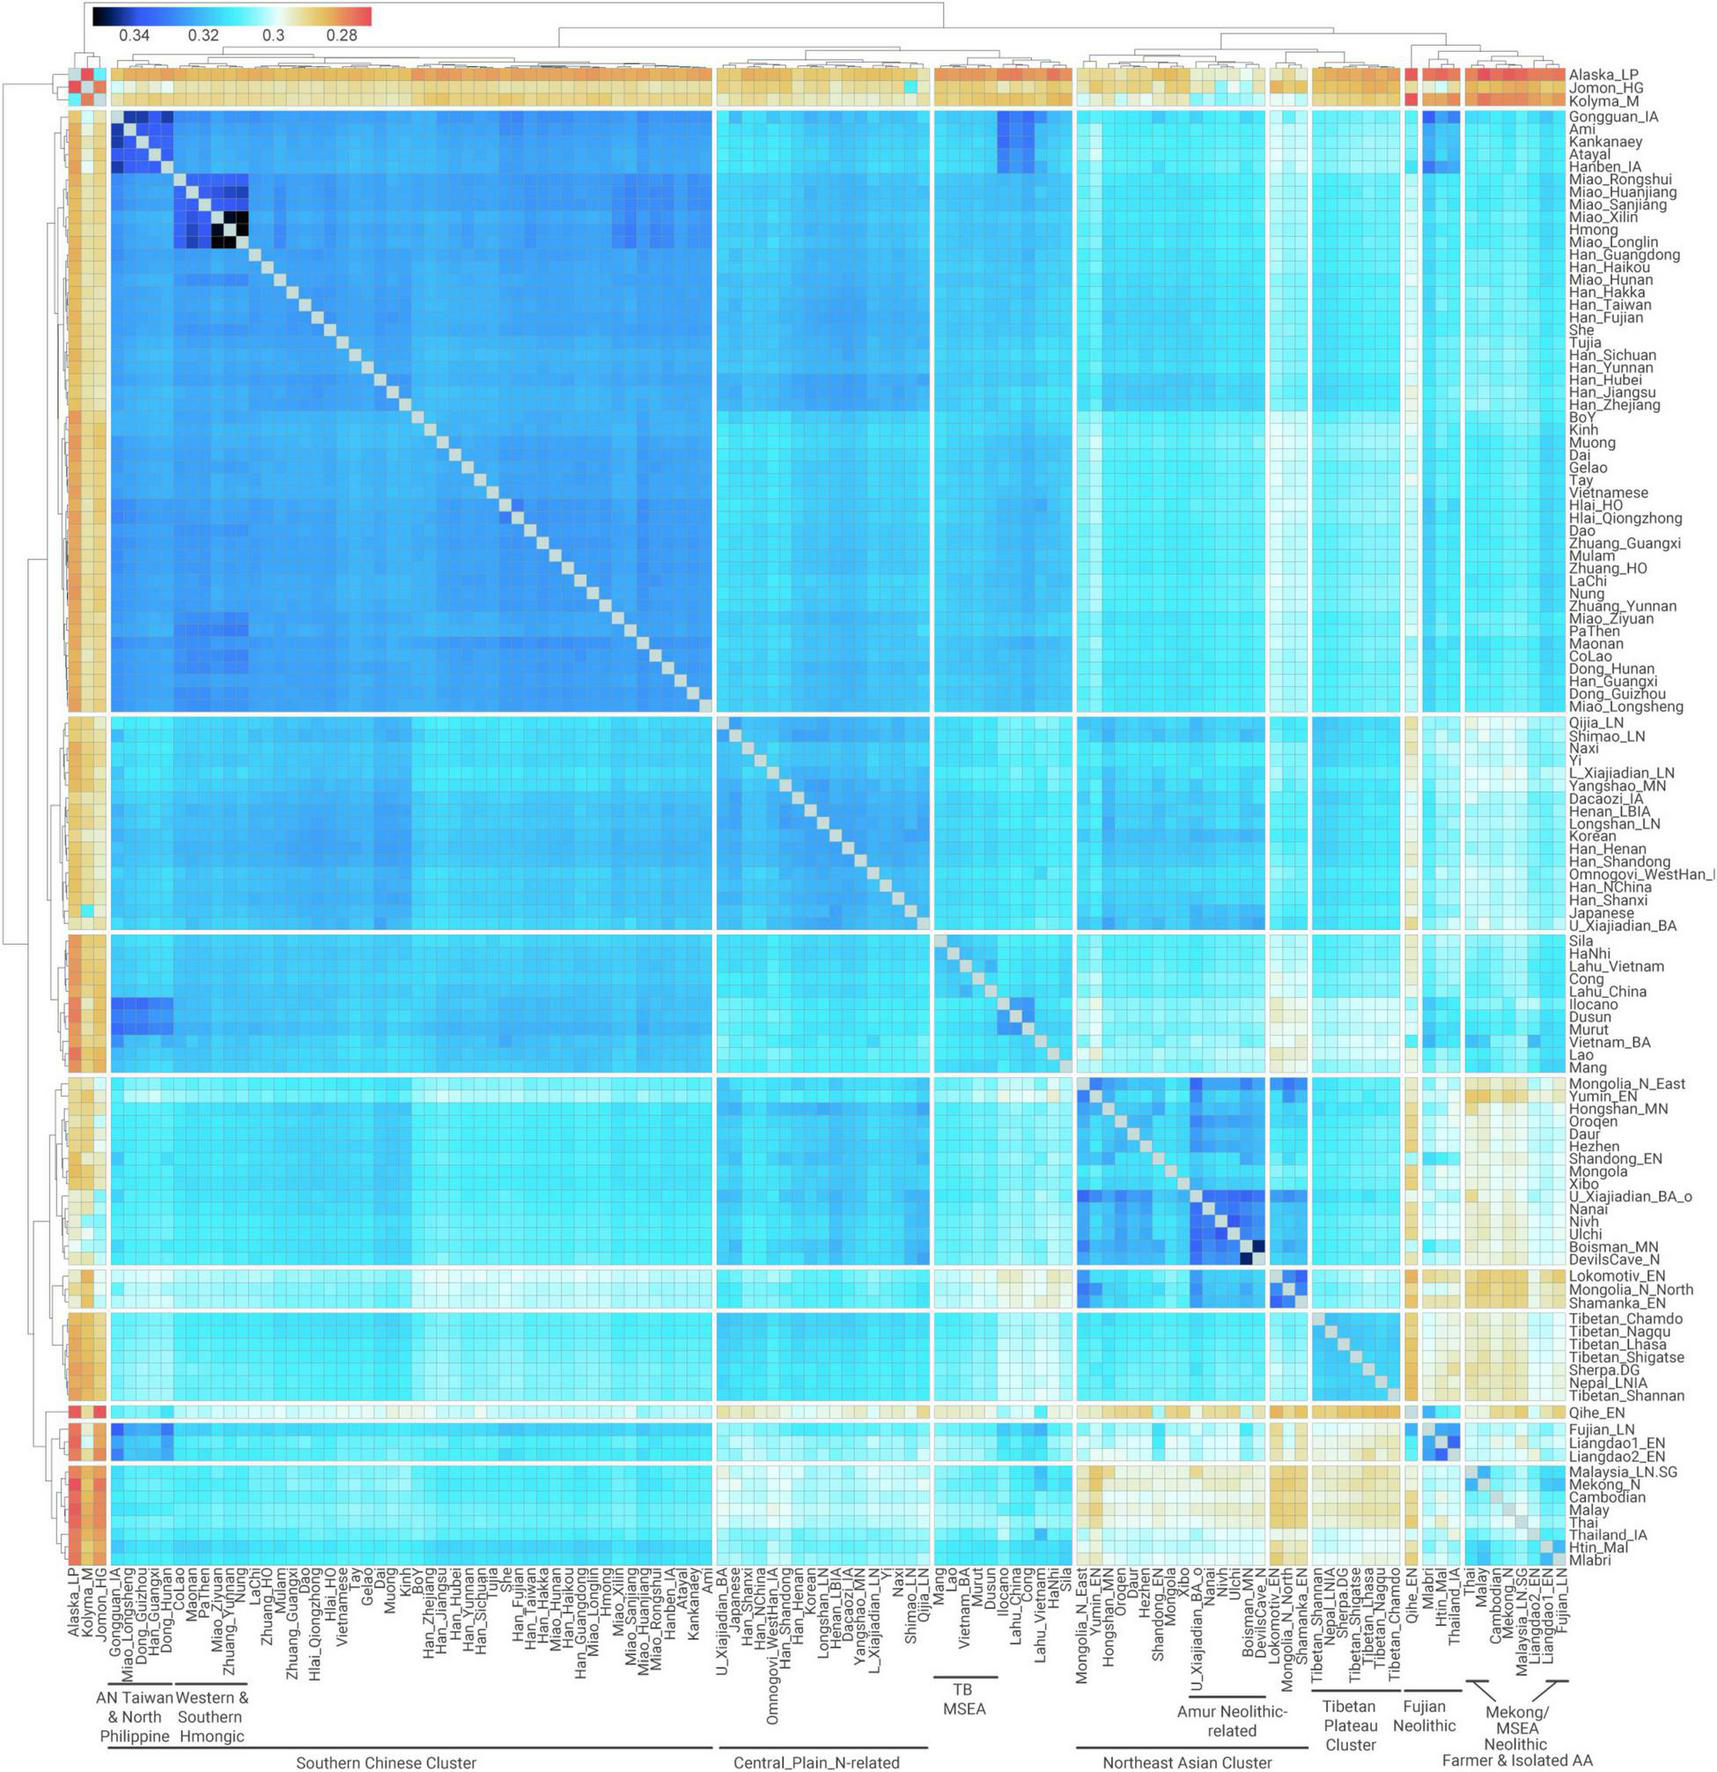
Quantitative measurement for pairwise genetic affinity based on allele sharing. Outgroup-f3 in the form f3(Mbuti; X, Y) measuring shared genetic drift between pairwise ancient and modern East Asian populations.
FIGURE 3
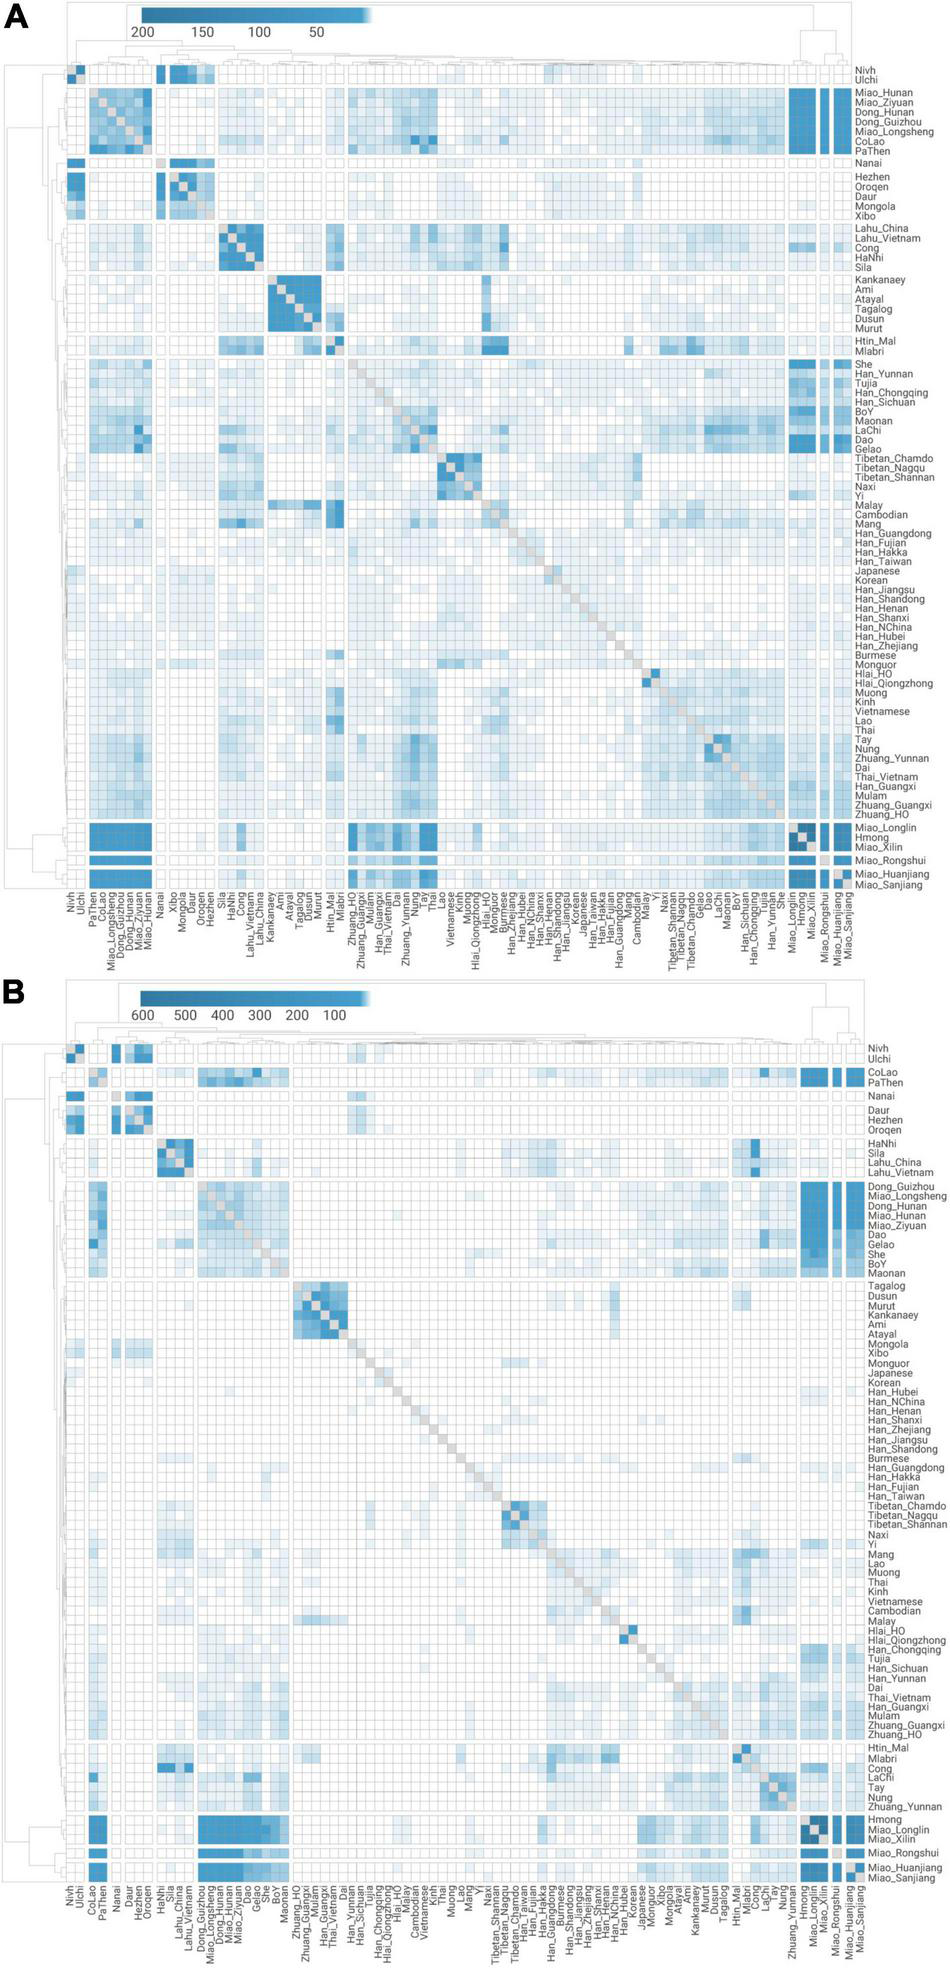
Quantitative measurement for pairwise genetic affinity based on haplotype sharing. Normalized haplotype sharing based on (A) the number and (B) the total length (unit: cM) of shared identity-by-descent chunks for pairwise modern East Asian populations.
FIGURE 4
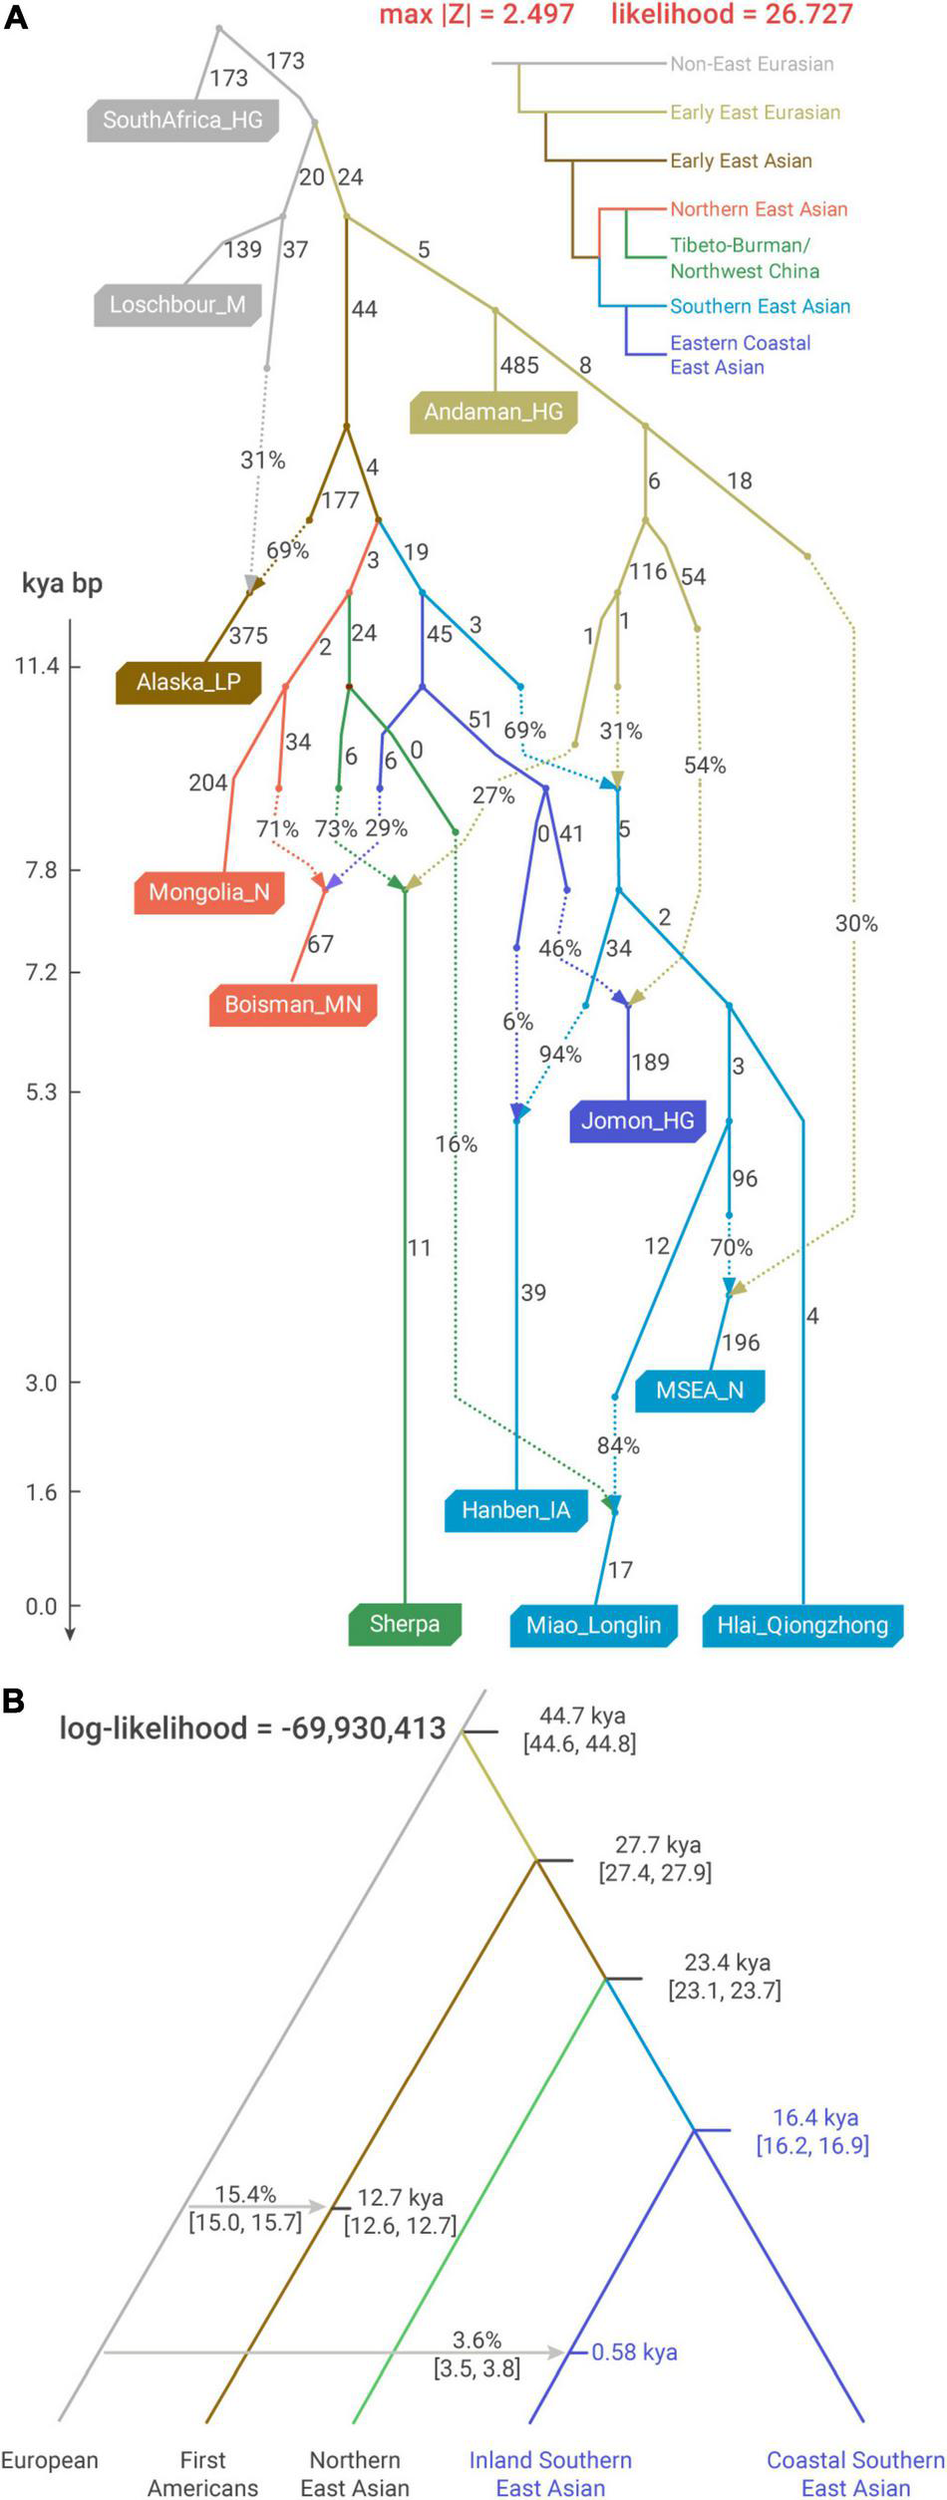
Demographic modeling for the deep history of East Asians (A) optimal qpGraph admixture model for the phylogenetic relationship among the surrogates for major ancestries in East Asia. Alaska_LP, Mongolia_N/Boisman_MN, Sherpa, Hanben_IA, Hlai_Qiongzhong, Miao_Longlin, and MSEA_N, respectively, surrogate First Americans, Northeast Asian, Sino-Tibetan, Austronesian, Kra-Dai, Hmong–Mien, and Austroasiatic ancestries. Drift along each edge is multiplied by 1,000. (B) Coalescent analysis using SFS of rare alleles to calibrate the time of the major splits in East Asians (implemented with Rarecoal). We used whole-genome sequences from 56 individuals in this analysis and the data composition of the pooled populations is denoted in Supplementary Table 4. kya, 1,000 years ago.
The clustering of outgroup-f3 analysis (Figure 2) is presented in a manner very similar to that of PCA and ADMIXTURE (Figures 1B–D), indicating that recent genetic isolation does not have a substantial impact on the overall genetic structure observed. Specifically for Southern East Asians, we find that Kra-Dai and Hmong–Mien populations in Southern China and Vietnam, Southern Han Chinese, and Austronesian speakers in Taiwan (Ami and Atayal) and northern Philippine (Kankanaey) cluster together with a high degree of shared genetic drift (outgroup-f3 > 0.320). We term this cluster as “Southern Chinese Cluster” as it majorly consists of groups in Southern China and adjacent regions (Figure 2).
The fine-scale genetic sub-structure inferred by IBD analysis also provides evidence for a language-associated genetic pattern in Southern East Asia (Figure 3). Most of the Hmong–Mien- and Austronesian-speaking populations, some Kra-Dai- and Austroasiatic-speaking populations, and Tibeto-Burman speakers in MSEA (termed as “TB_MSEA,” i.e., Lahu, HaNhi, Cong, and Sila) show a higher degree of IBD sharing within the speakers of each language families. In view of the threshold of the IBD segment (> 0.29 cM), such a result also indicates that the sharing genetic history for the speakers of these language families is on a time scale of < ∼5,000 BP. Intriguingly, we observe that all the Hmong–Mien-speaking populations share the most amount of IBD segments with Western Hmongic speakers (i.e., Miao_Longlin, Miao_Xilin, and Hmong, Supplementary Tables 1, 18A). Likewise, all the Austronesian-speaking populations have a higher IBD-sharing degree to Austronesian Taiwanese than to any other Austronesian populations (Supplementary Table 18E). Therefore, both sets of populations may have experienced relatively less extent of external gene flow than other populations with the same language classification. Such a pattern is consistent with the fact that both sets of populations have the most extreme positions in PCA (Figure 1C) and maximized proportions of ancestry components corresponding to their language classification (Figure 1D).
A Genetic Sub-structure in Southern China Formed Pre-Holocene Partially Retains in Present-Day Southern East Asians
We applied qpGraph to explore admixture-allowing phylogenetic models that could accommodate the major genetic variation in East Asians. For the external relationship of Southern East Asians to other groups, our best-fitting model captures the deep history supported by previous studies, such as the north-south split in East Asia (Yang et al., 2020; Wang C. C. et al., 2021) and the deep Andamanese-related ancestry shared by Southern East Asians (McColl et al., 2018; Figure 4A). The split between the lineages leading to Iron Age Taiwanese and First Farmers in MSEA (termed as “MSEA_N”) represents the earliest divergence within the Southern East Asian-related lineage, which is consistent with their most extreme positions in PC2 of “Southern-East-Asian-only” PCA (Figure 1C).
Based on the qpGraph-inferred admixture graph, we used coalescent theory-based Rarecoal to estimate the dates of the major splits related to the demographic history of East Asians. Particularly for Southern East Asians, we used present-day whole-genome sequencing samples that are tightly clustered with Iron Age Taiwanese (Ami, Atayal, and Igorot, collectively termed as “Coastal Southern East Asian”) and First Farmers in MSEA (Thai and Cambodian, collectively termed as “Inland Southern East Asian”) to represent the split within the Southern East Asian-related lineage (Figure 4B). The date estimate of such an inland-coastal split is pre-Holocene at 16,400 BP [95% confidence interval (CI) 16,200–16,900 BP] and significantly predates the earliest farming practice in Southern China (∼9,000 BP) (Liu and Chen, 2012). Such a result implies that the previously proposed “Yangtze River Farmer”-related ancestry, which is substantially shared by most of the present-day Southern East Asians and related to the expansion of rice farming, might already have a genetic sub-structure even before the Neolithic transition in Southern China.
In “Southern-East-Asian-only” PCA, the oldest sample clustered with Iron Age Taiwanese is the ∼8,400-year-old Qihe_EN from Fujian, who is in turn clustered with ∼12,000-year-old Qihe3 from the same archeological site in a recent study (Wang T. et al., 2021), whereas the oldest genomes clustered with First Farmers in MSEA in the same study are ∼8,800-year-old Dushan individual and ∼7,400-year-old Baojianshan individual from Guangxi (Wang T. et al., 2021). Therefore, our coalescent-based estimate is consistent with the genetic variation represented by ancient genomes from Southern China and indicates a long-lasting genetic sub-structure in this region that still persists in present-day Southern East Asians, particularly Austronesian (e.g., Ami and Atayal) and Austroasiatic speakers (e.g., Htin_Mal). In comparison, given the strong IBD-sharing level within Hmong–Mien speakers, the Hmong–Mien-related genetic sub-structure shown in PC1 of “Southern-East-Asian-only” PCA likely has a relatively younger time scale for its formation. This is consistent with the fact that all the currently reported ancient genomes genetically clustered with present-day Hmong–Mien speakers are < ∼500 BP (Wang T. et al., 2021).
Regarding the deep history, our estimates from Rarecoal analysis are also corroborated by previous studies. For example, our estimate for the divergence between East and West Eurasians (44,700 BP, 95% CI 44,600–44,800 BP, Figure 4B) is almost contemporary with the oldest East Eurasian-related ancient genomes to date from Bacho Kiro (∼46,000–42,500 BP) (Hajdinjak et al., 2021), and our estimate for the split between First Americans and East Asians (27,700 BP, 95% CI 27,400–27,900 BP, Figure 4B) is consistent with the arise of the derived EDAR allele ∼30,000 BP, which is shared by Native Americans and East Asians at a high frequency (Kamberov et al., 2013).
The Formation of Current Genetic Characteristics for Hmong–Mien and Kra-Dai Speakers
Admixture Within Ancient Southern Chinese Characterizes the Ancestry Profile Shared by Southern Chinese Cluster
We used qpAdm (Figure 5A) and qpWave (Figures 5B,C) to formally assess to what extent such a genetic sub-structure formed pre-Holocene retains in ancient and present-day Southern East Asians. Consistent with the pattern in “Southern-East-Asian-only” PCA (Figure 1C), Austronesian speakers in Taiwan (Ami and Atayal) and northern Philippine (Kankanaey) have the highest proportion of ancestry derived from a Neolithic Fujianese-like source (66.9–74.3%, Figure 5A), whereas the ancestry of Austroasiatic speakers in MSEA (e.g., Htin_Mal and Mlabri) is mostly derived from a First Neolithic Farmer-like source (69.2–75.2%, Figure 5A), suggesting that both sets of populations still largely retain the genetic sub-structure in Southern China formed pre-Holocene.
FIGURE 5
qpAdm and qpWave modeling of population structure in relation to out-groups (A) admixture proportion estimates of three ancestries related to Mongolia_N, Fujian_LN, and Mekong_N. (B,C) Pairwise qpWave negative log p-values (-log10p) for (B) Southeast Asians, (C) Northeast Asians, and Han Chinese.
Present-day Kra-Dai and Hmong–Mien speakers in Southern China, as well as Southern Han Chinese, show a highly admixed ancestry composition regarding the First MSEA Farmer-like and Neolithic Fujianese-like sources (i.e., | Fujian_LN –Mekong_N| < 10% for the majority of “Southern Chines Cline” populations, Figure 5A). This suggests that the admixture of the ancestral population with a different relationship to Fujian Neolithic- and First MSEA Farmer-related sources decreases the previously established genetic sub-structure and increases the genetic homogeneity in present-day Southern Chinese, particularly Kra-Dai and Hmong–Mien speakers. However, a considerable extent of retention of pre-Holocene genetic structure could still be observed from some present-day southern Chinese populations. For example, Western Hmongic speakers (Miao_Longlin, Miao_Xilin, and Hmong) have slightly more proportion of ancestry derived from a First Neolithic Farmer-like (32.3–35.0%) source than from a Neolithic Fujianese-like source (23.7–26.0%, Figure 5A). In comparison, Kra-Dai speakers with the highest proportion of Kra-Dai-related ancestry component in ADMIXTURE (Figure 1D), i.e., Hlai, Maonan, and Zhuang_Guangxi, have more Neolithic Fujianese-like ancestry (40.7–53.9%) than First MSEA Farmer-like ancestry (24.9–33.1%, Figure 5A).
The Formation of Hmong–Mien Cline
In addition to the admixture history shared by Southern Chinese Cluster, we also identified evidence for further admixture exclusively for the majority of Hmong–Mien-speaking and some Kra-Dai-speaking groups, collectively form a “Hmong–Mien Cline.” The members of this gradient majorly dwell in northern Guangxi, Southern Guizhou, and western Hunan, as well as the diaspora of these ethnic groups migrating to MSEA in recent centuries (Ratliff, 2010). In “Southern-East-Asian-only” PCA, it is obvious that individuals in Hmong–Mien Cline represent the major genetic variation of PC1 (Figure 1C). Our newly reported Hmong–Mien-speaking individuals from west to east (Figure 1A) roughly have a decreased proportion of Hmong–Mien-related ancestry component and an increased proportion of Kra-Dai-related ancestry component in the ADMIXTURE plot (Figure 1D). As indicated by qpWave, populations in Hmong–Mien Cline tend to have a high probability of being a clade in relation to the outgroups (Figure 5B), which further supports the substantial gene flow among Hmong–Mien Cline populations.
Notably for the newly sampled populations affiliated to Miao ethnicity, Western Hmongic-speaking (also known as Chuanqiandian Miao or Hmong, Supplementary Table 1) Miao_Longlin (87–99%) and Miao_Xilin (87–96%) from Northwest Guangxi (Figure 1A) have highest proportions of Hmong–Mien-related ancestry component in ADMIXTURE plot (Figure 1D and Supplementary Table 5). The speakers of Southern Dialect of Eastern Hmongic (also known as Qiandong Miao or Hmu, Supplementary Table 1), i.e., Miao_Huanjiang (50–76%), Miao_Sanjiang (31–70%), and Miao_Rongshui (20–51%), have moderate Hmong–Mien-related ancestry component. The speakers of Eastern Dialect of Eastern Hmongic, i.e., Miao_Longsheng (11–17%) and Miao_Ziyuan (4–23%), have the lowest proportion of Hmong–Mien-related ancestry component, which suggests that they may have strongest gene flow from neighboring Kra-Dai- and Han Chinese-speaking populations and is consistent with their eastmost location among the newly sampled Miao subgroups (Figure 1A).
Although She and Miao_Hunan have a comparable degree of IBD sharing with Western Hmongic groups as other Hmong–Mien speakers and Kra-Dai-speaking Dong and Gelao do (Figure 3), they have low pairwise qpWave p-values with most of the populations in Hmong–Mien Cline (Figure 5B). This indicates that both groups may receive additional gene flow and have a unique genetic history different from the mainstream Hmong–Mien Cline populations. Particularly for She, this is consistent with the fact that She people have undergone a language shift from Hmong–Mien to a variant of Hakka Chinese (Nakanishi, 2010).
Regarding the time for the formation of Hmong–Mien Cline, ALDER obtained consistent estimates of admixture time ∼700–1,500 BP for most of the populations in Hmong–Mien Cline when using the pooled population of all the Western Hmongic speakers (termed as “Hmong_Core”) as one of the two surrogates (Figure 6A). Particularly, most of the estimates surrogated by “Hmong_Core” have very strong statistical evidence for the decay of admixture LD (p < 1.0 × 10⁻⁴ and Z > 4, Supplementary Table 10), which provides further independent evidence for the admixture events in Hmong–Mien Cline. Intriguingly, this period approximately overlaps the reign of chieftains in this region, such as the Chiefdom of Bozhou (876–1,600 AD) and the Chiefdom of Sizhou (582–1,413 AD) (Jiang, 2018).
FIGURE 6
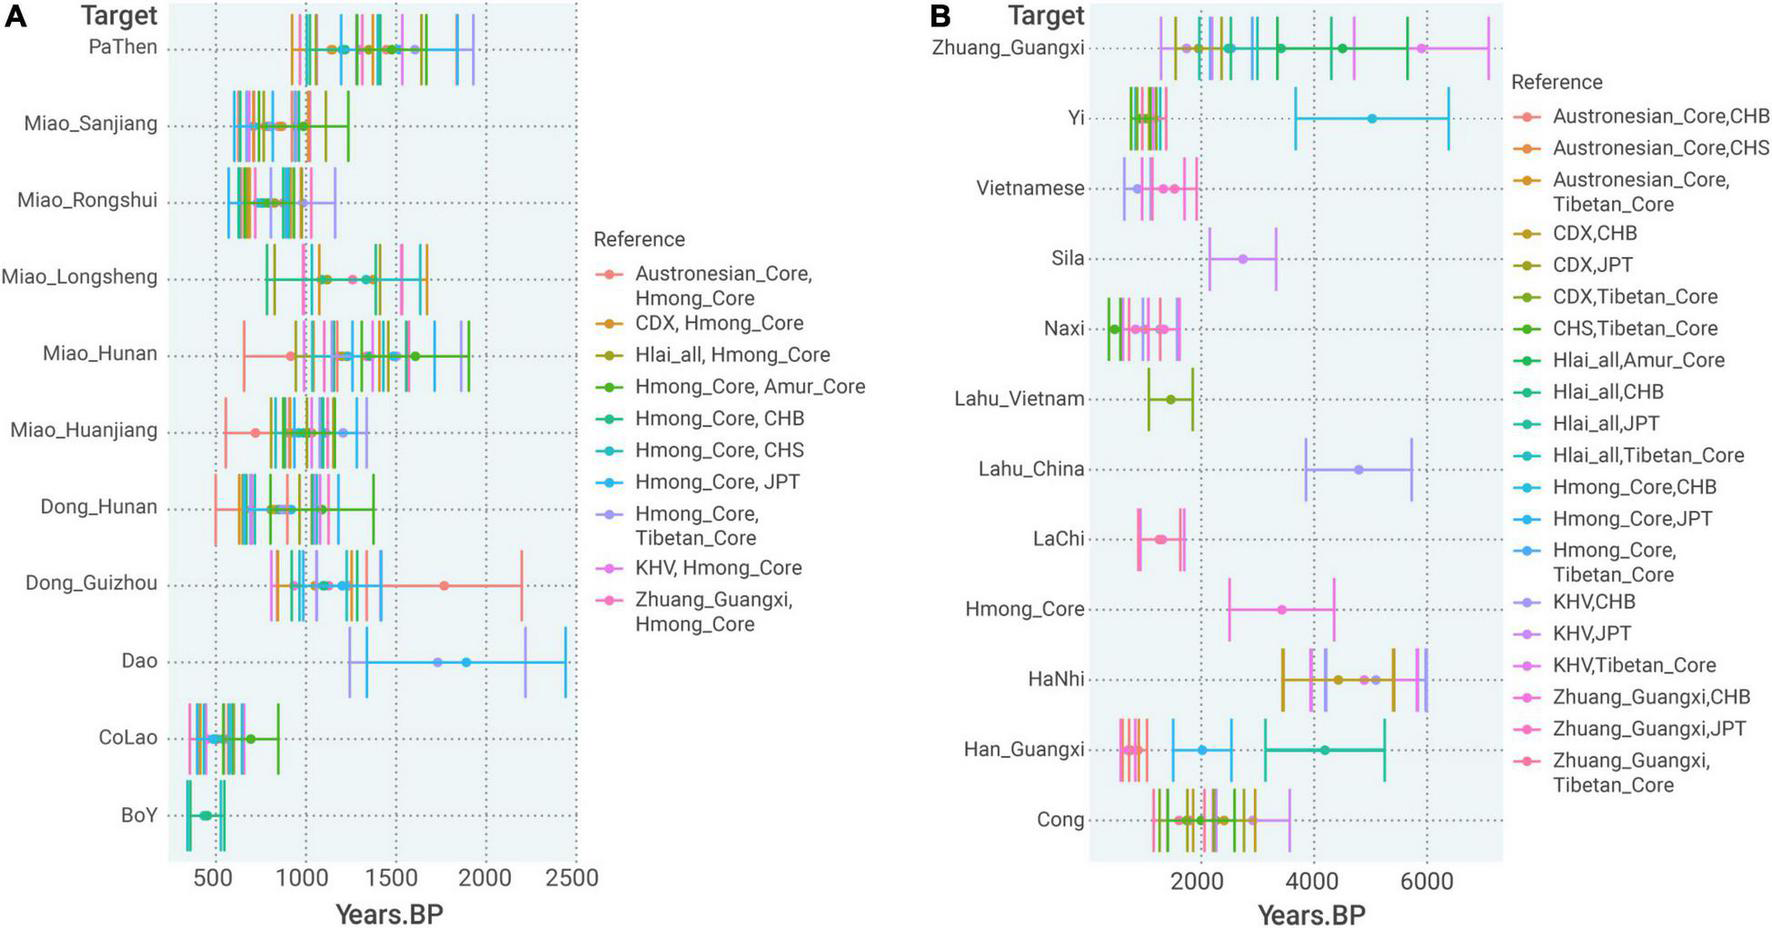
Admixture time estimated by ALDER (A) admixture time estimation of populations in the Hmong–Mien Cline referenced by pairing Hmong_Core and a non-Hmong–Mien reference. (B) Admixture time estimation for admixture between Northern and Southern East Asians. The error bar denotes ± 1 standard error.
Other Demographic Dynamics Related to Hmong–Mien and Kra-Dai Speakers
At least for Western Hmongic-speaking Miao_Longlin, we identify additional gene flow that can be surrogated by Tibeto-Burman-speaking Sherpa (16%) with strong shared genetic drift (f2 = 0.024) in qpGraph (Figure 4A). There is also moderate evidence for IBD sharing between Western Hmongic speakers and Tibeto-Burman-speaking Yi (Figure 3), which suggests a genetic contact with an ancestry source related to present-day Tibeto-Burman speakers in the history of Western Hmongic speakers. In ALDER, the north-south admixture in Western Hmongic speakers is dated to ∼3,400 BP (Figure 6B). Such a genetic contact is consistent with the language contact between Proto-Hmong–Mien and some Tibeto-Burman languages (Ratliff, 2010; Jacques, 2021). For Kra-Dai speakers outside Hmong–Mien Cline, we find that the strongest signals of admixture are consistently surrogated by a First MSEA Farmer-like and a Neolithic Fujianese-like source [e.g., Z = −3.309 for f3(Zhuang_Guangxi; Mekong_N, Ami), Supplementary Table 9], which further provides statistical evidence for the admixture within the Southern East Asian-related lineage during the history of Kra-Dai speakers.
The Formation of Southern Han Chinese
In qpAdm, the previously described “Han Chinese Cline” (Wang C. C. et al., 2021) is characterized with the gradually increased Southern East Asian-related ancestries (i.e., the sum of Fujian_LN- and Mekong_N-related ones) in farther south (Figure 5A), which is consistent with the higher probability of forming clade for geographically closer populations (e.g., Han_Fujian and Han_Zhejiang) than more distant ones (Han_Fujian and Han_Henan) in Han Chinese Cline (Figure 5C). The admixture still continues in Southern Chinese, e.g., Han_Guangxi, to very recent (< 1,000 BP) (Figure 6B). The highly mixed ancestry profile in relation to Fujian_LN- and Mekong_N-like sources is still obvious in Southern Han Chinese (Figure 5A), identical to other non-Austronesian-speaking groups in Southern Chinese Cluster (Figure 2). Particularly, Southern Han Chinese in Fujian and Guangdong show the highest excessive Fujian_LN-related ancestry (35.0–40.3%) than Mekong_N-related ancestry (21.8–23.6%), similar to Kra-Dai-speaking populations, such as Hlai. The higher effective population size (NE) of Southern Han Chinese and Kra-Dai speakers to other Southern Chinese (Supplementary Figure 1) is likely consistent with a potential substantial contribution in present-day Southern Chinese from Kra-Dai-speaking groups, or at least well surrogated by Kra-Dai speakers. However, some Southern Han Chinese groups, such as Han_Chongqing, show a moderate extent of IBD sharing with Western Hmongic populations (Figure 3), suggesting the potential different local patterns of the southern source in present-day Han Chinese Cline.
Since newly genotyped individuals affiliated to Zhuang and Han ethnicities from Guangxi and Yunnan are majorly sampled from the same localities, it offers a good opportunity to assess the genetic relationships among neighboring populations. In qpAdm modeling (Figure 5A), Han_Guangxi has the lowest proportion of Northern East Asian ancestry represented by Mongolia_N (33.8 ± 4.8%) among all the Han Chinese populations, which is slightly higher than the Northern East Asian ancestry in neighboring Zhuang_Guangxi (26.2 ± 4.9%). By contrast, the Northern East Asian ancestry in Han_Yunnan (50.0 ± 4.9%) is significantly higher than those of neighboring Zhuang_Yunnan (28.2 ± 5.0%). Such a result indicates that Han Chinese in Guangxi are majorly descendent from local Kra-Dai speakers who underwent language shift into Chinese dialects (e.g., Southwest Mandarin, Pinghua, Cantonese, and Hakka). In comparison, the significantly higher Northern East Asian ancestry in Han Chinese in Yunnan is consistent with the massive migration of Han Chinese speaker into Yunnan during Ming Dynasty (1368–1,644 AD) (Dardess, 2011). The proportions of Northern East Asian ancestry in Zhuang in Yunnan and Guangxi are also similar to neighboring Kra-Dai-speaking populations, e.g., Dai (30.5 ± 4.8%, Figure 5A). Such a result suggests that there is no additional gene flow from populations with significant Northern East Asia-related ancestry (e.g., Han Chinese migrants from further north) to Zhuang.
Sex-Specific History Inferred From Uniparental Markers
We grouped Y-chromosomal and mitochondrial haplogroups of newly sampled individuals affiliated to Han, Miao, and Zhuang ethnicities into several categories (Figure 7). For both Y-chromosomal (Figure 7A) and mitochondrial (Figure 7B) haplogroups, the composition of haplogroup distribution of Han and Zhuang is more similar to each other than they are to Miao. This suggests that local Han Chinese from Guangxi and Yunnan received more genetic influence from Kra-Dai-speaking groups and is consistent with the pattern from autosomal data. For both Han and Zhuang, the most prevalent Y-chromosomal lineages are O1b1a1-M95 (36.6% for Zhuang, 31.6% for Han, grouped into O1b-M268 in Figure 7A) and O1a-M119 (24.4% for Zhuang, 21.1% for Han). In published aDNA samples, O1b1a1-M95 is widely distributed in the First Farmers of MSEA (e.g., Vietnam_N, Laos_LN_BA, and Indonesia_LN_BA_IA) (Lipson et al., 2018a; McColl et al., 2018), whereas O1a-M119 can be found in Neolithic Fujianese individuals (e.g., Liangdao1) (Yang et al., 2020) and later Taiwanese (Hanben_IA) (Wang C. C. et al., 2021) and Vanuatu (Vanuatu_2900BP) (Skoglund et al., 2016; Lipson et al., 2018b) associated with Austronesian expansion. This also suggests that present-day Han and Zhuang in southern China are descendent from admixtures of multiple local ancestries in ancient southern China. For Miao in Guangxi, and the most prevalent Y-chromosomal haplogroup is O2a2a2a1a2a1a2-N5 (47.1%, grouped into O2a2a-M188, Figure 7A). The same haplogroup has also been reported as the most prevalent paternal lineage in Hmong–Mien-speaking Miao and Pahng from Hunan (Xia et al., 2019) and Hmong from Thailand (Kutanan et al., 2020), indicating that O2a2a2a1a2a1a2-N5 is the founding paternal lineage across Hmong–Mien-speaking populations. For mitochondrial haplogroups (Figure 7B), one of the previously suggested founding lineage for Hmong–Mien speakers in Hunan (Xia et al., 2019) and Thailand (Kutanan et al., 2020), B5a1c1a, is also found with high frequency in Miao_Xilin (50%, Supplementary Table 20). Interestingly, some mitochondrial haplogroups occurring in Early Neolithic Guangxi samples, such as M75 in two Baojianshan individuals and B4a1e in the Dushan individual (Wang T. et al., 2021), are also found with low frequencies in present-day Zhuang individuals from Guangxi (one individual with M75 in Zhuang_Jingxi and one individual with B4a1e in Zhuang_Guangnan).
FIGURE 7
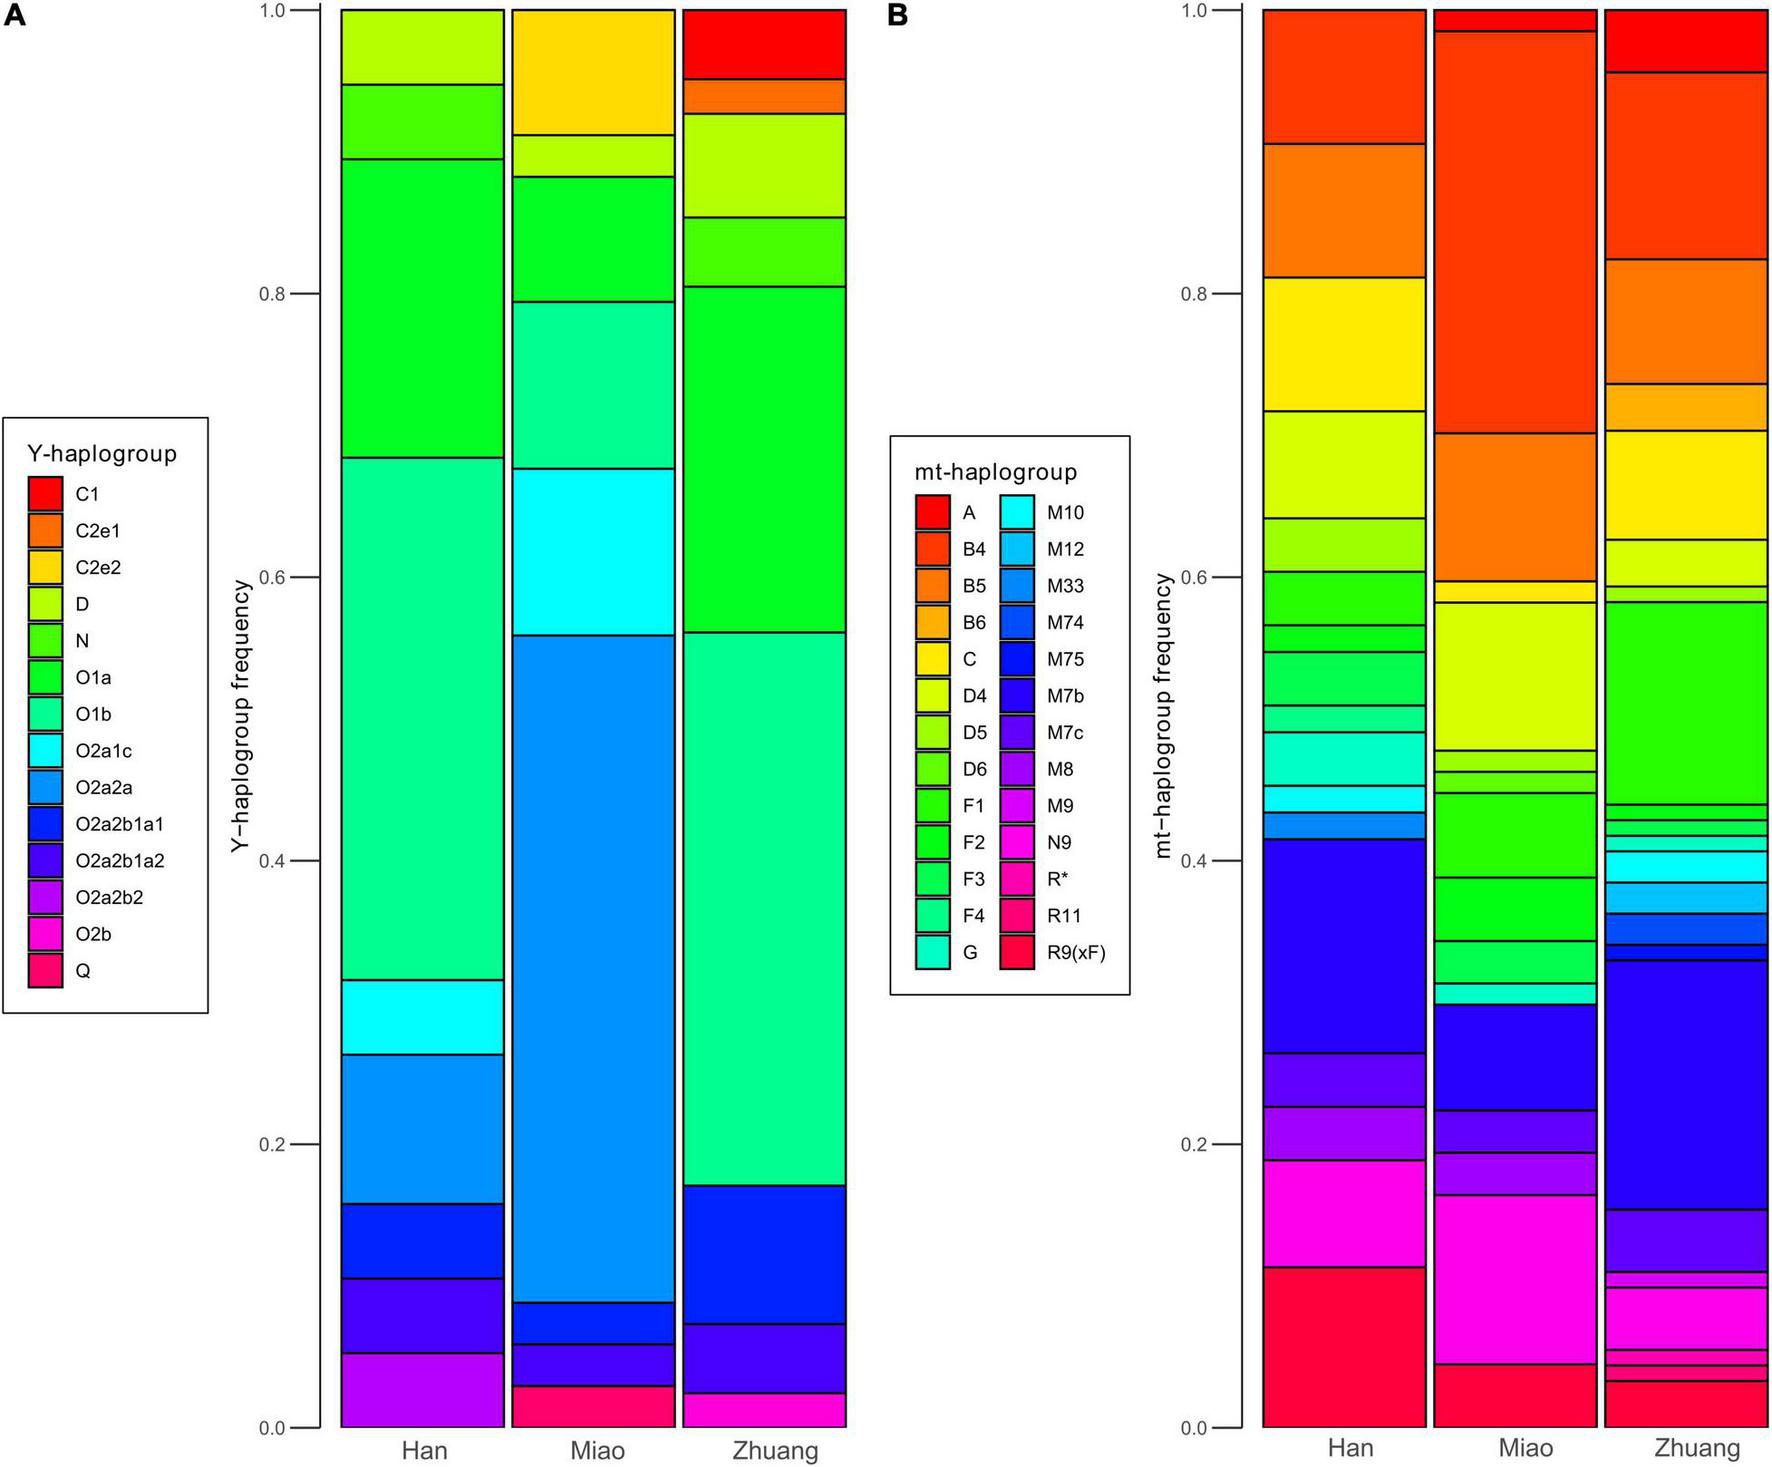
Frequencies of uniparental markers in newly sampled populations. (A) Distribution of Y-chromosomal haplogroups in newly sampled Han (N = 19), Miao (N = 34), and Zhuang (N = 41) populations. (B) Distribution of mitochondrial (mt) haplogroups in newly sampled Han (N = 53), Miao (N = 67), and Zhuang (N = 91) populations.
Discussion
In this study, we provide a comprehensive investigation into the demographic history that contributes to the genetic diversity of various ethnolinguistic groups in Southern China characterized by various admixture and migration events in recent millennia.
Further Discussion About the Establishment and Decrease of Genetic Sub-structure in Ancient Southern China
Given the previously proposed links between First MSEA Farmers and Austroasiatic expansion (McColl et al., 2018), as well as Neolithic Fujianese and Austronesian expansion (Yang et al., 2020), the potential genetic link between Western Hmongic speakers and First MESA Farmers, as well as Kra-Dai-speaking groups (e.g., Hlai) and Neolithic Fujianese, is consistent with some previous proposals of deep connections among language families in Southern East Asia to some extent. For example, Proto-Hmong–Mien and some Austroasiatic languages are proposed to have some shared “basic” vocabulary (Ostapirat, 2018), whereas the “Austro-Tai” hypothesis proposes a genealogical relationship between Austronesian and Kra-Dai language families (Sagart, 2004; Blench, 2013; Ostapirat, 2013). Given that Western Hmongic speakers are geographically close to First MSEA Farmers, the geographic factor would be an alternative explanation for their genetic pattern in addition to the linguistic relationship.
However, when taking multiple lines of evidence into account, we discover a more complex scenario than simply an exact match between shared genetic history and language classification, especially for the Austro-Tai hypothesis. First of all, the evidence for shared IBD between Austronesian and Kra-Dai speakers—even Hlai who processing highest ancestry related to Neolithic Fujianese (46.1–53.9%, Figure 5A)—is limited (Figure 3), which suggests a relatively old time scale for the shared genetic history between the modern speakers of both language families. Besides, present-day Austronesian-speaking Taiwanese exhibits high degree of genetic similarity with not only Kra-Dai speakers in Southern China [e.g., f3(Mbuti; Ami, Hlai_HO/Hlai_Qiongzhong) = 0.327]—which has been suggested to be a genetic pattern consistent with the Austro-Tai hypothesis (McColl et al., 2018)—but also Hmong–Mien speakers [e.g., f3(Mbuti; Ami, Miao_Sanjiang) = 0.326] to a comparable degree (Figure 2). The evidence is consistent with the scenario that the southern East Asian-related ancestors of modern Kra-Dai-speaking, Hmong–Mien-speaking, and Chinese-speaking populations in Southern China have undergone admixture between ancestral population with a different relationship to Fujian Neolithic- and First MSEA Farmer-related sources. This may partially explain the relatively limited extent of genetic connection among different groups with hypothesized deep language connections, e.g., Kra-Dai and Austronesian speakers.
The evidence from Iron Age Taiwanese provides a further constraint for the timing of such an admixture. We computed the statistic D(Test, Mbuti; Fujian_LN, Hanben_IA) to quantify the excessive allele sharing with Iron Age Taiwanese when compared to Late Neolithic Fujianese (Supplementary Table 13). This statistic is negatively significant (Z < −3) not only for Northern Chinese and present-day Austronesian speakers as previously confirmed (Wang C. C. et al., 2021), but also for other “Southern Chinese Cline” populations and most of the MSEA populations—particularly Mlabri (Z = −4.77) and Htin_Mal (Z = −3.15)—both of whom have the highest probabilities to form a clade with First MSEA Farmers in qpWave (Figure 5B). Evident by additional gene flow from a First MSEA Farmer-related source, Iron Age Taiwanese is hence affected by such an admixture as Kra-Dai and Hmong–Mien speakers do, which goes some ways to explaining the high level of outgroup-f3 among Southern Chinese Cluster (Figure 2). Given the time span of Iron Age Taiwanese (22–774 cal CE), the initial admixture contributing to the high genetic homogeneity in Southern Chinese Cluster and the mixed ancestry composition in Kra-Dai and Hmong–Mien speakers is not later than ∼2,000 BP.
The Formation of Northern Source for Southern Han Chinese
Due to the scarcity of available ancient genomes from Southern China (e.g., Yangtze River Basin), we focus on Northern China (especially Yellow River Basin) to seek clues of demographic dynamics related to coeval Southern China. In the earliest samples from Yellow River Basin, qpAdm results indicate that individuals from Early Neolithic Shandong of Lower Yellow River Basin (“Shandong_EN”) derive all of their Southern East Asian-related ancestry from a Neolithic Fujianese-like source (“Fujian_LN,” 32.0%, Figure 5A). Using a “rotating” strategy (Skoglund et al., 2017) to move each of the surrogates into the outgroup set, the nested model still holds when removing Mekong_N as a surrogate (p = 0.91) but fails when removing Fujian_LN (p = 6.03 × 10⁻⁴, Supplementary Table 6). By contrast, individuals from Yangshao Culture of Neolithic Middle Yellow River Basin (“Yangshao_MN”) derive all of their Southern East Asian-related ancestry from a First MSEA Farmer-like source (“Mekong_N,” 32.2%, Figure 5A), consistent with the marginally failed nested model (p = 0.0015) when moving “Mekong_N” into the outgroup set. Hence, our analysis suggests that the genetic sub-structure in Southern China formed pre-Holocene is also connected to Neolithic Northern China with geographical correspondence despite the high genetic homogeneity [outgroup-f3(Mbuti; Yangshao_MN, Shandong_EN) = 0.319], which might presumably be established via distinct inland and coastal routes. Correspondingly, the statisticD (Test, Mbuti; Yangshao_MN, and Shandong_EN) indicates that coastal individuals from Neolithic Amur Basin [“DevilsCave_N,” Z = −3.61; “Boisman_MN,” Z = −4.03], Jomon hunter-gatherer (Z = −3.72), and Early Neolithic Fujianese (“Liangdao1_EN,” Z = −3.00) share more allele with Neolithic Shandong individuals (Supplementary Table 14), which is consistent with the previously suggested genetic connection in Neolithic coastal East Asia (Yang et al., 2020) and is also incorporated in our qpGraph model (Figure 4A). However, we find that the extra connection with Neolithic Shandong individuals is not limited to coastal regions [e.g., Z = −3.71 for Yumin_EN from inland Inner Mongolia], and we cannot replicate this connection in First MSEA Farmers [“Malaysia_LN.SG,” Z = 1.66; “Mekong_N,” Z = 0.66, Supplementary Table 14] suggested in the previous study (Yang et al., 2020). Given that the upper time limit of Neolithic Shandong individuals (∼10,000 BP) is very close to the start of Holocene (∼11,000 BP), such a coastal genetic connection is consistent with now-vanishing land connections in pre-Holocene coastal East Asia, e.g., the land connection between continental East Asia and Japan lasting to ∼12,000 BP (Liu and Chen, 2012).
Except for Late Neolithic Upper Yellow River Chinese (“Qijia_LN,” 2,866-2,237 cal BCE), all the Yellow River individuals since Late Neolithic have a novel ancestry composition with southern sources derived from both First MSEA Farmer-like and Neolithic Fujianese-like sources in qpAdm (Figure 5A) and increased proportion of Kra-Dai-related ancestry component in ADMIXTURE (Figure 1D), which still preserves in present-day Northern Han Chinese. We computed D(Test, Mbuti; Yangshao_MN, YellowRiver_LNIA_all) where “YellowRiver_LNIA_all” is a collection of post-Yangshao ancient individuals from Yellow River Basin, which indicates Southern East Asian-related gene flow (Supplementary Table 14) consistent with the previous study (Ning et al., 2020). Besides, there is no significant evidence for Neolithic Shandong-related gene flow in post-Yangshao individuals (Z = 0.32), which suggests that the genetic contact between Neolithic Shandong-related and Yangshao-related sources has a minor effect on the post-Yangshao ancestry profile. Particularly, we identify that all the populations with significant excessive allele sharing with post-Yangshao individuals (i.e., Z > −3) are from Southern Chinese Cluster (Hanben_IA, Dao, Gelao, Maonan, Zhuang_Yunnan, Nung, and Kankanaey), whereas Neolithic Fujianese (Qihe_EN, Liangdao1_EN, Liangdao2_EN, and Fujian_LN, Z = −0.03–−1.29) and First MSEA Farmers (Mekong_N and Malaysia_LN.SG, Z = −1.04–−2.14) do not have significant statistics. We find consistent but less significant results when post-Yangshao individuals are not pooled (Supplementary Table 14). This suggests that Southern Chinese Cluster may have a closer relationship to the true contributor of the additional Southern East Asian-related ancestry in post-Yangshao individuals. In archeological records, we find that this gene flow is consistent with the cultural communication of Late Yangshao with neighboring Dawenkou and Qujialing Cultures (Liu and Chen, 2012) and the rise of complex societies since the Longshan period (Liu and Chen, 2012).
Archeological Evidence in Accordance With Genetic Isolation in Ancient Southern China
Although the ancient genomes from the Yangtze River Basin are currently unsampled, the pattern of cultural exchange and diffusion of local archeological cultures with neighboring cultures is generally consistent with the demographic scenario inferred from ancient genomes from neighboring regions and present-day data. Since the early Neolithic, there are two agricultural centers for rice domestication and farming practice with corresponding material traditions in Yangtze River Basin: (1) the center in Yangtze Delta with a “coastal” tradition, particularly represented by Kuahuqiao Culture (∼7,000–5,000 BCE), Hemudu/Majiabang Culture (∼5,000–3,300 BCE) and Liangzhu Culture (∼3,300–2,000 BCE); the center in Middle Yangtze with an “inland” tradition, particularly represented by Pengtoushan Culture (∼7,000–5,800 BCE), Daxi Culture (∼5,000–3,400 BCE), and Qujialing-Shijiahe Culture (∼3,400–2,000 BCE) (Diamond and Bellwood, 2003; Fuller, 2011; Liu and Chen, 2012; Stevens and Fuller, 2017). This is consistent with the geographically corresponding genetic sub-structure in Southern China inferred from ancient genomes further north (e.g., Neolithic Yellow River) and further south (e.g., Neolithic Fujian and MSEA). Particularly, the coastal tradition, particularly Hemudu Culture, shares many material cultures with some present-day Austronesian speakers (e.g., pottery stove and canoe) (Bellwood, 2005) and some cultural practices commonly shared by some Kra-Dai speakers (e.g., Gelao) and Austronesian Taiwanese (e.g., dental avulsion) (Blench, 2013). By contrast, the homelands of Proto-Austroasiatic and Proto-Hmong–Mien are hypothesized to be in or nearby the inland center (Bellwood, 2005). Such suggestive cultural connections are also compatible with the possible genetic connections between Kra-Dai and Austronesian speakers and Hmong–Mien and Austroasiatic speakers distinguished in this study, although to a largely reduced extent. Furthermore, the cultural connection of Shijiahe Culture (2,600–2,000 BCE) in the inland center with Liangzhu Culture in the coastal center (Liu and Chen, 2012) and the arrival of both inland and coastal traditions in Pearl River Delta ∼3,000 BCE (Bellwood, 2005) also suggest a frequent cultural exchange in Southern China. Although cultural communications are not necessarily accompanied by population admixture, this time range is intriguingly contemporary to the “Southern Chinese Cluster”-related gene flow since Longshan Culture and is consistent with the conservative lower limit of admixture related to the formation of “Southern Chinese Cluster” ∼2,000 BP.
Limitation
Since some computational methods applied in this study have statistical assumptions, we notice the possible violation of original assumptions in the following cases and caution potential over-interpretation. Both qpAdm and qpWave assume that there is no back-migration from “left” populations (i.e., source and target for qpAdm, target for qpWave) to “right” populations (i.e., outgroup). However, as the limited available ancient genomes from Southern China and Southeast Asia, such an assumption may sometimes be violated due to the close relationship between outgroups and sources. For example, the low p-value for the full model of Maonan and Dong_Hunan suggests that the real contributor for the ancestry related to a certain source (e.g., Mekong_N) may not have a closer relationship to source than to outgroup (e.g., Malaysia_LN.SG) due to the scarcity of “good” sources and outgroups. That is why we used the “p-value” ratio (Supplementary Table 7) to compare different models. For split time estimation based on Rarecoal, we assume no gene flow after the separation between Coastal Southern East Asian and Inland Southern East Asian, which may underestimate the split time between pairwise populations. However, we notice that our inference for the genetic sub-structure established “pre-Holocene” still holds even taking this factor into account. Finally, ALDER assumes a single pulse of admixture (Loh et al., 2013). However, as the continuous admixture is often the case (e.g., for TB_MSEA individuals, Figure 6B), we may obtain an underestimated time for admixture in such cases (Hellenthal, 2019).
Prospective
This study provides profound insights into the genetic history of present-day Southern Chinese. However, as the scarcity of ancient genomes from Southern China, the scenarios of many genetic history events inferred in this study are not fully clear. For example, it is still obscure how and to what extent the Yangtze River Farmers related to present-day populations in the “Southern Chinese Cluster” due to the scarcity of ancient genomes from the Yangtze River Basin. Besides, ancient samples from Fujian since ∼4,000 BP would provide further information on the population transition of local Neolithic Fujianese to present-day Han Chinese in Fujian.
Publisher’s Note
All claims expressed in this article are solely those of the authors and do not necessarily represent those of their affiliated organizations, or those of the publisher, the editors and the reviewers. Any product that may be evaluated in this article, or claim that may be made by its manufacturer, is not guaranteed or endorsed by the publisher.
Statements
Data availability statement
The datasets presented in this study can be found in online repositories. The names of the repository/repositories and accession number(s) can be found below:https://zenodo.org/record/4570184, 4570184.
Ethics statement
The studies involving human participants were reviewed and approved by Ethical Committee of Youjiang Medical University for Nationalities and Xiamen University (approval number: XDYX2019009). The patients/participants provided their written informed consent to participate in this study.
Author contributions
C-CW and Z-YX conceived and designed the study and wrote the manuscript with input from other authors. XH, XB, LY, YH, FM, YY, and TY collected the samples and performed genotyping experiments. Z-YX, GH, JG, AA, JZ, YL, RH, L-HW, and C-CW performed genomic analyses. All authors have reviewed and contributed to the final manuscript.
Funding
This work was funded by the National Natural Science Foundation of China (NSFC 32060208, 31801040), the “Double First Class University Plan” key construction project of Xiamen University (the origin and evolution of East Asian populations and the spread of Chinese civilization, 0310/X2106027), Nanqiang Outstanding Young Talents Program of Xiamen University (X2123302), the Major Project of National Social Science Foundation of China granted to C-CW (21&ZD285), the Major Project of National Social Science Foundation of China (20&ZD248), the Major Project of National Social Science Foundation of China (2021MZD014), and the European Research Council (ERC) grant (ERC-2019-ADG-883700-TRAM).
Acknowledgments
S. Fang and Z. Xu from Information and Network Center of Xiamen University are acknowledged for the help with the high-performance computing.
Conflict of interest
The authors declare that the research was conducted in the absence of any commercial or financial relationships that could be construed as a potential conflict of interest.
Supplementary material
The Supplementary Material for this article can be found online at: https://www.frontiersin.org/articles/10.3389/fevo.2022.853391/full#supplementary-material
Footnotes
References
1
AlexanderD. H.NovembreJ.LangeK. (2009). Fast model-based estimation of ancestry in unrelated individuals.Genome Res.191655–1664. 10.1101/gr.094052.109
2
BellwoodP. S. (2005). First Farmers: The Origins of Agricultural Societies.Oxford: Blackwell.
3
BlenchR. M. (2013). “The prehistory of the Daic (Tai-Kadai) speaking peoples and the hypothesis of an Austronesian connection,” in Unearthing Southeast Asia’s Past: Selected Papers from the 12th International Conference of the European Association of Southeast Asian Archaeologists, edsKlokkeM. J.DegrootV. (Singapore: National University of Singapore Press), 3–15.
4
BrowningB. L.BrowningS. R. (2013). Improving the accuracy and efficiency of identity-by-descent detection in population data.Genetics194459–471. 10.1534/genetics.113.150029
5
ChangmaiP.JaisamutK.KampuansaiJ.KutananW.AltınışıkN. E.FlegontovaO.et al (2021). Indian genetic heritage in Southeast Asian populations.bioRxiv [Preprint]. 10.1101/2021.01.21.427591
6
ClarkP. U.DykeA. S.ShakunJ. D.CarlsonA. E.ClarkJ.WohlfarthB.et al (2009). The last glacial maximum.Science325710–714.
7
DardessJ. W. (2011). Ming China, 1368–1644: A Concise History of a Resilient Empire.Lanham, MD: Rowman & Littlefield Publishers.
8
de Barros DamgaardP.MarchiN.RasmussenS.PeyrotM.RenaudG.KorneliussenT.et al (2018a). 137 ancient human genomes from across the Eurasian steppes.Nature557369–374.
9
de Barros DamgaardP.MartinianoR.KammJ.Moreno-MayarJ. V.KroonenG.PeyrotM.et al (2018b). The first horse herders and the impact of early Bronze Age steppe expansions into Asia.Science360:eaar7711. 10.1126/science.aar7711
10
DiamondJ.BellwoodP. (2003). Farmers and their languages: the first expansions.Science300597–603. 10.1126/science.1078208
11
FennerJ. N. (2005). Cross-cultural estimation of the human generation interval for use in genetics-based population divergence studies.Am. J. Phys. Anthropol.128415–423. 10.1002/ajpa.20188
12
FlegontovP.AltınışıkN. E.ChangmaiP.RohlandN.MallickS.AdamskiN.et al (2019). Palaeo-Eskimo genetic ancestry and the peopling of Chukotka and North America.Nature570236–240. 10.1038/s41586-019-1251-y
13
FuQ.LiH.MoorjaniP.JayF.SlepchenkoS. M.BondarevA. A.et al (2014). Genome sequence of a 45,000-year-old modern human from western Siberia.Nature514445–449. 10.1038/nature13810
14
FullerD. Q. (2011). Pathways to Asian civilizations: tracing the origins and spread of rice and rice cultures.Rice478–92.
15
GakuhariT.NakagomeS.RasmussenS.AllentoftM. E.SatoT.KorneliussenT.et al (2020). Ancient Jomon genome sequence analysis sheds light on migration patterns of early East Asian populations.Commun. Biol.3:437. 10.1038/s42003-020-01162-2
16
HaakW.LazaridisI.PattersonN.RohlandN.MallickS.LlamasB.et al (2015). Massive migration from the steppe was a source for Indo-European languages in Europe.Nature522207–211. 10.1038/nature14317
17
HajdinjakM.MafessoniF.SkovL.VernotB.HübnerA.FuQ.et al (2021). Initial upper Palaeolithic humans in Europe had recent Neanderthal ancestry.Nature592253–257. 10.1038/s41586-021-03335-3
18
HeG. L.LiY. X.WangM. G.ZouX.YehH. Y.YangX. M.et al (2020). Fine-scale genetic structure of Tujia and central Han Chinese revealing massive genetic admixture under language borrowing.J. Syst. Evol.591–20.
19
HeG.WangZ.GuoJ.WangM.ZouX.TangR.et al (2020). Inferring the population history of Tai-Kadai-speaking people and southernmost Han Chinese on Hainan Island by genome-wide array genotyping.Eur. J. Hum. Genet.281111–1123. 10.1038/s41431-020-0599-7
20
HellenthalG. (2019). “Population structure, demography and recent admixture,” in Handbook of Statistical Genomics, edsBaldingD.MoltkeI.MarioniJ. (New York, NY: Wiley), 247–274.
21
HuangX.ZhouQ.BinX.LaiS.LinC.HuR.et al (2018). The genetic assimilation in language borrowing inferred from Jing People.Am. J. Phys. Anthropol.166638–648. 10.1002/ajpa.23449
22
Institute of Linguistics [IOL] (2012). The Language Atlas of China.Beijing: The Commercial Press.
23
JacquesG. (2021). “Hmong-mien and rgyalrongic,” in Studies in Asian Historical Linguistics, Philology and Beyond, edsKupchikJ.Alonso de la FuenteJ. A.MiyakeM. H. (Leiden: Brill Publishers), 150–153.
24
JeongC.BalanovskyO.LukianovaE.KahbatkyzyN.FlegontovP.ZaporozhchenkoV.et al (2019). The genetic history of admixture across inner Eurasia.Nat. Ecol. Evol.3966–976. 10.1038/s41559-019-0878-2
25
JeongC.OzgaA. T.WitonskyD. B.MalmströmH.EdlundH.HofmanC. A.et al (2016). Long-term genetic stability and a high-altitude East Asian origin for the peoples of the high valleys of the Himalayan arc.Proc. Natl. Acad. Sci. U. S. A.1137485–7490. 10.1073/pnas.1520844113
26
JiangY. (2018). Thinking about “Ming China” anew: the ethnocultural space in a diverse empire—with special reference to the “Miao Territory”.J. Chin. Hist.227–78.
27
JonesE. R.Gonzalez-FortesG.ConnellS.SiskaV.ErikssonA.MartinianoR.et al (2015). Upper Palaeolithic genomes reveal deep roots of modern Eurasians.Nat. Commun.6:8912. 10.1038/ncomms9912
28
KamberovY. G.WangS.TanJ.GerbaultP.WarkA.TanL.et al (2013). Modeling recent human evolution in mice by expression of a selected EDAR variant.Cell.152691–702. 10.1016/j.cell.2013.01.016
29
KutananW.LiuD.KampuansaiJ.SrikummoolM.SrithawongS.ShoocongdejR.et al (2021). Reconstructing the human genetic history of mainland Southeast Asia: insights from genome-wide data from Thailand and Laos.Mol. Biol. Evol.383459–3477. 10.1093/molbev/msab124
30
KutananW.ShoocongdejR.SrikummoolM.HübnerA.SuttipaiT.SrithawongS.et al (2020). Cultural variation impacts paternal and maternal genetic lineages of the Hmong-Mien and Sino-Tibetan groups from Thailand.Eur. J. Hum. Genet.281563–1579. 10.1038/s41431-020-0693-x
31
LawsonD. J.Van DorpL.FalushD. (2018). A tutorial on how not to over-interpret STRUCTURE and ADMIXTURE bar plots.Nat. Commun.9:3258. 10.1038/s41467-018-05257-7
32
LazaridisI.NadelD.RollefsonG.MerrettD. C.RohlandN.MallickS.et al (2016). Genomic insights into the origin of farming in the ancient Near East.Nature536419–424. 10.1038/nature19310
33
LazaridisI.PattersonN.MittnikA.RenaudG.MallickS.KirsanowK.et al (2014). Ancient human genomes suggest three ancestral populations for present-day Europeans.Nature513409–413. 10.1038/nature13673
34
LipsonM.CheronetO.MallickS.RohlandN.OxenhamM.PietrusewskyM.et al (2018a). Ancient genomes document multiple waves of migration in Southeast Asian prehistory.Science36192–95. 10.1126/science.aat3188
35
LipsonM.SkoglundP.SpriggsM.ValentinF.BedfordS.ShingR.et al (2018b). Population turnover in remote Oceania shortly after initial settlement.Curr. Biol.281157–1165. 10.1016/j.cub.2018.02.051
36
LipsonM.LohP.-R.PattersonN.MoorjaniP.KoY.-C.StonekingM.et al (2014). Reconstructing Austronesian population history in island Southeast Asia.Nat. Commun.5:4689. 10.1038/ncomms5689
37
LipsonM.SpriggsM.ValentinF.BedfordS.ShingR.ZingerW.et al (2020). Three phases of ancient migration shaped the ancestry of human populations in Vanuatu.Curr. Biol.304846–4856.e6. 10.1016/j.cub.2020.09.035
38
LiuD.DuongN. T.TonN. D.Van PhongN.PakendorfB.Van HaiN.et al (2020). Extensive ethnolinguistic diversity in Vietnam reflects multiple sources of genetic diversity.Mol. Biol. Evol.372503–2519. 10.1093/molbev/msaa099
39
LiuL.ChenX. (2012). The Archaeology of China: From the Late Paleolithic to the Early Bronze Age.Cambridge: Cambridge University Press.
40
LohP.-R.LipsonM.PattersonN.MoorjaniP.PickrellJ. K.ReichD.et al (2013). Inferring admixture histories of human populations using linkage disequilibrium.Genetics1931233–1254. 10.1534/genetics.112.147330
41
MaX.YangW.GaoY.PanY.LuY.ChenH.et al (2021). Genetic origins and sex-biased admixture of the Huis.Mol. Biol. Evol.383804–3819. 10.1093/molbev/msab158
42
MallickS.LiH.LipsonM.MathiesonI.GymrekM.RacimoF.et al (2016). The Simons genome diversity project: 300 genomes from 142 diverse populations.Nature538201–206. 10.1038/nature18964
43
MaoX.ZhangH.QiaoS.LiuY.ChangF.XieP.et al (2021). The deep population history of northern East Asia from the Late Pleistocene to the Holocene.Cell1843256–3266. 10.1016/j.cell.2021.04.040
44
MassilaniD.SkovL.HajdinjakM.GunchinsurenB.TseveendorjD.YiS.et al (2020). Denisovan ancestry and population history of early East Asians.Science370579–583. 10.1126/science.abc1166
45
MathiesonI.LazaridisI.RohlandN.MallickS.PattersonN.RoodenbergS. A.et al (2015). Genome-wide patterns of selection in 230 ancient Eurasians.Nature528499–503. 10.1038/nature16152
46
MayewskiP. A.RohlingE. E.StagerJ. C.KarlénW.MaaschK. A.MeekerL. D.et al (2004). Holocene climate variability.Quat. Res.62243–255.
47
McCollH.RacimoF.VinnerL.DemeterF.GakuhariT.Moreno-MayarJ. V.et al (2018). The prehistoric peopling of Southeast Asia.Science36188–92. 10.1126/science.aat3628
48
MittnikA.WangC.-C.PfrengleS.DaubarasM.ZariņaG.HallgrenF.et al (2018). The genetic prehistory of the Baltic Sea region.Nat. Commun.9:442.
49
MondalM.CasalsF.XuT.Dall’OlioG. M.PybusM.NeteaM. G.et al (2016). Genomic analysis of Andamanese provides insights into ancient human migration into Asia and adaptation.Nat. Genet.481066–1070. 10.1038/ng.3621
50
Moreno-MayarJ. V.PotterB. A.VinnerL.SteinrückenM.RasmussenS.TerhorstJ.et al (2018a). Terminal Pleistocene Alaskan genome reveals first founding population of Native Americans.Nature553203–207. 10.1038/nature25173
51
Moreno-MayarJ. V.VinnerL.de Barros DamgaardP.de la FuenteC.ChanJ.SpenceJ. P.et al (2018b). Early human dispersals within the Americas.Science362:eaav2621. 10.1126/science.aav2621
52
NakanishiH. (2010). On the genetic affiliation of Shehua.J. Chin. Linguist. Monogr. Ser.24, 247–267.
53
NarasimhanV. M.PattersonN.MoorjaniP.RohlandN.BernardosR.MallickS.et al (2019). The formation of human populations in South and Central Asia.Science365:eaat7487. 10.1126/science.aat7487
54
NingC.LiT.WangK.ZhangF.LiT.WuX.et al (2020). Ancient genomes from northern China suggest links between subsistence changes and human migration.Nat. Commun.11:2700. 10.1038/s41467-020-16557-2
55
NingC.WangC.-C.GaoS.YangY.ZhangX.WuX.et al (2019). Ancient genomes reveal Yamnaya-related ancestry and a potential source of Indo-European Speakers in iron age Tianshan.Curr. Biol.292526–2532.e4. 10.1016/j.cub.2019.06.044
56
O’ConnellJ.GurdasaniD.DelaneauO.PirastuN.UliviS.CoccaM.et al (2014). A general approach for haplotype phasing across the full spectrum of relatedness.PLoS Genet.10:e1004234. 10.1371/journal.pgen.1004234
57
OstapiratW. (2013). “Austro-Tai revisited,” in 23rd Annual Meeting of the Southeast Asian Linguistic Society, (Pathum Wan: Chulalongkorn University).
58
OstapiratW. (2018). 7. Macrophyletic trees of East Asian languages re examined.Senri Ethnol. Stud.98107–121.
59
PalamaraP. F.LenczT.DarvasiA.Pe’erI. (2012). Length distributions of identity by descent reveal fine-scale demographic history.Am. J. Hum. Genet.91809–822. 10.1016/j.ajhg.2012.08.030
60
PattersonN. J.MoorjaniP.LuoY.MallickS.RohlandN.ZhanY.et al (2012). Ancient admixture in human history.Genetics1921065–1093.
61
PattersonN.PriceA. L.ReichD. (2006). Population structure and eigenanalysis.PLoS Genet.2:e190. 10.1371/journal.pgen.0020190
62
PrüferK.de FilippoC.GroteS.MafessoniF.KorlevićP.HajdinjakM.et al (2017). A high-coverage Neandertal genome from Vindija Cave in Croatia.Science358655–658. 10.1126/science.aao1887
63
PrüferK.RacimoF.PattersonN.JayF.SankararamanS.SawyerS.et al (2014). The complete genome sequence of a Neanderthal from the Altai Mountains.Nature50543–49. 10.1038/nature12886
64
PugachI.HübnerA.HungH.-C.MeyerM.CarsonM. T.StonekingM. (2021). Ancient DNA from Guam and the peopling of the Pacific.Proc. Natl. Acad. Sci.118:e2022112118. 10.1073/pnas.2022112118
65
PurcellS.NealeB.Todd-BrownK.ThomasL.FerreiraM. A.BenderD.et al (2007). PLINK: a tool set for whole-genome association and population-based linkage analyses.Am. J. Hum. Genet.81559–575. 10.1086/519795
66
RaghavanM.SkoglundP.GrafK. E.MetspaluM.AlbrechtsenA.MoltkeI.et al (2014). Upper Palaeolithic Siberian genome reveals dual ancestry of Native Americans.Nature50587–91. 10.1038/nature12736
67
RasmussenM.AnzickS. L.WatersM. R.SkoglundP.DeGiorgioM.StaffordT. W.Jret al (2014). The genome of a Late Pleistocene human from a Clovis burial site in western Montana.Nature506225–229. 10.1038/nature13025
68
RatliffM. S. (2010). Hmong-Mien Language History. Camberra, Research School of Pacific and Asian Studies.Canberra: The Australian National University.
69
ReichD.PattersonN.CampbellD.TandonA.MazieresS.RayN.et al (2012). Reconstructing Native American population history.Nature488370–374. 10.1038/nature11258
70
SagartL. (2004). The higher phylogeny of Austronesian and the position of Tai-Kadai.Oceanic Linguist.43411–444.
71
ScallyA.DurbinR. (2012). Revising the human mutation rate: implications for understanding human evolution.Nat. Rev. Genet.13745–753. 10.1038/nrg3295
72
SchiffelsS.HaakW.PaajanenP.LlamasB.PopescuE.LoeL.et al (2016). Iron age and Anglo-Saxon genomes from East England reveal British migration history.Nat. Commun.7:10408. 10.1038/ncomms10408
73
SchlebuschC. M.MalmströmH.GüntherT.SjödinP.CoutinhoA.EdlundH.et al (2017). Southern African ancient genomes estimate modern human divergence to 350,000 to 260,000 years ago.Science358652–655. 10.1126/science.aao6266
74
SikoraM.PitulkoV. V.SousaV. C.AllentoftM. E.VinnerL.RasmussenS.et al (2019). The population history of Northeastern Siberia since the Pleistocene.Nature570182–188. 10.1038/s41586-019-1279-z
75
SiskaV.JonesE. R.JeonS.BhakY.KimH.-M.ChoY. S.et al (2017). Genome-wide data from two early Neolithic East Asian individuals dating to 7700 years ago.Sci. Adv.3:e1601877. 10.1126/sciadv.1601877
76
SkoglundP.MallickS.BortoliniM. C.ChennagiriN.HünemeierT.Petzl-ErlerM. L.et al (2015). Genetic evidence for two founding populations of the Americas.Nature525104–108. 10.1038/nature14895
77
SkoglundP.PosthC.SirakK.SpriggsM.ValentinF.BedfordS.et al (2016). Genomic insights into the peopling of the Southwest Pacific.Nature538510–513. 10.1038/nature19844
78
SkoglundP.ThompsonJ. C.PrendergastM. E.MittnikA.SirakK.HajdinjakM.et al (2017). Reconstructing prehistoric African population structure.Cell17159–71.e21. 10.1016/j.cell.2017.08.049
79
StevensC. J.FullerD. Q. (2017). The spread of agriculture in Eastern Asia: archaeological bases for hypothetical farmer/language dispersals.Lang. Dyn. Change7152–186.
80
The 1000 Genomes Project Consortium (2015). A global reference for human genetic variation.Nature52668–74. 10.1038/nature15393
81
The HUGO Pan-Asian SNP Consortium (2009). Mapping human genetic diversity in Asia.Science3261541–1545. 10.1126/science.1177074
82
van OvenM.KayserM. (2009). Updated comprehensive phylogenetic tree of global human mitochondrial DNA variation.Hum. Mutat.30E386–E394. 10.1002/humu.20921
83
WangC. C.YehH.-Y.PopovA. N.ZhangH.-Q.MatsumuraH.SirakK.et al (2021). Genomic insights into the formation of human populations in East Asia.Nature591413–419. 10.1038/s41586-021-03336-2
84
WangT.WangW.XieG.LiZ.FanX.YangQ.et al (2021). Human population history at the crossroads of East and Southeast Asia since 11,000 years ago.Cell1843829–3841.e21. 10.1016/j.cell.2021.05.018
85
XiaZ.-Y.YanS.WangC.-C.ZhengH.-X.ZhangF.LiuY.-C.et al (2019). Inland-coastal bifurcation of southern East Asians revealed by Hmong-Mien genomic history.bioRxiv [Preprint]. 10.1101/730903
86
XuS.YinX.LiS.JinW.LouH.YangL.et al (2009). Genomic dissection of population substructure of Han Chinese and its implication in association studies.Am. J. Hum. Genet.85762–774. 10.1016/j.ajhg.2009.10.015
87
YangM. A.FanX.SunB.ChenC.LangJ.KoY.-C.et al (2020). Ancient DNA indicates human population shifts and admixture in northern and southern China.Science369282–288. 10.1126/science.aba0909
88
YangM. A.GaoX.TheunertC.TongH.Aximu-PetriA.NickelB.et al (2017). 40,000-year-old individual from Asia provides insight into early population structure in Eurasia.Curr. Biol.273202–3208. 10.1016/j.cub.2017.09.030
89
YunusbayevB.MetspaluM.MetspaluE.ValeevA.LitvinovS.ValievR.et al (2015). The genetic legacy of the expansion of Turkic-speaking nomads across Eurasia.PLoS Genet.11:e1005068. 10.1371/journal.pgen.1005068
90
ZhaoJ.WurigemuleW.SunJ.XiaZ.HeG.YangX.et al (2020). Genetic substructure and admixture of Mongolians and Kazakhs inferred from genome-wide array genotyping.Ann. Hum. Biol.47620–628. 10.1080/03014460.2020.1837952
Summary
Keywords
Southern China, population genetics, human demographic history, admixture, language diffusion, ancient DNA
Citation
Huang X, Xia Z-Y, Bin X, He G, Guo J, Adnan A, Yin L, Huang Y, Zhao J, Yang Y, Ma F, Li Y, Hu R, Yang T, Wei L-H and Wang C-C (2022) Genomic Insights Into the Demographic History of the Southern Chinese. Front. Ecol. Evol. 10:853391. doi: 10.3389/fevo.2022.853391
Received
12 January 2022
Accepted
23 May 2022
Published
30 June 2022
Volume
10 - 2022
Edited by
Lian Deng, Fudan University, China
Reviewed by
Rita Rasteiro, University of Bristol, United Kingdom; Cesar Fortes-Lima, Uppsala University, Sweden
Updates
Copyright
© 2022 Huang, Xia, Bin, He, Guo, Adnan, Yin, Huang, Zhao, Yang, Ma, Li, Hu, Yang, Wei and Wang.
This is an open-access article distributed under the terms of the Creative Commons Attribution License (CC BY). The use, distribution or reproduction in other forums is permitted, provided the original author(s) and the copyright owner(s) are credited and that the original publication in this journal is cited, in accordance with accepted academic practice. No use, distribution or reproduction is permitted which does not comply with these terms.
*Correspondence: Zi-Yang Xia, ziyang.xia.20@alumni.ucl.ac.ukChuan-Chao Wang, wang@xmu.edu.cn
†These authors have contributed equally to this work
This article was submitted to Evolutionary and Population Genetics, a section of the journal Frontiers in Ecology and Evolution
Disclaimer
All claims expressed in this article are solely those of the authors and do not necessarily represent those of their affiliated organizations, or those of the publisher, the editors and the reviewers. Any product that may be evaluated in this article or claim that may be made by its manufacturer is not guaranteed or endorsed by the publisher.