 Kevin Schoch
 Matthias Tschumi
 Stefan Lutter
 Hans Ramseier1
 Silvia Zingg
- 1School of Agriculture, Forest and Food Sciences, Bern University of Applied Sciences, Zollikofen, Switzerland
- 2Swiss Ornithological Institute, Sempach, Switzerland
Flower strips are an effective agri-environmental measure to promote functional biodiversity and ecosystem services in agricultural landscapes. In particular, tailored annual flower strips are increasingly implemented to foster insect pollination and biological pest control. While positive effects of flower strips on service providers and associated ecosystem services were recently demonstrated, little is known about how their effectiveness is affected by the surrounding landscape. We investigated how landscape composition and configuration, as well as flower strip traits influence the abundance of all insects, pollinators and natural enemies in 74 annual flower strips across 7 years (2014–2020). Landscape characteristics such as crop diversity, mean field size, area, and quality of semi-natural farmland habitats were assessed in a 1-km radius surrounding flower strips and combined with flower strip traits such as size, flower coverage, and flowering plant species richness to model insect abundance and diversity. Total insect and pollinator abundance, as well as wild bee abundance, richness, and diversity in flower strips were negatively affected by the share of semi-natural farmland habitats in the surrounding landscape, suggesting a dilution effect. On the other hand, semi-natural habitats with elevated ecological quality (i.e., biodiversity promotion areas with high botanical and structural diversity) enhanced total insect and pollinator abundance in flower strips. Furthermore, pollinator abundance and wild bee abundance in specific were positively affected by the flower coverage of the strips. Our results therefore suggest simultaneous competition and facilitation effects of semi-natural habitats on the landscape scale depending on their ecological quality. Annual flower strips will therefore be most effective in fostering services in landscapes of moderate to low complexity but with a high share of semi-natural habitats with increased ecological quality. For additional benefits for pollinator and wild bee abundance, flower strips should be designed to yield high flower cover. Our study thus highlights the importance of quality of ecological infrastructure and provides recommendations to maximize ecosystem services and biodiversity by means of flower strips at the landscape scale.
Introduction
The ongoing agricultural intensification has resulted in severe declines of farmland biodiversity and associated ecosystem services (Robinson and Sutherland, 2002). Beyond the increase in external inputs such as fertilizers and pesticides, the simplification of the agricultural landscapes was identified as the predominant driver of these declines. This includes increases in average field size, reduction in land-use diversity, and crop rotation, as well as the removal of natural and semi-natural habitats such as hedges, waterbodies or small structural elements (Stoate et al., 2001). To counteract these declines, agri-environmental schemes (AES) were implemented across Europe, after the reform of the Common Agriculture Policy in 1992 (Herzog et al., 2017). As a popular measure, AES often include subsidies for the protection and creation of semi-natural habitats such as hedges, extensively managed grasslands, or flower strips. While earlier schemes mainly targeted at halting biodiversity declines, they are now increasingly focused on protecting and enhancing ecosystem services (Kleijn et al., 2011; Scheper et al., 2013; Ekroos et al., 2014). Recently, tailored annual flower strips were designed to flexibly enhance pollination and pest control services at the time and place they are needed (Tschumi et al., 2015; Tschumi et al., 2016; Ganser et al., 2019). In Switzerland, annual flower strips are eligible biodiversity promotion areas (BPA) and part of the official AES since 2015. The basic concept of annual flower strips is that pollinators and natural enemies are attracted to the flower strips from where they spill-over to adjacent agricultural crops to enhance the respective services (Tschumi et al., 2015; Tschumi et al., 2016; Albrecht et al., 2020).
While some studies have indeed shown high effectiveness of flower strips in enhancing natural enemies and pest control (Tschumi et al., 2015; Albrecht et al., 2020) and positive effects on pollinators and crop pollination (Rundlöf et al., 2018), others have found only weak or no effects at all (Haaland et al., 2011; Albrecht et al., 2020). Besides flower strip traits, the surrounding landscape influences the colonization of flower strips and spill-over to adjacent crops. Among the most influential landscape characteristics are the proportion of arable land (Haenke et al., 2009; Carvell et al., 2011), forest cover (Fabian et al., 2013), the presence of other semi-natural habitats providing floral resources (Aviron et al., 2011; Carvell et al., 2011; Scheper et al., 2015), and habitat heterogeneity (Fabian et al., 2013; Wix et al., 2019). Typically, the abundance of beneficial arthropods in flower strips increases with the share of semi-natural habitats (Krimmer et al., 2019). This is because newly established flower strips need to be colonized from perennial habitats and arthropods need overwintering sites that are often not found in annual flower strips. However, the positive correlation with landscape complexity was often seen to level out at a higher degree of landscape complexity which is explained by the decreasing contrast created by the flower strips to the surrounding landscape (Haenke et al., 2009; Carvell et al., 2011; Scheper et al., 2015; Wix et al., 2019). Agri-environmental measures such as flower strips were thus predicted to provide the highest benefit in landscape of intermediate complexity (Tscharntke et al., 2012). Moreover, some studies have even detected negative effects of semi-natural habitats on insect abundance in flower strips. These apparently counterintuitive effects can be explained by a competition between habitats leading to a dilution of insects among the floral resources in the landscape (Desaegher et al., 2021). Hereby, a high share of suitable habitats, may results in lower insect abundance in flower strips. It is likely that both, facilitation and dilution effects often act simultaneously and that the shift from one being dominant to the other may depend on spatio-temporal conditions and specific characteristics of flower strips and landscape features. However few studies have so far assessed positive and negative effects of local flower strip traits and landscape composition and configuration simultaneously.
Annual flower strips were predominantly designed to enhance ecosystem services but are now also implemented as biodiversity-promotion measure. However, most studies have only investigated one functional group and with the exception of a few taxa (see. e.g., Tschumi et al., 2016), their effect on species diversity is largely unknown. Species- and group-specific reactions to flower strip traits have often been documented (Wood et al., 2015; Moquet et al., 2018). Whilst some groups such as bumblebees, for example, react positive to flower coverage within flower strips, others such as solitary bees do not (Jönsson et al., 2015; Wood et al., 2015). Particularly wild bees often show differentiated patterns, as they are more specialized and depend upon key plants and other species-specific factors, rather than general flower strip traits (Nichols et al., 2019). To assess the full potential of specific flower strips and their eligibility as biodiversity-promotion measures, it is thus crucial that their effects on multiple functional groups and their diversity are evaluated.
While there is increasing awareness of the different mechanisms described above, few studies have evaluated flower strip traits and landscape characteristics on multiple service providing groups and diversity components simultaneously. Using a large dataset of 74 annual flower strips across 7 years (2014–2020), we analyzed the effect of flower strip traits and landscape characteristics on total insect, pollinator, natural enemy, and wild bee abundance, as well as wild bee species richness and diversity. In specific we hypothesized that (i) flower strip traits such as flower strip size, flower coverage, and flower diversity would positively affect service providing insect abundance and diversity, and (ii) landscape characteristics associated with increasing complexity such as mean field size, crop diversity, the abundance of other biodiversity promotion areas, and the edge length of woody areas would positively affect service providing insect abundance and diversity
Materials and Methods
Flower Strips
Between 2014 and 2020, 74 flower strips were sown in the central Swiss plateau in the cantons of Bern, Freiburg, and Solothurn (mean altitude 548 m, range 413–981 m). The study area represents the typical agricultural landscape of the Swiss lowlands, characterized by a small-scale mosaic of intensively managed crop fields, meadows, and forest fragments in a comparably densely populated region (Figure 1). One to four different seed mixtures were sown in adjacent plots within one flower strip—hereafter called seed mixture plots (n = 196; see Supplementary Material 1 for illustration and seed composition of the flower strips). Flower strips were established between April 20th and May 25th by local farmers and left in place for a minimum of 100 days. No pesticides and fertilizers were used in the flower strips. All flower strips had a minimum width of 3 m and a maximum area of 0.5 ha. We used flower strip size (in hectares), flower coverage (in %), and flowering plant species richness (number of flowering plant species) as explanatory variables in the data analysis (see Table 1). Flower coverage and flowering plant species richness (only species with ≥ 0.1% coverage) was estimated in four representative squares (1 m2) in every seed mixture plot (simultaneously with the insect surveys—see below).
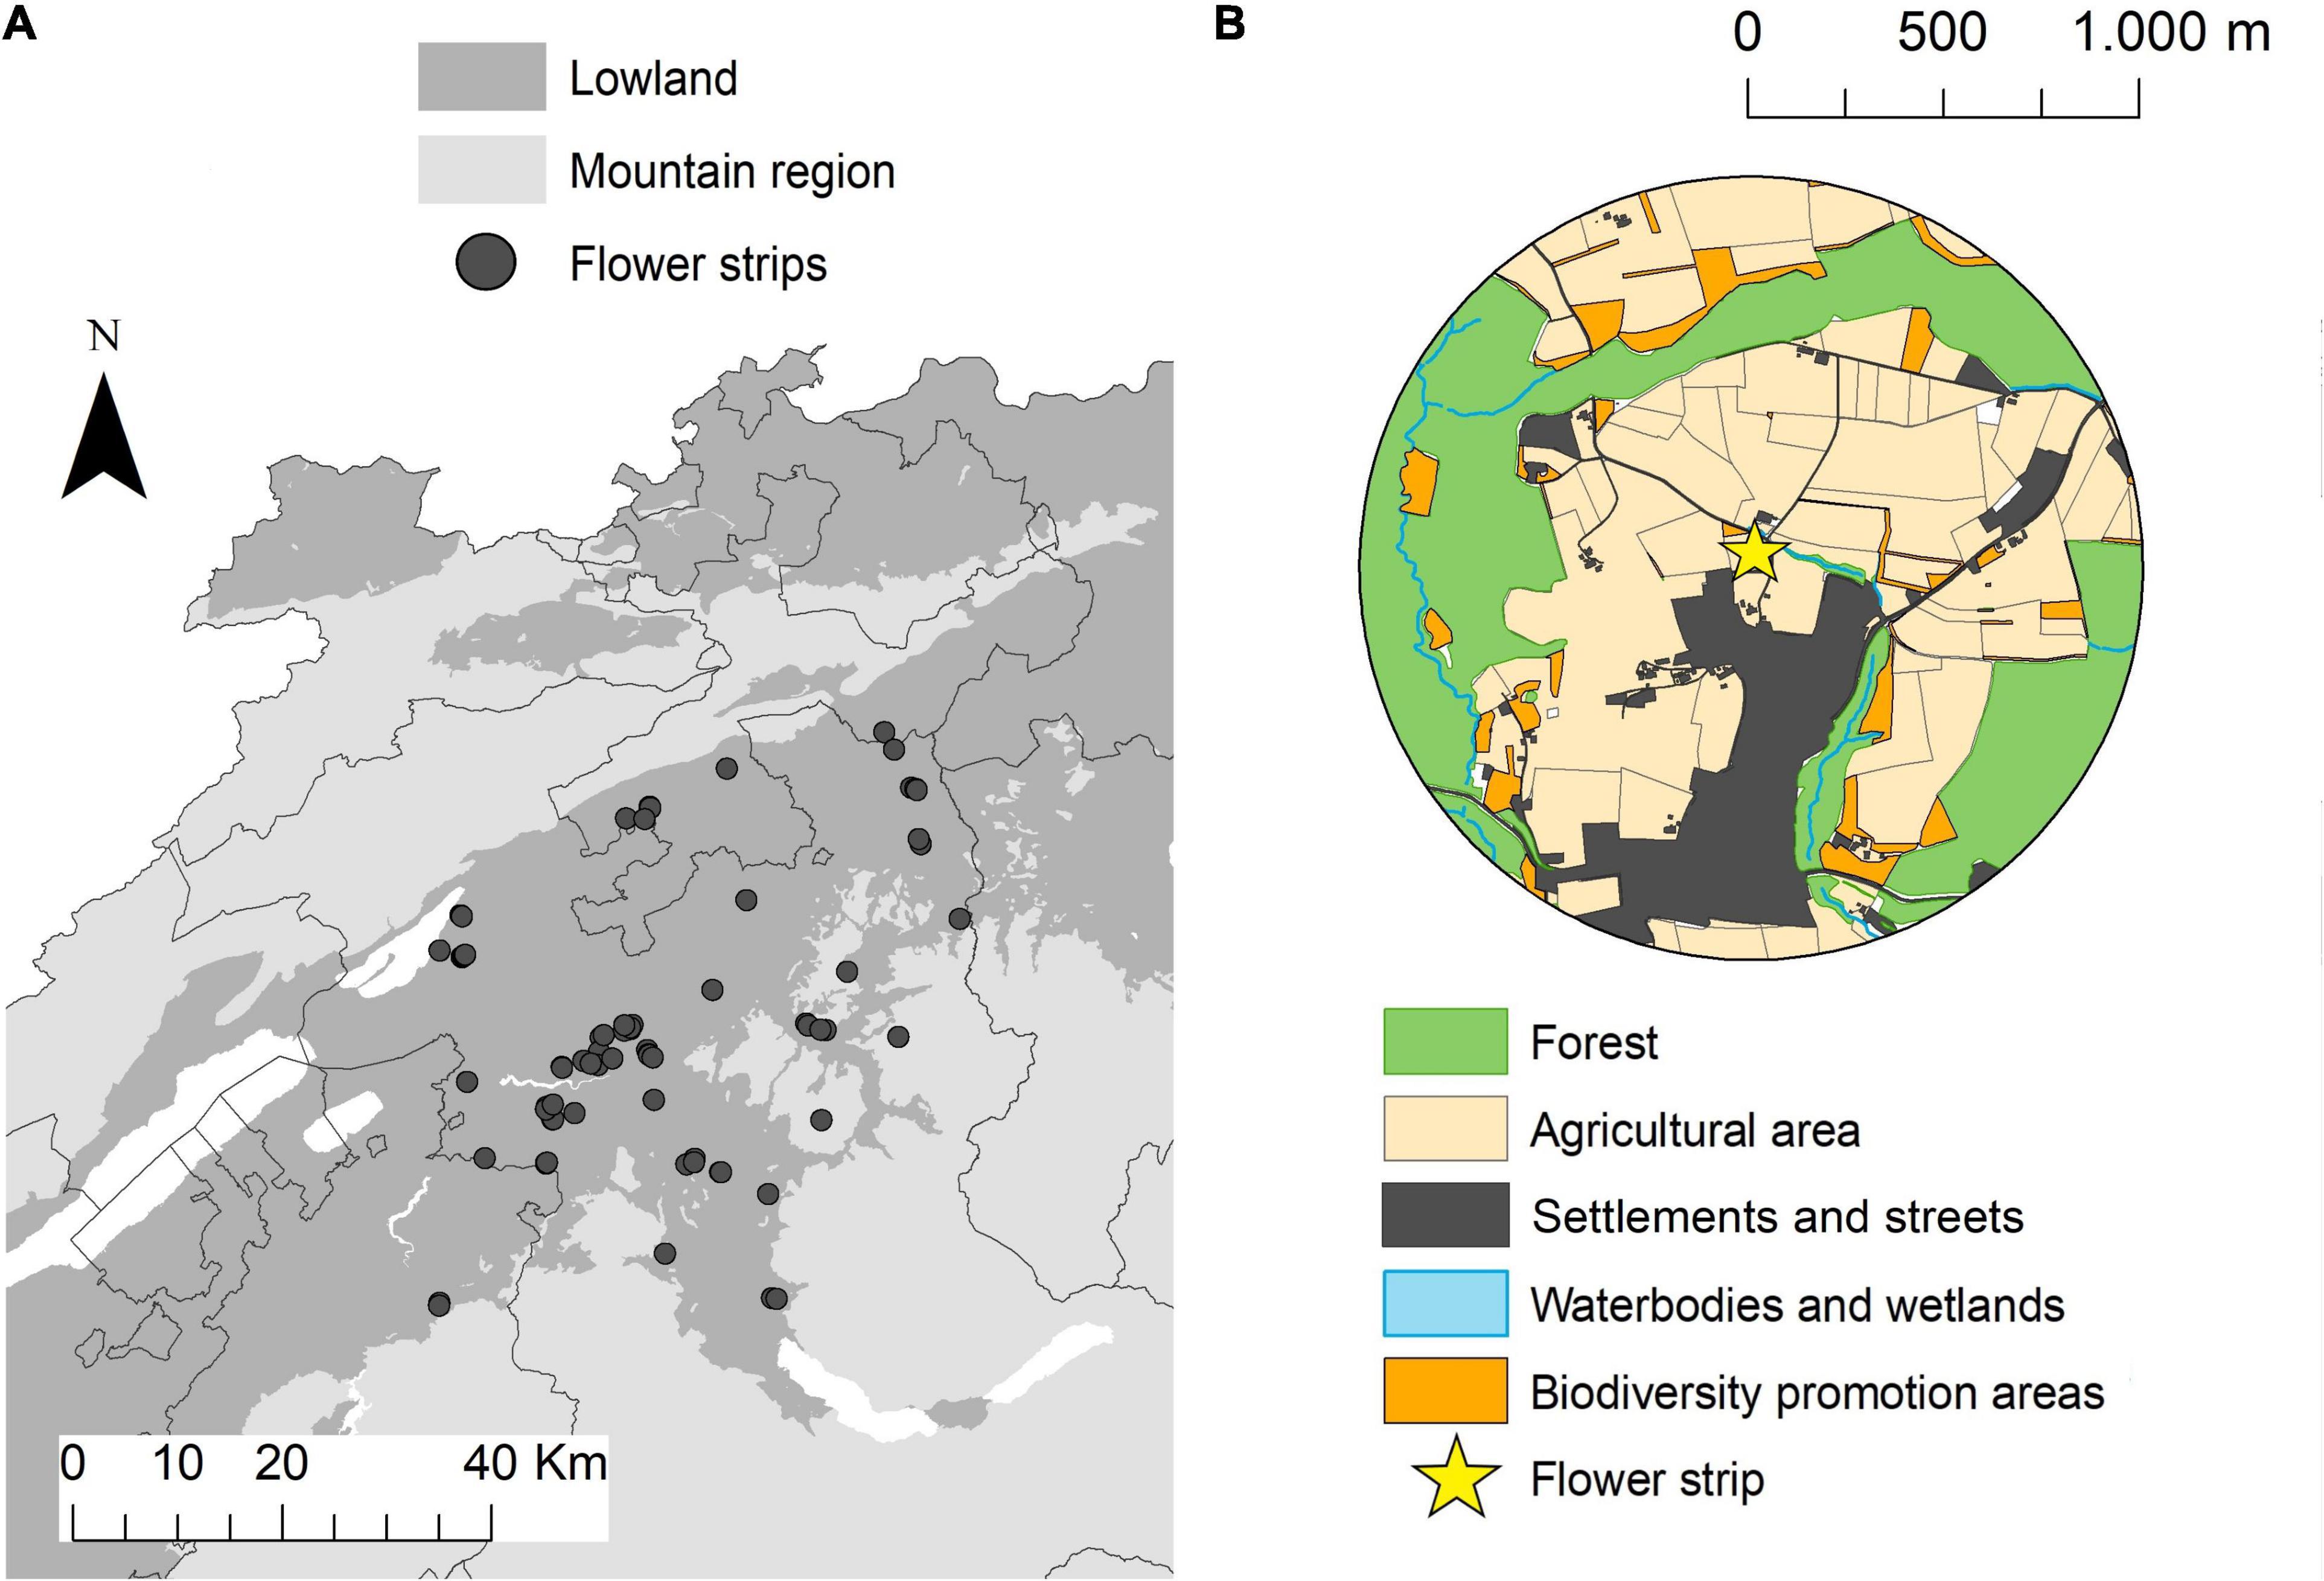
Figure 1. Map of the study area with the (n = 74) flower strip locations (A). Example of a study landscape with a 1 km radius surrounding flower strips in the center and different land use types (B).
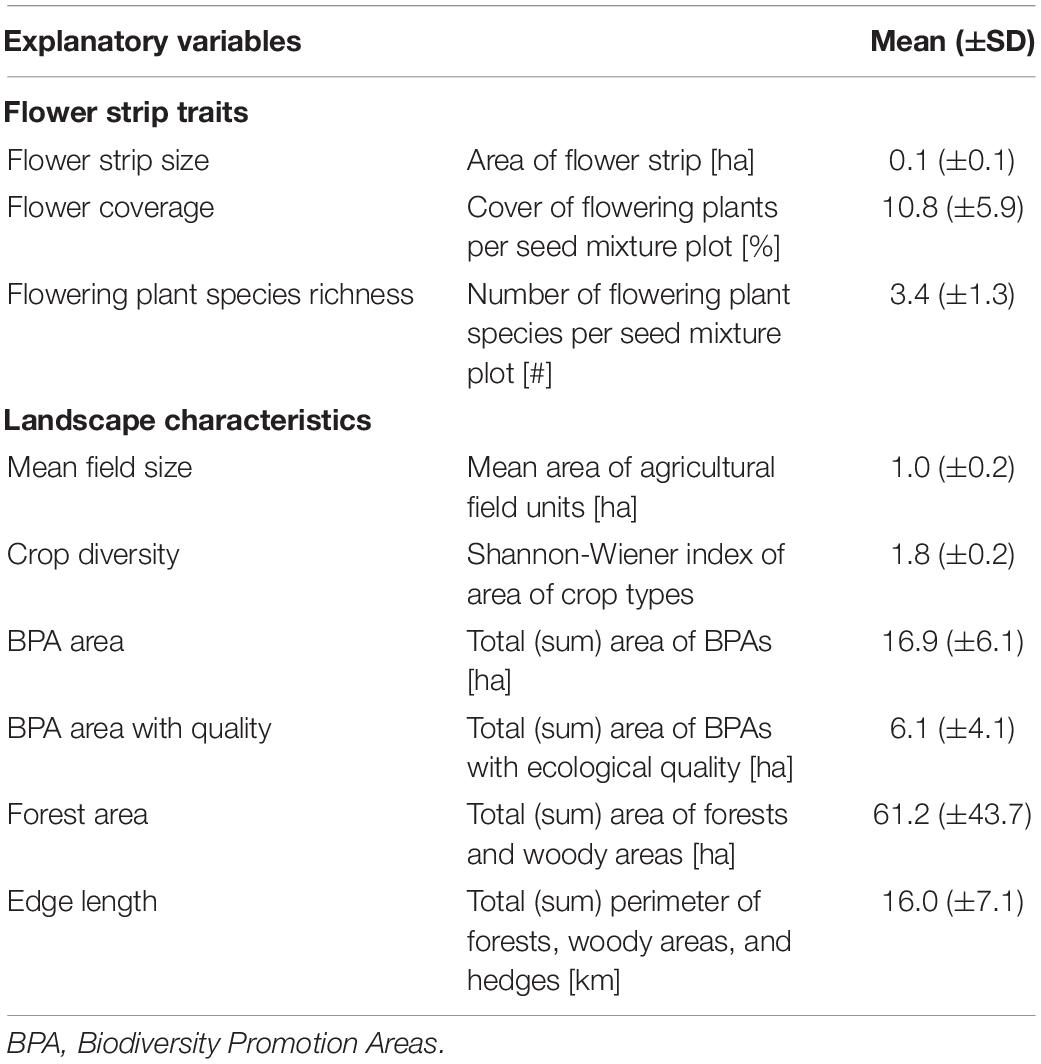
Table 1. Description of flower strip traits and landscape characteristics used as explanatory variables in all models with means ± standard deviations per flower strip and 1 km-radius landscape circles, respectively.
Landscape Characteristics
The surrounding landscape of every flower strip was described in a 1 km radius (Figure 1). Data on agricultural land-use provided by the cantonal agricultural offices allowed to calculate the share of agricultural and biodiversity promotion areas (BPA), BPA with high ecological quality, mean field size, and crop diversity for every landscape circle (see Supplementary Figure 2.1). BPA are extensively managed semi-natural habitats such as meadows, pastures, or hedges that are subsidized by the Swiss agri-environment scheme (Herzog et al., 2017). All farmers receiving direct payments have to manage at least 7% of their farmland as biodiversity promotion areas and today 98% of the Swiss farmland is managed under this scheme (Herzog et al., 2017). BPA with ecological quality, as defined by the Swiss Ordinance on Direct Payments, are BPA with high botanical and/or structural diversity and high ecological value (Herzog et al., 2017). A description of the different BPA types, management requirements and quality indicators can be found in the Supplementary Table 2.2. For crop diversity we used the Shannon–Weaver index (H) of the proportion of different crop types within each landscape circle (see Supplementary Table 2.1).
In addition to agricultural land use, we quantified forest area and total edge length for every landscape circle. Forest was defined as the summed area of densely and loosely stocked forests and smaller woody elements covered with trees and bushes (in hectares). Edge length was defined as the total length of the perimeter of forests, woody elements, and hedges (in km) and served as proxy for landscape heterogeneity (Martin et al., 2019). The data used to calculate these variables was obtained through the swissTLM3D dataset (Version 1.8 provided by the Federal Office of Topography Swisstopo) and verified using orthophotos from 2013 to 2017 (Bundesamt für Landestopografie Swisstopo, 2021). All spatial analyses were conducted in ArcGIS (Version 10.8.1).
Insect Abundance and Diversity
Insects were collected repeatedly within each seed mixture plot in intervals of 9–12 days after the start of flower blooming (between May and July). The number of surveys varied among flower strips with a minimum of two and a maximum of seven surveys but was equal for all seed mixture plots within a flower strip. All insects were collected with a sweep-net with a diameter of 40 cm. For each survey, the sweep net was swept 20 times on a standardized straight line at walking pace. Insect surveys were only done on days with favorable weather conditions (temperatures between 20 and 35°C and no rain or strong winds). Captured insects were frozen at −18°C and subsequently counted and categorized into the following groups: honeybees (Apis spp.), bumblebees (Bombus spp.), other wild bees, hoverflies (Syrphidae), parasitic wasps (Ichneumonidae), soldier beetles (Cantharidae), rove beetles (Staphylinidae), ladybirds (Coccinellidae), green lacewings (Chrysopidae), ants (Formicidae), other flies (Diptera), and all others (e.g., Heteroptera and Orthoptera). Larvae and imagines were summed within each group. In addition, all the wild bees from 80 seed mixture plots in 36 flower strips from the years 2015 to 2017 were identified to species level.
From these counts the following indicators for insect abundance and diversity were calculated: (i) Total insect abundance was defined as the mean number of all individuals, (ii) pollinator abundance as the mean number of honeybees, bumblebees, other wild bees, and hoverflies, (iii) natural enemy abundance as the mean number of parasitic wasps, hoverflies, green lacewings, and ladybirds, (iv) wild bee abundance as the mean number of bumblebees and other wild bees, (v) wild bee richness as the number of wild bee species, and (vi) wild bee diversity as the Shannon-Wiener diversity index of wild bees. The mean numbers were always calculated as the sum of all individuals divided by the number of surveys per seed mixture plot (see Table 2).
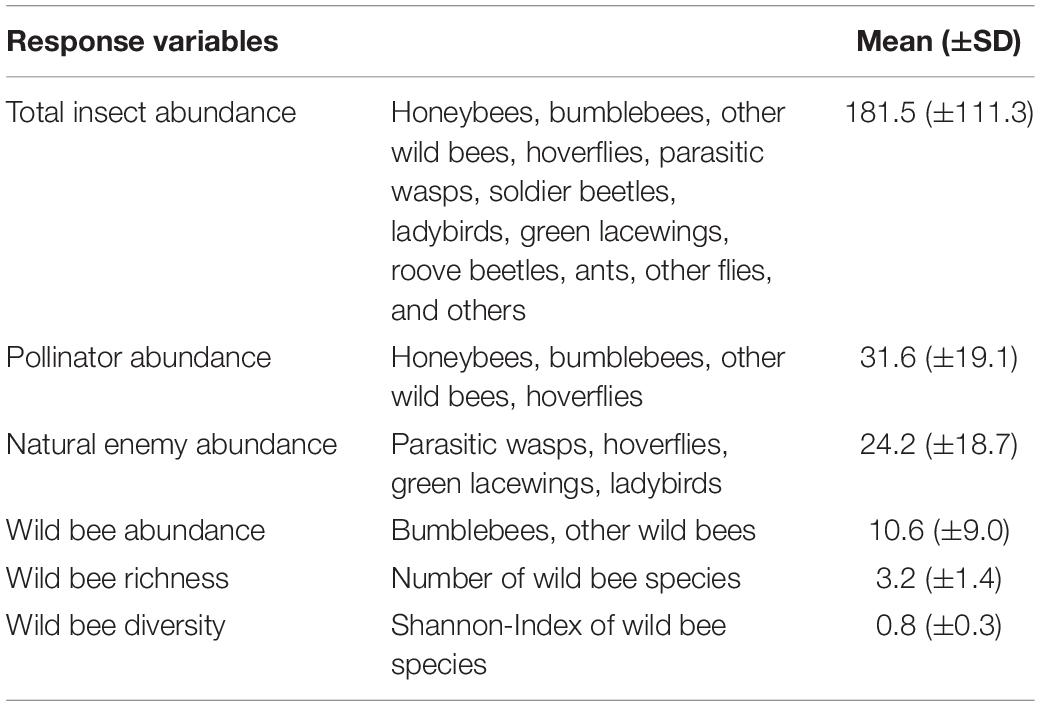
Table 2. Description of abundance and diversity indicators used as response variables. Shown are means ± standard deviations per seed mixture plot.
Data Analysis
To assess the impact of landscape characteristics and flower strip traits on insect abundance and diversity, we fitted linear mixed-effects models with total insect abundance, pollinator abundance, natural enemy abundance, wild bee abundance, as well as wild bee richness, and diversity as response variables. All explanatory variables described above (see also Table 1) were included as fixed effects in every model. To account for dependencies between observations, flower strip id and year were included in the models as crossed random effects. Pairwise correlations between explanatory variables were assessed using Pearson’s correlation coefficient (rs) and agricultural area was excluded from the models due to a strong negative correlation (rs > −0.60) with forest area. All linear mixed-effects model were fitted using the following formula:
lmer [y ∼ flower strip size + flower coverage + flowering plant species richness + BPA area + BPA area with quality + forest area + edge length + (1| Flower strip ID) + (1| Year)].
To assess if the differing number of surveys had a significant effect on our response variables, we fitted an additional linear-mixed effects model for every response variable including number of surveys as (only) fixed effect and flower strip id and year as crossed random effects. As the number of surveys had no significant effect on any response variable, it was subsequently not included in the main models. We also tested for quadratic effects of BPA area and BPA area with ecological quality, yet as there were no significant relationships, quadratic effects were not included in the final models.
Models were fitted using the R package lme4 (Bates et al., 2015) and model summaries calculated using the package lmerTest (Kuznetsova et al., 2020). Normality and homogeneity of the residuals were visually checked by using Tukey-Ascombe and QQ-plots. Spatial autocorrelation in the model residuals was checked with a Morans-I test [package DHARMa; (Hartig and Lohse, 2021)] and visually using bubble plots [package sp; (Pebesma et al., 2021)] but no remaining autocorrelation was detected (p > 0.05). Marginal effect plots were done using package sjplot (Lüdecke et al., 2021). The package vegan (Oksanen et al., 2021) was used to calculate the Shannon diversity indices. All statistical analyses were conducted in R Version 3.6.2 (R Core Team, 2021).
Results
On average we found (mean ± SD) 181.5 (±111.3) insects, 31.6 (±19.1) pollinators, 10.6 (±9.0) wild bees, and 24.2 (±18.7) natural enemies per seed mixture plot (see Table 2). Hereby, pollinator communities were influenced in equal parts by (mean number of individuals ± SD) honeybees (10.8 ± 11.2), wild bees 9.5 (±8.7), and hoverflies (9.2 ± 6.5), whilst the relative share of bumblebees was rather low (0.9 ± 1.4). The community of natural enemies was dominated by the abundance of parasitic wasps (13.1 ± 16.4) and hoverflies (9.2 ± 6.5), while green lacewings and ladybirds were rare (1.3 ± 1.3 and 0.7 ± 0.8 individuals per seed mixture plot, respectively). Detailed information on the mean number of individuals for all species groups can be found in the Supplementary Table 3.1. In 80 seed mixture plots, a total of 3’882 wild bee individuals were identified to species level. Hereby 73 different species were detected, and the mean species richness was 3.2 (±1.4). The wild bee species Lasioglossum malachurum, Lasioglossum pauxillum, Lasioglossum politum, Lasioglossum laticeps, and Bombus terrestris were the five most frequently observed species and accounted for 68% of all identified wild bee individuals.
Biodiversity promotion areas area had a consistent negative effect on all response variables except natural enemy abundance (and with wild bee abundance only being p = 0.065; Tables 3, 4; Figure 2). On the other hand, BPA area with ecological quality tended to have a positive effect on total insect abundance and pollinator abundance (Table 4; Figure 3). Finally, on the landscape scale, also forest area had a positive effect on total insect abundance (Table 3; Figure 3). From the flower strip traits, only flower coverage had a significantly positive effect on pollinator abundance and wild bee abundance and an almost significant effect on natural enemy abundance (Tables 3, 4; Figure 4). In terms of effect size, an increase in 1 ha of BPA led to a decrease in total insect, pollinator and wild bee abundance between 1.9 and 3.1% from the average (Figure 2), whereas an increase in 1 ha of BPA with ecological quality led to a predicted increase of total insect or pollinator abundance between 2.4 and 2.9%.
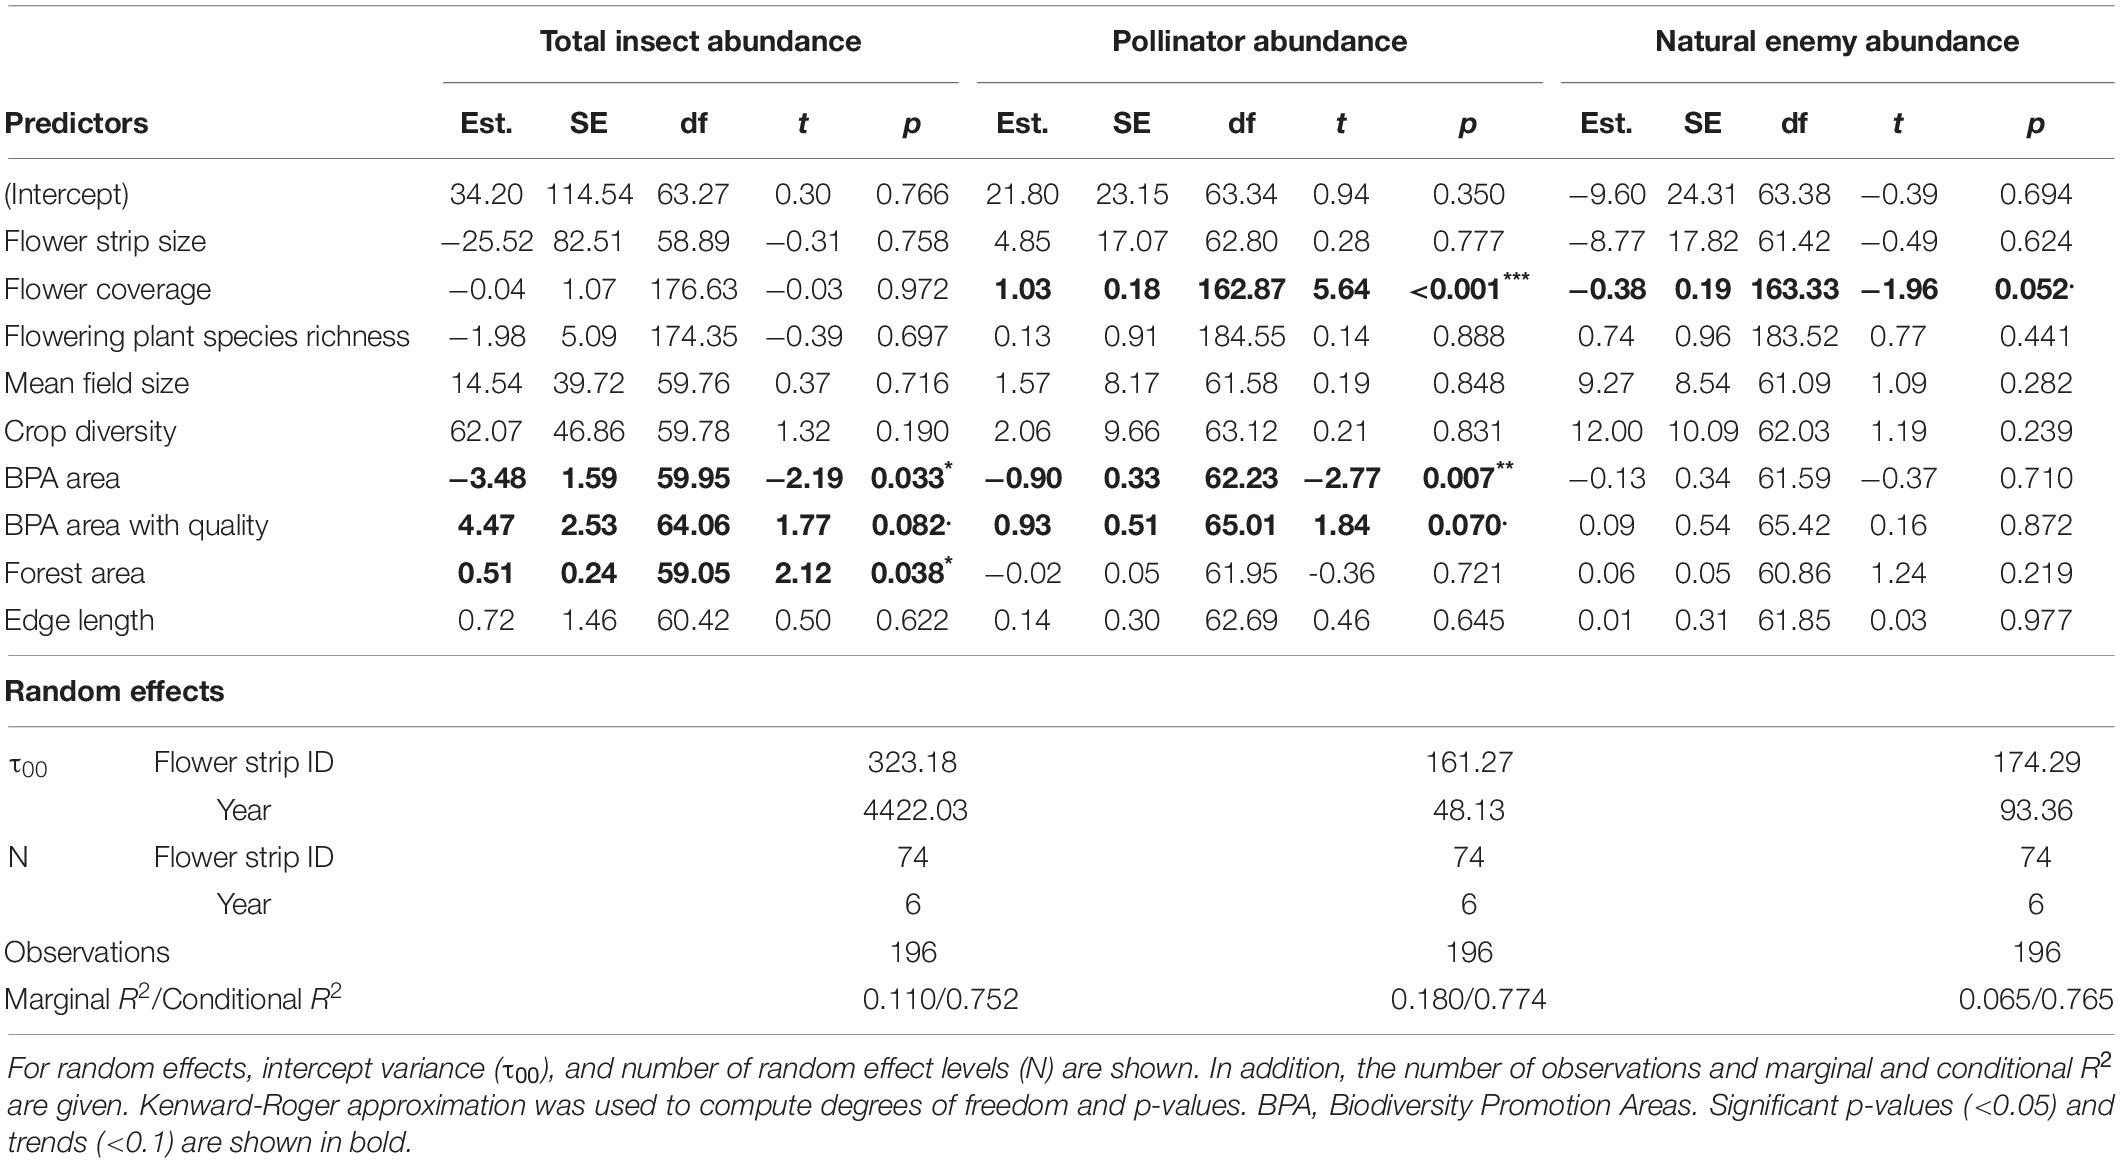
Table 3. Summary of linear mixed-effects models for total insect, pollinator, and natural enemy abundance with estimates (Est.), standard errors (SE), degrees of freedom (df), t-values (t), and p-values (***p < 0.001, **p < 0.01, *p < 0.05, .p < 0.1) for all fixed effects.
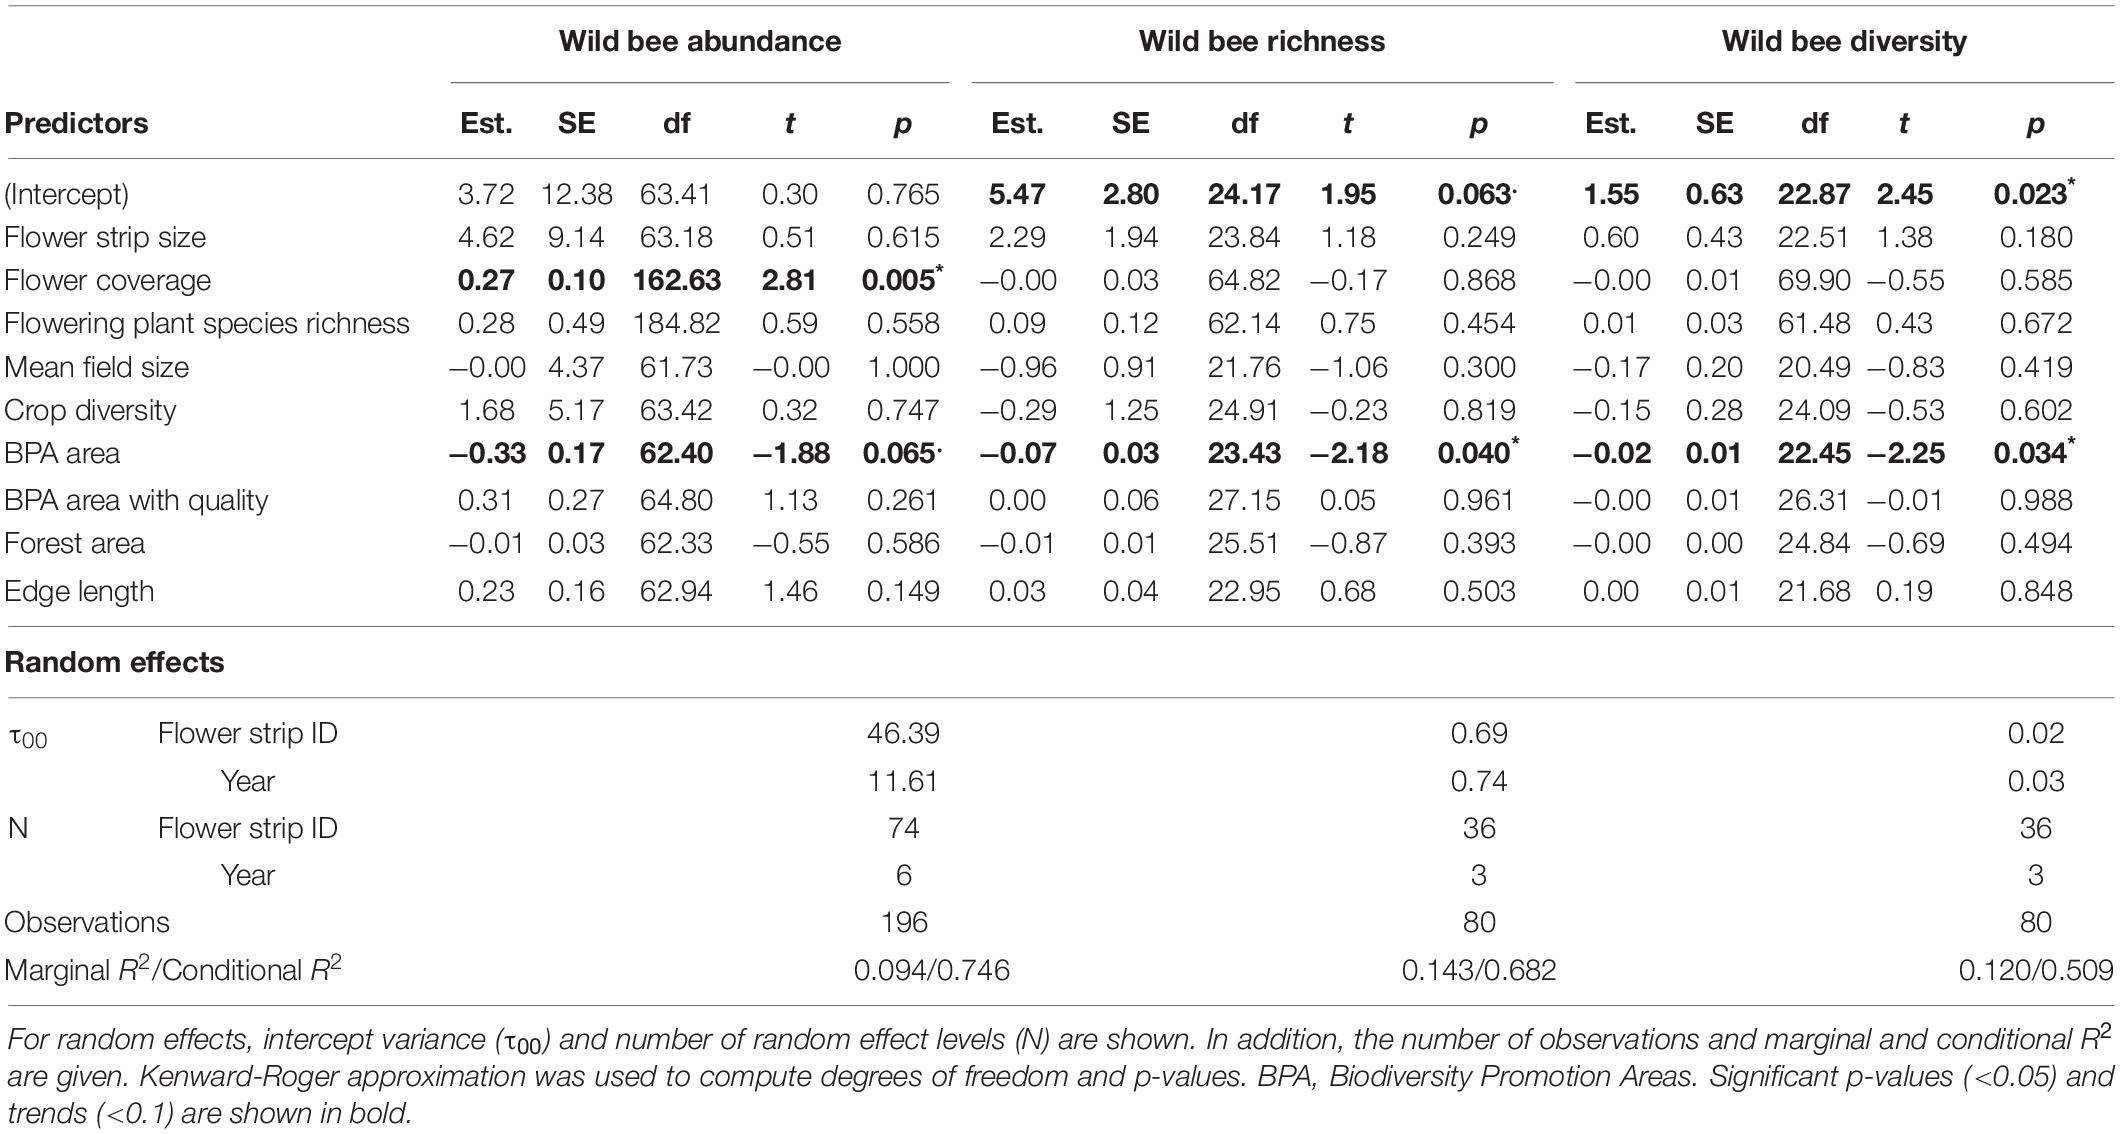
Table 4. Summary of linear mixed-effect models for wild bee abundance, wild bee richness, and wild bee diversity with estimates (Est.), standard errors (SE), degrees of freedom (df), t-values (t), and p-values (***p < 0.001, **p < 0.01, *p < 0.05, .p < 0.1) for all fixed effects.
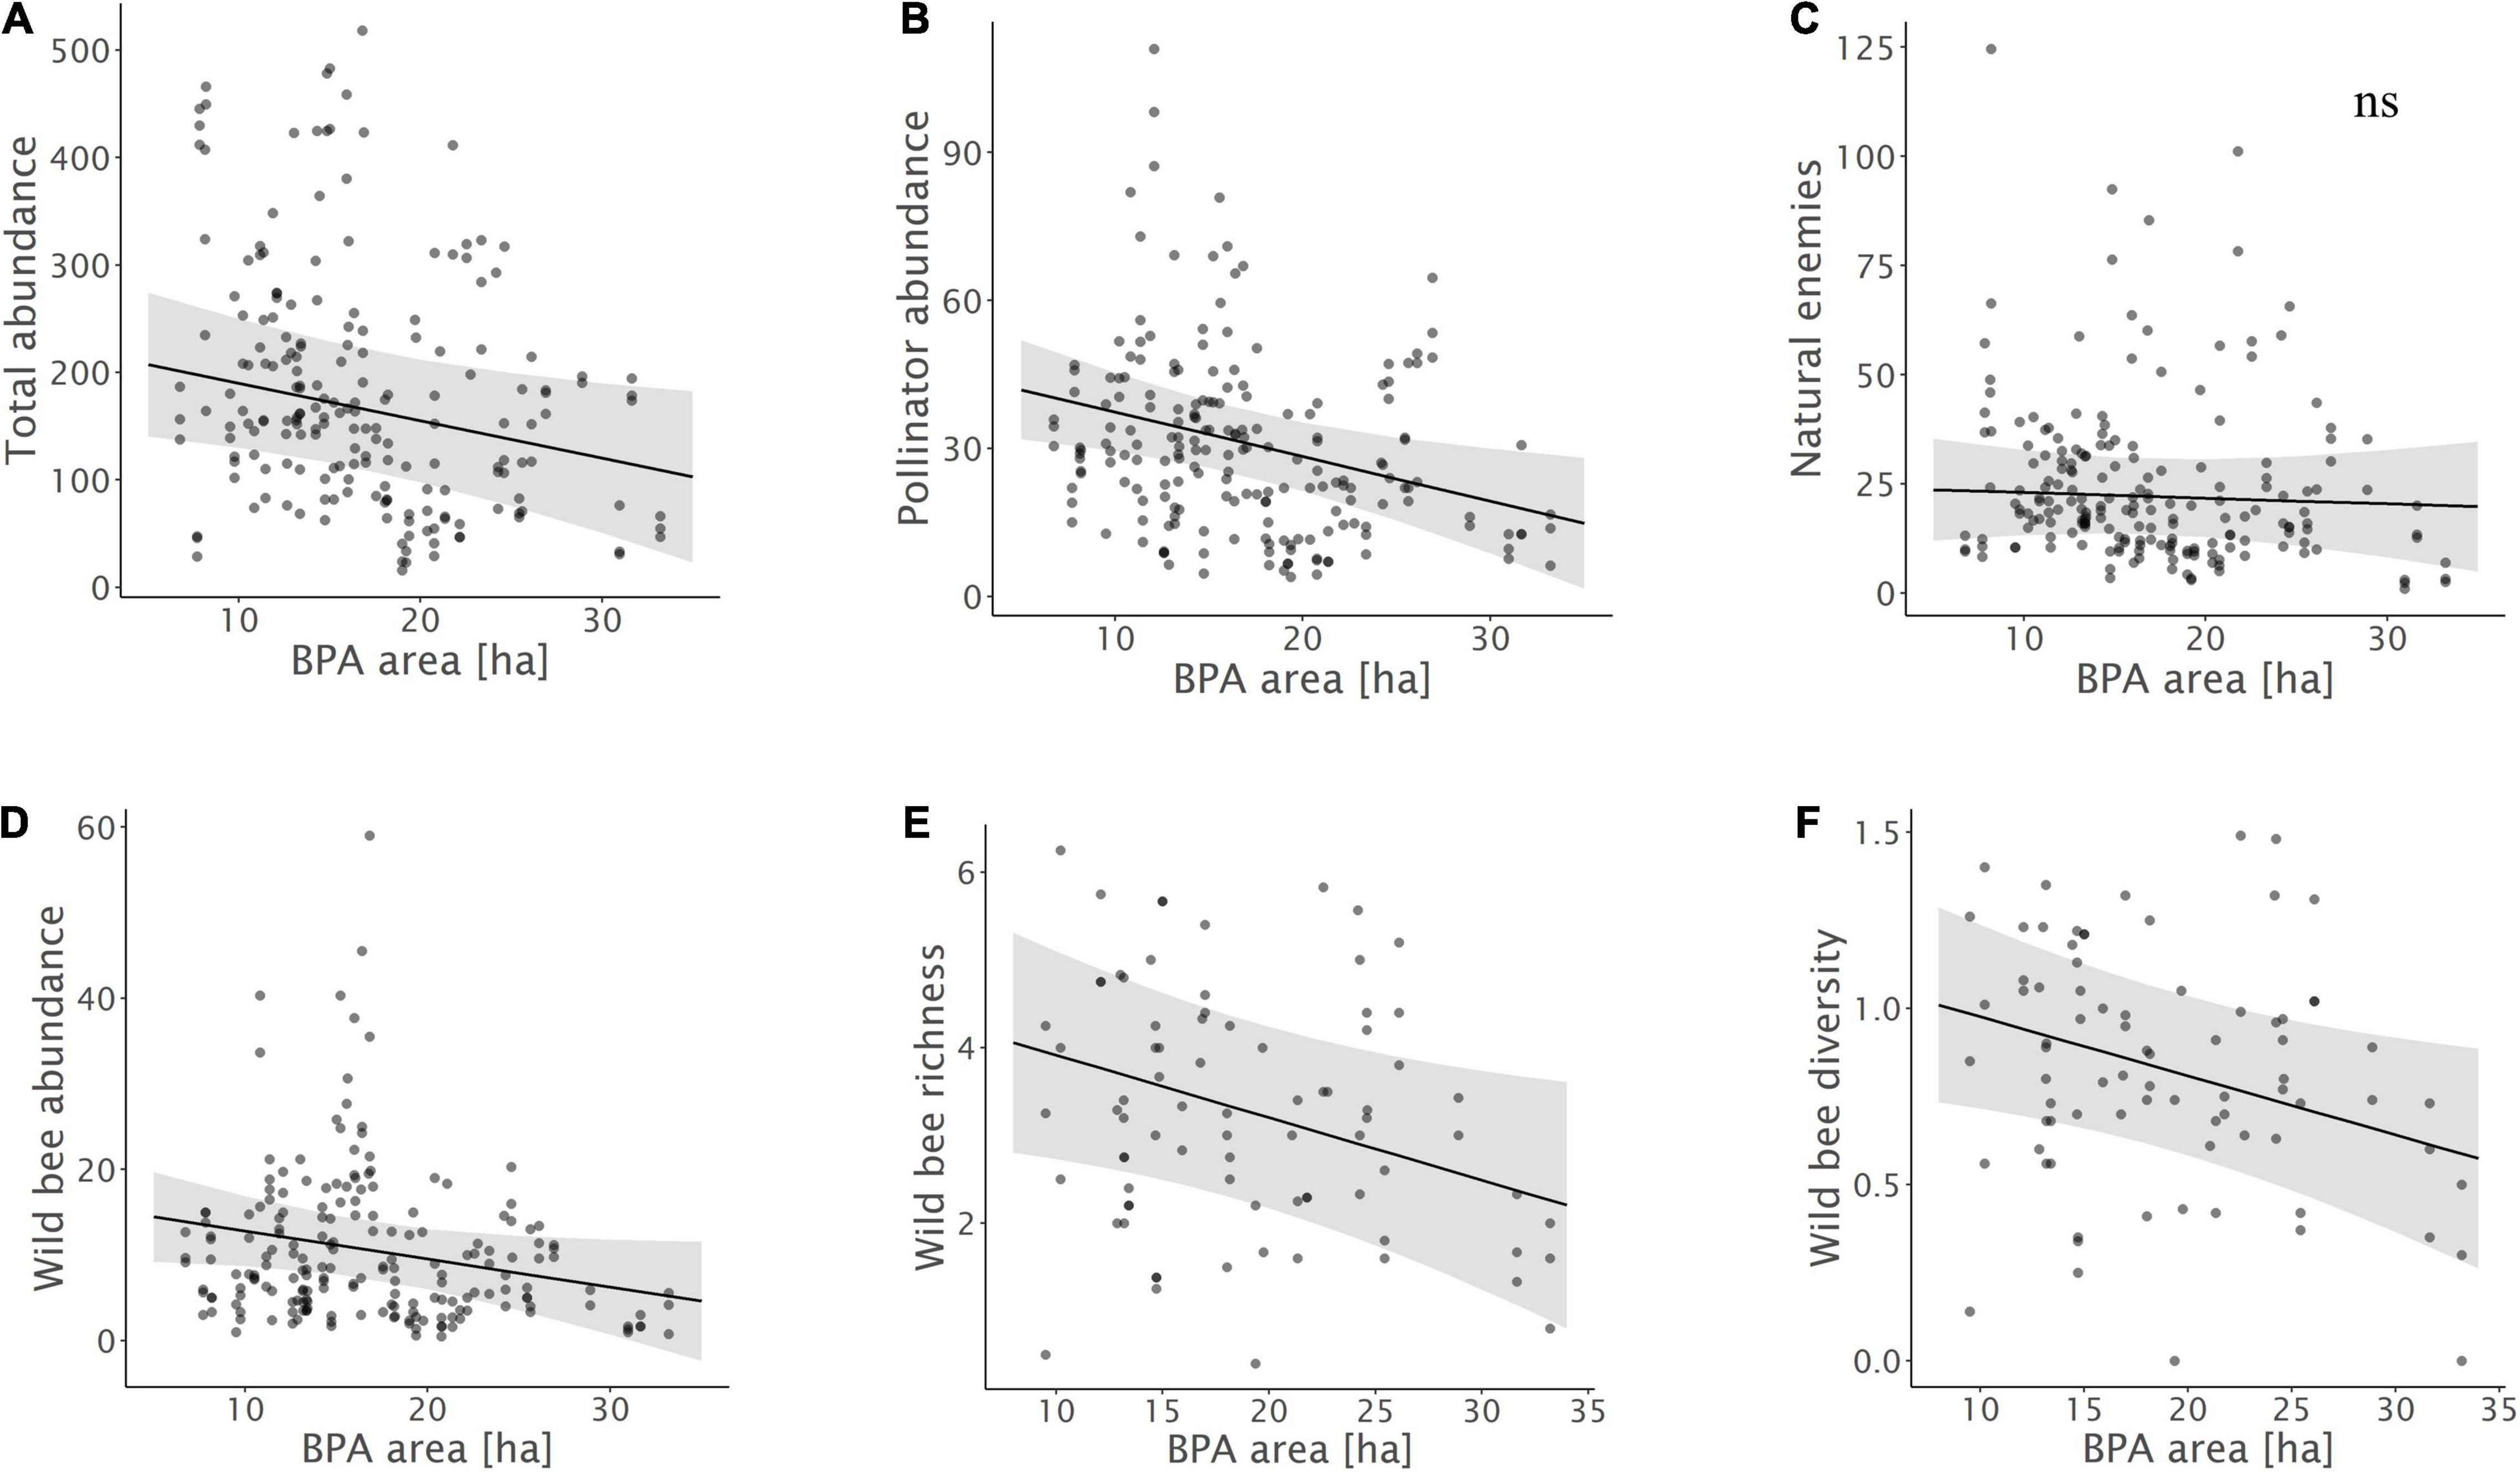
Figure 2. Relationships between (A) total insect abundance, (B) pollinator abundance, (C) natural enemy abundance, (D) wild bee abundance, (E) wild bee species richness, (F) wild bee diversity and the total area of biodiversity promotion areas (BPA) in the 1 km radius landscape circles. Model predictions with 95% confidence intervals and raw data points are shown.
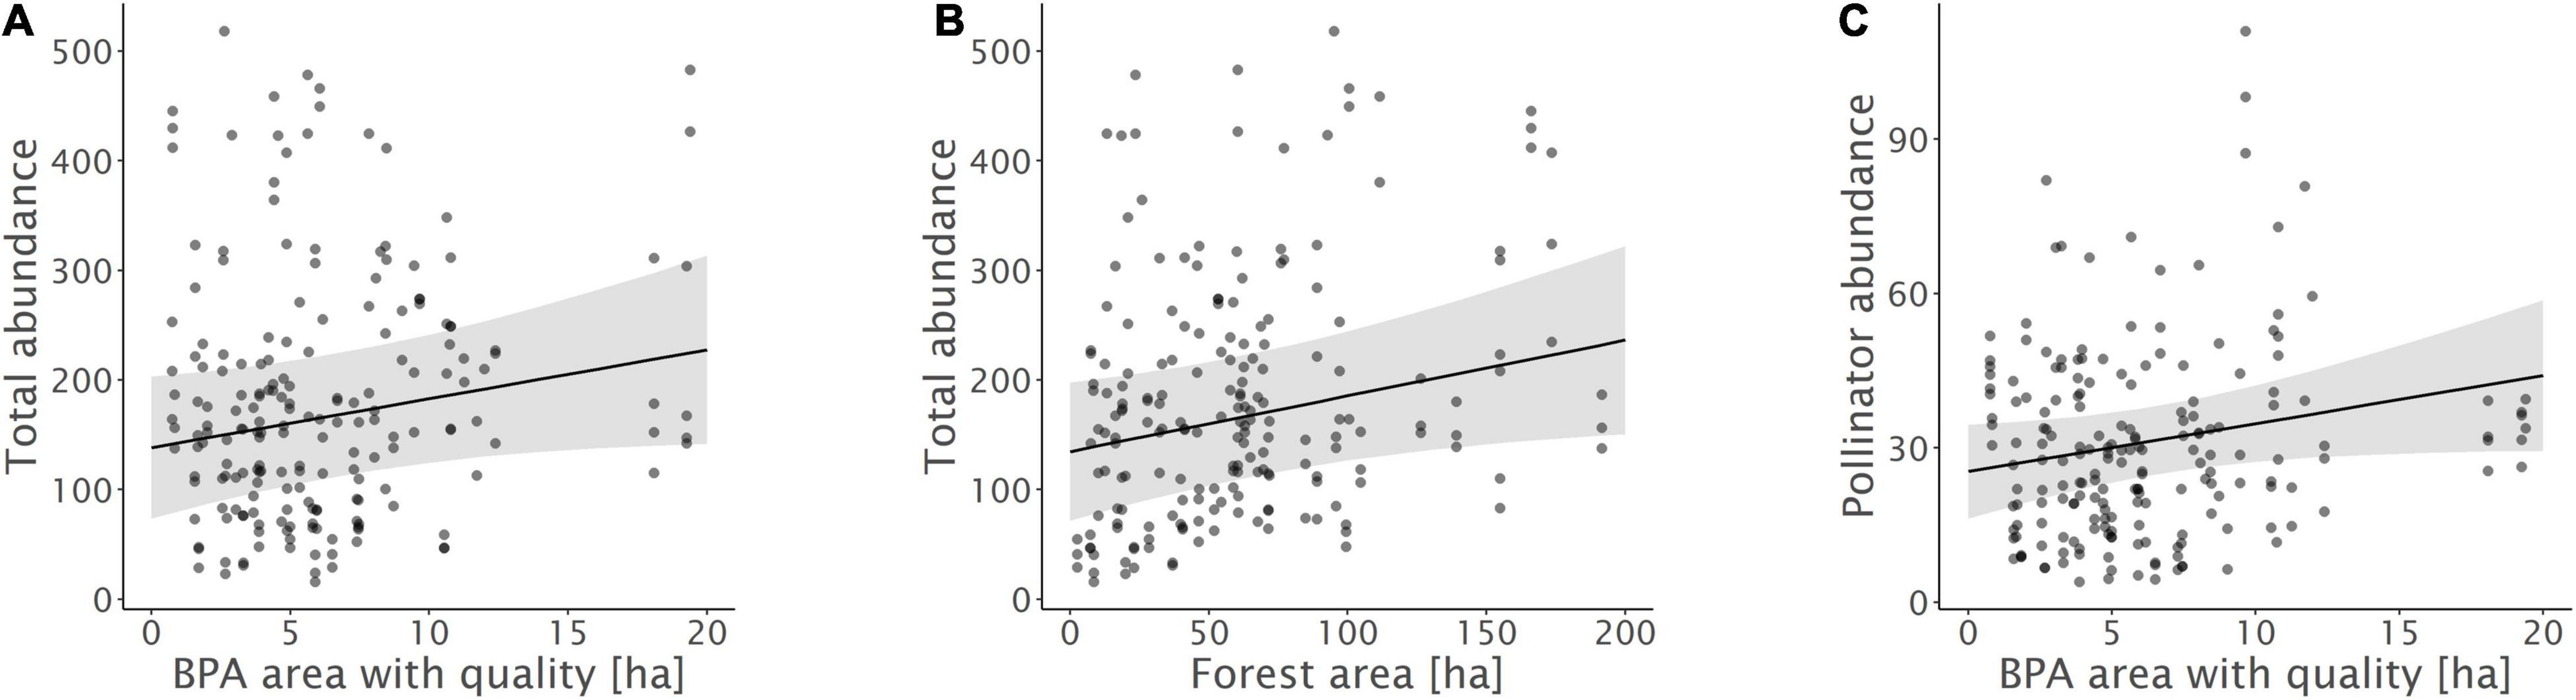
Figure 3. Relationships between (A) total insect abundance and biodiversity promotion areas (BPA) with ecological quality, (B) total insect abundance and forest, and (C) pollinator abundance and BPA with ecological quality. Model predictions with 95% confidence intervals and raw data points are shown.
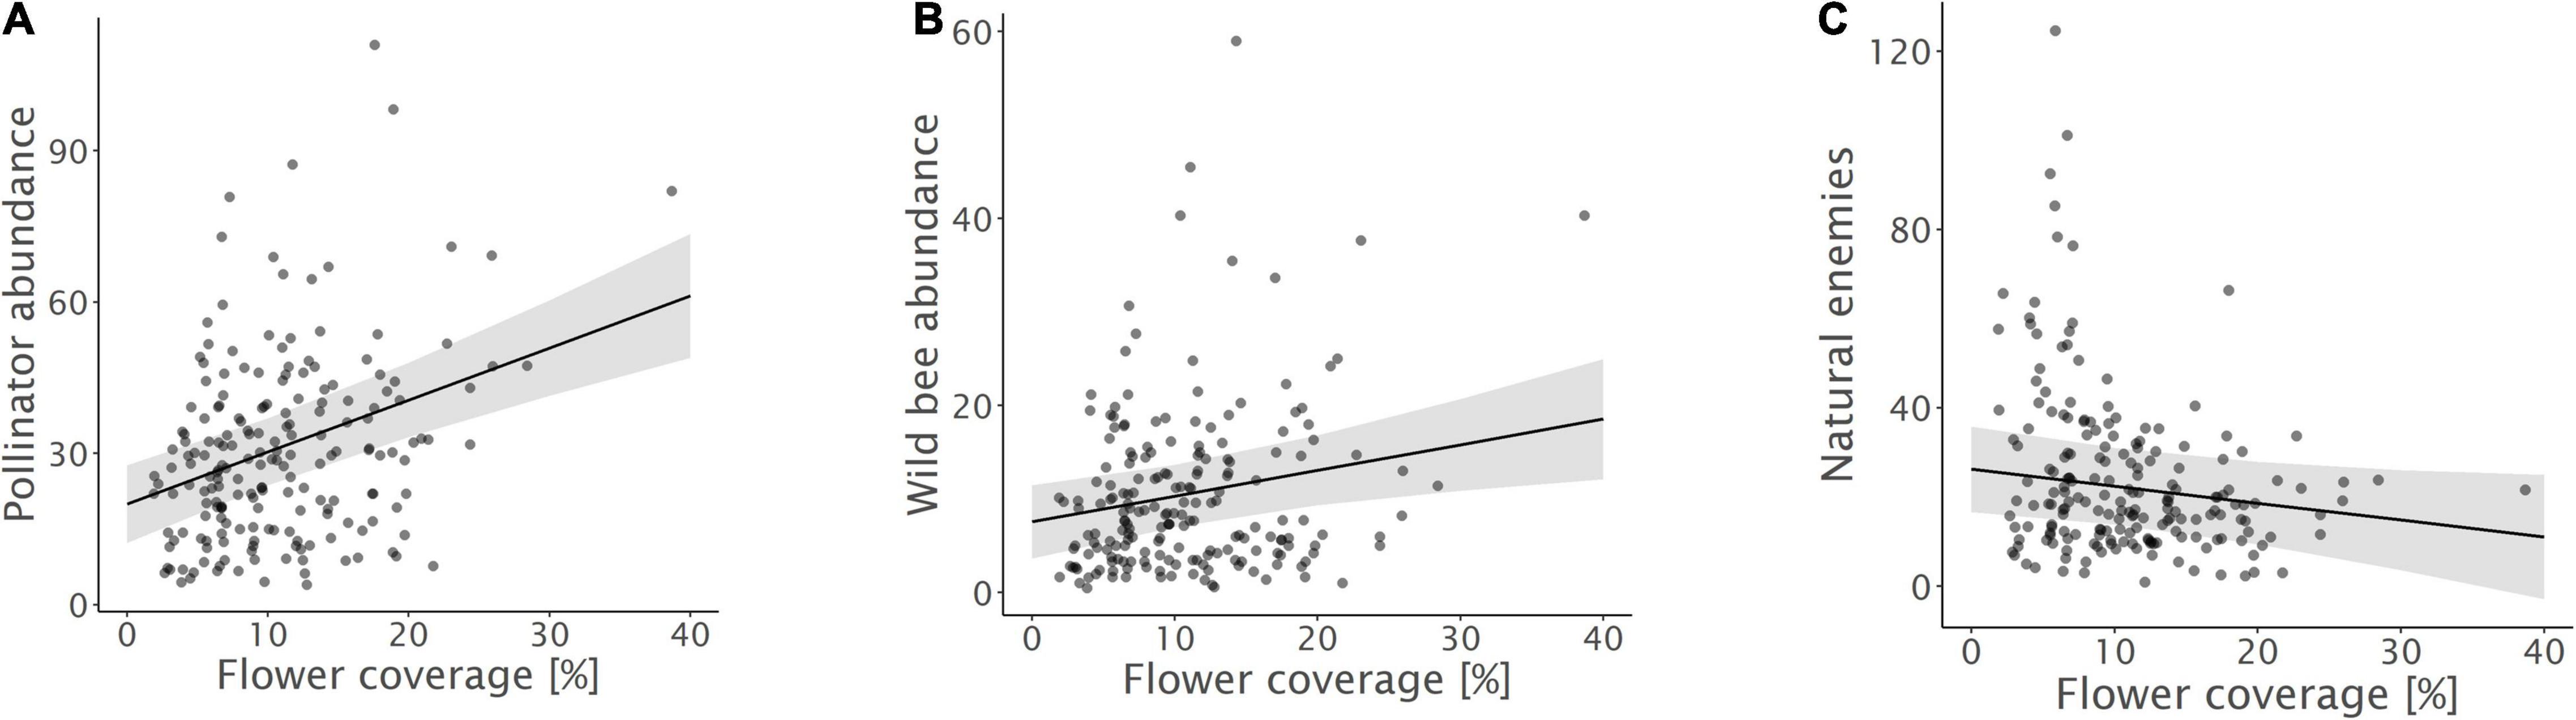
Figure 4. Relationships between (A) pollinator abundance, (B) wild bee abundance, and (C) natural enemy abundance and flower coverage. Model predictions with 95% confidence intervals and raw data points are shown.
Discussion
We found clear effects of landscape characteristics and flower strip traits on the abundance and diversity of different functional insect groups in annual flower strips. While all investigated groups and indices except natural enemies were negatively influenced by the area of BPA in the surrounding landscapes, BPA with elevated ecological quality had a positive effect on the abundance of total insects and pollinators in specific. In addition, forest area positively affected total insect abundance. Of the investigated flower strip traits, flower coverage was positively correlated with pollinator and wild bee abundance in flower strips.
Dilution Effects by Biodiversity Promotion Areas
The area of BPA in the surrounding landscape was negatively correlated with all biodiversity indicators, except for natural enemy abundance. This was unexpected, as we assumed that BPA in the landscape would increase insect abundance and diversity in flower strips. Previous research has mostly shown positive effects of semi-natural habitats on the abundance and diversity of ecosystem service providers at the landscape scale (Batáry et al., 2015; Holland et al., 2017; Zingg et al., 2019). Grassland habitats, especially extensively managed (low input) meadows which represented the most abundant BPA in our study, often harbor high pollinator species richness and abundances, as they provide mating, foraging and nesting sites (Pfiffner et al., 2018). In our case, however, a high proportion of BPA in the landscape apparently diluted insect abundance in flower strips. We suppose that in our case observed insect densities in flower strips more strongly reflect the distribution of individuals among alternative floral resources in the surrounding landscape than the total abundance in a given area (Haenke et al., 2009; Carvell et al., 2011). As indicated by the intermediate landscape-complexity hypothesis (Tscharntke et al., 2012), relative insect abundances in flower strips may be highest in landscapes with intermediate proportions of semi-natural farmland habitats and when moving from moderate to high landscape complexity, dilution effects may increasingly outperform facilitation. Indeed, most of our study landscapes would categorize as rather complex on an international scale, as they harbor on average 20% (±14) natural areas (i.e., forests) and an additional 5.4% (±1.9) semi-natural farmland habitats (i.e., BPA).
Irrespective of this result, it is the overall abundance of service providers in the landscape that determines the strength of provided ecosystem services. To support large and effective populations of service providers on the long-term, a network of diverse semi-natural habitats is indispensable (Sutter et al., 2018). Thus, landscape level greening, i.e., a high share of biodiversity promotion areas is crucial to maintain ecosystem services in the long term. Particularly annual flower strips are only temporary available habitats that can bypass resource scarcity but are plowed in autumn (Ramseier et al., 2016). Annual flower strips are therefore not sufficient to ensure a safe overwintering of arthropods and need complementing perennial habitats at spill-over distance (Ganser et al., 2019).
Facilitation Effect by Forest and Biodiversity Promotion Areas With High Ecological Quality
On the other hand, overall insect abundance in flower strips increased with the area of forest in the landscapes. Natural habitats are known to promote overall biodiversity and a share of at least 20% is often needed to maintain high species richness in agricultural landscapes (Tscharntke et al., 2012; Zingg et al., 2018). Nevertheless, none of the functional groups was correlated with forest area. This suggests that forests facilitate insect species and groups that are attracted by resources offered in flower strips but are not considered as pollinators or natural enemies of crop pests. Although, forest edges can potentially act as a source of pollinators, the effect may further depend up on microclimatic conditions (Bailey et al., 2014), the vegetation (Roberts et al., 2017), as well as the specific nesting behavior of a given species (Odanaka and Rehan, 2020). As highlighted by Ewers and Didham in their comprehensive review on habitat fragmentation and edge effects (2006), different invertebrate species are likely to vary strongly in their response to habitat edges and the composite of often contrasting responses may result in little to no effects on overall abundance and species richness observed.
In addition, also the share of BPA with ecological quality tend to promote overall insect and pollinator abundance. This stands in contrast to overall BPA area that had a negative effect but is more in line with our hypotheses. We assume, that the fulfilment of ecological quality requirements led to a pronounced improvement of landscape-scale habitat quality, capable to foster insect populations on the large scale and the long term. There are several reasons, why BPA with quality may represent an overall improvement of habitat quality for multiple insect groups: First, grassland BPA with high ecological quality harbor a higher botanical diversity, known to be a major driver of pollinator abundance and richness (Albrecht et al., 2007). Second, in grassland BPA with quality, the use of hay conditioners, knowing to tremendously reduce insect abundance is not allowed (Frick and Fluri, 2001). Third, in woody BPAs with high ecological quality (e.g., hedges) additional structural elements such as piles of branches or stones and nest boxes for wild bees are offered. BPA with high ecological quality have thus previously shown to enhance different components of biodiversity at the landscape level and may thus represent an important key to foster pollinators and insects overall (Meichtry-Stier et al., 2014; Zingg et al., 2019). BPA with lower ecological quality, on the other hand, may not be sufficient to provide sufficient key resources for many insect groups.
High Flower Coverage Promotes Pollinator Abundance
Both, pollinator, and wild bee abundance increased with flower coverage inside the flower strips. This corroborates our hypotheses and shows that not only landscape, but also the flower strip configuration and ecological quality is decisive. Flower strips thus need to contain high flower density to support high pollinator numbers (Krimmer et al., 2019). Yet, no effect on species richness or diversity was observed. Species-specific reactions to flower strip traits have often been documented (Wood et al., 2015) and many wild bee species show a distinct response depending on floral and nesting resources (Pfiffner et al., 2019). Apparently, the annual flower strips investigated here attracted mainly generalistic wild bees (98.7% of the observed wild bee individuals were polylecthic species) and, as a consequence, the wild bee communities observed were dominated by few, but abundant species (68% of all individuals belonged to only five species). Indeed, the flower strips investigated here were often dominated by few flowering plants such as Phacelia or Buckwheat that seem to be mainly attractive to these few generalists. In this regard, it is not very surprising that no effect of flower coverage on species richness or diversity was observed. However, also flowering plant species richness had no effect on wild bee richness and diversity. This can be explained by the fact that the presence of key plants is more important for wild bee diversity than flower coverage or plant species diversity per se (Sutter et al., 2018; Warzecha et al., 2018). Although our seed mixtures (Supplementary Table 1.1) contained some of the key plants mentioned by Sutter et al. (2018) and Warzecha et al. (2018), such as Phacelia tanacetifolia, Anthemis tinctoria, and Origanum vulgare, P. tanacetifolia was the only key plant that properly emerged. Including additional key plants and improving their emergence may therefore be important to support species diversity and enhance the stability and resilience of ecosystem services (Warzecha et al., 2018).
No Effect of Configurational Complexity
From the parameters related to configurational complexity, neither field size, nor crop diversity or edge length had a significant effect on insect abundance or diversity. This contrasts our expectations based on the findings that pollinators and natural enemies and their services increase with configurational landscape complexity (Krimmer et al., 2019; Martin et al., 2019; Albrecht et al., 2020). A diverse cropping matrix with small fields can provide a temporal continuity of food, nesting sites and shelter and promote biodiversity, including pollinators and natural enemies (Bianchi et al., 2006; Hass et al., 2018; Sirami et al., 2019). A lack of effect of configurational complexity measures can be explained in three ways: First, all of our flower strips were established in rather heterogeneous agricultural landscapes with comparably small fields (mean ± SD: 1.0 ha ± 0.2), high crop diversity (mean ± SD: 15 ± 1.4 crop types according to Supplementary Table 2.1) and many patches of non-crop areas. Hereby the contrast, or gradient, for configurational complexity may have been insufficient to detect any ecologically relevant effect and corroborates earlier results from the Swiss lowland (Zingg et al., 2018). Second, field margins in the study area are often small to non-existent or of low ecological quality, as they are impacted by agrochemical drift from mostly intensively managed fields. As a result, the small field size in the Swiss lowlands does not necessarily correlate with more habitat for insects, and unproductive structural complexity in marginal areas may be low compared to nearby regions in neighboring countries (Tschumi et al., 2020). Finally, as highlighted above, the variable and often diverging responses of individual species to habitat edges and the complex effects of habitat edges on species interactions may simply have blurred an ecological signal in our functional groups (Ewers and Didham, 2006).
No Effect on Natural Enemy Abundance
Remarkably and in contrast to our expectations, none of the selected landscape characteristics and flower strip traits had a significant effect on natural enemy abundance (with the exception of a negative trend of flower coverage). A recent meta-analysis corroborates these findings by showing that flower strip traits and landscape context had little effect on biological control (Albrecht et al., 2020). One explanation might be that seed mixtures designed to promote pollination are not optimal for the promotion of other ecosystem services such as pest control (Windsor et al., 2021). Although in our study various seed mixtures were used, at least some of them where specifically designed to attract pollinators. Hereby, and in contrast to pollinators, natural enemies strongly depend on the distribution of their prey or hosts and cannot reproduce with floral resources alone. Another explanation for the lack of effects might be that the group of natural enemies consists of several groups with highly specialized and diverging life-histories. The communities of natural enemies in our study were mainly dominated by the abundance of hoverflies and parasitic wasps (see Supplementary Material 3). While hoverflies are rather generalist predators, parasitic wasps are highly specialized on few or single host species. Although the occurrence of both groups is driven by the availability of resources for larvae and adults (Moquet et al., 2018), they often have very differing requirements. Lumping various natural enemy groups together might have resulted in too much variance in their responses to landscape characteristics and flower strip traits to detect any biological signal.
Conclusion
Our results provide evidence that both flower strip traits and landscape characteristics are important for the abundance of insects overall and different functional groups in annual flower strips. This was particularly true for pollinators and wild bees in specific. The negative effect of BPA area with standard quality but positive effect of BPA area with high ecological quality, suggests that to support viable populations of insects, ecological quality (high botanical and/or structural diversity) of semi-natural habitats is decisive. This is similarly true for the flower strips themselves that need high flower coverage to be attractive. To enhance overall insect abundance and pollinators in specific, annual flower strips therefore need to be complemented by BPA of high quality and designed to yield high flower coverage. However, to enhance biodiversity of wild bees and likely many other taxonomic groups, flower strips may need to be left in place for multiple years, with high diversity perennial seed-mixtures that also contain key plants for specialized insect species. This study provides new insights into how landscape context and flower strip traits in combination influence insect communities and ecosystem service providers. Taking these findings into account can help improving the effectiveness of flower strips in promoting biodiversity and the delivery of associated regulatory ecosystem services such as pollination or natural pest control.
Data Availability Statement
The original contributions presented in the study are included in the article/Supplementary Material, further inquiries can be directed to the corresponding author.
Author Contributions
SZ conceived and designed the study, helped with the statistical analysis, and had the lead in writing the manuscript. KS wrote the first draft of the manuscript, conducted the statistical analyses, and created the figures. MT helped with the statistical analyses, contributed to the writing, and provided critical feedback on the manuscript. HR and SL planned and conducted the data collection on the field and provided feedback on the manuscript. All authors approved the submitted version.
Conflict of Interest
The authors declare that the research was conducted in the absence of any commercial or financial relationships that could be construed as a potential conflict of interest.
Publisher’s Note
All claims expressed in this article are solely those of the authors and do not necessarily represent those of their affiliated organizations, or those of the publisher, the editors and the reviewers. Any product that may be evaluated in this article, or claim that may be made by its manufacturer, is not guaranteed or endorsed by the publisher.
Acknowledgments
We thank the cantonal offices of agriculture of Bern, Freiburg, and Solothurn for providing data on land use, and the Federal Office for Agriculture and the foundation Sur-La-Croix for their financial support. Further thank goes to Dominik Füglistaller, Christina Lädrach, Christian Ramseier, Michael Rauch, and Franziska Widmer Etter for their help with data collection. We also thank Andreas Müller for the identification of wild bee species. Special thanks go to all the farmers sowing and managing flower strips for this study and providing access to their fields.
Supplementary Material
The Supplementary Material for this article can be found online at: https://www.frontiersin.org/articles/10.3389/fevo.2022.854058/full#supplementary-material
References
Albrecht, M., Duelli, P., Müller, C., Kleijn, D., and Schmid, B. (2007). The Swiss agri-environment scheme enhances pollinator diversity and plant reproductive success in nearby intensively managed farmland. J. Appl. Ecol. 44, 813–822. doi: 10.1111/j.1365-2664.2007.01306.x
Albrecht, M., Kleijn, D., Williams, N. M., Tschumi, M., Blaauw, B. R., Bommarco, R., et al. (2020). The effectiveness of flower strips and hedgerows on pest control, pollination services and crop yield: a quantitative synthesis. Ecol. Lett. 2020, 1488–1498. doi: 10.1111/ele.13576
Aviron, S., Herzog, F., Klaus, I., Schüpbach, B., and Jeanneret, P. (2011). Effects of Wildflower Strip Quality, Quantity, and Connectivity on Butterfly Diversity in a Swiss Arable Landscape. Restor. Ecol. 19, 500–508. doi: 10.1111/j.1526-100X.2010.00649.x
Bailey, S., Requier, F., Nusillard, B., Roberts, S. P. M., Potts, S. G., and Bouget, C. (2014). Distance from forest edge affects bee pollinators in oilseed rape fields. Ecol. Evol. 4, 370–380. doi: 10.1002/ece3.924
Batáry, P., Dicks, L. V., Kleijn, D., and Sutherland, W. J. (2015). The role of agri-environment schemes in conservation and environmental management. Conserv. Biol. 29, 1006–1016. doi: 10.1111/cobi.12536
Bates, D., Mächler, M., Bolker, B., and Walker, S. (2015). Fitting Linear Mixed-Effects Models Using lme4. Available online at: https://cran.r-project.org/web/packages/lme4/vignettes/lmer.pdf (accessed November 24, 2021).
Bianchi, F. J. J. A., Booij, C. J. H., and Tscharntke, T. (2006). Sustainable pest regulation in agricultural landscapes: a review on landscape composition, biodiversity and natural pest control. Proc. R. Soc. B. 273, 1715–1727. doi: 10.1098/rspb.2006.3530
Bundesamt für Landestopografie Swisstopo (2021). SWISSIMAGE 25. Available online at: https://www.swisstopo.admin.ch/de/geodata/images/ortho/swissimage25.html (accessed November 26, 2021).
Carvell, C., Osborne, J. L., Bourke, A. F. G., Freeman, S. N., Pywell, R. F., and Heard, M. S. (2011). Bumble bee species’ responses to a targeted conservation measure depend on landscape context and habitat quality. Ecol. Appl. 21, 1760–1771. doi: 10.1890/10-0677.1
Desaegher, J., Sheeren, D., and Ouin, A. (2021). Optimising spatial distribution of mass-flowering patches at the landscape scale to increase crop pollination. J. Appl. Ecol. 2021:13949. doi: 10.1111/1365-2664.13949
Ekroos, J., Olsson, O., Rundlöf, M., Watzold, F., and Smith, H. G. (2014). Optimizing agri-environment schemes for biodiversity, ecosystem services or both? Biol. Conserv. 172, 65–71. doi: 10.1016/j.biocon.2014.02.013
Ewers, R. M., and Didham, R. K. (2006). Confounding factors in the detection of species responses to habitat fragmentation. Biol. Rev. 81, 117–142. doi: 10.1017/S1464793105006949
Fabian, Y., Sandau, N., Bruggisser, O. T., Aebi, A., Kehrli, P., Rohr, R. P., et al. (2013). The importance of landscape and spatial structure for hymenopteran-based food webs in an agro-ecosystem. J. Anim. Ecol. 82, 1203–1214. doi: 10.1111/1365-2656.12103
Frick, R., and Fluri, P. (2001). Bienenverlust beim Mähen mit Rotationsmähwerken. Agrarforschung 8, 196–201.
Ganser, D., Knop, E., and Albrecht, M. (2019). Sown wildflower strips as overwintering habitat for arthropods: Effective measure or ecological trap? Agric. Ecosyst. Environ. 275, 123–131. doi: 10.1016/j.agee.2019.02.010
Haaland, C., Naisbit, R. E., and Bersier, L.-F. (2011). Sown wildflower strips for insect conservation: a review. Insect Conserv. Divers. 4, 60–80. doi: 10.1111/j.1752-4598.2010.00098.x
Haenke, S., Scheid, B., Schaefer, M., Tscharntke, T., and Thies, C. (2009). Increasing syrphid fly diversity and density in sown flower strips within simple vs. complex landscapes. J. Appl. Ecol. 46, 1106–1114. doi: 10.1111/j.1365-2664.2009.01685.x
Hartig, F., and Lohse, L. (2021). Residual Diagnostics for Hierarchical (Multi-Level/Mixed) Regression Models [R package DHARMa version 0.4.3]. Vienna: R Core Team.
Hass, A. L., Kormann, U. G., Tscharntke, T., Clough, Y., Baillod, A. B., Sirami, C., et al. (2018). Landscape configurational heterogeneity by small-scale agriculture, not crop diversity, maintains pollinators and plant reproduction in western Europe. Proc. R. Soc. B 285:2242. doi: 10.1098/rspb.2017.2242
Herzog, F., Jacot, K., Tschumi, M., and Walter, T. (2017). “The role of pest management in driving agri-environment schemes in Switzerland,” in Environmental Pest Management: Challenges for Agronomists, Ecologists, Economists and Policymakers, eds M. Coll and E. Wajnberg (Hoboken, NY: Wiley), 385403.
Holland, J. M., Douma, J. C., Crowley, L., James, L., Kor, L., Stevenson, D. R., et al. (2017). Semi-natural habitats support biological control, pollination and soil conservation in Europe. A review. Agron. Sustain. Dev. 37, 1–23. doi: 10.1007/s13593-017-0434-x
Jönsson, A. M., Ekroos, J., Dänhardt, J., Andersson, G. K., Olsson, O., and Smith, H. G. (2015). Sown flower strips in southern Sweden increase abundances of wild bees and hoverflies in the wider landscape. Biol. Conserv. 184, 51–58. doi: 10.1016/j.biocon.2014.12.027
Kleijn, D., Rundlöf, M., Scheper, J., Smith, H. G., and Tscharntke, T. (2011). Does conservation on farmland contribute to halting the biodiversity decline? Trends Ecol. Evol. 26:474481. doi: 10.1016/j.tree.2011.05.009
Krimmer, E., Martin, E. A., Krauss, J., Holzschuh, A., and Steffan-Dewenter, I. (2019). Size, age and surrounding semi-natural habitats modulate the effectiveness of flower-rich agri-environment schemes to promote pollinator visitation in crop fields. Agric. Ecosyst. Environ. 284:106590. doi: 10.1016/j.agee.2019.106590
Kuznetsova, A., Brockhoff, P. B., Christensen, R. H. B., and Jensen, S. P. (2020). Tests in Linear Mixed Effects Models [R package lmerTest version 3.1-3]. Vienna: R Core Team.
Lüdecke, D., Bartel, A., Schwemmer, C., Powell, C., Djalovski, A., and Titz, J. (2021). Data Visualization for Statistics in Social Science [R package sjPlot version 2.8.9]. Vienna: R Core Team.
Martin, E. A., Dainese, M., Clough, Y., Báldi, A., Bommarco, R., Gagic, V., et al. (2019). The interplay of landscape composition and configuration: new pathways to manage functional biodiversity and agroecosystem services across Europe. Ecol. Lett. 22, 1083–1094. doi: 10.1111/ele.13265
Meichtry-Stier, K. S., Jenny, M., Zellweger-Fischer, J., and Birrer, S. (2014). Impact of landscape improvement by agri-environment scheme options on densities of characteristic farmland bird species and brown hare (Lepus europaeus). Agric. Ecosyst. Environ. 189, 101–109. doi: 10.1016/j.agee.2014.02.038
Moquet, L., Laurent, E., Bacchetta, R., and Jacquemart, A.-L. (2018). Conservation of hoverflies (Diptera, Syrphidae) requires complementary resources at the landscape and local scales. Insect Conserv. Divers. 11, 72–87. doi: 10.1111/icad.12245
Nichols, R. N., Goulson, D., and Holland, J. M. (2019). The best wildflowers for wild bees. J. Insect Conserv. 23, 819–830. doi: 10.1007/s10841-019-00180-8
Odanaka, K. A., and Rehan, S. M. (2020). Wild bee distribution near forested landscapes is dependent on successional state. For. Ecosyst. 7, 1–13. doi: 10.1186/s40663-020-00241-4
Oksanen, J., Guillaume, B., Friendly, M., Kindt, R., Legendre, P., McGlinn, D., et al. (2021). vegan: Community Ecology Package. : Vienna: R Core Team.
Pebesma, E., Bivand, R., Rowlingson, B., Virgilio, G.-R., Hijmans, R., Sumner, M., et al. (2021). Classes and Methods for Spatial Data [R package sp version 1.4-5]. Vienna: R Core Team.
Pfiffner, L., Cahenzli, F., Steinemann, B., Jamar, L., Bjørn, M. C., Porcel, M., et al. (2019). Design, implementation and management of perennial flower strips to promote functional agrobiodiversity in organic apple orchards: A pan-European study. Agric. Ecosyst. Environ. 278, 61–71. doi: 10.1016/j.agee.2019.03.005
Pfiffner, L., Ostermaier, M., Stoeckli, S., and Müller, A. (2018). Wild bees respond complementarily to ‘high-quality’ perennial and annual habitats of organic farms in a complex landscape. J. Insect Conserv. 22, 551–562. doi: 10.1007/s10841-018-0084-6
Ramseier, H., Füglistaller, D., Lädrach, C., Ramseier, C., Rauch, M., and Widmer Etter, F. (2016). Flower strips encourage honey bees and wild bees. Agrarforsch. Schweiz. 7, 276–283.
Roberts, H. P., King, D. I., and Milam, J. (2017). Factors affecting bee communities in forest openings and adjacent mature forest. For. Ecol. Manag. 394, 111–122. doi: 10.1016/j.foreco.2017.03.027
Robinson, R. A., and Sutherland, W. J. (2002). Post-war changes in arable farming and biodiversity in Great Britain. J. Appl. Ecol. 39, 157–176. doi: 10.1046/j.1365-2664.2002.00695.x
R Core Team (2021). R: A Language and Environment for Statistical Computing. Vienna: R Foundation for Statistical Computing.
Rundlöf, M., Lundin, O., and Bommarco, R. (2018). Annual flower strips support pollinators and potentially enhance red clover seed yield. Ecol. Evol. 8, 7974–7985. doi: 10.1002/ece3.4330
Scheper, J., Bommarco, R., Holzschuh, A., Potts, S. G., Riedinger, V., Roberts, S. P. M., et al. (2015). Local and landscape-level floral resources explain effects of wildflower strips on wild bees across four European countries. J. App. Ecol. 52, 1165–1175. doi: 10.1111/1365-2664.12479
Scheper, J., Holzschuh, A., Kuussaari, M., Potts, S. G., Rundlöf, M., Smith, H. G., et al. (2013). Environmental factors driving the effectiveness of European agri-environmental measures in mitigating pollinator loss - a meta-analysis. Ecol. Lett. 16, 912–920. doi: 10.1111/ele.12128
Sirami, C., Gross, N., Baillod, A. B., Bertrand, C., Carrié, R., Hass, A., et al. (2019). Increasing crop heterogeneity enhances multitrophic diversity across agricultural regions. PNAS 116, 16442–16447. doi: 10.1073/pnas.1906419116
Stoate, C., Boatman, N. D., Borralho, R. J., Carvalho, C. R., Snoo, G. R., de, et al. (2001). Ecological impacts of arable intensification in Europe. J. Environ. Manage. 63, 337–365. doi: 10.1006/jema.2001.0473
Sutter, L., Albrecht, M., and Jeanneret, P. (2018). Landscape greening and local creation of wildflower strips and hedgerows promote multiple ecosystem services. J. Appl. Ecol. 55, 612–620. doi: 10.1111/1365-2664.12977
Tscharntke, T., Tylianakis, J. M., Rand, T. A., Didham, R. K., Fahrig, L., Batáry, P., et al. (2012). Landscape moderation of biodiversity patterns and processes - eight hypotheses. Biol. Rev. Biol. Proc. Camb. Philos. Soc. 87, 661–685. doi: 10.1111/j.1469-185X.2011.00216.x
Tschumi, M., Albrecht, M., Collatz, J., Dubsky, V., Entling, M. H., Najar-Rodriguez, A. J., et al. (2016). Tailored flower strips promote natural enemy biodiversity and pest control in potato crops. J. Appl. Ecol. 53, 1169–1176. doi: 10.1111/1365-2664.12653
Tschumi, M., Albrecht, M., Entling, M. H., and Jacot, K. (2015). High effectiveness of tailored flower strips in reducing pests and crop plant damage. Proc. Biol. Sci. 282:1369. doi: 10.1098/rspb.2015.1369
Tschumi, M., Scherler, P., Fattebert, J., Naef-Daenzer, B., and Grüebler, M. U. (2020). Political borders impact associations between habitat suitability predictions and resource availability. Landsc. Ecol. 35, 2287–2300. doi: 10.1007/s10980-020-01103-8
Warzecha, D., Diekötter, T., Wolters, V., and Jauker, F. (2018). Attractiveness of wildflower mixtures for wild bees and hoverflies depends on some key plant species. Insect Conserv. Divers. 11, 32–41. doi: 10.1111/icad.12264
Windsor, F. M., Tavella, J., Rother, D. C., Raimundo, R. L. G., Devoto, M., Guimarães, P. R., et al. (2021). Identifying plant mixes for multiple ecosystem service provision in agricultural systems using ecological networks. J. App. Ecol. 58, 2770–2782. doi: 10.1111/1365-2664.14007
Wix, N., Reich, M., and Schaarschmidt, F. (2019). Butterfly richness and abundance in flower strips and field margins: the role of local habitat quality and landscape context. Heliyon 5:e01636. doi: 10.1016/j.heliyon.2019.e01636
Wood, T. J., Holland, J. M., and Goulson, D. (2015). Pollinator-friendly management does not increase the diversity of farmland bees and wasps. Biol. Conserv. 187, 120–126. doi: 10.1016/j.biocon.2015.04.022
Zingg, S., Grenz, J., and Humbert, J.-Y. (2018). Landscape-scale effects of land use intensity on birds and butterflies. Agric. Ecosys. Environ. 267, 119–128. doi: 10.1016/j.agee.2018.08.014
Keywords: agri-environment scheme (AES), biodiversity promotion area, agroecology, ecosystem service, natural enemies, functional biodiversity, habitat quality, landscape composition
Citation: Schoch K, Tschumi M, Lutter S, Ramseier H and Zingg S (2022) Competition and Facilitation Effects of Semi-Natural Habitats Drive Total Insect and Pollinator Abundance in Flower Strips. Front. Ecol. Evol. 10:854058. doi: 10.3389/fevo.2022.854058
Received: 13 January 2022; Accepted: 11 February 2022;
Published: 07 March 2022.
Edited by:
James Moran, Galway-Mayo Institute of Technology, IrelandReviewed by:
Zoltan Elek, Hungarian Academy of Sciences (MTA), HungaryMarco Ferrante, University of the Azores, Portugal
Copyright © 2022 Schoch, Tschumi, Lutter, Ramseier and Zingg. This is an open-access article distributed under the terms of the Creative Commons Attribution License (CC BY). The use, distribution or reproduction in other forums is permitted, provided the original author(s) and the copyright owner(s) are credited and that the original publication in this journal is cited, in accordance with accepted academic practice. No use, distribution or reproduction is permitted which does not comply with these terms.
*Correspondence: Silvia Zingg, c2lsdmlhLnppbmdnQGJmaC5jaA==