 Bing He
 Dian Huang
 Bo Kong
 Kang Liu
 Chan Zhou
 Liqun Sun
 Li Ning1
- 1Shenzhen Institute of Advanced Technology, Chinese Academy of Sciences, Shenzhen, China
- 2National Supercomputing Center in Shenzhen, Shenzhen, China
- 3Institute of Mountain Hazards and Environment, Chinese Academy of Sciences, Chengdu, China
Vegetation is essential for maintaining urban ecosystems, climate regulation, and resident health. To explore the variations in city-level vegetation greening (VG) and its relationship to urban expansion, VG in 439 Chinese cities was extracted using the Theil–Sen and Mann–Kendall algorithms based on Moderate Resolution Imaging Spectroradiometer EVI (enhanced vegetation index) data from 2001 to 2020. The spatial variations in VG and its patterns, as well as its relationship with urban expansion, were then analyzed. The following results were obtained: (1) cities with larger greening areas were primarily located in the central and eastern provinces of China, followed by the southeastern, southwestern, and western provinces. The 48 cities with the largest greening areas accounted for 60.47% of the total greening area. (2) VG patches in northern China exhibited better integrity. (3) The centralization trend of VG was evident; the location of VG patterns was influenced by the form of urban expansion. (4) The intensity of artificial impervious area expansion had a weak negative correlation with the VG. Therefore, we must enhance vegetation in new urban areas to improve the spatial balance of VG. The present results of this study can provide a foundation for developing effective policies for the construction and management of urban greenery projects.
Introduction
Urbanization continues worldwide, particularly in cities with growing economies. As a result of urbanization, urban ecosystems face enormous pressure. Vegetation plays an important role in improving urban air quality, mitigating and adapting to climate change while increasing disaster resilience; it is an important foundation for achieving Sustainable Development Goals 11 (SDGs 11) adopted by the United Nations (UN) in 2015 (United Nations [UN], 2016). However, urbanization-induced artificial impervious area (AIA) expansion and increasing landscape fragmentation affect the spatial patterns and ecological functions of urban vegetation. In response to future urban development, a timely and accurate description of the urban vegetation status and its spatial variation is the foundation for understanding the supply of ecosystem services and urban sustainability (Gan et al., 2014).
Remote sensing satellite vegetation indices, such as the normalized difference vegetation index (NDVI) and enhanced vegetation index (EVI), are commonly used as proxies for vegetation greenness (Yao et al., 2019), where high vegetation indices represent high vegetation greenness (Huete et al., 2002) to reflect characteristics such as vegetation growth, vegetation productivity, and green biomass (Jeong et al., 2017). Vegetation greening (VG) is defined as a statistically significant increase in the annual or seasonal greenness of vegetation at a given location (Piao et al., 2019). Previous studies based on satellite data have revealed trends in the greening of Earth’s vegetation (Zhu et al., 2016; Hua et al., 2017; Chen et al., 2019; Lamchin et al., 2020; Liu et al., 2021). Urbanization, a complex process involving spatial and temporal changes in different cities (Torrens, 2011), may enhance or inhibit VG depending on the location of a city and its background climate (Imhoff et al., 2004). Zhao et al. (2016) concluded that the enhancement of vegetation greenness is prevalent in 32 major Chinese cities. Zhong et al. (2019) suggested that the indirect effects of urbanization have led to an increase in the EVI, compensating for 24.6% of all vegetation loss. Based on the limited number of current studies, the city-level spatial variations in VG and eco-geographic regional differences in China should be the focus of further research.
Studies have found that population growth and urbanization contribute to changes in urban vegetation (Tan et al., 2013). Urban expansion is typically responsible for the degradation of existing vegetation in urban centers and fringe areas (Abutaleb et al., 2020). To balance urban ecosystems and social welfare, many urbanized areas have increased the number of greenery projects and improved greenery management (Tan et al., 2013). In Chinese cities, the public green space per capita (m2), green coverage rate of built districts (%), and green space rate of built district (%) areas increased by 167.75, 39.53, and 45.83%, respectively, from 2002 to 2019 (Ministry of Housing and Urban-Rural Development of the People, 2020). However, owing to the differences in urbanization rates and variations in the levels of greenery project construction and management (Zhou and Wang, 2011; Qian et al., 2015), urban vegetation is typically highly fragmented and heterogeneous, characterized by a large number of fragmented patches (Qian et al., 2015). These fragmentation characteristics have a significant impact on the livelihoods of urban residents and the maintenance of biodiversity. Satellite remote sensing provides reliable data and methods for quantifying and tracking VG during urbanization. Landscape metrics can characterize VG fragmentation because they allow for the quantification of the spatial structural characteristics of VG. After nearly 20 years of rapid urbanization, the VG fragmentation characteristics in China remain poorly understood. Therefore, combining remote sensing and landscape metrics can provide valuable information on the intercity fragmentation characteristics of VG.
Although they used various vegetation remote sensing data and terms with similar definitions as VG, previous studies have reported differences in VG in different regions of a city. Zhong et al. (2019) showed that, from 2000 to 2016, the EVI decreased by 38.0% in the peri-urban and rural areas of Shanghai, while an increasing trend was observed in the central urban area. Chang et al. (2020) found that the primary productivity of vegetation in the Tianjin–Beijing–Hebei urban agglomeration increased between 1998 and 2018 in built-up urban areas, with improvements in the vegetation conditions. Yao et al. (2019) revealed that increased spatial heterogeneity in VG implies increased differences in vegetation greenness between urban cores and rural areas; that is, urban core greening occurs more slowly than that in rural areas. Three main drivers also affect vegetation growth: climatic factors, human activities, and natural disturbances (Lamchin et al., 2020). However, the strength of the association between vegetation and temperature has decreased in China over the last 34 years, while there has been a weakened control over the NDVI from temperature and water conditions (Wang et al., 2021). In contrast, human activities have greatly contributed to the changes in global vegetation than climate change (Zhu et al., 2016; Zhang et al., 2017; Zhang and Huang, 2019; Liu et al., 2021). In cities, an increase in the AIA is a direct result of human activity, which is one of the key factors affecting vegetation growth (Ge et al., 2021), such as, the reduction in vegetation in the Pearl River Delta, China (Zhao et al., 2012). However, further investigation is required to determine whether there are specific patterns of VG in different regions of the city, as well as the relationship between the changes in the AIA from urbanization and VG.
This study aims to investigate the following: (1) city-level spatial variations in VG and eco-geographic regional differences in China; (2) spatial differences in the fragmentation characteristics of VG; and (3) VG patterns and the relationship between the AIA and VG. The remainder of this paper is organized as follows. Sections “Data and Methods” and “Results” describe the data and methods, and experimental results, respectively. Moderate Resolution Imaging Spectroradiometer (MODIS) EVI data from 2001 to 2020 were collected. The Mann–Kendall monotonic trend test (a trend detection method recommended by the World Meteorological Organization (WMO) (Wu et al., 2008; Shadmani et al., 2012; Zhu et al., 2016)) was used to calculate the VG of 439 Chinese cities, and the city-level spatial variations in VG were analyzed. Landscape metrics were then used to characterize the spatial fragmentation of patches composed of VG pixels. Next, we analyzed the hotspot areas in the VG pixels using the kernel density method, thereby providing a summary of the VG patterns in the 439 cities. Finally, the relationship between changes in the AIA and VG was analyzed. Section “Discussion” presents a discussion of our results and interpretations. Section “Conclusion” concludes the study with a summary of the key findings. This study provides two major contributions to the literature. First, unlike previous studies on the greening characteristics of natural environments and limited research on urban VG, this study provides a detailed discussion on VG and its patterns in 439 Chinese cities. Second, we investigated the relationship between VG and the AIA.
Data and Methods
Study Area and Data
In this study, four types of data from the 439 cities were used: (1) MODIS EVI; (2) urban boundary and AIAs; (3) eco-geographic regionalization data. Global Inventory Modeling and Mapping Studies (GIMMS) NDVI, Landsat NDVI, SPOT-Vegetation, and MODIS NDVI/EVI are vegetation remote sensing data frequently used in current vegetation change-related studies. Compared with these data, MODIS EVI has improved standards in terms of the observation time continuity, spatial resolution, and confidence in the data quality. Moreover, compared with the NDVI and soil adjustment vegetation index (SAVI), the EVI can minimize the effect of background reflectance variations. Kumari et al. (2021) found that the EVI has better correlations with different hydroclimatic factors. Therefore, the EVI is more suitable for monitoring vegetation dynamics in sparsely vegetated areas, such as in urban settings (Huete et al., 2002; Yao et al., 2019). In this study, Terra MODIS EVI data were used to indicate the greenness of the vegetation and to describe the VG fragmentation in cities. We obtained MODIS MOD13Q1 (version 6) data from the United States Geological Survey website (MODIS, 2021) from January 2001 to December 2020. MOD13Q1 data, a Level 3 product, were generated every 16 days at a spatial resolution of 250 m and is a Level 3 product; there were 8,740 EVI images in the study area.
Previous studies have used definitions such as peri-urban and rural areas, urban cores and rural areas to distinguish between different parts of a city. Most of the major cities in China were studied in this article, and it was difficult to precisely define the core and non-core parts for each city. Therefore, we downloaded the global urban boundaries (GUB) dataset (Urban Boundaries Datasets, 2020) from 1990 to 2018, as well as the global artificial impervious area (GAIA) data used for generating GUB. The earlier the year of the urban boundary and AIA, the more it is located in the center of the city. The GUB dataset provides an acceptable delineation of urban boundaries and can be used to examine the impact of urbanization on climate change and urban health (Li et al., 2020). The GUB has two uses: (a) to provide an urban boundary reference for VG and its associated index calculations; and (b) to assist in summarizing VG patterns (i.e., the patterns of dense clusters of VG pixels with respect to the urban boundary). GAIA also has two uses: (c) to determine the AIA generation year at VG pixel locations; and (d) to analyze the relationship changes in the AIA and VG. GUB and GAIA in (a) and (d) use data for 2 years, 2001 and 2018, (b) and (c) are only the statistical relationships for the VG pixel locations between GUB and GAIA; serial data from 1990 to 2018 were used. Owing to a lack of data for GUB and GAIA in 2019 and 2020, we assumed that GAIA and GUB were characterized by fewer changes after 2018. After excluding cities with boundary changes due to administrative adjustments, we selected 439 Chinese cities (Figure 1).
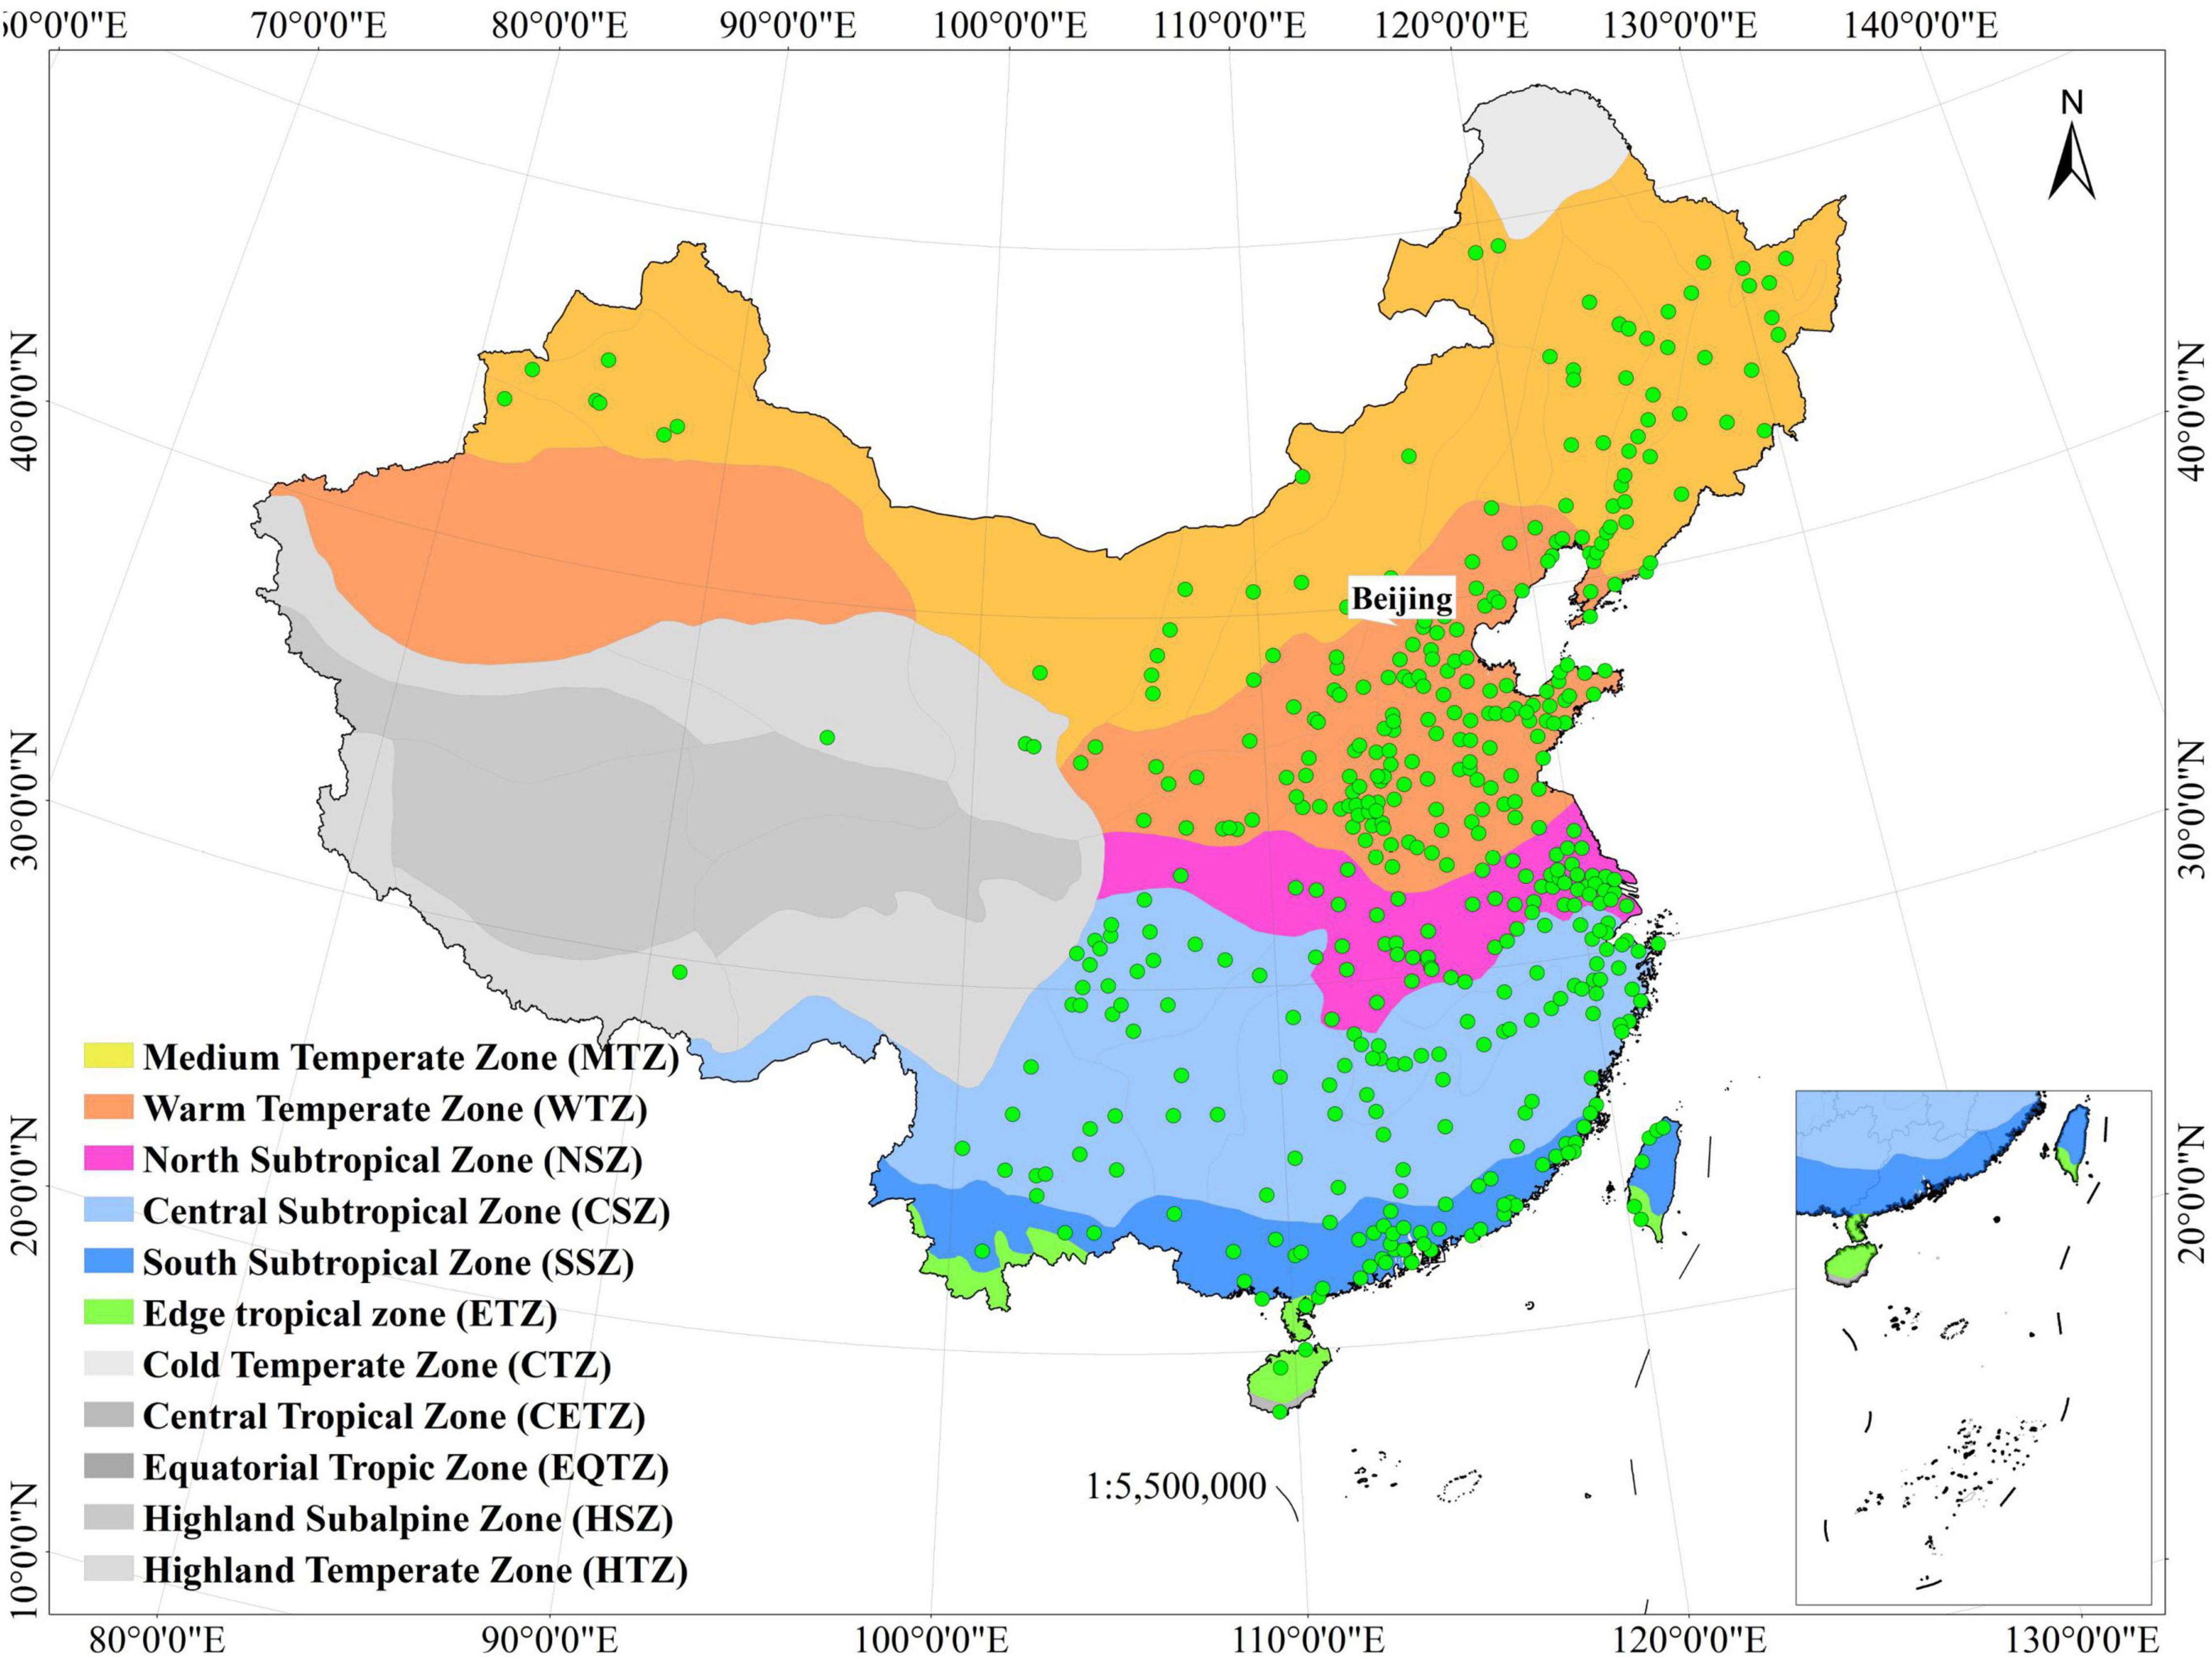
Figure 1. Spatial distribution of the selected 439 Chinese cities. Different colors indicate the first level of eco-geographic regional system. Colored zones were the focus of the statistical analysis. Green dots represent the locations of the 439 cities selected.
The 439 cities are located in different eco-geographic zones. To analyze the VG characteristics in different zones, Chinese eco-geographic regionalization data (Resource and Environment Science and Data Center, 2020) were collected, which are an eco-geographic zoning of China based on temperature and dry and wet conditions. This dataset has three levels: the first level was delineated by temperature (shown in Appendix Table A1); second level was divided by the criterion of water/moisture status (shown in Appendix Table A2); and third level was divided based on medium geomorphic logic units (Wu et al., 2003). The 2015 administrative boundary data (Resource and Environment Science and Data Center, 2020) for China were also used for mapping purposes. Parts of this dataset were re-projected to the UTM WGS 84 coordinate system for research and computational purposes. Appendix Table A3 shows all the datasets used in this study and their sources.
Methods
To explore the spatial variations in VG and their relationships with urban expansion and AIA change, data processing steps (Figure 2) were carried out as follows.
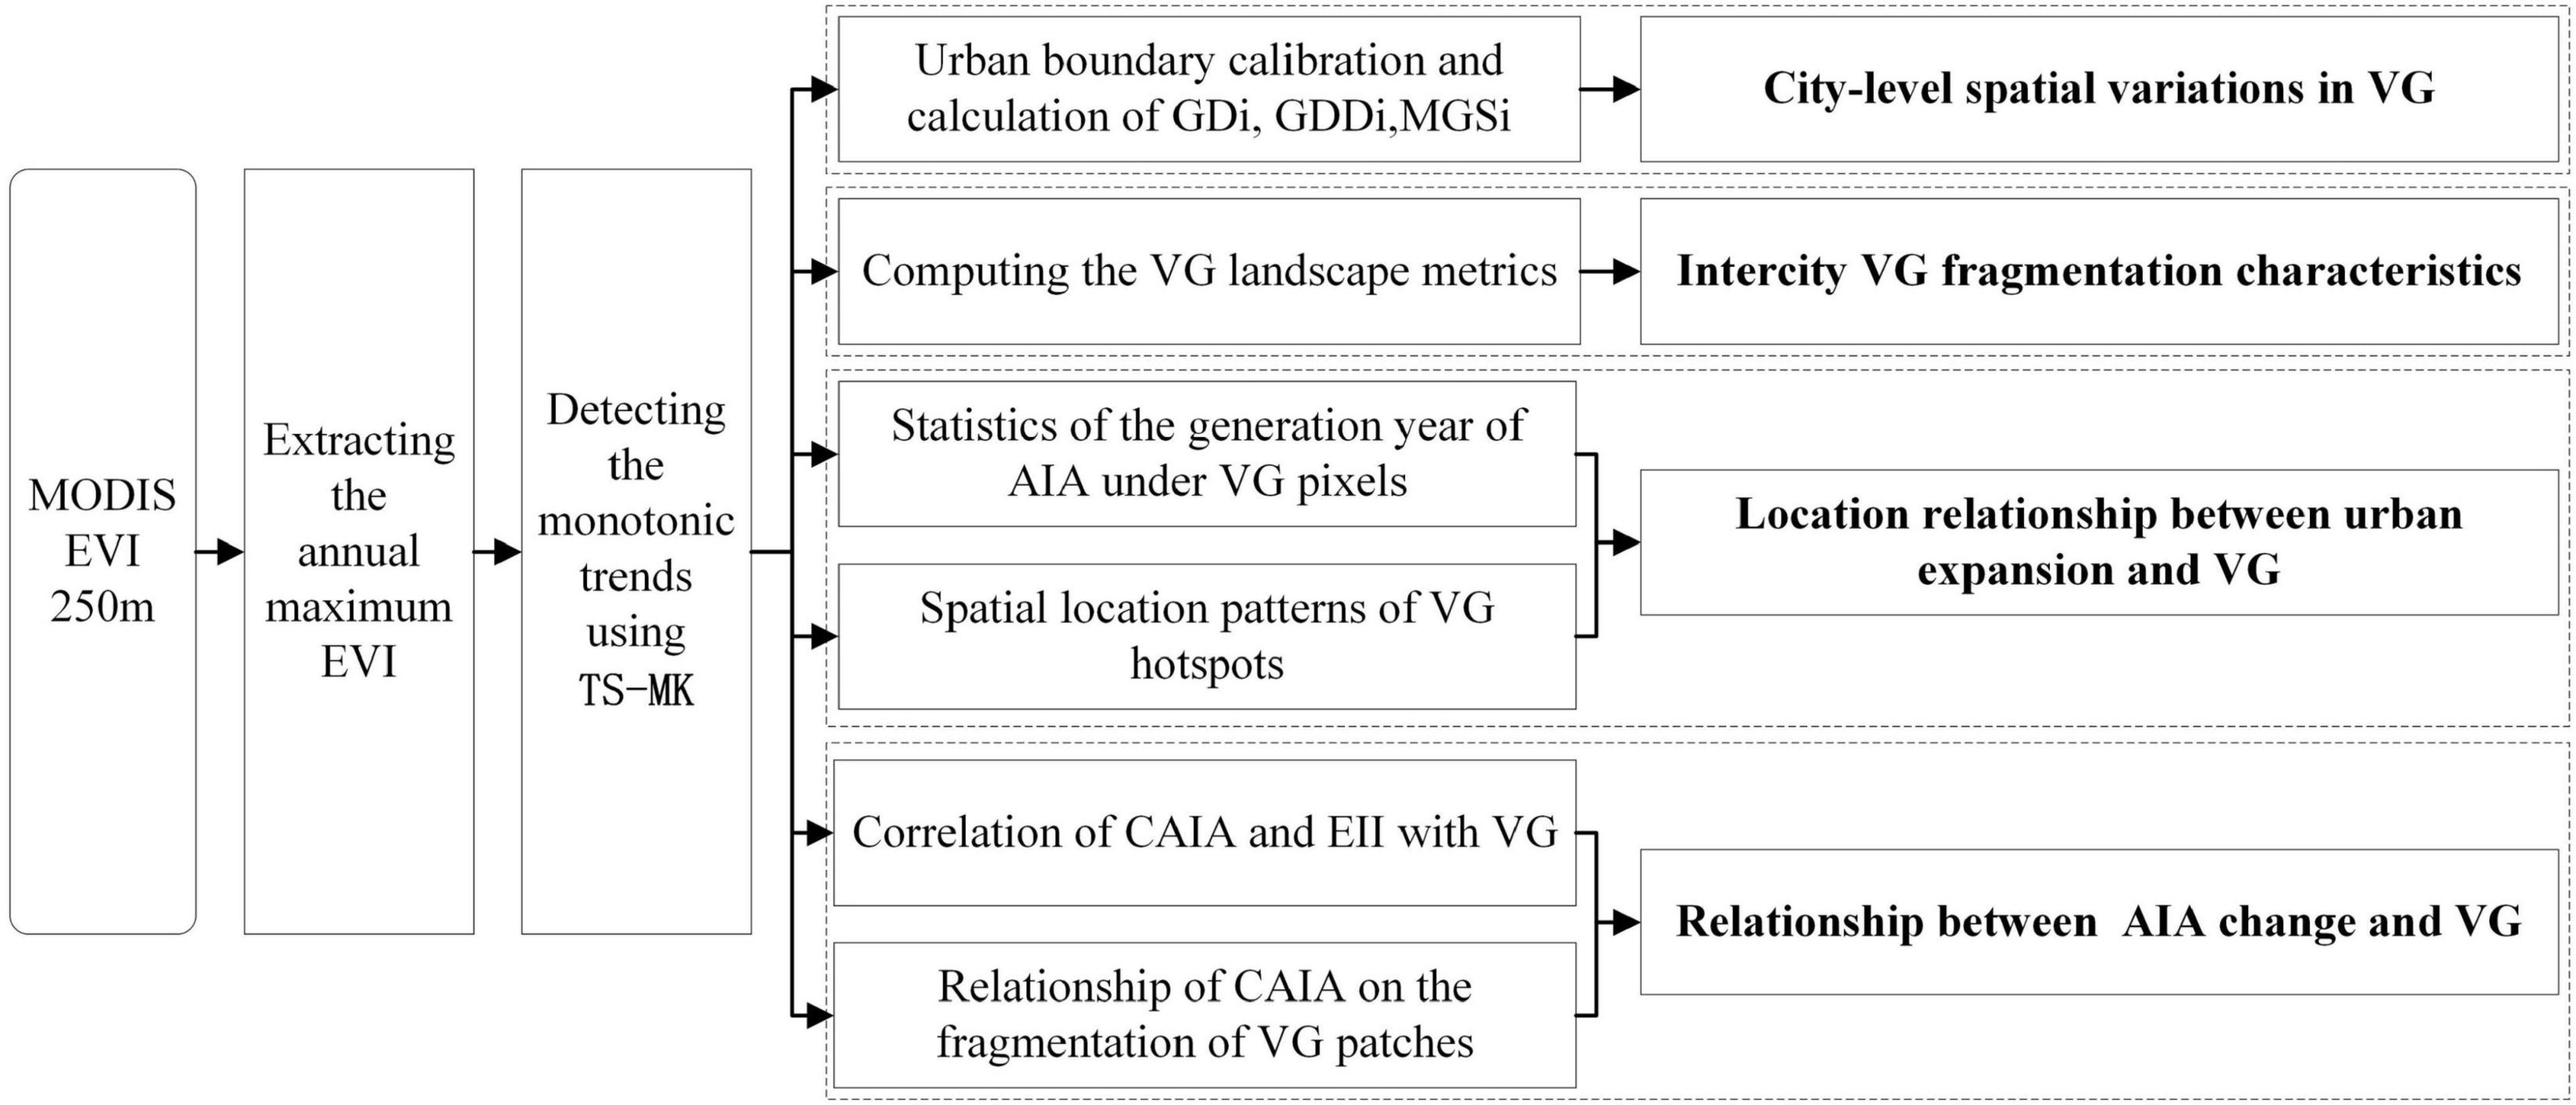
Figure 2. Flowchart for the data processing and analysis used in this study.
City-Level Spatial Variations in Vegetation Greening
First, to avoid the effect of phenology and calculate the VG of each pixel, we extracted the annual maximum EVI values (i.e., EVImax) of each pixel from the MOD13Q1 dataset. The length of the obtained EVImax time series was 20 years. The VG of each pixel was then calculated using the Theil–Sen and Mann–Kendall (TS–MK) methods. The Theil–Sen algorithm was used to compute the slope for each pixel from the EVImax time series. Theil–Sen is a robust nonparametric statistical method for trend calculations, which is computationally efficient and insensitive to measurement errors and outlier data. A slope >0 indicates an upward trend, whereas a slope <0 indicates a downward trend. The Mann–Kendall statistical test was used to quantify the trend significance. The Mann–Kendall monotonic trend test is a non-parametric statistical test within which the data do not need to follow a normal distribution and are less disturbed by outliers. The final pixels were significant at the 0.05 significance level and had slope >0 were considered as VG pixels and selected as the basis for subsequent tasks.
Second, based on the boundary dataset, 439 urban boundaries at different administrative levels were selected and manually calibrated using Google Earth images to ensure data reliability. To analyze the horizontal and vertical differences in VG among the cities, we proposed the following three indices (as listed in Table 1). The greening density index (GDi) was used to eliminate the effect of city size and indicate differences in the coverage rate of VG pixels among the cities. The greening density difference index (GDDi) indicates differences in the VG pixel density between areas with post-2001 boundary expansions and the 2001 urban boundary. The mean greening slope index (MGSi) was used to eliminate the effect of city size and indicate the Theil–Sen slope difference in the VG pixels among the cities.
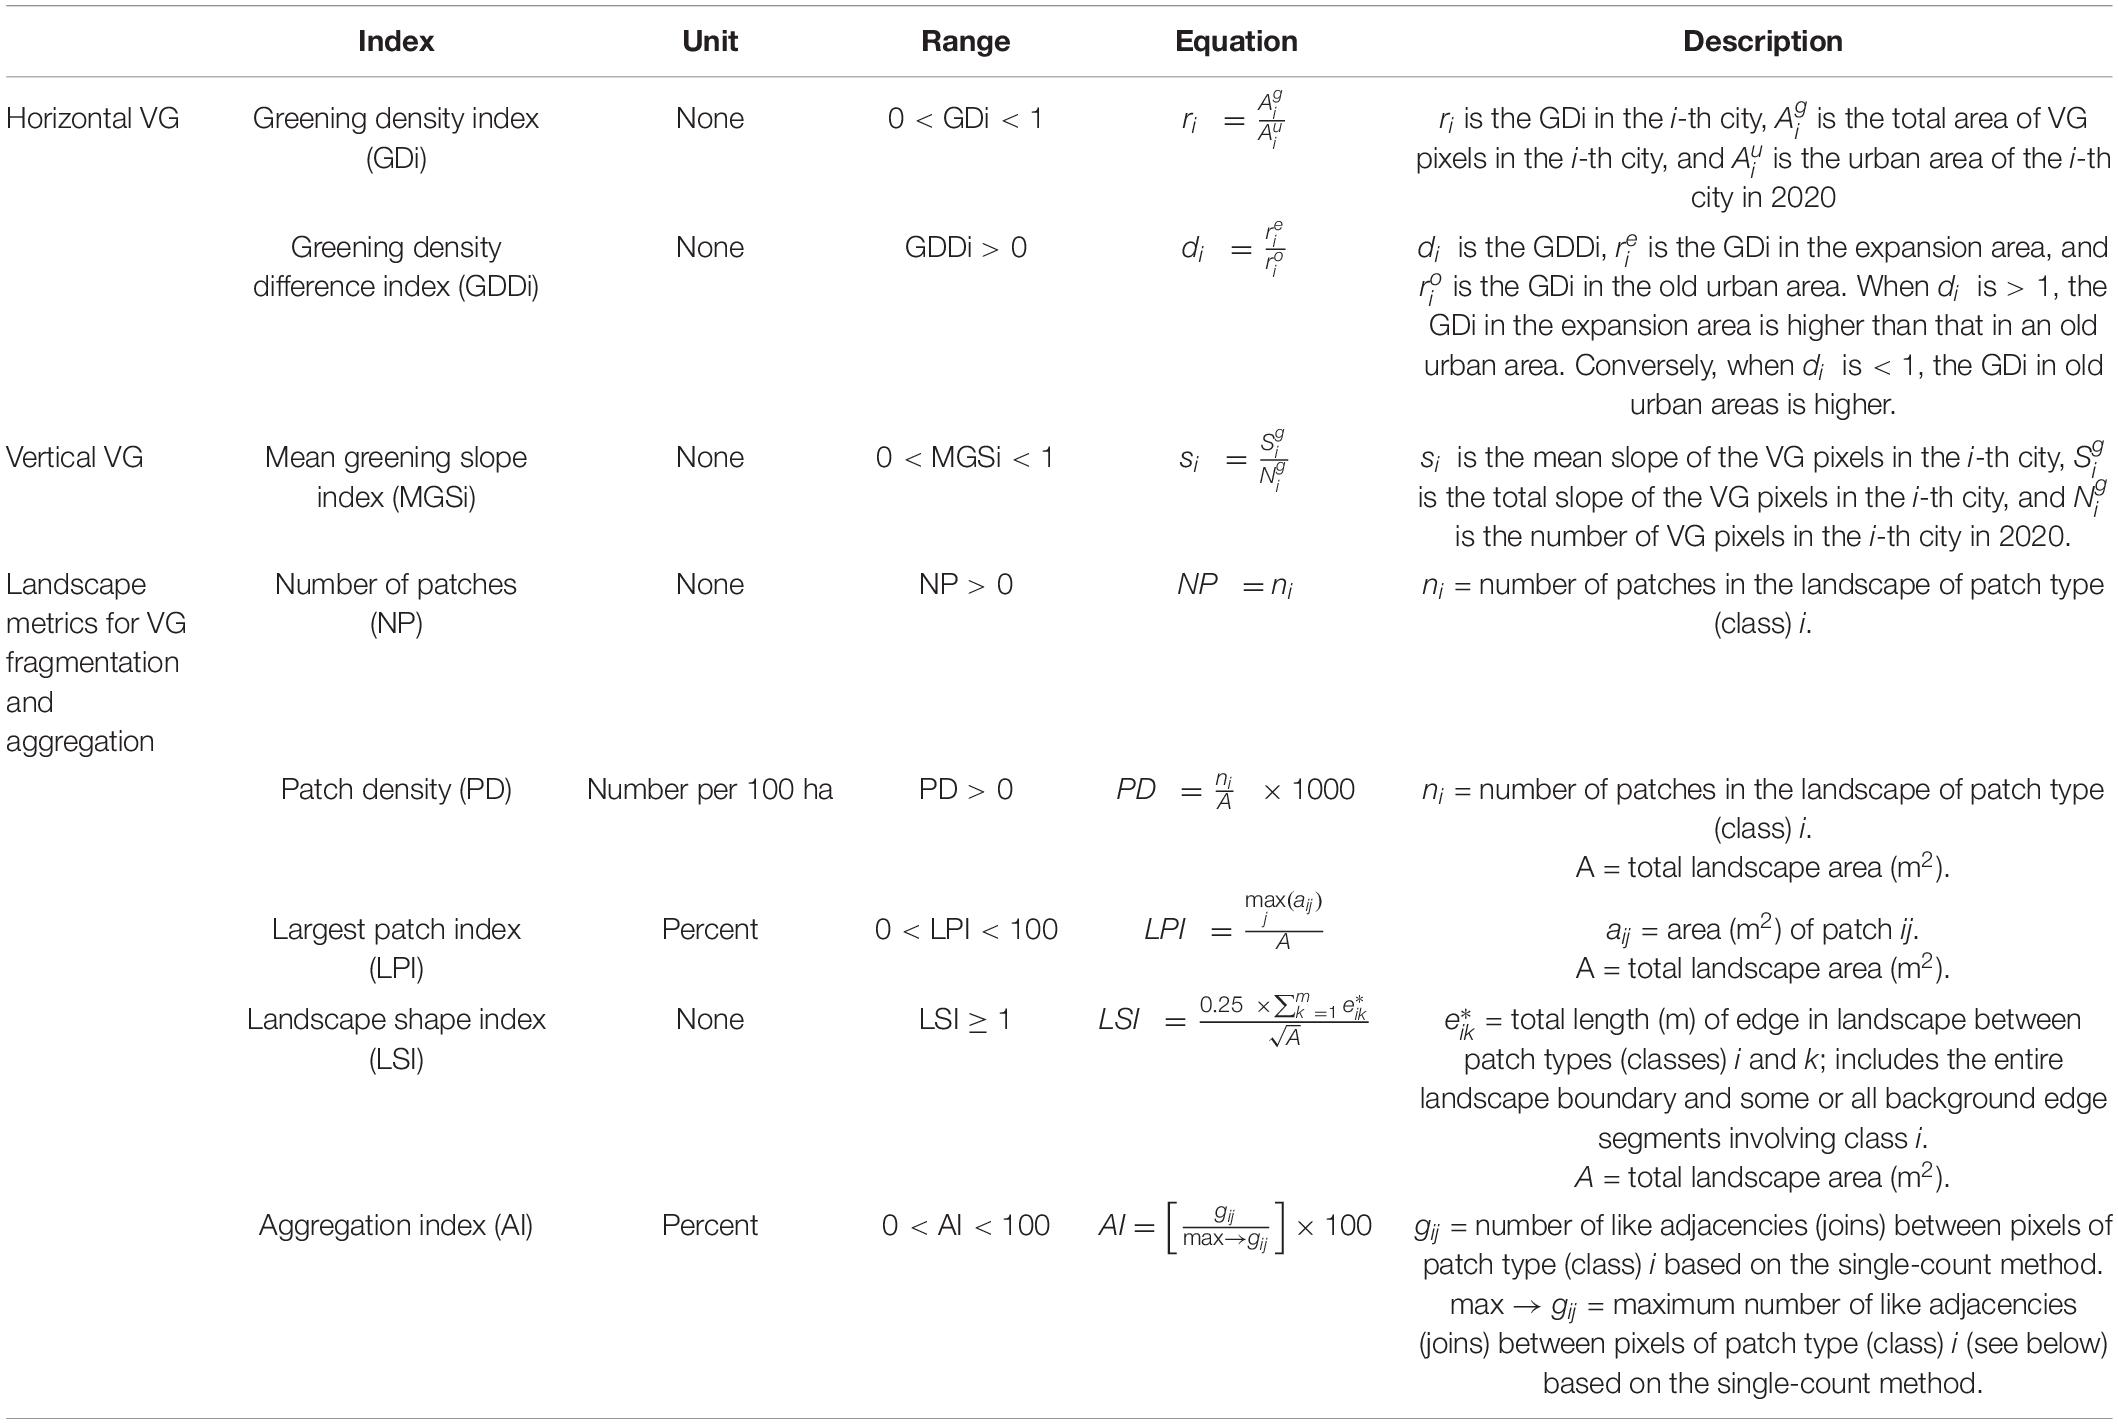
Table 1. Descriptions of VG-related indexes used in this study.
Finally, the city-level spatial variations in the greening area, GDi, GDDi, and MGSi of the 439 cities were analyzed and differences in different eco-geographic zones were clarified.
Intercity Vegetation Greening Fragmentation Characteristics
To further characterize the spatial fragmentation of VG patches composed of VG pixels in each city and the differences among the cities, we selected landscape metrics to quantify them. The selection of metrics was based on three principles. First, previous studies have widely used them to analyze fragmentation characteristics. Second, they should have different landscape pattern characteristics to reveal complex fragmentation processes. Third, there was a low redundancy among the metrics. Considering that only one patch type (patch composed of VG pixels) was available, whereas other pixels within the urban boundary were backgrounds, we selected five class-level metrics (as listed in Table 1). These metrics can be classified into number (number of patches, NP), area (largest patch index, LPI), density (patch density, PD), shape (landscape shape index, LSI), and aggregation (aggregation index, AI). The LPI describes the percentage of the maximum VG patches in the landscape area and characterizes the VG direction. The PD describes the degree of fragmentation in the VG patches. The LSI describes the shape complexity of the VG patches. The AI describes the aggregation of the VG patches. These metrics were calculated using Fragstats 4.2 (FRAGSTATS, 2022) software with a default eight cell neighborhood rule and no-sampling strategy. The selected metrics were numerically reliable (i.e., showing consistent trends) for depicting the spatial fragmentation of VG patches (McGarigal et al., 2002).
Location Relationship Between Urban Expansion and Vegetation Greening
The VG distribution balance, reflecting vegetation growth characteristics, vegetation productivity and green biomass, affects the well-being of urban residents and the maintenance of biodiversity. However, the GDi and GDDi only capture the density information on VG not the spatial location of VG in a city. Therefore, to further explore the VG balance, we derived the spatial pattern of VG from the location of the hotspot area (dense clustering area) of VG pixels relative to the urban boundary determining whether the new city or the old city was greening by counting the years of AIA under VG pixels. We first calculated the mean and median values for the past 20 years within the first (2001) and last (2020) urban boundaries to analyze the general trend of vegetation greenness in the 439 cities. We then counted the year of the urbanized area (AIA) where the VG pixels were located using GAIA data. Finally, we obtained the hotspot areas of VG pixels in the 439 cities using the kernel density method, statistically identifying the spatial location patterns of the hotspot areas in relation to the boundary footprints left by cities from 1990 to 2018.
Relationship Between Artificial Impervious Area Change and Vegetation Greening
Urbanization processes transform vegetated areas into AIA, whereas urban planning and landscape management create new green facilities to meet the ecological needs of a growing population. We used the AIA to represent areas of intense human activity and calculated the change in the AIA (CAIA) and expansion intensity index (EII) (Jiao et al., 2017) of the AIA. We then analyzed the Pearson correlation between these two indicators with the VG and VG landscape metrics. The EII is the ratio of the AIA expansion area to the total area of the region during the study period. It quantitatively compares the degree of AIA expansion and measures the intensity and speed of AIA expansion during different periods. The EII is defined as follows:
where EIIi denotes the EII of the i-th city. and are the impervious areas of the i-th city at the beginning and end of the study period, respectively, n is the time interval, and Ai is the impervious area of the i-th city. Finally, we used regression models to further investigate the effect that changes in the AIA have on the fragmentation of VG patches in provincial, prefecture-level, and county-level cities.
Results
City-Level Spatial Variations in Vegetation Greening
Based on the TS–MK results, the greening area of the VG pixels for each city was obtained from 2001 to 2020 (as shown in Figure 3A). The results showed that the greening areas of the 439 cities accounted for 17.42% of the total area of the urban boundaries in 2020. Figure 3B shows the spatial distribution of the greening area for each city. The greening areas were classified into five categories using the Jenks’ natural breaks. From Figure 3B, the first category of cities included Beijing, Shanghai, Guangzhou, Shenzhen, and Dongguan, which were located in three economically developed regions: Beijing-Tianjin-Hebei, Yangtze River Delta, and Pearl River Delta. Cities in the second category were distributed across 11 provincial cities (Wuhan, Chengdu, Xi’an, and Urumqi) and two prefecture-level cities (Daqing and Zhongshan). The third category contained 29 cities scattered in different locations, such as Kunming in the southwest, Taipei in the southeast, Kuitun and Kelamayi in Xinjiang in the northwest, and Harbin in the northeast. In the fourth category, prefecture-level cities had the largest number (78%) while the fifth category had the largest number of county-level cities (54.4%). Among the top three categories of greening areas, 48 cities accounted for 60.47% of the total greening area. Most of these cities are located in the central and eastern provinces of China, followed by Fujian, Guangdong, and Taiwan in the southeast. Provincial-level cities in the southwest had the highest VG values. To the west, the highest VG was found in northern Xinjiang.
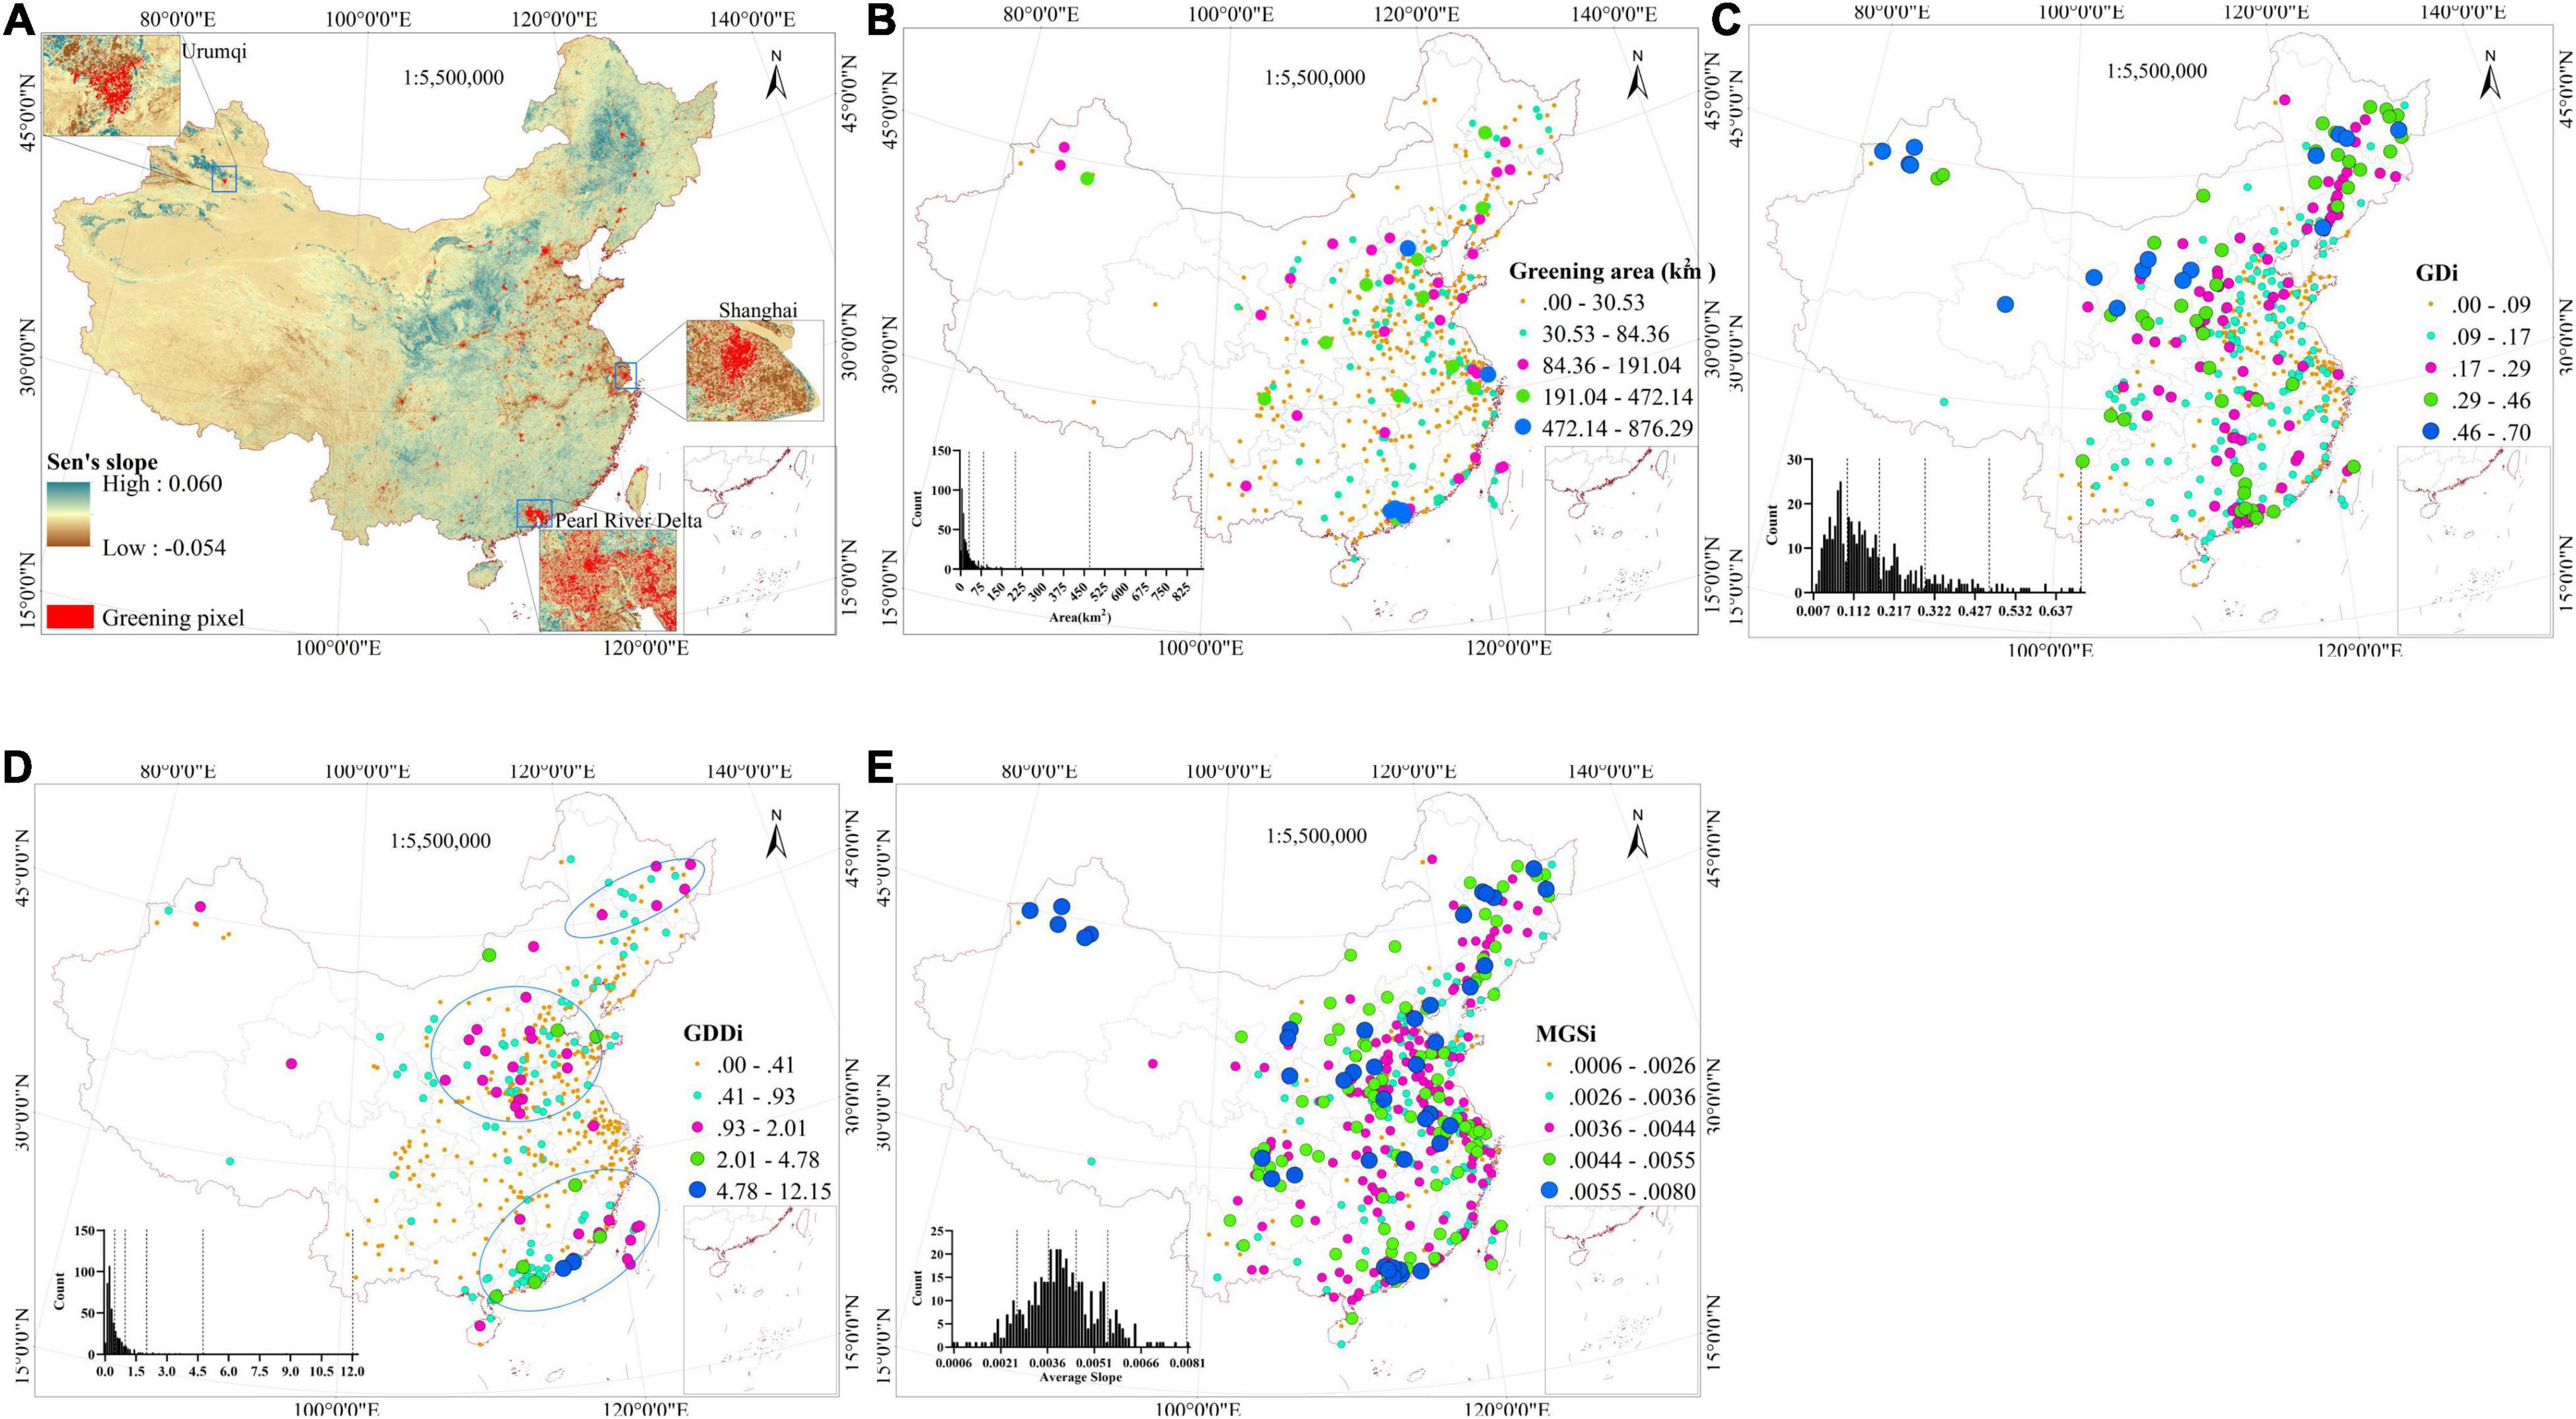
Figure 3. Spatial variations in the VG of the 439 cities. (A) Distribution of the VG pixels in the 439 cities; (B) spatial distribution of greening area of the VG; (C) spatial distribution of the GDi; (D) spatial distribution of the GDDi; and (E) spatial distribution of the MGSi. Dots in the images represent the selected cities; colors refer to the category of the greening area, GDi, GDDi, and MGSi. The histograms show the distribution of the values of the greening area, GDi, GDDi, and MGSi.
Figure 3C shows the spatial distribution of the GDi for each city. There were 17 cities with higher GDi values, most of which were located in northern China, such as Geermu in Qinghai and Qitaihe in Heilongjiang. Shenzhen in Guangdong was the only city in the south with a high GDi. As shown in Figure 3B, some megacities did not have high GDi values, despite their large greening areas, such as Beijing and Shanghai. In contrast, some prefecture- and county-level cities in the north had high GDi values, and most of these cities had an area of <100 km2 and were located in arid and semi-arid regions. Figure 3D shows the GDDi between the expansion areas after 2001 and the old urban areas in 2001 for the 439 cities. The GDDi results were classified into five categories. Cities with a high GDDi in the first category were Puning and Lufeng in the Guangdong Province. The second category included eight cities, such as Longkou, Sihui, and Guixi, which are mostly county-level cities. Based on the first three categories, the GDDi exhibited clear spatial aggregation. Cities with the highest GDDi were primarily located in three regions. One was in North China, Jinzhong, and Jinnan and the other was in the Pearl River Delta urban agglomeration, coastal Fujian, and western Taiwan. The third was Taonan in Jilin and four cities in Heilongjiang Province. In the west, the two cities with higher GDDi values were Karamay in Xinjiang and Geermu in Qinghai. Figure 3E shows the spatial distribution of the MGSi. The MGSi results were divided into five categories. The first category had 42 cities that showed a relatively notable agglomeration, such as northern Xinjiang, eastern Sichuan and Guangdong. Cities in the second, third, and fourth categories were evenly distributed across all of the provinces. Cities in the fifth category were primarily distributed in the central and eastern provinces of China.
To explore the spatial variations in the VG in different level of eco-geographic zones (as shown in Figure 1 and listed in Tables A1, A2), Figures 4A,B show a comparison of the average value of the GDi and MGSi. Due to the small sample size of provincial cities with different eco-geographic zones, only the differences in the average values of the GDi and MGSi between prefecture- and county-level cities were compared here. In Figure 4A, the average GDi of the prefecture-level cities had a maximum value in MTZ and a minimum value in NSZ, after which it gradually increased. Geographically (as shown by the corresponding colors in Figure 1), the average GDi of the prefecture-level cities decreased from north to south and then slightly increased. The maximum value of the average GDi of the county-level cities was in MTZ and the minimum value was in WTZ. Geographically, the average GDi of the county-level cities from north to south showed a W-shaped trend. When comparing the average GDi of the prefecture- and county-level cities, the average GDi of the prefecture-level cities was higher than that of the county-level cities in MTZ, WTZ, CSZ, and SSZ, while it was smaller than that of the county-level cities in NSZ. In Figure 4B, the average GDi shows a decreasing trend from AZ to HZ. Interestingly, the average GDi in the arid and semi-arid zones was larger than that in the humid and semi-humid zones. Figures 4C,D show a comparison of the average MGSi for eco-geographic zones. In Figure 4C, the maximum value of the average MGSi for the prefecture-level cities was located in MTZ and the minimum value in CSZ. The maximum value of the average MGSi for the county-level cities was located in MTZ and the minimum value in NSZ. However, the differences of the average MGSi for the county-level cities in WTZ, NSZ, and CSZ were not significant. In Figure 4D, the cities with the largest average MGSi in different administrative levels were located in the arid zone and shows a decreasing trend with increasing humidity. The Chinese government has developed a number of policies to protect and create urban green spaces in recent decades, particularly large-scale afforestation programs in arid and semi-arid areas. The positive impact of greenery policies on VG has been preserved from the results.
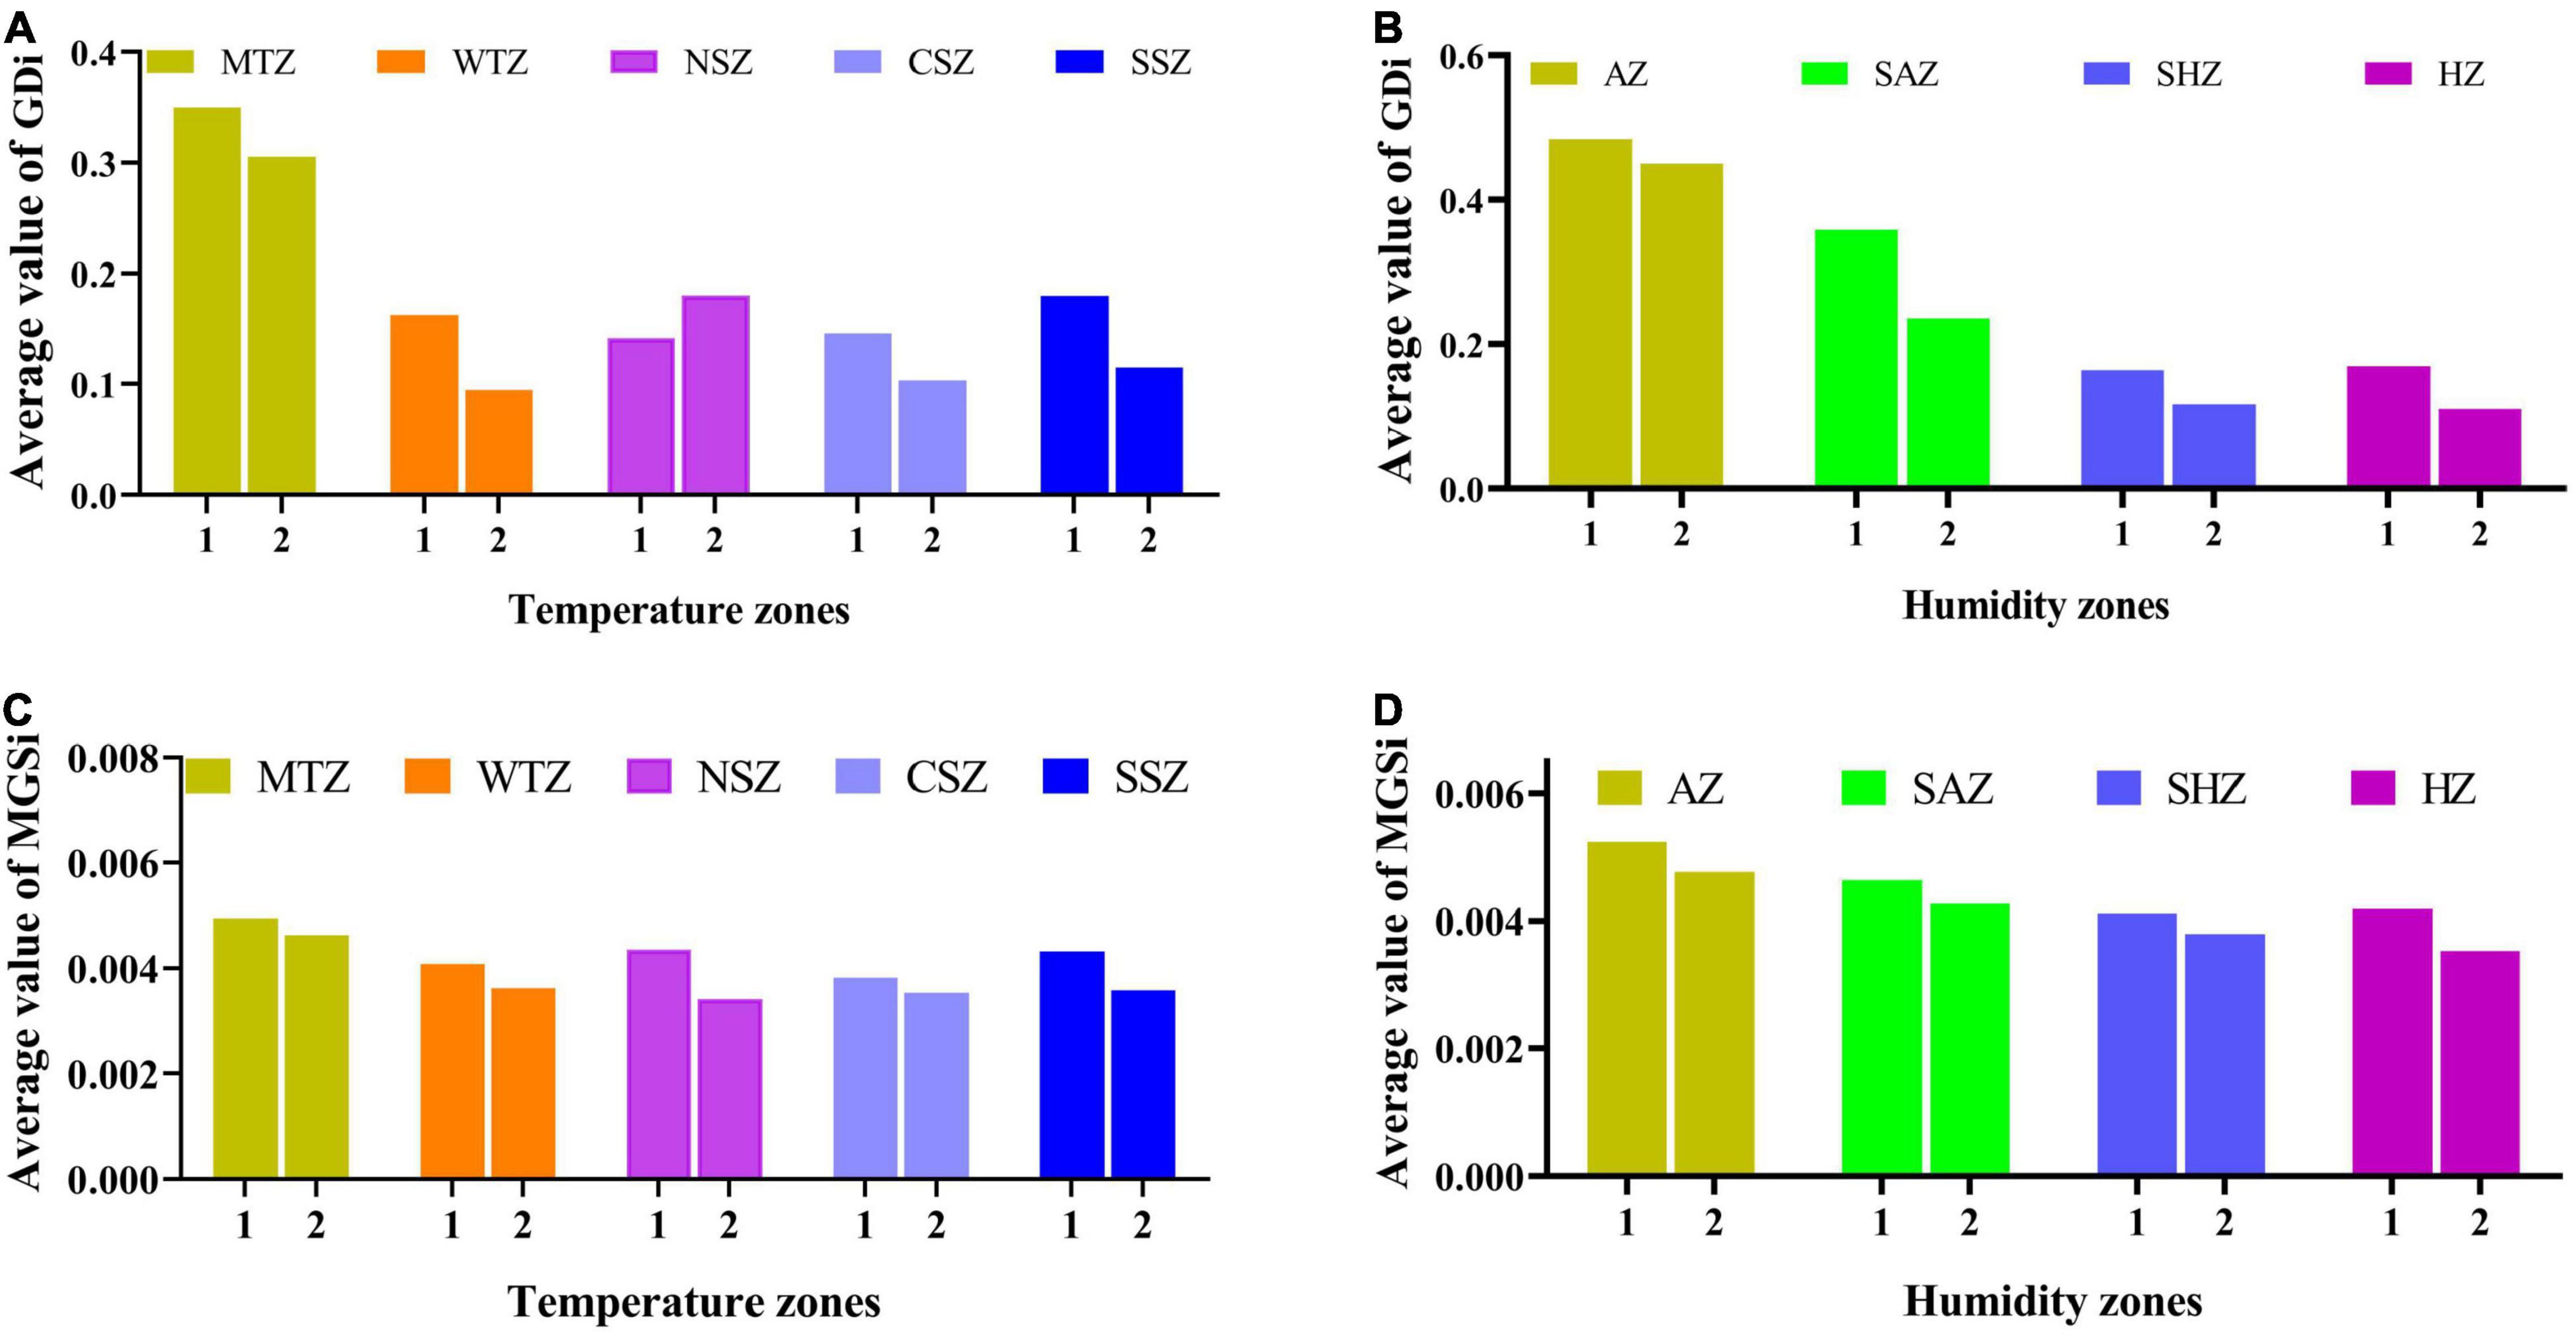
Figure 4. Comparison of the average value of the GDi and MGSi in different temperature and humidity zones. (A,B) the average value of the GDi in temperature zones and humidity zones; (C,D) the average value of the MGSi in temperature zones and humidity zones; numbers 1 and 2 on the x-axis denote prefecture-level and county-level cities, respectively.
Intercity Vegetation Greening Fragmentation Characteristics
We calculated four class-level landscape metrics to characterize the spatial fragmentation of patches composed of VG pixels, as shown in Figure 5. There was a redundancy between the NP and PD; therefore, the NP is not shown here. From a spatial variation perspective, the spatial trends in the LPI, PD, LSI, and AI were different. For the PD (Figure 5A), there were 33 cities with a PD value >0.59 (59 per 100 ha). Cities with high PD values were primarily located in central and southern China. This indicates that these cities had a high degree of VG patch fragmentation. Cities with low PD values (<0.19) were primarily located in the downstream provinces along the Yangtze and Yellow rivers, such as Henan, Anhui, Jiangsu, and Zhejiang. For the LPI, there were 10 cities in northern China with high LPI values (>38%), including Xinjiang and Inner Mongolia (Figure 5B). However, they have a smaller urbanized areas, resulting in the formation of large VG patches. In Figure 5C, high AI values >70 were primarily distributed north of 28°N, such as in Sichuan, Shanxi, Shaanxi, Gansu, Xinjiang, Inner Mongolia, and Liaoning provinces. These cities had higher concentrations of VG patches. Cities with lower AI values (<36) in the coastal provinces were Qinzhou, Fuqing, Taichung, Weihai, and Linghai. As shown in Figure 5D, 24 cities with the highest LSI values were primarily distributed in the coastal cities of Guangdong, Fujian, Taiwan, Zhejiang, Shandong, and Liaoning. The high LSI of these cities indicates a complex and diverse VG patch shape, strongly influenced by human activities. Generally, higher LPI values provides a better recreational environment for residents and maintains biodiversity. Cities experienced better VG and had a higher patch integrity and higher LPI. These cities were primarily located in the north (Figure 5B). In terms of the PD, cities with a high PD tended to fragment spatially, such as those in the Pearl River Delta and Beijing-Tianjin-Hebei region. To reduce the fragmentation of VG, cites with high PD values should pay more attention to urban development while focusing on vegetation maintenance. The VG shape complexity was influenced by city size, such as Beijing, Shanghai, and Guangzhou. The economic development and expansion of these cities were more likely to contribute to the shape complexity of VG. In terms of aggregation, most cities in China tended to have a concentration of VG patches, particularly western and northern cities. Although these cities are located in less developed areas, enhanced vegetation management may also lead to a concentration of VG pixels, which is also more conducive to the formation of dense vegetation areas.
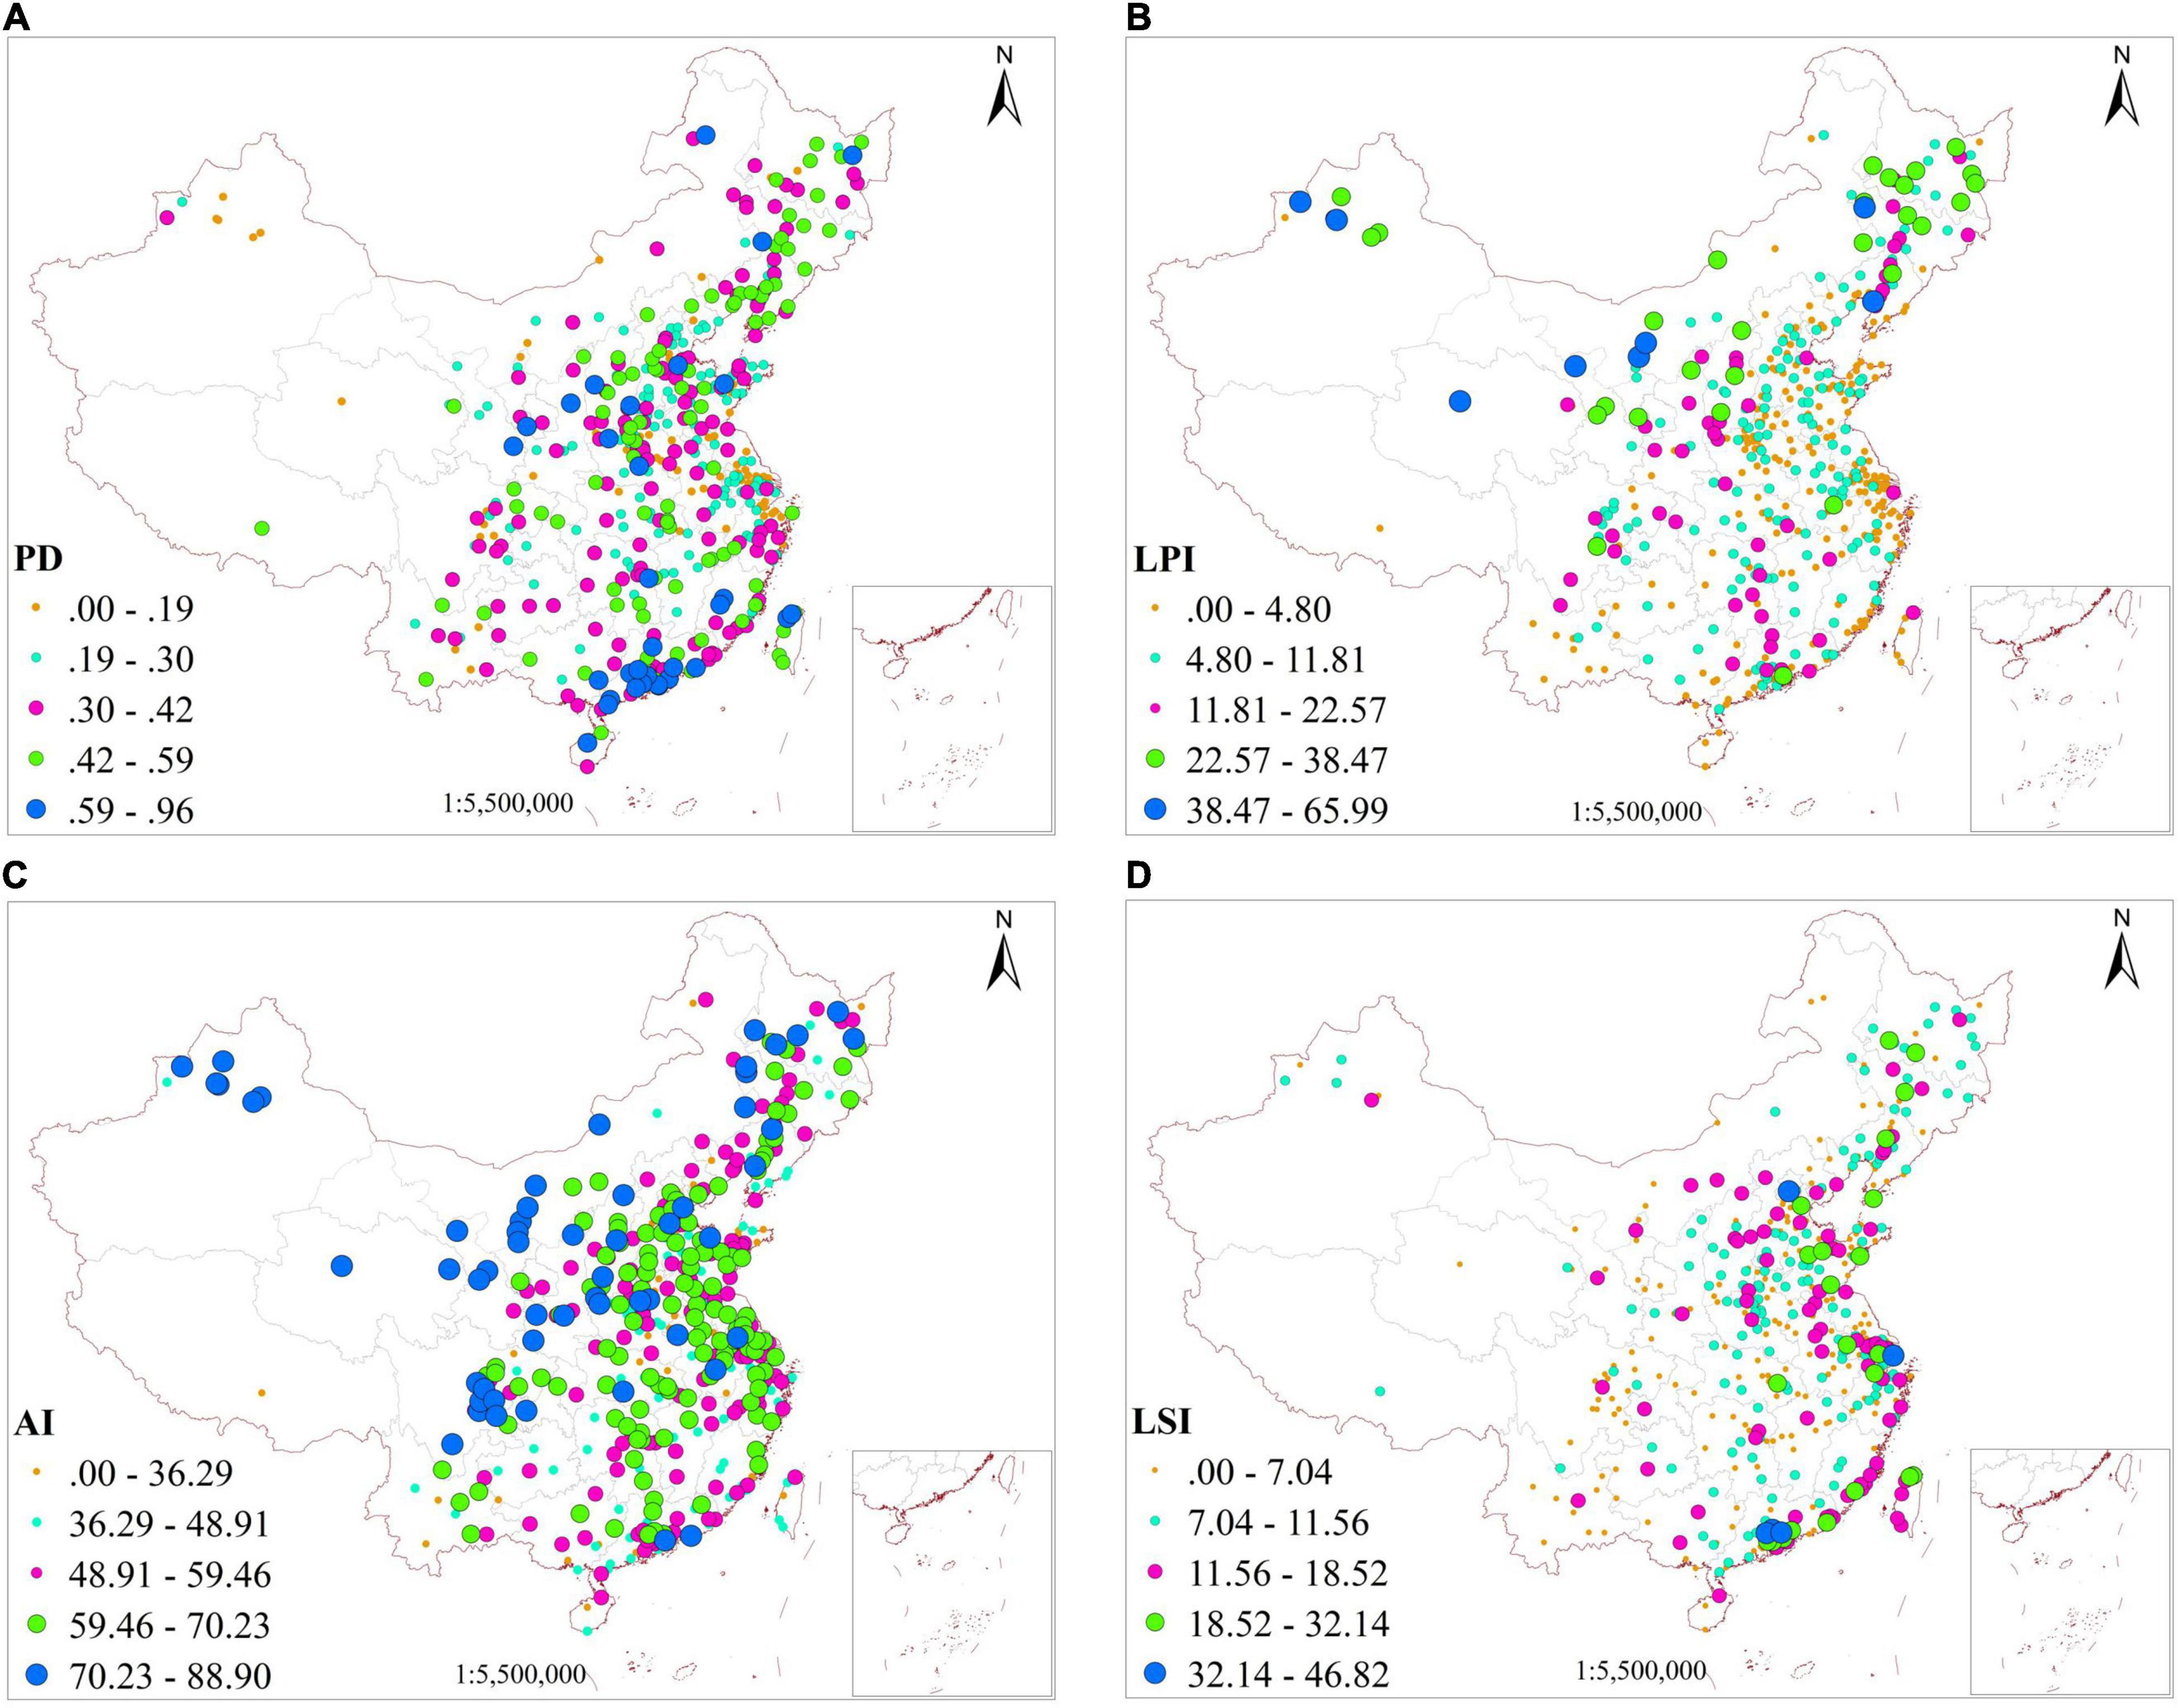
Figure 5. Spatial variations in the landscape metrics for VG. (A–D) VG landscape metric for the PD, LPI, AI, and LSI, respectively.
Location Relationship Between Urban Expansion and Vegetation Greening
To analyze the trend of EVImax data series within the city boundary before (2001) and after (2020) urban expansion, we calculated the mean and median values of EVImax for the past 20 years by referring to the pre-expansion and post-expansion city boundaries. In Figure 6A, these two values gradually increased within the 2001 boundary and decreased within the 2020 boundary. A similar conclusion to the Shanghai study (Zhong et al., 2019) can be obtained from Figure 6A, where there was an overall decreasing trend of urban vegetation, but there may be a trend of vegetation improvement in older urban areas. Therefore, we extracted the AIA (urbanized areas) generation year in which the VG pixels were located, and counted the percentage of VG pixels per AIA generation year. From Figure 6B, the percentage of the VG pixels before the AIA generation year 1990 is 60.4%. As shown in Figure 6C, the earlier the AIA was generated (older urban areas), the smaller the VG slope. However, more recently urbanized areas have a larger VG slope. To further analyze the VG patterns in urbanized areas, we computed the hotspot areas of VG pixels in the 439 cities using the kernel density method and statistically identified the spatial location patterns of the hotspot areas in relation to the boundary footprints left by cities from 1990 to 2018. The results showed that 97.7% of the VG hotspot areas in the 439 cities were mostly located within the boundary footprint of the cities in 1990. This indicates that the VG hotspots in Chinese cities were primarily distributed in old urban areas, while the VG density in new urban areas was sparse. The spatial location patterns of the VG hotspots in these cities were divided into three types: center-type, fringe-type, and infill-type (as shown in Figures 6D–F). The VG in center-type cities (e.g., Changzhou) was scattered from the center to the periphery; the proportion of this type across the 439 cities was 25.3%. Fringe-type cities (e.g., Changshu) tended to scatter in certain directions; the proportion of this type was 64.9%. The infill-type cities (e.g., Baotou) were primarily due to the high growth of VG pixels, which covered most part of the city; the proportion of this city type was 9.8%. Our study confirmed the VG in the central city, which covered a wider range of cities compared with limited urban case observations.
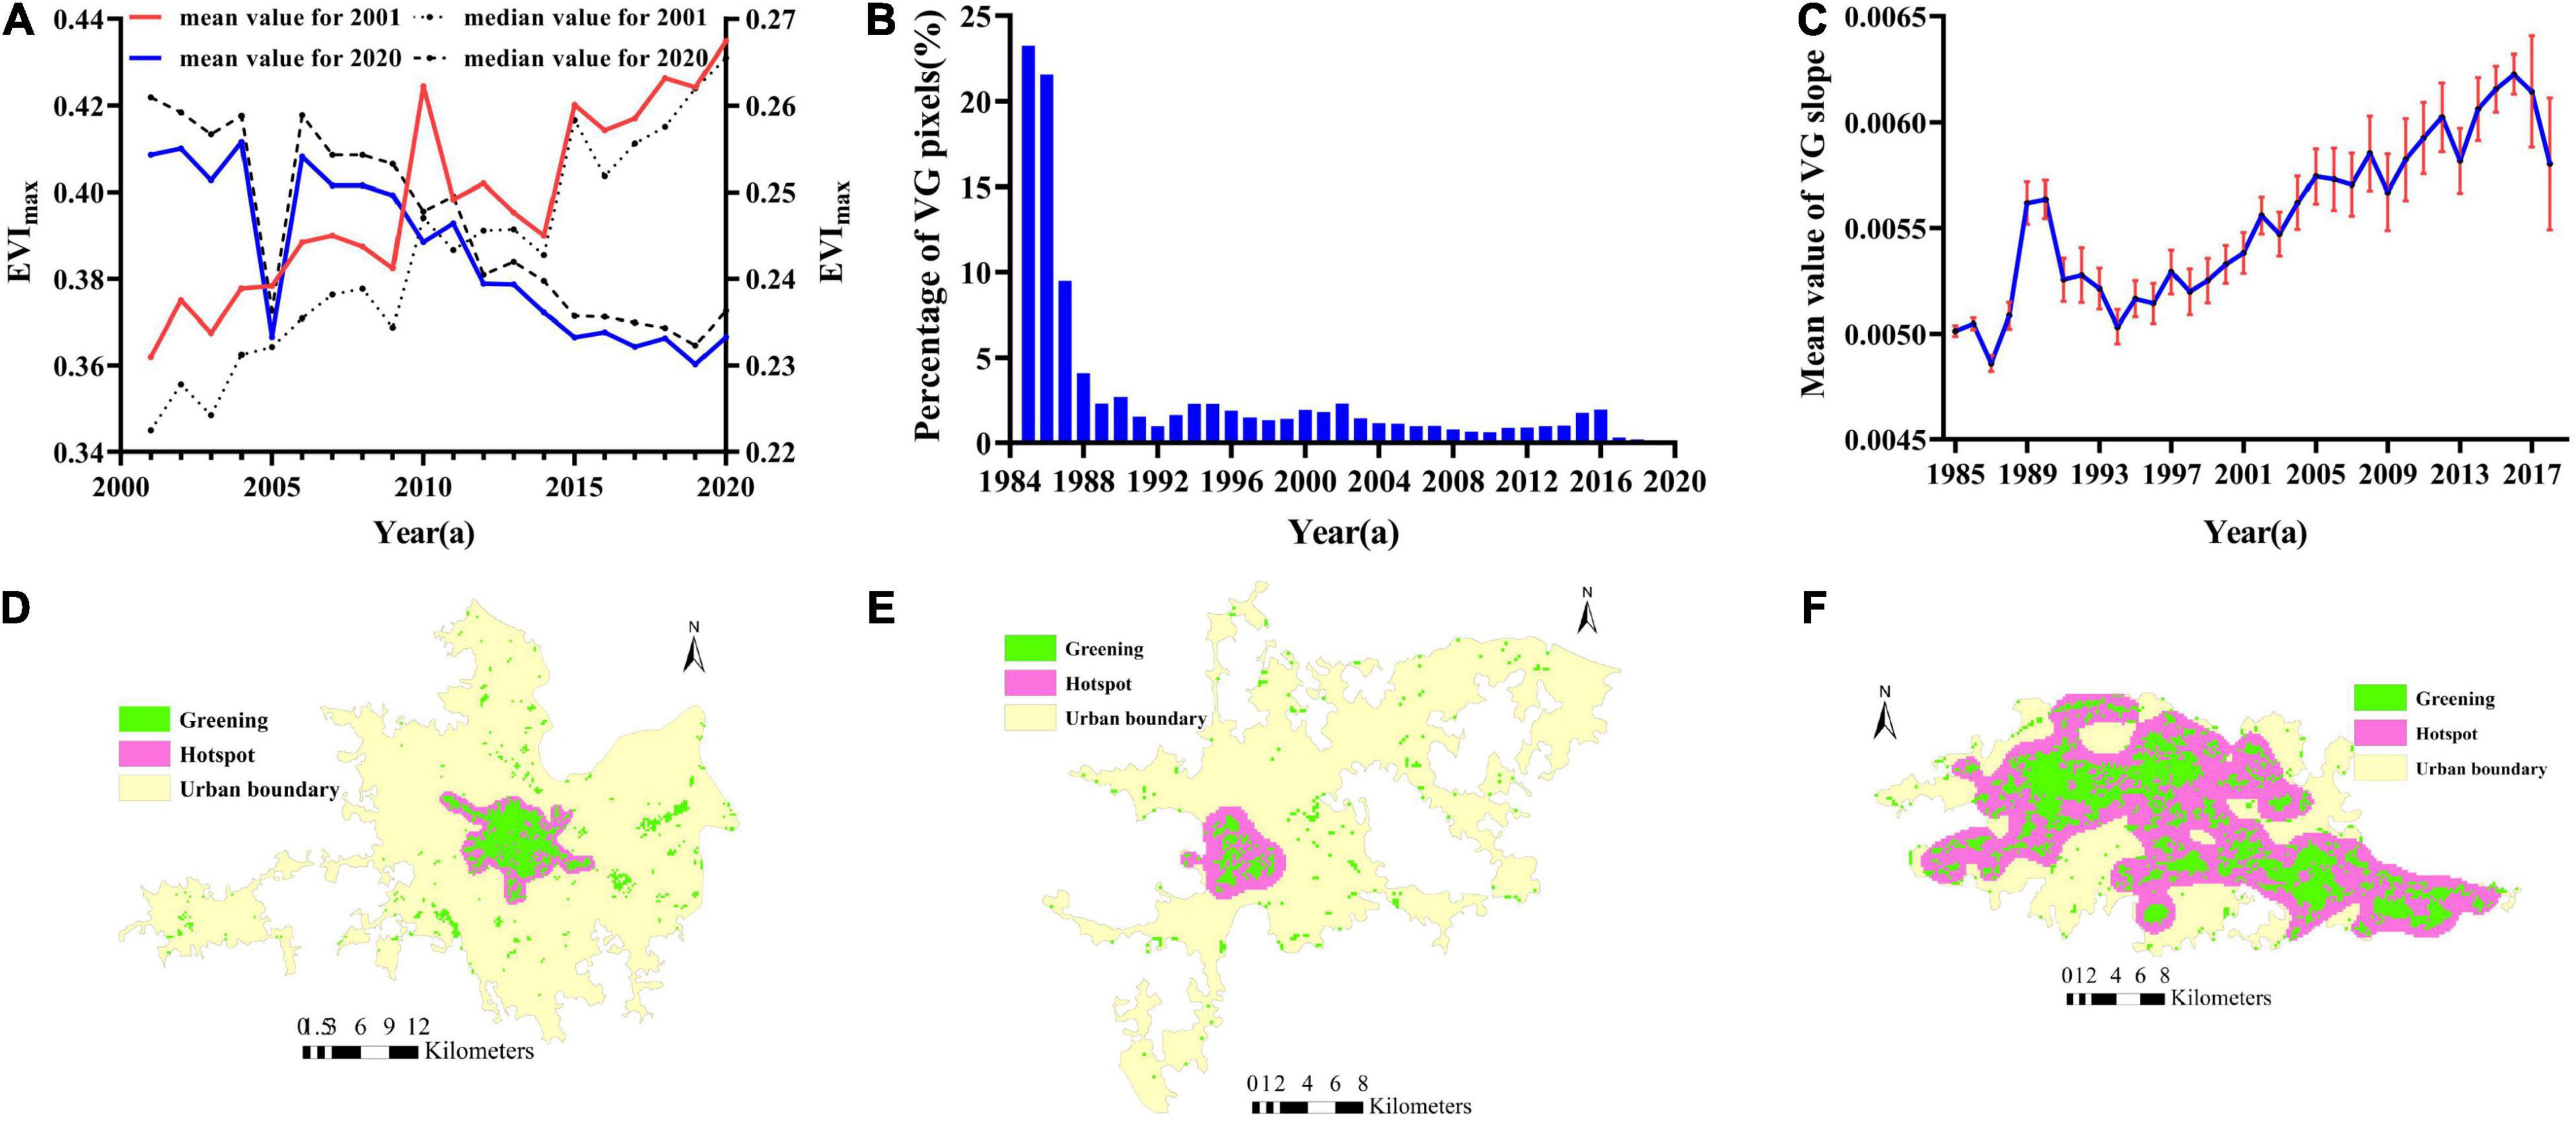
Figure 6. Concentration types for the VG hotspots. (A) Mean and median of EVImax within the urban boundary for the year 1990 and 2020; (B) the percentage of VG pixels per AIA generation year; (C) the mean value of VG slope per AIA generation year; (D) center-type (Changzhou); (E) fringe-type (Changshu); and (F) infill-type (Baotou).
Relationship Between Artificial Impervious Area Change and Vegetation Greening
Table 2 lists the correlation results for the CAIA and EII with the VG indices and the VG landscape metrics. The CAIA was significantly and positively correlated with the greening area (r = 0.832), reflecting a strong relationship between increases in the AIA and greening area. Figure 6 also shows that this positive correlation had the largest contribution from VG in old urban areas. The CAIA was also significantly and positively correlated with the LSI (r = 0.809), indicating that the shape of the VG patches becomes complex during the urbanization process. The CAIA was weakly and positively correlated with the AI (r = 0.177), indicating that the increase in the AIA was closely related to the concentration of VG patches, which can be partially explained by the concentration of VG in old urban areas. However, there was a weak negative correlation between the CAIA and PD (r = −0.021), suggesting that an increased AIA was associated with the degree of VG fragmentation. The EII had a negative correlation with the six indicators, but the correlation was less significant. Of these, the EII had the largest negative correlation with the GDi, indicating that the growth rate of the AIA had a negative relationship with the VG density within a city. The EII and CAIA reflected the correlation between the two state quantities of the AIA, in space and time, and VG. The spatial changes in the CAIA in the first and last periods were positively correlated with the shape, aggregation, and slope of VG, which may be due to the active land use policy. However, the growth rate of the AIA reflected the intensity of human activities, which would be negatively correlated with the VG density, differences in VG between old and new urban areas, and VG fragmentation.
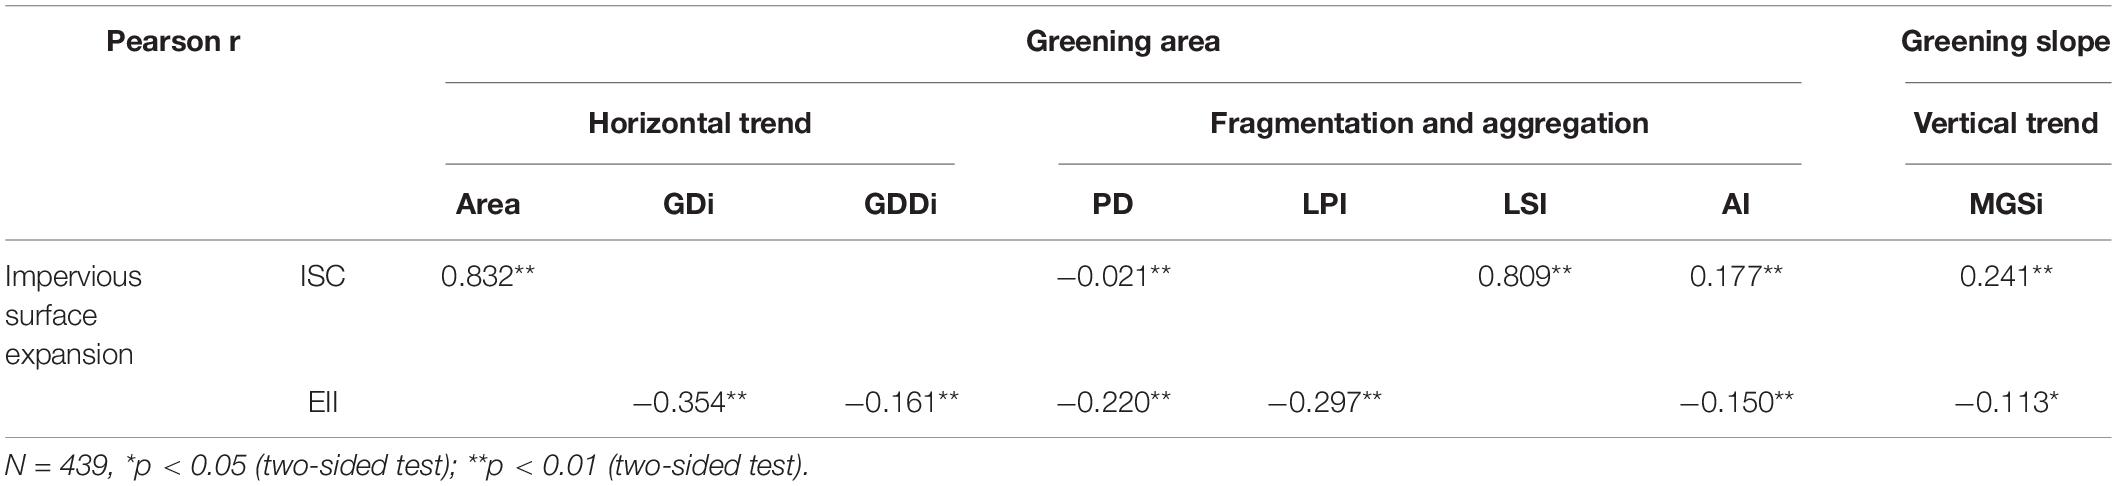
Table 2. Correlation coefficients for the changes in the AIA and VG.
Regression models were used to further investigate the effect of the CAIA on the fragmentation of VG patches in provincial, prefecture-level, and county-level cities. However, after subdividing by city administrative level, the EII and landscape metrics indicating fragmentation were not significant in the regression model, while the CAIA was not significant with the AI and PD; therefore, these results were not presented here. We only used the CAIA to analyze the effects of urbanization on the NP and LSI of the VG patches. Here, the NP and PD had similar fragmentation description characteristics; however, the NP focused more on the number of patches. As shown in Figure 7, most of the models for the provincial, prefecture-level, and county-level cities could explain >68% of the variation in the NP and LSI, significant at a 0.05 level. In terms of the NP and LSI, the CAIA better explained the phenomenon of fragmentation and shape complexity in the VG patches in prefecture-level cities, whereas it was least interpretable in the county-level cities. This may be due to the smaller urbanized areas in county-level cities, where the fragmentation and shape of the VG landscape are more complex.
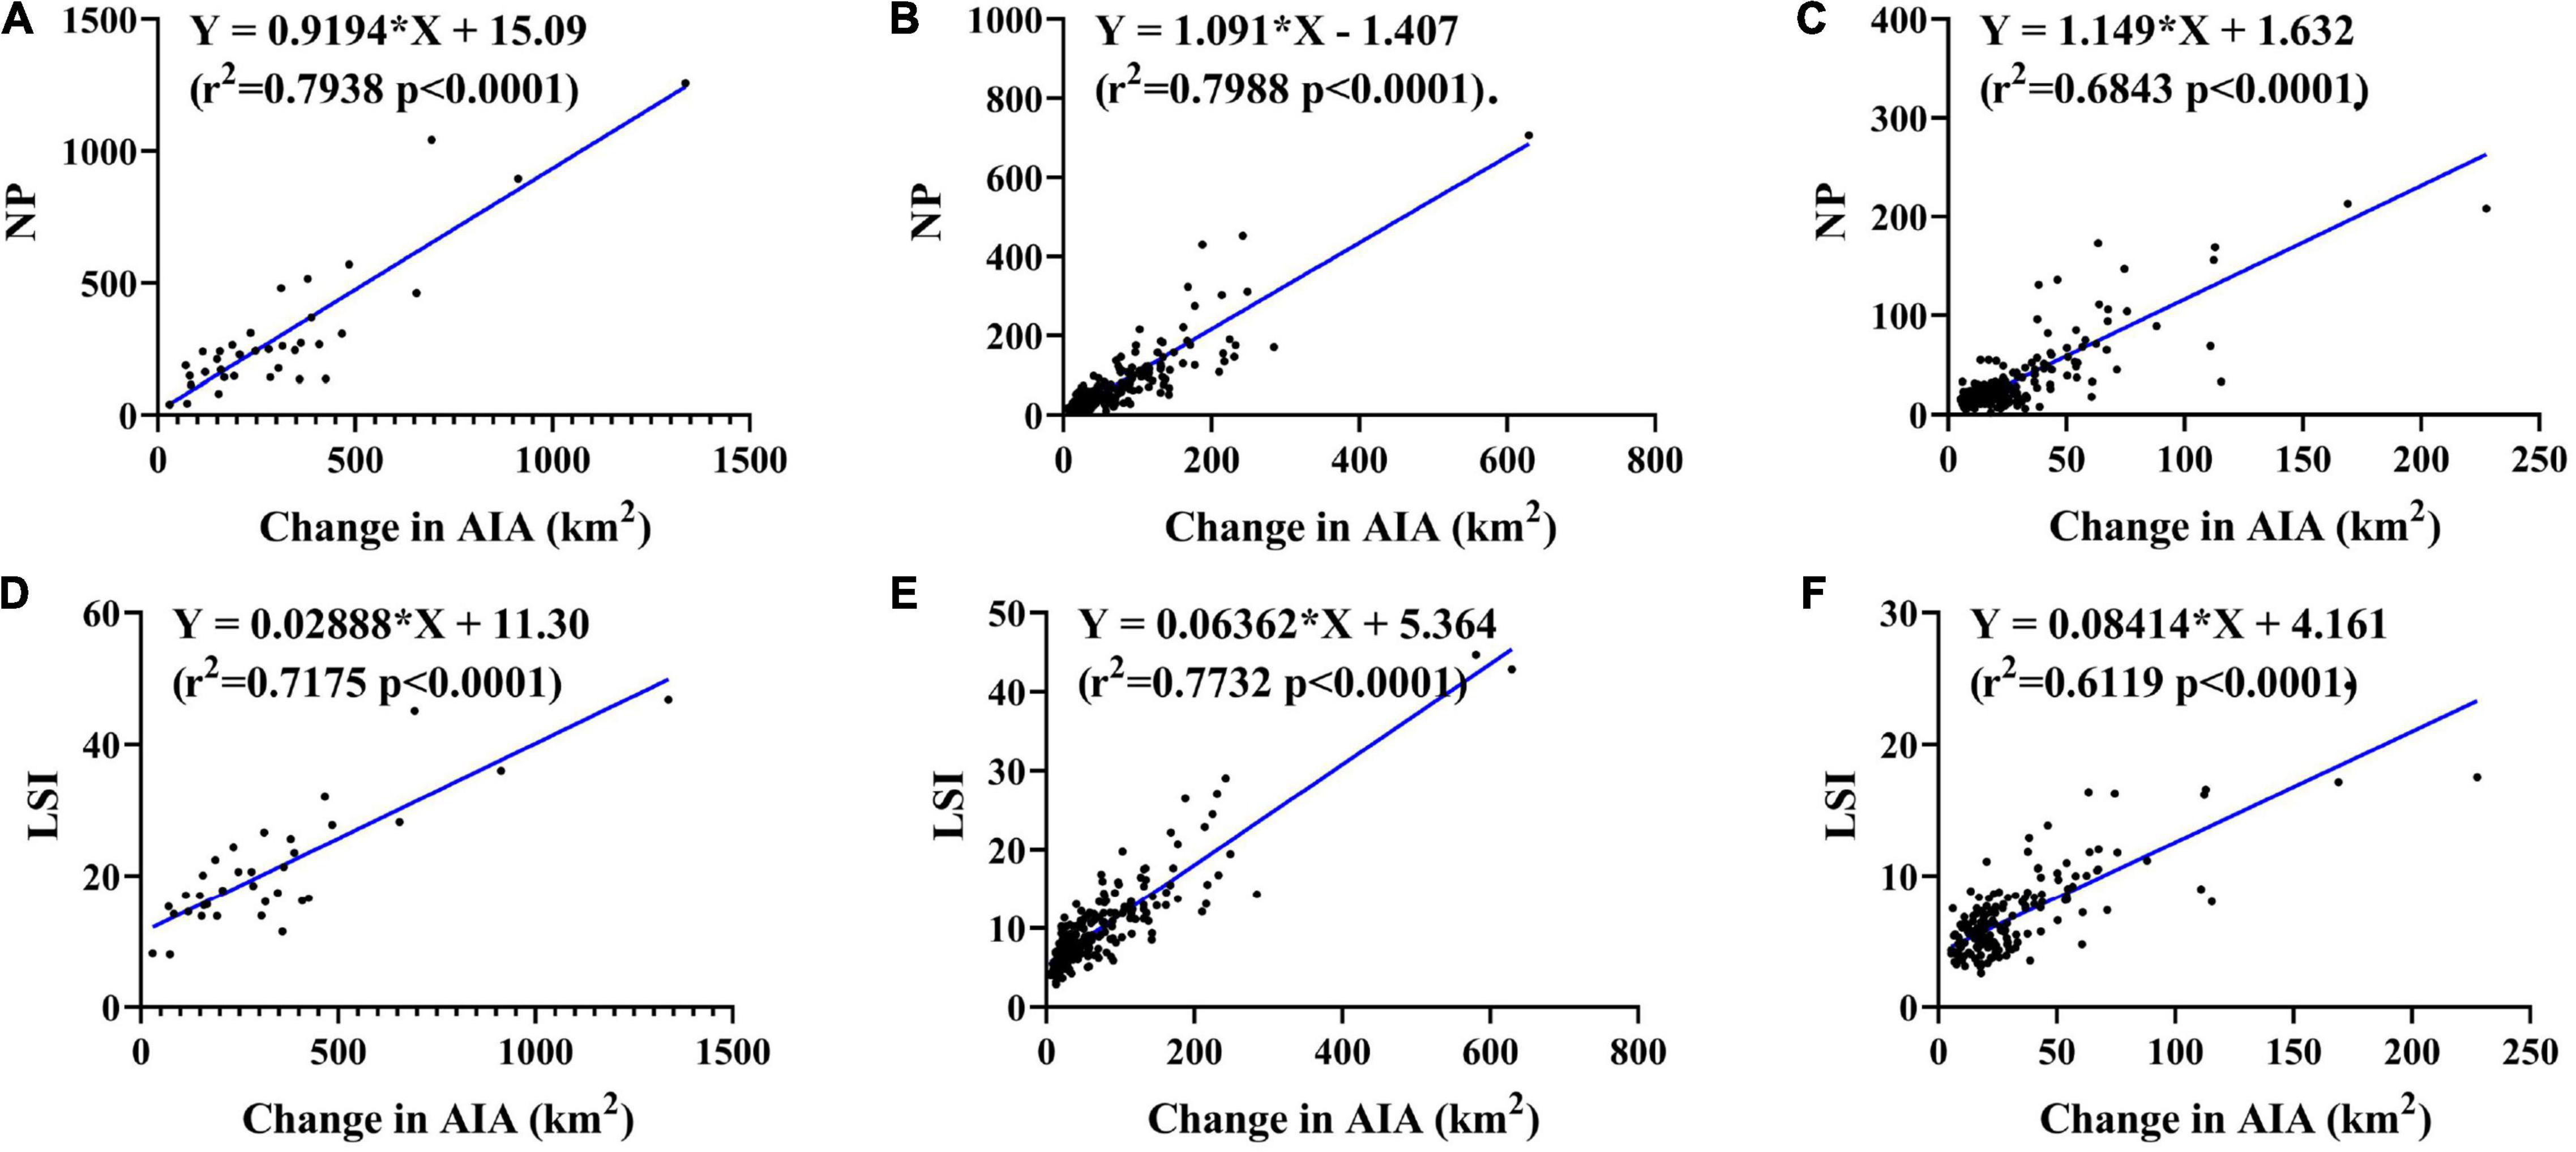
Figure 7. Correlations among the CAIA, landscape metrics, and VG. (A–C) Correlations between the CAIA and NP, and LSI in the provincial-level (A,D), prefecture-level (B,E), and county-level cities (C,F).
Discussion
Characteristics of Urban Vegetation Greening in China
Urban vegetation status studies can be classified into two categories. The first category analyzes changes in the number, area, and patches of urban green space based on land use and land cover maps. High-resolution remote sensing data are typically used to extract and summarize changes in green spaces. Previous studies have shown that there has been a decline in the total amount of urban green space, particularly in suburban areas, such as Shanghai (Wu et al., 2019) and Nanchang (Li et al., 2015). However, urban green spaces are narrowly defined as outdoor places with a certain amount of vegetation (Zhao et al., 2013), which typically ignores vegetation on roadsides, rooftops, and around buildings, accounting for up to 40% of the total urban vegetation (Haase et al., 2019). However, they provide cultural and ecosystem services closely related to the health and quality of life of urban residents. Therefore, assessing changes in urban vegetation using vegetation indices, such as the NDVI (Chen et al., 2017), GPP, and EVI (Zhong et al., 2019), is important at an integrated spatial scale. We examined the MODIS EVI to quantify and describe urban VG using the TS–MK method. Consistent with the results of previous EVI (Zhong et al., 2019) and NDVI (Sun et al., 2011) studies, there was a decreasing vegetation trend in the urban periphery. We further compared VG according to the city administrative level, eco-geographic zones, and old and new urban areas. Greening areas accounted for 17.42% of the total area across the 439 selected cities. The top 48 cities accounted for 60.47% of all urban greening areas. This indicates that the overall trend for improvements to urban vegetation was not promising. Moreover, 17 cities with a high greening density (GDi) were located in several northern prefecture-level and county-level cities, and most of them were located in arid and semi-arid regions. This could be explained by the fact that, in arid or semi-arid cities, urbanization may lead to an increase in vegetation, replacing the original landscape with vegetated human settlements (Lu et al., 2017).
Patches are typically used as functional units in landscape ecology, urban planning, and natural resource management (Zhou et al., 2017). Many studies investigating the dynamics of urban green spaces at the patch level have identified a trend in green space fragmentation. As the interiors of building plots and rooftops are not included in green space management, their positive impact on human physical and psychological health cannot be ignored (McNamee, 2009). This indicates a new a new approach to effectively quantify the spatial patterns of urban VG. We quantified the spatial pattern of VG pixels in each city using landscape metrics to more effectively reveal differences in urban VG fragmentation or aggregation. The results showed that the urban patch integrity was better in northern China, VG was more fragmented in the Pearl River Delta and Beijing-Tianjin-Hebei, and VG was complex in shape in cities with better economic development. By analyzing the landscape characteristics composed of VG pixels that were highly correlated with vegetation ecology and social functions, refining our understanding of the vegetation status of each city at the national level may be crucial.
Under the pressure of urbanization, the expansion of built-up areas typically destroys a large proportion of the original vegetation; extensive green areas become impervious surfaces, which are then replaced with new artificial green patches. Some studies have reported that older urban areas become greener while expanded built-up areas generally have a higher green coverage than older urban areas (Yang et al., 2014). Yang et al. (2021) found that urbanization has a dual effect on vegetation. Vegetation degradation has occurred in urban areas, but there has been improvements to the vegetation in urban centers. However, no large sample exists for analyzing whether this phenomenon is widespread across a national region and what spatial characteristics are involved in vegetation improvement. The results of our study showed that 60% of the VG pixels in the 439 cities were located on impervious surfaces before 1990. The spatial aggregation patterns of the VG pixels were analyzed using the kernel density estimation method. We found that the fringe-type VG pattern accounted for 64.9% while the center-type accounted for 25.3% of the 439 cities. Our study not only confirmed the upward greening trend in old urban areas, but also further obtained the year of AIA under the VG pixels. “Planting where possible” (Wang et al., 2018) vegetation restoration strategies may be one of the factors contributing to these changes. The difference in the GDDi between old and new urban areas further confirmed that, as urbanization accelerates, the VG of old urban areas still cannot offset the green loss in new urban areas. Therefore, more attention should focus on greenery management and planning decisions in new urban areas.
Implications for Urban Vegetation Management
Urban expansion has a two-way effect of promoting and constraining vegetation growth. Incremental urban expansion converts cropland and forestland into impervious surfaces. Stock urban expansion changes the type of land cover within existing urban boundaries, such as adding new greenery projects and changing vegetation types. The area, slope, and VG density can be used as indicators for comparative analyses of changes in urban vegetation. Moreover, they can be used to adjust urban vegetation management plans to promote the balanced development of urban expansion and VG. To improve the spatial structure of VG, we must analyze the aggregation characteristics of VG and its degree of fragmentation. Vegetation construction in cities is typically fragmented; in contrast, land use determines the type of vegetation, as well as the availability and distribution of the planting space. Therefore, the above indicators can improve the effectiveness of green space design and planning. Moreover, based on the data analysis results, the greening-centered trend in Chinese cities indicates a need to increase the greening of land in peri-urban areas, particularly impervious surfaces, and to protect the surrounding environment.
Limitations and Future Research
The results obtained in this study were limited to areas with VG, which does not indicate the coverage of urban vegetation. These results can only be used to assess vegetation growth and its patterning. Additionally, several types of vegetation index data are currently available and used as a proxies for monitoring vegetation changes (Goetz, 1997; Gianelle et al., 2009; Tong and He, 2013), such as MODIS and Landsat vegetation index derivatives. Landsat optical images have sufficient spatial and spectral resolution to provide information on vegetation growth characteristics. However, cloud cover and water vapor typically degrade image quality, which limits the available images for time-series vegetation vitality measurements (Lee et al., 2017). Moreover, Albarakat and Lakshmi (2019) used Pearson correlation analysis for each pixel in Landsat and MODIS vegetation index data. The results showed that although the spatial resolutions of Landsat and MODIS were different, the locations of increasing (positive slope) or decreasing (negative slope) vegetation were in the same areas. Therefore, in this study, high-quality and well-documented 250 m MODIS EVI data were selected to understand urban VG.
Future research should validate and compare VG patterns with higher-resolution data and analyze the factors influencing VG. Urbanization is an ongoing process; only VG over the past 20 years were analyzed. Further studies should investigate the effects of urbanization, particularly urban expansion on VG—should be further investigated. The influence of urban vegetation greenery projects and management, and climatic factors on VG should also be the focus of future research.
Conclusion
The objective of this study was to analyze the spatial differences in VG and its patterns in Chinese cities and the impact of urban expansion on VG. Based on MODIS EVI, we used the TS–MK trend test, landscape metric calculation, correlation analysis, and linear regression for data processing and analysis of the results. The main conclusions can be summarized as follows: (1) there was a trend toward VG in urban areas, but it was not promising. Cities with larger greening areas were primarily located in central and eastern Chinese provinces, followed by southeastern, southwestern, and western provinces. The greening areas of the 439 cities accounted for only 17.42% of the total urban boundary area. The 48 cities with the largest greening areas accounted for 60.47% of the total greening area. (2) In the southern subtropical and warm temperate zones, 33 cities had a greening PD > 0.59, which was highly dispersed. In contrast, the VG patches in northern China showed better integrity. (3) The differences in the greening density and the distribution of VG hotspots demonstrated a notable centralized trend in cities. The form of urban expansion influenced the location patterns of VG hotspots. (4) The intensity of impervious surface expansion had a weak negative correlation with the greening trend. The correlations between the greening density and greening slope were −0.354 and −0.113, respectively. Given that vegetation is an important foundation for urban sustainability objectives, enhancing the greening of new urban land, particularly on artificial surfaces, is important.
Data Availability Statement
Publicly available datasets were analyzed in this study. This data can be found here: MODIS EVI https://lpdaac.usgs.gov/products/mod13q1v006/, urban boundary datasets http://data.ess.tsinghua.edu.cn. The eco-geographic regionalization data are available from https://www.resdc.cn.
Author Contributions
BH: conceptualization, methodology, validation, formal analysis, writing—original draft preparation, investigation, and visualization. BH and LS: resources and data curation. BK: review and editing. BH and KL: funding acquisition. DH and LS: validation. All authors have read and agreed to the published version of the manuscript.
Funding
This research was funded by the Shenzhen Fundamental Research Program (Nos. JCYJ20190812171419161 and JCYJ20190807163001783) and the National Natural Science Foundation of China (No. 41901391).
Conflict of Interest
The authors declare that the research was conducted in the absence of any commercial or financial relationships that could be construed as a potential conflict of interest.
Publisher’s Note
All claims expressed in this article are solely those of the authors and do not necessarily represent those of their affiliated organizations, or those of the publisher, the editors and the reviewers. Any product that may be evaluated in this article, or claim that may be made by its manufacturer, is not guaranteed or endorsed by the publisher.
Acknowledgments
Our deepest gratitude goes to the reviewers and editors for their careful work and thoughtful suggestions that have helped improve this manuscript substantially.
Supplementary Material
The Supplementary Material for this article can be found online at: https://www.frontiersin.org/articles/10.3389/fevo.2022.859542/full#supplementary-material
References
Abutaleb, K., Mudede, M. K., Nkongolo, N., and Newete, S. W. (2020). Estimating urban greenness index using remote sensing data: A case study of an affluent vs poor suburbs in the city of Johannesburg. Egypt. J. Remote Sens. Space Sci. 24, 343–351. ejrs.2020.07.002 doi: 10.1016/j
Albarakat, R., and Lakshmi, V. (2019). Comparison of Normalized Difference Vegetation Index Derived from Landsat, MODIS, and AVHRR for the Mesopotamian Marshes Between 2002 and 2018. Remote Sens. 11:1245. doi: 10.3390/rs11101245
Chang, S. P., Wang, J., Zhang, F. F., Niu, L. W., and Wang, Y. T. (2020). A study of the impacts of urban expansion on vegetation primary productivity levels in the Jing-Jin-Ji region, based on nighttime light data. J. Clean. Prod. 263:121490. doi: 10.1016/j.jclepro.2020.121490
Chen, B., Nie, Z., Chen, Z., and Xu, B. (2017). Quantitative estimation of 21st-century urban greenspace changes in Chinese populous cities. Sci. Total Environ. 609, 956–965. doi: 10.1016/j.scitotenv.2017.07.238
Chen, C., Park, T., Wang, X. H., and Piao, S. L. (2019). China and India lead in greening of the world through land-use management. Nat. Sustainbil. 2, 122–129. doi: 10.1038/s41893-019-0220-7
FRAGSTATS (2022). FRAGSTATS 4.2. Available online at: https://fragstats.software.informer.com/4.2/ (accessed on October 22, 2021).
Gan, M. Y., Deng, J. S., Zheng, X. Y., Hong, Y., and Wang, K. (2014). Monitoring Urban Greenness Dynamics Using Multiple Endmember Spectral Mixture Analysis. PLoS One. 9:e112202. doi: 10.1371/journal.pone.0112202
Ge, W., Deng, L., Wang, F., and Han, J. (2021). Quantifying the contributions of human activities and climate change to vegetation net primary productivity dynamics in China from 2001 to 2016. Sci. Total Environ. 773:145648. doi: 10.1016/j.scitotenv.2021.145648
Gianelle, D., Vescovo, L., and Mason, F. (2009). Estimation of grassland biophysical parameters using hyperspectral reflectance for fire risk map prediction. Int. J. Wildl Fire 18, 815–824. doi: 10.1071/WF08005
Goetz, S. J. (1997). Multi-sensor analysis of NDVI, surface temperature and biophysical variables at a mixed grassland site. Int. J. Remote Sens. 18, 71–94. doi: 10.1080/014311697219286
Haase, D., Jänicke, C., and Wellmann, T. (2019). Front and back yard green analysis with subpixel vegetation fractions from earth observation data in a city. Landsc. Urban Plan. 182, 44–54. doi: 10.1016/j.landurbplan.2018.10.010
Hua, W., Chen, H., Zhou, L., Xie, Z., and Qin, M. (2017). Observational quantification of climatic and human influences on vegetation greening in China. Remote Sens. 9:425. doi: 10.3390/rs9050425
Huete, A., Didan, K., Miura, T., and Rodriguez, E. P. (2002). Overview of the radiometric and biophysical performance of the MODIS vegetation indices. Remote Sens. Environ. 83, 195–213. doi: 10.1016/S0034-4257(02)00096-2
Imhoff, M. L., Bounoua, L., DeFries, R., and Lawrence, W. T. (2004). The consequences of urban land transformation on net primary productivity in the United States. Remote Sens. Environ. 89, 434–443. doi: 10.1016/j.rse.2003.10.015
Jeong, S. J., Schimel, D., Frankenberg, C., and Drewry, D. T. (2017). Application of satellite solar-induced chlorophyll fluorescence to understanding large-scale variations in vegetation phenology and function over northern high latitude forests. Remote Sens. Environ. 190, 178–187. doi: 10.1016/j.rse.2016.11.021
Jiao, L., Xu, G., Xiao, F., Liu, Y., and Zhang, B. (2017). Analyzing the Impacts of Urban Expansion on Green Fragmentation Using Constraint Gradient Analysis. Profess. Geogr. 69, 553–566. doi: 10.1080/00330124.2016.1266947
Kumari, N., Srivastava, A., and Dumka, U. C. (2021). A Long-Term Spatiotemporal Analysis of Vegetation Greenness over the Himalayan Region Using Google Earth Engine. Climate 9:109. doi: 10.3390/cli9070109
Lamchin, M., Wang, S. W., Lim, C. H., and Ochir, A. (2020). Understanding global spatio-temporal trends and the relationship between vegetation greenness and climate factors by land cover during 1982–2014. Glob. Ecol. Conserv. 24, 1–17. doi: 10.1016/j.gecco.2020.e01299
Lee, M. H., Lee, S. B., Eo, Y. D., Kim, S. W., Woo, J. H., and Han, S. H. (2017). A comparative study on generating simulated landsat ndvi images using data fusion and regression method—the case of the korean peninsula. Environ. Monit. Assess. 189:333. doi: 10.1007/s10661-017-6034-z
Li, H., Chen, W., and He, W. (2015). Planning of Green Space Ecological Network in Urban Areas: An Example of Nanchang, China. Int. J. Environ. Res. Publ Health 12, 12889–12904. doi: 10.3390/ijerph121012889
Li, X. C., Gong, P., Zhou, Y. Y., and Wang, J. (2020). Mapping global urban boundaries from the global artificial impervious area (GAIA) data. Environ. Res. Lett. 15:094044. doi: 10.1088/1748-9326/ab9be3
Liu, H., Deng, Y., and Liu, X. Q. (2021). The contribution of forest and grassland change was greater than that of cropland in human-induced vegetation greening in China, especially in regions with high climate variability. Sci. Total Environ. 792:148408. doi: 10.1016/j.scitotenv.2021.148408
Lu, Y., Coops, N. C., and Hermosilla, T. (2017). Estimating urban vegetation fraction across 25 cities in pan-Pacific using Landsat time series data. ISPRS J. Photogr. Remote Sens. 126, 11–23. doi: 10.1016/j.isprsjprs.2016.12.014
McGarigal, K., Cushman, S. A., Neel, M. C., and Ene, E. (2002). FRAGSTATS: Spatial Pattern Analysis Program for Categorical Maps (Computer Software Program). Amherst, MA: University of Massachusetts.
McNamee, K. (2009). “From wild place to endangered spaces: a history of Canada’s national parks,” in Parks and Protected Area Management in Canada: Planning and Management, 2nd Edn, eds P. Dearden and R. Rollins (Toronto: Oxford University).
Ministry of Housing and Urban-Rural Development of the People. (2020). Republic of China. Available online at: http://www.mohurd.gov.cn/ (accessed on July 11, 2021)
MODIS (2021). MODIS/Terra Vegetation Indices 16-Day L3 Global 250 m SIN Grid. Available online at: https://lpdaac.usgs.gov/products/mod13q1v006/ (accessed on July 11, 2021).
Piao, S., Wang, X., Park, T., and Chen, C. (2019). Characteristics, drivers and feedbacks of global greening. Nat. Rev. Earth Environ. 1, 1–14. doi: 10.1038/s43017-019-0001-x
Qian, Y., Zhou, W., Li, W., and Han, L. (2015). Understanding the dynamic of greenspace in the urbanized area of Beijing based on high resolution satellite images. Urban Forest. Urban Green. 14, 39–47. doi: 10.1016/j.ufug.2014.11.006
Resource and Environment Science and Data Center (2020). Resource and Environment Science and Data Center, Chinese Academy of Sciences. Available online at: https://www.resdc.cn/ (accessed on July 11, 2021)
Shadmani, M., Marofi, S., and Roknian, M. (2012). Trend analysis in reference evapotranspiration using Mann-Kendall and Spearman’s rho tests in arid regions of Iran. Water Resour. Manag. 26, 211–224. doi: 10.1007/s11269-011-9913-z
Sun, J., Wang, X., Chen, A., Ma, Y., Cui, M., and Piao, S. (2011). NDVI indicated characteristics of vegetation cover change in China’s metropolises over the last three decades. Environ. Monit. Assess. 179, 1–14. doi: 10.1007/s10661-010-1715-x
Tan, P. Y., Wang, J., and Sia, A. (2013). Perspectives on five decades of the urban greening of Singapore. Cities 32, 24–32. doi: 10.1016/j.cities.2013.02.001
Tong, A., and He, Y. (2013). Comparative analysis of SPOT, Landsat, MODIS, and AVHRR normalized difference vegetation index data on the estimation of leaf area index in a mixed grassland ecosystem. J. Appl. Remote Sens. 7, 209–217. doi: 10.1117/1.JRS.7.073599
Torrens, P. M. (2011). Calibrating and Validating Cellular Automata Models of Urbanization. Hoboken, NJ: Wiley.
United Nations [UN] (2016) United Nations. Available online at: https://www.un.org/sustainabledevelopment/cities/ (accessed on Dec 16, 2021)
Urban Boundaries Datasets (2020). Urban boundaries datasets. Available online at: http://data.ess.tsinghua.edu.cn (accessed on July 11, 2021)
Wang, H., Yan, S. J., Liang, Z., and Jiao, K. W. (2021). Strength of association between vegetation greenness and its drivers across China between 1982 and 2015: Regional differences and temporal variations. Ecol. Indic. 128:107831. doi: 10.1016/j.ecolind.2021.107831
Wang, J., Zhou, W., Qian, Y., Li, W., and Han, L. (2018). Quantifying and characterizing the dynamics of urban greenspace at the patch level: A new approach using object-based image analysis. Remote Sens. Environ. 204, 94–108. doi: 10.1016/j.rse.2017.10.039
Wu, H., Soh, L. K., Samal, A., and Chen, X. H. (2008). Trend analysis of streamflow drought events in Nebraska. Water Resour. Manag. 22, 145–164. doi: 10.1007/s11269-006-9148-6
Wu, S. H., Yang, Q. Y., and Zheng, D. (2003). Delineation of eco-geographic regional system of China. J. Geograph. Sci. 13, 309–315. doi: 10.1007/bf02837505
Wu, Z., Chen, R., Meadows, M. E., Sengupta, D., and Xu, D. (2019). Changing urban green spaces in Shanghai: trends, drivers and policy implications. Landsc. Use Policy 87:104080. doi: 10.1016/j.landusepol.2019.104080
Yang, J., Huang, C., Zhang, Z., and Wang, L. (2014). The temporal trend of urban green coverage in major Chinese cities between 1990 and 2010. Urban Forest. Urban Green. 13, 19–27. doi: 10.1016/j.ufug.2013.10.002
Yang, K., Sun, W. Z., Luo, Y., and Zhao, L. (2021). Impact of urban expansion on vegetation: the case of china (2000–2018). J. Environ. Manag. 291:112598. doi: 10.1016/j.jenvman.2021.112598
Yao, R., Wang, L. C., Huang, X., Chen, X. X., and Liu, Z. J. (2019). Increased spatial heterogeneity in vegetation greenness due to vegetation greening in mainland China. Ecol. Indicat. 99, 240–250. doi: 10.1016/j.ecolind.2018.12.039
Zhang, X., Xiong, Z., Zhang, X., and Shi, Y. (2017). Simulation of the climatic effects of land use/land cover changes in eastern China using multi-model ensembles. Global Planet. Change 154, 1–9. doi: 10.1016/j.gloplacha.2017.05.003
Zhang, X. L., and Huang, X. R. (2019). Human disturbance caused stronger influences on global vegetation change than climate change. PeerJ. 7:e7763. doi: 10.7717/peerj.7763
Zhao, J., Chen, S., Jiang, B., Ren, Y., Wang, H., and Vause, J. (2013). Temporal trend of green space coverage in China and its relationship with urbanization over the last two decades. Sci. Total Environ. 442, 455–465. doi: 10.1016/j.scitotenv.2012.10.014
Zhao, S. Q., Liu, S. G., and Zhou, D. C. (2016). Prevalent vegetation growth enhancement in urban environment. Proc. Natl. Acad. Sci. U.S.A. 113, 6313–6318. doi: 10.1073/pnas.1602312113
Zhao, X., Zhou, D., and Fang, J. (2012). Satellite-based studies on large-scale vegetation changes in China. J. Integr. Plant Biol. 54, 713–728. doi: 10.1111/j.1744-7909.2012.01167.x
Zhong, Q., Ma, J., Zhao, B., and Wang, X. (2019). Assessing spatial-temporal dynamics of urban expansion, vegetation greenness and photosynthesis in megacity Shanghai, China during 2000-2016. Remote Sens. Environ. 233:111374. doi: 10.1016/j.rse.2019.111374
Zhou, W., Pickett, S. T. A., and Cadenasso, M. L. (2017). Shifting concepts of urban spatial heterogeneity and their implications for sustainability. Landsc. Ecol. 32, 15–30. doi: 10.1007/s10980-016-0432-4
Zhou, X., and Wang, Y. (2011). Spatial-temporal dynamics of urban green space in response to rapid urbanization and greening policies. Landsc. Urban Plan. 100, 268–277. doi: 10.1016/j.landurbplan.2010.12.013
Zhu, Z. C., Piao, S. L., Myneni, R. B., and Huang, M. T. (2016). Greening of the Earth and its drivers. Nat. Clim. Change 6, 791–795. doi: 10.1038/Nclimate3004
Appendix

Table A1. Temperature zones.
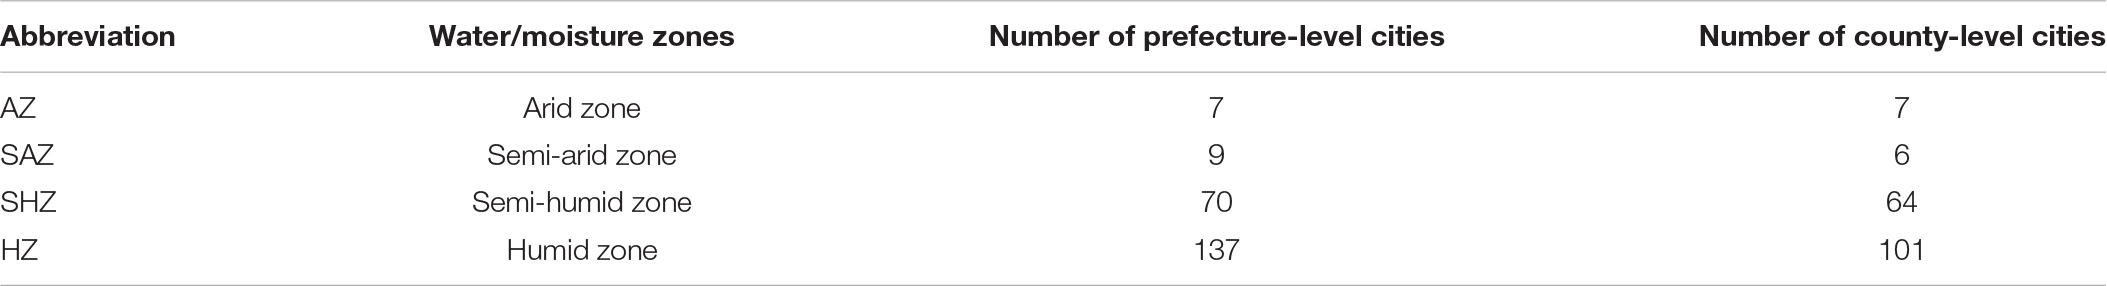
Table A2. Water/moisture zones.

Table A3. All data sets used and their sources.
Keywords: urban greening, urban expansion, landscape metrics, artificial impervious area, enhanced vegetation index
Citation: He B, Huang D, Kong B, Liu K, Zhou C, Sun L and Ning L (2022) Spatial Variations in Vegetation Greening in 439 Chinese Cities From 2001 to 2020 Based on Moderate Resolution Imaging Spectroradiometer Enhanced Vegetation Index Data. Front. Ecol. Evol. 10:859542. doi: 10.3389/fevo.2022.859542
Received: 21 January 2022; Accepted: 28 February 2022;
Published: 08 April 2022.
Edited by:
Hua-Feng Wang, Hainan University, ChinaReviewed by:
Guangrong Shen, Shanghai Jiao Tong University, ChinaJingli Yan, Shanghai Jiao Tong University, China
Copyright © 2022 He, Huang, Kong, Liu, Zhou, Sun and Ning. This is an open-access article distributed under the terms of the Creative Commons Attribution License (CC BY). The use, distribution or reproduction in other forums is permitted, provided the original author(s) and the copyright owner(s) are credited and that the original publication in this journal is cited, in accordance with accepted academic practice. No use, distribution or reproduction is permitted which does not comply with these terms.
*Correspondence: Bo Kong, a29uZ2JvODI3QGltZGUuYWMuY24=; Liqun Sun, bHEuc3VuQHNpYXQuYWMuY24=