- 1State Key Laboratory of Estuarine and Coastal Research, Institute of Eco-Chongming, East China Normal University, Shanghai, China
- 2Yangtze Delta Estuarine Wetland Ecosystem Observation and Research Station, Ministry of Education and Shanghai Science and Technology Committee, Shanghai, China
Restoring degraded and damaged salt marshes has become an important initiative in the coastal wetlands management around the world. Evaluating the economic output of salt marsh restoration is of great significance for identifying the current state of knowledge gaps related to conservation activities and economic benefits. To address this question, we conducted an overview of global salt marsh restoration projects, and their financial expenses and restoration benefits in the past 40 years. The results showed that most of the saltmarsh restoration projects are near megacities and larger rivers, and restoration techniques of different regions depend on the types of disturbance factors such as climate change, extreme weather events, and land use change. With limited resources, fund allocation between protected areas and unprotected areas in middle-income countries is often unbalanced, indicating a mismatch between conservation efforts and regional needs. Although restoration projects are expensive, the evidence in this article implies that most salt marsh restoration projects could recover their financial expense in the finite time, especially for large-scale restoration activities. Besides, the great carbon sequestration potential would make salt marsh restoration projects more profitable under current efforts to promote carbon sequestration for combating global warming.
Introduction
Coastal salt marshes usually occur in the intertidal zone of moderate to low-energy shorelines along estuaries, bays, and tidal rivers and have characteristics of both marine and terrestrial environments (Broome et al., 1988; Doody, 2008). They sustain a rich, dynamic, and productive ecological zone that plays an important role in biological diversity and human welfare (Mitsch and Gosselink, 2015). They not only provide abundant resources for production and daily life but also serve as nursery and shelter places for numerous species, including benthic fauna, fish, and migratory birds. Moreover, they provide a significant number of vital ecosystem services, including water purification, flooding mitigation, carbon sinks, climate stabilization, nutrient cycling, and coastal protection, and socioeconomic benefits (e.g., sightseeing and tourism, recreation, education, and research spaces; Barbier et al., 2011; Tang et al., 2018; Stewart-Sinclair et al., 2020). Although salt marshes occupied relatively small geographical space, less than 1% of the earth’s surface area, the economic value generated from related ecosystem services, culture, and employment was estimated around US$ 8,722 billion/year, approximately 29% of the global coastal wetland value of each year (Costanza et al., 2014; The United Nations Ocean Conference, 2017; Li et al., 2018).
Despite their importance, salt marshes were still under enormous pressure and disappeared at an unpredictable speed in the global scale (Scott et al., 2014). Triggered by climate change, sea level rise, and extreme weather events and disturbed by urbanization expansion and intensive human activities, 20–50% of salt marshes were predicted to be either lost or degraded during the current century (Barbier et al., 2011; Kirwan and Megonigal, 2013). Salt marsh degradation and loss have induced declinations in ecosystem resilience and biodiversity, which lead to the reduction of supporting ability and collapse of maintaining ability (Koch et al., 2009; DeLaune and White, 2012). Eventually, those processes would have an adverse effect on environmental and economic benefits. Even without considering other ecosystem services’ loss, the annual economic loss of carbon emissions caused by the loss and degradation of salt marshes can reach US$ 6.4–97 million (Coverdale et al., 2014). In this context, salt marsh rehabilitation and restoration is an effective initiative to stop further degradation process and to restore the integrity, health, and sustainability of the degraded salt marsh ecosystem (Saintilan, 2013; Adam, 2019), especially in areas where natural recovery is relatively slow or facing biological or physical obstacles (Society for Ecological Restoration, 2004). Some successful salt marsh ecological restoration projects have been conducted around the world, such as the San Francisco Bay, the Gulf of Mexico, the Bay of Fundy, and the Yangtze River Estuary (Cornelisen, 1998; Roman and Burdick, 2012; Liu et al., 2016). These projects generated numerous environmental, economic, and social benefits, such as increase of ecosystem services, conservation of biodiversity, supplying of products, and jobs creation. For example, the report from the Restore America’s Estuaries website1 gave a message that coastal habitat restoration work in the Chesapeake Bay, the Great Lakes, and Everglades boosted US$ 4.3 billion economic output and supported more than 3,200 jobs (Restore America’s Estuaries, 2011).
Although salt marsh restoration projects reinforce ecosystem function and generate relatively high benefits, people still pay less attention to salt marsh restoration and wrongly consider them as “net-cost” projects based on inadequate analysis (De Groot et al., 2013; Secretariat of the Convention on Biological Diversity, 2020). The cost of ecological restoration is relatively expensive, ranging from tens of thousands of dollars (for seagrass, salt marsh, and mangrove) to millions (for coral reefs; Spurgeon, 1999; Bullock et al., 2011). The high up-front cost and long-term nature of investment cannot match investors’ desire for liquidity and might reduce their investment interests (Wainaina et al., 2020). However, some studies posed new evidence and suggested that salt marsh restoration projects were profitable (Mok, 2019; Taillardat et al., 2020). Besides, salt marshes and mangroves play an important role in keeping coastlines stable and could considerably reduce coastal infrastructure costs, which might make restoration engineering and sustainable management of marine ecosystems more economical (Hochard et al., 2019; van Zelst et al., 2021).
There is very substantial literature about salt marsh restoration and rehabilitation technologies and methods, restoration result evaluation indicators and their framework, and their application and accounting for specific sites, including reviews of them (Adam, 2019). However, interdisciplinary research among restoration ecology, society, and economy is lacking. While Spurgeon (1999) and Bayraktarov et al. (2016) had carried out some surveys about the cost and benefit of restoration, they focused on different marine and coastal ecosystems. Similarly, Su et al. (2021) analyzed the cost and benefit of mangrove restoration. But there have been few studies on salt marsh ecosystem restoration projects’ cost and benefit at a global scale. Furthermore, the location preference (i.e., bias) phenomenon or mismatches between conservation efforts and regional demands might occur during restoration because of limited resources, invalid communication, lack of adaptive management, and weak links between conservation science and practice, among other reasons (Zhang et al., 2018). In fact, mismatches between restoration efforts and needs had been well documented in coral reefs, avian conservation, amphibians, and other conservation actions (Lawler et al., 2006; Fisher et al., 2011). Besides, although the number of marine-protected areas has increased over the past decade, the levels of protection investment of “areas of importance for ecosystem services” have not been effectively studied (United Nations Environment Programme -World Conservation Monitoring Centre et al., 2018).
Actually, the theoretical framework among ecological restoration goals, restoration technologies and methods, restoration projects’ cost, and ecological policies should be better tailored to overcome people’s prejudice about salt marsh restoration (Blignaut et al., 2013). Economic evaluation of restoration projects should be interpreted cautiously to determine if similar mismatches exist in salt marsh restoration activities. Further analysis of salt marsh restoration is necessary for us to understand the relationship between restoration projects’ attributes and budget. Therefore, we conducted a systematic literature review to better identify knowledge gaps related to conservation activities and economic benefits, which was critical to improve practice and justify further investment in salt marsh restoration. We assessed the distribution, protection status, geographical area, duration, disturbance factors, techniques, cost, and outcome in relation to different restoration projects, to address the following three questions:
1. What are the spatial and temporal characteristics of global salt marsh restoration projects, as well as disturbance factors and restoration techniques and their changing patterns?
2. According to the financial cost of different restoration projects, is there a mismatch existing between conservation fund allocation and regional ecological service supplication?
3. How long might it take for salt marsh restoration projects to pay for themselves? What is the impact of carbon ecosystem services and types of ecosystem services on this outcome?
Methods
Literature Collection
We searched the peer-reviewed literature to identify quantitative studies about the economic costs and benefits of salt marsh restoration. In the first step, we first searched using the title search term “salt marsh,” “ecosystem restoration,” “ecological rehabilitation,” and “coastal restoration” or their combination in the Google Scholar, Web of Science (WOS), and China National Knowledge Infrastructure (CNKI) online version database, respectively. Our search period is mainly focused from 1980 to 2001. After removing invalid, irrelevant, and repetitive articles, we did further screening according to the abstract and preliminarily obtained 232 relevant articles. We updated other restoration projects’ data and supplemented additional useful information of all restoration projects by browsing governments’ ecological and environmental department websites, non-profit organizations’ websites, and influential ecological protection websites’ databases. We also looked through relevant physical books, conference reports, and other “gray materials.” Some effective messages, such as citations and personal communications, enabled us to figure out the connection of diverse information sources. According to the international principles and standards of ecological restoration practice proposed by Gann et al. (2019), the ecological restoration projects and experiments included in our analysis should meet some specific standards. We modified them for following practical reasons: (1) Stakeholders participation, (2) many types of knowledge used for ecological restoration, (3) a reference system, and (4) clear indicators for ecological assessment and restoration. For this study, 133 primary studies that had feasible economic data finally met the above criteria.
Restoration Cost and Benefit Data
As for the restoration cost, to eliminate the impact of inflation and regional disparity, we used consumer price index (CPI), purchasing power parity (PPP), and discount rate (DIS) to convert all value data into 2020 (base year). The calculation methods of three indices were derived from Hanley and Black (2006); Bayraktarov et al. (2016), and Wei et al. (2018). More details are shown in the Supplementary material. A discount rate reflects a society’s relative valuation on today’s wellbeing versus wellbeing in the future. Since small changes in the discount rate would have a great influence on future benefits, huge errors might occur by roughly applying one or several discount rates to all restoration projects (Hanley et al., 2009). Therefore, we summarized the corresponding countries’ discount rates (Table 1) and applied the exact value according to every restoration projects’ reference year. We assumed a constant discount rate of 4.7% (value of 1978–2017) for the years after 2017 for the United States as relevant data are unavailable during this period. Similarly, the discount rate of China is 4.5% after 2011. All restoration projects were divided into two categories, namely, completed projects and ongoing projects. The completed projects’ reference year used for monetary converting was chosen according to the following priority order: (1) funding year, (2) project year, (3) data collection year, and (4) publication year minus one. In contrast, those unfinished projects’ reference year selection method was much easier. We defined all of them as 2021. All economic data were derived from the National Bureau of Statistics of China2 and the World Bank website3.
We recorded every sites’ monetary value generated from restoration action. In addition, we replenished extra benefit data from the latest ESVD database (Ecosystem Service Value database, 2020) developed by De Groot et al. (2012). Every benefit value of the ESVD database was assigned to geographically overlapping or adjacent restoration sites through spatial analysis. Using the same way, further supplementary benefit data were obtained from official reports, monitoring data documents, and other relevant information. Detailed gray information sources are also available in the Supplementary Material. As mentioned above, benefit value data were also converted into 2020 to ensure data consistency. Finally, we calculated how many years were needed for the restoration projects to recover their cost (ty) with the following equation:
In this equation, the symbol “i” represented the discount rate of each country in different periods. Cost2020$ and Benefit2020$ represented the total cost and benefit of the restoration project in 2020.
Since most selected studies do not have valid monitoring and running cost data, we assumed that all restoration projects in this research did not need human actively interfering and managing after restoration activities. This meant the monitoring and running cost was excluded from the calculation of ty for simplification. Besides, due to the lack of the carbon sequestration benefit in most restoration projects, we also applied the simple and empirical model proposed by Burden et al. (2019, Figure 1f) to replenish these restoration projects’ new carbon stock situation after 2020. An open-access software called GetData Graph Digitizer was used to obtain data from the graph. The carbon price range was $ 5–30/t CO2 e, taking into account current carbon prices in compliance and voluntary markets across the world (Mok, 2019). So, $ 5/t CO2 e was supposed to be a low-carbon value, while $ 30/t CO2 e was regarded as a high-carbon value in this study. We calculated ty of restoration sites based on three different benefit data evaluations (i.e., original, high-carbon value, and low carbon) to assess salt marsh carbon sequestration potential value contribution under a warmer climate.
Analysis
Apart from the cost and benefit data of salt marsh restoration projects, geographical location, disturbance reasons, actions, and outcomes were also included in the analysis. For experimental restoration projects with multiple restoration sites and different cost data, every site was regarded as a single study when doing a cost-benefit analysis. But when we counted other information frequency, including degradation factor, restoration technologies, and generated ecosystem services, we regarded all restoration sites of an experimental restoration project as a study, since there was usually a strong similarity among different sites. We also combined the Ramsar wetland website4 and Protected planet website5 data to evaluate every single site protection situation for spatial analysis. Salt marshes areas with human management and conservation, such as ecological reserves, marine parks, and national wetlands, were all defined as “protected” status in this article, while other salt marshes were defined as “unprotected” status. In this article, we assumed that protected areas represent areas where restoration efforts and resources are concentrated, which generally have a higher restoration priority than non-protected areas.
Results
Distribution of Restoration Projects
A total of 117 studies with reasonable data were incorporated into our spatial analysis. Compared with Africa and Europe, North America and Asia had more restoration projects data publicly available, similar to Zhang et al. (2018). As shown in Figure 1, global salt marsh restoration projects had an obvious spatial distribution pattern. Most of the restoration projects were concentrated in the San Francisco Bay, the Gulf of Mexico, and Maine Bay in the United States, Yangtze Estuary in China, and the New South Wales region of Australia. The distribution of high-density value of restoration sites was adjacent to larger rivers (i.e., Mississippi and Yangtze River) and megacities (i.e., New York, Sydney, and Shanghai). This pattern reflected that intensive human activities and rapid economic development may accelerate the transformation of salt marsh and the degradation process of this ecosystem, which in turn induces intensive restoration activities in the later period. A further issue that emerged from the data was that salt marsh restoration activities dominated by people might have an evident location preference, with emphasis on those degradation areas used to sustain high ecosystem services and have a strong influence on surrounding residents.
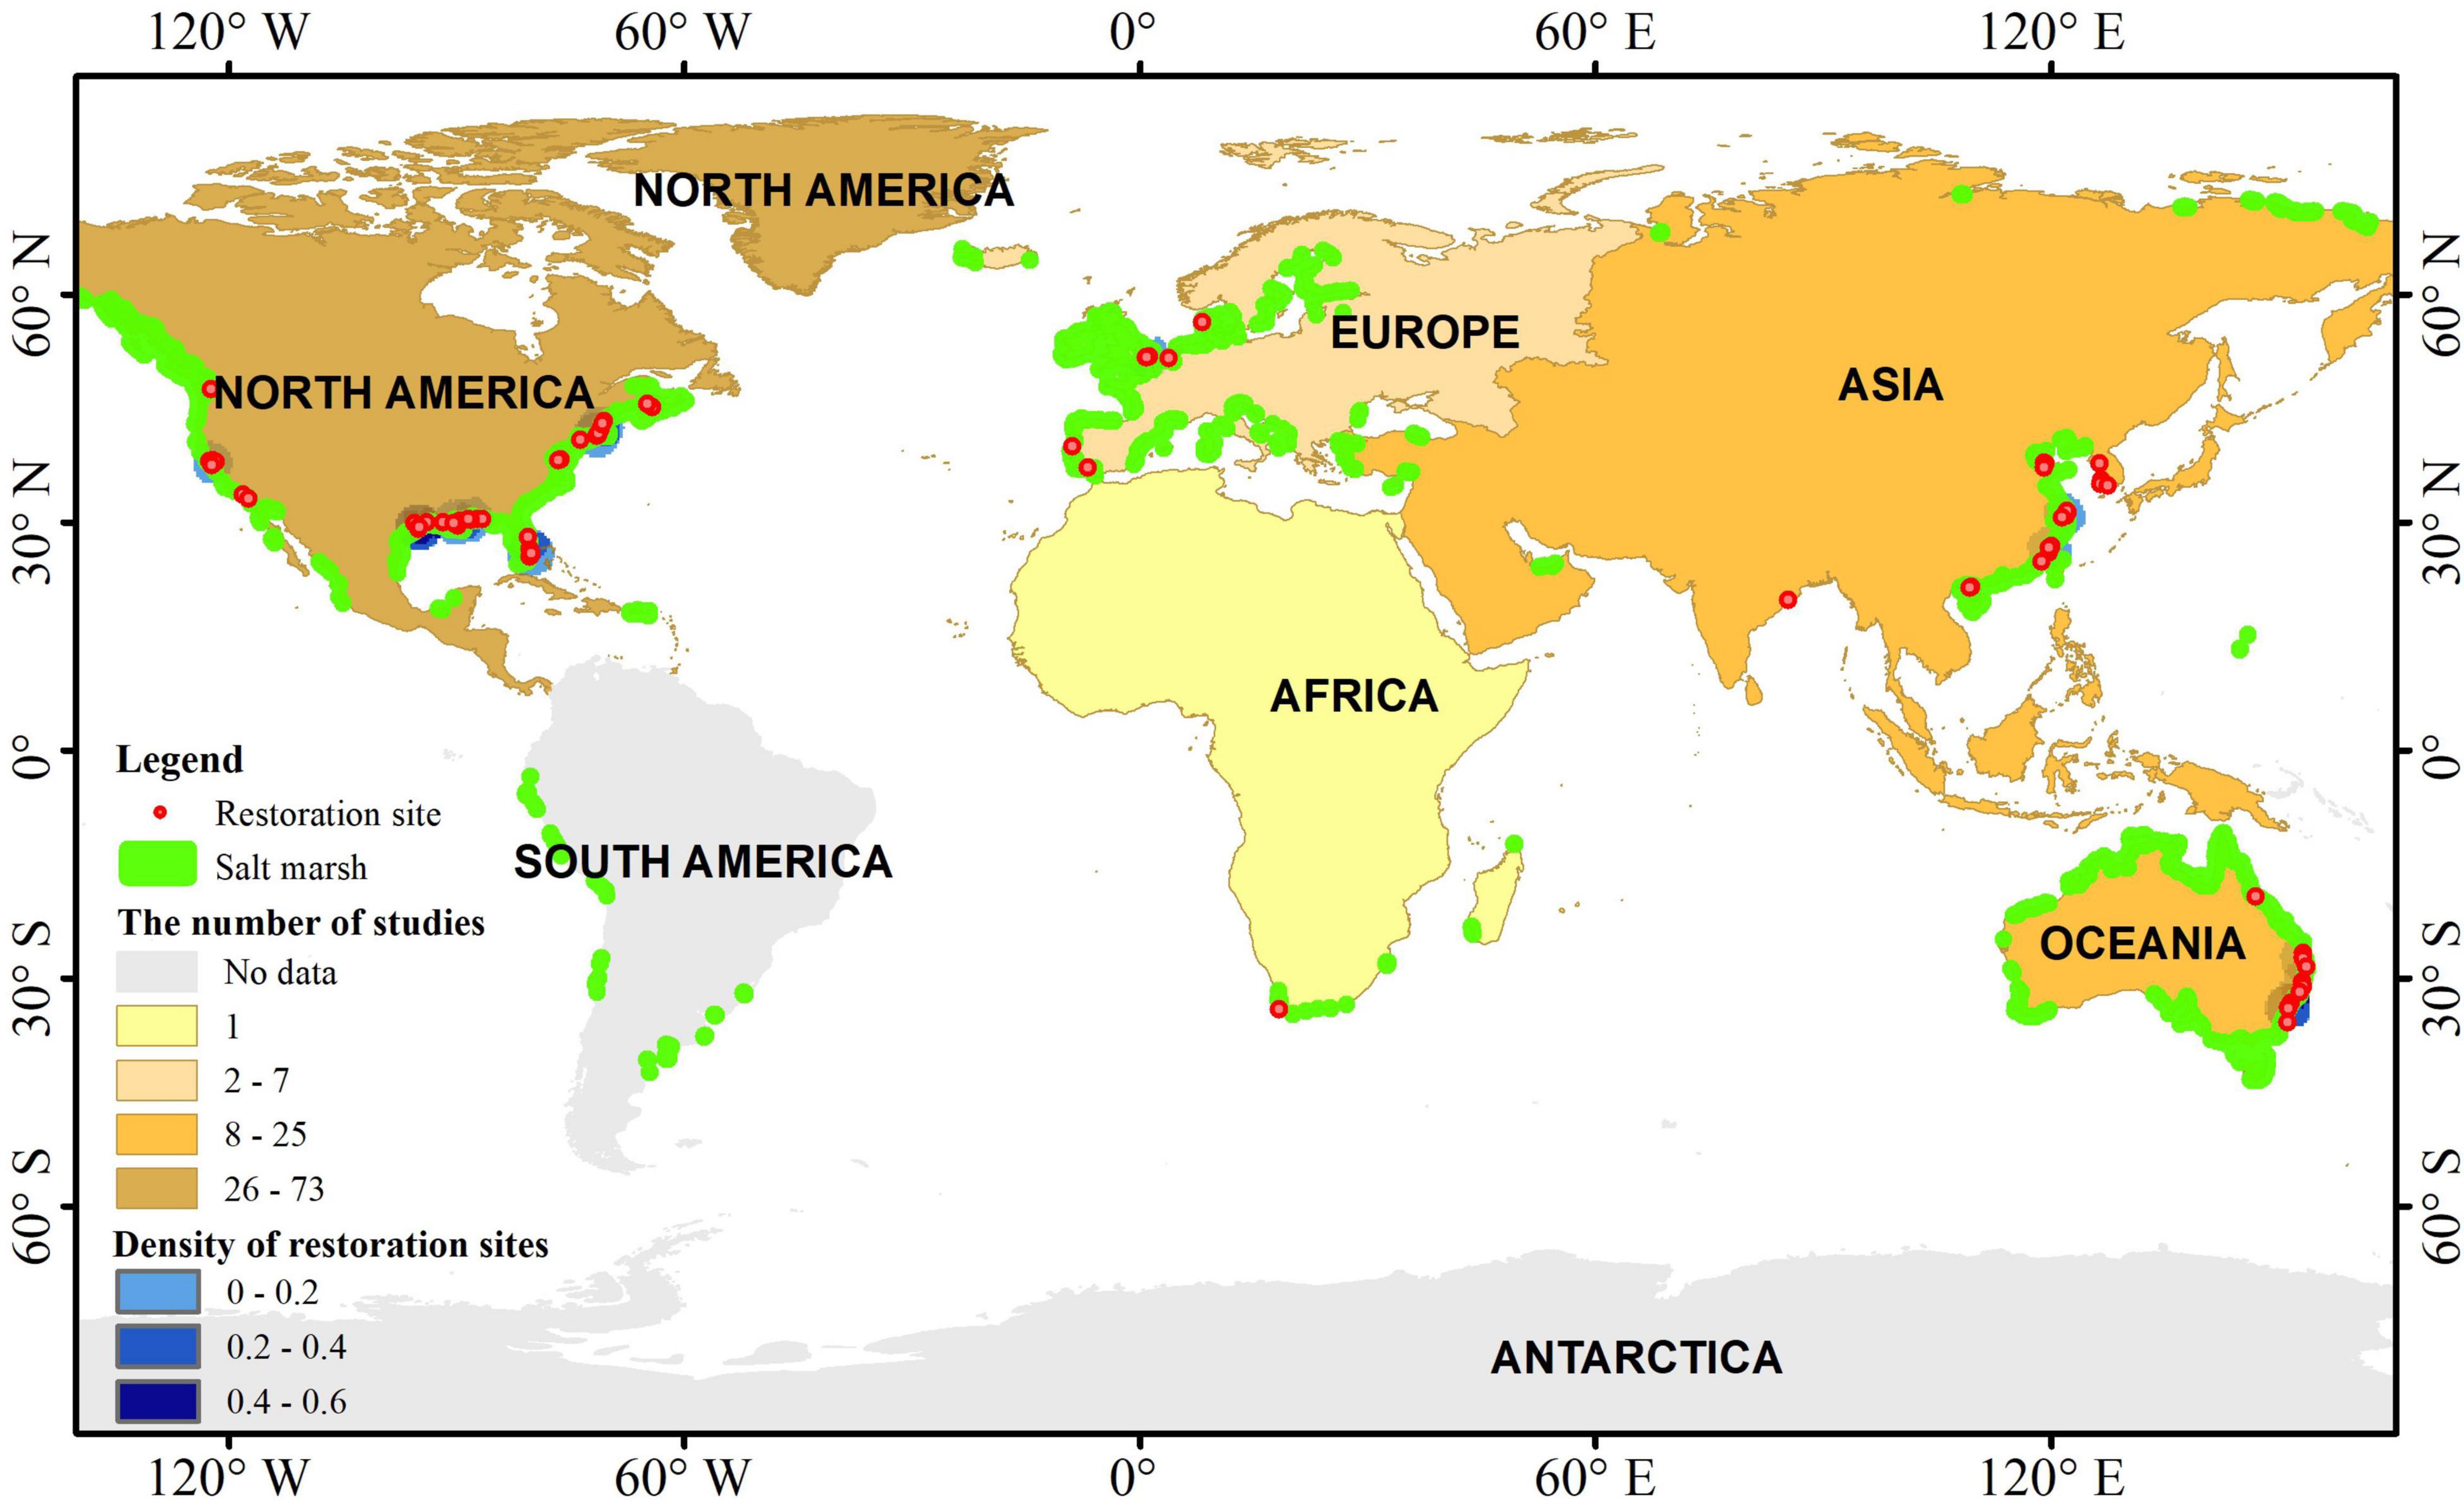
Figure 1. Spatial distribution of the global salt marsh ecological restoration projects used for this study.
There was a surge of restoration projects during the period of 1990–2000 and 2013–2021 around the world (Figure 2). Not only the number of restoration studies showed an obvious upward trend between 1990 and 2000 but also the cumulative restoration area and cost increased rapidly. This reflected that intensive and large-scale restoration projects were carried out during this period, and people’s investment enthusiasm was gradually ramping up, but it dropped down in the next decade. Although the cumulative cost was gradually climbing during the period from 2001 to 2012, the cumulative restoration area remained virtually unchanged. The number of restoration studies in North America dropped, while the number of restoration studies grew in Asia and Oceania, despite of fluctuation. Fluctuations of the number of restoration studies in North America might have a relationship with the global financial crisis that happened in 2008 because a recent study verified the relationship between gross domestic product (GDP) and the number of salt marsh restoration projects in the United States (Li et al., 2019). From 2013, the cumulative total cost started to dramatically increase till 2021. This meant that the government and people began to understand the importance of salt marsh ecosystem protection. For example, the Chinese State Council issued a public announcement to strictly control coastal wetlands reclamation in 2018 (Gu et al., 2018). Besides, heavy disasters also accelerated wetland legislation processes and salt marsh restoration and creation projects in disaster-stricken areas. After Hurricane Sandy devastated the New England area in 2012, the United States government allocated funds to salt marsh restoration projects in Rhode Island to improve the resistance in coastal and estuarine areas. The growth of salt marsh restoration projects in recent years would deliver a positive signal to ecological scientists and conservationists and encourage their work, especially when we started the “UN Decade on Ecosystem Restoration” (2021–2030; Waltham et al., 2020).
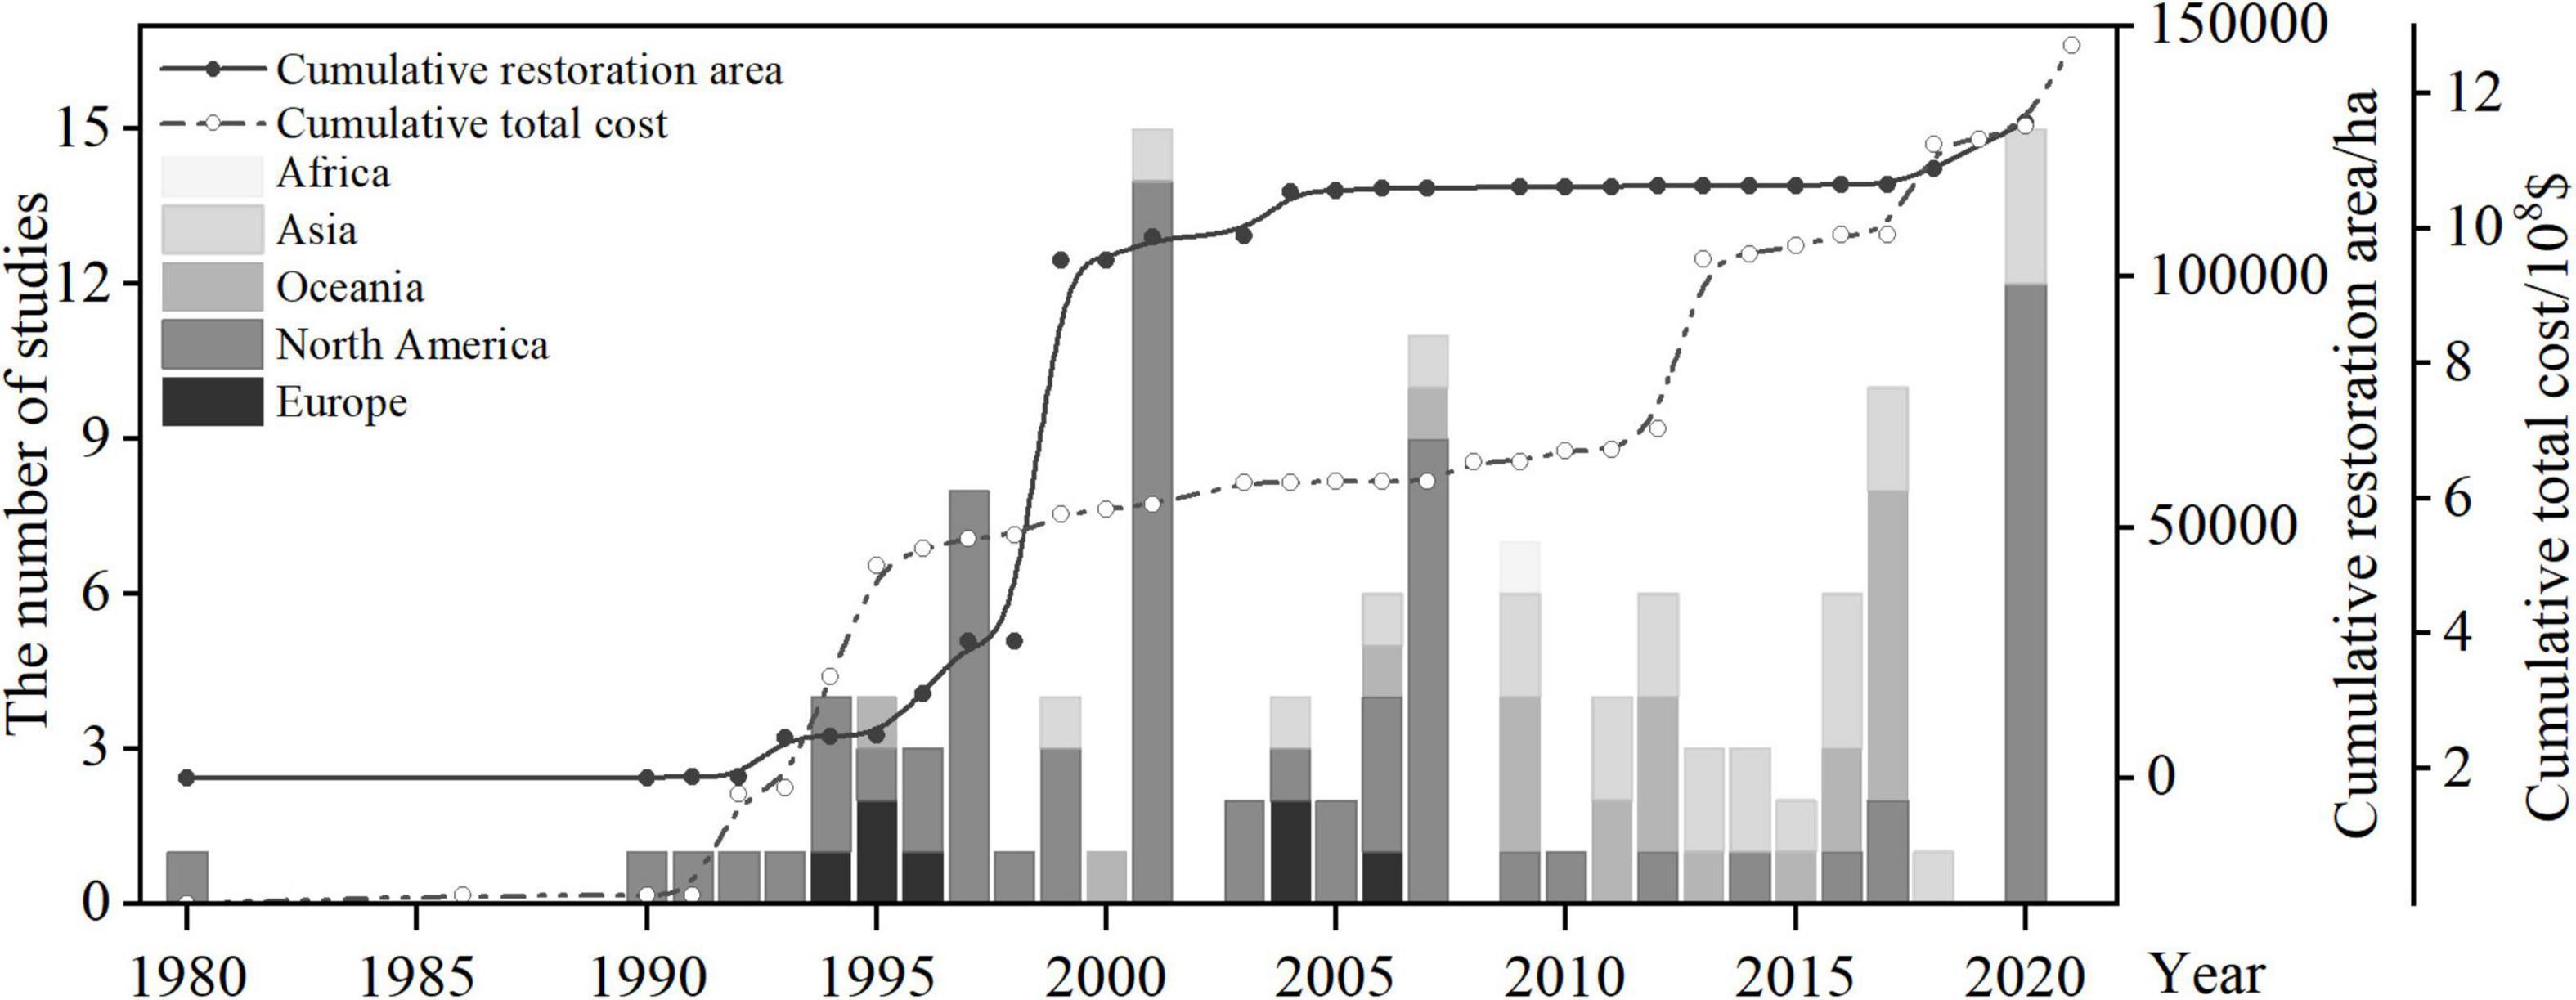
Figure 2. Temporal distribution of the global salt marsh ecological restoration projects used for this study.
Degradation Factors and Restoration Methods
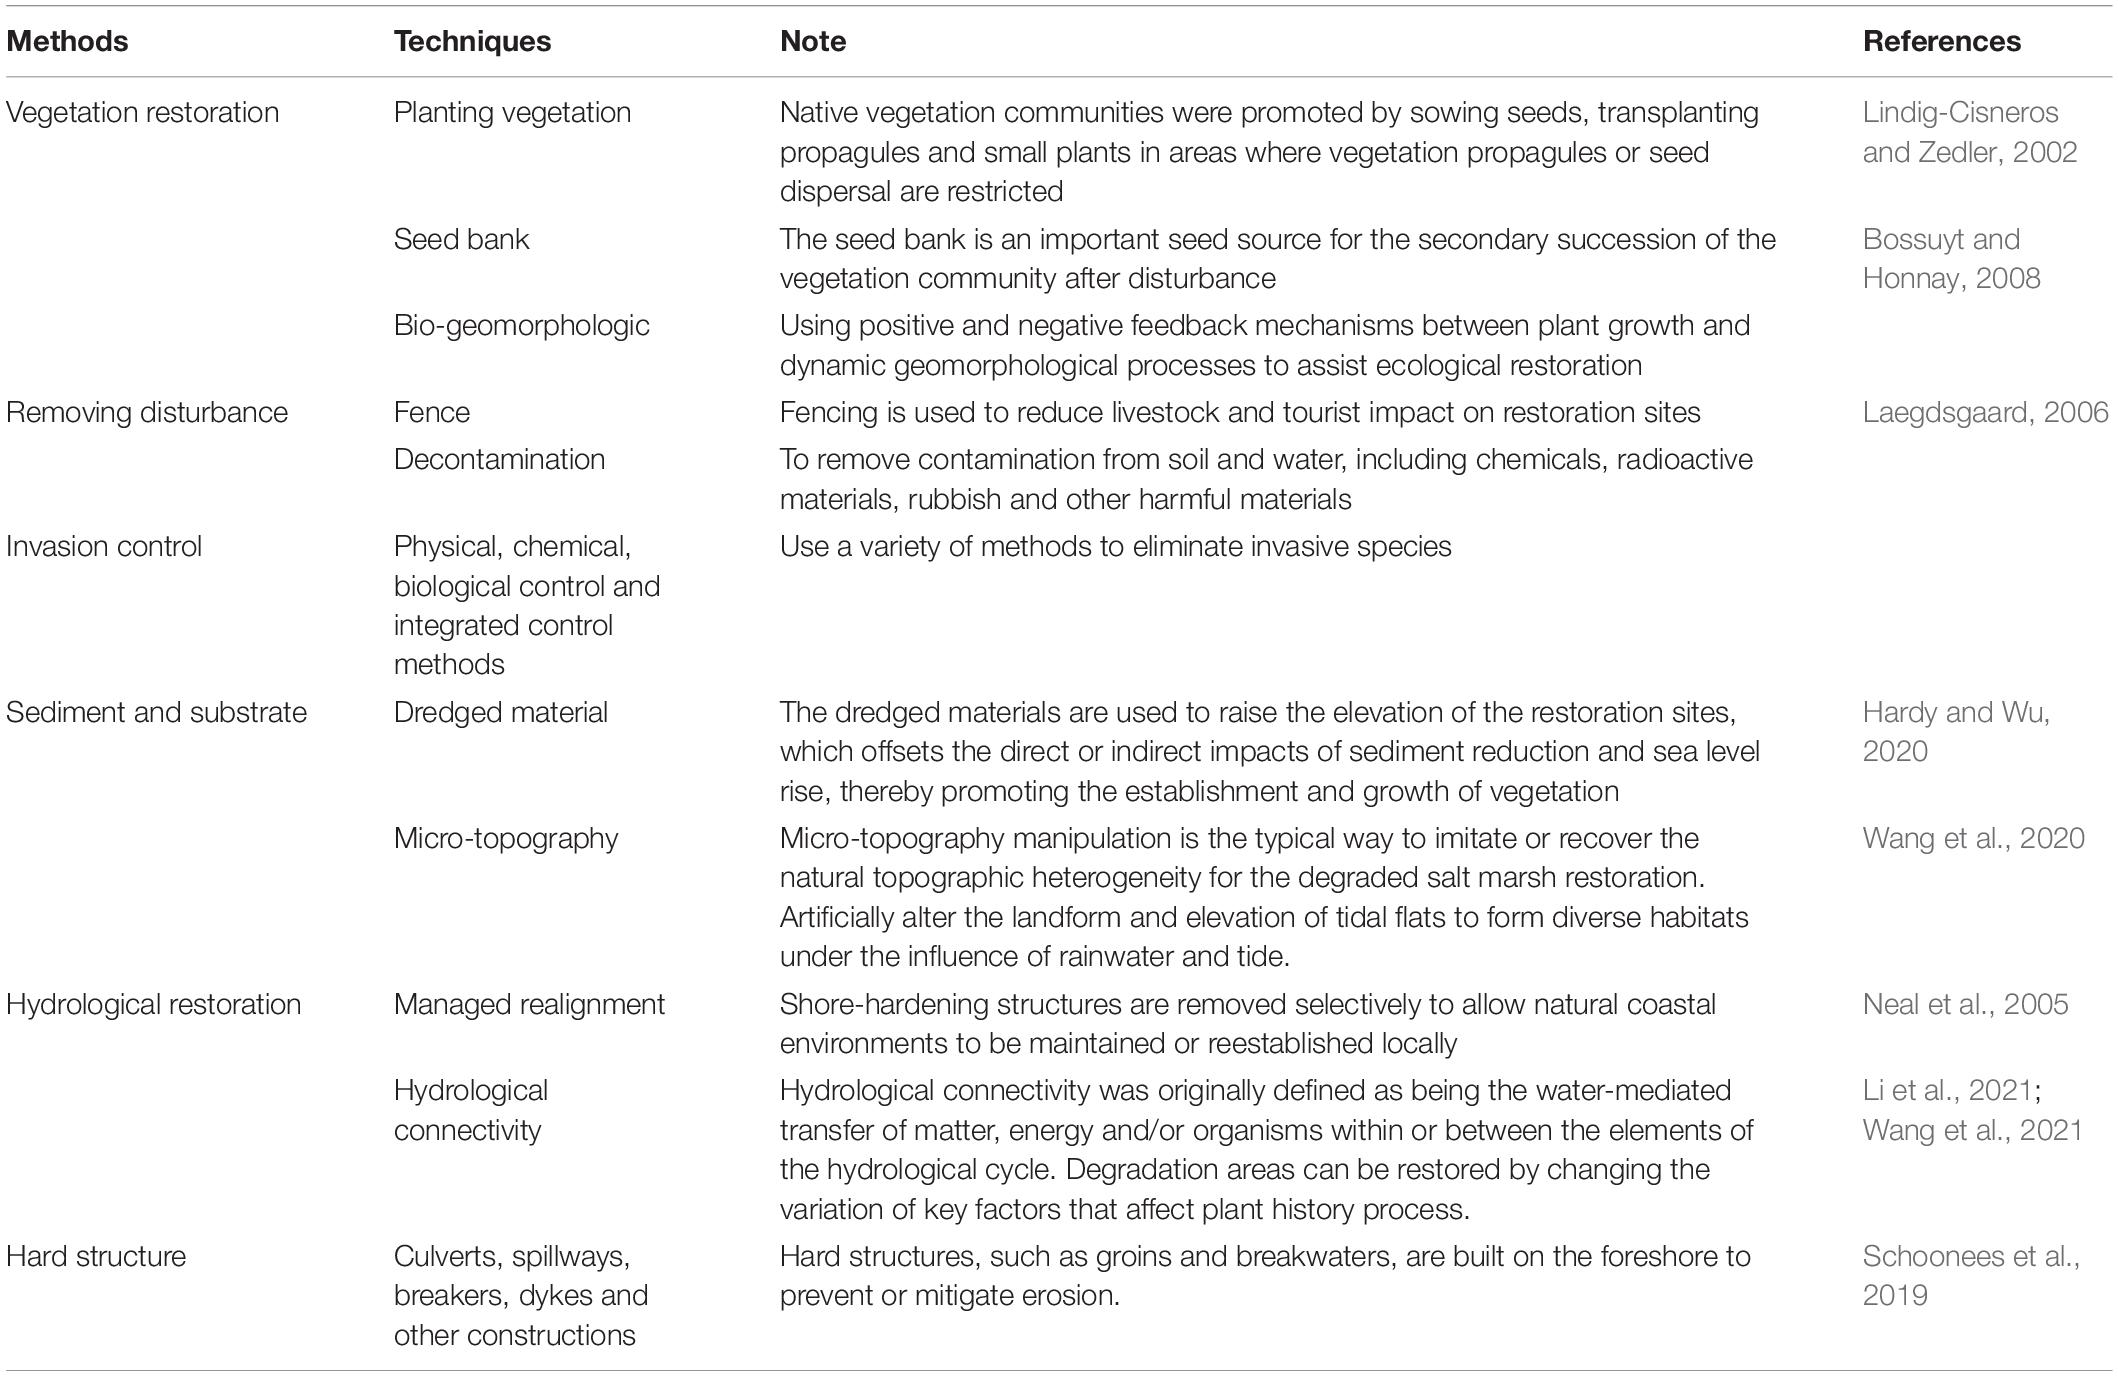
We also collected other useful information about restoration projects for analysis. Table 2 showed more details about restoration methods that were used in this study. With regard to disturbance and stress factors, different continents shared some common characteristics. Obviously, extreme weather events and climate change were the main physical stress factors to induce salt marshes’ ecosystem degradation and loss in the five continents. Marshland conversion affected by human activities, such as enclosure, aquaculture, and urbanization, were the dominant anthropogenic factors for the loss of salt marshes (Figure 3A). The number of studies reported about dams and hydrology change in North America was significantly different from other continents. The United States used to consider salt marsh as mosquito nurseries and thus carried out long-term and massive physical landfilling and water impoundment activities in the past century (Taylor, 2011). This may have explained why North America showed the largest number in hydrological connectivity and managed realignment approaches (Figure 3B). There had been 3,869 dams removed between 1950 and 2016, about a third of which occurred in America (Secretariat of the Convention on Biological Diversity, 2020). Besides, the beneficial use of dredged materials and hard structure construction were also popular in North America. Although the planting vegetation method was widely applied across the world, using fences for avoiding animals disturbance was also popular in Oceania.
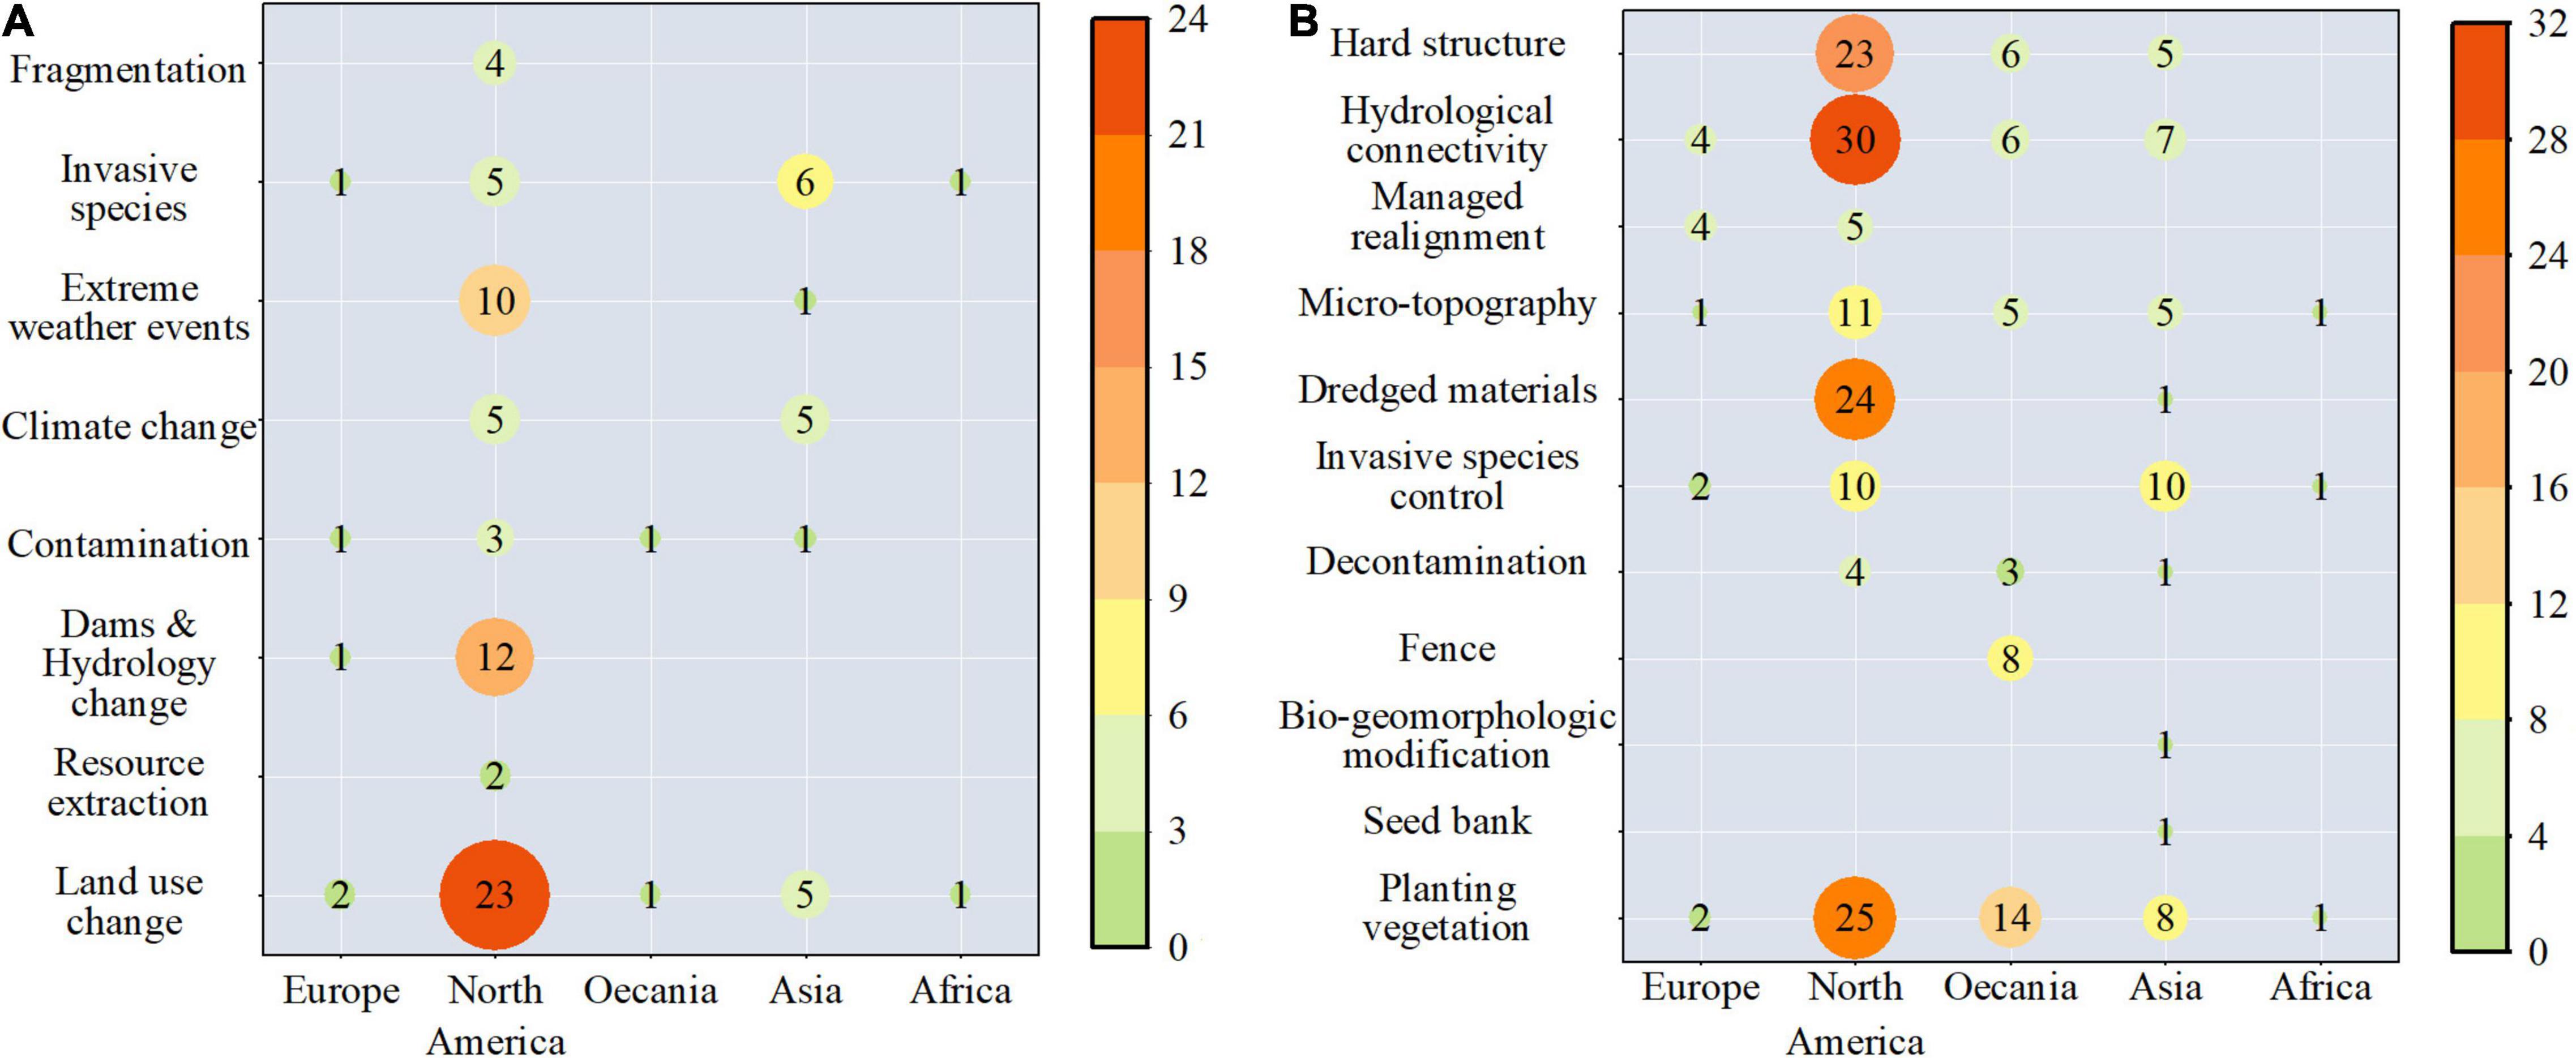
Figure 3. Salt marsh ecological restoration projects’ degradation factors (A) and restoration techniques (B) in the five continents. Numbers are the count of projects.
The number of studies that recorded different stress factors and restoration methods changed with time and showed different patterns. The number of studies that recorded land use change, dam, and hydrology change declined during the period 1991–2021 (Figure 4A). In contrast, the number of studies of climate change and contamination increased with time. Overall, almost every restoration method experienced an earlier increase and later decrease, whereas a dissimilar increase trend could be seen in the number of studies that documented vegetation restoration and removing disturbance methods (Figure 4B). The emerging shoreline protection concept, living shorelines and nature-based solutions, might prompt vegetation restoration technology flourishing in recent years (Bilkovic et al., 2016).
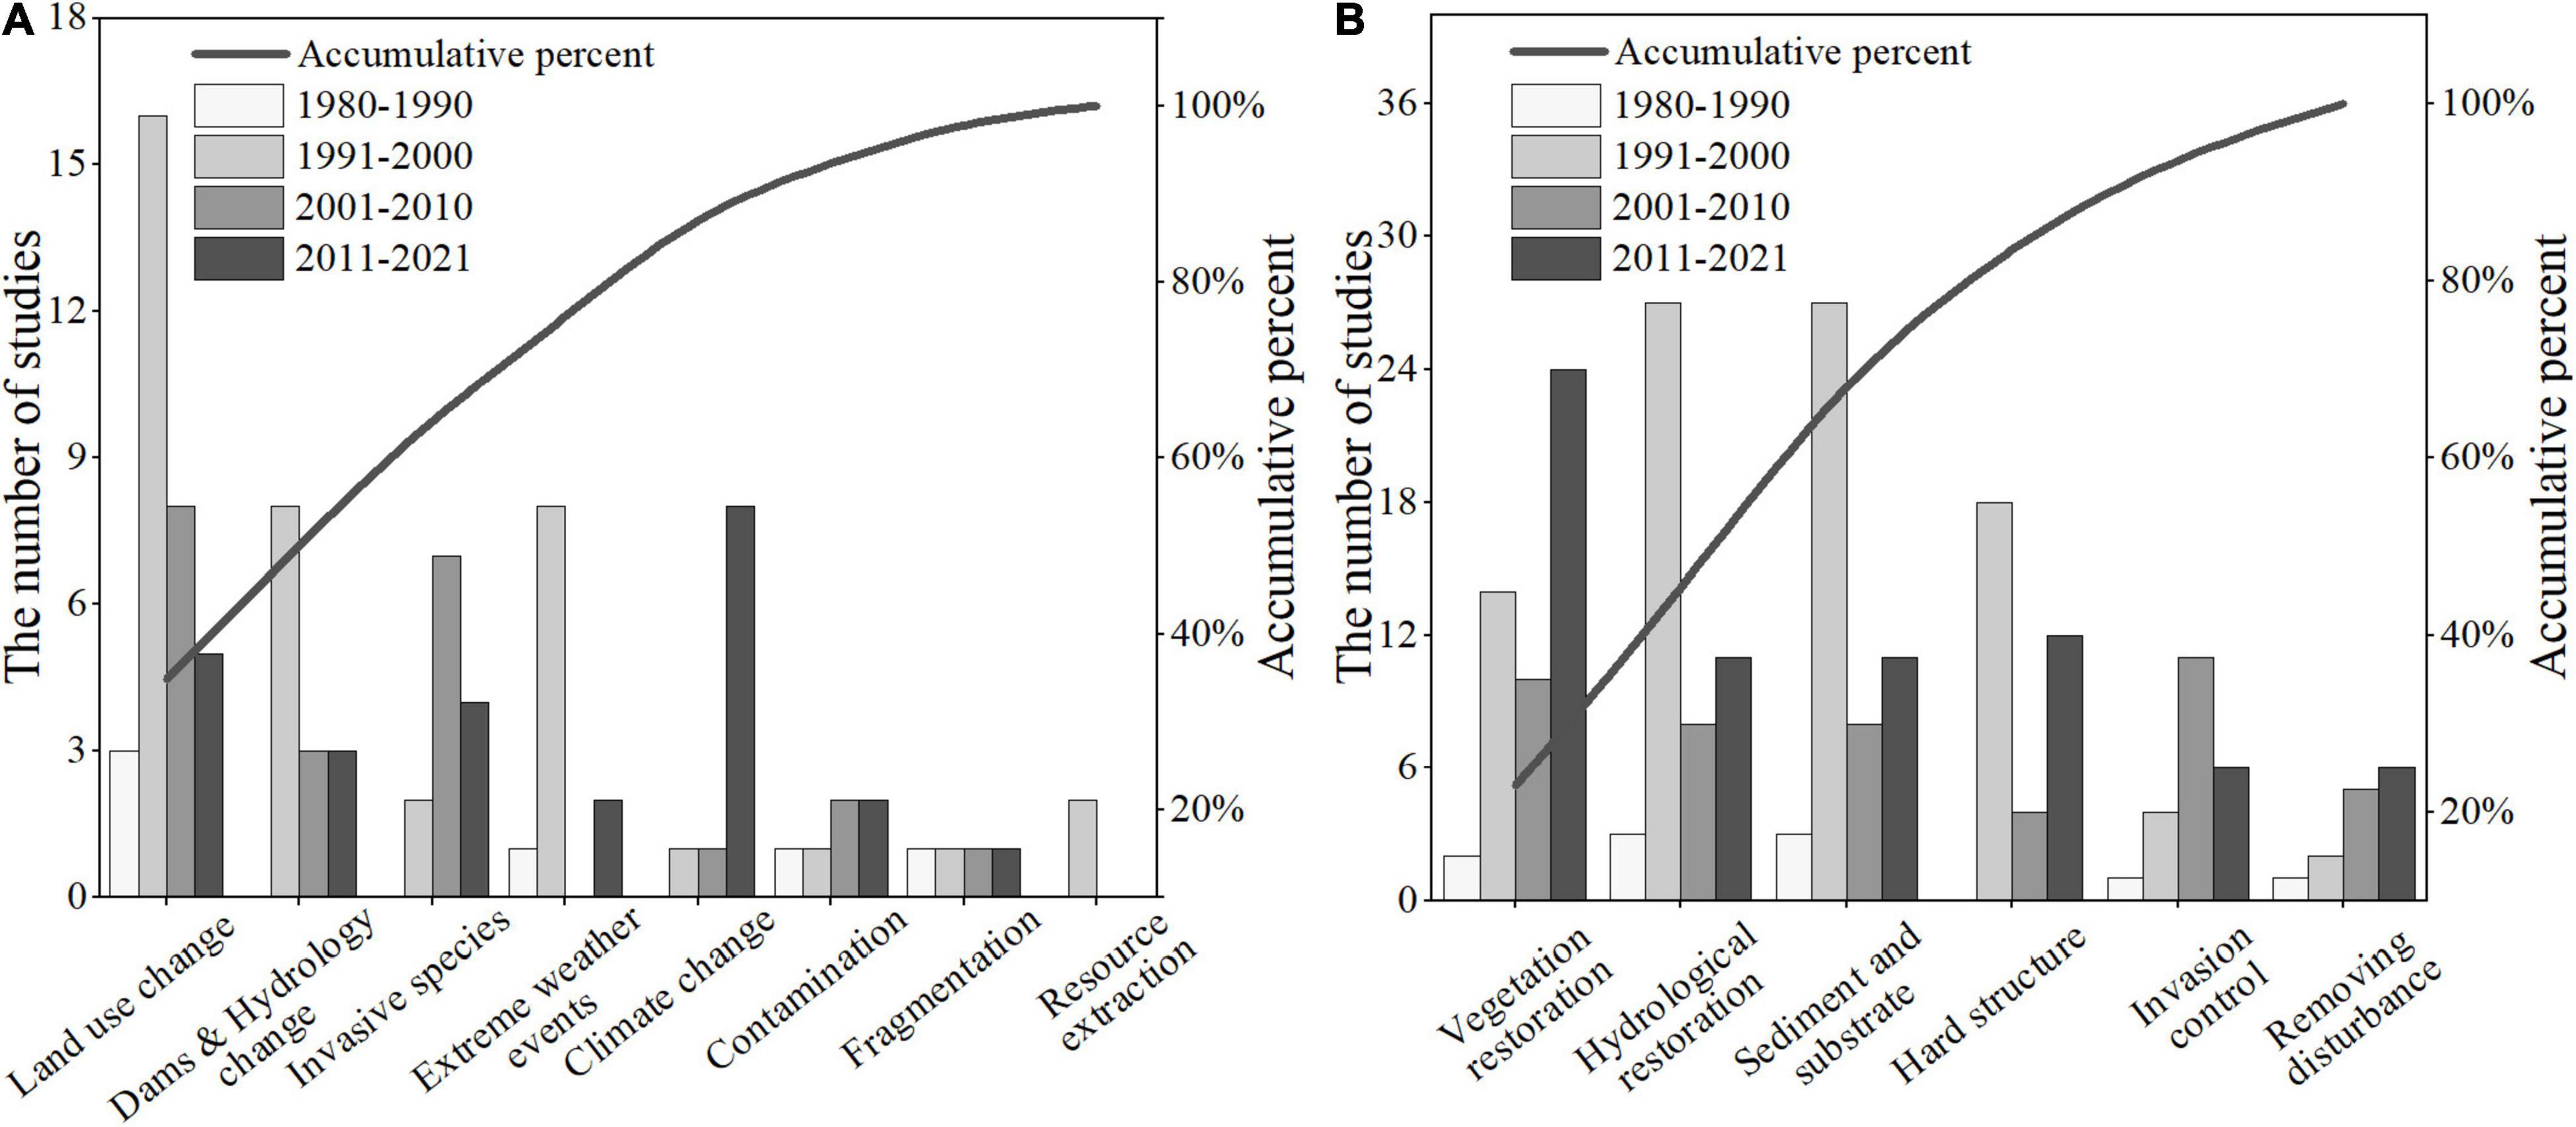
Figure 4. Salt marsh ecological restoration projects’ degradation factors (A) and restoration methods (B) in the past four decades.
Unbalanced Restoration Cost Allocation
As shown from Table 3, the number of restoration sites located in the protected area was significantly less than those in unprotected areas, probably due to the limited space of protected salt marshes. According to the Global Biodiversity Outlook 5, at least 10% of coastal and marine zone are effectively conserved by 2020 (Chape et al., 2005; Secretariat of the Convention on Biological Diversity, 2020). The cumulative restoration area and mean total cost per hectare values were variable in different income countries. Although middle-income countries restored and created more area in comparison with high-income countries, their expense allocation of restoration sites under different protection statuses was more unbalanced than high-income countries. Except for hard structure cost, we found that almost all the cost for the restoration of unprotected sites in high-income countries were higher than those in middle-income countries, regardless of the three different monetary conversion methods. In contrast to earlier findings, however, the cost of the six restoration methods listed in Table 3 for protected sites in the high-income country was either lower or roughly equal with those in the middle-income country.

Table 3. Restoration cost in protected and unprotected restoration sites in the middle-income and high-income countries and other useful information (only minimum and maximum value of the three monetary conversion methods presented).
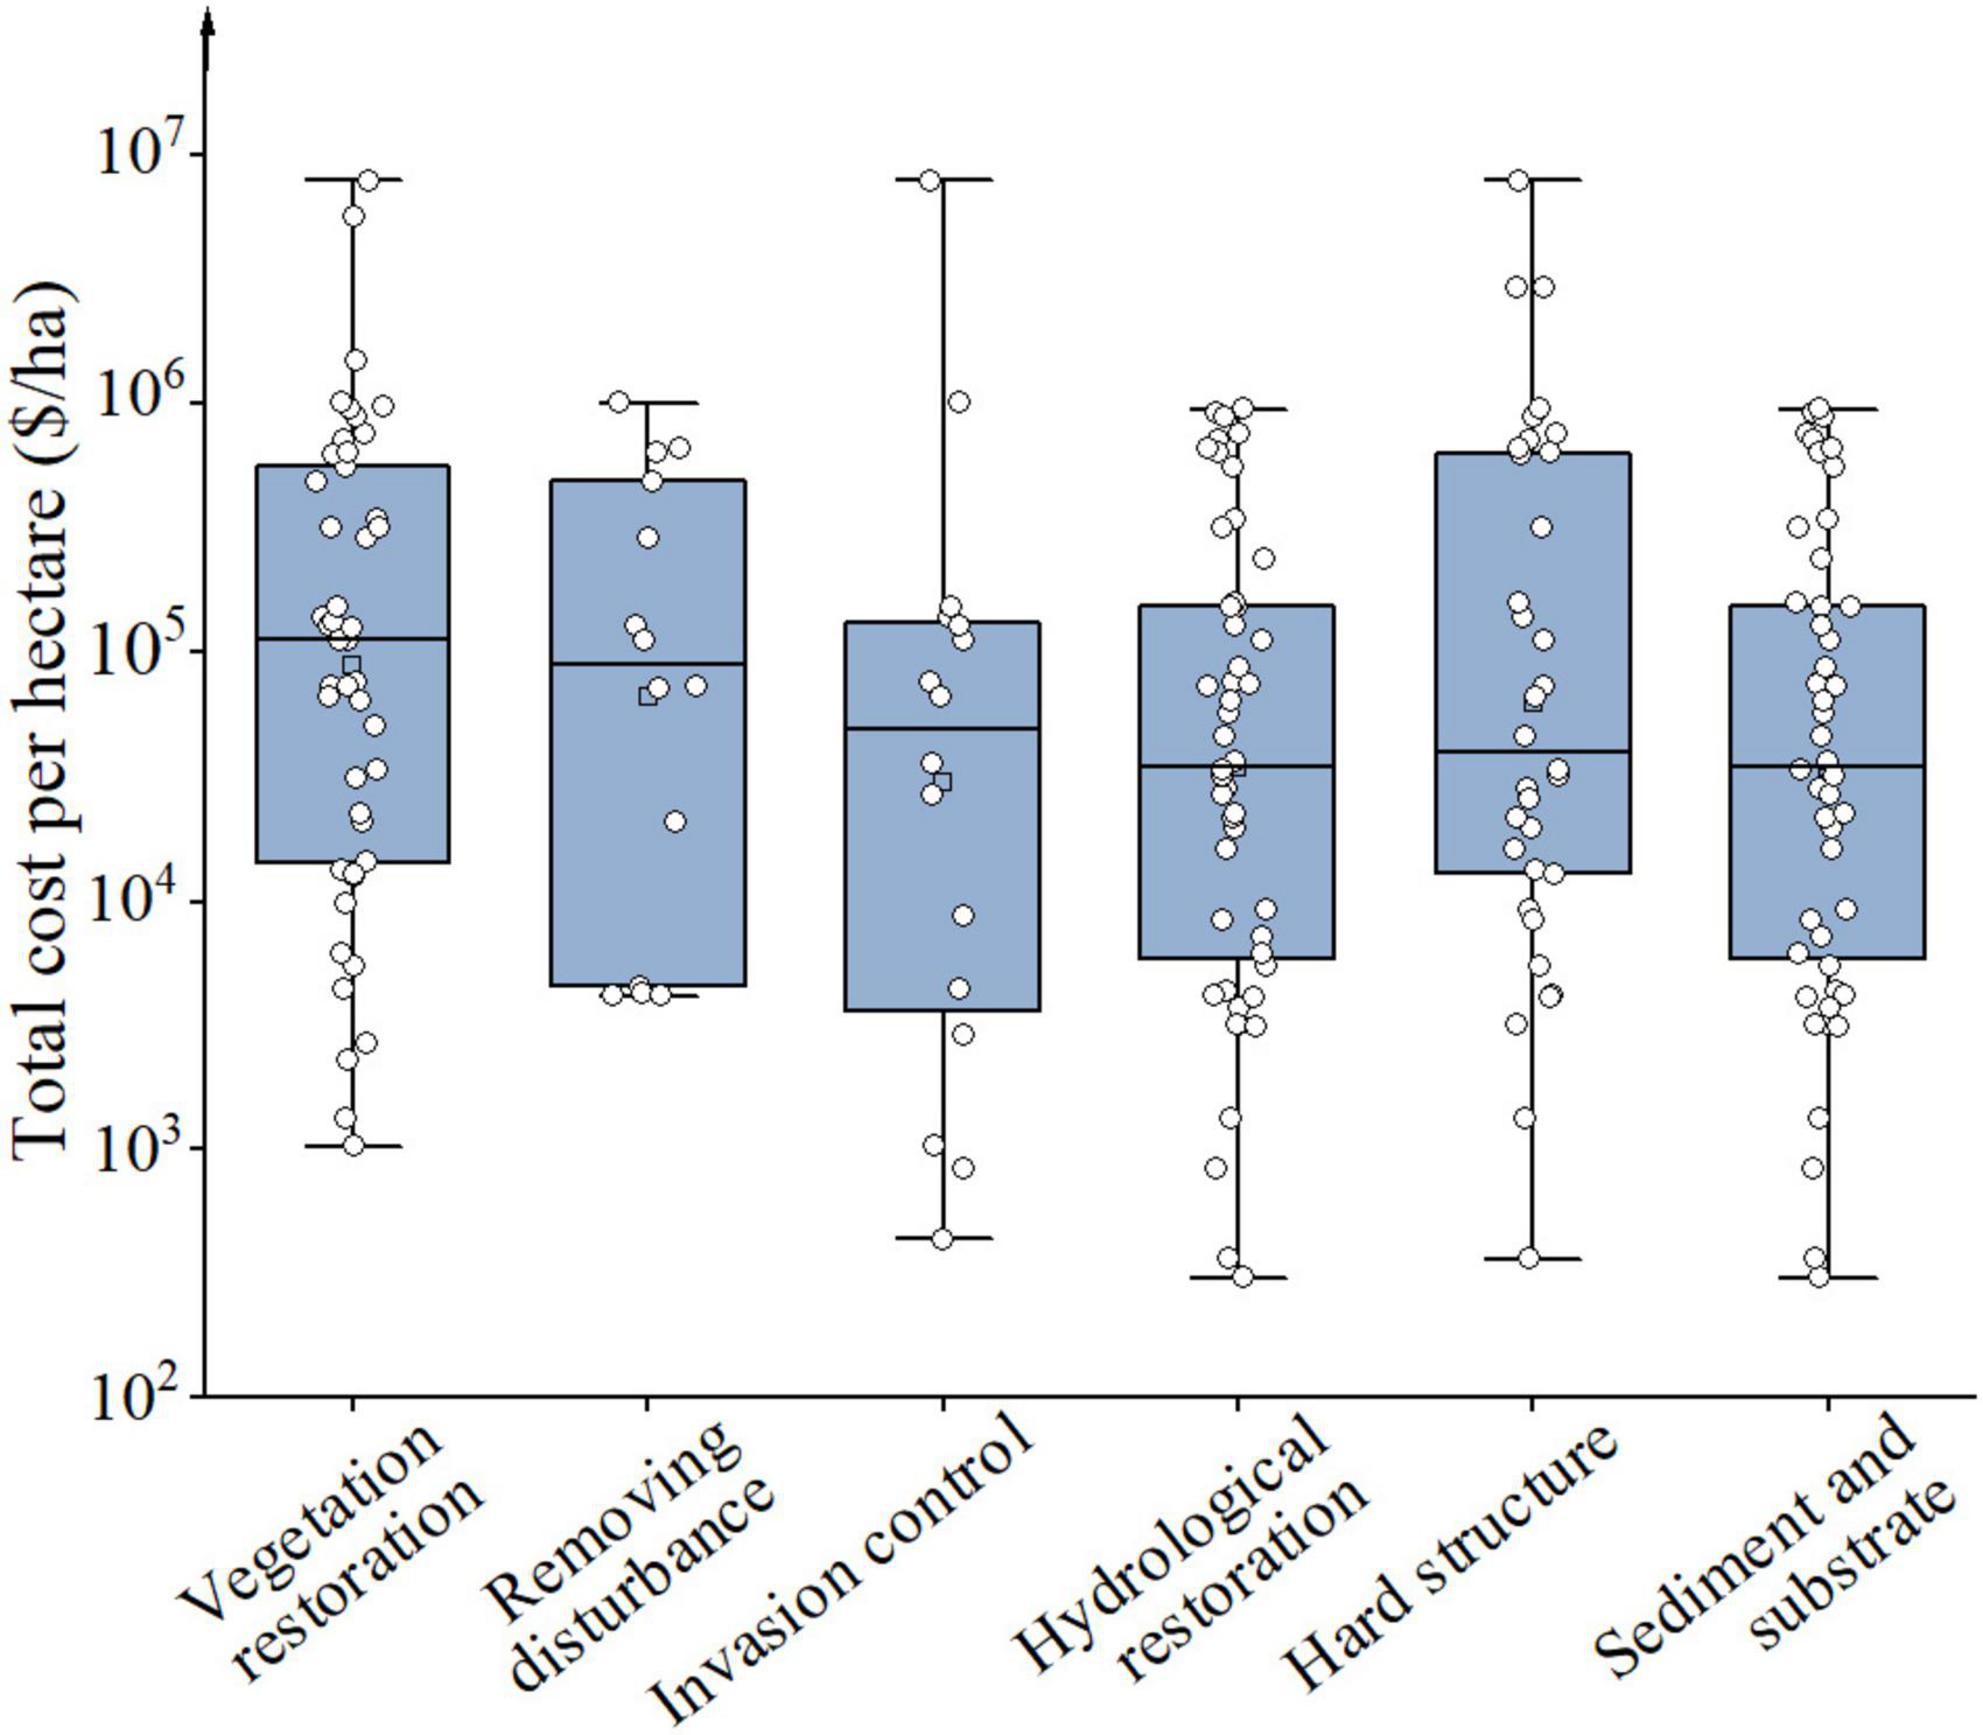
No matter which monetary conversion method was applied, vegetation restoration, removing disturbance, and hard structure restoration methods need more financial investment in comparison with invasion control, hydrological restoration, and sediment and substrate recovery (Figure 5). Although removing disturbance and hard structure restoration methods were more expensive, middle-income countries still invested more money for those methods in protected sites than high-income countries. The invasion control cost in protected areas in the middle-income countries was biased by an expensive ecological project in Shanghai, China, which spent over one billion RMB for wiping out the invasive species and promoting birds’ habitats. After removing anomaly data, the mean total cost of invasion control restoration approach for one hectare would drop to US$ 4,369–6,596. Overall, middle-income countries paid more attention to the salt marsh restoration projects in the protected area, such as Ramsar sites, wildlife management areas, refuges, ecological reserves, marine parks, and marine protected areas. Since they are generally faced with more economic and resource limitations than high-income countries, restoration projects for ecological hot spots tend to get funds and public support relatively easy because they have particular importance for biodiversity and ecosystem services.
Restoration Benefits and the Year to Recover the Cost
We analyzed all ecosystem services generated from effective managed action and documented ecosystem services only used for monetization of every restoration project. Then, we calculated the year to recover the cost of every restoration project in three different benefit data evaluations based on CPI, PPP, and DIS value conversion methods by combining with the restoration projects’ cost data. We found that most benefit data only included one or two types of ecosystem service value, namely, production or ecotourism. According to the rough benefit data estimation, nearly one-fifth of the restoration projects that are based on the ordinary benefit data evaluation could return their investment cost in a short period of time (less than 5 years). If time is extended to 30 years, the proportion of restoration projects with recovered cost will increase to about 40%, of which nearly half (47%) are located in protected areas. As Figure 6 showed, salt marsh restoration projects located in the protected area needed less time to recover costs than those in unprotected areas, either in high-income countries or in middle-income countries. Therefore, ecological hotspots produced enormous ecological benefits and human welfare in return to the high financial support. However, there were still 19% of restoration projects located in unprotected areas whose cost recovery period was significantly lower than the mean cost recovery period. The mismatch between ecological investment and returns in some unprotected areas presented in this study could raise our recognition of the remaining restoration gaps in global salt marsh restoration. In addition, restoring and recreating salt marsh can contribute to carbon sequestration and climate mitigation (Johnson et al., 2018). But, we found that carbon sequestration value was often overlooked in most restoration projects’ benefit evaluations. After adding carbon sequestration value to restoration projects without carbon benefit data, our findings showed that the cost recovery period for those restoration projects had been reduced, regardless of whether they were under low-carbon value or high-carbon value. The information presented in this study suggested that the tremendous carbon sequestration benefit of salt marsh habitat restoration and creation could make corresponding restoration activities more profitable.
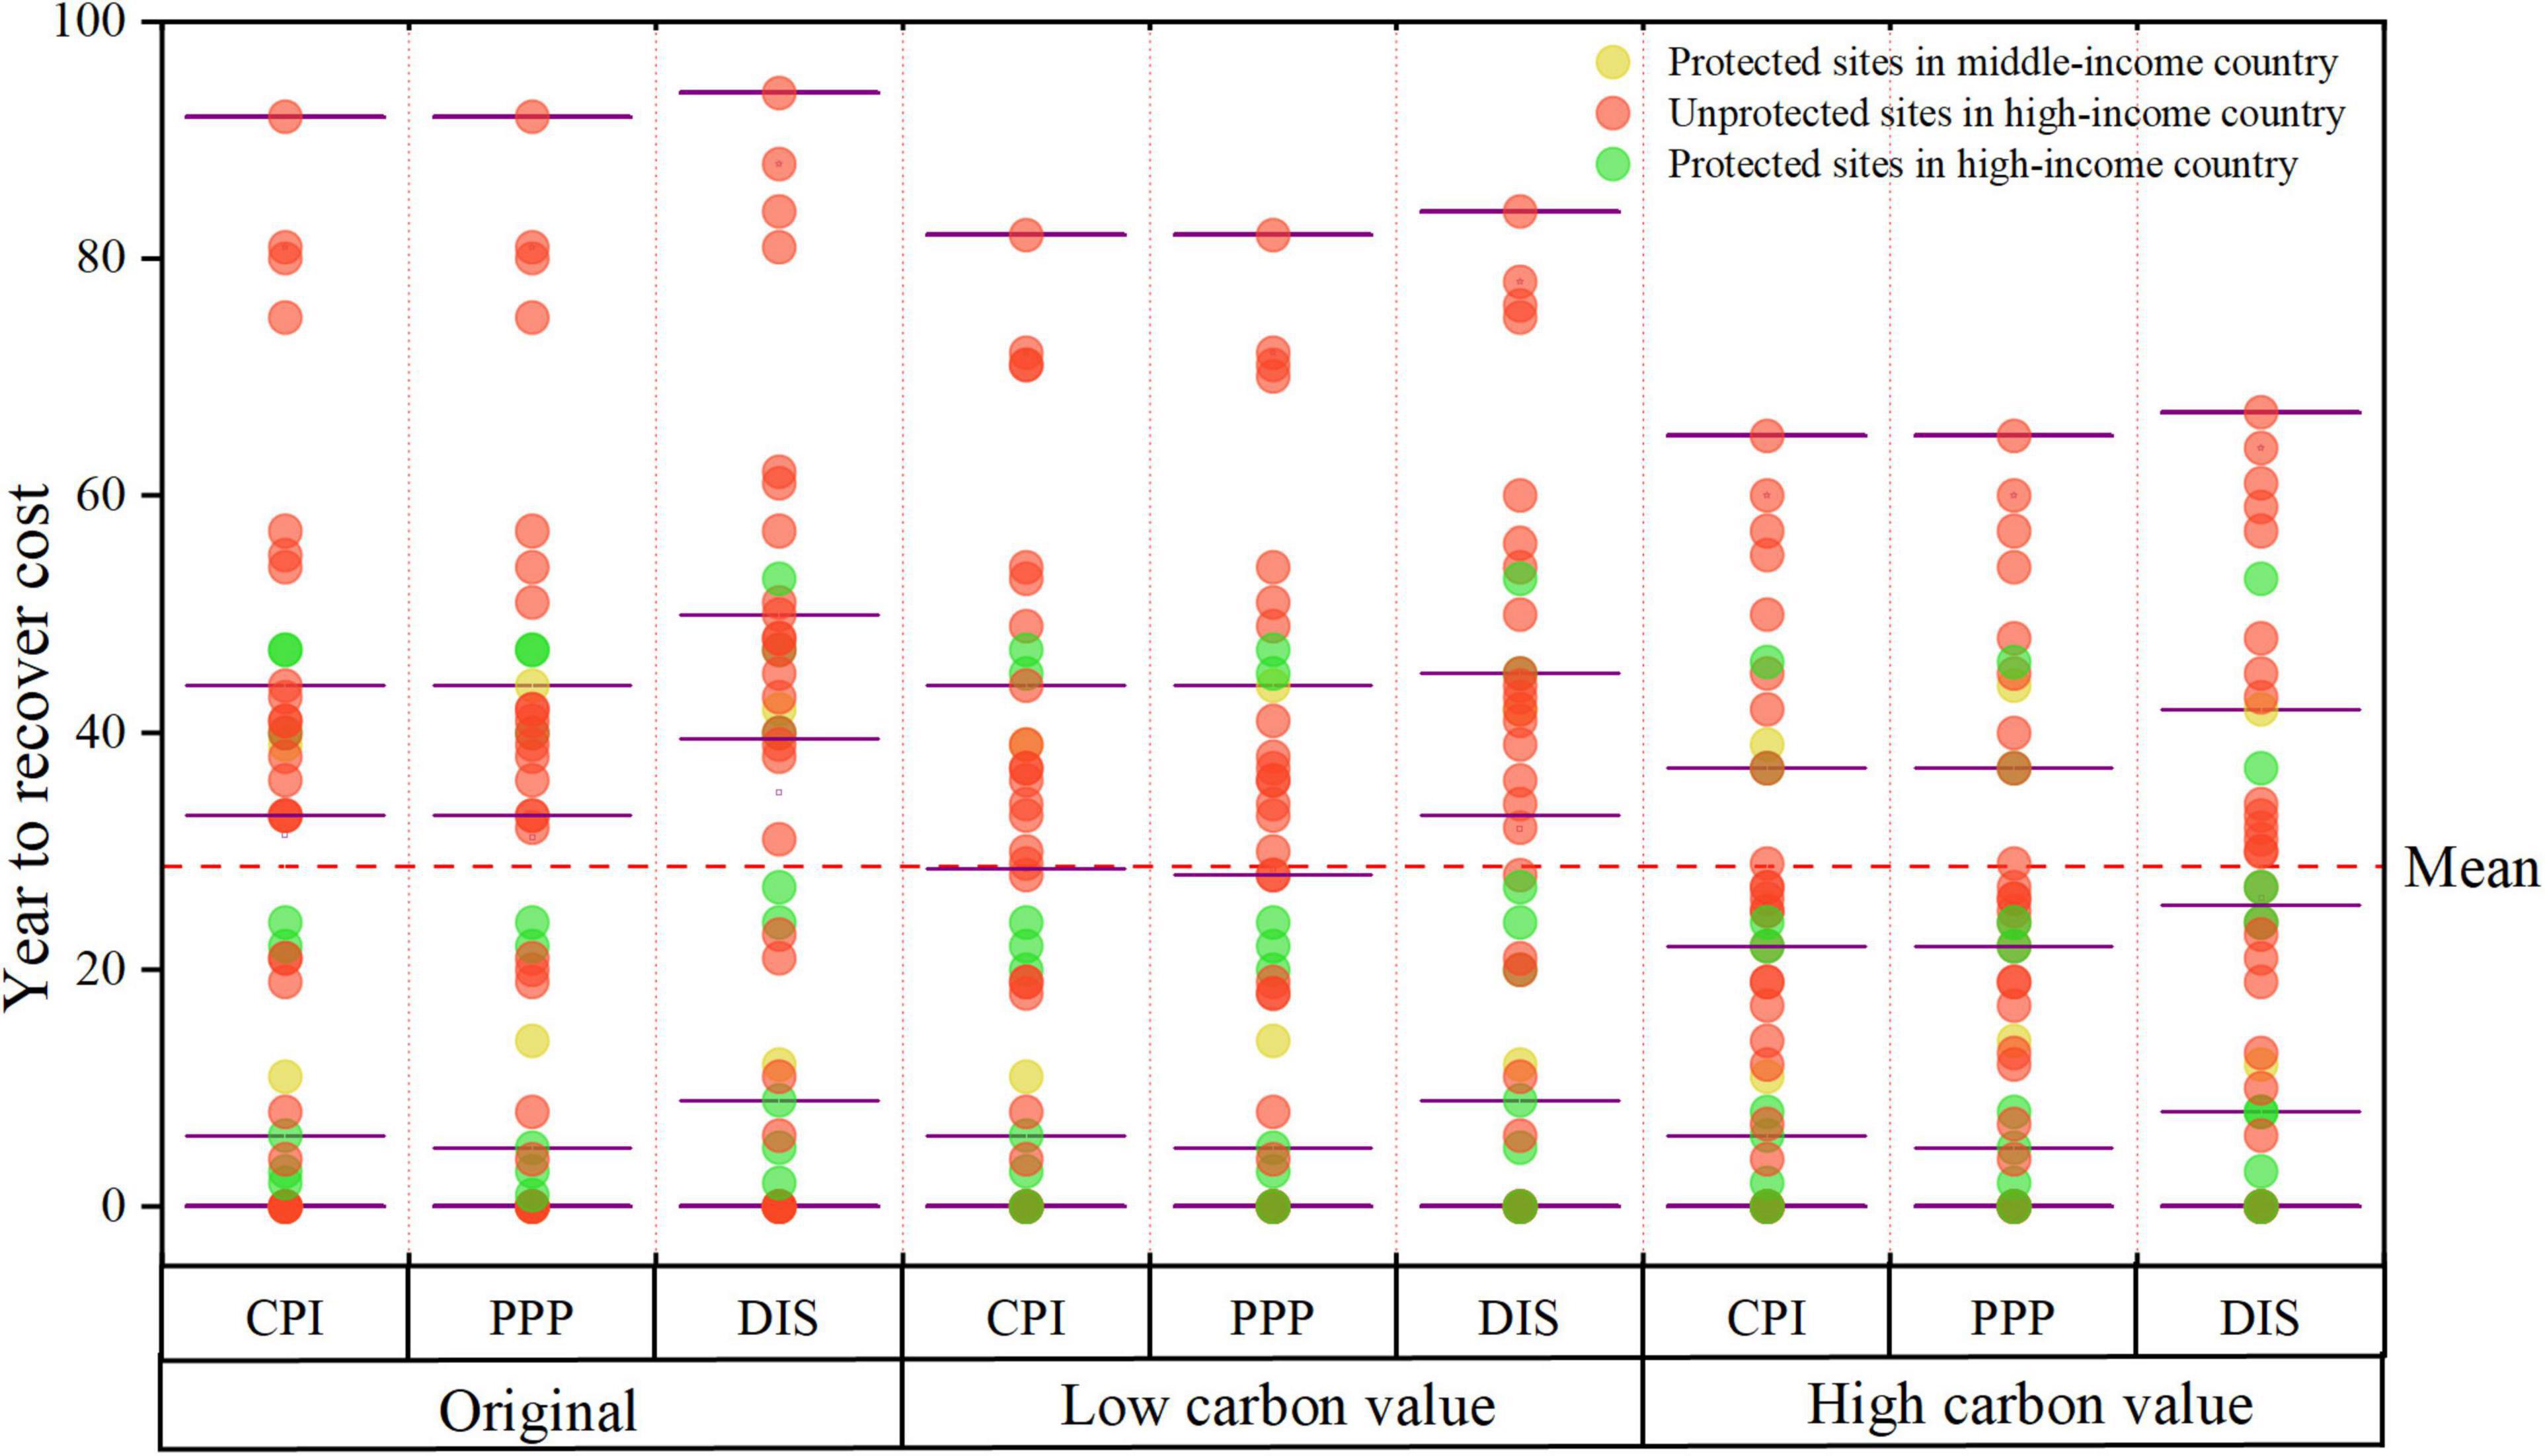
Figure 6. Year to recover the cost of salt marsh ecological restoration projects based on three different benefit data evaluations. The purple lines represent the max, min, median, and two quartile values.
Discussion
Restoration Scale and Cost
Until recently, most coastal restoration projects were still costly and at small scales in comparison with terrestrial ecosystem restoration projects, with a limited success rate. To achieve the expected success of the large-scale coastal zone management, we need to think broadly about the relationship between restoration scale and cost because it is vital for restoration site selection and financial resource division. Some scholars believe that large-scale restoration size would diminish and share construction and management expenses as a result of the economy of scale theory, which is more thrifty (Berger, 1997). However, other scientists find no obvious linear relationship between restoration area and restoration cost per unit area (Bayraktarov et al., 2016). In this study, salt marsh restoration projects are dominated by small-scale experimental restoration, ranging from 1 ha to 76,000 ha. The total cost and cost per hectare irregularly and dramatically fluctuate when restoration size is scaled up. However, after using the natural breaks method to divide all restoration projects into several categories to maximize single category similarities, we found restoration cost and benefit value presented different changing patterns as the restoration scale increased (Table 4). With the increase of the restoration scale, the mean total cost of restoration projects has risen significantly. But the mean benefit per hectare showed a trend of decrease first and then increase. It reached the lowest point when restoration size ranged from 471 ha to 1,400 ha and then increased to a high level as restoration scaled up. This can be caused by the relationship between ecological services, landscape scale, ecosystem service assessment methods, and people’s willingness to pay. Further research is needed to provide evidence for explaining the relationship between restoration scale and cost. Besides, since small-scale and short-time restoration activities had the highest unit mean cost and relatively lower benefit, it was foreseeable that small-scale restoration activities would take longer time to recover the original expenses than large-scale restoration.

Table 4. Restoration cost and benefit of different scales (only minimum and maximum value of the three monetary conversion methods presented).
Although substantial literature have focused on restoration scale, cost, and their correlations, all the studies reviewed so far, however, suffer from the difficulty of data collection. When collecting data from the same country and adjacent geographical area, scientists tended to draw a conclusion that restoration cost has a regression relationship with scale when complicated factors were simplified, such as GDP, technologies, funding sources, and policies. Some of these factors have been proven to affect the restoration budget (Stewart-Sinclair et al., 2020).
Mismatch Phenomenon
Although we have recognized that unbalanced funding allocation and regional biases of salt marsh restoration projects would probably provoke a mismatch between restoration efforts and social expectations, corresponding practical reasons are diverse and complex. One potential explanation is that endangered species richness and the degree of ecosystem degradation vary widely across the world. Regarding degradation areas that have lost tremendous ecological services and are faced with severe human encroachment, scientists are predisposed to understand their threats and consider them as conservation priority areas (Lawler et al., 2006). Due to the greater ecosystem services value in ecological hotspots and reserves, restoration projects happening in these areas would receive more attention and funds than unprotected zones (Table 3). Various restoration and creation activities, such as lowering water levels on impounded former wetlands, filling in with dredged material, or creating new habitats by removing tidal barriers, are all associated with the transformation of different land use forms. There is a trade-off between former land use and salt marsh restoration activities. The buffer effect of salt marshes against storm surge is critical to coastal cities with high population density and economic values. However, an important predictor of salt marsh services value is the income level of the particular affected community, which means the salt marsh value in high-income areas is higher in “avoided damage cost” method than that in middle-income areas. Therefore, we inadvertently created a justification to over-invest in marshes in high-income areas and underinvest in middle-low-income areas (zu Ermgassen et al., 2021). The salt marsh assessment and land trade-off offered an intrinsic explanation about why most of the restoration sites are adjacent to megacities. Another factor that affects ecological funds allocation is regional administrative capacity and policies, rather than environmental needs or population size (Borgström et al., 2016). Government funding is still the main source for coastal habitat restoration (Zhang et al., 2018). Except for North America and Europe, private protection was rarely considered in other regions, and subnational protection was least considered in Asia (McKinley et al., 2020). On the other hand, some mismatches are mainly derived from English literature. Africa and South America have many countries and regions where English is not the primary official language or a secondary foreign language, which means non-English literature cannot be accessed even if they do exist in native language (Lawler et al., 2006).
Limitations and Uncertainties
Although we endeavored to search salt marsh restoration projects and their cost and benefit data, cost data are still quite limited for deep research. The Economics of Ecosystems and Biodiversity project conducted a study of more than 2,000 recovery cases and found that less than 5% of the cases provided meaningful cost data (Neßhöver et al., 2011). The quality of the cost data varied in different projects (Bullock et al., 2011). Similarly, a report by Wortley et al. (2013) indicated that only 3.9% of restoration projects interpreted the economic results of restoration projects. Bayraktarov et al. (2016) and Li et al. (2019) also pointed out the problem of restoration cost data accessibility. In addition, multiple projects with a certain degree of relevance are often implemented within a long duration in some specific geographic areas, with repetitive and somewhat different records from different sources such as academic journals, news, bloggers, reports, and webpages. Establishing advanced and available coastal wetland restoration databases might be helpful to improve the analysis results. However, only some developed countries owned public available ecosystem restoration databases, while most developing countries still need time to establish their restoration database and share the data.
To simplify the research questions, we used simplified cost-benefit analysis as a “decision rule” for identifying a preferred option in our study. But, it is subject to the uncertainties of different monetary conversion methods. CPI, PPP, and DIS are the most common and widely used monetary conversion methods in environmental management projects, such as coastal protection, wild animal protection, and their cultural services (Narayan et al., 2016; Wei et al., 2018). But they reflect different economic concepts and consumption differences, which would cause uncertainties in our final calculation results (Bayraktarov et al., 2016; Ma et al., 2020). When we compared the three monetary conversion methods, DIS usually had the highest value, while the difference between CPI and PPP was not obvious (Figure 7). Different discount rates also affect our results. In the DIS method, different discount rates can produce contradictory results, and there is no consensus on which discount rate should be applied for restoration projects (Bullock et al., 2011). Turner et al. (2007) considered that fixed negative, positive, and zero discount rates were not suitable for longtime restoration projects because climate change and other various factors may affect consequences. Gowdy et al. (2010) suggested that variable discount rates should be used for assessing the long-term impacts of environmental change. Considering the differences among countries and years, we used various discount rates for every single restoration project to minimize inherent uncertainties in the DIS method. Moreover, in the actual situation, a certain restoration project usually lasted for several years, and their investment is in batches, including long-term maintenance cost and original construction cost. For practical reasons, we used a specific year during the implementation period and removed maintenance and running costs from the calculation, which would reduce costs and thereby affect the results’ accuracy.
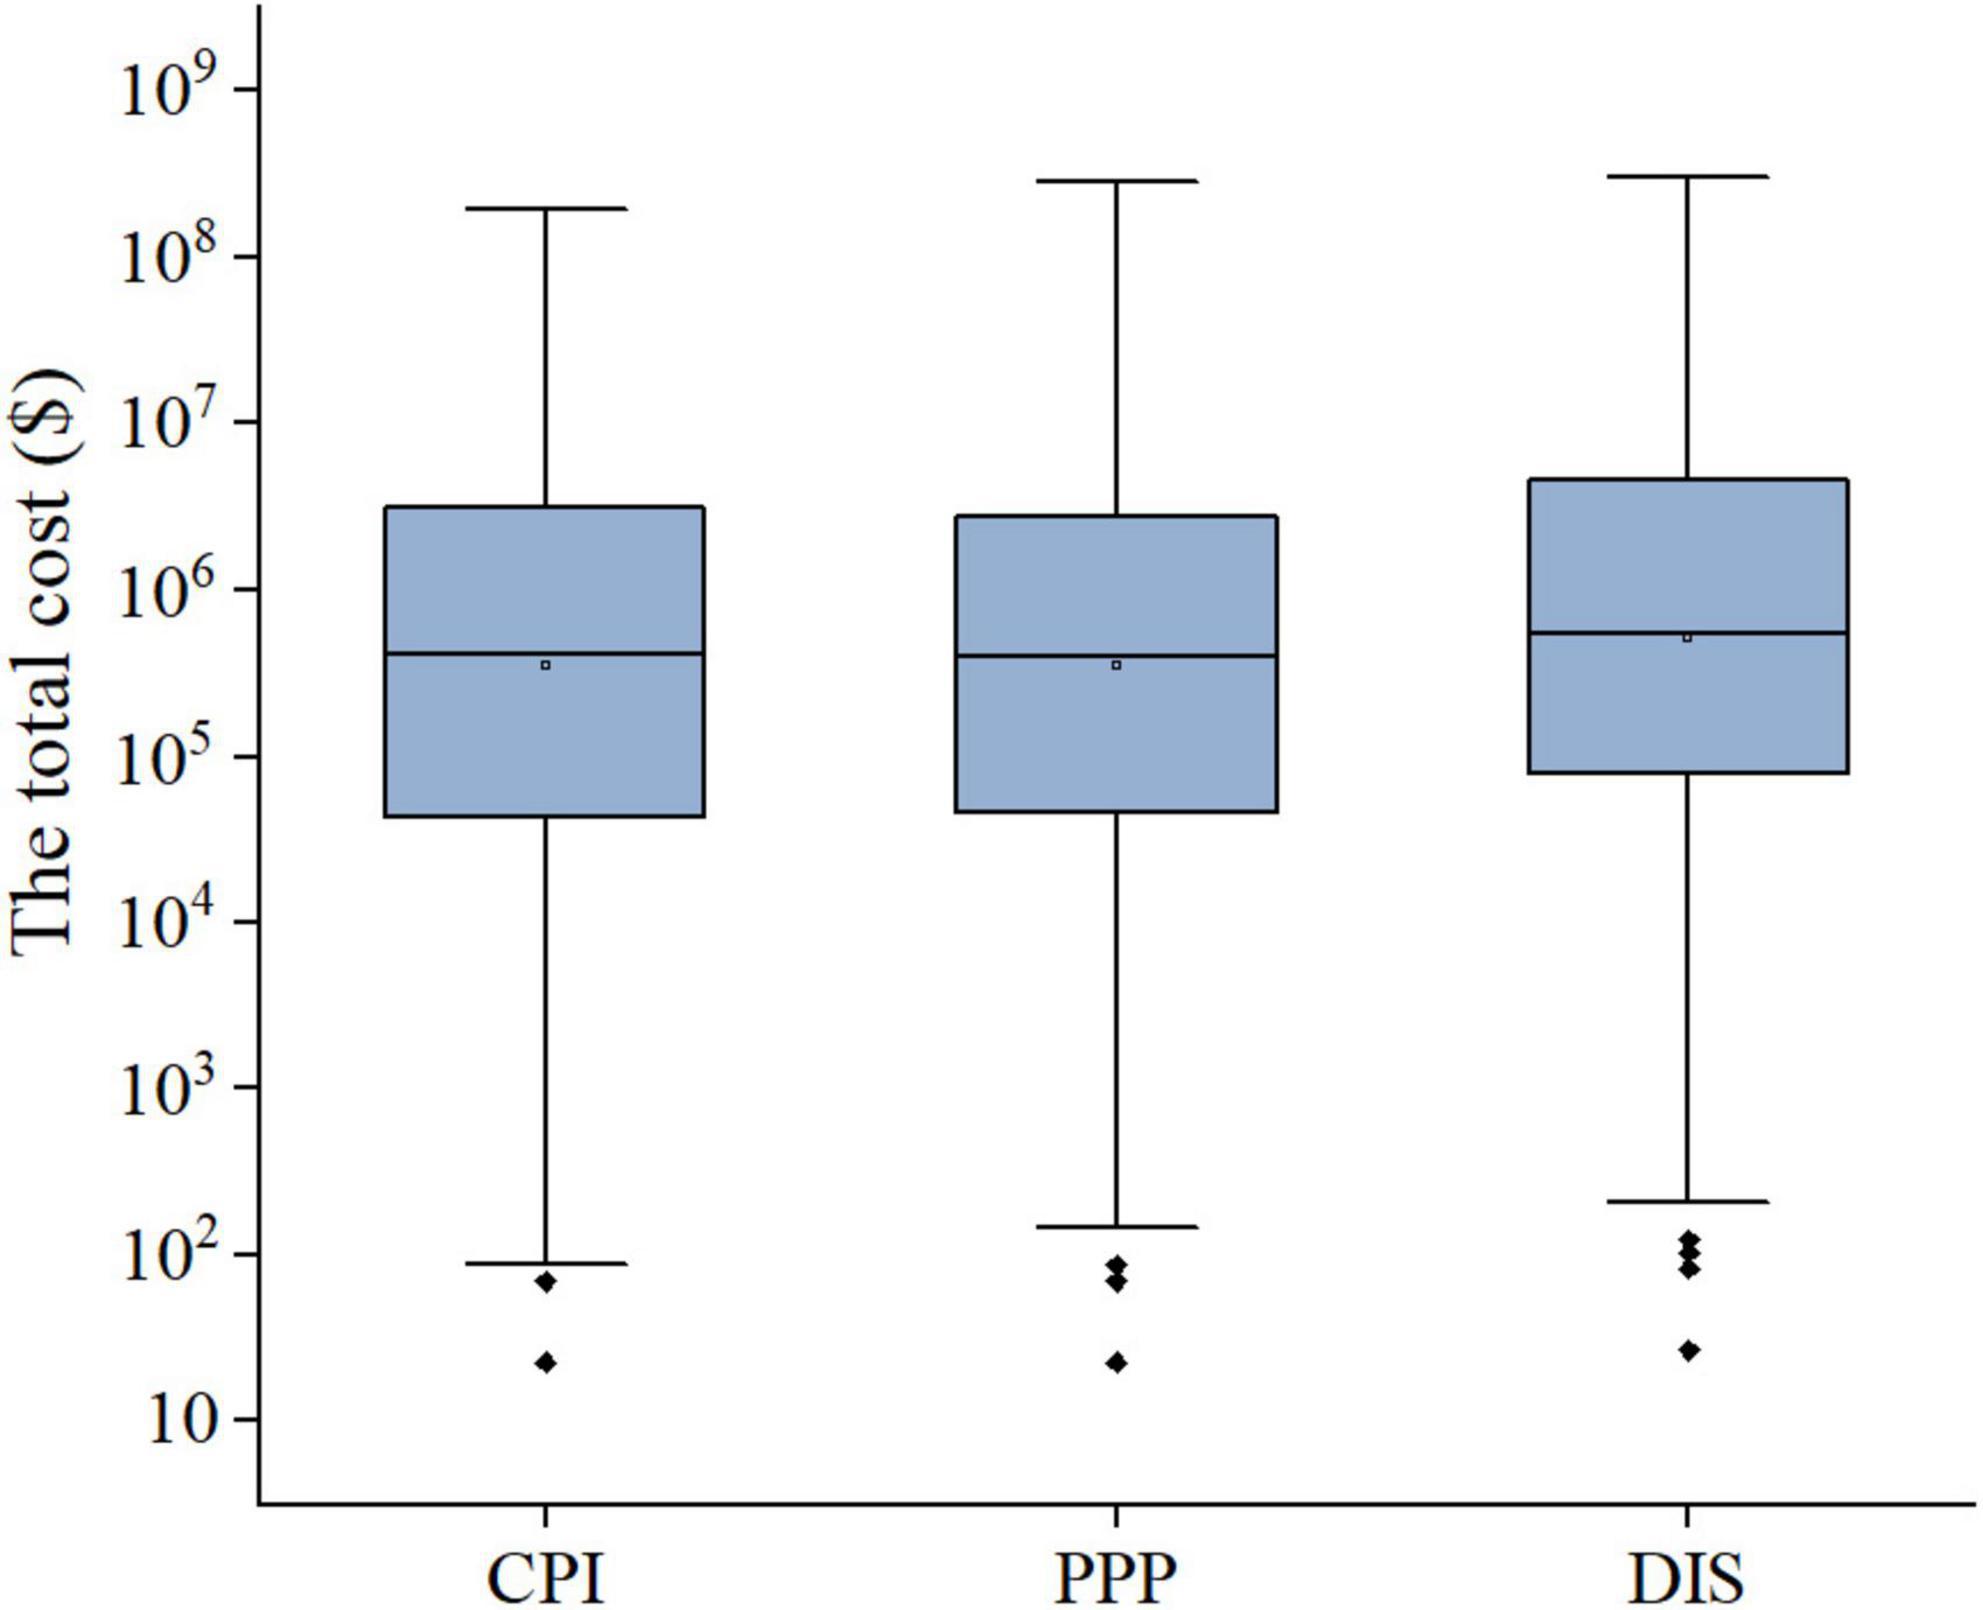
Figure 7. The total cost of salt marsh ecological restoration projects in different monetary conversion methods.
Another uncertainty is from the economic evaluation of restoration outcomes. We must distinguish between the “restoration outcomes” and the “restoration benefits.” Restoration outcomes cover all the results produced by the restoration action, while the restoration benefits are more inclined toward the beneficial ones for human. Sometimes, ecosystem benefits generated from restoration activities return over long periods of time, which might be overlooked because they are hard to monetize. For example, local residents’ health improvement associated with environmental changes could be absent from ecological assessment documents of restoration activities. After summarizing the natural and economic results of 133 selected restoration studies, we found that ecosystem services generated from restoration actions are not consistent with reported monetary benefit calculation (Figure 8). In fact, most benefit data only recorded benefit values of fish and shrimp production, raw materials, and ecotourism. Ecosystem services, such as residents’ sense of experience from restoration activities and the value of specific native species, were absent from the benefit data. Without species composition, biodiversity, and physical condition improvement benefit data generated from restoration activities, we could draw an inexact conclusion that the costs of salt marsh restoration outweigh the benefits. In addition, the potential negative impacts and opportunity cost of land use change caused by restoration activities should be further taken into account because the overall result of cost-effectiveness of ecological restoration was sensitive to manipulation of market and economic data. In the materials collected, we barely found any observed bad effects or failure lessons of restoration. In the future, the uncertainties can be alleviated by conducting surveys and interviews with relevant participators and management organizations of restoration projects. Further work is required to understand the multiple values of salt marshes across the globe.
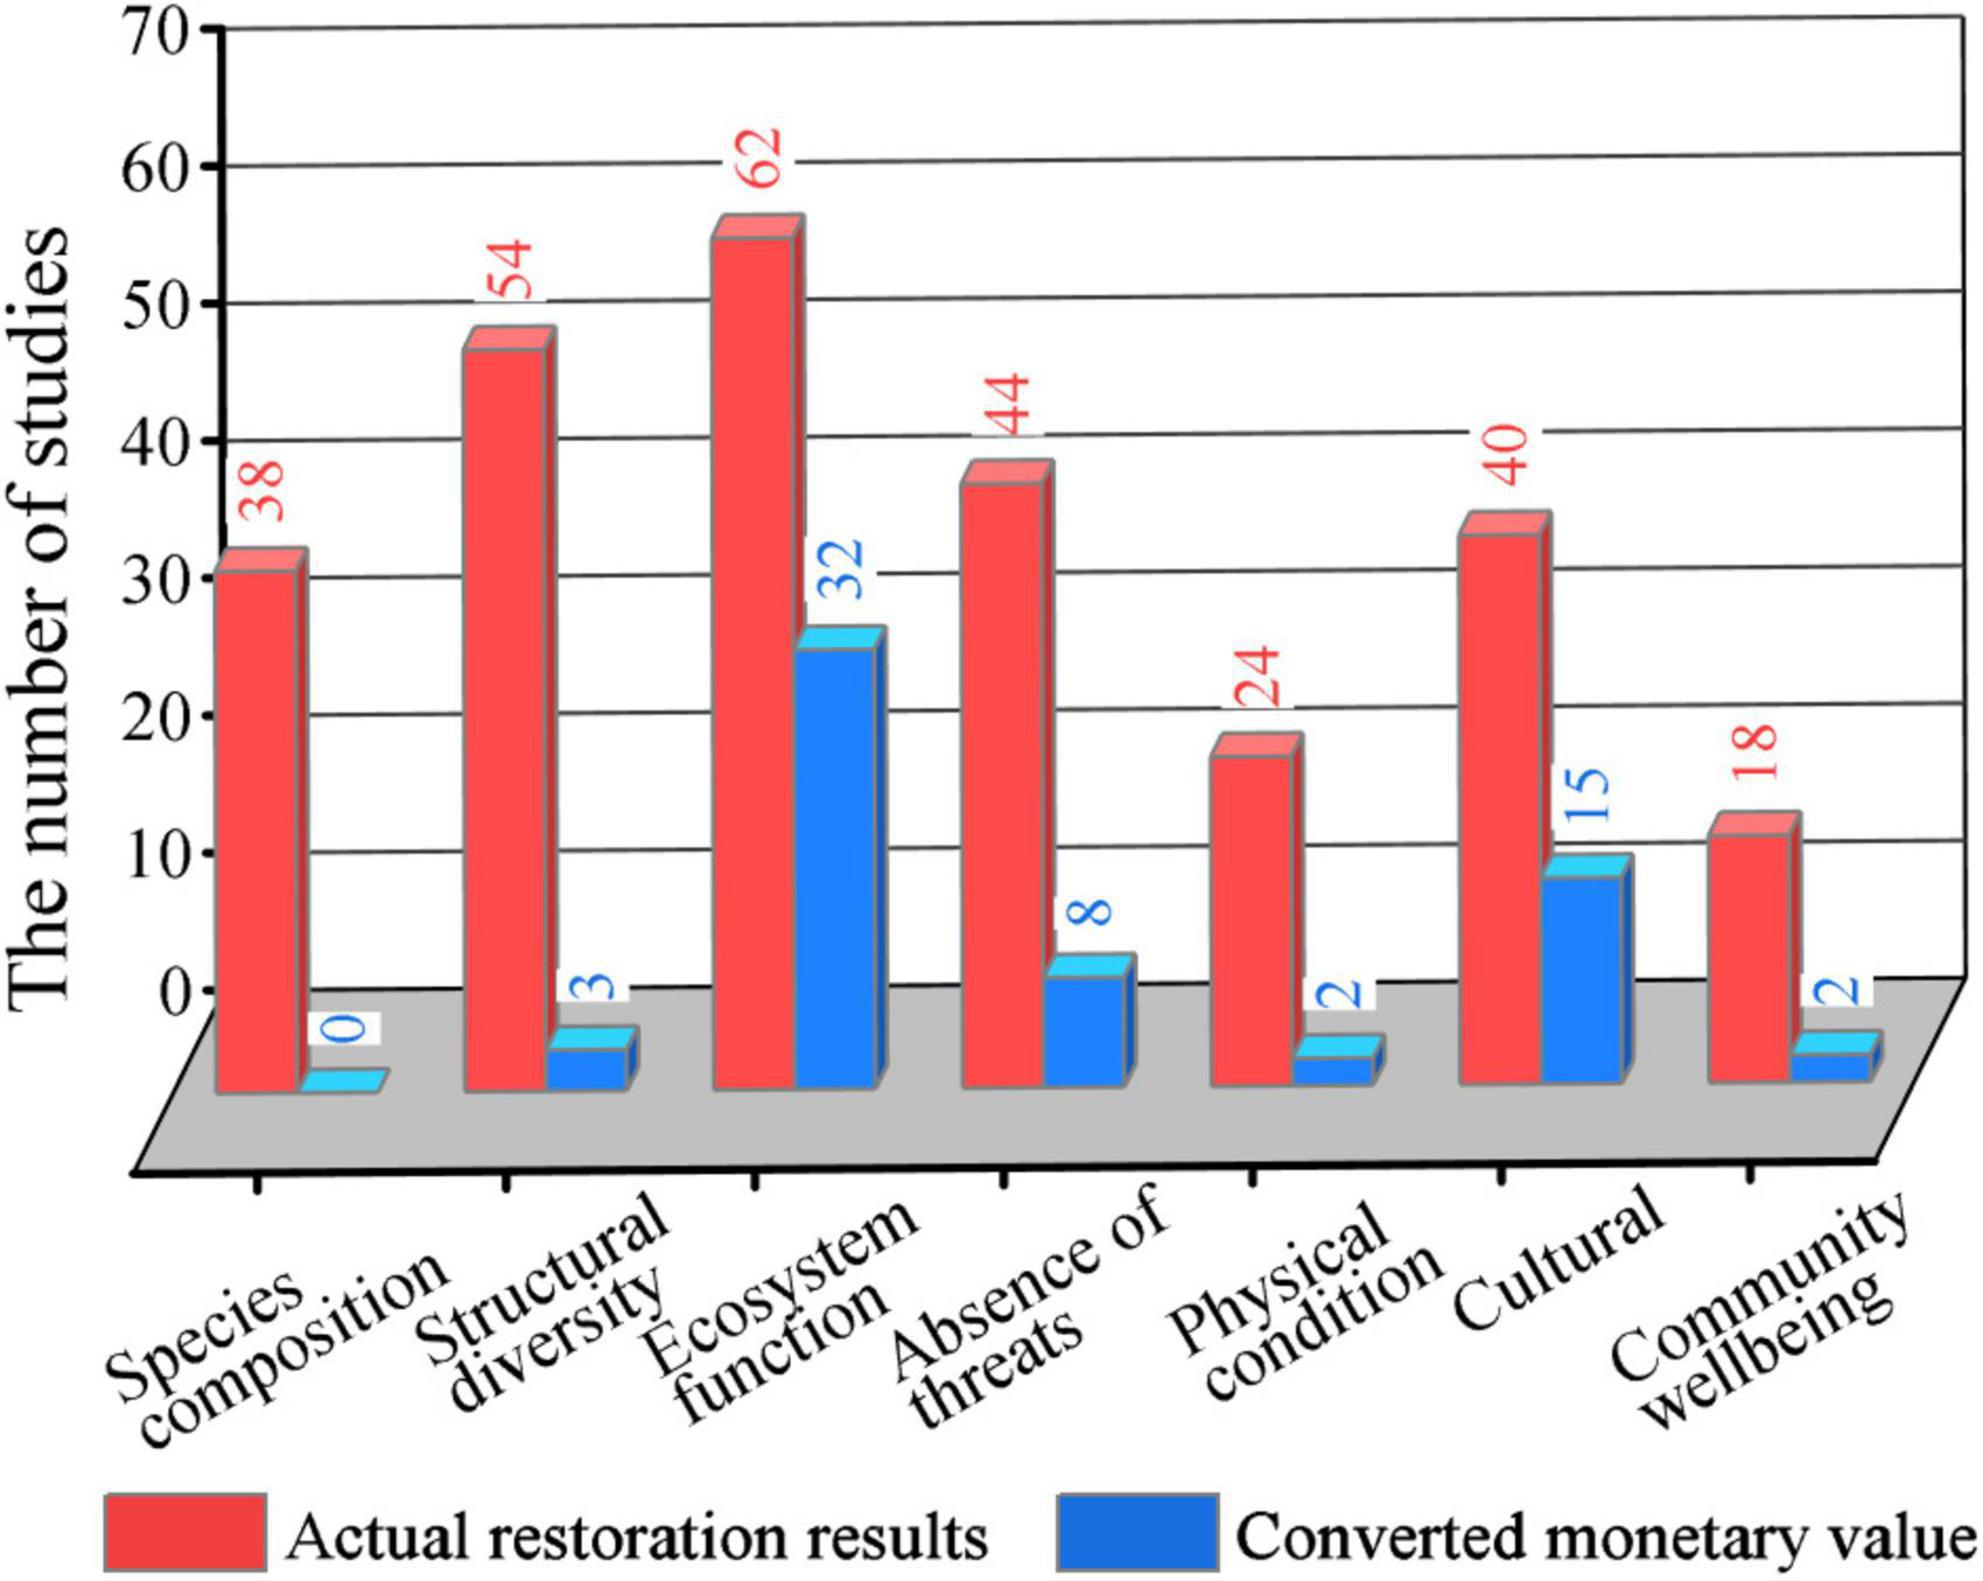
Figure 8. Comparison between actual restoration results and converted monetary values. The red bar represents the number of studies of specific restoration results that either improved or were generated due to salt marsh restoration projects in a total of 133 studies. Similarly, the blue bar represents the number of studies with restoration economic results reported. Not all natural restoration benefits were converted into monetary value.
Conclusion
Our results showed that most ecological restoration projects were geographically close to large rivers and megacities and formed two restoration booms during the periods of 1990–2000 and 2013–2021. Restoration methods were based on the types of natural disturbances and anthropogenic threats, while planting vegetation was becoming more popular. Although the number of restoration projects is increasing in recent years, middle-income countries tend to spend more salt marsh restoration efforts in protected areas than that in unprotected areas. As for restoration benefits, most restoration projects could recover their original investment in a relatively short period under the imprecise monetary valuation of limited ecosystem services. The great carbon sequestration potential would make salt marsh restoration projects more profitable in the future, as carbon neutral policies are being adopted by many countries to combat global warming. Compared with large-scale restoration activities, small-scale experimental restoration projects are more expensive and make it difficult to recover their costs. Our study provides obvious evidence that middle-income countries have not adequately recognized the contributions of salt marsh restoration in unprotected areas yet. Restoration can significantly increase natural capital and the flow of services and benefits to human society. More efforts are needed to make these links explicit and provide evidence to convince society that the benefits outweigh the investment costs. Our results could help to bridge policymakers and ecologists in their joint efforts to improve restoration planning and implementation.
Data Availability Statement
The original contributions presented in the study are included in the article/Supplementary Material, further inquiries can be directed to the corresponding author.
Author Contributions
J-JW: conceptualization, data acquisition, methodology, analysis, writing—original draft, review, and editing. X-ZL: supervision, editing, and funding acquisition. S-WL: conceptualization and polishing. Y-XM: polishing. All authors contributed to the article and approved the submitted version.
Funding
This work was sponsored by the National Natural Science Foundation of China (42141016), and the National Key R&D Program of China (2017YFC0506000).
Conflict of Interest
The authors declare that the research was conducted in the absence of any commercial or financial relationships that could be construed as a potential conflict of interest.
Publisher’s Note
All claims expressed in this article are solely those of the authors and do not necessarily represent those of their affiliated organizations, or those of the publisher, the editors and the reviewers. Any product that may be evaluated in this article, or claim that may be made by its manufacturer, is not guaranteed or endorsed by the publisher.
Supplementary Material
The Supplementary Material for this article can be found online at: https://www.frontiersin.org/articles/10.3389/fevo.2022.865516/full#supplementary-material
Footnotes
- ^ http://www.estuaries.org/
- ^ http://www.stats.gov.cn/english/
- ^ https://www.worldbank.org/en/home
- ^ https://rsis.ramsar.org/ris-search?selectlayer=centroids-ramsar_sdi%3Aunboundaries
- ^ https://www.protectedplanet.net/en
References
Abelson, P., and Dalton, T. (2018). Choosing the social discount rate for Australia. Aust. Econ. Rev. 51, 52–67. doi: 10.1111/1467-8462.12254
Adam, P. (2019). “Salt marsh restoration,” in Coastal Wetlands: an Integrated Ecosystem Approach, eds G. M. E. Perillo, E. Wolanski, D. R. Cahoon, and C. S. Hopkinson (Amsterdam: Elsevier), 817–861. doi: 10.1016/b978-0-444-63893-9.00023-x
Barbier, E. B., Hacker, S. D., Kennedy, C., Koch, E. W., Stier, A. C., and Silliman, B. R. (2011). The value of estuarine and coastal ecosystem services. Ecol. Monog. 81, 169–193. doi: 10.1890/10-1510.1
Bayraktarov, E., Saunders, M. I., Abdullah, S., Mills, M., Beher, J., Possingham, H. P., et al. (2016). The cost and feasibility of marine coastal restoration. Ecol. Appl. 26, 1055–1074. doi: 10.1890/15-1077.1
Berger, L. (1997). Costs for Wetland Creation and Restoration Projects in the Glaciated Northeast. Washington DC: United States Environmental Protection Agency.
Bilkovic, D. M., Mitchell, M., Mason, P., and Duhring, K. (2016). The Role of Living Shorelines as Estuarine Habitat Conservation Strategies. Coast. Manag. 44, 161–174. doi: 10.1080/08920753.2016.1160201
Blignaut, J., Esler, K. J., de Wit, M. P., Le Maitre, D., Milton, S. J., and Aronson, J. (2013). Establishing the links between economic development and the restoration of natural capital. Curr. Opin. Environ. Sustain. 5, 94–101. doi: 10.1016/j.cosust.2012.12.003
Borgström, S., Zachrisson, A., and Eckerberg, K. (2016). Funding ecological restoration policy in practice—patterns of short-termism and regional biases. Land Use Policy 52, 439–453. doi: 10.1016/j.landusepol.2016.01.004
Bossuyt, B., and Honnay, O. (2008). Can the seed bank be used for ecological restoration? An overview of seed bank characteristics in European communities. J. Veg. Sci. 19, 875–884. doi: 10.3170/2008-8-18462
Broome, S. W., Seneca, E. D., and Woodhouse, W. W. Jr. (1988). Tidal salt marsh restoration. Aquat. Bot. 32, 1–22. doi: 10.1016/0304-3770(88)90085-X
Bullock, J. M., Aronson, J., Newton, A. C., Pywell, R. F., and Rey-Benayas, J. M. (2011). Restoration of ecosystem services and biodiversity: conflicts and opportunities. Trends Ecol. Evol. 26, 541–549. doi: 10.1016/j.tree.2011.06.011
Burden, A., Garbutt, A., and Evans, C. D. (2019). Effect of restoration on saltmarsh carbon accumulation in Eastern England. Biol. Lett. 15:20180773. doi: 10.1098/rsbl.2018.0773
Chape, S., Harrison, J., Spalding, M., and Lysenko, I. (2005). Measuring the extent and effectiveness of protected areas as an indicator for meeting global biodiversity targets. Phil. Trans. R. Soc. B. 360, 443–455. doi: 10.1098/rstb.2004.1592
Cornelisen, C. D. (1998). Restoration of Coastal Habitats and Species in the Gulf of Maine. Portland: Gulf of Marine Council on the Marine Environment.
Costanza, R., De Groot, R., Sutton, P., Van der Ploeg, S., Anderson, S. J., Kubiszewski, I., et al. (2014). Changes in the global value of ecosystem services. Glob. Environ. Change 26, 152–158. doi: 10.1016/j.gloenvcha.2014.04.002
Coverdale, T. C., Brisson, C. P., Young, E. W., Yin, S. F., Donnelly, J. P., and Bertness, M. D. (2014). Indirect human impacts reverse centuries of carbon sequestration and salt marsh accretion. PLoS One 9:e93296. doi: 10.1371/journal.pone.0093296
De Groot, R., Blignaut, J., Van Der Ploeg, S., Aronson, J., Elmqvist, T., and Farley, J. (2013). Benefits of investing in ecosystem restoration. Conserv. Biol. 27, 1286–1293. doi: 10.1111/cobi.12158
De Groot, R., Brander, L., Van der Ploeg, S., Costanza, R., Bernard, F., Braat, L., et al. (2012). Global estimates of the value of ecosystems and their services in monetary units. Ecosyst. Serv. 1, 50–61. doi: 10.1016/j.ecoser.2012.07.005
DeLaune, R. D., and White, J. R. (2012). Will coastal wetlands continue to sequester carbon in response to an increase in global sea level: a case study of the rapidly subsiding Mississippi river deltaic plain. Clim. Change 110, 297–314. doi: 10.1007/s10584-011-0089-6
Du Preez, M. (2004). The discount rate for public sector conservation projects in South Africa. Afr. Dev. Rev. 16, 456–471. doi: 10.1111/j.1017-6772.2004.00100.x
Evans, D. J., and Sezer, H. (2004). Social discount rates for six major countries. Appl. Econ. Lett. 11, 557–560. doi: 10.1080/135048504200028007
Evans, D. J., and Sezer, H. (2005). Social discount rates for member countries of the European Union. J. Econ. Stud. 32, 47–59. doi: 10.1108/01443580510574832
Fisher, R., Radford, B. T., Knowlton, N., Brainard, R. E., Michaelis, F. B., and Caley, M. J. (2011). Global mismatch between research effort and conservation needs of tropical coral reefs. Conserv. Lett. 4, 64–72. doi: 10.1111/j.1755-263X.2010.00146.x
Gann, G. D., McDonald, T., Walder, B., Aronson, J., Nelson, C. R., Jonson, J., et al. (2019). International principles and standards for the practice of ecological restoration. Restor. Ecol. 27, S1–S46. doi: 10.1111/rec.13035
Gowdy, J., Howarth, R. B., and Tisdell, C. (2010). “Discounting, ethics and options for maintaining biodiversity and ecosystem integrity,” in The Economics of Ecosystems and Biodiversity: Ecological and Economic Foundations, ed. P. Kumar (London: Routledge), 257–278.
Gu, J., Luo, M., Zhang, X., Christakos, G., Agusti, S., Duarte, C. M., et al. (2018). Losses of salt marsh in China: trends, threats and management. Estuar. Coast. Shelf Sci. 214, 98–109. doi: 10.1016/j.ecss.2018.09.015
Hanley, N., Barbier, E. B., and Barbier, E. (2009). Pricing Nature: Cost-Benefit Analysis and Environmental Policy. Cheltenham: Edward Elgar Publishing.
Hanley, N., and Black, A. R. (2006). Cost-benefit analysis and the water framework directive in Scotland. Integr. Environ. Assess. Manag. 2, 156–165. doi: 10.1002/ieam.5630020208
Hardy, T., and Wu, W. (2020). Impact of different restoration methods on coastal wetland loss in Louisiana: Bayesian analysis. Environ. Monit. Assess. 193:1. doi: 10.1007/s10661-020-08746-9
Hochard, J. P., Hamilton, S., and Barbier, E. B. (2019). Mangroves shelter coastal economic activity from cyclones. PNAS 116, 12232–12237. doi: 10.1073/pnas.1820067116
Johnson, B. J., Lovelock, C. E., and Herr, D. (2018). “Climate Regulation: Salt Marshes and Blue Carbon,” in The Wetland Book: Structure and Function, Management, and Methods, eds C. M. Finlayson, M. Everard, K. Irvine, R. J. McInnes, B. A. Middleton, A. A. V. Dam, et al. (Dordrecht: Springer), 1185–1196. doi: 10.1007/978-90-481-9659-3_213
Kirwan, M. L., and Megonigal, J. P. (2013). Tidal wetland stability in the face of human impacts and sea-level rise. Nature 504, 53–60. doi: 10.1038/nature12856
Koch, E. W., Barbier, E. B., Silliman, B. R., Reed, D. J., Perillo, G. M. E., Hacker, S. D., et al. (2009). Non−linearity in ecosystem services: temporal and spatial variability in coastal protection. Front. Ecol. Environ. 7:29–37. doi: 10.1890/080126
Kula, E. (1987). Social interest rate for public sector appraisal in the United Kingdom, the United States and Canada. Project Appraisal 2, 169–174. doi: 10.1080/02688867.1987.9726623
Laegdsgaard, P. (2006). Ecology, disturbance and restoration of coastal saltmarsh in Australia: a review. Wetl. Ecol. Manag. 14, 379–399. doi: 10.1007/s11273-005-8827-z
Lawler, J. J., Aukema, J. E., Grant, J. B., Halpern, B. S., Kareiva, P., Nelson, C. R., et al. (2006). Conservation science: a 20−year report card. Front. Ecol. Environ. 4:473–480. doi: 10.1890/1540-929520064[473:CSAYRC]2.0.CO;2
Li, S., Xie, T., Pennings, S. C., Wang, Y., Craft, C., and Hu, M. (2019). A comparison of coastal habitat restoration projects in China and the United States. Sci. Rep. 9:14388. doi: 10.1038/s41598-019-50930-6
Li, X., Bellerby, R., Craft, C., and Widney, S. E. (2018). Coastal wetland loss, consequences, and challenges for restoration. Anthropocene Coast. 1, 1–15. doi: 10.1139/anc-2017-0001
Li, Y., Xu, J., Wright, A., Qiu, C., Wang, C., and Liu, H. (2021). Integrating two aspects analysis of hydrological connectivity based on structure and process to support muddy coastal restoration. Ecol. Indic. 133:108416. doi: 10.1016/j.ecolind.2021.108416
Lindig-Cisneros, R., and Zedler, J. B. (2002). Halophyte recruitment in a salt marsh restoration site. Estuaries 25, 1174–1183. doi: 10.1007/bf02692214
Liu, Z., Cui, B., and He, Q. (2016). Shifting paradigms in coastal restoration: six decades’ lessons from China. Sci. Total Environ. 56, 205–214. doi: 10.1016/j.scitotenv.2016.05.049
Ma, Y. X., Li, X. Z., Lin, S. W., Xie, Z. L., and Xue, L. M. (2020). Ecosystem services valuation and its uncertainty in wetlands surrounding Chongming. Chin. J. Ecol. 39, 1875–1883. doi: 10.13292/j.1000-4890.202006.011
McKinley, E., Pagès, J. F., Alexander, M., Burdon, D., and Martino, S. (2020). Uses and management of saltmarshes: a global survey. Estuar. Coast. Shelf Sci. 243:106840. doi: 10.1016/j.ecss.2020.106840
Mok, J. (2019). Creating Added Value for Korea’s tidal flats: Using Blue Carbon as an Incentive for Coastal Conservation. [PhD thesis]. California: the University of California.
Narayan, S., Beck, M. W., Reguero, B. G., Losada, I. J., Van Wesenbeeck, B., Pontee, N., et al. (2016). The effectiveness, costs and coastal protection benefits of natural and nature-based defences. PLoS One 11:e0154735. doi: 10.1371/journal.pone.0154735
Neal, W. J., Bush, D. M., and Pilkey, O. H. (2005). “Managed Retreat,” in Encyclopedia of Coastal Science. Encyclopedia of Earth Science Series, ed. M. L. Schwartz (Dordrecht: Springer), 602–606. doi: 10.1007/978-3-319-48657-4_201-2
Nesticò, A., and Maselli, G. (2020). A protocol for the estimate of the social rate of time preference: the case studies of Italy and the USA. J. Econ. Stud. 47, 527–545. doi: 10.1108/JES-02-2019-0081
Neßhöver, C., Aronson, J., Blignaut, J., Eppink, F., Vakrou, A., Wittmer, H., et al. (2011). “Investing in ecological infrastructure,” in The Economics of Ecosystems and Biodiversity in National and International Policy Making, ed. P. T. Brink (London: Routledge), 401–442.
Restore America’s Estuaries. (2011). Jobs and Dollars: Big Returns from Coastal Habitat Restoration. Available online at: https://estuaries.org/wp-content/uploads/2019/01/Jobs-and-Dollars_2011.pdf (accessed November 2, 2021).
Roman, C. T., and Burdick, D. M. (2012). Tidal Marsh Restoration-A Synthesis of science and management. Washington DC: Island press.
Saintilan, N. (2013). “Rehabilitation and management of saltmarsh habitats,” in Workbook for Managing Urban Wetlands in Australia, ed. S. Paul (Sydney: Sydney Olympic Park Authority), 309–320.
Schoonees, T., Mancheño, A. G., Scheres, B., Bouma, T. J., Silva, R., Schlurmann, T., et al. (2019). Hard structures for coastal protection, towards greener designs. Estuar. Coast. 42, 1709–1729. doi: 10.1007/s12237-019-00551-z
Scott, D. B., Frail-Gauthier, J., and Mudie, P. J. (2014). Coastal Wetlands of the World: Geology, Ecology, Distribution and Applications. Cambridge: Cambridge University Press.
Secretariat of the Convention on Biological Diversity (2020). Global Biodiversity Outlook 5. Available online at: https://www.cbd.int/gbo5 (accessed January 21, 2022)
Society for Ecological Restoration (2004). The SER International Primer on Ecological Restoration. Available online at: https://www.ser-rrc.org/resource/the-ser-international-primer-on/ (accessed January 21, 2022)
Song, J. (2016). An Empirical Investigation of Social Discount Rate: Case of Korea. Available online at: https://www.dbpia.co.kr/Journal/articleDetail?nodeId=NODE07097608 (accessed March 25, 2022).
Spurgeon, J. (1999). The Socio-Economic Costs and Benefits of Coastal Habitat Rehabilitation and Creation. Mar. Pollut. Bull. 37, 373–382. doi: 10.1016/s0025-326x(99)00074-0
Stewart-Sinclair, P. J., Purandare, J., Bayraktarov, E., Waltham, N., Reeves, S., Statton, J., et al. (2020). Blue restoration–building confidence and overcoming barriers. Front. Mar. Sci. 7:541700. doi: 10.3389/fmars.2020.541700
Su, J., Friess, D. A., and Gasparatos, A. (2021). A meta-analysis of the ecological and economic outcomes of mangrove restoration. Nat. Commun. 12:5050. doi: 10.1038/s41467-021-25349-1
Taillardat, P., Thompson, B. S., Garneau, M., Trottier, K., and Friess, D. A. (2020). Climate change mitigation potential of wetlands and the cost-effectiveness of their restoration. Interface Focus 10:20190129. doi: 10.1098/rsfs.2019.0129
Tang, J., Ye, S., Chen, X., Yang, H., Sun, X., Wang, F., et al. (2018). Coastal blue carbon: concept, study method, and the application to ecological restoration. Sci. CHIN. Earth Sci. 61, 637–646. doi: 10.1007/s11430-017-9181-x
Taylor, D. S. (2011). Removing the sands (sins?) of our past: dredge spoil removal and saltmarsh restoration along the Indian River Lagoon, Florida (USA). Wetl. Ecol. Manag. 20, 213–218. doi: 10.1007/s11273-011-9236-0
The United Nations Ocean Conference (2017). Factsheet: People and Oceans. Available online at: https://www.un.org/sustainabledevelopment/wp-content/uploads/2017/05/Ocean-fact-sheet-package.pdf (accessed January 21, 2022)
Turner, R. K., Burgess, D., Hadley, D., Coombes, E., and Jackson, N. (2007). A cost–benefit appraisal of coastal managed realignment policy. Glob. Environ. Change 17, 397–407. doi: 10.1016/j.gloenvcha.2007.05.006
United Nations Environment Programme -World Conservation Monitoring Centre, International Union for Conservation of Nature, and National Geographic Society (2018). Protected Planet Report 2018. Available online at: https://portals.iucn.org/library/node/48344 (accessed January 21, 2022).
van Zelst, V., Dijkstra, J. T., van Wesenbeeck, B. K., Eilander, D., Morris, E. P., Winsemius, H. C., et al. (2021). Cutting the costs of coastal protection by integrating vegetation in flood defences. Nat. Commun. 12:6533. doi: 10.1038/s41467-021-26887-4
Wainaina, P., Minang, P. A., Gituku, E., and Duguma, L. (2020). Cost-benefit analysis of landscape restoration: a stocktake. Land 9:465. doi: 10.3390/land9110465
Waltham, N. J., Elliott, M., Lee, S. Y., Lovelock, C., Duarte, C. M., Buelow, C., et al. (2020). UN Decade on Ecosystem Restoration 2021–2030—what chance for success in restoring coastal ecosystems? Front. Mar. Sci. 7:71. doi: 10.3389/fmars.2020.00071
Wang, D., Bai, J., Wang, W., Ma, X., Guan, Y., Gu, C., et al. (2020). Micro-topography manipulations facilitate Suaeda Salsa marsh restoration along the lateral gradient of a tidal creek. Wetlands 40, 1657–1666. doi: 10.1007/s13157-020-01308-2
Wang, H. Z., Du, S. Y., and Zeng, X. F. (2013). Evaluating China’s Social Discount Rate Based on SRTP. Stat. Decis. 21, 18–21. doi: 10.13546/j.cnki.tjyjc.2013.21.012
Wang, Q., Xie, T., Luo, M., Bai, J., Chen, C., Ning, Z., et al. (2021). How hydrological connectivity regulates the plant recovery process in salt marshes. J. Appl. Ecol. 58, 1314–1324. doi: 10.1111/1365-2664.13879
Wei, F. W., Costanza, R., Dai, Q., Stoeckl, N., Gu, X. D., Farber, S., et al. (2018). The Value of Ecosystem Services from Giant Panda Reserves. Curr. Biol. 28, 2174–2180. doi: 10.1016/j.cub.2018.05.046
Wortley, L., Hero, J.-M., and Howes, M. (2013). Evaluating ecological restoration success: a review of the literature. Restor. Ecol. 21, 537–543. doi: 10.1111/rec.12028
Zhang, Y. S., Cioffi, W. R., Cope, R., Daleo, P., Heywood, E., Hoyt, C., et al. (2018). A global synthesis reveals gaps in coastal habitat restoration research. Sustainability 10:1040. doi: 10.3390/su10041040
Zhuang, J., Liang, Z., Lin, T., and De Guzman, F. (2007). Theory and Practice in the Choice of Social Discount Rate for Cost-Benefit Analysis: a Survey. Los Baños: ERD working paper series.
Keywords: salt marshes, ecological restoration, restoration cost, restoration outcome, mismatch, carbon
Citation: Wang J-J, Li X-Z, Lin S-W and Ma Y-X (2022) Economic Evaluation and Systematic Review of Salt Marsh Restoration Projects at a Global Scale. Front. Ecol. Evol. 10:865516. doi: 10.3389/fevo.2022.865516
Received: 30 January 2022; Accepted: 07 March 2022;
Published: 08 April 2022.
Edited by:
Guangxuan Han, Yantai Institute of Coastal Zone Research (CAS), ChinaReviewed by:
Chuan Tong, Fujian Normal University, ChinaDongdong Shao, Beijing Normal University, China
Copyright © 2022 Wang, Li, Lin and Ma. This is an open-access article distributed under the terms of the Creative Commons Attribution License (CC BY). The use, distribution or reproduction in other forums is permitted, provided the original author(s) and the copyright owner(s) are credited and that the original publication in this journal is cited, in accordance with accepted academic practice. No use, distribution or reproduction is permitted which does not comply with these terms.
*Correspondence: Xiu-Zhen Li, eHpsaUBza2xlYy5lY251LmVkdS5jbg==
 Jiang-Jing Wang
 Xiu-Zhen Li1,2*
