 Pradeep Adhikari
 Yong Ho Lee1,2†
 Prabhat Adhikari
 Sun Hee Hong
 Yong-Soon Park
- 1Institute of Humanities and Ecology Consensus Resilience Lab, Hankyong National University, Anseong, South Korea
- 2Ojeong Resilience Institute, Korea University, Seoul, South Korea
- 3Central Department of Botany, Tribhuvan University, Kirtipur, Nepal
- 4School of Plant Science and Landscape Architecture, College of Agriculture and Life Sciences, Hankyong National University, Anseong, South Korea
- 5Biotechnology Research Institute, College of Natural Sciences, Chungbuk National University, Cheongju, South Korea
Species distribution modeling is widely used for evaluating invasion risk, and for prioritizing areas for the control and management of invasive species. However, selecting a modeling tool that accurately predicts species invasion risk requires a systematic approach. In this study, five species distribution models (SDMs), namely, artificial neural network (ANN), generalized linear model (GLM), multivariate adaptive regression splines (MARS), maximum entropy (MaxEnt), and random forest (RF), were performed and evaluated their model performance using the mean value of area under the curve (AUC), true skill statistics (TSS), and Kappa scores of 12 ecosystem disturbing alien plant species (EDAPS). The mean evaluation metric scores were highest in RF (AUC = 0.924 ± 0.058, TSS = 0.789 ± 0.109, Kappa = 0.671 ± 0.096, n = 12) and lowest in ANN. The ANOVA of AUC, TSS, and Kappa metrics revealed the RF model was significantly different from other SDMs and was therefore selected as the relatively best model. The potential distribution area and invasion risk for each EDAPS were quantified. Under the current climate conditions of South Korea, the average potential distribution area of EDAPS was estimated to be 13,062 km2. However, in future climate change scenarios, the average percentage change of EDAPS distribution relative to the current climate was predicted to be increased over 219.93%. Furthermore, under the current climate, 0.16% of the area of the country was estimated to be under a very high risk of invasion, but this would increase to 60.43% by 2070. Invasion risk under the current climate conditions was highest in the northwestern, southern, and southeastern regions, and in densely populated cities, such as Seoul, Busan, and Daegu. By 2070, invasion risk was predicted to expand across the whole country except in the northeastern region. These results suggested that climate change induced the risk of EDAPS invasiveness, and SDMs could be valuable tools for alien and invasive plant species risk assessment.
Introduction
Introduction of alien and invasive species poses a serious threat to native biodiversity, ecosystem integrity, and agricultural productivity, which in turn results in large economic losses worldwide (Early et al., 2016; Díaz et al., 2019). Invasive species cause trophic imbalance and decrease species resilience (Weiskopf et al., 2020). Moreover, global climate change aggravates the risk of alien and invasive plant species and expands their range (Weiskopf et al., 2020). Earlier studies report that many alien and invasive species have traits that increase invasion success and enable them to readily adapt to climate change. These traits include greater tolerance to increased temperatures, intensive growth under elevated carbon dioxide levels, and geographic latitude-dependent phenotypic plasticity (Molina-Montenegro and Naya, 2012). In addition, extreme climatic events, such as prolonged heat waves, excessive drought, and heavy precipitation, facilitate plant invasion and decrease native species resistance to biotic stresses (Diez et al., 2012). For almost two decades, several researchers have anticipated that climate change will enhance the spread of alien and invasive species. However, actual evidence for climate change-facilitated alien species invasiveness is limited and poorly synthesized (Hulme, 2017), which inhibits the proactive prevention and management of alien and invasive species in the ecosystems they affect (Bonebrake et al., 2018).
Human-induced factors, such as anthropogenic land cover change, urbanization, and the construction of transportation corridors, increase invasion risk of alien plants by promoting disturbances and seed dispersal, which in turn create new habitats that enable invasive weeds to thrive, while inhibiting native species (Vila and Ibáñez, 2011; Wang et al., 2016; Rew et al., 2018). Therefore, along with climate change, other environmental variables, such as land cover change, should be considered in species distribution modeling to more effectively identify areas that are at high risk of invasion by unwanted plant species.
The rapidly growing human population accelerates economic development, international trade, and tourism, which are factors that increase the introduction of alien and invasive species (Lin et al., 2011; Seebens et al., 2018). South Korea is the world’s 12th largest importer of goods, including agriculture products, leading to the introduction of alien and invasive species (UN, 2020). Until 2016, 427 alien and invasive plant taxa were intentionally or unintentionally introduced to South Korea, resulting in their invasion of agricultural fields, orchards, and pastures (NIE, 2017; Young et al., 2017). The Ministry of Environment, South Korea listed 16 alien and invasive plants as ecosystem disturbing alien plant species (EDAPS) based on their noxious characteristics and high invasion potential to the ecosystem (Young et al., 2017; MoE, 2022). Alien and invasive species, including EDAPS, cause the loss of approximately 22.6 billion Korean Won per year (MoE, 2014). Because of the harmful effects of invasive plant species on the country’s economy, it is necessary to profile alien and invasive species, and identify high invasion risk areas. Doing so will enable the adoption of cost-effective control and management strategies to minimize the threats of EDAPS invasion in South Korea. Moreover, implementing tools that can forecast potential changes in invasive species distribution and accurately assess future invasion risks is required.
The problems caused by invasive species prompted us to study invasive weeds in South Korea under future climate change scenarios, to guide the development of measures to control their spread (Adhikari et al., 2021; Hong et al., 2021). In one study, 16 invasive weeds from the southern region (<36° latitude) were evaluated. These 16 weed species were estimated to expand their range and habitat to the northern region of the country in large scale over 145.19% in year 2070 (Hong et al., 2021). In another study, ten alien plant species that were intentionally introduced for horticulture, pasture improvement, and soil erosion control were assessed for their spatial invasion risk. Under future climate change scenarios, intentionally introduced species are predicted to spread to non-targeted ecosystems and occupy approximately 86.21% area of the country, which falls under the moderate- to high-risk category (Adhikari et al., 2021). Both of our previous studies identify rapid environmental changes that carry an increasing risk of alien weed invasion. These reports indicate that the rise in invasive weeds could seriously threaten natural ecosystem integrity and cropland productivity in South Korea.
Risk assessment is an essential step before initiating procedures for the control and eradication of alien and invasive species. Numerous risk assessment tools are used to quantify invasion risk of alien plant species (Morse et al., 2004; Robertson et al., 2021). Species distribution models (SDMs), for example, are widely used tools to assess the invasion risk of alien plants, and aid in designing conservation policies for their control and eradication (Bradley et al., 2010; Dullinger et al., 2017; Adhikari et al., 2021). SDMs resolve the ecological niche of plant species by statistical regression, machine learning, and spatial interpolation (Elith and Leathwick, 2009; Li and Wang, 2013; Zurell et al., 2020). However, the large number of SDM algorithms make it difficult to select the best algorithm and methodology (Elith et al., 2010). Moreover, a single SDM may not always provide accurate predictions for risk assessment, and there is no modeling technique that consistently performs better in predicting invasiveness across species, regions, and applications (Elith et al., 2006; Koo et al., 2017). Evaluating many models and selecting the best one based on its predictive performance allow the acquisition of more reliable predictions (Mainali et al., 2015; Koo et al., 2017; Zurell et al., 2020; Ahmed et al., 2021). Therefore, we adopted this concept in the risk assessment of EDAPS in South Korea.
The main objective of this study was to conduct a risk assessment of EDAPS present in South Korea. The specific objectives were as follows: (1) Selection of the best algorithm between two statistical regression-based models, namely, the generalized linear model (GLM) and multivariate adaptive regression splines (MARS), and among three machine learning models, namely, artificial neural network (ANN), maximum entropy (MaxEnt), and random forest (RF). Algorithms were assessed using established the model calibration techniques, area under the curve (AUC) value of receiver operating curve (ROC) (Pearson, 2010), true skill statistics (TSS) (Allouche et al., 2006), and Kappa scores (McHugh, 2012). (2) Estimate the potential distribution area of 12 EDAPS and assess invasion risk using the best SDM algorithm under the current and future climate change scenarios, representative concentration pathways (RCP) 4.5 and RCP 8.5, and land cover changes in South Korea.
Materials and methods
Study area
South Korea is located at the southern part of the Korean Peninsula. It has a total land area of 98,477 km2, and is surrounded by the East Sea, the Yellow Sea, and the East China Sea (NIBR, 2014). The country has more than 3,000 islands with a coastline that is approximately 2,413 km long (NIBR, 2014). The country has diverse patterns of climate, ranging from warm oceanic climates to cold continental climates characterized by four seasons. Winters are long and dry with average temperatures of −6 to 3°C, while summers are short and humid with average temperatures of 23–26°C (KMA, 2021). Heavy precipitation occurs in the summer season because of the East Asian monsoon, leading to an average annual precipitation of 1,000–1,800 mm (KMA, 2021). South Korea has 41,483 species, which include, but are not limited to, 5,308 vascular plants, 1,899 vertebrates, and 22,612 invertebrates (NIBR, 2014).
Species occurrence records of ecosystem disturbing alien plant species
Twelve EDAPS in South Korea (Table 1; Figure 1) were selected based on the availability of minimum species presence points for species distribution modeling, and invasion potential in natural ecosystems and agricultural lands (NIE, 2017; Young et al., 2017). The process of survey design, recording of species occurrence, and spatial filtering of species occurrence points were performed as described in Adhikari et al. (2021) and Hong et al. (2021).
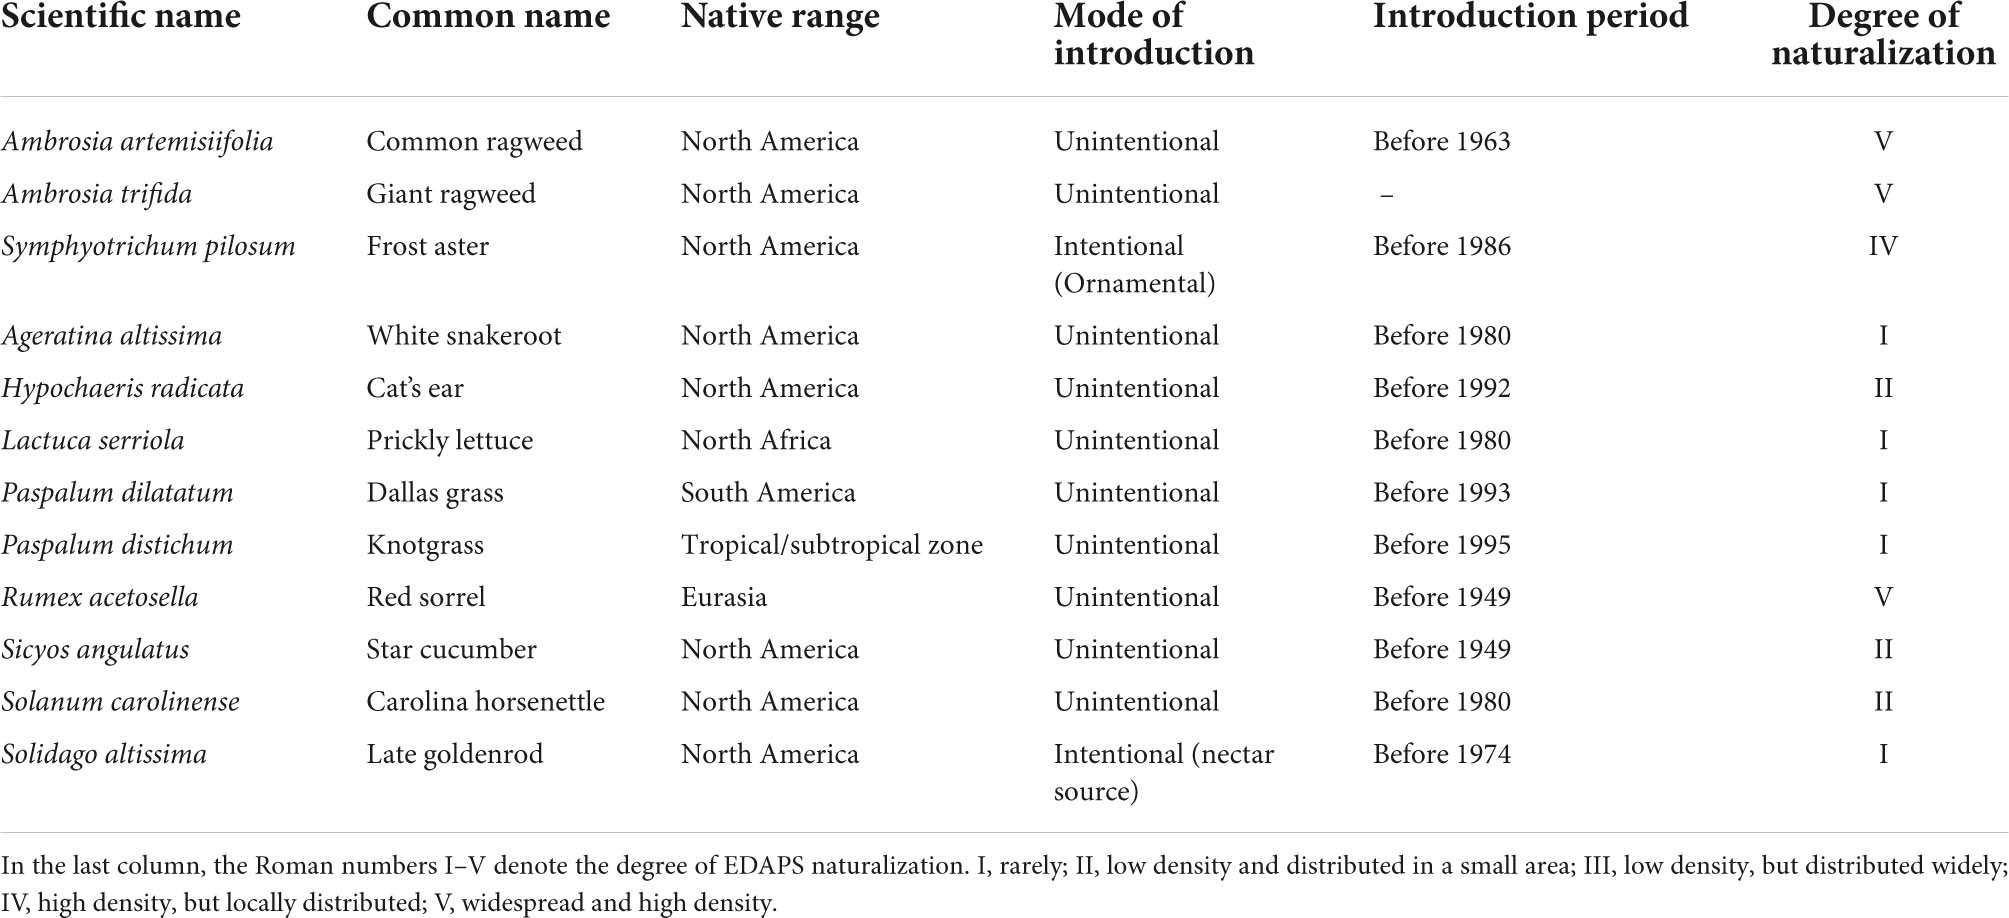
Table 1. List of ecosystem disturbing alien plant species (EDAPS) used in the study.
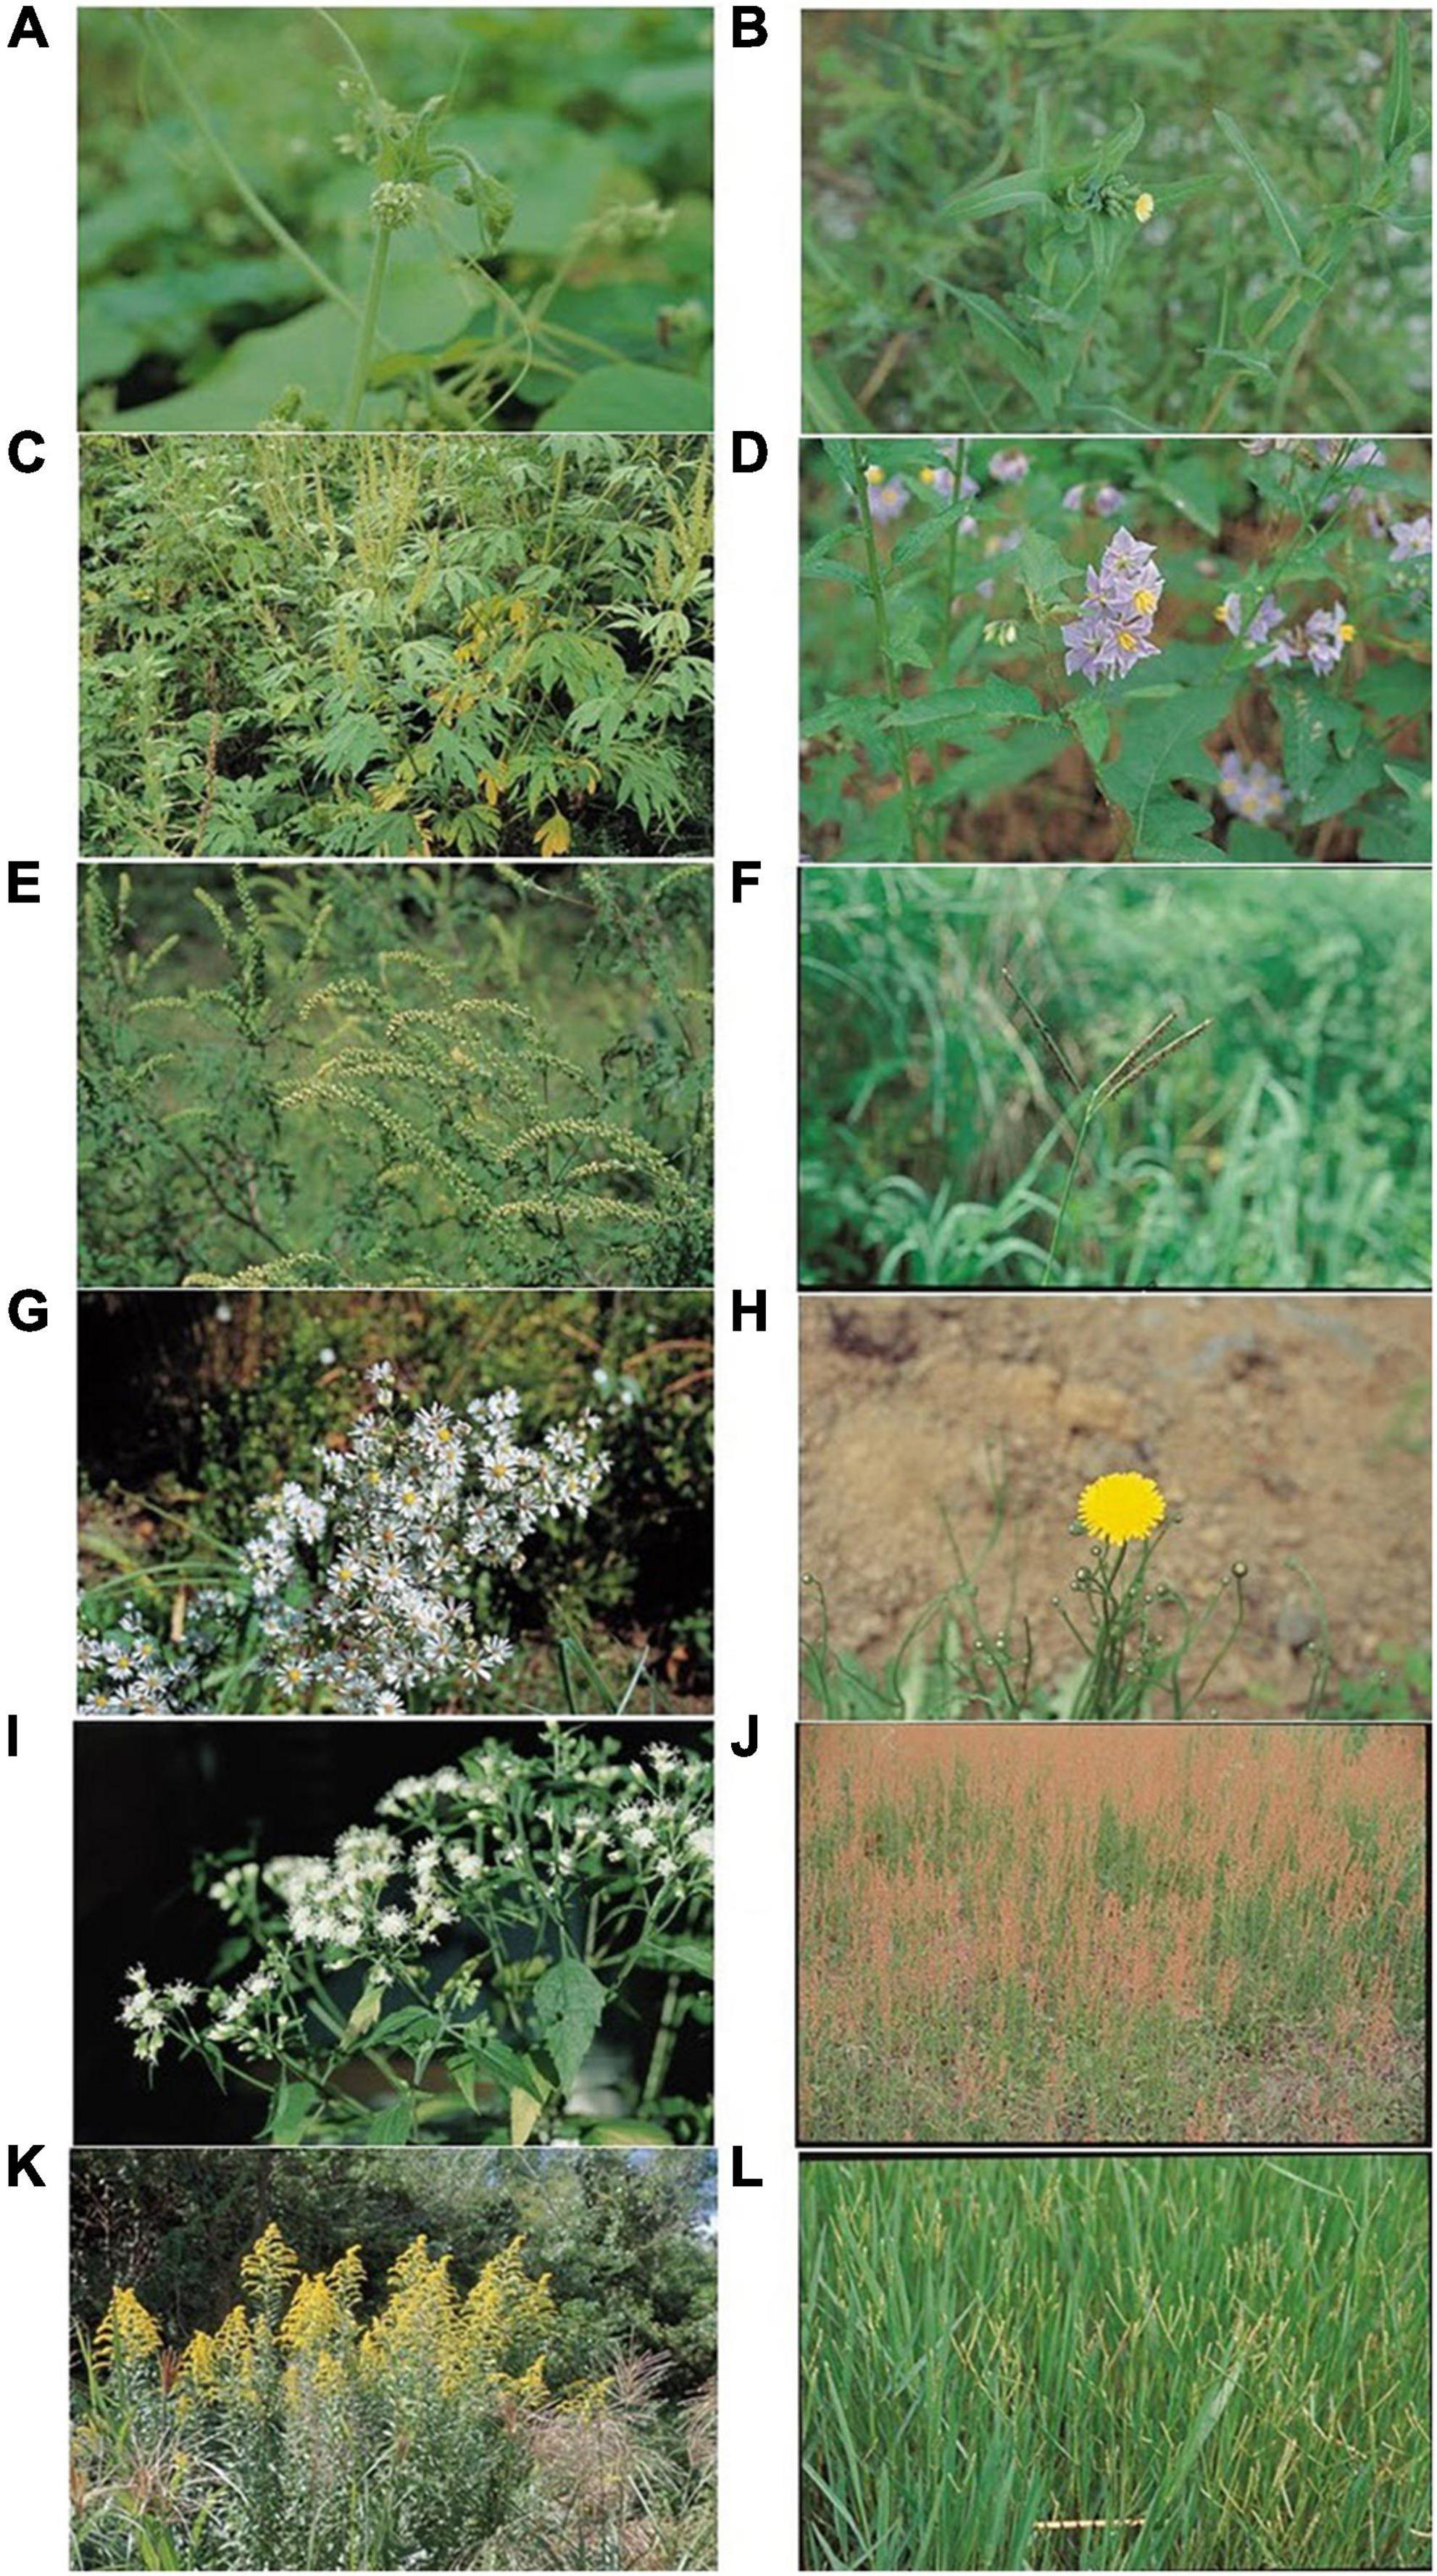
Figure 1. Photographs of EDAPS used in this study. (A) Sicyos angulatus, (B) Lactuca serriola, (C) Ambrosia trifida, (D) Solanum carolinense, (E) Ambrosia artemisiifolia, (F) Paspalum distichum, (G) Symphyotrichum pilosum, (H) Hypochaeris radicata, (I) Ageratina altissima, (J) Rumex acetosella, (K) Solidago altissima, and (L) Paspalum dilatatum.
Selection of bioclimatic and environmental variables for modeling
Land cover change, distance from the road, distance from the water, and 19 bioclimatic variables were considered as essential parameters for predicting the distribution of the 12 EDAPS (Supplementary Table 1). Climate data, which included precipitation, and monthly minimum and maximum temperature, were obtained from the KMA1 (unpublished data; Table 2). The data were used to develop climate change scenarios for current and future South Korean climates. Two climate change scenarios, namely, RCP 4.5 and RCP 8.5, were chosen for the year 2070. The current and the year 2070 (i.e., future) climates were calculated by averaging climate metrics from years 1950 to 2000, and 2066 to 2075, respectively (Adhikari et al., 2020b; Kim et al., 2021). HadGEM3-RA is a global climate model developed by the Met Office Hadley Centre, London, United Kingdom.2 It is used by the KMA for developing national climate change scenarios for South Korea because of the country’s complex topography, uneven coastlines, and more than 3,000 islands of the country (Lee et al., 2012). Therefore, the HadGEM3-RA global circulation model was selected for determining RCP 4.5 and RCP 8.5 climate change scenarios using the R Package Dismo v. 1.3 (Hijmans et al., 2020).
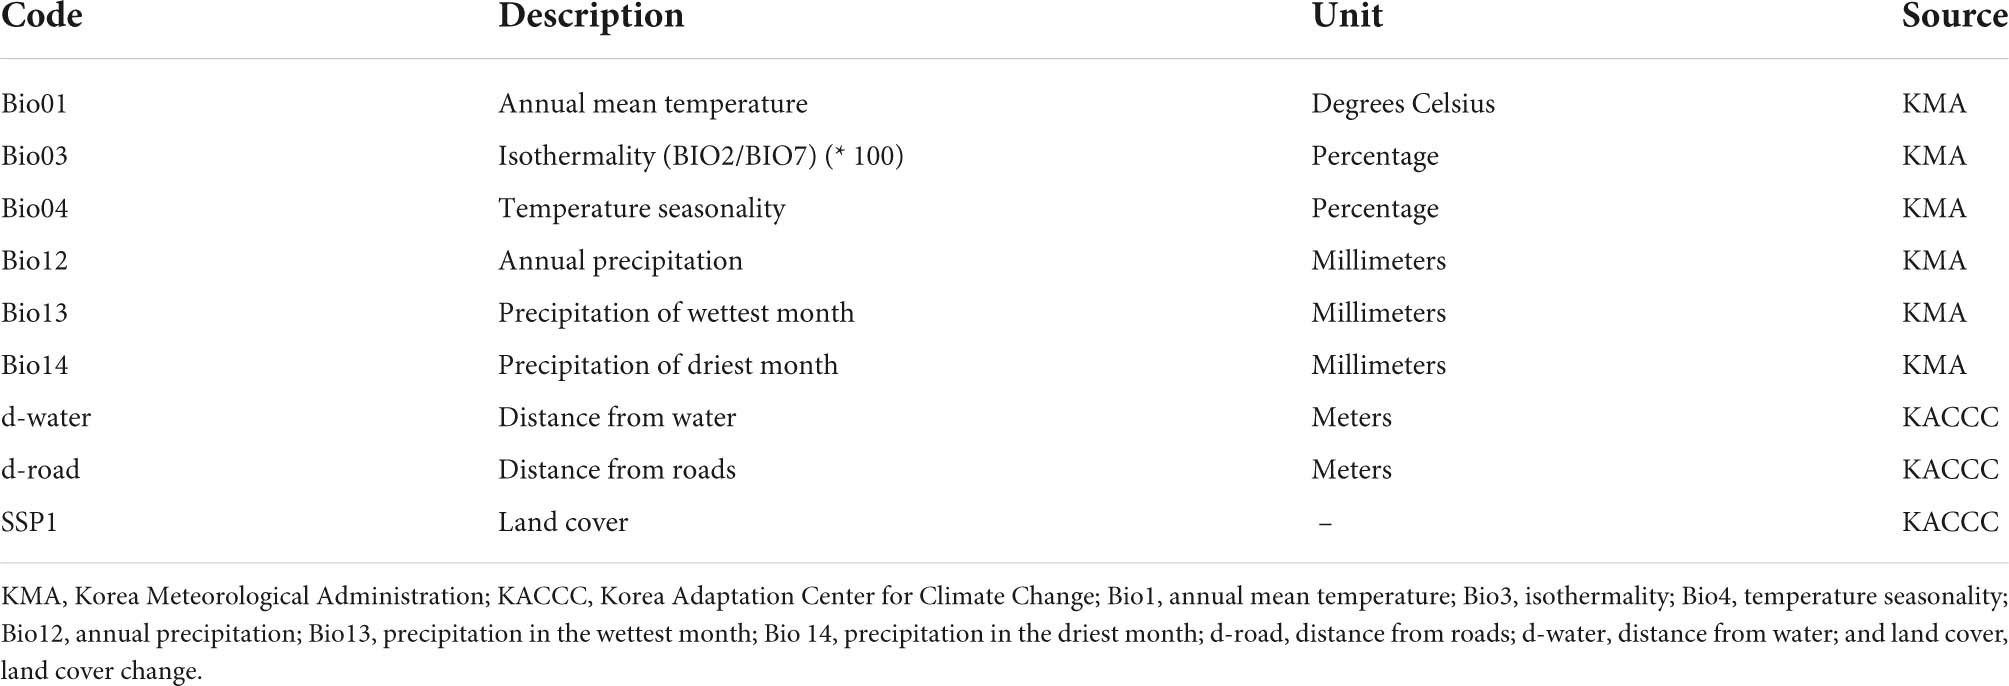
Table 2. List of variables used in the modeling of ecosystem disturbing alien plant species.
In addition to bioclimatic variables, diverse environmental variables, including land cover changes (e.g., grassland, forest, urban, cropland, wetland, barren, and water), distance from the road (d-road), and distance from the water (d-water), were used for alien plant species and weed modeling. Land cover data, d-water, and d-road data were downloaded from the Korea Adaptation Center for Climate Change3 (accessed on October 11 2021). Spearman’s correlation was used (Supplementary Table 2) on pairs with the Proc Corr function of SAS 9.4 to minimize autocorrelation (r2 > 0.75, p = 0.05) among bioclimatic and environmental variables (SAS Institute, Inc., Cary, NC, United States), as described in Shin et al. (2018), Jeon et al. (2020). All the variables had a spatial resolution of 0.01° (30 s), which have an area of approximately 1 km2.
Species distribution modeling using artificial neural network, generalized linear model, multivariate adaptive regression splines, maximum entropy, and random forest models
Species distribution modeling was performed using two regression-based models, GLM and MARS, and three machine learning models, ANN, MaxEnt, and RF. Regression-based models predict future species distribution based on the relationship between dependent variables and several independent variables (Araghinejad, 2014). Regression models range from linear to non-linear, and from parametric to non-parametric (Araghinejad, 2014). The GLM is a flexible and relatively simple tool derived from linear models that allows for non-linearity and non-constant variance structures in data by not forcing data into unnatural scales (Hastie and Tibshirani, 2017). GLM is particularly applicable for analyzing non-normal distribution data, such as binomial and Poisson distributions (Bolker et al., 2009). MARS was developed from linear regression models that spontaneously determine non-linearities and interactions between predictor variables. MARS is particularly suitable for a wide range of predictor variables (Choe et al., 2016) and a large number of explanatory variables with low order interaction effects (Thuiller et al., 2010).
In addition to regression-based models, machine learning methods accelerate processing and analysis of massive raw data repositories (Berger-Wolf et al., 2017), allowing for faster ecological studies and broader geographical scopes. Moreover, machine learning models extract hidden characteristics from input data and are appropriate for analyzing datasets with a complex correlation structure. For machine learning models, ANNs are non-linear models that have a network of simple elements or artificial neurons with a complex global behavior (Hopfield, 1982). The hidden neurons in a layer receive information from inputs, which are summed and processed using a fixed function. ANNs run similar to multiple regression when outputs are categorical or continuous variables (Li and Wang, 2013). MaxEnt is a machine learning algorithm that determines species distribution using presence-only data and pseudoabsence data based on the MaxEnt theory (Phillips et al., 2006; Phillips and Dudík, 2008). The MaxEnt model performs robust predictions while making minimum effort in parameter tuning through default settings (Phillips et al., 2006). The RF is a novel ensemble classifier that generates a large number of decision trees, in which classes are determined by a majority vote (Li and Wang, 2013). RF has many qualitative features. It handles thousands of input variables without deleting any, manages correlated variables effectively, and has a robust method for processing unbalanced data sheets and missing data. As such, RF is considered one of the most accurate machine learning algorithms with high predictive performance (Breiman, 2001).
The absence data of alien and invasive species is not always trustworthy. The expanding distribution range of alien and invasive species, and the fact that they have not yet attained equilibrium, result in misinterpretation (Jiménez-Valverde et al., 2011). Therefore, we used background (pseudoabsence) points of study area, which were determined with ArcGIS 10.3 (Esri, Redlands, CA, United States) as suggested by Thuiller et al. (2021). Species distribution modeling with ANN, GLM, MARS, MaxEnt, and RF was performed by selecting a single model in the “Biomod2” Package v.3.5.1. for GNU R4 (Thuiller et al., 2021), as described in Adhikari et al. (2021). The species occurrence data were split into a 3:1 ratio for model calibration and validation. All the modeling options for each algorithm were set with default values according to the guidelines of the “Biomod2” Package v.3.5.1. (Thuiller et al., 2021), but the model replications were 100 for each SDM.
Evaluation of model performance and validation using area under the curve, true skill statistics, and Kappa values
Three measures, namely, the AUC values of the ROC curves (Pearson, 2010), the TSS (Allouche et al., 2006), and the Kappa statistic (McHugh, 2012), were used to evaluate and validate model performance. The process of model calibration and validation were performed as described in Adhikari et al. (2021, 2022). In this study, computing AUC, TSS, and Kappa did not only compare the predictive performances of the models, but also selected the best model using corresponding scores for 12 EDAPS. Mean scores of AUC, TSS, and Kappa were estimated and presented as graphs to compare the degree of prediction accuracy among the five SDMs and thereby enable selection of the best model. Analysis of variance (ANOVA) (Table 3) and Duncan’s multiple range test were then performed using SAS 9.4 to determine statistically significant differences among the five SDMs. The process of selecting the best model using AUC, TSS, and Kappa values was consistent with Koo et al. (2017) and Mainali et al. (2015). The ROC curve, TSS, and Kappa analyses were implemented with the “Biomod2” Package v.3.5.1. for GNU R. The optimal TSS scores were used to convert probability distribution maps into binary distribution map representing suitable or unsuitable habitats by employing the optimal threshold that enhanced the highest TSS score as a cutoff value in Biomod2 (Thuiller et al., 2021). The optimal TSS scores were estimated by default in Biomod2 were species specific and varied in different SDMs. The modeling procedure used in this study is summarized in the flowchart shown in Figure 2.
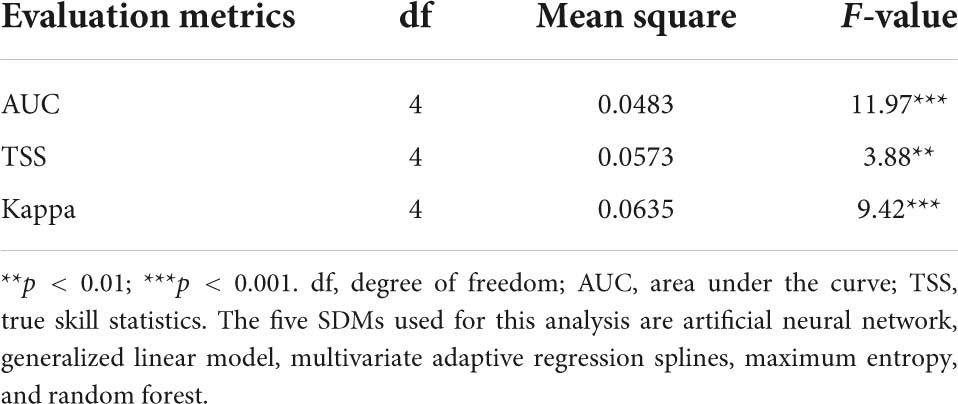
Table 3. Analysis of variance of AUC, TSS, and Kappa determined using five species distribution models (SDMs).
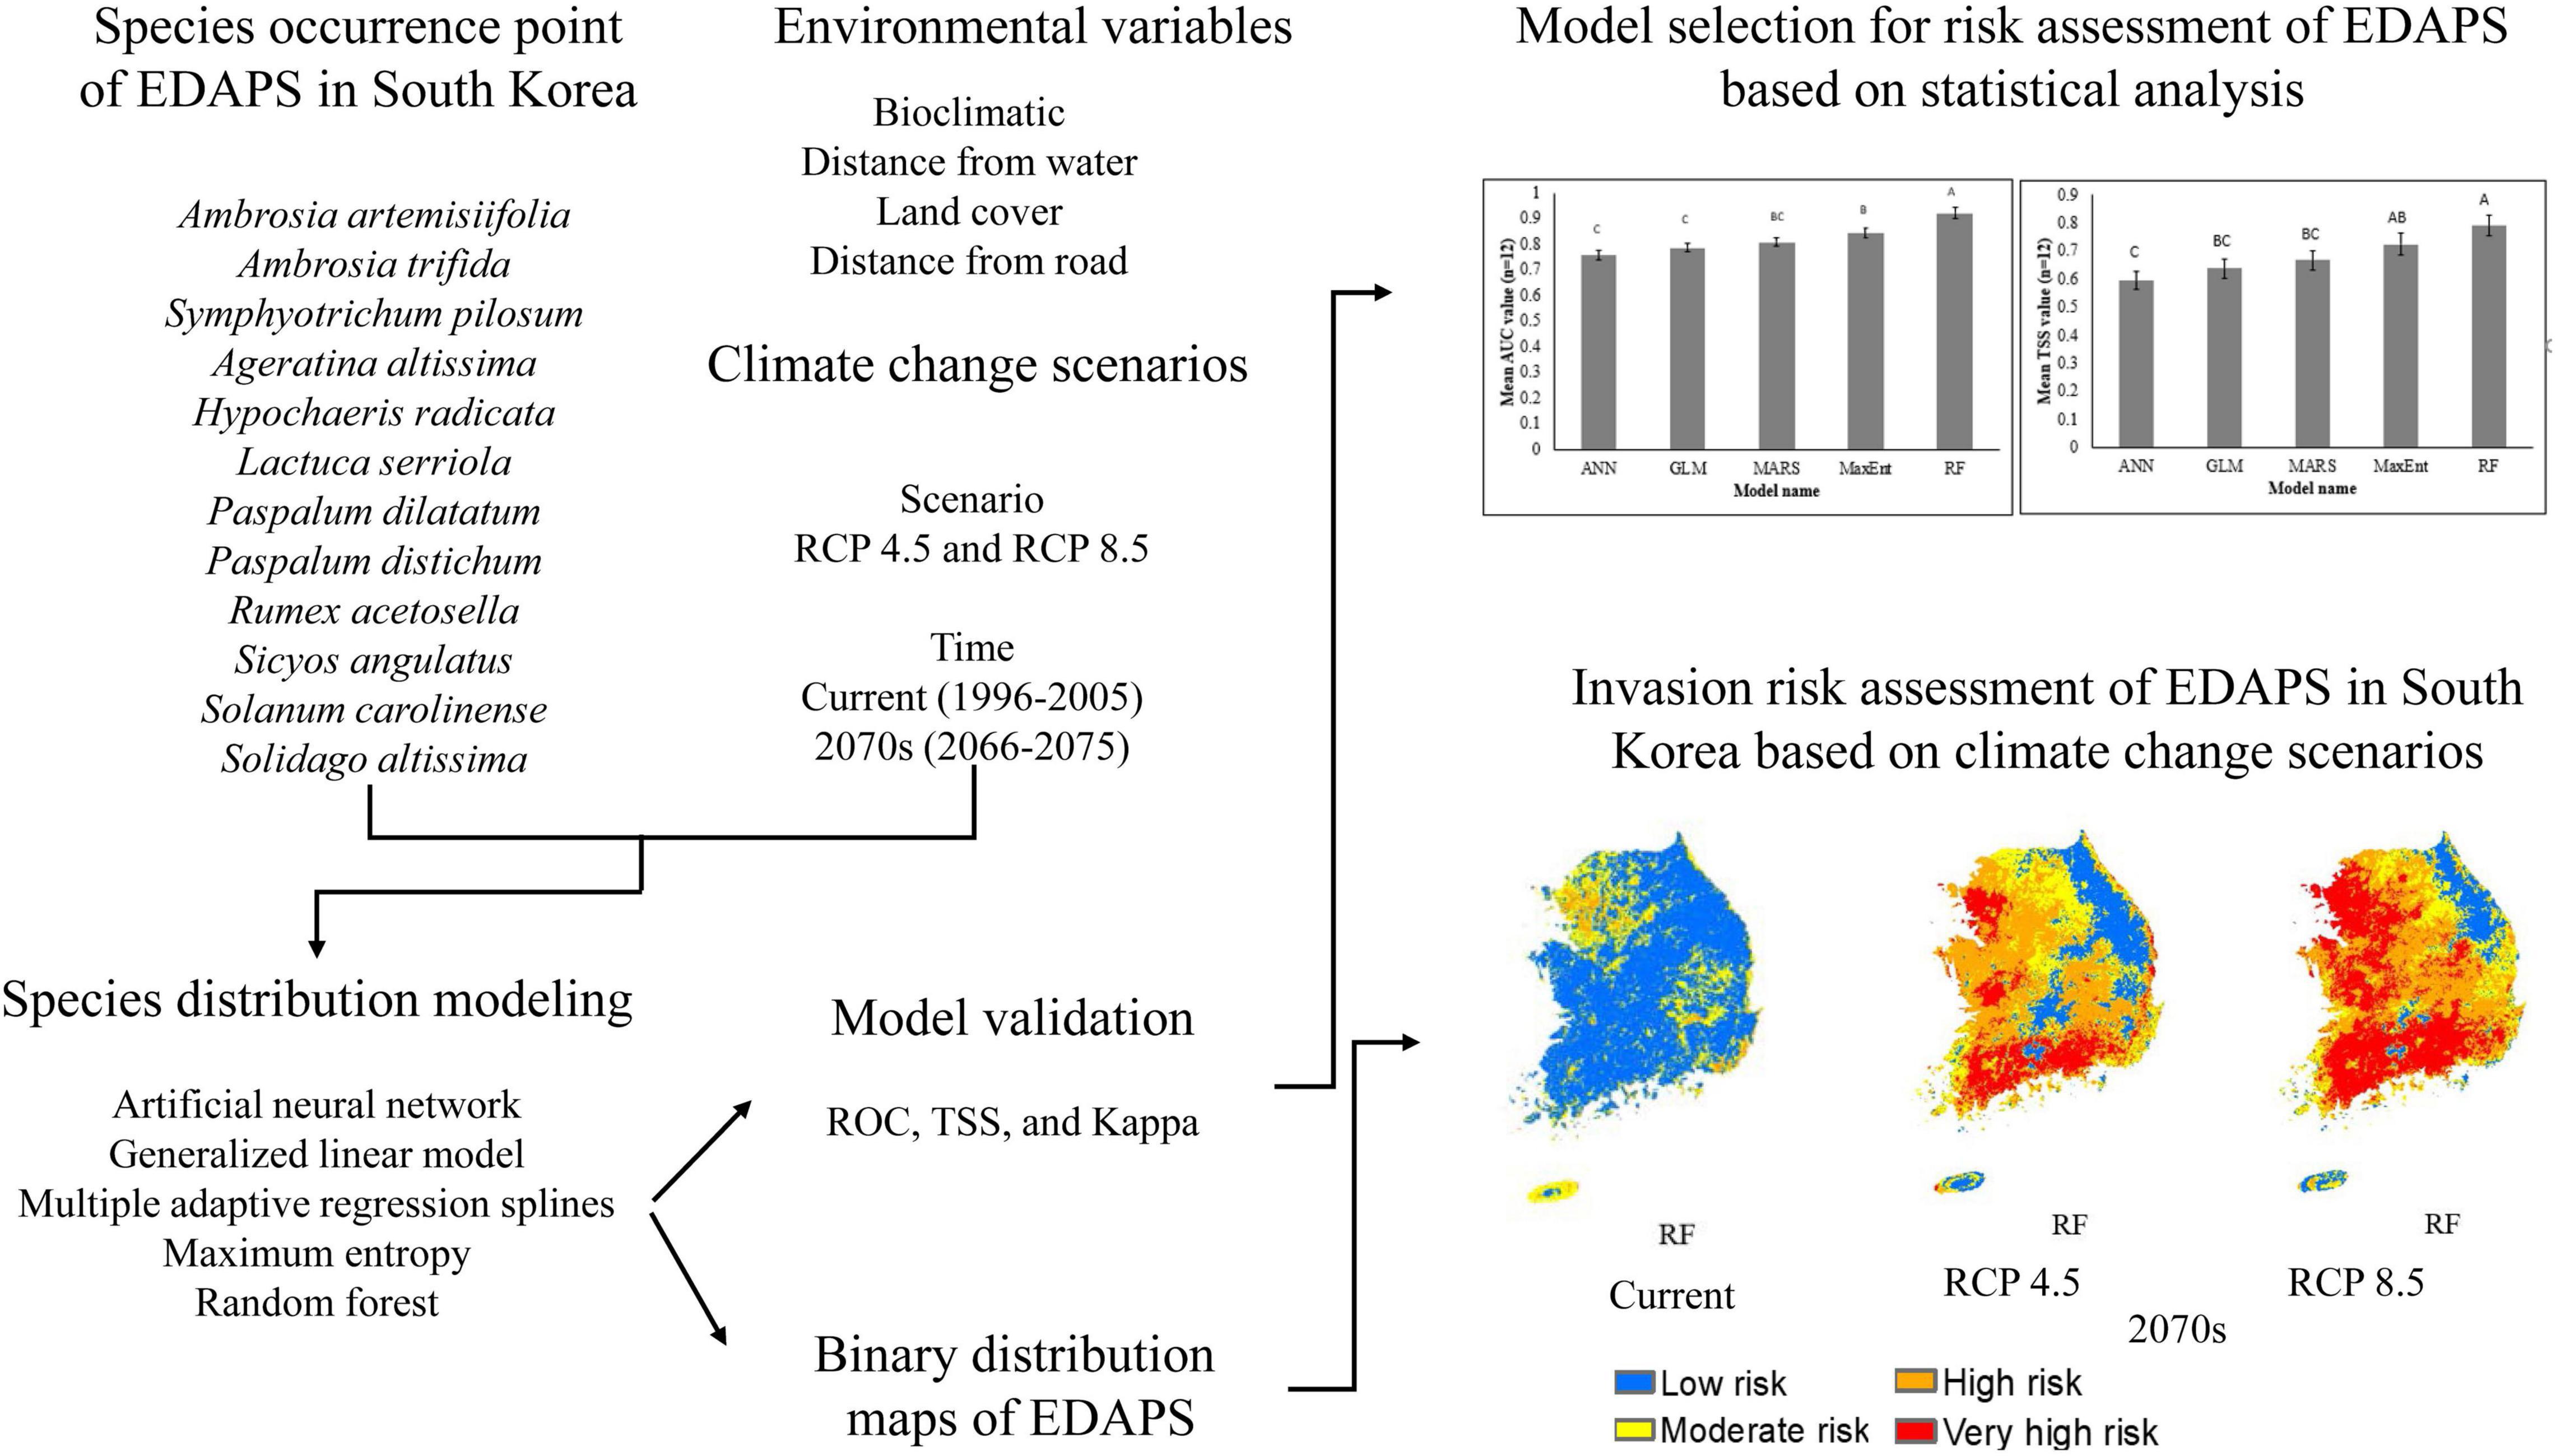
Figure 2. Flow chart showing database and modeling methods for predicting EDAPS invasion risk in South Korea.
Prediction of potential distribution and invasion risk of ecosystem disturbing alien plant species
The areas of suitable habitats of all alien weeds were estimated using a best model under the current and future climate change scenarios. The average percentage of relative change of EDAPS distribution under RCP 4.5 and RCP 8.5 climate change scenarios for 2070 was calculated and compared with that of the current climate change scenario and presented in tabulated form (Table 4). The binary distribution maps of 12 EDAPS obtained in each model were summed up using the Raster 3.4 Package in GNUR4.03. An aggregated distribution map of current and future climate change scenarios, and land cover changes in South Korea, were obtained. Invasion risk maps were produced using the aggregated distribution maps, in which cells with higher species richness represented a larger invasion risk, and therefore potentially a greater hazard for the environment. Invasion risk was divided into four categories: low risk, moderate risk, high risk, and very high risk, based on the linear scale described in Adhikari et al. (2021). The invasion risk maps obtained from the different models and the area covered by each risk category were compared to the total area of the country under the RCP 4.5 and RCP 8.5 climate change scenarios.
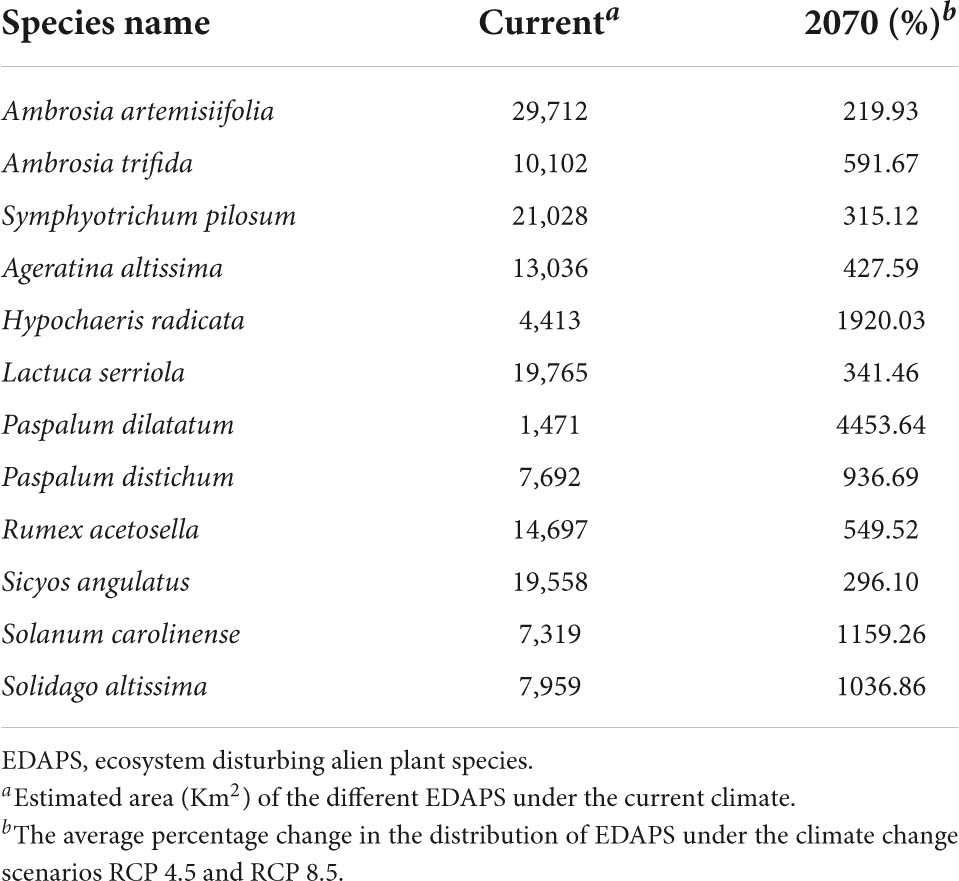
Table 4. Relative change in the distribution of ecosystem disturbing alien plant species (EDAPS).
Results
Spearman’s correlation test selected six bioclimatic and three environmental variables
Spearman’s correlation test was performed to select relevant and independent bioclimatic and environmental variables for species distribution modeling. Six bioclimatic variables and three environmental variables were chosen based on their weak correlations (r < 0.75) with each other. The selected variables were as follows: annual mean temperature (Bio01), isothermality (Bio03), temperature seasonality (Bio04), annual precipitation (Bio12), precipitation during the wettest month (Bio13), precipitation during the driest month (Bio 14), distance from water (d-water), distance from roads (d-road), and land cover (SSP1) (Table 2).
The random forest model has the highest predictive performance
Individual species distribution model was established for 12 EDAPS using five SDMs and presented in Supplementary Figures 1–60. The predictive performance of each model was evaluated using AUC, TSS, and Kappa values and expressed in Supplementary Tables 3–5. Among the five SDMs, the RF model had the highest AUC value for all EDAPS. The mean AUC value (n = 12) was estimated to be highest in RF (0.928 ± 0.058), followed by MaxEnt (0.85 ± 0.05), MARS (0.816 ± 0.053), GLM (0.781 ± 0.068), and ANN (0.763 ± 0.07) (Supplementary Table 3). When considering the mean AUC values determined above, the predictive performance of RF was excellent, MaxEnt and MARS were good, and GLM and ANN were fair for predicting EDAPS distribution. Similar to AUC scores, TSS and Kappa values were estimated to be highest in RF for all EDAPS (n = 12) except for Solidago altissima. Based on the mean values of TSS and Kappa, RF (TSS = 0.790 ± 0.109, Kappa = 0.684 ± 0.096) was the most superior in regard to model performance, while ANN was the most inferior (TSS = 0.601 ± 0.121, Kappa = 0478 ± 0.486) (Supplementary Tables 4, 5). ANOVA of AUC, TSS, and Kappa metrics revealed significant differences among the five SDMs (Table 3). Mean comparisons using Duncan’s multiple range test showed that RF was significantly different from other SDMs (Figures 3A–C). When AUC, TSS, and Kappa were considered together, RF consistently showed the highest predictive performance. MaxEnt followed RF in regard to accurate modeling of EDAPS, while ANN showed relatively poor predictive performance. Taken together, the data indicate that RF is the best model for studying the potential distribution of the 12 EDAPS among the five SDMs.
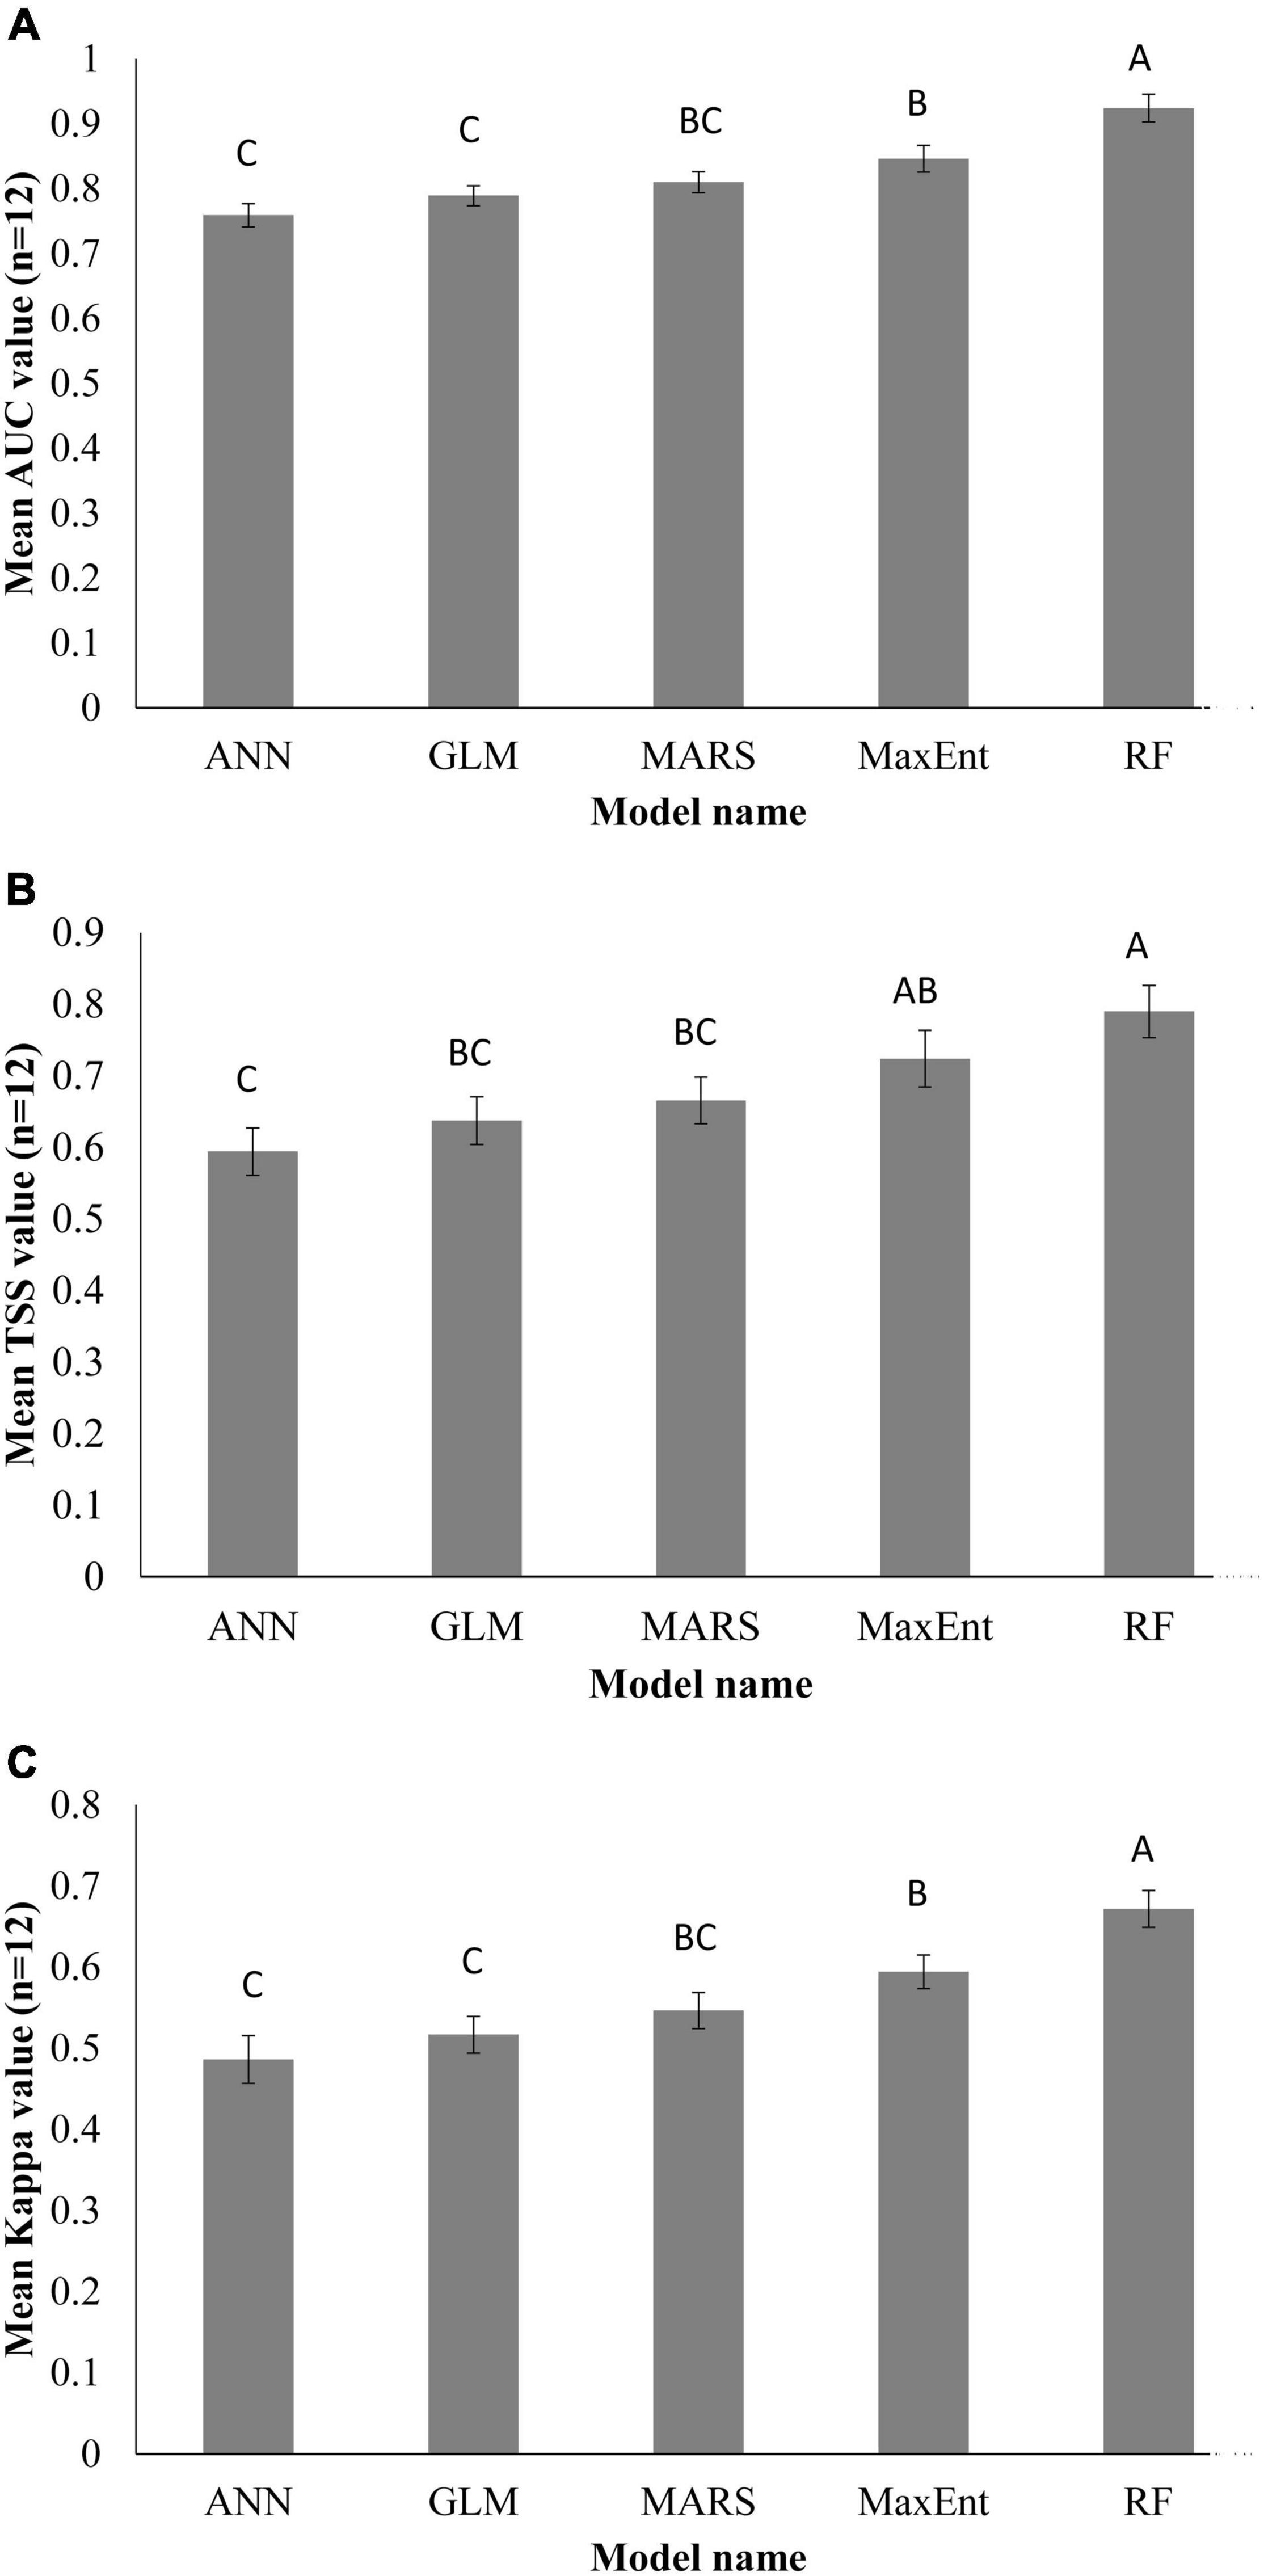
Figure 3. Predictive performance of the SDMs used in this study. AUC (A), TSS (B), and Kappa (C) values of 12 EDAPS for calibrating the five SDMs. Values are means (n = 12) ± standard error. Similar letters above the bar graphs indicate no significant differences among the models based on Duncan’s multiple range test.
Paspalum dilatatum is predicted to have the highest average relative change in distribution in the future
The area of potentially suitable habitat of 12 EDAPS was estimated using the RF model, and the average change in percentage of invasive species distribution under the future climate change scenarios (RCP 4.5 and RCP 8.5) for 2070 was calculated and compared with that of the current climate distribution (Table 4). Under the current climate, Ambrosia artemisiifolia had the highest potential distribution (29,712 km2), while P. dilatatum had the lowest distribution area (1,471 km2) (Table 4). The average distribution area of 12 EDAPS under the current climate was 13,062 km2. However, in future climate change scenarios, range expansion of the 12 EDAPS varied largely and was estimated to range from 219.93 to 4,453.6%. P. dilatatum would have the highest average relative change in distribution followed by Hypochaeris radicata, S. altissima, Paspalum distichum, Ambrosia trifida, Rumex acetosella, Ageratina altissima, Lactuca serriola, Symphyotrichum pilosum, Sicyos angulatus, and A. artemisiifolia.
Current and future climate change affects ecosystem disturbing alien plant species invasion risk
Invasive alien plant species are threats to native biodiversity and ecosystems (Ansong and Pickering, 2015). In this study, EDAPS invasion risk was predicted using the RF model based on the species richness in a grid cell. Invasion risk was categorized into low (<25%), moderate (>25–50%), high (>50–75%), and very high risk (>75–100%), according to the level of species richness in each cell (Adhikari et al., 2021). The invasion risk maps under the current and future climate change conditions (RCP 4.5 and RCP 8.5) are presented in Figure 4A. Currently, 70.81% of the country belongs to the low risk of invasion category. This category was followed by moderate (19.67%), high (9.23%), and very high risk of invasion (0.16%) categories (Figure 4B). However, the extent and spatial pattern of invasion risks were predicted to increase in the future. The results showed that most EDAPS would maintain their current distribution with rapid range expansions in the future. Under the RCP 4.5, 36.55% of the country would fall under the high-risk category, and 43.90% of the country would be classified under the very high-risk category (Figure 4B). On the other hand, under the RCP 8.5, 27.86% of the country would belong to the high-risk category, and 60.43% of the country would fall under the very high-risk category (Figure 4B). These results suggested that RCP 8.5 was relatively more favorable for EDAPS distribution than that of RCP 4.5. Therefore, invasion risks were predicted to be high under RCP 8.5.
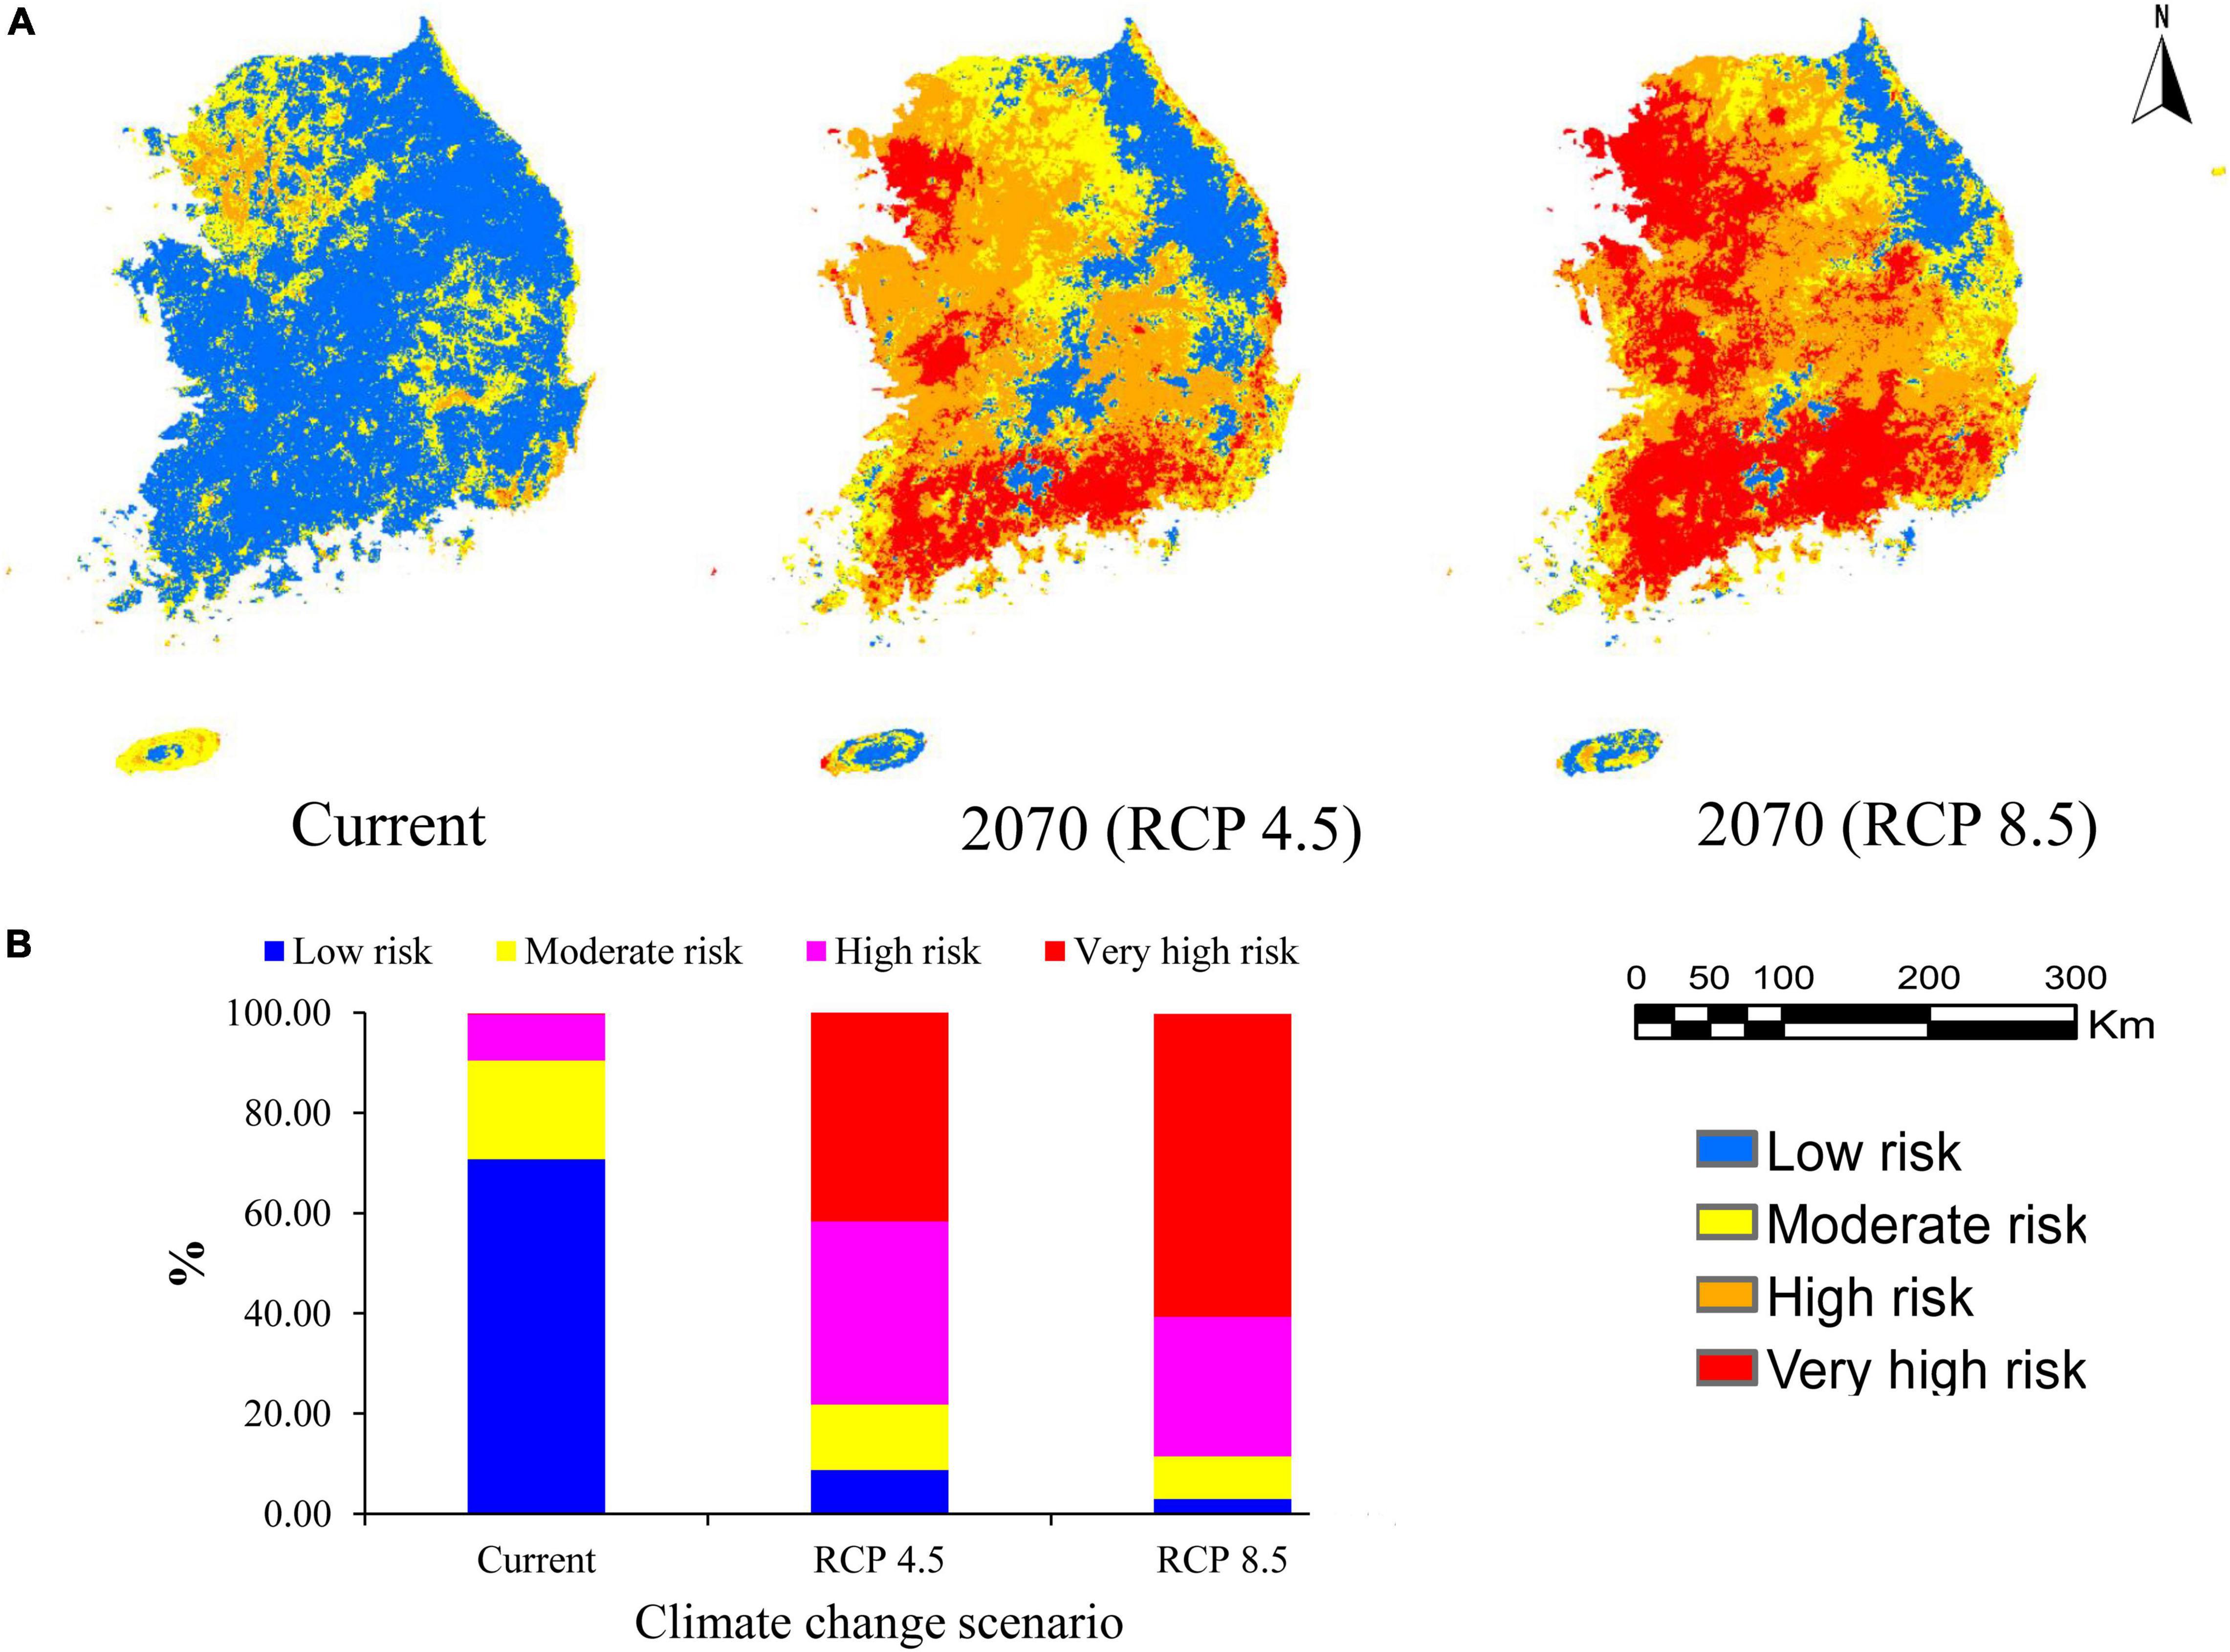
Figure 4. Prediction of invasion risk of 12 EDAPS under the current and future climate change conditions (RCP 4.5 and RCP 8.5) in South Korea. (A) Color-coded maps of South Korea showing areas of potential invasion risk using the RF model. Colors indicate the different risk categories. (B) Segmented bar graphs showing estimated percentages (%) of the different invasion risk categories relative to the total area of the country.
Discussion
The following results were obtained in this study. (1) RF was selected as the best model among the five SDMs based on the average AUC, TSS, and Kappa scores. (2) The RF model estimated invasion risk to be high in the coastal areas of the northwestern and southern regions, and some large cities of South Korea, such as Incheon, Seoul, and Busan, under the current climate. In the future climate change scenarios, invasion risk was predicted to increase across the whole country except for the high-altitude northeastern region of Gangwon province (Figure 4A). (3) The extreme future climate change scenario presented by RCP 8.5 revealed that EDAPS distribution fell under the high- or very high-risk category, which corresponded to a large proportion of the country’s area.
The five SDMs used in this study showed different prediction results of EDAPS while using same environmental variables and species occurrence data, which indicates the model uncertainty (Wenger et al., 2013). Accounting for this model uncertainty is critical for effective conservation actions. Therefore, we quantified model uncertainty by comparing predictive performances of each model using three standard model evaluation metrices (AUC, TSS, and Kappa). A quantitative evaluation of model performance establishes the model’s suitability for specific applications and identifies components of the model that require further improvement (Koo et al., 2017). Furthermore, evaluating model performance can be used to compare different modeling approaches, and to study how different data and/or species characteristics affect the accuracy of predicted maps created by the model (Allouche et al., 2006). The AUC value shows the predictive capacity of a model using training and test datasets (Thuiller et al., 2005) to distinguish observed occurrences from background data (Thuiller et al., 2005). The AUC is unaffected by dataset size (prevalence); however, it has limitations because it equally weighs commission and omission errors, avoids true probability values, and is based on geographical extent (Lobo et al., 2008). AUC values are inflated when the geographical range is expanded beyond the current distribution range, resulting in overestimation of AUC. This in turn causes misinterpretation during model evaluation (Lobo et al., 2008). Because of the uncertainties with AUC metrics, TSS and Kappa were used as alternative criteria for validating model performance. TSS correlates with sensitivity, which corresponds to observed presence that is precisely estimated, and specificity, which means observed absence that is precisely estimated. Sensitivity and specificity are recognized as omission and commission errors, respectively (Pearson, 2010). Kappa values describe the overall accuracy of model performance with the assumption that accuracy occurs by chance (Allouche et al., 2006). In this study, we used average scores of AUC, TSS, and Kappa (n = 12) for evaluating model performance and selecting a best model. Similar to our findings, other studies used these evaluation metrics for model calibration, validation, comparison, and selection of a best model (Li and Wang, 2013; Mainali et al., 2015; Koo et al., 2017). Here, RF was the most accurate model in predicting the distribution of all EDAPS, while ANN was the worst performing model (Figure 3). Consistent with results presented in this study, the superior performance of RF was reported by previous SDM studies (Attorre et al., 2011; Mainali et al., 2015).
Our studies showed that current invasion was predicted to be highest in the northwestern region, where Gyeonggi province and Seoul city are located. High invasion risk also partly occurred in the southern and southeastern regions, where Jeollanam-do, Jeju-si, and Gyeongsangnam-do provinces, as well as Busan city, are located (Figure 4A). However, the central region of the country, which includes Chungcheongbuk-do province, Daejeon and Sejong cities, and Gangwon province in the northeastern region, exhibited low risk of invasion. These results showed that EDAPS invasion risks initiated along ocean routes of the northwestern, southern, and southeastern regions, and primarily colonized the harbor areas of these regions and surrounding islands. Similar predictions were uncovered by Adhikari et al. (2019, 2021) and Hong et al. (2021). Invasion is typically brought about by global trade and tourism, in which invasive plants enter through harbors and airports intentionally or unintentionally (Hellmann et al., 2008). The northwestern, southern, and southeastern regions of South Korea have many international harbors (e.g., Incheon, Pyeongtaek, Yeosu, Mokpo, and Busan) and airports (e.g., Incheon, Busan, and Muan). Therefore, invasive plants are introduced through these harbors and airports, and colonize agricultural fields, urban lands, and wild ecosystems (Early et al., 2016). Moreover, densely populated areas and disturbed lands are characteristic of big cities, such as Seoul, Incheon, Busan, and Daegu, and Gyeonggi-do province. Therefore, invasion risk could be more severe in these areas. Urban development, industrialization, construction of road networks, and establishment of recreational parks lead to disturbed lands, thereby facilitating the growth of EDAPS (Hellmann et al., 2008; Adhikari et al., 2020a, 2021). Introduced invasive species could then disperse across the country through land, air, and water transportation systems (Eminniyaz et al., 2013).
Under the future climate change and anthropogenic land cover change, large areas of the country were predicted to be under the high-risk (27.86%) and very high-risk (60.43%) categories of invasion by 2070. Furthermore, it was estimated that these types of invasion events will occur in the northwestern, western, and southern regions of the country, particularly in the provinces of Jeollanam, Jeollabuk-do, and Gyeonggi (Figure 4A). These predictions are reinforced by the fact that the RF model selected for risk assessment is a more robust classifier than other SDMs, and it has a tendency to emphasize differences between grid cells (Mainali et al., 2015). Furthermore, RF has a flexible fitting process, making it very efficient in modeling complex responses (Berk, 2008). Climate change generates favorable conditions for introducing new invasive species into ecosystems. It does so by making the habitat more suitable for the invading species, while changing native species distribution and abundance (Hellmann et al., 2008). Moreover, climate change alters competitive interactions among species, making native groups more susceptible to colonization by new and established invaders (Finch et al., 2021). Extreme climate (i.e., very wet and dry) favors establishment and range expansion of invasive species (Hellmann et al., 2008; Adhikari et al., 2019). Unfortunately, the average temperature in year 2100 is predicted to be 5.7°C higher than the current average temperature (16°C) in South Korea (KMA, 2021). Increasing temperature may play roles in expansion of transportation networks, urbanization, and industrialization. Under these circumstances, finding the most accurate model is required to mitigate potential invasion risks of EDAPS and/or any invasive weeds and plants.
In this study, we investigated invasion risk of 12 EDAPS in South Korea using SDMs. SDMs are empirical tools for predicting species spatial distribution across geographical space and time by determining correlations between species occurrence and environmental parameters (Elith and Leathwick, 2009; Franklin, 2013; Zurell et al., 2020). SDMs are used extensively in landscape ecology, conservation biology, wildlife management, and studies of climate change (Li and Wang, 2013). SDMs are used synonymously with ecological niche species distribution, habitat suitability, and climatic envelope models (Zurell et al., 2020). We created invasion risk maps for South Korea and categorized them into low risk, moderate risk, high risk, and very high risk under the current and future climate change and land cover change. To the best of our knowledge, this is the first study assessing invasive and alien plants using five SDMs. Furthermore, the best model for alien and invasive plant risk assessment in South Korea was identified. Through this model, we expect to cover research gaps in risk assessment of alien and invasive plants in South Korea. The current study sheds light on prediction modeling of distribution and invasion risk that can be applied to other invasive weed and plant species. This study could inform the central and federal governments and society about areas at high risk of invasion, guide invasive species management, and secure economic resources (Renteria et al., 2021).
Ecosystem disturbing alien plant species invasion risk may not only depend on climatic factors and land cover change, but also on other factors, such as biogeographic origin, and biological and physiological traits (Ni et al., 2021). Most of the EDAPS studied here originated from tropical regions of South America and temperate regions of North America and Europe. They were indiscriminately introduced into South Korea except for S. pilosum and S. altissima, which were imported as ornamental plants and as a source of nectar (Table 1). The introduced EDAPS then colonized disturbed lands, such as parks, roadsides, and coastlines, and eventually became fully adapted. Such plants adapt better to climatic variability than native species (Barral, 2019). The warming climate correlates positively with seed germination, and daytime temperature fluctuations may stimulate seed germination (Chen et al., 2017). In addition, species specific biological traits, such as growth rate, reproduction rate, and seed mass, correlate with invasiveness (Carboni et al., 2016). Furthermore, physiological traits, such as photosynthetic rate, efficiency of resource utilization, and competition, could play important roles in the success of invasive plant species (Ni et al., 2021). Moreover, natural phenomena, including wind, tides, and flood, and animals, such as birds and mammals, could facilitate EDAPS seed dispersal. Further studies are required to determine if similar phenomena influence EDAPS invasion risks in South Korea. Therefore, in addition to climatic and anthropogenic factors, biological and physiological traits of invasive plants, and methods of seed dispersal, need to be incorporated in models to obtain more accurate predictions of invasiveness.
Conclusion
This study compared the predictive performance of five SDMs based on three evaluation metrics. These metrics are widely used for calibration and validation of model performance. By comparing the predictive performance and outputs of the SDMs, we concluded that RF is the best modeling method among the five SDMs for forecasting EDAPS invasion risk. Climate change is likely to favor the spread of EDAPS and increase invasion risk across South Korea. This study suggested that comparison of many models with the same species and location is an ideal approach to determine the best model, and interpret the accuracy and coherence of the modeling results, for predicting the impact of climate change on species invasiveness. Predicting current and future EDAPS invasion risk areas could provide valuable information for the development of effective control and management strategies to minimize the threat of invasive plant species at the regional and local levels. Based on the results of risk analysis presented in this study, EDAPS detection and eradication activities are required in South Korea’s northwestern, southern, and southeastern regions, particularly focusing on the cities of Seoul and Busan and the provinces of Incheon, Chungcheongnam, and Jeollanam. These areas are likely to be the source for future EDAPS range expansion into new geographical areas.
Data availability statement
The original contributions presented in this study are included in the article/Supplementary Material, further inquiries can be directed to the corresponding authors.
Author contributions
PdA: conceptualization, software, formal analysis, and writing–original draft preparation. PdA and YL: methodology and validation. PdA, YL, and Y-SP: investigation. PdA and PbA: literature review and data curation. PdA and SH: resources. PdA and Y-SP: review and editing. Y-SP and SH: supervision. SH: project administration and funding acquisition. All authors read and approved the published version of the manuscript.
Funding
This study was supported by the Ministry of Environment, Republic of Korea (grant number 2018002270001).
Conflict of interest
The authors declare that the research was conducted in the absence of any commercial or financial relationships that could be construed as a potential conflict of interest.
Publisher’s note
All claims expressed in this article are solely those of the authors and do not necessarily represent those of their affiliated organizations, or those of the publisher, the editors and the reviewers. Any product that may be evaluated in this article, or claim that may be made by its manufacturer, is not guaranteed or endorsed by the publisher.
Acknowledgments
We are grateful to the Korea Meteorological Agency for providing the maximum and minimum temperature and average precipitation data for South Korea. We also thank the Korea Adaptation Center for Climate Change of South Korea for providing data on land cover, distance from road, and distance from water.
Supplementary material
The Supplementary Material for this article can be found online at: https://www.frontiersin.org/articles/10.3389/fevo.2022.880987/full#supplementary-material
Footnotes
- ^ https://www.kma.go.kr
- ^ https://www.metoffice.gov.uk/
- ^ https://kaccc.kei.re.kr
- ^ https://cran.r-project.org/web/packages/biomod2/index.html
References
Adhikari, A., Rew, L. J., Mainali, K. P., Adhikari, S., and Maxwell, B. D. (2020a). Future distribution of invasive weed species across the major road network in the state of Montana, USA. Regional Environ. Change 20:60.
Adhikari, P., Ja-Young, J., Kim, H. W., Oh, H.-S., Adhikari, P., and Seo, C. (2020b). Northward range expansion of southern butterflies according to climate change in South Korea. J. Clim. Chang. Res. 11, 643–656.
Adhikari, P., Jeon, J.-Y., Kim, H. W., Shin, M.-S., Adhikari, P., and Seo, C. (2019). Potential impact of climate change on plant invasion in the Republic of Korea. J. Ecol. Environ. 43:36. doi: 10.1186/s41610-019-0134-133
Adhikari, P., Kim, B.-J., Hong, S.-H., and Lee, D.-H. (2022). Climate change induced habitat expansion of nutria (Myocastor coypus) in South Korea. Sci. Rep. 12:3300. doi: 10.1038/s41598-022-07347-5
Adhikari, P., Lee, Y. H., Park, Y.-S., and Hong, S. H. (2021). Assessment of the spatial invasion risk of intentionally introduced alien plant species (IIAPS) under environmental change in South Korea. Biology 10:1169. doi: 10.3390/biology10111169
Ahmed, N., Atzberger, C., and Zewdie, W. (2021). Species Distribution Modelling performance and its implication for Sentinel-2-based prediction of invasive Prosopis juliflora in lower Awash River basin, Ethiopia. Ecol. Proc. 10:18.
Allouche, O., Tsoar, A., and Kadmon, R. (2006). Assessing the accuracy of species distribution models: prevalence, kappa and the true skill statistic (TSS). J. Appl. Ecol. 43, 1223–1232.
Ansong, M., and Pickering, C. (2015). What’sa weed? knowledge, attitude and behaviour of park visitors about weeds. PLoS One 10:e0135026. doi: 10.1371/journal.pone.0135026
Araghinejad, S. (2014). “Regression-based models,” in Data-Driven Modeling: Using MATLAB® in Water Resources and Environmental Engineering. Dordrecht: Springer Netherlands, 49–83.
Attorre, F., Alfò, M., De Sanctis, M., Francesconi, F., Valenti, R., Vitale, M., et al. (2011). Evaluating the effects of climate change on tree species abundance and distribution in the Italian peninsula. Appl. Veg. Sci. 14, 242–255.
Berger-Wolf, T. Y., Rubenstein, D. I., Stewart, C. V., Holmberg, J. A., Parham, J., Menon, S., et al. (2017). Wildbook: crowdsourcing, computer vision, and data science for conservation. arXiv [Preprint] doi: 10.48550/arXiv.1710.08880
Bolker, B. M., Brooks, M. E., Clark, C. J., Geange, S. W., Poulsen, J. R., Stevens, M. H. H., et al. (2009). Generalized linear mixed models: a practical guide for ecology and evolution. Trends Ecol. Evol. 24, 127–135.
Bonebrake, T. C., Brown, C. J., Bell, J. D., Blanchard, J. L., Chauvenet, A., Champion, C., et al. (2018). Managing consequences of climate-driven species redistribution requires integration of ecology, conservation and social science. Biol. Rev. 93, 284–305. doi: 10.1111/brv.12344
Bradley, B. A., Wilcove, D. S., and Oppenheimer, M. (2010). Climate change increases risk of plant invasion in the Eastern United States. Biol. Invasions 12, 1855–1872. doi: 10.1007/s10530-009-9597-y
Breiman, L. (2001). Statistical modeling: the two cultures (with comments and a rejoinder by the author). Statistical Sci. 16, 199–231.
Carboni, M., Münkemüller, T., Lavergne, S., Choler, P., Borgy, B., Violle, C., et al. (2016). What it takes to invade grassland ecosystems: traits, introduction history and filtering processes. Ecol. Lett. 19, 219–229. doi: 10.1111/ele.12556
Chen, B.-M., Gao, Y., Liao, H.-X., and Peng, S.-L. (2017). Differential responses of invasive and native plants to warming with simulated changes in diurnal temperature ranges. AoB Plants 9:lx028. doi: 10.1093/aobpla/plx028
Choe, H., Thorne, J. H., and Seo, C. (2016). Mapping national plant biodiversity patterns in South Korea with the MARS species distribution model. PLoS One 11:e0149511. doi: 10.1371/journal.pone.0149511
Díaz, S., Settele, J., Brondízio, E. S., Ngo, H. T., Guèze, M., Agard, J., et al. (2019). Summary for Policymakers of the Global Assessment Report on Biodiversity and Ecosystem Services of the Intergovernmental Science-Policy Platform on Biodiversity and Ecosystem Services. Bonn: Intergovernmental Science-Policy Platform on Biodiversity and Ecosystem Services.
Diez, J. M., D’Antonio, C. M., Dukes, J. S., Grosholz, E. D., Olden, J. D., Sorte, C. J., et al. (2012). Will extreme climatic events facilitate biological invasions? Front. Ecol. Environ. 10:249–257. doi: 10.1890/110137
Dullinger, I., Wessely, J., Bossdorf, O., Dawson, W., Essl, F., Gattringer, A., et al. (2017). Climate change will increase the naturalization risk from garden plants in Europe. Global Ecol. Biogeography 26, 43–53.
Early, R., Bradley, B. A., Dukes, J. S., Lawler, J. J., Olden, J. D., Blumenthal, D. M., et al. (2016). Global threats from invasive alien species in the twenty-first century and national response capacities. Nat. Commun. 7:12485. doi: 10.1038/ncomms12485
Elith, J., Kearney, M., and Phillips, S. (2010). The art of modelling range-shifting species. Methods Ecol. Evol. 1, 330–342.
Elith, J., and Leathwick, J. R. (2009). Species distribution models: ecological explanation and prediction across space and time. Ann. Rev. Ecol. Evol. Systematics 40, 677–697. doi: 10.1111/gcb.12548
Elith, J. H., Graham, C., Anderson, P. R., Dudík, M., Ferrier, S., Guisan, A., et al. (2006). Novel methods improve prediction of species’ distributions from occurrence data. Ecography 29, 129–151.
Eminniyaz, A., Qiu, J., Tan, D., Baskin, C. C., Baskin, J. M., and Nowak, R. S. (2013). Dispersal mechanisms of the invasive alien plant species Buffalobur (Solanum rostratum) in cold desert sites of Northwest China. Weed Sci. 61, 557–563.
Finch, D. M., Butler, J. L., Runyon, J. B., Fettig, C. J., Kilkenny, F. F., Jose, S., et al. (2021). “Effects of climate change on invasive species,” in Invasive Species in Forests and Rangelands of the United States, eds T. M. Poland, T. Patel-Weynand, D. M. Finch, C. F. Miniat, D. C. Hayes, and V. M. Lopez (Cham: Springer), 57–83.
Franklin, J. (2013). Species Distribution Models in Conservation Biogeography: Developments and Challenges. Hoboken, NJ: Wiley Online Library.
Hellmann, J. J., Byers, J. E., Bierwagen, B. G., and Dukes, J. S. (2008). Five potential consequences of climate change for invasive species. Conserv. Biol. 22, 534–543. doi: 10.1111/j.1523-1739.2008.00951.x
Hijmans, R. J., Phillips, S., Leathwick, J., and Elith, J. (2020). Species Distribution Modeling Package ‘Dismo’ version 1.3. Available online at: https://cran.rproject.org/web/packages/dismo.pdf (accessed 12 October 2021).
Hong, S. H., Lee, Y. H., Lee, G., Lee, D.-H., and Adhikari, P. (2021). Predicting impacts of climate change on northward range expansion of invasive weeds in South Korea. Plants 10:1604. doi: 10.3390/plants10081604
Hopfield, J. J. (1982). Neural networks and physical systems with emergent collective computational abilities. Proc. Natl. Acad. Sci. U S A. 79, 2554–2558.
Hulme, P. E. (2017). Climate change and biological invasions: evidence, expectations, and response options. Biol. Rev. 92, 1297–1313. doi: 10.1111/brv.12282
Jeon, J.-Y., Adhikari, P., and Seo, C. (2020). Impact of climate change on potential dispersal of Paeonia obovata (paeoniaceae), a critically endangered medicinal plant of South Korea. Eco. Env. Cons. 26, S145–S155.
Jiménez-Valverde, A., Peterson, A. T., Soberón, J., Overton, J. M., Aragón, P., and Lobo, J. M. (2011). Use of niche models in invasive species risk assessments. Biol. Invasions 13, 2785–2797. doi: 10.1007/s10530-011-9963-9964
Kim, H. W., Adhikari, P., Chang, M. H., and Seo, C. (2021). Potential distribution of amphibians with different habitat characteristics in response to climate change in South Korea. Animals 11:2185. doi: 10.3390/ani11082185
Koo, K. A., Park, S. U., Kong, W.-S., Hong, S., Jang, I., and Seo, C. (2017). Potential climate change effects on tree distributions in the Korean Peninsula: understanding model & climate uncertainties. Ecol. Modell. 353, 17–27.
Lee, I.-H., Park, S.-H., Kang, H.-S., and Cho, C.-H. (2012). “Regional climate projections using the HadGEM3-RA,” in Proceedings of the 3rd International Conference on Earth System Modelling, (Germany: Hamburg).
Li, X., and Wang, Y. (2013). Applying various algorithms for species distribution modelling. Int. Zool. 8, 124–135.
Lin, W., Cheng, X., and Xu, R. (2011). Impact of different economic factors on biological invasions on the global scale. PLoS One 6:e18797. doi: 10.1371/journal.pone.0018797
Lobo, J. M., Jiménez-Valverde, A., and Real, R. (2008). AUC: a misleading measure of the performance of predictive distribution models. Global Ecol. Biogeography 17, 145–151.
Mainali, K. P., Warren, D. L., Dhileepan, K., McConnachie, A., Strathie, L., Hassan, G., et al. (2015). Projecting future expansion of invasive species: comparing and improving methodologies for species distribution modeling. Global Change Biol. 21, 4464–4480. doi: 10.1111/gcb.13038
MoE (2014). Korea’s National Biodiversity Strategy 2014-2018. Seoul: Biodiversity division, Ministry of Environment, Republic of Korea.
Molina-Montenegro, M. A., and Naya, D. E. (2012). Latitudinal patterns in phenotypic plasticity and fitness-related traits: assessing the climatic variability hypothesis (CVH) with an invasive plant species. PLoS One 7:e47620. doi: 10.1371/journal.pone.0047620
Morse, L. E., Randall, J. M., Benton, N., Hiebert, R., and Lu, S., and NatureServe. (2004). An Invasive Species Assessment Protocol: Evaluating Non-native Plants for their Impact on Biodiversity, Version 1”.
Ni, M., Deane, D. C., Li, S., Wu, Y., Sui, X., Xu, H., et al. (2021). Invasion success and impacts depend on different characteristics in non-native plants. Diversity Distrib. 27, 1194–1207.
NIBR (2014). Korean Red List of Threatened Species. Incheon: National Institute of Biological Resources, Ministry of Environment.
NIE (2017). Monitoring of Invasive Alien Species Designated by the Act on the Conservation and use of Biological Diversity (IV). Seocheon-gun: National Institute of Ecology.
Pearson, R. G. (2010). Species’ distribution modeling for conservation educators and practitioners. Lessons Conserv. 3, 54–89.
Phillips, S. J., Anderson, R. P., and Schapire, R. E. (2006). Maximum entropy modeling of species geographic distributions. Ecol. Modell. 190, 231–259.
Phillips, S. J., and Dudík, M. (2008). Modeling of species distributions with maxent: new extensions and a comprehensive evaluation. Ecography 31, 161–175.
Renteria, J. L., Darin, G. M. S., and Grosholz, E. D. (2021). Assessing the risk of plant species invasion under different climate change scenarios in California. Invasive Plant Sci. Manag. 14, 172–182. doi: 10.1002/ps.5183
Rew, L. J., Brummer, T. J., Pollnac, F. W., Larson, C. D., Taylor, K. T., Taper, M. L., et al. (2018). Hitching a ride: seed accrual rates on different types of vehicles. J. Environ. Manag. 206, 547–555. doi: 10.1016/j.jenvman.2017.10.060
Robertson, P. A., Mill, A. C., Adriaens, T., Moore, N., Vanderhoeven, S., Essl, F., et al. (2021). Risk management assessment improves the cost-effectiveness of invasive species prioritisation. Biology 10:1320.
Seebens, H., Blackburn, T. M., Dyer, E. E., Genovesi, P., Hulme, P. E., Jeschke, J. M., et al. (2018). Global rise in emerging alien species results from increased accessibility of new source pools. Proc. Natl. Acad. Sci. U S A. 115, E2264–E2273. doi: 10.1073/pnas.1719429115
Shin, M.-S., Seo, C., Lee, M., Kim, J.-Y., Jeon, J.-Y., Adhikari, P., et al. (2018). Prediction of potential species richness of plants adaptable to climate change in the Korean Peninsula. J. Environ. Impact Assess. 27, 562–581. doi: 10.14249/EIA.2018.27.6.562
Thuiller, W., Lavorel, S., and Araújo, M. B. (2005). Niche properties and geographical extent as predictors of species sensitivity to climate change. Global Ecol. Biogeography 14, 347–357. doi: 10.1111/j.1466-822X.2005.00162.x
Thuiller, W. G., Gueguen, M., Engler, R., and Breiner, F. (2021). Package ‘biomod2’: Ensemble Platform for Species Distribution Modeling, Version 3.5.1.
Thuiller, W., Lafourcade, B., and Araujo, M. (2010). Presentation Manual for BIOMOD. Genoble: Joseph Fourier University.
UN (2020). 2020 International Trade Statistics Year Book. New York, NY: Department of Economic and Social Affairs, United Nations.
Wang, W., Zhang, C., Allen, J. M., Li, W., Boyer, M. A., Segerson, K., et al. (2016). Analysis and prediction of land use changes related to invasive species and major driving forces in the state of Connecticut. Land 5:25.
Weiskopf, S. R., Rubenstein, M. A., Crozier, L. G., Gaichas, S., Griffis, R., Halofsky, J. E., et al. (2020). Climate change effects on biodiversity, ecosystems, ecosystem services, and natural resource management in the United States. Sci. Total Environ. 733:137782.
Wenger, S. J., Som, N. A., Dauwalter, D. C., Isaak, D. J., Neville, H. M., Luce, C. H., et al. (2013). Probabilistic accounting of uncertainty in forecasts of species distributions under climate change. Global Change Biol. 19, 3343–3354. doi: 10.1111/gcb.12294
Young, J. S., Lee, J. W., Shin, H. T., Kim, S. J., An, J. B., Heo, T. I., et al. (2017). Invasive Alien Plants in South Korea. Pocheon. Korea: National Arboretum.
Keywords: climate change, ecosystem disturbing alien plant species, species distribution models, South Korea, invasion risk assessment
Citation: Adhikari P, Lee YH, Adhikari P, Hong SH and Park Y-S (2022) Climate change-induced invasion risk of ecosystem disturbing alien plant species: An evaluation using species distribution modeling. Front. Ecol. Evol. 10:880987. doi: 10.3389/fevo.2022.880987
Received: 22 February 2022; Accepted: 29 June 2022;
Published: 15 July 2022.
Edited by:
Åke Brännström, Umeå University, SwedenReviewed by:
Fleur Matheson, National Institute of Water and Atmospheric Research (NIWA), New ZealandHao Wu, Xinyang Normal University, China
Copyright © 2022 Adhikari, Lee, Adhikari, Hong and Park. This is an open-access article distributed under the terms of the Creative Commons Attribution License (CC BY). The use, distribution or reproduction in other forums is permitted, provided the original author(s) and the copyright owner(s) are credited and that the original publication in this journal is cited, in accordance with accepted academic practice. No use, distribution or reproduction is permitted which does not comply with these terms.
*Correspondence: Sun Hee Hong, c2hob25nQGhrbnUuYWMua3I=; Yong-Soon Park, eXNwYXJrMjAwNUBjYm51LmFjLmty
†These authors have contributed equally to this work