Abstract
Understanding the effects of climate change on tropicalpine biota remains a scientific challenge today. The Andean páramo is the largest and most diverse tropicalpine biogeographical region in the world, and also one of the most threatened as it is prone to accelerated environmental changes. My goal was to predict changes in the distribution ranges of the diverse and highly endemic páramo flora on the mid-term (50 years). First, I predicted distribution changes in páramo plant species under novel climates and considering dispersal constraints. Second, I looked for consensus areas of species losses vs. gains in the páramo, expecting to identify a gradient of increasing relative richness with elevation over time. Last, I evaluated the behavior of plant species regarding their climatic refugia since the Last Glacial Maximum (LGM) to establish if they likely remain or transcend them. Based on VegParamo vegetation data and CHELSA bioclimatic information, I performed species distribution models for a 664 species pool, that were then contrasted between the present, future (2070) and past (LGM). About 8.3% of the entire species pool (55 species) were predicted to be extirpated from the páramo by 2070, including 22 species endemics. On average, páramo plants gained 15.52% of additional distribution by 2070 (18.81% for endemics). Models predicted the most area gains for the northern páramos of Colombia and Venezuela, and the highest losses for the eastern Ecuadorian and Peruvian mountains. Moreover, area gains were more pronounced at high elevations, suggesting a future accelerated colonization process toward the northern Andean summits. Finally, only 21.41% of the species’ 2070 distribution coincided with their LGM (19.75% for endemics), and the largest climatic refugia since the LGM were found in southern Ecuador and Peru. This study is pioneer in predicting future distribution shifts for páramo plant species overall and provides solid bases to support climate change research and adaptation strategies in the tropical Andes.
Introduction
The world is currently living its 6th mass extinction (Barnosky et al., 2011; Ceballos et al., 2015) with species extinctions occurring at an unprecedented speed, as seen in plants with 18–26 extinctions per million species years, or 500 times the expected background rate (De Vos et al., 2015; Humphreys et al., 2019). In addition, more than a million species are considered at risk of extinction today due to increasing human population and its consequent environmental impacts (Diaz et al., 2019). Climate change constitutes one of the main drivers of biodiversity loss worldwide, as it challenges species in their capacity to follow the accelerating pace of their surrounding climate (Panetta et al., 2018; Diaz et al., 2019; IPCC, 2021). When climatic optimums shift spatially, species are required to migrate and or adapt at a similar speed in order to survive in altered environments (Lenoir and Svenning, 2015). As a result, species often move poleward toward higher latitudes or upward toward higher elevations to track isotherms (Lenoir et al., 2020). Nevertheless, because certain species migrate more efficiently than others, e.g., large birds vs. small amphibians, short life-cycle herbs vs. long life-cycle trees, dispersal lags progressively set in and climatic debts arise (Dullinger et al., 2012a; Alexander et al., 2018). Assessing species’ capacity to track climate change and therefore tackle climatic debts is a main scientific challenge with important societal outcomes, for instance regarding the provision of ecosystem services for human populations (Diaz et al., 2019; Lenoir et al., 2020). It is particularly urgent to focus our research on tropical species (Feeley et al., 2015), which must respond to some of the fastest environmental changes, yet remain overlooked in climate change science (Anthelme and Lavergne, 2018).
Tropicalpine environments involve some of the most severe climates on Earth today, and as a result they harbor a unique biota adapted to extreme conditions (Körner, 2021). The Andean páramo (∼Lat. 11°N-5°S), regarded as the most biodiverse high mountain region on Earth (Sklenář et al., 2014), comprises species able to endure rapid precipitation changes as well as temperature variations up to 40°C over a 24 h timespan (Luteyn et al., 1999). However, future conditions might become even more challenging for mountain biodiversity, as climate change significantly impacts their environment. Mountains worldwide are already highly vulnerable to climate change with warming occurring faster than the global average, i.e., 0.3 and 0.2°C per decade, respectively (Pepin et al., 2015; IPCC, 2021). In the tropical Andes specifically (∼Lat. 11°N-23°S), recent studies have identified a 0.1–0.4°C rise per decade in monthly mean temperature and an overall increase of temperature extremes in the second half of the XXth century (Toledo et al., 2021). The region as hence been qualified as a warming hotspot with amplified temperature variations in the tropicalpine area and over the 4,000 m isohypse (Vuille et al., 2015). Future estimates predict an additional warming of 1–4°C by the end of the XXIth century in the Tropical Andes, which could compromise the survival of many species and alter ecosystems’ structure and functions (Pepin et al., 2015; Vuille et al., 2015; Toledo et al., 2021; but see Fadrique et al., 2018 on the diverse spatio-temporal responses from tree species in Andean forests).
In addition to warming, important changes in precipitation patterns are expected in the Tropical Andes, as illustrated by the ±20 mm rainfall variation per decade observed in the region over the 1950–2000 period (Anderson et al., 2011). Recent studies forecast a general increase in rainfall between 5 and 20% by 2100 (under scenario RCP 8.5) in the northern Tropical Andes (∼Lat. 11°N-5°S), although important uncertainty remains regarding these precipitation projections (Palomino-Lemus et al., 2015; Pabón-Caicedo et al., 2020). Precipitation trends will likely show stronger amplitudes with time and differ within the region, as (i) some areas will experience drying tendencies due to the influence of inter-Andean valleys and the Caribbean, such as Santa Marta and the north-facing Andes of Venezuela; (ii) while others will undergo important increases in precipitation, such as the Amazonia-bordering slope of the cordillera (Wang et al., 2018; Pabón-Caicedo et al., 2020). In the tropicalpine páramo, an alarming additional factor is the predicted rising and thinning of the condensation belts resulting in a decrease in fog, which currently acts as natural buffer against the intense solar radiation at high elevations. As a result, 70% of all páramos could experience significant drying by 2050 (Helmer et al., 2019).
Even though páramo plants are currently accustomed to fast climatic changes daily, the fragmented distribution of their habitat, paired with their narrow environmental niches and limited refugium availability could hinder their survival under future climate change (Anthelme et al., 2014; Peyre et al., in review). Several studies focused on alpine plants have already identified a spatial pattern of rising species toward mountain summits over time, qualified as the accelerated colonization process (e.g., Telwala et al., 2013; in the Himalayas; Steinbauer et al., 2018 in Europe). Moreover in the Andean páramo, Sklenář et al. (2021) recorded a mean shift of ∼ 2–7 m in the upper limit of plants’ distribution on the Chimborazo and Antisana since 1880. Future climate change will most probably affect páramo plants by reducing their distribution while keeping pushing them up toward mountain summits, where the availability of surface areas for establishment is limited and environmental conditions can be unadequate, for instance regarding soil requirements and microclimatic features (Anthelme et al., in press). Because páramo plants behave like alpine floras and do not disperse very efficiently (Vittoz et al., 2009; Peyre et al., 2020), it is likely that newcoming competitive plants, such as invasive species, will take advantage of their migration impediment and will act as pioneers by forming no-analog plant communities in the future (Alexander et al., 2015).
In that context and given the speed and magnitude of the threats associated to climate change in the tropicalpine Andes, increasing our knowledge on plant species’ response to future changes is a priority (Anthelme and Lavergne, 2018). Recent studies estimated that more than 23% of the tropicalpine species pool is at risk of extinction under an optimistic warming scenario (RCP 4.5), in comparison to 8% worldwide (Urban, 2015; Zimmer et al., 2018). Researchers are using different approaches to address this challenge, for example with experimental in situ methods, such as Leon-Garcia and Lasso (2019) who assessed heat tolerance for 21 páramo plants and suggested important adaptation capacity using open-top chambers. In addition, several studies predicted habitat availability for species of interest under future climate change scenarios, as seen for the Espeletia stemrosette species, whose climatically suitable areas could reduce by 51–78% by 2050 (Valencia et al., 2020) and which could be most affected in north and eastern Colombia (Mavárez et al., 2019). Finally, predictive community models, considering species distribution models (SDMs) and assembly rules suggested that the Ecuadorian high páramo (qualified as super-páramo, ∼ 4,200–4,800 m) could suffer severe recomposition by 2100, while 15% of its species pool could present a significant extirpation risk (Peyre et al., 2020).
In this study, my goal was to predict changes in the distribution ranges of the diverse and highly endemic páramo flora by 2070. First, I aimed at predicting specific distribution changes under novel climates and assess how much of the species’ potential distribution is likely to be occupied in the future considering dispersal constraints. H1 – I advanced that dispersal would hinder species’ capacity to occupy their suitable climatic niche and cause their distribution to reduce over time as seen in Valencia et al. (2020) and Peyre et al. (2020). Second, I intended to find consensus areas of net species losses and gains in the páramo by 2070. H2 – Despite the suggested reductions in species’ distributions in the future, I expected to identify a significant upward shift in said distributions, resulting in a gradient of increasing richness with elevation and time following Steinbauer et al. (2018) and Telwala et al. (2013) for temperate mountains. Third, I evaluated the stability of species’ distribution over the last interglacial period by assessing how much of their future distribution at 2070 coincided with their climatic refugium since the Last Glacial Maximum (LGM – 20.000 years ago). Considering that alpine species worldwide still attempt to colonize their Holocene suitable range, I question whether this delay impedes the páramo flora’s hability to track future climate change (Svenning and Skov, 2004; Dullinger et al., 2012b; Cannone and Pignatti, 2014). H3 – Building upon recent species distributions models for páramo plants during the LGM (Peyre et al., in review), I compared predictions at three different timepoints (LGM, present and 2070) expecting that (i) species would remain in their past climatic refugium as much as possible, and that (ii) the smaller the refugium, the higher the probability that a species would climb out of it in the future. For all specific goals, I paid special attention to endemics so to identify species and areas that strike out as potentially vulnerable and require further research and management focus.
Materials and Methods
Study Area
The study area encompassed the tropicalpine páramo region in the northern Andes, ranging from the depression Huancabamba in northern Peru, often described as a main biogeographic barrier between the northern and central Andes, to the mountains of Ecuador, Colombia and Venezuela (∼Lat. 11°N-5°S; Long: 65°–82°W; Luteyn et al., 1999; Weigend, 2002). Small páramo areas out the main Andean cordilleras, such as Amazonian volcanoes or central American páramos were excluded (Kappelle and Horn, 2016; Lozano et al., 2020). To predict species’ distributions in the future and account for potential downward migrations, a small elevation buffer was added to the actual ∼3,500 m treeline (Peyre et al., 2021) and therefore the 3,000 m isohypse was used to delimit the study area (Figure 1). No upper páramo limit was considered since the natural páramo frontier is represented by mountain summits or glaciers, which currently encompass about 1% of the northern Andes and will undergo further reductions by 2070 (Dussaillant et al., 2019; Peyre et al., 2021).
FIGURE 1
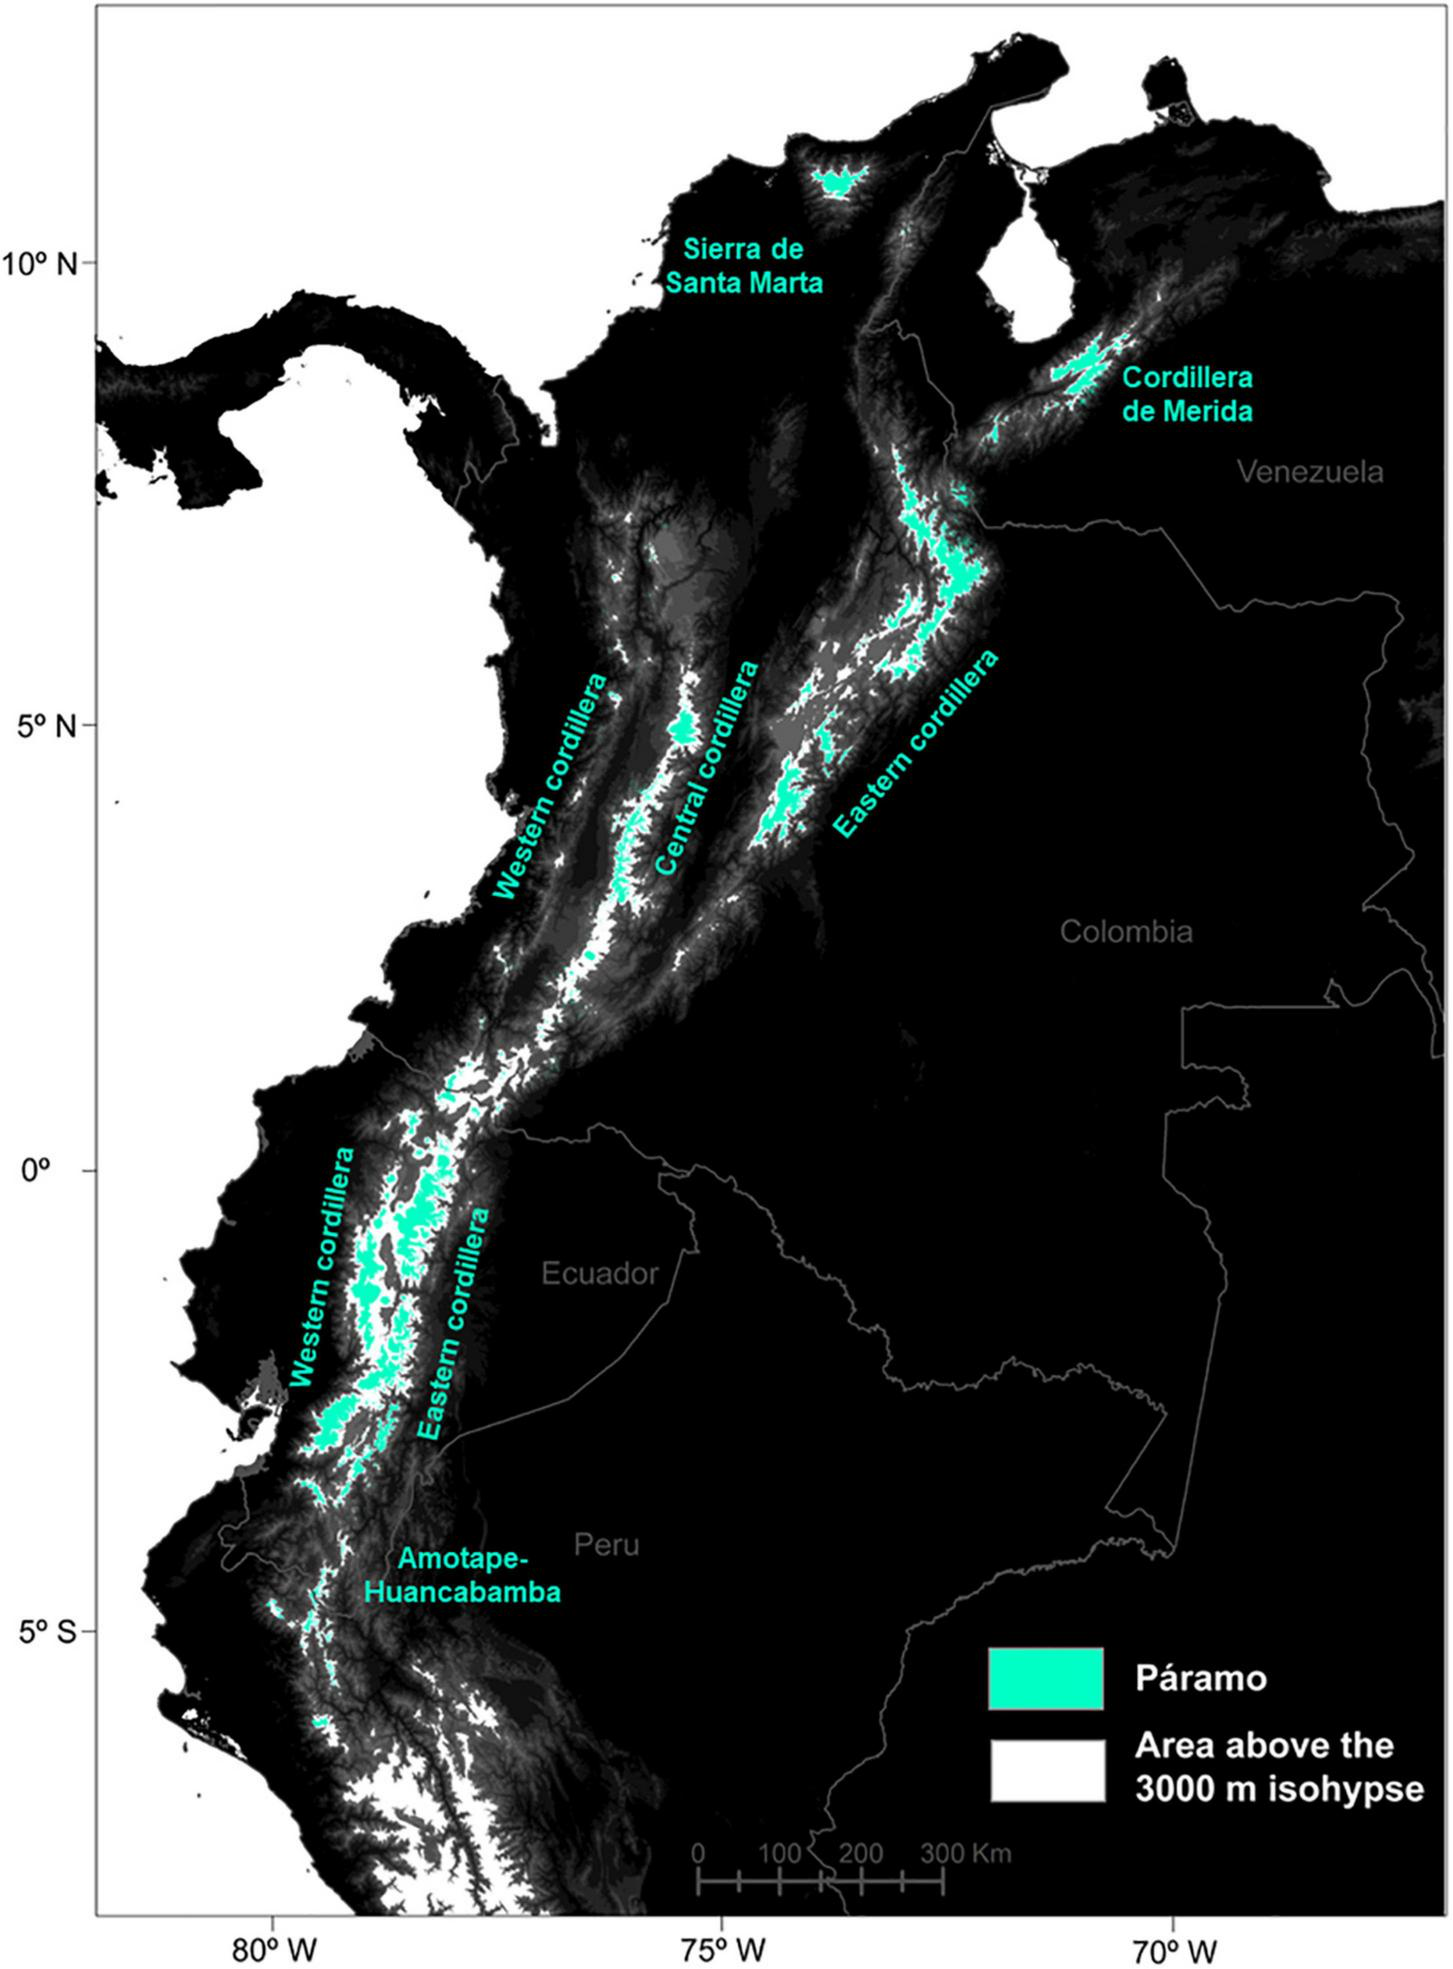
Distribution of the páramo in the Northern Andes (in blue) and delimitation used for the models above the 3,000 m isohypse (in white).
Species Distribution Data and Dispersal Capacity
The substantial species dataset used was identical to Peyre et al. (in review) to ensure comparability of the predictive results for future conditions with those for the LGM. All analyses were performed in R 4.0.2 (R Core Team, 2020). The species list was retrieved from the VegParamo – the flora and vegetation database for the Andean páramo (Peyre et al., 2015)1 and included 664 vascular plant species spread over the main páramo plant families. The VegParamo vegetation plots were then downloaded and complemented for rare species (<50 occurences) with additional occurrence records (timeperiod 1980–2019) obtained from 21 open-access herbarium databases. Then, the data cleaning procedure included: (i) merging sub-species at the species level; (ii) removing non-vascular species and taxa identified at the genus level or above; (iii) removing plots and occurrence points either poorly georeferenced (>1 km) or outside the study area; and (iv) checking and removing observation duplicates between vegetation plots and species occurrences by applying a 500 m radius buffer to all VegParamo plot coordinates (data source and year or observation were final selection criteria). To prevent overfitting issues in the subsequent statistical models, very rare species with less than 10 occurences in the cleaned dataset were removed (Merow et al., 2014). This threshold was lower than the usually recommended minimum 15–25 observations to reduce model uncertainty and was defined to account for the overall sampling gap in the Andes (van Proosdij et al., 2016; Santini et al., 2021). As a result, the final dataset consisted of 3,439 georeferrenced presence-absence entries for the 664 species: (i) 1,986 observations from VegParamo with presence and absence information registered in vegetation plots; and (ii) 1,453 additional occurrences from open-access herbarium databases (Peyre, 2022).
Endemics -- defined as those species almost exclusively present in the tropicalpine belt of the northern Andes -- were then drawn from the 664 species list. This list of páramo endemic species is the first attempt to systematically assess endemicity in the region and was achieved through a two-step procedure. For each species, all its occurrence points were downloaded from GBIF2 between 1980 and 2021 to fit the study’s timescale. Duplicate observations as well as obvious poorly georeferenced points, i.e., in habitats unfit of the species’ ecology, and data from collections, i.e., on other continents and in major cities, were discarded. To classify as endemic, a species first needed to present at least 90% of its occurrence points in the longitude-latitude spatial frame defined by the study area (a 10% of outlier points was allowed). Second, at least 90% of its datapoints had to be distributed above the elevation mask set at the 2,500 m isohypse, to include points with unprecise georeferencing (based on the 1 km UTM scale). As a result, 247 of the 664 species in the dataset constituted the endemic species pool (Supplementary Table 1).
Because the following models required a predictor able to emulate species’ dispersal capacity (DP), I retrieved the maximum dispersal distance (DD), and associated dispersal factor (DF) calculated for the 664 species in Peyre et al. (in review). DD were previously computed using the disperSal function for the R environment (Tamme et al., 2014) that relies on trait data (plant height, seed mass, and dispersal mode) and predicts kernel-shaped dispersal at a given distance (in km/year). Because dispersal frequency remains largely unknown for this species pool, periodic annual dispersal was assumed for all species for simplicity reasons. The DF was calculated by rescaling the DD onto a 0–1 scale, which allowed to rank species from worst to best disperser. Morever, I extrapolated the species’ dispersal range to the study area in the form of a raster map for current conditions, or dispersal predictor – DP. This procedure meant applying the iForce function to the study area, creating a buffer of currently accessible raster cells around the presence points, with a λ parameter defined as the DF (iSDM package, Hattab et al., 2017; Peyre et al., 2020).
Bioclimatic Data
Similarly to the previous step, the bioclimatic variables used in this study followed Peyre et al. (in review) to allow comparibility between future predictions (2070) and predicted climatic refugia since the LGM. The predictors set included (i) bio1 – mean annual temperature; (ii) bio2 – mean diurnal temperature range; (iii) bio4 – temperature seasonality; (iv) bio12 – total annual precipitation; (v) bio15 – precipitation seasonality; (vi) bio17 – precipitation of the driest quarter; and (vii) bio18 – precipitation of the warmest quarter. These variables were previously checked for multicollinearity using a variance inflation factor analysis (VIF < 10) and considered fit for the study area (vif function, usdm package; Naimi et al., 2014). Selecting the same variable set for all species may not fit the data as well as species-specific predictors, however, this methodological choice was made based on the following points: (i) little is known about the ecological correlations between each species’ distribution and environmental factors (Smith and Santos, 2020) and these correlations may be significantly affected by the large spatial study scale; (ii) keeping variable amounts relatively low helps maintain intermediate parameterization complexity in models (Brun et al., 2020); and (iii) the selected variables have been deemed important to explain current plant species richness patterns in the páramo (Peyre et al., 2019).
The seven bioclimatic variables were downloaded at a 30 arcsec resolution (∼1 km at the equator) from the CHELSA project v. 1.13 (Karger et al., 2017) as mean values computed for the 1979–2013 period. The variable set was considered adequate to represent current conditions (set at 2010 to enable the tracking of species over time) and fitted the species distribution data spread over the 1980–2019 timeframe. The same bioclimatic predictors were downloaded for 2050 (mean values over 2040–2060) and 2070 (mean values over 2050–2070). My intent was to assess and compare the effects of plausible climate change scenarios on the páramo flora, and therefore two Representative Concentration Pathways (RCP), CMIP5-RCP45 (moderate scenario, hereafter referred to as RCP45), and CMIP5-RCP85 (severe scenario, hereafter referred to as RCP85), were chosen. Furthermore, to encompass sufficient climatic variance and reduce uncertainty in future predictions (Thuiller et al., 2019), 5 General Circulation Models (GCM) were selected per RCP: CNRM-CM5 (CNRM); FGOALS-g2 (FGOALS); IPSL-CMA-LR (IPSL); MPI-ESM-P (MPI); and MRI-CGCM (MRI). The 5 GCMs were selected on the bases of (i) their dissimilarity in the GCM correlation matrix presented in Sanderson et al. (2015), and (ii) because they matched the scenarios used to represent LGM climatic conditions with PMIP3 data (Peyre et al., in review).
In order to follow the progressive shift in species’ distribution between today and 2070, the future bioclimatic data were interpolated per decade so to apply step-by-step dispersal constraints. Simple linear regressions were used on the future variables cropped to the study area and regression coefficients were extracted per variable (one for the 2000–2050 period and one for 2050–2070 period). Then, the previously computed coefficient was successively applied to interpolate each variable for the years 2020, 2030, 2040, and 2060, while values for the years 2010, 2050, and 2070 were directly extracted from the original downloaded variables (Adhikari et al., 2018).
Species Distribution Models
Species distribution models allow to correlate species observations (presence or presence-absence) to environmental data and extrapolate these relationships onto different spatio-temporal contexts (Araújo et al., 2019). I followed the procedure detailed in Peyre et al. (2020) that (i) uses SDMs to establish species distributions for current conditions and project them into the future per decade until 2070 for the 10 climate change scenarios; and (ii) successively applies dispersal limitations to the decadal projections.
First, to represent the species’ current (realized) distribution, SDMs were fitted with eight predictors: the seven bioclimatic variables and the previously computed species-specific predictor – DP, emulating the species’ actual dispersal range over the study area. The species data was retrieved from the final 3,439 observations dataset, from which were extracted both presence points (VegParamo data and curated additional occurrences) and absence points (VegParamo data). In order to enhance the models’ fit and predictive success, four algorithms across different families were included to perform the SDMs: Generalized Linear Model, Random Forest, Multivariate Adaptive Regression Splines, and Artificial Neural Network. For a given species, the modeling procedure consisted of (i) partitioning the dataset into training and testing sets through random splitting of the data in 75/25 proportions (Araújo et al., 2019); (ii) feeding the training set to an algorithm; and (iii) validating the resulting model with the testing set (biomod2 package; Thuiller et al., 2016). Out of the 100 models per species (four algorithms, 25 runs each), only those with a performance of 0.6 and above on the true skill statistic (TSS) metric were selected for the final ensembling of their predictive outputs (Allouche et al., 2006; Fernandes et al., 2019). Ensemble modeling was performed to better visualize the true correlation signal from the statistical noise intrinsic to each algorithm (Dormann et al., 2018; Hao et al., 2019) and then projected onto the study area to forecast species’ probabilistic distribution at present. Then, these predictions were binarized by applying a species-specific threshold that maximizes the sum of the sensitivity and specificity metrics in the retained models (optimal.thresholds function; PresenceAbsence package; Liu et al., 2005; Freeman and Moisen, 2008).
Second, to represent the future potential distribution of each species, SDMs were fitted with the seven bioclimatic variables only. An additional filter was applied to the species’ absence points to remove those absences that not necessarily represent environmental filtering of the species but instead dispersal limitations. This was achieved by applying the pDLA function, with a α parameter set at 0.5 that considered a 50% probability to classify an absence point as a dispersal-limitation-absence (iSDM package; Hattab et al., 2017). The rest of the modeling procedure remained identical, and every model ensemble was projected onto the variable set at each decade (2020, 2030, 2040, 2050, 2060, and 2070) for each RCP and GCM, and finally binarized.
Third for each species, its current realized distribution and future potential distributions as binary maps were ordered temporally and constrained by dispersal at each step (per decade) using the MigClim approach (Engler et al., 2012). At each step, the before and after binary predictions was compared and the maximum dispersal distance (DD) was applied to limit the later distribution to the area available and accessible to the species at that time (functions migclim.distance and migclim.plot, migclim package; Engler et al., 2012). In addition, a mask was used to emulate biogeographical barriers below the 3,000 m isohypse, corresponding to Andean forests and human-occupied areas that a species could cross if its DD was greater than the distance separating two suitable raster cells (exceptional long distance dispersal was not considered). The set of decadal binary maps per GCM and RCP offered time series of species redistribution from which can be assessed the species-specific proportion of areas that were colonized (gained), decolonized (lost), available but unoccupied (i.e., potential), and remained occupied (stable) between the present time and 2070. Therefore, these values were calculated and averaged per GCM at the species level (as raster cell numbers and as a percentage in distribution change by 2070), and then summed for the entire species pool and the endemic pool only for each RCP and overall.
Climatic Refugia
The current (2010), future (2070, per RCP and averaged over the 5 GCM), and past (LGM, as a mean scenario) distributions were assembled for each species of the dataset to assess how much of their distribution remained in their climatic refugia between these three different time points. The previously computed SDM for current conditions was used to represent the present, and the LGM distributions were obtained from Peyre et al. (in review). The future distribution was obtained from the final map following the MigClim procedure, therefore accounting for (i) presences – summing total remaining and colonized raster cells; and for (ii) absences – including non-occupied cells, total decolonized cells and potential cells (available but unaccessible in 2070). The maps were stacked and their coinciding (climatic refugium) and non-coincinding pixels (distribution out of the refugia) were counted to express a mean percentage of coherence between present-future (PF) and past-present-future (PPF) timelines. A linear regression was finally performed for each timeline and altogether to reflect any relationship between the size of the climatic refugium per species (in Log form) and the distribution percentage occuring out of refugia, accross RCPs.
Results
When concerting results between RCP45 and RCP85, a total of 55 species (8.3% of the entire species pool) were commonly predicted to be extirpated from the páramo by 2070, including 22 endemics (or 8.9% of the endemics pool; Table 1). Each RCP separately predicted extirpation for 114 species and extinction for 43 species on average from the complete species pool and endemics pool, respectively, with RCP85 scenarios being more pessimistic than RCP45. On average, páramo plant species gained an additional 15.52% over their 2010 distribution in 2070, with higher mean net gain values for the RCP85 scenarios in comparison to the RCP45 scenarios (Figure 2 and Supplementary Table 2). This net area gained resulted from a mean 26.76% stable area between 2010 and 2070, summed to a general 74.59% gain and 85.83% loss in species’ distribution. For endemics, models predicted a 18.81% net gain in species’ distribution overall, as product of 25.59% stable, 95.61% gained, and 102.38% lost areas. Similarly, net gain values were higher for endemics under RCP85 than RCP45 (almost threefold). In addition, 22.17% of the 2070 species’ distribution qualified as potential area (deemed as climatically adequate for these species, yet unoccupied at that time due to dispersal limitations), but only 15.42% for endemics.
TABLE 1
| Climate change scenario | N species extirpated | N species extinct |
| RCP45 predictions | 105 (±16.5) – 15.8% | 37 (±6.8) – 15.1% |
| RCP85 predictions | 123 (±33.3) – 18.6% | 48 (±12.7) – 19.6% |
| Average predictions | 114 (±26.6) – 17.2% | 43 (±11.3) – 17.3% |
| Common predictions | 55 – 8.3% | 22 – 8.9% |
| Extirpated species: Achyrocline lehmannii, Aciachne flagellifera, Aetheolaena otophora, Aetheolaena patens, Ageratina gracilis, Aragoa tamana, Arenaria lanuginosa, Bartsia melampyroides, Brachyotum confertum, Chusquea scandens, Cinna poiformis, Coespeletia thyrsiformis, Cortaderia sericantha, Cybianthus marginatus, Diplostephium obtusum, Diplostephium rosmarinifolium, Disterigma alaternoides, Draba sericea, Epidendrum frutex, Gamochaeta humilis, Geranium diffusum, Geranium multiceps, Geranium santanderiense, Geranium stoloniferum, Geranium velutinum, Gynoxys cuicochensis, Hieracium frigidum, Hypericum cardonae, Hypericum magdalenicum, Hypericum paramitanum, Hypericum thuyoides, Ilex kunthiana, Juncus ecuadoriensis, Laestadia pinifolia, Libanothamnus griffinii, Macleania rupestris, Miconia jahnii, Miconia media, Miconia pustulata, Monnina revoluta, Monticalia abietina, Nassella mucronata, Neurolepis glomerata, Oreopanax ruizanus, Oritrophium limnophilum, Ortachne erectifolia, Pentacalia pulchella, Pentacalia trianae, Puya trianae, Rhynchospora guaramacalensis, Ruilopezia lopez-palacii, Stellaria recurvata, Ternstroemia meridionalis, Vaccinium corymbodendron, Verbesina baccharidea | ||
Predictions of the extirpation and extinction risks for páramo plants by 2070 according to climate change scenarios considering two Representative Concentration Pathways, RCP45 and RCP85, and for each, five averaged General Circulation Models (CNRM, FGOALS, IPSL, MPI, and MRI).
Extirpation was assumed when a species from the complete 664 speces pool was predicted as absent from the páramo in 2070. Extinction was assumed for endemic species only (247 species pool), as subpart of the complete species pool. Predictions are expressed (i) by RCP, (ii) averaged over the two RCPs, and (iii) as common results between the two RCPs. Values reflect the number of species predicted to go extirpated/extinct by 2070 (standard deviations across GCMs in parenthesis), and its proportion relative to the corresponding species pool (complete or endemics dataset). Finally, the species list resumes species predicted to undergo extirpation according to both RCP scenarios (underlined species are endemics predicted to go extinct).
FIGURE 2
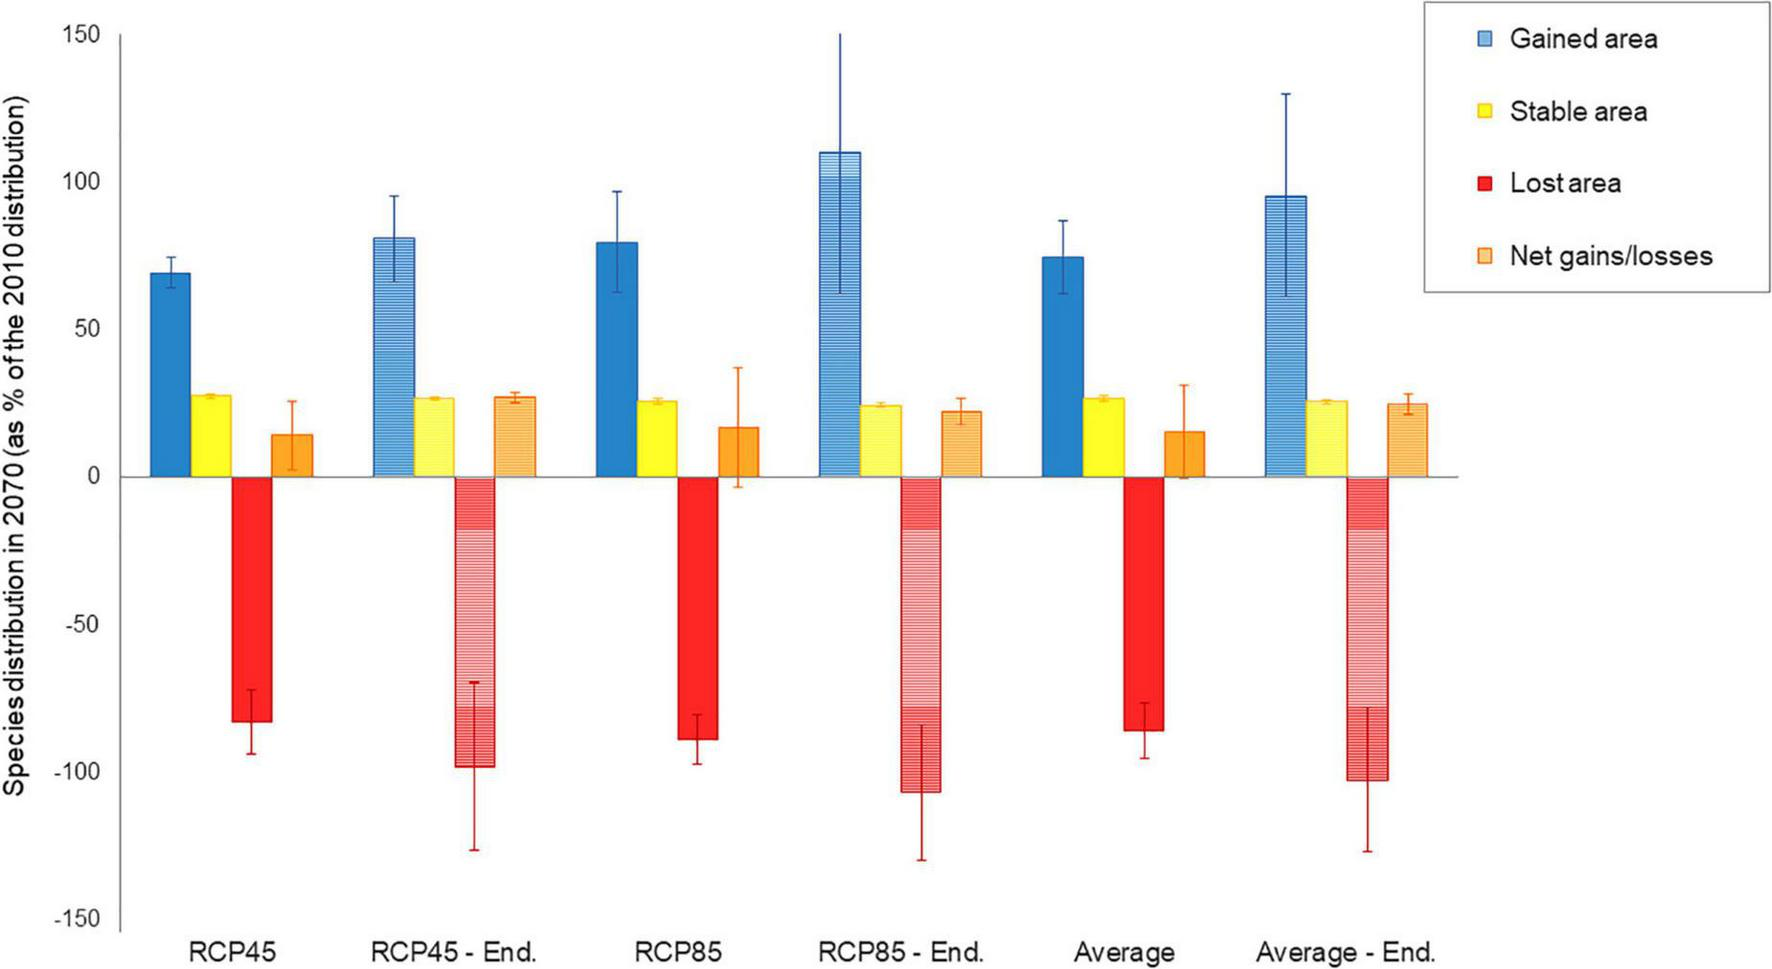
Distribution changes expected for 664 páramo plant between 2010 and 2070 as: gained area, stable area, lost area and net area gain/loss. Net area gain/loss accounts for the area occupied by the species in 2070 (stable and gained area), as well as the area lost between 2010 and 2070. Changes are calculated based on cell classification of the 2070 raster relative to the 2010 raster and are hence expressed for the 2070 species distribution as a percentage of the 2010 distribution. They are given as mean responses over the 5 GCM for RCP45 (moderate scenario) and RCP85 (severe scenario) and on average. Values for endemics alone (247 species) figure in dashed colors per RCP and on average.
The spatial patterns of stable, gained and lost areas for the species pool were varied at the páramo scale (Figure 3). Net gains/losses for all species were highest in the Ecuadorian western cordillera and lowest in the Ecuadorian eastern cordillera accross the two RCPs considered. In general, two spatial patterns of net gains in species distributions struck out (i) towards the northernmost latitudes (Sierra Nevada de Santa Marta and Cordillera de Merida); and (ii) along the elevation gradient, with important species distribution gains in the central parts of a cordillera (i.e., higher elevation) and losses at its edges (i.e., low elevations) especially in eastern Ecuador and Peru. When looking at stable, gained and lost area trends individually for the entire species pool, complementary trends confirmed the previous results (Figures 2, 4). In fact, the most stable areas and those with the highest gained distribution coincided in Peru (the Amotape-Huancabamba zone), the Ecuadorian western cordillera, and to lesser extent the Sierra Nevada de Santa Marta. In contrast and complementarily to what was previously observed, the areas that suffered the highest distribution losses were the Colombian central cordillera, as well as along the eastern slope of the Ecuadorian and Peruvian páramos. When focusing on endemics alone, a similar trend to the general pattern came through, although with less pronounced extremes, and relatively higher distribution net increases in the south-western páramos of Peru and Ecuador. Finally, there was no obvious differences between RCPs as both predicted similar magnitudes changes, except for a slightly more pronounced elevation pattern in distribution shifts for all species and for endemics alone under RCP45.
FIGURE 3
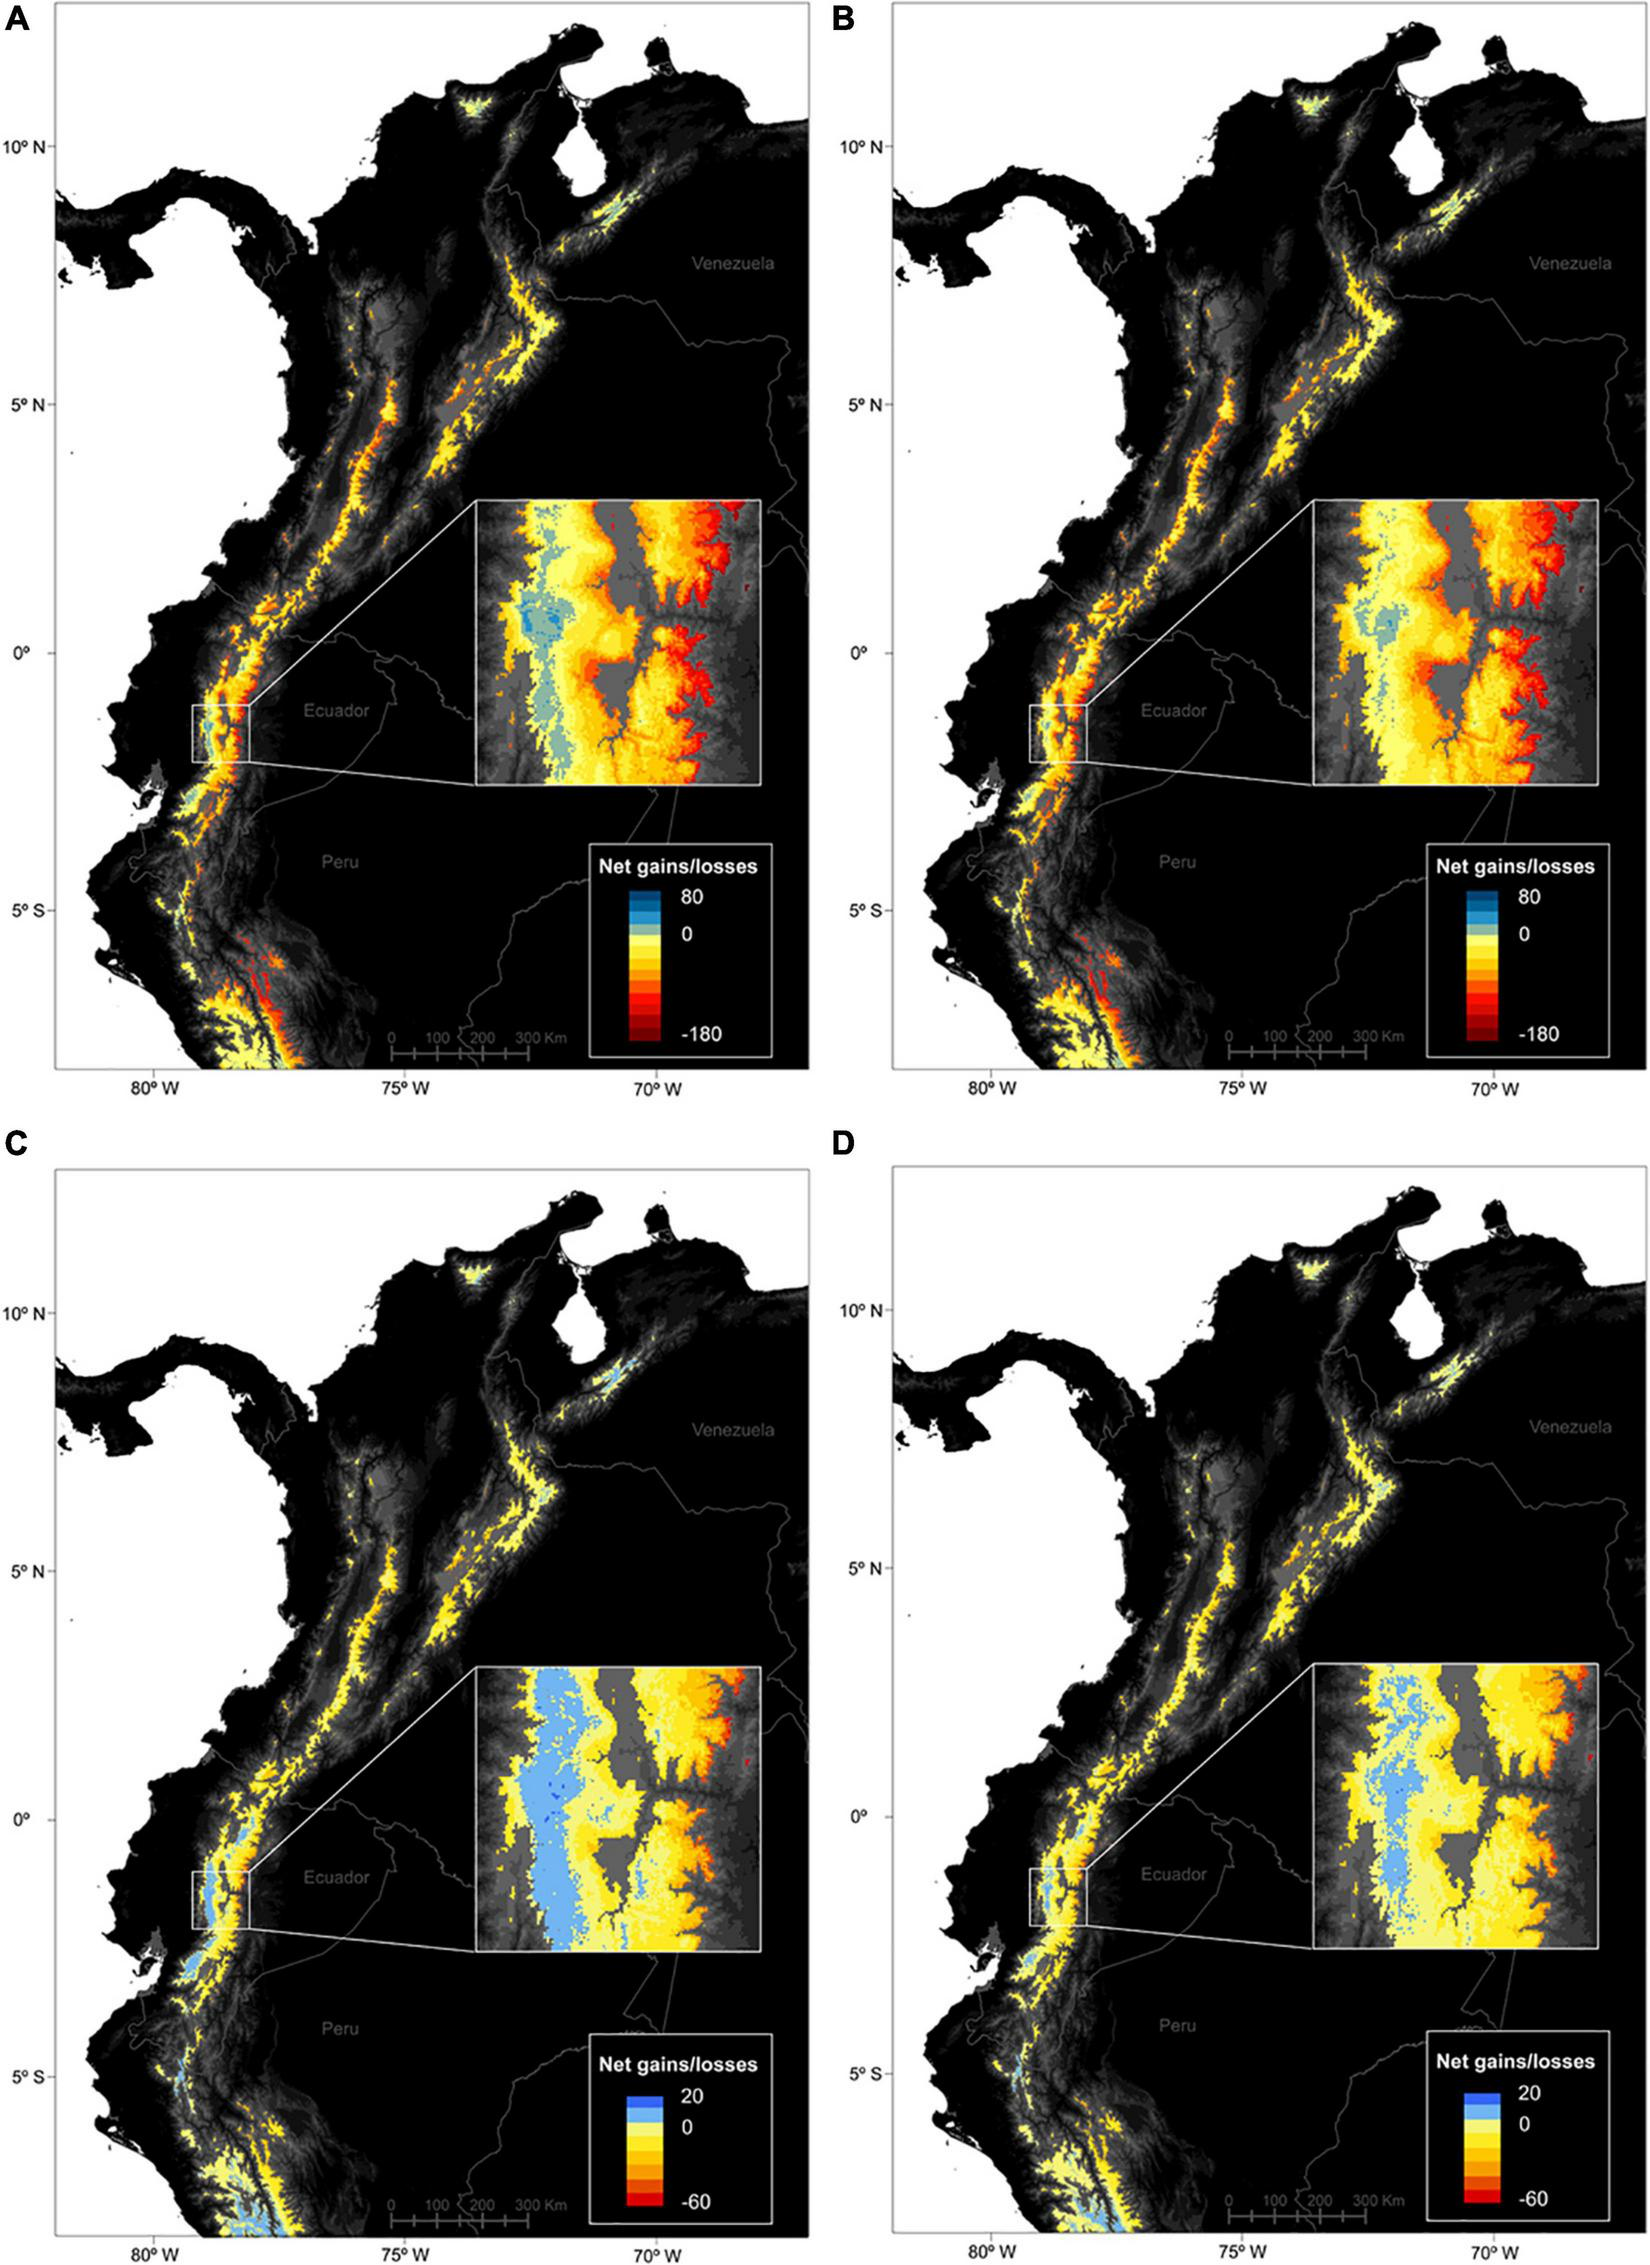
Predicted spatial patterns of net distribution gains and losses for vascular plant species in the páramo region between 2010 and 2070, according to two climate change scenarios, (A,C) RCP45 – the moderate scenario, and (B,D) RCP85 – the severe scenario. A raster cell value accounts for the number of species predicted to have occupied the cell in 2010 and/or 2070, as well as the species-specific responses in the cell (either positive, stable/gained area, or negative, lost area) and averaged across the 5 GCMs considered. (A,B) were computed on the complete species pool (664 species), while (C,D) were computed on the endemics pool only (247 species).
FIGURE 4
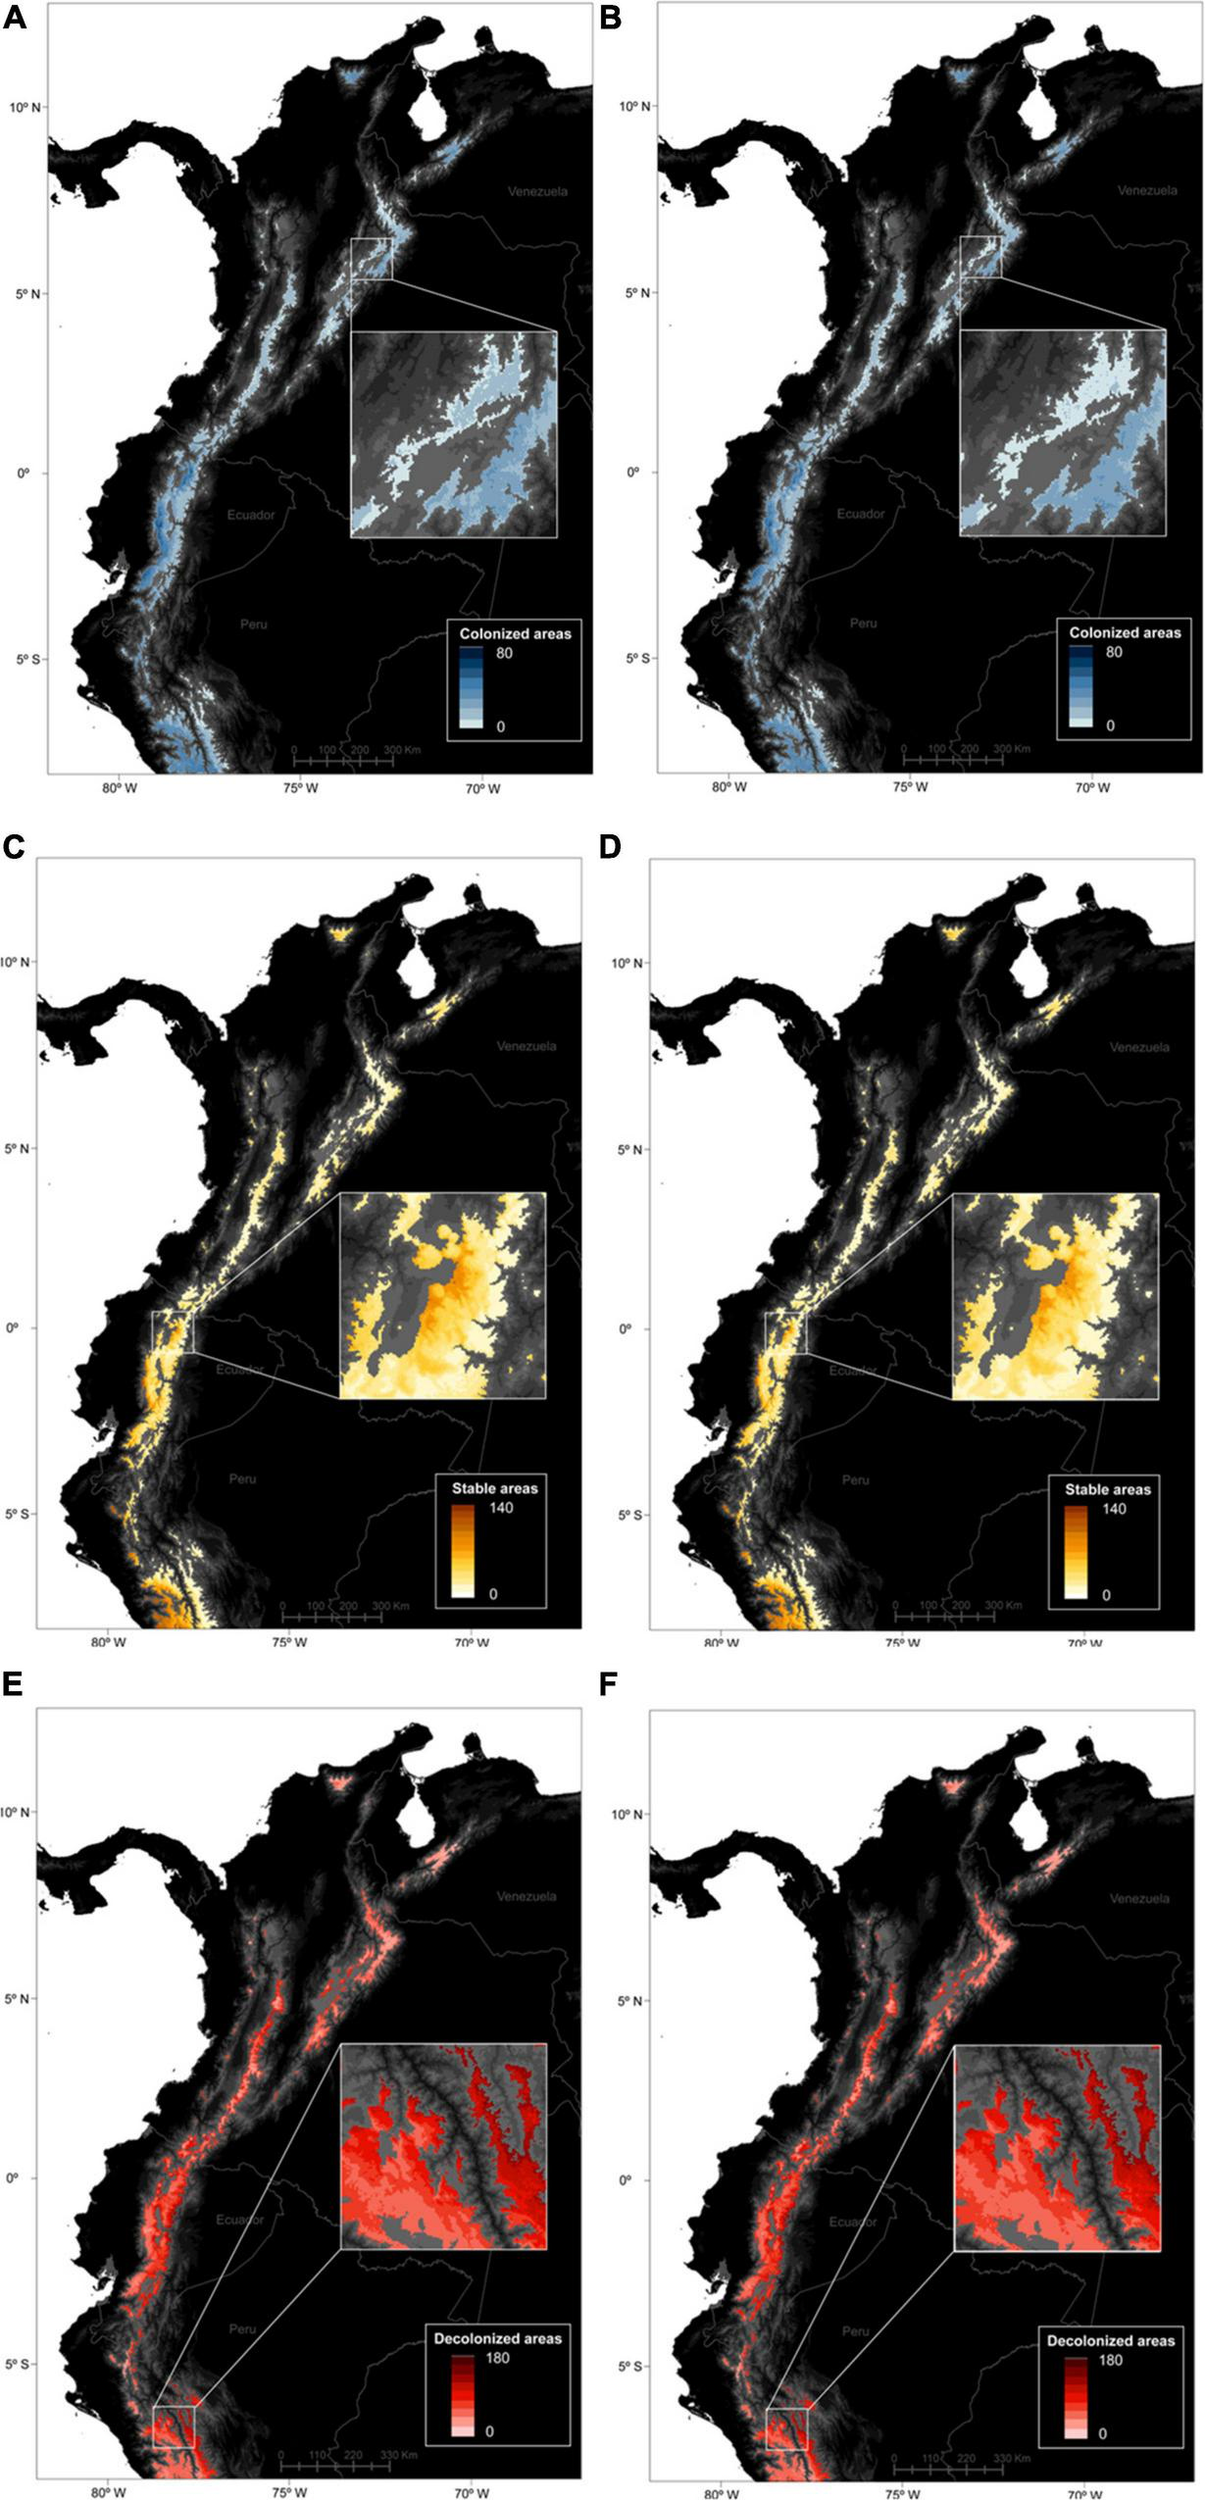
Predicted spatial patterns of gained (A,B), stable (C,D), and lost areas (E,F) for 664 páramo plant species between 2010 and 2070, according to the moderate – RCP45 (A,C,E) and severe – RCP85 (B,D,F) climate change scenarios. A raster cell value accounts for the number of species predicted to have occupied the cell in 2070 only (A,B), over the 2010–2070 timeperiod (C,D), and in 2010 only (E,F), and averaged over the 5 GCMs considered.
A total of 152 species (23% of the complete species pool) did not present a climatic refugium in 2070, according to either PF or PFF comparisons or both. Only 21.41% of a species’ 2070 distribution on average coincided with their LGM distribution, and 19.75% for endemics, with a clear density trend toward lower values (Figure 5A). In contrast, 69% of a species’ 2070 distribution coincided with their 2010 distribution, 69.78% for endemics, with very dispersed values overall. Indeed, of a species’ refugium at 2070, 31.27% was shared with its current and LGM distributions, whereas 68.72% was shared with its current distribution only (Figure 5C), a ratio that was slightly higher for RCP45 scenarios than for RCP85 scenarios. There was a significant but very slight and positive correlation between the area occupied by a species in 2070 and its refugium size, a correlation that was mostly carried by PF refugia, as no significant trend was found for PPF (Figure 5B and Supplementary Figure 1).
FIGURE 5
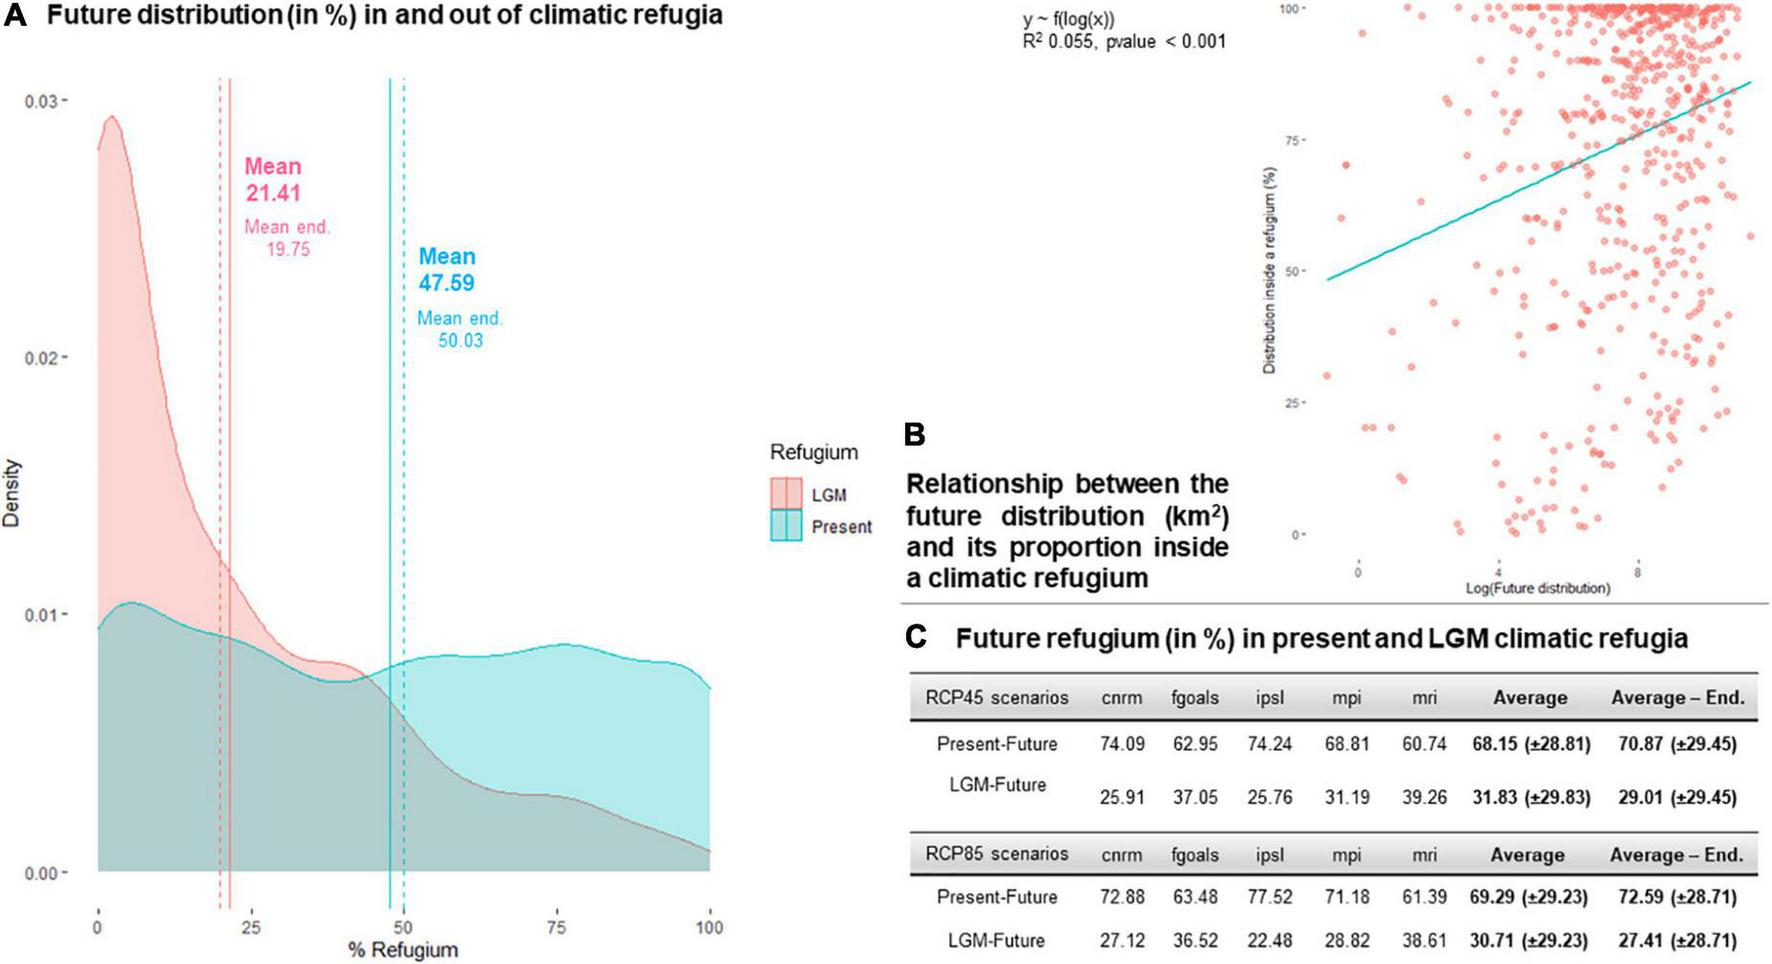
Relationships between the future distribution of the 664 studied species at 2070 and their climatic refugia since the present time (2010, PF) and since the LGM (PPF). (A) Proportion of future distributions in a LGM refugium and in a present refugium, for the complete species pool and for endemics only. (B) Relationship between the area occupied by species’ future distributions and their refugium size (PF and PPF, for individual responses see Supplementary Figure 1). (C) Distribution of the species refugium between PF and PPF.
Regarding the spatial patterns of LGM-future refugia at the páramo scale and for the entire species pool, it appears that the largest refugia areas concentrated in the Ecuadorian western cordillera and northern Peru, coinciding with the net gain trend previously observed (Figure 6). Similarly to previous results, models overall predicted slightly higher values and contrasts for RCP45 than RCP85. Endemics followed a similar pattern, however, they also presented high values in central Colombia as well as northern Ecuador.
FIGURE 6
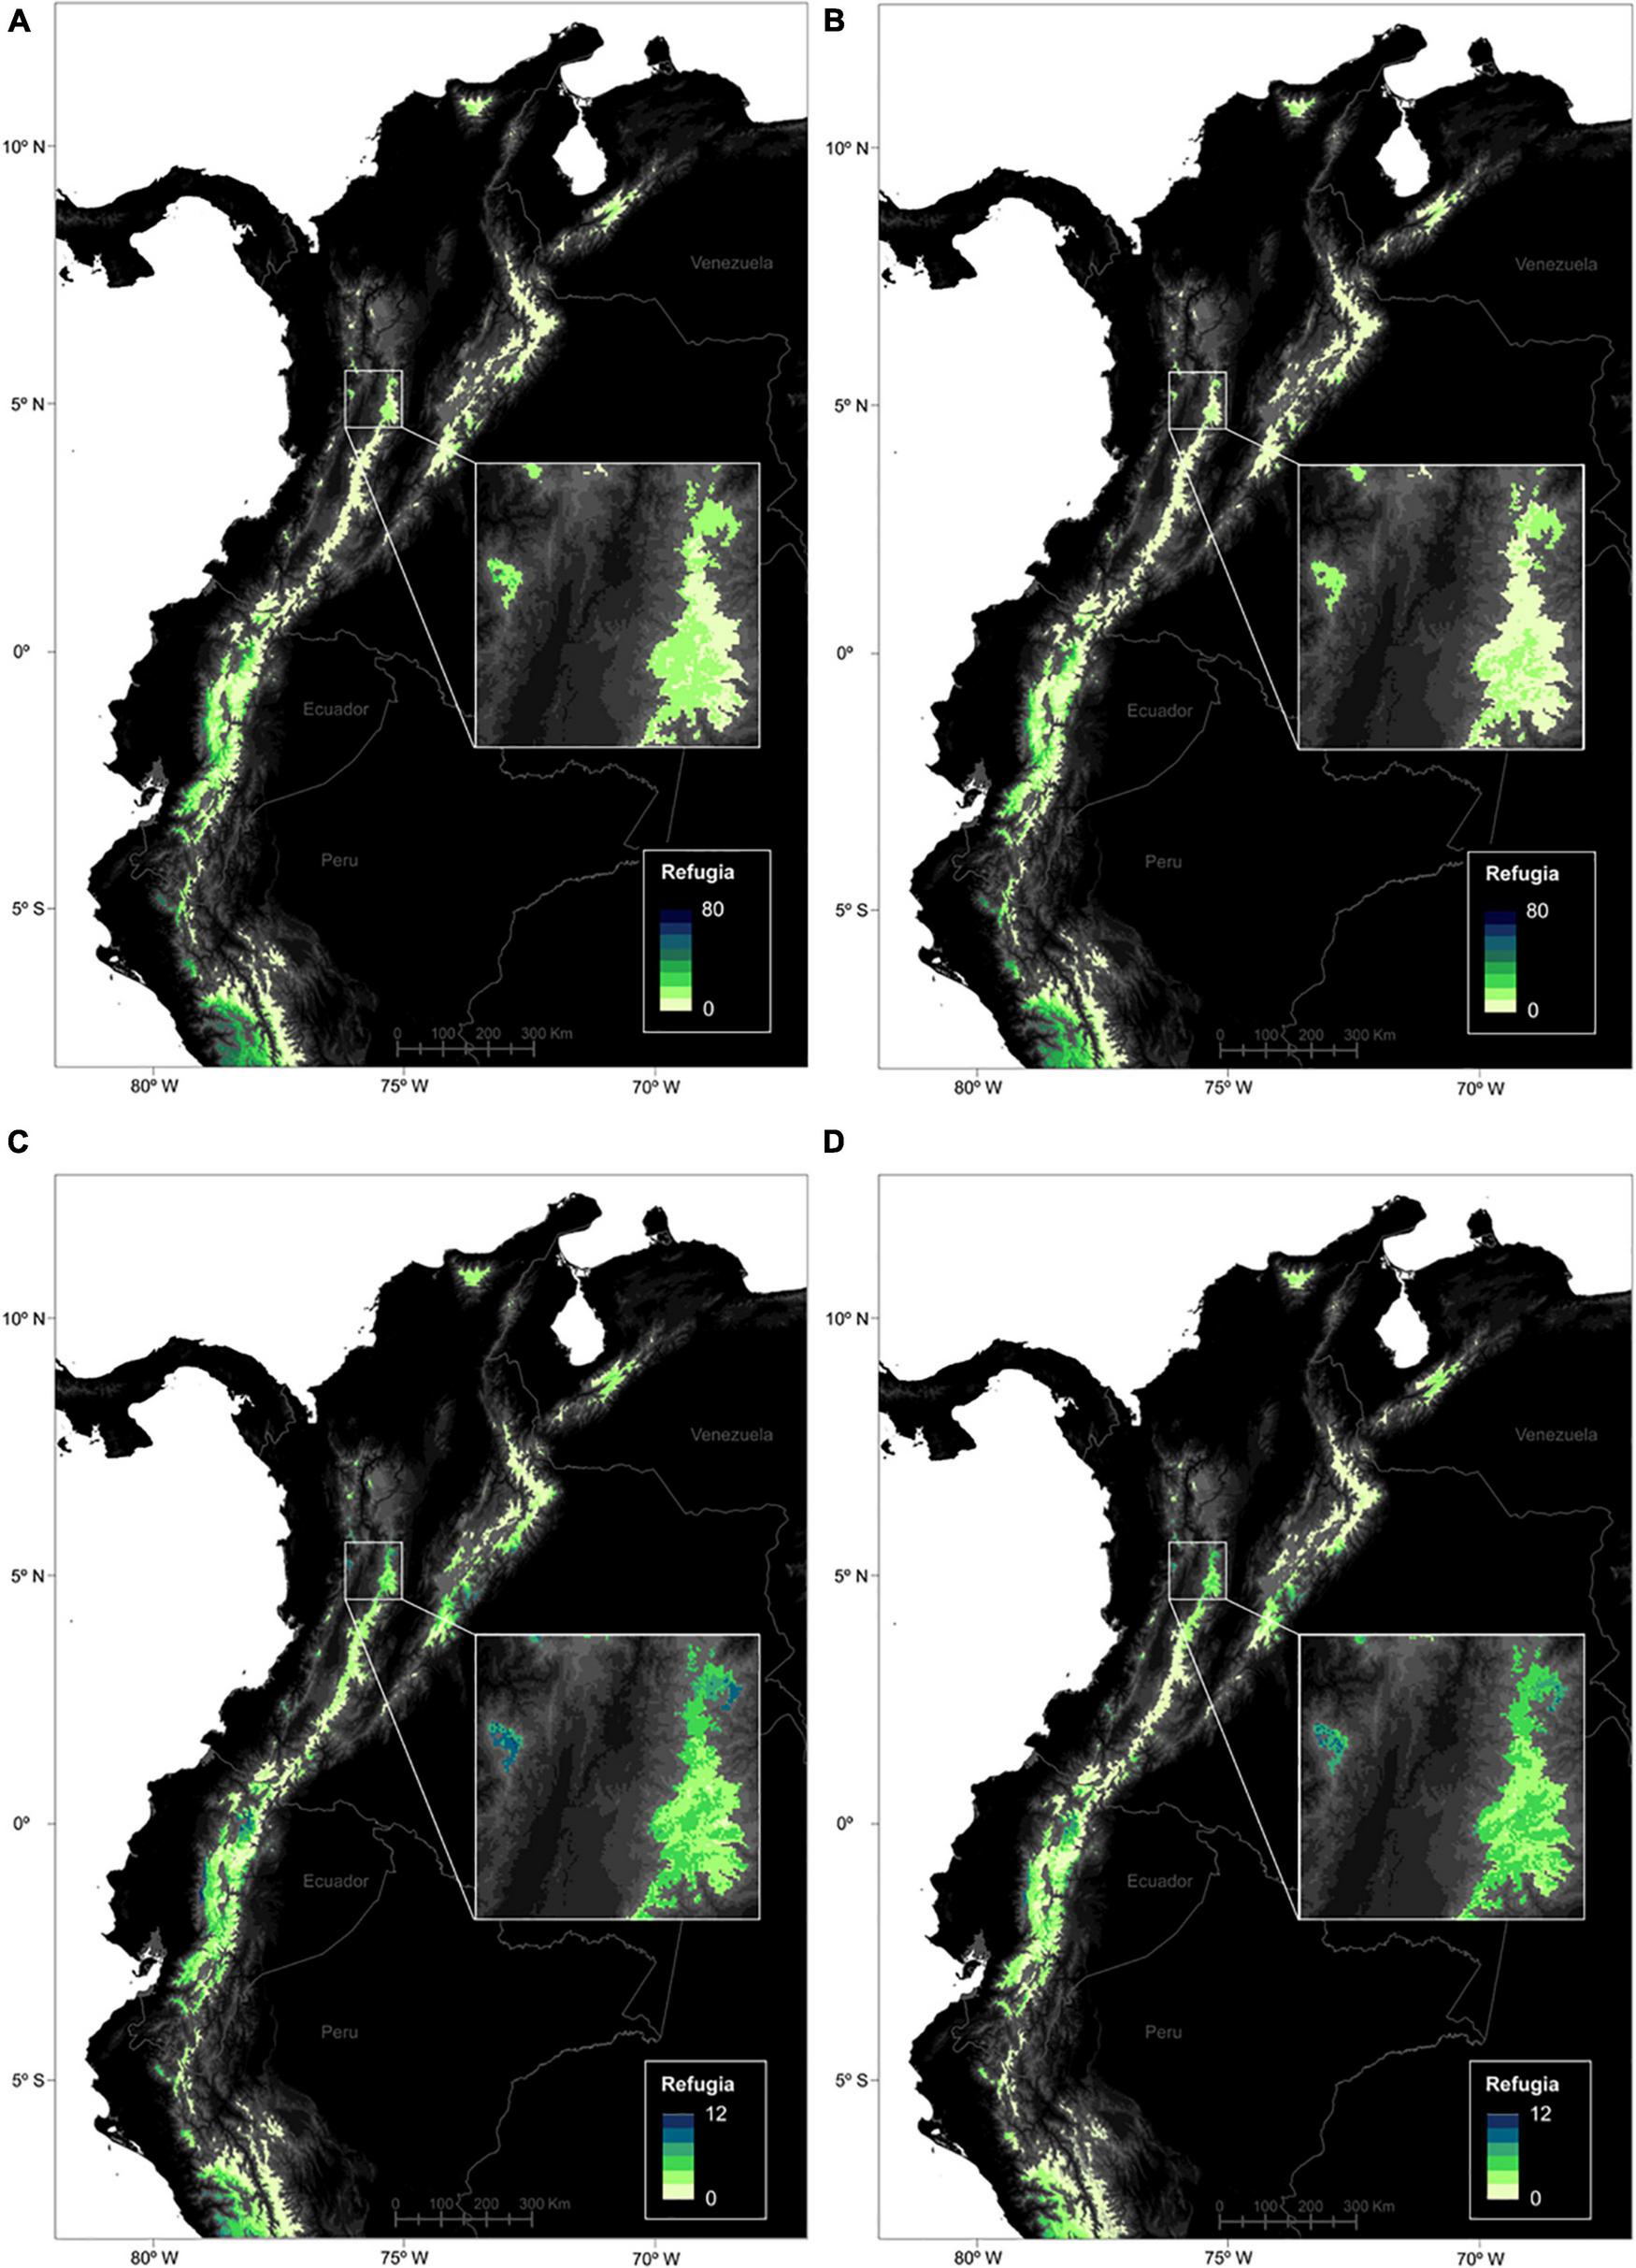
Location of the climatic refugia for páramo plants between the Last Glacial Maximum, present time (2010) and 2070 (PPF). Refugia numbers are presented for the 664 species (max. 80) and for the average RCP45 (A) and RCP85 (B) climate change scenarios. Similarly, refugia numbers are shown for the 247 endemic species (max. 12) and for the average RCP45 (C) and RCP85 (D) climate change scenarios.
Discussion
Tropicalpine environments are highly vulnerable to climate change, and as a result, shedding light on the response of vascular plants to future climate change in the most biodiverse high mountain region in the world is a priority (Feeley et al., 2015; Anthelme and Lavergne, 2018). Towards that goal, this study is pioneer in predicting future distribution shifts for a large páramo plant species pool, which helps (i) quantifying the vulnerability of the páramo flora, (ii) identifying páramo areas at risk of species loss and gains, and (iii) assessing the extent of past and present climatic refugia and their role in shaping future distributions.
Will Páramo Plant Species See Significant Distribution Changes by 2070?
In terms of biodiversity loss, my results identified a high extirpation risk for 55 species, including 22 endemics by 2070. Many of these species are common from the sub-páramo transition with montane forests (∼3,000–3,500 m) and known in few locations, for example Brachyotum confertum in Ecuador, Monticalia abietina and Pentacalia pulchella in Colombia, or Diplostephium obtusum and Ternstroemia meridionalis in Venezuela. These species should be primary candidates for conservation measures, since they often are also threatened by anthropogenic activities and habitat degradation near the treeline (Hofstede et al., 2003; Peyre et al., 2018). The future upheaval of the treeline due to increased thermophilization of montane forests (Fadrique et al., 2018) might in addition procure additional competition with rising tree species which might cause a further reduction of the shrub species’ distribution in the sub-páramo, but also understorey species such as the endemic Epidendrum frutex and Geranium velutinum.
Models established that páramos species will tend to increase their actual distribution by 15.52% in 2070, despite showing important species-specific variations. This finding contradicts my first hypothesis H1, based on Valencia et al. (2020) for the Espeletiinae group and Peyre et al. (2020) for plant communities in the Ecuadorian super-páramo, both of which suggested overall reductions in species’ distributions. Our contrasted result is most probably due to the substantial diversity of life-forms and strategies represented within the 664 species pool. In fact, Valencia et al. (2020) and Peyre et al. (2020) focused on plant species with poor-dispersing strategies, namely the unassisted anemochorous Espeletiinae and mostly small plants adapted to severe conditions, hence investing in survival more than growth and reproduction. In contrast, the species pool modeled here also included many species representative of (i) the sub-páramo transition with Andean forests dominated by dwarf forests and shrublands, and (ii) the mid-páramo (approx. 3,500–4,200 m) dominated by mixed grasslands (Peyre et al., 2018). Such species emerging from lower elevations could be advantaged in their colonization endeavors since they often rely either on assisted anemochory (e.g., with wings) or zoochory, which means that they could expand their distribution, provided that they are able to maintain an important part of their current distribution range under environmental changes. The net gain in species distribution across scenarios is attributed to important area gains and losses rather than strong stable areas, which suggests that severe recompositions at the plant community level will occur during the 60 years timespam. We should keep in mind that the models are based on niche requirements only and therefore, they may underestimate species’ persistence in suitable–turned-unsuitable environments, while at the same time slightly overestimate migrations because they do not account for certain constrains that are relevant on site. Indeed, it is probable that species’ (i) acclimation capacity to novel environmental conditions (Leon-Garcia and Lasso, 2019), (ii) species interactions (Llambí et al., 2018; Zimmer et al., 2018), and (iii) establishment and extinction lags, for example due to soil conditions (Anthelme et al., in press; Alexander et al., 2018), will come into play and buffer distribution changes.
Will the Northern Andes See a Future Accelerated Colonization Process?
My results show that the richness gains on mountain tops already observed in European mountains (Steinbauer et al., 2018) and the Himalayas (Telwala et al., 2013) will likely also take place in the páramo in the next decades, in accordance with hypothesis H2. Models predicted that distribution gains will principally occur at high elevation (central part of cordilleras) while losses will mostly occur at low elevation (edges of the páramo distribution). As previously established, the richness gains expected at high elevations might be alarming, since they are associated to low elevation species rising quickly and competing with local high-elevation species for microrefugia in a more thermophilic setting. Indeed, more than 200 invasive species are present in alpine areas worldwide (Alexander et al., 2015) and such species migrate efficiently thanks to their important seed production and dispersal, as well as their ability to use local nurse plants to aid their progress (Llambí et al., 2018). These species are already taking advantage of higher temperature to establish in un-saturated super-páramo areas and after glacial retreat creates newly available niches (Dussaillant et al., 2019; Rosero et al., 2021) where no-analog temporary plant communities arise (Anthelme et al., in press; Peyre et al., 2020). Nevertheless, endemic species (through not necessarily super-páramo species) are predicted to follow a similar uprising trend, which suggests that the accelerated colonization process will include many native species and, which calls for further vulnerability assessment of the páramo flora with conservation priorization outcomes. One unexpected result was that the northern páramos of the Sierra de Santa Marta and Cordillera de Merida were predicted as important areas for species gains instead of losses that could be attributed to future complex climatic trends in these páramos (Anderson et al., 2011; Helmer et al., 2019; Pabón-Caicedo et al., 2020). In this case, an in-depth analysis of the composition shifts predicted to occur is necessary to establish what species are driving these distribution gains.
In parallel, distribution losses were mostly predicted for low elevations (the edges of the páramo distribution) as well as the eastern slope of the páramo, facing the Amazonia and Orinoquia regions, both for the 664 species pool and endemic pool only. These losses will likely be compensated by the progressive upheaval of montane species at the sub-páramo ecotone in the region (Fadrique et al., 2018) related to regional thermophilization. Regarding the eastern slope specifically, we can expect that the precipitation decrease and important warming of the western Amazonia (Wang et al., 2018) will likely push tree species up the piemount and Andean flank in an accelerated manner, as páramo species will too migrate upslope causing important ecosystem restructuration and changes in functions.
Will Plants Shift From Their Last Glacial Maximum Climatic Refugium by 2070?
The hability of a species to track future climate change can be partly deduced based on its capacity to occupy its climatic refugium through range-filling since the last great climatic shift on Earth, i.e., the LGM 20,000 years ago (Svenning and Skov, 2004; Dullinger et al., 2012b; Cannone and Pignatti, 2014). It was previously established that vast majority of the 664 species pool showed a climatic refugium between the present and the LGM (84%; Peyre et al., in review), a number that reduced further in the future since only 77% of the species pool potentially had a LGM refugium by 2070 under the novel climates that create new conditions requiring fast responses from species. If a species is shifting its distribution out of its refugium, it likely means that it has good migration capacity. If it remains within its refugium, it means that the species relies on its adaptation capacity to new environments or it is potentially challenged and delaying its extirpation by other factors such as biotic interactions. For example, the endemic Eryngium humboldtii, which despite being predicted with a small future distribution of 10 km2 should remain at 95% in its climatic refugium since the LGM. Across all studied species, the results suggested that the chances to find potential refugia are higher in central Ecuador and the Amotape-Huancabamba zone, an area coinciding with important future losses in species distribution according to the models. The refugium pattern encountered here repeats previous findings from a previous study focusing on refugia between the LGM and present time (Peyre et al., in review) and was interpreted as (i) the easier access to low elevation from out-of-the-páramo species, as well as (ii) climatic stability due to low elevations, and (iii) entry points for species colonizing from the central Andes (Weigend, 2002). Nevertheless, the spatial patterns observed here differed from previous findings by dismissing two refugia-rich areas located on the eastern slope of the cordillera and in Central Colombia, according to Peyre et al. (in review). These contrasting results could be, respectively, due to (i) the definition of endemics at the species level instead of the genus level, weighted by the Espeletiinae group diversified in Colombia; and (ii) quick climatic changes predicted to occur between 2010 and 2070 such as the progressive precipitation shifts of the western Amazonia, which could reduce long-term suitable areas for páramo species.
On average, 21.41% of a species’ future distribution in 2070 coincided with a LGM refugium, and an additional 47.59% to a PF refugium, with little distinction for endemics alone. It means that species have a strong tendency to shift out of their climatic refugium over time, and that this shift is supposed to occur quicker in the near future as 30% of a species distribution in 2070 will not coincide with any refugium. I supposed in hypothesis H3 that the smaller the refugium, the higher the probability that a species would climb out of it, however, there was no support for this hypothesis given the lack of PPF correlation, this probably due to the diversity of responses to environmental change on such a broad timescale. However, there was a slight significant positive correlation between refugium size and future distribution for the PF relationship. This finding means that a species with a large distribution in 2070 will have likely remained close to its current distribution, while a species with a small distribution will have likely climbed out of its current refugia.
The models also identified that on average, species will occupy 77.28% or their potential area by 2070, which means that about 20% of their potential distribution will be available but inaccessible due to dispersal limitations at that time. This finding strengthens my hypothesis H1 that dispersal is a significant constraint for páramo species, a pattern that is repeated for endemics who on average occupy 84.28% of their potential area. This insufficient dispersal at play can be related either in the form of (i) short DD, as páramo species disperse on the lower end of the terrestrial angiosperm dispersal spectrum (Peyre et al., 2020; Sklenář et al., 2021) and similarly to other alpine floras (Vittoz et al., 2009; Morgan and Venn, 2017); or (ii) as habitat natural fragmentation impeding dispersal, due to the sky island setting of the northern Andes (Anthelme et al., 2014). In addition, it suggests that narrow-range species with net distribution losses and little potential area could have issues finding niche area in the future, and therefore be at risk of extinction. For instance, Aa argyrolepis and Aa maderoi, both small terrestrial orchids that are predicted to occupy less than 10 km2 in the future and experience a net loss of 28.82 and 79.59% of their distribution, respectively, by 2070 also occupy less than 1% of their potential niche due to dispersal limitations.
Future Perspectives
This study provides a first outlook of páramo plant responses to climate change in the Andean páramo and identified that, even though species distributions might increase overall through uplsope migration and lead to the accelerated colonization process of high mountain areas, there are several concerns. The speed of climate change induces little refugium stability and important losses in species distributions, urging them to rely on their DP to track climate change, which is an issue for many páramo plants. While 9% of the species pool was deemed at risk of extirpation, 10% of the endemics pool could undergo extinction by 2070, which calls for urgent monitoring and conservation measures targeting these species. In addition, I suspect that this proportion would increase accounting for a larger endemics species pool, since many were discarded from theses analyses due to the scarcity of datapoints, hence requiring rare-species model approaches (Breiner et al., 2017). More fitted models to predict these few occurrences species such as Joint SDMs would therefore help predict these species responses to climate change (e.g., Wilkinson et al., 2021). Climate change is already inflincting serious impacts on biodiversity worldwide, but its velocity and local directions in the páramo will likely lead to different levels of exposure and vulnerability for plant species (Dobrowski and Parks, 2016; Panetta et al., 2018). Focusing on the adaptative capacity of species is germane today to complement and fully assess the true vulnerability state of páramo species. In fact, topographically heterogenous landscapes create local microrefugia, which can respond independently or at least slower to environmental change than their surrounding macroclimate (Scherrer and Körner, 2011; Patsiou et al., 2014). This behavior could in turn imply that local páramo plants could be able to persist and show resilience in light of future climate change and delay their extirpation, as observed in several other alpine flora (Frei et al., 2014; Graae et al., 2018). Therefore, future research focusing on climate change responses from páramo plants should incorporate a meso to microscale outlook (Cannone and Pignatti, 2014; e.g., Lenoir et al., 2017). Finally, it would be crucial to account for evolving land-systems in future predictions, since the human response to climate change, in the form of population increase, land-use expansion and intensification, is bound to pose more threats to the páramo biodiversity than climate change itself (Anthelme and Peyre, 2020).
Publisher’s Note
All claims expressed in this article are solely those of the authors and do not necessarily represent those of their affiliated organizations, or those of the publisher, the editors and the reviewers. Any product that may be evaluated in this article, or claim that may be made by its manufacturer, is not guaranteed or endorsed by the publisher.
Statements
Data availability statement
The original contributions presented in the study are included in the article/Supplementary Material, further inquiries can be directed to the corresponding author.
Author contributions
The author confirms being the sole contributor of this work and has approved it for publication.
Funding
GP was financed through the Fondo de Profesores of the University of the Andes and the LMI-BioInca.
Acknowledgments
The author would like to thank Catalina Lopez for her assistance with model processing.
Conflict of interest
The author declares that the research was conducted in the absence of any commercial or financial relationships that could be construed as a potential conflict of interest.
Supplementary material
The Supplementary Material for this article can be found online at: https://www.frontiersin.org/articles/10.3389/fevo.2022.896387/full#supplementary-material
Supplementary Figure 1Correlations between the area occupied by each species in 2070 and the proportion of this distribution inside a climatic refugium (a) since the LGM (PPF) and (b) since 2010 (PF).
Supplementary Table 1Endemic status of the 664 species modeled in the study. The procedure included fitting 90% of the species occurrences (1) in the study area defined by the Latitude-Longitude frame, and (2) above the 3,000 m elevation mask. The table shows each step of the process and the final classification of every species as endemic or not of the high northern Andes.
Supplementary Table 2Model performance according to the Specificity, Sensitivity and TSS metrics for the four employed algorithms: ANN, GLM, MARS, and RF, averaged over their 25 runs for each of the 664 studied species (standard deviation in parenthesis), for both the realized and potential species distribution models.
References
1
AdhikariP.ShinM. S.JeonJ. Y.KimH. W.HongS.SeoC. (2018). Potential impact of climate change on the species richness of subalpine plant species in the mountain national parks of South Korea.J. Ecol. Environ.42:36. 10.1186/s41610-018-0095-y
2
AlexanderJ. M.ChalmandrierL.LenoirJ.BurgessT. I.EsslF.HaiderS.et al (2018). Lags in the response of mountain plant communities to climate change.Glob. Change Biol.24563–579.
3
AlexanderJ. M.DiezJ. M.LevineJ. M. (2015). Novel competitors shape species’ responses to climate change.Nature525515–518.
4
AlloucheO.TsoarA.KadmonR. (2006). Assessing the accuracy of species distribution models: prevalence, kappa and the true skill statistic (TSS).J. Appl. Ecol.431223–1232. 10.1111/j.1365-2664.2006.01214.x
5
AndersonE. P.MarengoJ.VillalbaR.HalloyS.YoungB.CorderoD.et al (2011). “Consequences of climate change for ecosystems and ecosystem services in the tropical Andes,” in Climate Change and Biodiversity in the Tropical Andes, edsHerzogS. K.MartínezR.JørgensenP. M.TiessenH. (São José dos Campos: Inter-American Institute for Global Change Research), 1–18.
6
AnthelmeF.CavieresL. A.DanglesO. (2014). Facilitation among plants in alpine environments in the face of climate change.Front. Plant Sci.5:387. 10.3389/fpls.2014.00387
7
AnthelmeF.LavergneS. (2018). Alpine and arctic plant communities: a worldwide perspective.Perspect. Plant Ecol. Evol. Syst.301–131.
8
AnthelmeF.PeyreG. (2020). “Biogeography of South American highlands,” in Reference Module in Earth Systems and Environmental Sciences, Encyclopedia of the World’s Biomes, edsEliasS. A.AldertonD. H. M.BliznakV.CochranJ. K.DellaSalaD. A.FunicielloF.et al (Amsterdam: Elsevier). 10.1016/B978-0-12-409548-9.11811-1
9
AnthelmeF.CarrasquerI.CeballosJ. L.PeyreG. (in press). Novel plant communities after glacial retreat in Colombia: (many) losses and (few) gains ALBO-D-21-00071. Alp. Bot.
10
AraújoM. B.AndersonR. P.BarbosaA.BealeC. M.DormannC. F.EarlyR.et al (2019). Standards for distribution models in biodiversity assessments.Sci. Adv.5:eaat4858.
11
BarnoskyA. D.MatzkeN.TomiyaS.WoganG. O.SwartzB.QuentalT. B.et al (2011). Has the Earth’s sixth mass extinction already arrived?Nature47151–57.
12
BreinerF. T.GuisanA.NobisM. P.BergaminiA. (2017). Including environmental niche information to improve IUCN red list assessments.Divers. Distrib.23484–495.
13
BrunP.ThuillerW.ChauvierY.PellissierL.WüestR. O.WangZ.et al (2020). Model complexity affects species distribution projections under climate change.J. Biogeogr.47130–142.
14
CannoneN.PignattiS. (2014). Ecological responses of plant species and communities to climate warming: upward shift or range filling processes?Clim. Change123201–214. 10.1007/s10584-014-1065-8
15
CeballosG.EhrlichP. R.BarnoskyA. D.GarcíaA.PringleR. M.PalmerT. M. (2015). Accelerated modern human–induced species losses: entering the sixth mass extinction.Sci. Adv.1:e1400253.
16
De VosJ. M.JoppaL. N.GittlemanJ. L.StephensP. R.PimmS. L. (2015). Estimating the normal background rate of species extinction.Conserv. Biol.29452–462.
17
DiazS.SetteleJ.BrondízioE.NgoH.GuèzeM.AgardJ.et al (2019). Summary for Policymakers of the Global Assessment Report on Biodiversity and Ecosystem Services of the Intergovernmental Science-Policy Platform on Biodiversity and Ecosystem Services.Bonn: IPBES secretariat.
18
DobrowskiS. Z.ParksS. A. (2016). Climate change velocity underestimates climate change exposure in mountainous regions.Nat. Commun.7:12349.
19
DormannC. F.CalabreseJ. M.GuilleraArroitaG.MatechouE.BahnV.BartońK.et al (2018). Model averaging in ecology: a review of Bayesian, information-theoretic, and tactical approaches for predictive inference.Ecol. Monogr.88485–504.
20
DullingerS.GattringerA.ThuillerW.MoserD.ZimmermannN. E.GuisanA.et al (2012a). Extinction debt of high-mountain plants under twenty-first century climate change.Nat. Clim. Change2619–622.
21
DullingerS.WillnerW.PlutzarC.EnglischT.Schratt-EhrendorferL.MoserD.et al (2012b). Post-glacial migration lag restricts range filling of plants in the European Alps.Glob. Ecol. Biogeogr.21829–840.
22
DussaillantI.BerthierE.BrunF.MasiokasM.HugonnetR.FavierV.et al (2019). Two decades of glacier mass loss along the Andes.Nat. Geosci.12802–808.
23
EnglerR.HordijkW.GuisanA. (2012). The MIGCLIM R package–seamless integration of dispersal constraints into projections of species distribution models.Ecography35872–878.
24
FadriqueB.BáezS.DuqueÁ.MaliziaA.BlundoC.CarillaJ.et al (2018). Widespread but heterogeneous responses of Andean forests to climate change.Nature564207–212.
25
FeeleyK. J.SilmanM. R.DuqueA. (2015). Where are the tropical plants? A call for better inclusion of tropical plants in studies investigating and predicting the effects of climate change.Front. Biogeogr.7174–176.
26
FernandesR. F.ScherrerD.GuisanA. (2019). Effects of simulated observation errors on the performance of species distribution models.Divers. Distrib.25400–413.
27
FreemanE. A.MoisenG. (2008). PresenceAbsence: an R package for presence absence analysis.J. Stat. Softw.231–31.
28
FreiE. R.GhazoulJ.MatterP.HeggliM.PluessA. R. (2014). Plant population differentiation and climate change: responses of grassland species along an elevational gradient.Glob. Change Biol.20441–455.
29
GraaeB. J.VandvikV.ArmbrusterW. S.EiserhardtW. L.SvenningJ. C.HylanderK.et al (2018). Stay or go–how topographic complexity influences alpine plant population and community responses to climate change.Perspect. Plant Ecol. Evol. Syst.3041–50.
30
HaoT.ElithJ.Guillera-ArroitaG.Lahoz-MonfortJ. J. (2019). A review of evidence about use and performance of species distribution modelling ensembles like BIOMOD.Divers. Distrib.25839–852.
31
HattabT.Garzón-LópezC. X.EwaldM.SkowronekS.AertsR.HorenH.et al (2017). A unified framework to model the potential and realized distributions of invasive species within the invaded range.Divers. Distrib.23806–819. 10.1111/ddi.12566
32
HelmerE. H.GersonE. A.BaggettL. S.BirdB. J.RuzyckiT. S.VoggesserS. M. (2019). Neotropical cloud forests and páramo to contract and dry from declines in cloud immersion and frost.PLoS One14:e0213155. 10.1371/journal.pone.0213155
33
HofstedeR.SegarraP.VásconezP. M. (2003). Los Páramos del Mundo: Proyecto Atlas Mundial de los Páramos.Quito: UICN Global Peatland Initiative, Ecociencia.
34
HumphreysA. M.GovaertsR.FicinskiS. Z.LughadhaE. N.VorontsovaM. S. (2019). Global dataset shows geography and life form predict modern plant extinction and rediscovery.Nat. Ecol. Evol.31043–1047.
35
IPCC (2021). “Climate change 2021: the physical science basis,” in Proceedings of the Contribution of Working Group I to the Sixth Assessment Report of the Intergovernmental Panel on Climate Change, edsMasson-DelmotteV.ZhaiP.PiraniA.ConnorsS. L.PéanC.BergerS.et al (Cambridge: Cambridge University Press).
36
KappelleM.HornS. P. (2016). “The páramo ecosystem of costa Rica’s highlands,” in Costa Rican Ecosystems, ed.KappelleM. (Chicago, IL: The University of Chicago Press), 492–523.
37
KargerD. N.ConradO.BöhnerJ.KawohlT.KreftH.Soria-AuzaR. W.et al (2017). Climatologies at high resolution for the earth’s land surface areas.Sci. Data4:170122. 10.1038/sdata.2017.122
38
KörnerC. (2021). Alpine Plant Life: Functional Plant Ecology of High Mountain Ecosystems.Berlin: Springer Nature.
39
LenoirJ.BertrandR.ComteL.BourgeaudL.HattabT.MurienneJ.et al (2020). Species better track climate warming in the oceans than on land.Nat. Ecol. Evol.41044–1059.
40
LenoirJ.HattabT.PierreG. (2017). Climatic microrefugia under anthropogenic climate change: implications for species redistribution.Ecography40253–266.
41
LenoirJ.SvenningJ. C. (2015). Climate-related range shifts–a global multidimensional synthesis and new research directions.Ecography3815–28. 10.1111/ecog.00967
42
Leon-GarciaI. V.LassoE. (2019). High heat tolerance in plants from the Andean highlands: implications for paramos in a warmer world.PLoS One14:e0224218. 10.1371/journal.pone.0224218
43
LiuC.BerryP. M.DawsonT. P.PearsonR. G. (2005). Selecting thresholds of occurrence in the prediction of species distributions. Ecography28, 385–393. 10.1111/j.0906-7590.2005.03957.x
44
LlambíL. D.HuppN.SaezA.CallawayR. (2018). Reciprocal interactions between a facilitator, natives, and exotics in tropical alpine plant communities.Perspect. Plant Ecol. Evol. Syst.3082–88.
45
LozanoP.CabreraO.PeyreG.CleefA.ToulkeridisT. (2020). Plant diversity and composition changes along an altitudinal gradient in the isolated volcano Sumaco in the Ecuadorian Amazon.Diversity12:229.
46
LuteynJ. L.ChurchillS. P.GriffinD.GradsteinS. R.SipmanH. J.GavilanesA. (1999). Páramos: A Checklist of Plant Diversity, Geographical Distribution, and Botanical Literature, Vol. 278. New York, NY: New York Botanical Garden Press.
47
MavárezJ.BézyS.GoeuryT.FernándezA.AubertS. (2019). Current and future distributions of Espeletiinae (Asteraceae) in the Venezuelan Andes based on statistical downscaling of climatic variables and niche modelling.Plant Ecol. Divers.12633–647.
48
MerowC.SmithM. J.EdwardsT. C.Jr.GuisanA.McMahonS. M.NormandS.et al (2014). What do we gain from simplicity versus complexity in species distribution models?Ecography371267–1281.
49
MorganJ. W.VennS. E. (2017). Alpine plant species have limited capacity for long-distance seed dispersal.Plant Ecol.218813–819. 10.1007/s11258-017-0731-0
50
NaimiB.HammN. A.GroenT. A.SkidmoreA. K.ToxopeusA. G. (2014). Where is positional uncertainty a problem for species distribution modelling?Ecography37191–203. 10.1111/j.1600-0587.2013.00205.x
51
Pabón-CaicedoJ. D.AriasP. A.CarrilA. F.EspinozaJ. C.BorrelL. F.GoubanovaK.et al (2020). Observed and projected hydroclimate changes in the Andes.Front. Earth Sci.8:61. 10.3389/feart.2020.00061
52
Palomino-LemusR.Córdoba-MachadoS.Gámiz-FortisS. R.Castro-DíezY.Esteban-ParraM. J. (2015). Summer precipitation projections over Northwestern South America from CMIP5 models.Glob. Planet. Change13111–23. 10.1016/j.gloplacha.2015.05.004
53
PanettaA. M.StantonM. L.HarteJ. (2018). Climate warming drives local extinction: evidence from observation and experimentation.Sci. Adv.4:eaaq1819. 10.1126/sciadv.aaq1819
54
PatsiouT. S.ContiE.ZimmermannN. E.TheodoridisS.RandinC. F. (2014). Topo-climatic microrefugia explain the persistence of a rare endemic plant in the Alps during the last 21 millennia.Glob. Change Biol.202286–2300.
55
PepinN.BradleyR. S.DiazH. F.BaraërM.CaceresE. B.ForsytheN.et al (2015). Elevation-dependent warming in mountain regions of the world. Nat. clim. Change5, 424–430. 10.1038/nclimate2563
56
PeyreG. (2022). Climatic Refugia in the Coldest Neotropical Hotspot, the Andean páramo. Presence-Absence Data for the 664 Species analyzed in this Study in the Northern Andes. Dryad, Dataset. Available online at: 10.5061/dryad.pnvx0k6p8(accessed May 5, 2020).
57
PeyreG.BalslevH.FontX. (2018). Phytoregionalisation of the Andean páramo.PeerJ6:e4786. 10.7717/peerj.4786
58
PeyreG.BalslevH.FontX.TelloJ. S. (2019). Fine-scale plant richness mapping of the Andean páramo according to macroclimate.Front. Ecol. Evol.7:377. 10.3389/fevo.2019.00377
59
PeyreG.BalslevH.MartíD.SklenářP.RamsayP.LozanoP.et al (2015). VegPáramo, a flora and vegetation database for the Andean páramo.Phytocoenologia45195–201. 10.1127/phyto/2015/0045
60
PeyreG.LenoirJ.KargerD. N.GomezM.GonzalezA.BroennimannO.et al (2020). The fate of páramo plant assemblages in the sky islands of the northern Andes.J. Veg. Sci.31967–980.
61
PeyreG.OsorioD.FrançoisR.AnthelmeF. (2021). Mapping the páramo land-cover in the Northern Andes.Int. J. Remote Sens.427777–7797.
62
PeyreG.LopezC.DiazM. D.LenoirJ. (in review). Climatic refugia in the coldest Neotropical hotspot, the Andean páramo.Divers. Distrib.
63
R Core Team (2020). R: A Language and Environment for Statistical Computing.Vienna: R Foundation for Statistical Computing.
64
RoseroP.Crespo-PérezV.EspinosaR.AndinoP.BarragánÁ.MoretP.et al (2021). Multi-taxa colonisation along the foreland of a vanishing equatorial glacier.Ecography441010–1021.
65
SandersonB. M.KnuttiR.CaldwellP. (2015). A representative democracy to reduce interdependency in a multimodel ensemble.J. Clim.285171–5194. 10.1175/jcli-d-14-00362.1
66
SantiniL.Benítez-LópezA.MaioranoL.ČengićM.HuijbregtsM. A. (2021). Assessing the reliability of species distribution projections in climate change research.Divers. Distrib.271035–1050.
67
ScherrerD.KörnerC. (2011). Topographically controlled thermal-habitat differentiation buffers alpine plant diversity against climate warming.J. Biogeogr.38406–416. 10.1111/j.1365-2699.2010.02407.x
68
SklenářP.HedbergI.CleefA. M. (2014). Island biogeography of tropical alpine floras.J. Biogeogr.41287–297. 10.1111/jbi.12212
69
SklenářP.RomolerouxK.MurielP.JaramilloR.BernardiA.DiazgranadosM.et al (2021). Distribution changes in páramo plants from the equatorial high Andes in response to increasing temperature and humidity variation since 1880.Alp. Bot.131201–212.
70
SmithA. B.SantosM. J. (2020). Testing the ability of species distribution models to infer variable importance.Ecography431801–1813.
71
SteinbauerM. J.GrytnesJ. A.JurasinskiG.KulonenA.LenoirJ.PauliH.et al (2018). Accelerated increase in plant species richness on mountain summits is linked to warming.Nature556231–234. 10.1038/s41586-018-0005-6
72
SvenningJ. C.SkovF. (2004). Limited filling of the potential range in European tree species.Ecol. Lett.7565–573.
73
TammeR.GötzenbergerL.ZobelM.BullockJ. M.HooftmanD. A.KaasikA.et al (2014). Predicting species’ maximum dispersal distances from simple plant traits.Ecology95505–513. 10.1890/13-1000.1
74
TelwalaY.BrookB. W.ManishK.PanditM. K. (2013). Climate-induced elevational range shifts and increase in plant species richness in a Himalayan biodiversity epicentre.PLoS One8:e57103. 10.1371/journal.pone.0057103
75
ThuillerW.GeorgesD.EnglerR.BreinerF.GeorgesM. D.ThuillerC. W. (2016). Package ‘biomod2’. Species Distribution Modeling within an Ensemble Forecasting Framework. Available Online at: https://cran.r-project.org/web/packages/biomod2/index.html
76
ThuillerW.GuéguenM.RenaudJ.KargerD. N.ZimmermannN. E. (2019). Uncertainty in ensembles of global biodiversity scenarios.Nat. Commun.10:1446. 10.1038/s41467-019-09519-w
77
ToledoO.PalazziE.Cely ToroI. M.MortariniL. (2021). Comparison of elevation-dependent warming and its drivers in the tropical and subtropical Andes.Clim. Dyn.10.1007/s00382-021-06081-4
78
UrbanM. C. (2015). Accelerating extinction risk from climate change.Science348571–573.
79
ValenciaJ. B.MesaJ.LeónJ. G.MadriñánS.CortésA. J. (2020). Climate vulnerability assessment of the espeletia complex on Páramo Sky Islands in the Northern Andes.Front. Ecol. Evol.8:565708. 10.3389/fevo.2020.565708
80
van ProosdijA. S.SosefM. S.WieringaJ. J.RaesN. (2016). Minimum required number of specimen records to develop accurate species distribution models.Ecography39542–552.
81
VittozP.DussexN.WassefJ.GuisanA. (2009). Diaspore traits discriminate good from weak colonisers on high-elevation summits.Basic Appl. Ecol.10508–515. 10.1016/j.baae.2009.02.001
82
VuilleM.FranquistE.GarreaudR.Lavado CasimiroW. S.CáceresB. (2015). Impact of the global warming hiatus on Andean temperature.J. Geophys. Res. Atmos.1203745–3757. 10.1002/2015jd023126
83
WangX.-Y.LiX.ZhuJ.TanajuraC. A. S. (2018). The strengthening of Amazonian precipitation during the wet season driven by tropical sea surface temperature forcing.Environ. Res. Lett.13:094015. 10.1088/1748-9326/aadbb9
84
WeigendM. (2002). Observations on the biogeography of the Amotape-Huancabamba zone in northern Peru.Bot. Rev.6838–54.
85
WilkinsonD. P.GoldingN.Guillera-ArroitaG.TingleyR.McCarthyM. A. (2021). Defining and evaluating predictions of joint species distribution models.Methods Ecol. Evol.12394–404.
86
ZimmerA.MenesesR. I.RabatelA.SorucoA.DanglesO.AnthelmeF. (2018). Time lag between glacial retreat and upward migration alters tropical alpine communities.Perspect. Plant Ecol. Evol. Syst.3089–102.
Summary
Keywords
Andes, climate change, dispersal constraints, last glacial maximum, species distribution model, tropicalpine, vascular plants
Citation
Peyre G (2022) What Does the Future Hold for Páramo Plants? A Modelling Approach. Front. Ecol. Evol. 10:896387. doi: 10.3389/fevo.2022.896387
Received
15 March 2022
Accepted
04 May 2022
Published
26 May 2022
Volume
10 - 2022
Edited by
Scott Brian Franklin, University of Northern Colorado, United States
Reviewed by
Diego Nieto-Lugilde, University of Córdoba, Spain; Maria Cristina Duarte, University of Lisbon, Portugal
Updates
Copyright
© 2022 Peyre.
This is an open-access article distributed under the terms of the Creative Commons Attribution License (CC BY). The use, distribution or reproduction in other forums is permitted, provided the original author(s) and the copyright owner(s) are credited and that the original publication in this journal is cited, in accordance with accepted academic practice. No use, distribution or reproduction is permitted which does not comply with these terms.
*Correspondence: Gwendolyn Peyre, gf.peyre@uniandes.edu.co
This article was submitted to Biogeography and Macroecology, a section of the journal Frontiers in Ecology and Evolution
Disclaimer
All claims expressed in this article are solely those of the authors and do not necessarily represent those of their affiliated organizations, or those of the publisher, the editors and the reviewers. Any product that may be evaluated in this article or claim that may be made by its manufacturer is not guaranteed or endorsed by the publisher.