Abstract
Ecological communities are fundamentally connected through a network of trophic interactions that are often complex and difficult to model. Substantial variation exists in the nature and magnitude of these interactions across various predators and prey and through time. However, the empirical data needed to characterize these relationships are difficult to obtain in natural systems, even for relatively simple food webs. Consequently, prey-dependent relationships and specifically the hyperbolic form (Holling’s Type II), in which prey consumption increases with prey density but ultimately becomes saturated or limited by the time spent handling prey, are most widely used albeit often without knowledge of their appropriateness. Here, we investigate the sensitivity of a simplified food web model for a natural, boreal system in the Kluane region of the Yukon, Canada to the type of functional response used. Intensive study of this community has permitted best-fit functional response relationships to be determined, which comprise linear (type I), hyperbolic (type II), sigmoidal (type III), prey- and ratio-dependent relationships, and inverse relationships where kill rates of alternate prey are driven by densities of the focal prey. We compare node- and network-level properties for a food web where interaction strengths are estimated using best-fit functional responses to one where interaction strengths are estimated exclusively using prey-dependent hyperbolic functional responses. We show that hyperbolic functional responses alone fail to capture important ecological interactions such as prey switching, surplus killing and caching, and predator interference, that in turn affect estimates of cumulative kill rates, vulnerability of prey, generality of predators, and connectance. Exclusive use of hyperbolic functional responses also affected trends observed in these metrics over time and underestimated annual variation in several metrics, which is important given that interaction strengths are typically estimated over relatively short time periods. Our findings highlight the need for more comprehensive research aimed at characterizing functional response relationships when modeling predator-prey interactions and food web structure and function, as we work toward a mechanistic understanding linking food web structure and community dynamics in natural systems.
Introduction
Functional responses, which describe density-dependent interactions between predators and their prey, are integral to community and ecosystem dynamics. These relationships connect behavior and physiology of individuals to broader community dynamics through the role that they play in determining vital rates for both predator and prey populations (Holling, 1959; Rosenzweig and MacArthur, 1963). As such, functional responses are commonly used to measure predator-prey interactions (i.e., interaction strengths measured as per capita kill rates) (Berlow et al., 2004) and continue to form the basis of investigations into the relationship between the complexity and stability of natural systems (Oaten and Murdoch, 1975; Nunney, 1980; Abrams and Allison, 1982; Rall et al., 2008; Kawatsu and Kondoh, 2018). Given their inherent link to individual fitness, functional response relationships are also shaped by predator-prey interactions occurring over evolutionary timescales (Abrams, 1997; Drossel et al., 2004; Jones and Ellner, 2007) and hence are also expected to take diverse forms (Kawatsu and Kondoh, 2018).
Various types of functional response models exist owing to the many ecological processes that can influence the functional response (reviewed in Jeschke et al., 2002; Figure 1). Holling (1959) originally described three types characterized by the shape of the relationship between prey density and a predator’s kill rate: type I (rectilinear), type II (hyperbolic) and type III (sigmoidal). Despite Holling’s (1959) original classification, “type I” is frequently used in contemporary literature to mean a linear functional response that lacks an upper threshold above which the consumption rate becomes constant. We use “linear” to mean fully linear models with no observed upper threshold. Type I functional responses are exclusive to filter feeders that are not limited by the time required to process food (Jeschke et al., 2004), but linear responses have been observed more broadly, often when data to fit a more complex relationship are lacking (e.g., Chan et al., 2017; Beardsell et al., 2021). Hyperbolic functional responses arise when predators become satiated or limited at high prey densities by the time taken to handle their prey (Holling, 1959). Sigmoidal functional responses occur when predators are further limited in their ability to kill prey at low densities, such as when ample prey refuges are available or with learning when switching between different prey types, patches, or foraging tactics (Oaten and Murdoch, 1975; Jeschke et al., 2002; Hossie and Murray, 2010). These prey-dependent models have also been expanded to multispecies models to account for predators that feed on multiple types of prey (Smout et al., 2010; Morozov and Petrovskii, 2013; Chan et al., 2017; Smith and Smith, 2020). Additionally, when predators feed primarily on a focal prey type, the functional response of alternate prey types can be inversely related to densities of the focal prey rather than depending on densities of the alternate prey (Chan et al., 2017). Interference or facilitation from conspecifics can lead to kill rates that are best described by predator- or ratio-dependent functional responses, further taking the density of predators into account (Arditi and Ginzburg, 1989; Skalski and Gilliam, 2001; Berec, 2010). Recent studies also continue to reveal an increasing number of factors that can influence functional responses (e.g., spatial distribution of predators and prey—Fryxell et al., 2007; McLellan et al., 2010; Arjaldi et al., 2011; Zimmerman et al., 2015; Hossie and Murray, 2016; Bentout et al., 2021 habitat complexity and heterogeneity—Holt, 2002; McPhee et al., 2012; Mocq et al., 2021; season, temperature and other climate-related factors—Sand et al., 2008; Sentis et al., 2015; Uiterwaal and DeLong, 2020; individual differences in predator and prey behavior—Pettorelli et al., 2015).
FIGURE 1
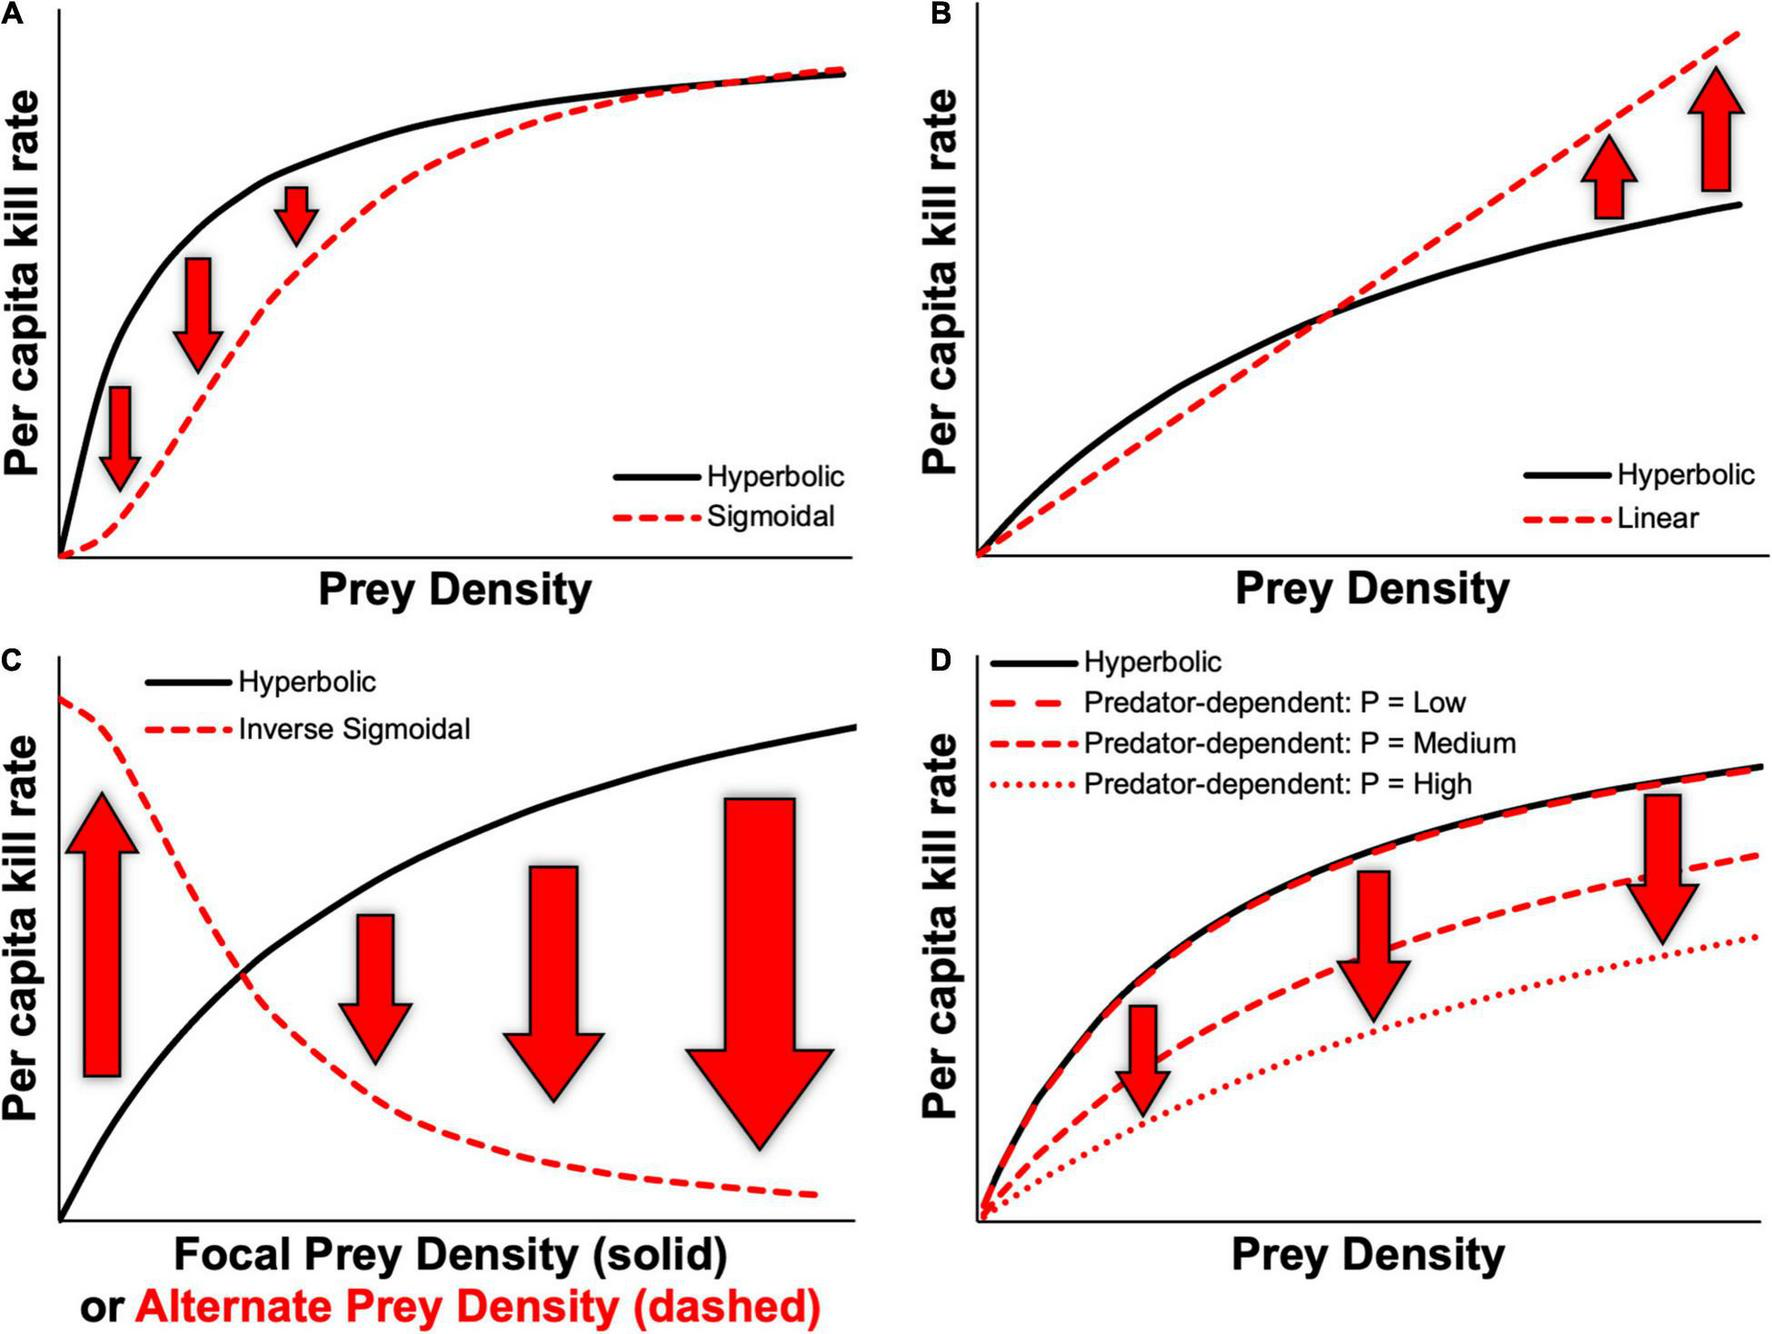
Examples of various functional response relationships based on the Kluane vertebrate system, Yukon, Canada, highlighting potential differences in predicted kill rates between prey-dependent hyperbolic relationships and (A) prey-dependent sigmoidal, (B) prey-dependent linear, (C) inverse sigmoidal, and (D) predator-dependent functional responses, where P represents the predator density.
Theoretical studies have further shown that community models are sensitive to the type of functional response models used (Nunney, 1980; Kondoh, 2003; Rall et al., 2008; Aldebert and Stouffer, 2018; Kawatsu and Kondoh, 2018), given that different forms of functional response models can lead to markedly different predictions in kill rates. Figure 1 depicts several examples of how predicted kill rates might differ owing to the type of functional response used. Based on the differences that define hyperbolic and sigmoidal functional responses, kill rates predicted by these types of models are likely to differ mostly over low prey densities (Figure 1A). Kill rates predicted by linear functional responses might differ most from those of a hyperbolic functional response at high prey densities, owing to the lack of saturation that occurs with the latter, thus leading to lower rates of increase in kill rates at high prey densities (Figure 1B). Predicted kill rates from an inverse functional response model for alternate prey can differ drastically from prey-dependent models based on densities of alternate prey, as these would instead depend on densities of the focal prey (Figure 1C). Similarly, interference from conspecific predators can reduce kill rates across the full range of prey densities when compared to a prey-dependent functional response (Figure 1D). Importantly, most studies employ prey-dependent hyperbolic functional response models (Jeschke et al., 2004; Novak et al., 2017) and often without considering the many processes that can yield different types of functional response models beyond Holling’s types I—III (Okuyama, 2012, 2013). Likewise, functional responses that are driven by predator numbers or predator:prey ratio are rarely considered (Abrams and Ginzburg, 2000).
We investigated how the type of functional response relationship used to estimate interaction strengths in a food web model influences modeled predator-prey interactions, both at the level of individual species and across the community, for a natural system. Using a simplified food web for a boreal forest community in the Kluane Region of the Yukon, Canada, we compared several quantitative descriptors (i.e., cumulative kill rates, vulnerability of prey, generality of predators, and connectance, see Bersier et al., 2002), based on interaction strengths estimated from different types of functional response models. More specifically, we examined how food web model predictions differ when interaction strengths are estimated using previously published best-fit functional responses (Chan et al., 2017) compared to prey-dependent hyperbolic functional responses. Best-fit functional response relationships for predators and prey that comprise our simplified Kluane food web encompass a diverse array of functional response types, including linear, hyperbolic, sigmoidal, prey- and ratio-dependent relationships, and inverse relationships for alternate prey. Owing to the length of our time series, which spans a full 10-year snowshoe hare (Lepus americanus) cycle that is characteristic of this system, we further examine the effect of the type of functional response on trends in these quantitative descriptors over time.
Materials and Methods
Study System
Our food web model was developed for the Kluane Region of southwestern Yukon, Canada (61°57′N, 138°12′W), a system that is renowned for its intensive study of the cyclic population dynamics of snowshoe hare and Canada lynx (Lynx canadensis), and where predator-prey interactions have been well studied as part of the Kluane Boreal Forest Ecosystem Project1 (Krebs et al., 2001, 2017). The area is dominated by white spruce (Picea glauca), patches of aspen (Populus tremuloides), and a mix of gray willow (Salix sp.) and American dwarf birch (Betula glandulosa). As part of the boreal forest of North America, the cyclic dynamics of the snowshoe hare (hereafter “hare”), and one of its primary predators, the Canada lynx (hereafter “lynx”) are central to this system (Boutin et al., 1995). Our food web (Figure 2) thus focuses on the species within the community that are trophically most closely linked to these cyclic dynamics and for which diet and density data (Figure 3) were available to characterize functional response relationships. The main predators of hares comprise lynx, coyotes (Canis latrans), and great-horned owls (Bubo virginianus; hereafter “owl”). Our food web also includes red squirrel (Tamiasciurus hudsonicus) as an important alternate prey item for lynx (O’Donoghue et al., 1998b; Chan et al., 2017).
FIGURE 2
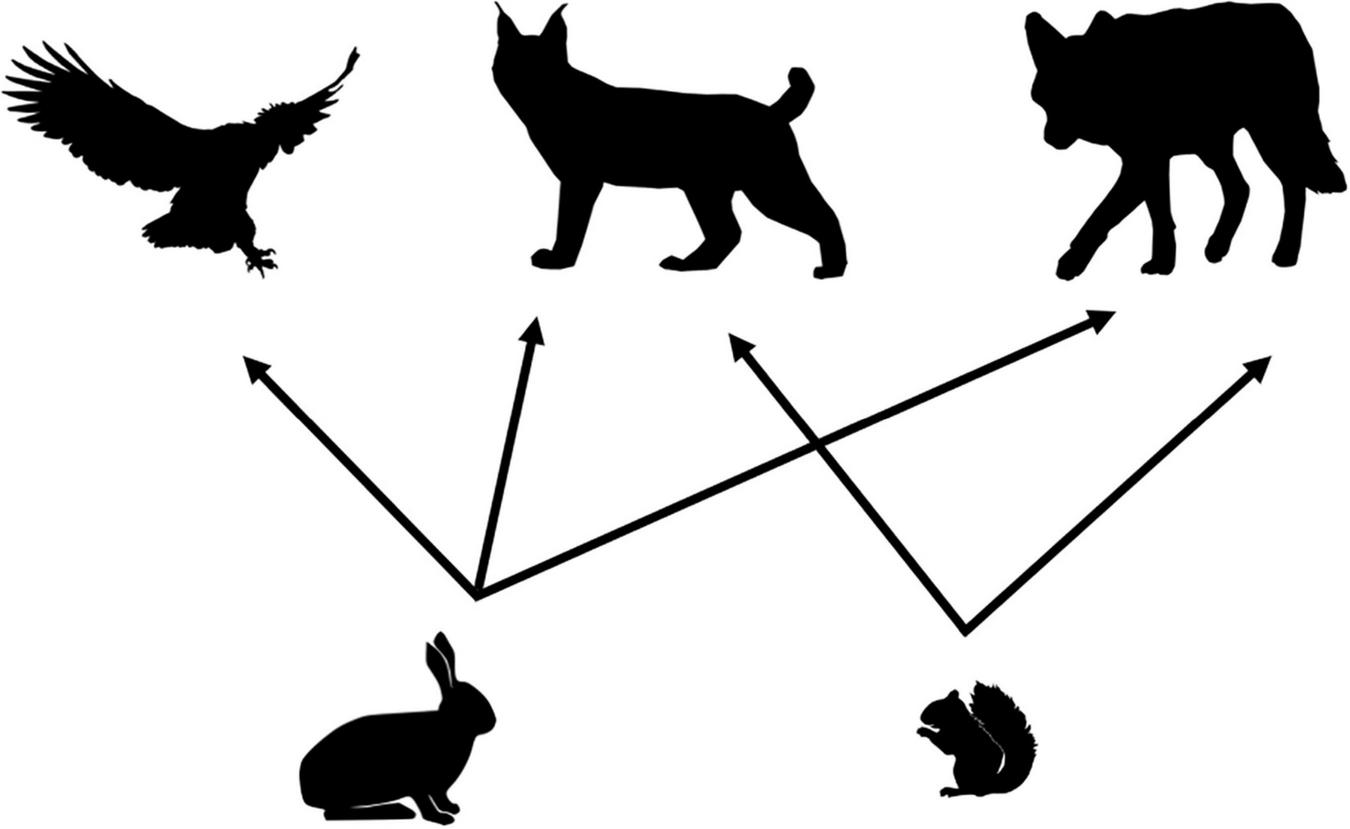
Simplified food web for the Kluane vertebrate system, Yukon, Canada focused around the cyclic dynamics of snowshoe hares. Hares are preyed on by lynx, owls, and coyotes. Red squirrels are an alternate prey item for both lynx and coyotes.
FIGURE 3

Estimated densities of predators (triangles) and prey (circles) for the simplified Kluane food web in winter. Densities of key predators (lynx, coyotes, owls) follow that of hares. Red squirrels, whose densities are independent of hares, serve as an alternate prey for lynx and coyotes. Shading indicates phases of the cycle as defined by hare density. Error bars for prey species represent 95% confidence intervals. Predator species lack confidence intervals, as densities shown here represent absolute counts from within the study area. Also note varying y-axis scale for each species.
The data used in our study were collected during winter seasons of the hare cycle spanning 1988 to 1997. Each hare cycle period in this region is approximately 10 years long (Hodges et al., 2001), with predator cycles typically lagging 1–3 years behind (Boutin et al., 1995; O’Donoghue et al., 2001). The cycle is divided into four phases: increase, peak, decline, and low, in accordance with rates of change in hare densities (Oli et al., 2020). Red squirrel densities are unrelated to those of hares and primarily driven by the availability of spruce cones (Boonstra et al., 2001; Figure 3). Hare and red squirrel densities for each winter are calculated as the average of estimates for fall (September—October) and spring (April—May) months, which were generated using spatially explicit capture-recapture by applying Efford’s maximum-likelihood based approach (Borchers and Efford, 2008; Efford, 2009) to mark-recapture data collected through live-trapping (Krebs, 2011). Notably, trends in hare densities reported here differ slightly from estimates previously reported for this region by Boutin et al. (1995) that used a jackknife estimator (Otis et al., 1978). Furthermore, our hare densities are mean estimates for the region based on grids within the study area that exhibited variation in the estimated timing of peak hare abundance between the winters of 1988-89 through 1990-91. Consequently, the present analysis did not reveal the 1-year lag in coyote and lynx densities reported by Boutin et al. (1995; Figure 3). Densities of coyotes and lynx were estimated by O’Donoghue et al. (1997) from track counts paired with known home ranges of radio-collared animals (O’Donoghue et al., 1997, in revision). Owls were censused by Rohner (1997), Rohner et al. (2001) through hooting surveys that were used to identify pairs and map territorial boundaries. Kill rates of each type of prey by lynx and coyotes were taken from O’Donoghue et al. (1998b), which were calculated from kills recorded during snow tracking of predators supplemented with movement data from radio-collared individuals to estimate time spent on kills and caches. Kill rates of hares by owls were estimated by Rohner et al. (2001) from diet data obtained through pellet analysis as a function of the proportion of prey in the diet, biomass consumed daily, activity levels, investment in reproduction, waste, and the time over which kill rates were estimated.
For each pair of prey and predators, we estimated interaction strengths for each year across the hare cycle as the daily per capita kill rate, using two types of functional responses: (1) the most commonly used in the literature, prey-dependent hyperbolic, and (2) the best-fit relationship determined by Rohner et al. (2001) for owls and hares, and Chan et al. (2017) for all other predators and prey (Table 1). Chan et al. (2017) compared candidate models with Akaike’s information criterion adjusted for small sample sizes (AICc), whereas Rohner et al. (2001) assessed model fit using R-squared values. When best-fit models from Chan et al. (2017) were statistically indistinguishable (ΔAICc < 2), we selected the most ecologically relevant model based on our existing knowledge of the predator-prey interaction. Specifically, we used sigmoidal and inverse sigmoidal functional responses as best-fit relationships for lynx with hares and red squirrels, respectively, which captures prey switching by lynx between their primary and alternate prey (Chan et al., 2017). For coyotes, all models with ΔAICc < 2 were linear, but for hares the prey-dependent, ratio-dependent, and predator-dependent models were indistinguishable. We selected the ratio-dependent linear functional response for the best-fit model as the model with lowest AICc value and the highest AICc weight. The next highest ranked model was also the predator-dependent model, which could suggest that interference may contribute to the coyote functional response (Chan et al., 2017). Parameters for hyperbolic and best-fit functional responses (Supplementary Table 1) were taken from Chan et al. (2017) for all prey and predators, except for owls with hares. Parameters for the latter relationship were obtained from Rohner et al. (2001) (Supplementary Table 1); this is also the only prey and predator pair for which the best-fit functional response is a prey-dependent hyperbolic response (Table 1). Given the inherent uncertainty associated with estimating kill rates and functional response relationships generally, we emphasize that best-fit relationships represent the model found to best fit the data within the set of candidate models evaluated and are not assumed to represent true relationships. All prey and predator densities used to estimate interaction strengths were scaled to an area of 100 km2 (Supplementary Table 2).
TABLE 1
| Consumer | Resource | Best-fit functional response | Ecological processes missed by hyperbolic |
| Lynx | Hare | Prey-dependent sigmoidal* | Prey-switching |
| Lynx | Red squirrel | Inverse sigmoidal* | Primary prey dependence and prey-switching |
| Coyote | Hare | Ratio-dependent linear* | Predator dependence, surplus killing and caching |
| Coyote | Red squirrel | Ratio-dependent linear* | Predator dependence and alternate prey dependence |
| Owl | Hare | Prey-dependent hyperbolic§ | none |
Best-fit functional response relationships for key predators and prey in the Kluane food web, and the ecological processes that are not accounted for when each is modeled using a prey-dependent hyperbolic functional response.
Sources:
§Rohner et al. (2001). Great Horned Owls. In C. J. Krebs, S. Boutin, and R. Boonstra (Eds.). Ecosystem Dynamics of the Boreal forest: The Kluane Project. New York: Oxford University Press.
Food Web Quantitative Descriptors
We estimated node- and network-level quantitative descriptors (Bersier et al., 2002) for the Kluane food web using interaction strengths estimated from both hyperbolic and best-fit functional response relationships for each year of the hare cycle (1988–1997). Here, the network represents the entire simplified food web, with each node representing an individual species. Given that hares are the focal species of predator-prey interactions in this food web, we measured uncertainty in node- and network-level quantitative descriptors by generating estimates using kill rates based on upper and lower confidence limits of maximum likelihood-based hare density estimates from the annual census of hare populations (Krebs, 2011). Node- and network-level quantitative descriptors were estimated using the Cheddar package in R (Hudson et al., 2013).
Node-Level Metrics
Cumulative per Capita Daily Kill Rates and Biomass Killed
Cumulative per capita daily kill rates were calculated as the sum of kill rates across all prey for predators and as the sum of kill rates across all predators for prey, where kill rates are expressed as the number of individuals killed per day. Thus, given a predation matrix a with s number of species, where predators are listed in columns (j) and prey are listed in rows (i), cumulative kill rates for each predator and prey are the sum of column j (a⋅j) and the sum or row i (ai⋅), respectively.
To assess the appropriateness of cumulative per capita daily kill rates compared to the cumulative biomass of prey killed as a measure of interaction strength, we converted cumulative per capita daily kill rates to biomass killed by multiplying kill rates by the mean biomass of each respective prey type. Hares have a greater mean mass (i.e., in our study area 1.56 kg; E. Studd, unpubl.) compared to red squirrels (0.250 kg; Boonstra et al., 2001), which we expected would influence interaction strengths. Although we present these results, we chose to base subsequent node- and network-level quantitative descriptors on kill rates (i.e., numbers of prey killed) rather than biomass killed, as this is how functional responses are typically measured due to their link with demographic and hence numerical responses (Holling, 1959; Rosenzweig and MacArthur, 1963).
Vulnerability and Generality
At the node level, vulnerability and generality represent effective numbers of predators for prey and prey for predators, respectively, that are normalized and weighted by interaction strengths. Whereas qualitative measures of vulnerability and generality reflect the number of consumers of prey and prey consumed by predators, quantitative measures account for the diversity of prey kill rates by predators (HN) and of predators’ kills on prey (HP) via the Shannon measure of entropy (or uncertainty) (Shannon, 1948). For each species, k:
where aika and akj, respectively represent the interaction strength of species k with prey i or predator j, and a⋅k and ak⋅ represent the column sum and row sum, respectively, for species k in the predation matrix.
Effective numbers of prey (nN) and predators (nP) are then given by the reciprocals of these diversity indices:
that are then standardized and weighted by the interaction strength to obtain the weighted standardized vulnerability (vk) or generality (gk) for species k:
Network-Level Metrics
Vulnerability and Generality
At the network level, quantitative weighted vulnerability (Vq) and generality (Gq) represent the average number of effective predators and prey, respectively, weighted by the interaction strengths:
where a⋅⋅ is the sum of the predation matrix a. As both Vq and Gq are derived from predation matrix a, any change in interaction strengths affects both Vq and Gq.
Connectance
Connectance measures the average number of links (i.e., link density) per species in the food web. With quantitative data, this can be calculated while accounting for interaction strengths as the average effective number of prey and predators, weighted by the interaction strengths of each species, which yields a weighted link density (LDq):
Dividing the quantitative link density by the number of species thus gives quantitative connectance, Cq:
Results
Best-fit functional response models altered the predicted cumulative per capita kill rates (i.e., interaction strengths) of predators and prey when compared to prey-dependent hyperbolic models, with estimates for red squirrel and lynx being the most impacted (Figure 4). For hares, error bars reflecting the effects of uncertainty in annual hare density estimates on cumulative kill rates generally overlapped for the two types of functional response relationships. An exception to this pattern occurred in 1991 during the transition from peak hare densities to the decline phase, when using a hyperbolic functional response increased estimates of kill rates on hares 1.4-fold compared to the best-fit functional response. In contrast, using a hyperbolic functional response consistently increased cumulative per capita kill rates on red squirrels by lynx and coyotes up to 41-fold and cumulative kill rates of lynx up to 5.3-fold in all years. Both results stem from the inverse best-fit functional response for red squirrels and lynx that is dependent on hare density, which is markedly distinct from the default hyperbolic functional response. The effect of functional response type on the cumulative kill rates of coyotes varied over the cycle, such that a hyperbolic functional response increased estimates (1 to 2.1-fold) during the peak and decline phases but resulted in lower estimates (approximately a 0.6-fold change) during the subsequent low and increase phases, due to the ratio-dependent best-fit functional responses for coyotes with both hares and red squirrels. Kill rates of owls were the same with both approaches owing to the best-fit functional response for hares being a relatively flat hyperbolic relationship, resulting in little annual variation within the range of hare densities observed over the course of the cycle.
FIGURE 4

Cumulative per capita daily kill rates for prey (hare, red squirrel) and predators (lynx, coyote, owl) based on hyperbolic and best-fit functional response models. Cumulative per capita daily kill rates represent the number of individuals killed summed across all types of predators for each prey, and the number of individuals killed summed across all prey types for each predator. Error bars show uncertainty in cumulative per capita kill rates based on upper and lower limits of 95% confidence intervals for hare density estimates. Shading indicates phases of the cycle as defined by hare density. Also note varying y-axis scale for each species.
Adjusting cumulative interaction strengths to account for the biomass of prey consumed altered the magnitudes of these values, as well as the pattern observed across the cycle for lynx (Figure 5). While cumulative interaction strengths based on the number of prey consumed (i.e., per capita kill rates) reached higher values for red squirrels than for hares (Figure 4), these values become higher for hares than for red squirrels once we account for the higher average mass of a hare (approx. 1.56 kg) relative to that of a red squirrel (approx. 0.25 kg). For lynx, patterns observed in the cumulative number of prey killed over the course of the cycle are thus largely driven by kill rates on red squirrels when using a hyperbolic functional response and are relatively lower and appear less variable when using best-fit functional responses (Figure 4 and Supplementary Table 3). In contrast, patterns observed in the cumulative biomass of prey killed by lynx are similar based on the two types of functional responses, with a hyperbolic response consistently yielding higher interaction strength estimates that are between 1.4 to 3.2-fold of those estimated from a best-fit functional response (Figure 5). Differences between patterns in kill rates and biomass killed hence reflect annual variation in the proportion of hares and red squirrels killed by lynx. Overall, patterns in the cumulative biomass killed by lynx follow trends in hare density across the cycle (i.e., biomass killed is highest when hare densities are high and lowest when hare densities are low) using both types of functional responses, due to the large proportion that hare biomass comprises in the lynx diet. For coyotes and owls, patterns in the cumulative biomass killed remained consistent with kill rates, reflecting the relatively small proportion that red squirrels comprise in the diet of coyotes (Supplementary Figure 1), and that hares comprise the only prey of owls captured by our food web.
FIGURE 5
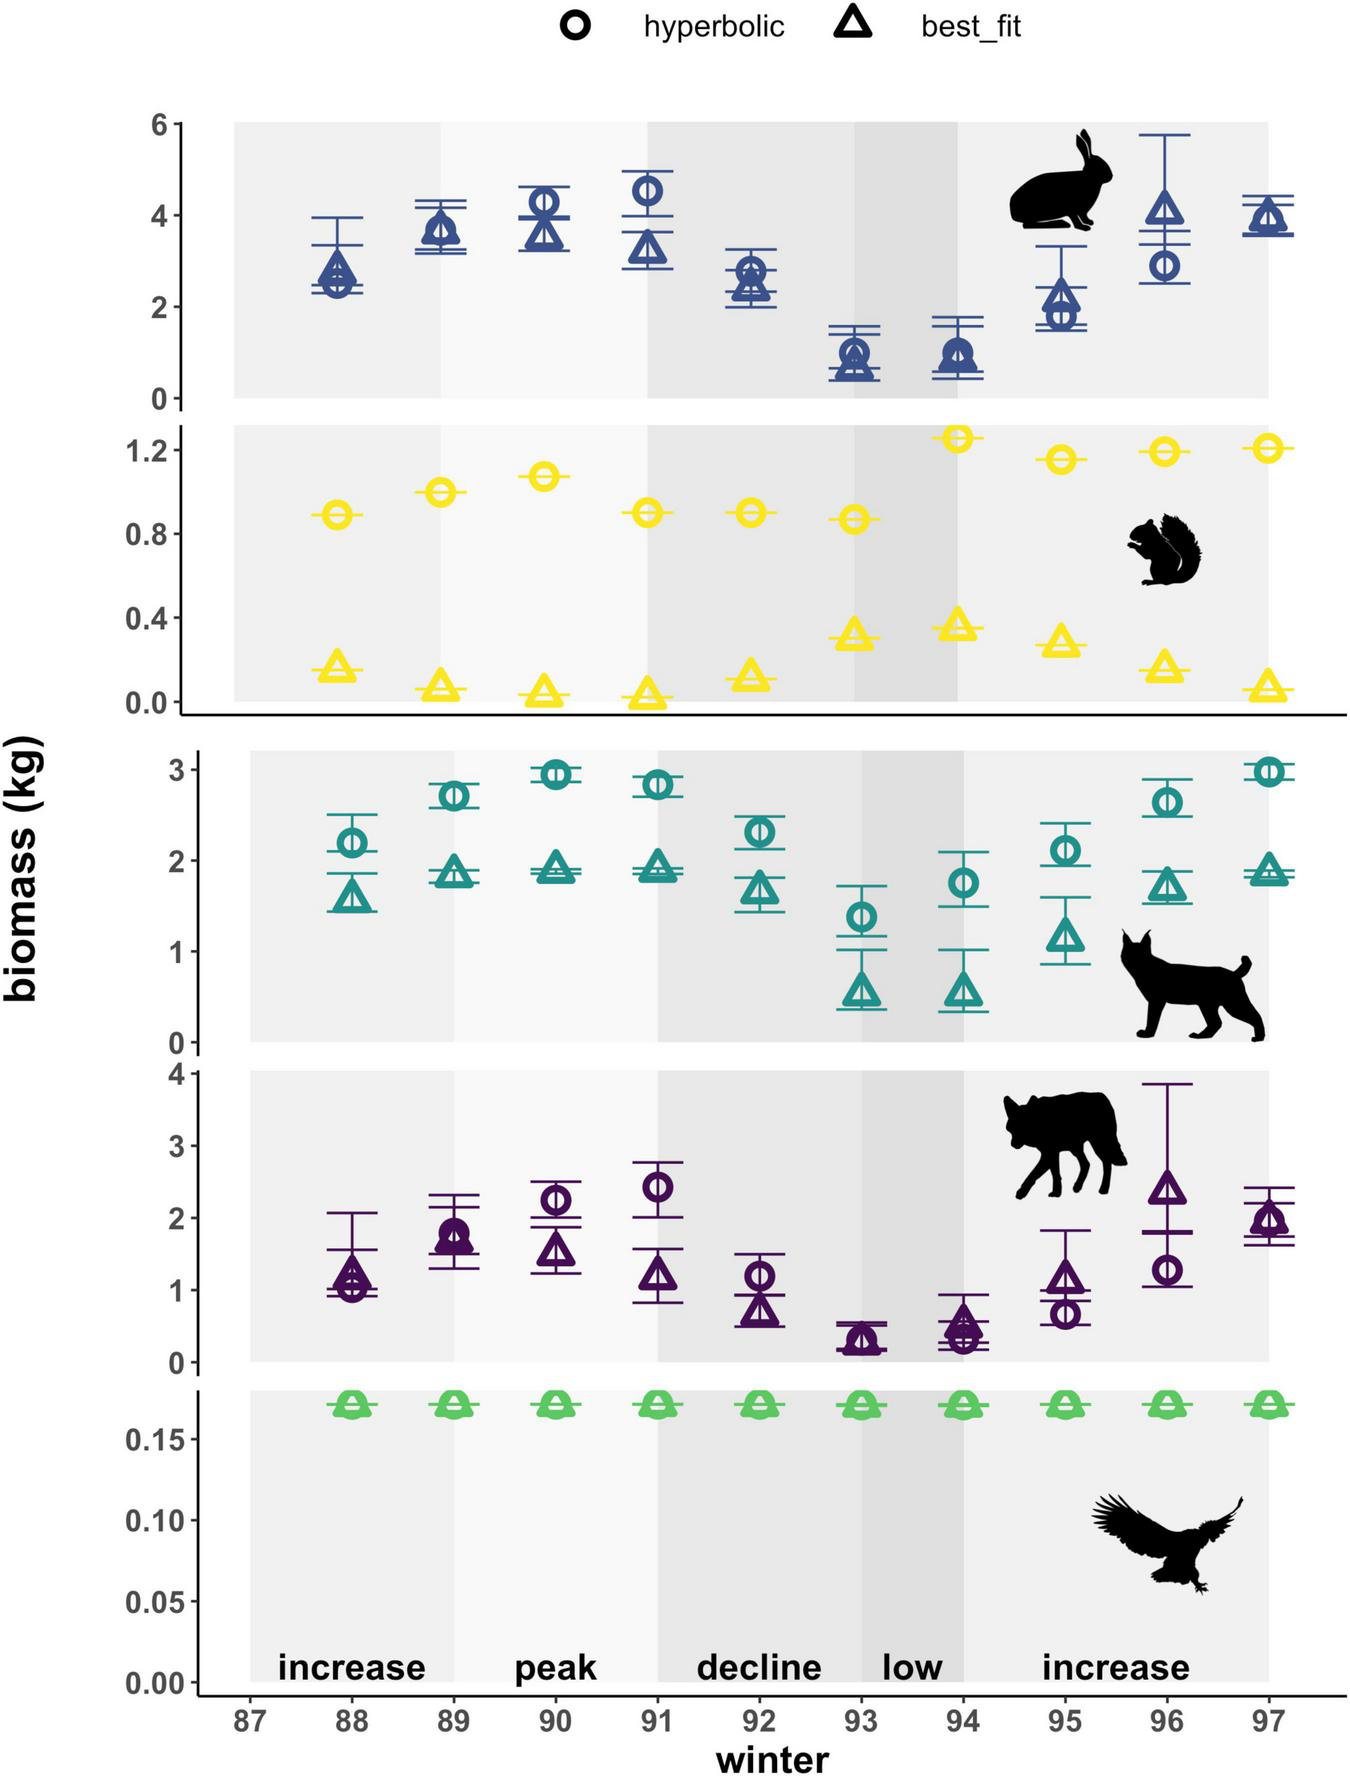
Cumulative biomass of prey killed (hare, red squirrel) by predators (lynx, coyote, owl), based on hyperbolic and best-fit functional response models. Cumulative biomass represents per capita daily kill rates converted to biomass estimates using the mean mass of each prey. Error bars show uncertainty in cumulative biomass killed based on upper and lower limits of 95% confidence intervals for hare density estimates. Shading indicates phases of the cycle as defined by hare density. Also note varying y-axis scale for each species.
Vulnerability at the node level represents the normalized effective number of predators for each prey species, weighted by the interaction strength. The type of functional response used to estimate interaction strengths affected estimates of vulnerability for both prey types in our food web (Figure 6). Patterns in the vulnerability of hares across the cycle for both types of functional responses followed trends in the density of hares. Those based on hyperbolic relationships yielded estimates that were also 0.5-fold lower than best-fit relationships on average, meaning that prey are killed less evenly across all predator species. Vulnerability estimates for red squirrels based on hyperbolic functional responses followed trends in red squirrel densities and increased 1.2 and 10-fold compared to estimates based on best-fit relationships. Vulnerability based on the best-fit relationships followed patterns opposite to hare density in accordance with the inverse best-fit functional response relationship. Best-fit functional responses yielded greater interannual variation compared to hyperbolic relationships for both prey species (Figure 6 and Supplementary Table 3). Comparing between prey species, hyperbolic functional responses generally estimated the vulnerability of red squirrels to be higher than that of hares for most years, especially during the low phase. In contrast, best-fit relationships yielded higher estimates of vulnerability of hares across the cycle, except when hare density was low.
FIGURE 6
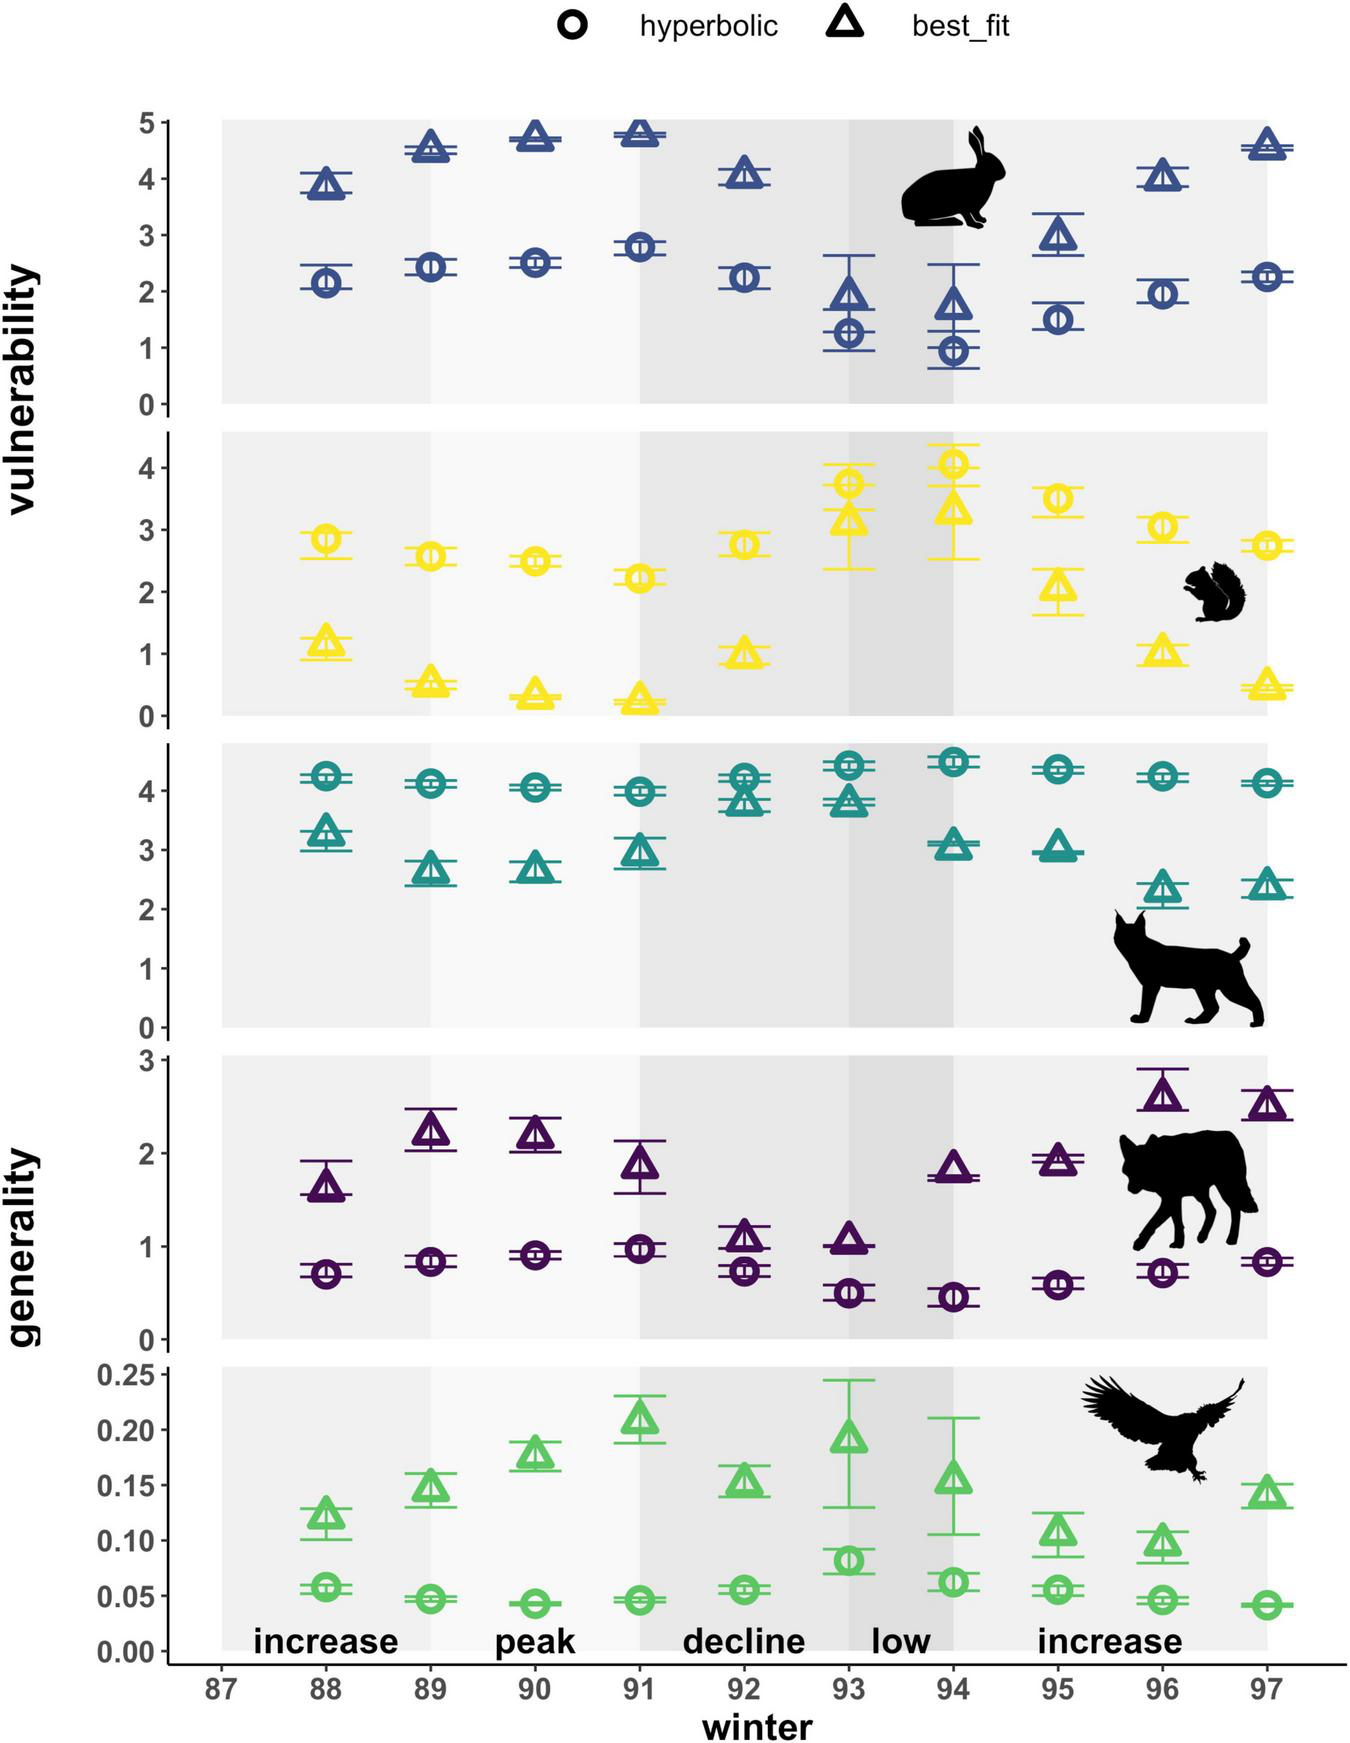
Weighted node-level vulnerability of prey and generality of predators based on hyperbolic and best-fit functional response models. Vulnerability represents effective numbers of predator species that kill each prey, weighted by per capita kill rates on that prey. Generality represents effective numbers of prey species killed by a predator, weighted by the per capita kill rates of that predator. Effective numbers of prey/predators are standardized to yield equivalent numbers of prey/predators per node. Error bars show uncertainty in vulnerability and generality based on upper and lower limits of 95% confidence intervals for hare density estimates. Shading indicates phases of the cycle as defined by hare density. Also note varying y-axis scale for each species.
Generality at the node level represents the normalized effective number of prey for each predator species, weighted by the interaction strength, and was also affected by the type of functional response used for all predators in our food web (Figure 6). Estimates of the generality of lynx increased, 1.1 to 1.8-fold, based on hyperbolic functional responses compared to best-fit relationships (i.e., lynx appear to consume hares and red squirrels more evenly when using a hyperbolic functional response). In contrast, that of coyotes consistently decreased and exhibited a 0.3 to 0.7-fold-change, using hyperbolic functional responses compared to best-fit relationships. The generality of both lynx and coyotes differed most between hyperbolic and best-fit functional responses during the decline phase, when lynx switched prey and consequently increased predation on red squirrels, and coyote kill rates on both hares and red squirrels declined with decreasing ratios of both prey types to coyotes. Hyperbolic functional responses yielded estimates of generality for lynx that were 4.4 to 10-fold that of coyotes across the entire cycle, whereas best-fit relationships led to more similar estimates of generality for the two predators with that of lynx being 1.2 to 3.5-fold that of coyotes in most years and 0.9-fold that of coyotes in 2 years (1996 and 1997). For both predators, generality exhibited greater interannual variation when based on best-fit functional responses (Figure 6 and Supplementary Table 3). Patterns in the generality of lynx and coyotes across the cycle based on best-fit functional responses also exhibited opposing trends, with lynx being most generalized during the decline when coyotes appear to be most specialized. Owls exhibited higher generality based on best-fit functional responses (2 to 4.5-fold) and higher interannual variability in these estimates across the cycle (Figure 6 and Supplementary Table 3). Notably, in absolute terms this difference for owls amounts to an average of less than 0.1 hares per day and arises solely due to the standardization of equivalent numbers of prey, as hares represent the exclusive prey of owls in our food web and this functional response relationship is unchanged in the best-fit scenario. Accordingly, generality for owls is also much lower when compared to lynx and coyotes that kill multiple prey species.
At the network level, weighted vulnerability and generality represent the weighted average of each of these node-level metrics across all prey and predators, respectively. The type of functional response used to estimate interaction strengths also affected the magnitudes and patterns of both of these network-level metrics (Figure 7). Hyperbolic functional responses yielded lower network-level vulnerability estimates for prey that were on average 0.7-fold that of those based on best-fit relationships. These differences arise directly from the effects of the type of functional response used on the node-level vulnerability estimates of hares and red squirrels (Figure 6). Patterns in network-level vulnerability across the cycle, based on hyperbolic functional responses, correlated with trends in hare densities; those based on best-fit functional responses yielded a similar pattern but exhibited more variation across years (Figure 7 and Supplementary Table 4). Network-level generality of predators based on hyperbolic and best-fit functional responses both averaged 1.5 effective prey across all years but differed in terms of interannual variation and in their patterns across the cycle (Figure 7 and Supplementary Table 4). Trends in network-level generality based on hyperbolic functional responses followed trends in hare density, whereas those based on best-fit relationships exhibited slightly more variation, with the highest values of generality occurring during transitional phases (i.e., increase and decline) and lower values during the peak and low phases.
FIGURE 7
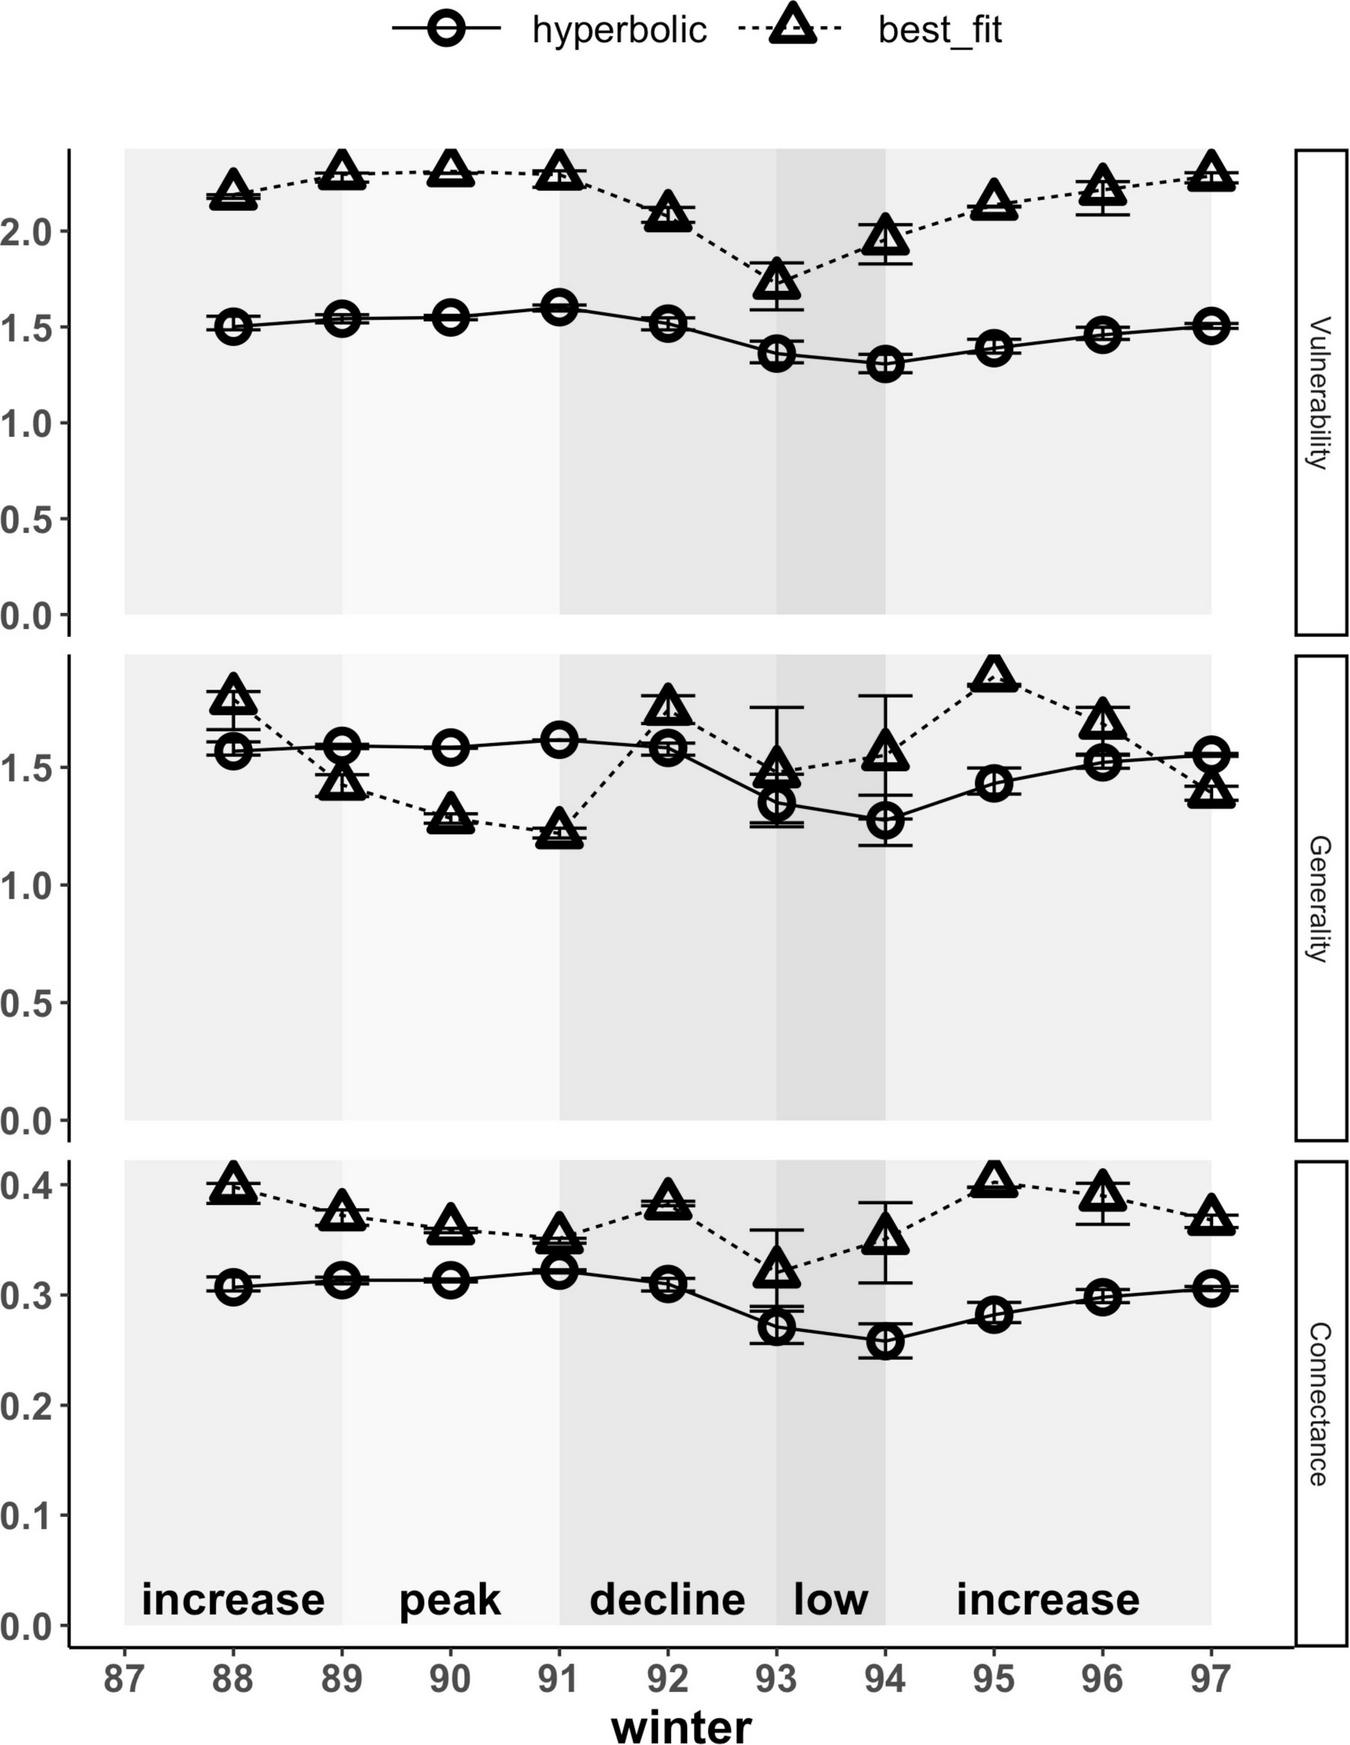
Weighted network-level metrics (vulnerability, generality and connectance) based on hyperbolic and best-fit functional response models. At the network level, vulnerability and generality represent the averages of node-level estimates across all prey and predators, respectively, weighted by per capita kill rates. Connectance reflects the diversity of kill rates across the network and is similarly weighted by per capita kill rates; higher values indicate a more even distribution of kill rates across prey and predators in the food web. Error bars show uncertainty in network-level metrics based on upper and lower limits of 95% confidence intervals for hare density estimates. Shading indicates phases of the cycle as defined by hare density.
Network-level weighted connectance reflects the diversity of kill rates (i.e., how uniformly distributed these are) across the food web, weighted by the interaction strengths. Both magnitudes and patterns of connectance across our food web were affected by the type of functional response used to estimate interaction strengths. Hyperbolic functional responses yielded lower estimates that were 0.7 to 0.9-fold of those estimated using best-fit relationships, thus yielding a less connected network across the entire cycle (Figure 7). Patterns in connectance based on hyperbolic functional responses followed trends in hare density, with estimates being highest during the peak phase, lowest during the low phase, and transitioning during increase and decline phases. Connectance patterns based on best-fit relationships differed, with estimates being higher during transitional periods (i.e., increase and decline phases) and lower during the peak and low phases, hence reflecting that kill rates are most uniformly distributed across the food web at intermediate hare densities when transitioning between peak and low phases. For all network-level metrics (i.e., connectance, vulnerability, and generality), weighting of metrics by the interaction strengths increased, but was never solely responsible for differences observed between hyperbolic and best-fit functional responses (Supplementary Figure 2).
Discussion
Interaction strengths estimated using best-fit functional response relationships, rather than exclusively prey-dependent hyperbolic functional responses, affected estimates of quantitative descriptors for our simplified Kluane system food web. These effects extended to both node- and network-level descriptors, influencing the absolute values of these estimates as well as variability and patterns in these metrics over time. Hyperbolic functional responses overestimated the importance of red squirrels as a prey source, particularly for lynx, thus underestimating that of hares. While this led to lynx appearing more generalized in their feeding patterns, a hyperbolic functional response resulted in coyotes appearing less generalized than when using the best-fit functional response. The effects of hyperbolic functional responses on interaction strengths were carried up to the network level, such that vulnerability of prey, generality of predators, and connectivity across the community tended to correlate directly with hare density across the cycle. In contrast, best-fit functional response relationships that have the potential to capture processes such as prey-switching, surplus killing and caching, and predator interference, revealed that across the community, vulnerability of prey is lowest going from the decline phase into the low, and the generality of predators and connectivity across the community is highest during transitional phases. To our knowledge, this is the first study to demonstrate the sensitivity of food web model predictions to the form of functional response used in a natural system. Even for a simplified boreal forest food web in the Yukon that is relatively less complex than many other ecosystems, this has notable implications for the conclusions we draw about food webs and communities under study. These impacts thus demonstrate the importance of the type of functional response model used and the need to employ appropriate models that capture relevant ecological processes when modeling food webs.
It is widely recognized that various ecological processes can yield functional response relationships that vary in their shape (Holling, 1959; Jeschke et al., 2004; Hossie and Murray, 2010) or that depend on variables other than the density of the focal prey (e.g., ratio-dependence—Arditi and Ginzburg, 1989; predator dependence—Skalski and Gilliam, 2001; Novak and Stouffer, 2021; spatial arrangement of predators and prey —Cosner et al., 1999; Hossie and Murray, 2016; Fall et al., 2021; alternative prey—Smout et al., 2010; body size—Kalinkat et al., 2013; Weterings et al., 2015; temperature and acclimation—Sentis et al., 2015; Uiterwaal and DeLong, 2020; habitat complexity—Gorini et al., 2012; Mocq et al., 2021). In fact, the most recent literature largely regards consumer dependence as being common (Barbier et al., 2021; Novak and Stouffer, 2021). Despite this, prey-dependent hyperbolic functional responses remain the most frequently used (Jeschke et al., 2004; Novak et al., 2017), often without further assessment of whether they are the most appropriate model for a given predator-prey interaction beyond potentially distinguishing between linear, hyperbolic and sigmoidal types (Okuyama, 2013). For natural systems, the lack of further consideration of various other types of functional response models likely stems in part from the significant challenges associated with characterizing these relationships in natural environments (Abrams and Ginzburg, 2000). Observing predation events directly or gathering evidence to estimate kill rates in nature can be both difficult (Petroelje et al., 2020) and costly, or in some cases simply not possible. Reliable density estimates may also be unavailable for all predators and prey. These challenges may apply particularly to rare or cryptic species (Zimmerman et al., 2007; Doran-Myers et al., 2021). For organisms that can be manipulated in laboratory or microcosm settings, functional response relationships are thus often assessed using controlled experiments in which kill rates are measured over a range of prey densities (Abrams and Ginzburg, 2000). However, this approach greatly limits our ability to capture ecological processes occurring in complex natural systems comprising numerous trophic levels, where predators feed on multiple prey types and the rate at which prey are killed is constrained by numerous factors beyond the density of that individual prey species (Abrams and Ginzburg, 2000). Furthermore, these implications are expected to vary depending on the type of functional response relationships that best represent predator-prey interactions within a given community. For example, the largest differences found in our study were driven primarily by the inverse best-fit relationship between lynx and their alternate prey, red squirrels.
Our results also highlight the need to consider variation in community interactions over time and the impact that the type of functional response can have when examining interactions over both long and short time periods. Over the course of the 10-year hare cycle, we observed considerable variation in both node- and network-level quantitative descriptors, especially given the limited number of nodes and trophic links in our simplified food web and that both remained consistent in number across the time series. Importantly, estimating interaction strengths with prey-dependent hyperbolic functional responses altered conclusions about how community interactions varied over the cycle. While the Kluane system is characterized by substantial variation in the densities of hares and their predators (Hodges et al., 2001; O’Donoghue et al., 2001; Rohner et al., 2001), analogous non-cyclic systems also experience annual variation in environmental conditions, population densities, and community interactions (Murray, 2000) and these are unlikely to be captured by functional response relationships modeled over relatively short time periods. The data used to fit functional response models are often overdispersed (Trexler et al., 1988; Barraquand and Gimenez, 2021) and therefore, the amount of data available, especially at kill rates that are distinct for a particular functional response type, can further limit our ability to determine the most appropriate type of response (Marshal and Boutin, 1999). In an extensive review of published functional response data sets, Novak and Stouffer (2021) revealed widespread systematic bias in functional response model comparisons and parameter estimation due specifically to small sample sizes. Field data sets with kill rate and density estimates for predators and prey spanning a decade or more, like in the current study, are exceedingly rare (but see—Korpimäki and Norrdahl, 1991; Korpimäki, 1993; Hanski and Korpimäki, 1995; Beardsell et al., 2021; Costán and Sarasola, 2021; Fall et al., 2021) and thus studies with increased sample sizes are needed (Novak and Stouffer, 2021). Community interactions can also vary seasonally within a given year (Humphries et al., 2017; Sato et al., 2021), which can be difficult to capture (Merrill et al., 2010). Even with a decade of predator-prey data from the Kluane study, both Chan et al. (2017) and Rohner et al. (2001) upon which the current study is based, were similarly limited to fitting functional response models to relatively few datapoints and data were not available during summer months owing to the reliance of these estimates on snow tracking data. Improving functional response models for natural systems will therefore require novel approaches that can be implemented over long time periods and/or across different seasons to assess both inter- and intra-annual variability in predator-prey interactions. We may now be able to obtain replicate estimates from data sets that historically would have yielded a single data point; for example, in the Kluane study by using distinct tracking events as the unit of measure. Similarly, with GPS telemetry and accelerometry, it is now possible to obtain individualized kill rates that should help to address issues related to sample size in functional response estimation (Studd et al., 2021).
For the Kluane system, trends in node and network level metrics based on best-fit functional responses align with what is currently known about interactions in this community. We expect the vulnerability of hares, a keystone species (Boutin et al., 1995; Krebs, 2011), to be greater than that of red squirrels, the latter of which is largely considered an alternate prey source for lynx and coyotes (O’Donoghue et al., 1998b; Chan et al., 2017) and not consumed by owls (Supplementary Figure 1). Given how central hares are in this food web, it is also not surprising that weighted vulnerability at the network level would largely mirror that of hares (Figures 6, 7). For lynx that are known to demonstrate prey-switching (O’Donoghue et al. 1998, 2001), we might also expect kills to be more focused on hares during the peak phase and red squirrels during the low phase but distributed more evenly between hares and red squirrels during the increase and decline phases when lynx can transition from one prey to the other. This was reflected by trends in the generality of lynx that tended to decrease during the peak and the low phases and increase during transitional phases when we used best-fit functional response relationships that could account for prey switching. Notably, the generality of coyotes was consistently less than that of lynx based on best-fit relationships, suggesting that this predator may be more specialized and rely mainly on hares except when hare densities are especially low (Supplementary Figure 1), as previously suggested by O’Donoghue et al. (1998a). Accounting for ecological processes by using best-fit relationships also yielded higher estimates of connectance across the entire cycle compared to hyperbolic functional responses, particularly during transitional phases when kill rates would be distributed more evenly between hares and red squirrels, as was similarly reflected by trends in the generality of predators. Previous studies have demonstrated the role of the functional response in connectance-stability relationships (Nunney, 1980; Kondoh, 2003; Rall et al., 2008; Kawatsu and Kondoh, 2018). Sigmoidal functional responses (Murdoch, 1969; Nunney, 1980; van Baalen et al., 2001; Rall et al., 2008), predator interference (Rogers and Hassell, 1974; Ruxton et al., 1992; Rall et al., 2008), and adaptive foraging strategies (Kondoh, 2003) have been found to yield positive relationships between connectance and stability. Kawatsu and Kondoh (2018) further showed variation in both the functional response and types of species interactions (i.e., beneficial or harmful) to be synergistically stabilizing. Consequently, functional responses and the variation observed in these relationships may also play an important role in the connectivity of the system, which could have further implications for stability and how it might vary across the cycle.
We chose to measure interaction strengths as kill rates representing the number of prey killed, rather than the biomass of prey killed, owing to the connections among functional, demographic and numerical responses. Functional responses have conventionally focused on kill rates (Holling, 1959) in part due to the central role that kill rates play in predator-prey dynamics; kill rates determine rates of change in predator density as well as the predation rate that influences prey density (Holling, 1959; Rosenzweig and MacArthur, 1963; but see Vucetich et al., 2011). Converting cumulative kill rates (Figure 4) to cumulative biomass killed (Figure 5) altered the magnitude of interaction strengths and the pattern observed over the cycle for lynx. The way interaction strengths are measured could therefore affect trends observed in node- and network-level metrics, as well as how these might differ based on the type of functional response used. Such effects would occur by altering estimates of effective numbers of prey and predators and/or the weighting of vulnerability, generality, and connectance. Note that we were unable to account for variation in the biomass of prey over the cycle when converting kill rates to biomass killed. However, variation in hare biomass is expected to be considerably less compared to differences owing to prey type and hence any effect of this would likely be small. When interpreting network quantitative descriptors, it is important to do so in the context of how interaction strengths are measured. For this system, we opted to use kill rates reflecting numbers of individuals, which are thought to be most relevant to dynamics in this community. However, biomass would be a more appropriate measure of interaction strengths when examining the flow of energy across a food web (Bersier et al., 2002), or when dynamics are linked to biomass (e.g., aquatic systems—Welch et al., 1992; Walters et al., 1997; fisheries—Walters and Martell, 2004).
Our findings highlight the importance of employing an appropriate type of functional response model, encompassing the relevant ecological processes that occur in complex, natural systems; not doing so has the potential to affect our understanding of community interactions and dynamics. New and emerging research focusing on functional responses continue to reveal complexities in these relationships and their roles at broader ecological scales that are not accounted for by traditional models (e.g., Sentis et al., 2015; Preston et al., 2018; Barbier et al., 2021; Beardsell et al., 2021). This growing body of literature calls for an increased need to move toward functional response models that are mechanistic (Sentis and Boukal, 2018; Beardsell et al., 2021) and that account for predator dependence (Coblentz and DeLong, 2021), among other ecological processes that influence the functional response (e.g., Uiterwaal and DeLong, 2020; Mocq et al., 2021). Such shifts are consistent with the structure of the functional response models first offered by Holling (1959) and that have inspired subsequent decades of predator-prey research. It is notable that while several recent studies provide guidance to improve the design and analysis of functional response experiments (Zhang et al., 2018; Moffat et al., 2020; Uszko et al., 2020; Coblentz and DeLong, 2021), novel approaches and models are still needed to better characterize these relationships in natural systems and to capture variation in them occurring across various temporal, spatial, and ecological scales (Novak et al., 2017; Barbier et al., 2021). Technological advances such as camera-traps, biotelemetry and biologgers, and genetic and genomic methods are greatly improving our ability to estimate densities of various predators and prey (Bravington et al., 2016; Ruzzante et al., 2019; Green et al., 2020; Ruprecht et al., 2021), diets (Galan et al., 2018), and kill rates (Merrill et al., 2010; Hubel et al., 2016; Brockman et al., 2017; Wilmers et al., 2017; Studd et al., 2021), while collecting ancillary data from natural systems (Wilmers et al., 2015; Tosa et al., 2021). Such tools and approaches will be essential to furthering our understanding of functional responses and their role in community and ecosystem dynamics.
Publisher’s Note
All claims expressed in this article are solely those of the authors and do not necessarily represent those of their affiliated organizations, or those of the publisher, the editors and the reviewers. Any product that may be evaluated in this article, or claim that may be made by its manufacturer, is not guaranteed or endorsed by the publisher.
Statements
Data availability statement
The original contributions presented in the study are included in the article/Supplementary Material, further inquiries can be directed to the corresponding author/s.
Author contributions
JG, TH, RD, SS, TC, LS, NK, AS, KT, GS, CS, FQ, JR, HM, HF, OL, CD, JD, and DM contributed to the study conception. JG completed the analysis. JG and TH developed the figures and tables with input from RD, SS, TC, LS, NK, AS, KT, GS, CS, FQ, JR, HM, HF, OL, CD, JM, and DM. JG wrote the initial draft of the manuscript with contributions from TH, RD, SS, TC, LS, NK, AS, KT, GS, CS, FQ, JR, HM, HF, OL, CD, JM, and DM. SB, RB, MO’D, and CK provided input on the study and draft manuscript. All authors contributed to the article and approved the submission.
Funding
This research was funded by a Collaborative Special Projects grant from the Natural Sciences and Engineering Research Council of Canada (NSERC) and the writeup was supported by the Canada Research Chairs Program.
Acknowledgments
We are grateful to the many field technicians who helped collect the data used in this study.
Conflict of interest
The authors declare that the research was conducted in the absence of any commercial or financial relationships that could be construed as a potential conflict of interest.
Supplementary material
The Supplementary Material for this article can be found online at: https://www.frontiersin.org/articles/10.3389/fevo.2022.898805/full#supplementary-material
References
1
AbramsP. A. (1997). Evolutionary responses to foraging-related traits in unstable predator-prey systems.Evol. Ecol.11673–686. 10.1023/a:1018482218068
2
AbramsP. A.AllisonT. D. (1982). Complexity, stability, and functional response.Am. Nat.119240–249. 10.1086/283905
3
AbramsP. A.GinzburgL. R. (2000). The nature of predation: prey dependent, ratio dependent or neither?Trends Ecol. Evol.15337–341. 10.1016/s0169-5347(00)01908-x
4
AldebertC.StoufferD. B. (2018). Community dynamics and sensitivity to model structure: towards a probabilistic view of process-based model predictions.J. R. Soc. Interface15:20180741. 10.1098/rsif.2018.0741
5
ArditiR.GinzburgL. R. (1989). Coupling in predator-prey dynamics: ratio-dependence.J. Theor. Biol.139311–326. 10.1016/s0022-5193(89)80211-5
6
ArjaldiV.PittavinoM.VenturinoE. (2011). Modeling herd behavior in population systems.Nonlinear Anal. Real World Appl.122319–2338. 10.1016/j.nonrwa.2011.02.002
7
BarbierM.WojcikL.LoreauM. (2021). A macro-ecological approach to predation density-dependence.Oikos130553–570. 10.1111/oik.08043
8
BarraquandF.GimenezO. (2021). Fitting stochastic predator-prey models using both population density and kill rate data.Theor. Popul. Biol.1381–27. 10.1016/j.tpb.2021.01.003
9
BeardsellA.GravelD.BerteauxD.GauthierG.ClermontJ.CareauV.et al (2021). Derivation of predator functional responses using a mechanistic approach in a natural system.Front. Ecol. Evol.9:630944. 10.3389/fevo.2021.630944
10
BentoutS.DjilaliS.KumarS. (2021). Mathematical analysis of the influence of prey escaping from prey herd on three species fractional predator-prey interaction model.Physica A572:125840. 10.1016/j.physa.2021.125840
11
BerecL. (2010). Impacts of foraging facilitation among predators on predator-prey dynamics.B. Math. Biol.7294–121. 10.1007/s11538-009-9439-1
12
BerlowE. L.NeutelA.-M.CohenJ. E.De RuiterP. C.EbenmamB.EmmersonM.et al (2004). Interaction strengths in food webs: issues and opportunities.J. Anim. Ecol.75585–598. 10.1111/j.0021-8790.2004.00833.x
13
BersierL.-F.Banašek-RichterC.CattinM.-F. (2002). Descriptors of food-web matrices.Ecology832394–2407. 10.1111/j.1365-2656.2009.01588.x
14
BoonstraR.BoutinS.ByromA.KarelsT.HubbsA.Stuart-SmithK.et al (2001). “The Role of Red Squirrels and Arctic Ground Squirrels,” in Ecosystem Dynamics of the Boreal Forest: The Kluane Project, edsKrebsC. J.BoutinS.BoonstraR. (New York: Oxford University Press), 179–214.
15
BorchersD. L.EffordM. G. (2008). Spatially explicit maximum likelihood methods for capture-recapture studies.Biometrics64377–385. 10.1111/j.1541-0420.2007.00927.x
16
BoutinS.KrebsC. J.BoonstraR.DaleM. R. T.HannonS. J.MartinK. (1995). Population changes of the vertebrate community during a snowshoe hare cycle in Canada’s boreal forest.Oikos7469–80. 10.2307/3545676
17
BravingtonM. V.GreweP. M.DaviesC. R. (2016). Absolute abundance of southern bluefin tuna estimated by close-kin mark-recapture.Nat. Commun.7:13162. 10.1038/ncomms13162
18
BrockmanC. J.CollinsW. B.WelkerJ. M.SpalingerD. E.DaleB. W. (2017). Determining kill rates of ungulate calves by brown bears using neck-mounted cameras.Wildl. Soc. B.4188–97. 10.1002/wsb.733
19
ChanK.BoutinS.HossieT. J.KrebsC. J.O’DonoghueM.MurrayD. L. (2017). Improving the assessment of predator functional responses by considering alternate prey and predator interactions.Ecology981787–1796. 10.1002/ecy.1828
20
CoblentzK. E.DeLongJ. P. (2021). Estimating predator functional responses using the times between prey captures.Ecology102:e03307. 10.1002/ecy.3307
21
CosnerC.DeAngelisD. L.AultJ. S.OlsonD. B. (1999). Effects of spatial grouping on the functional response of predators.Theor. Popul. Biol.5665–75. 10.1006/tpbi.1999.1414
22
CostánA.SarasolaJ. H. (2021). Raptors, doves and fragmented landscapes: overabundance of native birds elicit numerical and functional responses of avian top predators.Food Webs26:e00184. 10.1016/j.fooweb.2020.e00184
23
Doran-MyersD.KenneyA.KrebsC.LambC. T.MenziesA.MurrayD. L.et al (2021). Density estimates for Canada lynx vary among estimation methods.Ecosphere12:e03774. 10.1002/ecs2.3774
24
DrosselB.McKaneA. J.QuinceC. (2004). The impact of nonlinear functional responses on the long-term evolution of food web structure.J. Theor. Biol.229539–548. 10.1016/j.jtbi.2004.04.033
25
EffordM. G. (2009). DENSITY 4.4: Software for Spatially Explicit Capture-Recapture.New Zealand: Department of Zoology.
26
FallJ.JohannesenE.EnflundG.JohansenG. O.FiksenØ (2021). Predator-prey overlap in three dimensions: cod benefit from capelin coming near the seafloor.Ecography44802–815. 10.1111/ecog.05473
27
FryxellJ. M.MosserA.SinclairA. E. R.PackerC. (2007). Group formation stabilizes predator-prey dynamics. Nature449, 1041–1043. 10.1038/nature06177
28
GalanM.PonsJ.-B.TournayreO.PierreÉLeuchtmannM.PontierD.et al (2018). Metabarcoding for the parallel identification of several hundred predators and their prey: application to bat species diet analysis.Mol. Ecol. Resour.18474–489. 10.1111/1755-0998.12749
29
GoriniL.LinnelJ. D. C.MayR.PanzacchiM.BoitaniL.OddenM.et al (2012). Habitat heterogeneity and mammalian predator-prey interactions.Mammal. Rev.4255–77. 10.1111/j.1365-2907.2011.00189.x
30
GreenA. M.ChynowethM. W.ŞekercioğluÇH. (2020). Spatially explicit capture-recapture through camera trapping: a review of benchmark analyses for wildlife density estimation.Front. Ecol. Evol.8:563477. 10.3389/fevo.2020.563477
31
HanskiI.KorpimäkiE. (1995). Microtine rodent dynamics in northern Europe: parameterized models for the predator-prey interaction.Ecology76840–850. 10.1016/j.mbs.2009.06.004
32
HodgesK. E.KrebsC. J.HikD. S.StefanC. I.GillisE. A.DoyleC. E. (2001). “Snowshoe Hare Demography,” in Ecosystem Dynamics of the Boreal Forest: The Kluane Project, edsKrebsC. J.BoutinS.BoonstraR. (New York, NY: Oxford University Press), 142–178.
33
HollingC. S. (1959). The components of predation as revealed by a study of small-mammal predation of the European pine sawfly.Can. Ent.91293–320. 10.4039/ent91293-5
34
HoltR. D. (2002). Food webs in space: on the interplay of dynamic instability and spatial processes.Ecol. Res.17262–273.
35
HossieT. J.MurrayD. L. (2010). You can’t run but you can hide: refuge use in frog tadpoles elicits density-dependent predation by dragonfly larvae.Oecologia163395–404. 10.1007/s00442-010-1568-6
36
HossieT. J.MurrayD. L. (2016). Spatial arrangement of prey affects the shape of ratio-dependent functional response in strongly antagonistic predators.Ecology97834–841. 10.1890/15-1535.1
37
HubelT. Y.MyattJ. P.JordanN. R.DewhirstO. P.McNuttJ. W.WilsonA. M. (2016). Additive opportunistic capture explains group hunting benefits in African wild dogs.Nat. Commun.7:11033. 10.1038/ncomms11033
38
HudsonL. N.EmersonR.JenkinsG. B.LayerK.LedgerM. E.PichlerD. E.et al (2013). Cheddar: analysis and visualization of ecological communities in R.Methods Ecol. Evol.499–104. 10.1111/2041-210x.12005
39
HumphriesM. M.StuddE. K.MenziesA. K.BoutinS. (2017). To everything there is a season: summer-to-winter food webs and the functional traits of keystone species.Integr. Comp. Biol.57961–976. 10.1093/icb/icx119
40
JeschkeJ. M.KoppM.TollrianR. (2002). Predator functional responses: discriminating between handling and digesting prey.Ecol. Monogr.7295–112. 10.1890/0012-9615(2002)072[0095:pfrdbh]2.0.co;2
41
JeschkeJ. M.KoppM.TollrianR. (2004). Consumer-food systems: why type I functional responses are exclusive to filter feeders.Biol. Rev. Camb. Philos. Soc.79337–349. 10.1017/s1464793103006286
42
JonesL. E.EllnerS. P. (2007). Effects of rapid prey evolution on predator-prey cycles.J. Math. Biol.55541–573. 10.1007/s00285-007-0094-6
43
KalinkatG.SchneiderF. D.DigelC.GuillC.RallB. C.BroseU. (2013). Body masses, functional responses and predator-prey stability.Ecol. Lett.161126–1134. 10.1111/ele.12147
44
KawatsuK.KondohM. (2018). Density-dependent interspecific interactions and the complexity-stability relationship.Proc. R. Soc. B285:20180698. 10.1098/rspb.2018.0698
45
KondohM. (2003). Foraging adaptation and the relationship between food-web complexity and stability.Science2991388–1391. 10.1126/science.1079154
46
KorpimäkiE. (1993). Regulation of multiannual vole cycles by density-dependent avian and mammalian predation?Oikos66359–363. 10.2307/3544826
47
KorpimäkiE.NorrdahlK. (1991). Numerical and functional responses of kestrels, short-eared owls, and long-eared owls to vole densities.Ecology72814–826. 10.2307/1940584
48
KrebsC. J. (2011). Of lemmings and snowshoe hares: the ecology of northern Canada.Proc. R. Soc. B278481–489. 10.1098/rspb.2010.1992
49
KrebsC. J.BoonstraR.BoutinS. (2017). Using experimentation to understand the 10-year snowshoe hare cycle in the boreal forest of North America.J. Anim. Ecol.8787–100. 10.1111/1365-2656.12720
50
KrebsC. J.BoutinS.BoonstraR. (eds) (2001). Ecosystem Dynamics of the Boreal Forest: The Kluane Project.New York, NY: Oxford University Press.
51
MarshalJ. P.BoutinS. (1999). Power analysis of wolf-moose functional responses.J. Wildl. Manage.63396–402. 10.2307/3802525
52
McLellanB. N.SerrouyaR.WitmerH. U.BoutinS. (2010). Predator-mediated allee effects in multi-prey systems.Ecology91286–292. 10.1890/09-0286.1
53
McPheeH. M.WebbN. F.MerrillE. H. (2012). Time-to-kill: measuring attach rates in a heterogeneous landscape with multiple prey types.Oikos121711–720. 10.1111/j.1600-0706.2011.20203.x
54
MerrillE.SandH.ZimmermannB.McPheeH.WebbN.HebblewhiteM.et al (2010). Phil.Trans. R. Soc. B3652279–2288.
55
MocqJ.SoukupP. R.NäslundJ.BoukalD. S. (2021). Disentangling the nonlinear effects of habitat complexity on functional responses.J. Anim. Ecol.901525–1537. 10.1111/1365-2656.13473
56
MoffatH.HainyM.PapanikolaouN. E.DrovandiC. (2020). Sequential experimental design for predator-prey functional response experiments.J. R. Soc. Interface17:20200156. 10.1098/rsif.2020.0156
57
MorozovA.PetrovskiiS. (2013). Feeding on multiple sources: towards a universal parameterization of the functional response of a generalist predator allowing for switching.PLoS One8:e74586. 10.1371/journal.pone.0074586
58
MurdochW. W. (1969). Switching in general predators: experiments on predator specificity and stability of prey populations.Ecol. Monogr.39335–354. 10.2307/1942352
59
MurrayD. L. (2000). A geographic analysis of snowshoe hare population demography.Can. J. Zool.781207–1217. 10.1139/z00-025
60
NovakM.StoufferD. B. (2021). Systematic bias in studies of consumer functional responses.Ecol. Lett.24580–593. 10.1111/ele.13660
61
NovakM.WolfC.CoblentzK. E.ShepardI. D. (2017). Quantifying predator dependence in the functional response of generalist predators.Ecol. Lett.20761–769. 10.1111/ele.12777
62
NunneyL. (1980). The stability of complex model ecosystems.Am. Nat.115639–649. 10.1086/283589
63
OatenA.MurdochW. W. (1975). Functional response and stability in predator-prey systems.Am. Nat.109289–298. 10.1086/282998
64
O’DonoghueM.BoutinS.KrebsC. J.HoferE. J. (1997). Numerical responses of coyotes and lynx to the snowshoe hare cycle.Oikos80150–162. 10.2307/3546526
65
O’DonoghueM.BoutinS.KrebsC. J.MurrayD. L.HoferE. J. (1998a). Behavioural responses of coyotes and lynx to the snowshoe hare cycle.Oikos82169–183. 10.2307/3546927
66
O’DonoghueM.BoutinS.KrebsC. J.ZuletaG.MurrayD. L.HoferE. J. (1998b). Functional responses of coyotes and lynx to the snowshoe hare cycle.Ecology791193–1208. 10.2307/176736
67
O’DonoghueM.BoutinS.MurrayD. L.KrebsC. J.HoferE. J.BreittenmoserU.et al (2001). “Coyotes and Lynx,” in Ecosystem Dynamics of the Boreal Forest: The Kluane Project, edsKrebsC. J.BoutinS.BoonstraR. (New York, NY: Oxford University Press), 275–323.
68
OkuyamaT. (2012). Flexible components of functional responses.J. Anim. Ecol.81185–189. 10.1111/j.1365-2656.2011.01876.x
69
OkuyamaT. (2013). On selection of functional response models: holling’s models and more.BioControl58293–298. 10.1007/s10526-012-9492-9
70
OliM. K.KrebsC. J.KenneyA. J.BoonstraR.BoutinS.HinesJ. E. (2020). Demography of snowshoe hare population cycles.Ecology101:e02969. 10.1002/ecy.2969
71
OtisD lBurnhamK. P.WhiteG. C.AndersonD. R. (1978). Statistical inference from capture data on closed animal populations.Wildl. Monogr.623–135.
72
PetroeljeT. R.BelantJ. L.SvobodaN. J. (2020). Identification of carnivore kill sites is improved by verified accelerometer data.Anim. Biotelemetry8:18.
73
PettorelliN.HillbornA.DuncanC.DurantS. M. (2015). Individual variability: the missing component to our understanding of predator-prey interactions.Adv. Ecol. Res.5219–44.
74
PrestonD. L.HendersonJ. S.FalkeL. P.SeguiL. M.LaydenT. J.NovakM. (2018). What drives interaction strengths in complex food webs? A test with feeding rates of a generalist stream predator.Ecology991591–1601. 10.1002/ecy.2387
75
RallC. B.GuillC.BroseU. (2008). Food-web connectance and predator interference dampenthe paradox of enrichment.Oikos117202–213. 10.1111/j.2007.0030-1299.15491.x
76
RogersD. J.HassellM. P. (1974). General models for insect parasite and predator searching behaviour: interference.J. Anim. Ecol.43239–253. 10.1046/j.1420-9101.2003.00585.x
77
RohnerC. (1997). Non-territorial ‘floaters’ in great horned owls: space use during a cyclic peak of snowshoe hares.Anim. Behav.53901–912. 10.1006/anbe.1996.0381
78
RohnerC.DoyleF. I.SmithJ. N. M. (2001). “Great Horned Owls,” in Ecosystem Dynamics of the Boreal Forest: The Kluane Project, edsKrebsC. J.BoutinS.BoonstraR. (New York,NY: Oxford University Press), 339–376.
79
RosenzweigM. L.MacArthurR. H. (1963). Graphical representation and stability conditions of predator-prey interactions.Am. Nat.895209–223. 10.1086/282272
80
RuprechtJ. S.ErikssonC. E.ForresterT. D.ClarkD. A.WisonM. J.RowlandM. M.et al (2021). Evaluating and integrating spatial capture-recapture models with data of variable individual identifiability.Ecol. Appl.[Epub ahead of print]. 10.1101/2020.03.27.010850
81
RuxtonG. D.GurneyW. S. C.de RoosA. M. (1992). Interference and generation cycles.Theor. Popul. Biol.42235–253. 10.1016/0040-5809(92)90014-k
82
RuzzanteD. E.McCrakenG. R.FørlandB.MacMillanJ.NotteD.BuhariwallaC.et al (2019). Validation of close-kin mark-recapture (CKMR) methods for estimating population abundance.Methods Ecol. Evol.001–9.
83
SandH.WabakkenP.ZimmermannB.JohansoonO.PedersenH. C.LibergO. (2008). Summer kill rates and predation pattern in a wolf-moose system: can we rely on winter estimates?Oecologia15653–64. 10.1007/s00442-008-0969-2
84
SatoT.UedaR.TakimotoG. (2021). The effects of resource subsidy duration in a detritus-based stream ecosystem: a mesocosm experiment.J. Anim. Ecol.901142–1151. 10.1111/1365-2656.13440
85
SentisA.BoukalD. S. (2018). On the use of functional responses to quantify emergent multiple predator effects.Sci. Rep.8:11787. 10.1038/s41598-018-30244-9
86
SentisA.MorissonJ.BoukalD. S. (2015). Thermal acclimation modulates the impacts of temperature and enrichment on trophic interaction strengths and population dynamics.Glob. Change Biol.213290–3298. 10.1111/gcb.12931
87
ShannonC. E. (1948). A mathematical theory of communication.Bell Sys. Tech. J.27379–423.
88
SkalskiG.GilliamJ. (2001). Functional responses with predator interference: viable alternatives to the Holling type II model.Ecology823083–3092. 10.1890/0012-9658(2001)082[3083:frwpiv]2.0.co;2
89
SmithB. E.SmithL. A. (2020). Multispecies functional responses reveal reduced predation at high prey densities and varied responses among and within trophic groups.Fish Fish.21891–905. 10.1111/faf.12468
90
SmoutS.AssurgC.MatthiopoulosJ.FernándezC.RedpathS.ThirgoodS.et al (2010). The functional response of a generalist predator.PLoS One5:e10761. 10.1371/journal.pone.0010761
91
StuddE. K.DerbyshireR. E.MenziesA. K.SimmsJ. F.HumphriesM. M.MurrayD. L.et al (2021). The purr-fect catch: using accelerometers and audio recorders to document kill rates and hunting behaviour of a small prey specialist.Methods Ecol. Evol.121277–1287.
92
TosaM. I.DziedzicE. H.AppelC. L.UrbinaJ.MasseyA.RuprechtJ.et al (2021). The rapid rise of next-generation natural history.Front. Ecol. Evol.9:698131. 10.3389/fevo.2021.698131
93
TrexlerJ. C.McCullochC. E.TravisJ. (1988). How can the functional response best be determined?Oecologia76206–214. 10.1007/BF00378751
94
UiterwaalS. F.DeLongJ. P. (2020). Functional responses are maximized at intermediate temperatures.Ecology101:e02975. 10.1002/ecy.2975
95
UszkoW.DiehlS.WickmanJ. (2020). Fitting functional response surfaces to data: a best practice guide.Ecosphere11:e03051.
96
van BaalenM.KřivanV.van RijnP. C. J.SabelisM. W. (2001). Alternative food, switching predators, and the persistence of predator-prey systems.Am. Nat.5512–524. 10.1086/319933
97
VucetichJ. A.HebblewhiteM.SmithD. W.PetersonR. O. (2011). Predicting prey population dynamics from kill rate, predation rate and predator-prey rations in three wolf-ungulate systems.J. Anim. Ecol.801236–1245. 10.1111/j.1365-2656.2011.01855.x
98
WaltersC. J.ChristensenV.PaulyD. (1997). Structuring dynamic models of exploited ecosystems from trophic mass-balance assessments.Rev. Fish. Biol. Fish.7139–172.
99
WaltersC. J.MartellS. J. D. (2004). Fisheries Ecology and Management.New Jersey: Princeton University Press.
100
WelchH. E.BergmannM. A.SiferdT. D.MartinK. A.CurtisM. F.CrawfordR. E.et al (1992). Energy Flow through the Marine Ecosystem of the Lancaster Sound Region.Arctic Canada45343–357.
101
WeteringsR.UmponstiraC.BuckleyH. L. (2015). Density-dependent allometric functional response models.Ecol. Model.30312–18. 10.1371/journal.pone.0025937
102
WilmersC. C.IsbellL. A.SuraciJ. P.WilliamT. M. (2017). Energetics-informed behavioural states reveal the drive to kill in African leopards.Ecoshpere8:e01850.
103
WilmersC. C.NickelB.BryceC. N.SmithJ. A.WheatR. E.YovovichV. (2015). The golden age of bio-logging: how animal-borne sensors are advancing the frontiers of ecology.Ecology961741–1753. 10.1890/14-1401.1
104
ZhangJ. F.PapanikolaouN. E.KypraiosT.DrovandiC. C. (2018). Optimal experimental design for predator-prey functional response experiments.J. R. Soc. Interface15:20180186. 10.1098/rsif.2018.0186
105
ZimmermanB.SandH.WabakkenP.LibergO.AndreassenH. P. (2015). Predator-dependent functional response in wolves: from food limitation to surplus killing.J. Anim. Ecol.84102–112. 10.1111/1365-2656.12280
106
ZimmermanB.WabakkenP.SandH.PedersonH. C.LibergO. (2007). Wolf movement patterns: a key estimation of kill rate?J. Wildl. Manage.711177–1182. 10.2193/2006-306
Summary
Keywords
ecological communities, interaction strength, kill rate, Lepus americanus, Lynx canadensis, predator functional response, quantitative descriptors, weighted networks
Citation
Gobin J, Hossie TJ, Derbyshire RE, Sonnega S, Cambridge TW, Scholl L, Kloch ND, Scully A, Thalen K, Smith G, Scott C, Quinby F, Reynolds J, Miller HA, Faithfull H, Lucas O, Dennison C, McDonald J, Boutin S, O’Donoghue M, Krebs CJ, Boonstra R and Murray DL (2022) Functional Responses Shape Node and Network Level Properties of a Simplified Boreal Food Web. Front. Ecol. Evol. 10:898805. doi: 10.3389/fevo.2022.898805
Received
17 March 2022
Accepted
28 April 2022
Published
20 May 2022
Volume
10 - 2022
Edited by
Mauricio Lima, Pontificia Universidad Católica de Chile, Chile
Reviewed by
Nigel Yoccoz, UiT The Arctic University of Norway, Norway; Salih Djilali, University of Chlef, Algeria
Updates
Copyright
© 2022 Gobin, Hossie, Derbyshire, Sonnega, Cambridge, Scholl, Kloch, Scully, Thalen, Smith, Scott, Quinby, Reynolds, Miller, Faithfull, Lucas, Dennison, McDonald, Boutin, O’Donoghue, Krebs, Boonstra and Murray.
This is an open-access article distributed under the terms of the Creative Commons Attribution License (CC BY). The use, distribution or reproduction in other forums is permitted, provided the original author(s) and the copyright owner(s) are credited and that the original publication in this journal is cited, in accordance with accepted academic practice. No use, distribution or reproduction is permitted which does not comply with these terms.
*Correspondence: Jenilee Gobin, jenileegobin@trentu.ca
This article was submitted to Population, Community, and Ecosystem Dynamics, a section of the journal Frontiers in Ecology and Evolution
Disclaimer
All claims expressed in this article are solely those of the authors and do not necessarily represent those of their affiliated organizations, or those of the publisher, the editors and the reviewers. Any product that may be evaluated in this article or claim that may be made by its manufacturer is not guaranteed or endorsed by the publisher.