 Rachel M. Stein1*
 Bastien Lecigne2†
 Jan U. H. Eitel3
 Timothy R. Johnson4
 Craig McGowan5,6
 Janet L. Rachlow1
- 1Department of Fish and Wildlife Sciences, University of Idaho, Moscow, ID, United States
- 2Department of Biological Sciences, Centre for Forest Research (CEF), NSERC/Hydro-Québec Chain on Tree Growth Control, Université du Québec à Montréal, Montreal, QC, Canada
- 3Department of Natural Resources and Society, McCall Outdoor Science School, University of Idaho, Moscow, ID, United States
- 4Department of Mathematics and Statistical Science, University of Idaho, Moscow, ID, United States
- 5Department of Biological Sciences, University of Idaho, Moscow, ID, United States
- 6Keck School of Medicine, University of Southern California, Los Angeles, CA, United States
Visual information can influence animal behavior and habitat use in diverse ways. Visibility is the property that relates 3D habitat structure to accessibility of visual information. Despite the importance of visibility in animal ecology, this property remains largely unstudied. Our objective was to assess how habitat structure from diverse environments and animal position within that structure can influence visibility. We gathered terrestrial lidar data (1 cm at 10 m) in four ecosystems (forest, shrub-steppe, prairie, and desert) to characterize viewsheds (i.e., estimates of visibility based on spatially explicit sightlines) from multiple vantage points. Both ecosystem-specific structure and animal position influenced potential viewsheds. Generally, as height of the vantage point above the ground increased, viewshed extent also increased, but the relationships were not linear. In low-structure ecosystems (prairie, shrub-steppe, and desert), variability in viewsheds decreased as vantage points increased to heights above the vegetation canopy. In the forest, however, variation in viewsheds was highest at intermediate heights, and markedly lower at the lowest and highest vantage points. These patterns are likely linked to the amount, heterogeneity, and distribution of vegetation structure occluding sightlines. Our work is the first to apply a new method that can be used to estimate viewshed properties relevant to animals (i.e., viewshed extent and variability). We demonstrate that these properties differ across terrestrial landscapes in complex ways that likely influence many facets of animal ecology and behavior.
Introduction
Three-dimensional (3D) structure of natural environments is shaped by and responds to diverse ecosystem processes, and consequently, influences organisms in a variety of ways. An early study by MacArthur and MacArthur (1961) demonstrated a functional relationship between the 3D structure of trees and avian diversity. Similarly, Price et al. (2019) documented that 3D structural complexity of cold water reefs influenced biodiversity and benthic fauna abundance. Three-dimensional habitat structure also can influence patterns of habitat use. For example, terrestrial predators alter use of vegetation structure depending on their hunting strategy. Male lions (Panthera leo), which use an ambush strategy, primarily hunted in areas of high structure relative to their female counterparts, which use a social hunting strategy (Loarie et al., 2013). Likewise, movement decisions by animals can be influenced by habitat structure and mode of locomotion. For example, movement paths of arboreal primates through tree canopies was influenced by 3D connectivity of canopy structure that likely facilitated efficient locomotion (McLean et al., 2016). Even the 3D shape of space between structures may influence animal ecology; foraging success of the predators of mud crabs (Eurypanopeus depressus) was influenced by components of 3D interstitial space produced by the spatial arrangement of oyster (Crassostrea virginica) shells (Hesterberg et al., 2017). Anthropogenic alteration of 3D structure also can affect habitat use and subsequent animal fitness. For example, abundance, clutch size, and nesting success of grassland songbirds were influenced by the presence of and distance to human infrastructure (Nenninger and Koper, 2017; Daniel and Koper, 2019). A recognition of the importance of 3D habitat structure to ecology has led to: (1) calls to more broadly integrate 3D components of habitat into studies of wildlife ecology (Davies and Asner, 2014; D’Urban Jackson et al., 2020; Lepczyk et al., 2021); and (2) increased use of remote sensing tools (e.g., photogrammetry, structure from motion, and lidar) to characterize 3D structure in both terrestrial (Ahmed et al., 2014; Olsoy et al., 2015; Adams and Matthews, 2018) and marine environments (Irish and Lillycrop, 1999; Chen, 2019; Lochhead and Hedley, 2021).
Three-dimensional structure can influence perception of the environment by animals and humans by changing accessibility of sensory information, which could have strong effects on fitness (McNamara and Dall, 2010; Munoz and Blumstein, 2012). Interactions with structure by soundwaves alter propagation of sound through an environment and thus the accessibility of sonic information (Aylor, 1972a,b). Similarly, physical elements in the environment such as vegetation or terrain can block sightlines and thus alter the range at which visual information can be gathered (Aspbury and Gibson, 2004; Embar et al., 2011). The area from which visual information is accessible to animals in natural settings has been described as “visibility” or “viewshed” (e.g., Coleman and Hill, 2014; Davies et al., 2016). Although these terms are often applied interchangeably, it is useful to define them separately. Visibility refers to the property of the habitat that relates habitat structure to accessibility of visual information. The viewshed is an estimate of that property, defined as all the spatially explicit sightlines accessible from one vantage point (Aben et al., 2018). Habitat structure can block sightlines in multiple directions, thereby altering an individual’s viewshed (Embar et al., 2011).
Visibility has far-reaching influence on the ecology and behavior of animals and humans. Visual cues are used to locate resources (Potier et al., 2016), select mates (Detto, 2007), communicate (Menezes and Santos, 2020), determine movement paths (Aben et al., 2021), and evaluate risk (Potash et al., 2019), or detect danger (Acebes et al., 2013), and consequently they strongly influence space use and habitat selection by animals (Table 1). For example, red-capped cardinals (Paroraria gularis) spent more time in areas of their territory with high visibility where conspecific invaders were easy to detect (Eason and Stamps, 2001), and anole lizards (Anolis aenus) defended smaller territories where visibility was limited, likely due to the increased energetic costs of defending low-visibility territories (Eason and Stamps, 1992). Similarly, locations of leks in ground-displaying birds is constrained by the need for extensive visibility that facilitates attraction of mates and detection of predators (Aspbury and Gibson, 2004; Alonso et al., 2012). The influence of visibility (or lack thereof) on predator-prey interactions is particularly striking. For example, the most important predictor of lion kill sites was the viewshed experienced by the prey; lion kills were twice as likely in areas where the viewshed of their prey was limited (Davies et al., 2016). Multiple studies have documented that African ungulates generally select for habitat with wide-ranging visibility (Riginos and Grace, 2008; Riginos, 2015). Similarly, space use and perceived safety by humans in urban environments are influenced by visibility (Loewen et al., 1993; Haans and de Kort, 2012).
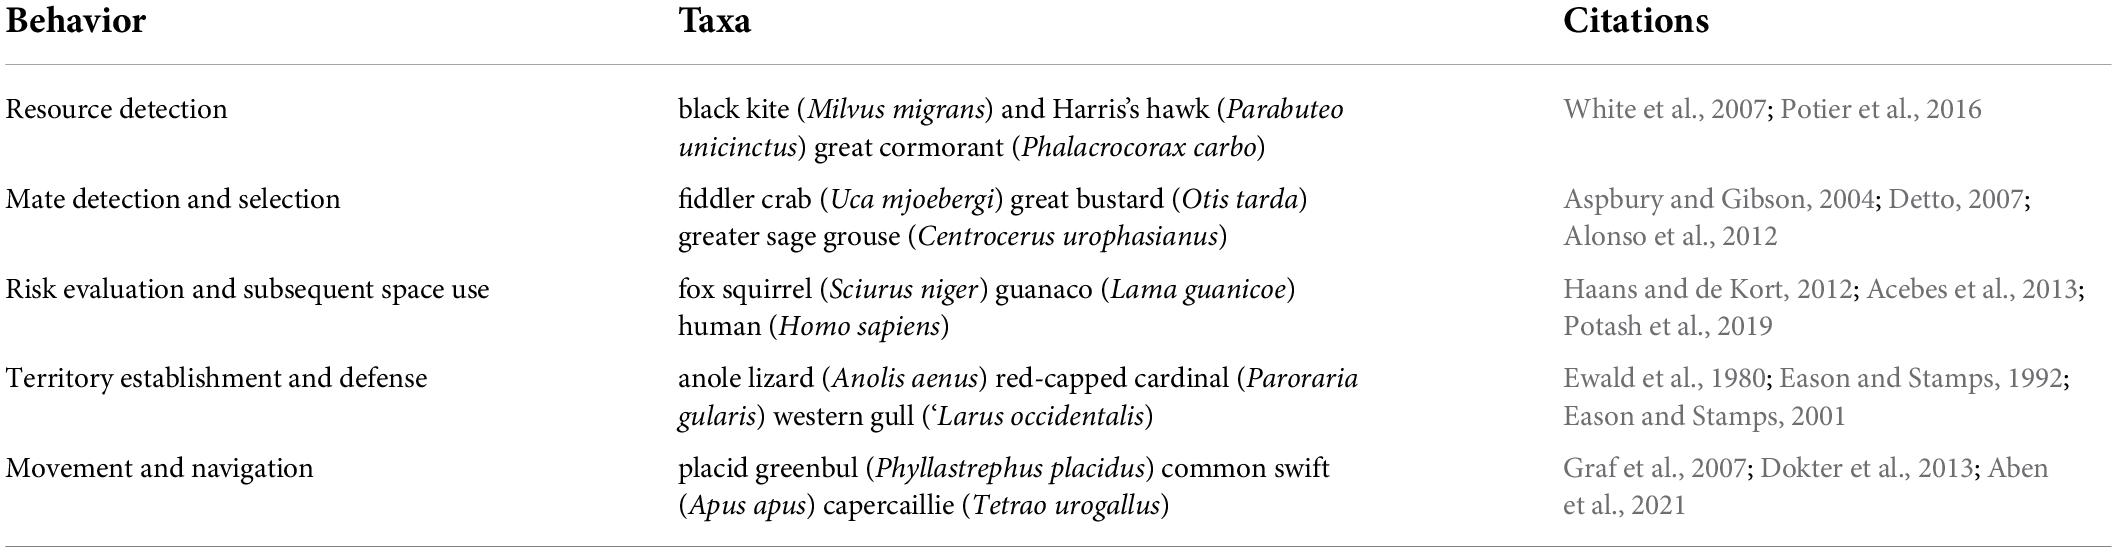
Table 1. Examples of behaviors that are influenced by visibility in animals and humans.
In the study of human sensation and perception, it is well-known that physical position of a person relative to the 3D structure around them influences what can be visually perceived (Gibson, 1979). Lecigne et al. (2020) argued that physical perspective influences the viewshed of wildlife, as well. Accounting for physical position may be important for researchers attempting to determine the influence of viewshed on habitat selection by species with access to different perspectives. For example, we expect that because of their ability to fly, birds can access a wide range of perspectives within their environment, whereas visibility of ground-dwelling species will be constrained to a greater degree by vegetation structure (Figure 1). Additionally, due to diverse ecological drivers, different ecosystems may have different 3D structures (e.g., forest vs. grassland), and all species are likely influenced by the 3D structures within which they evolved and persist. Non-vegetative 3D structures such as topography and human infrastructure also can influence visibility and subsequent space use (Aspbury and Gibson, 2004; Parsons et al., 2021). Despite the importance of visibility in animal ecology and the expected influence of 3D structure on visibility, no assessment has been conducted to evaluate the influence of ecosystem-specific structure and animal position on visibility.
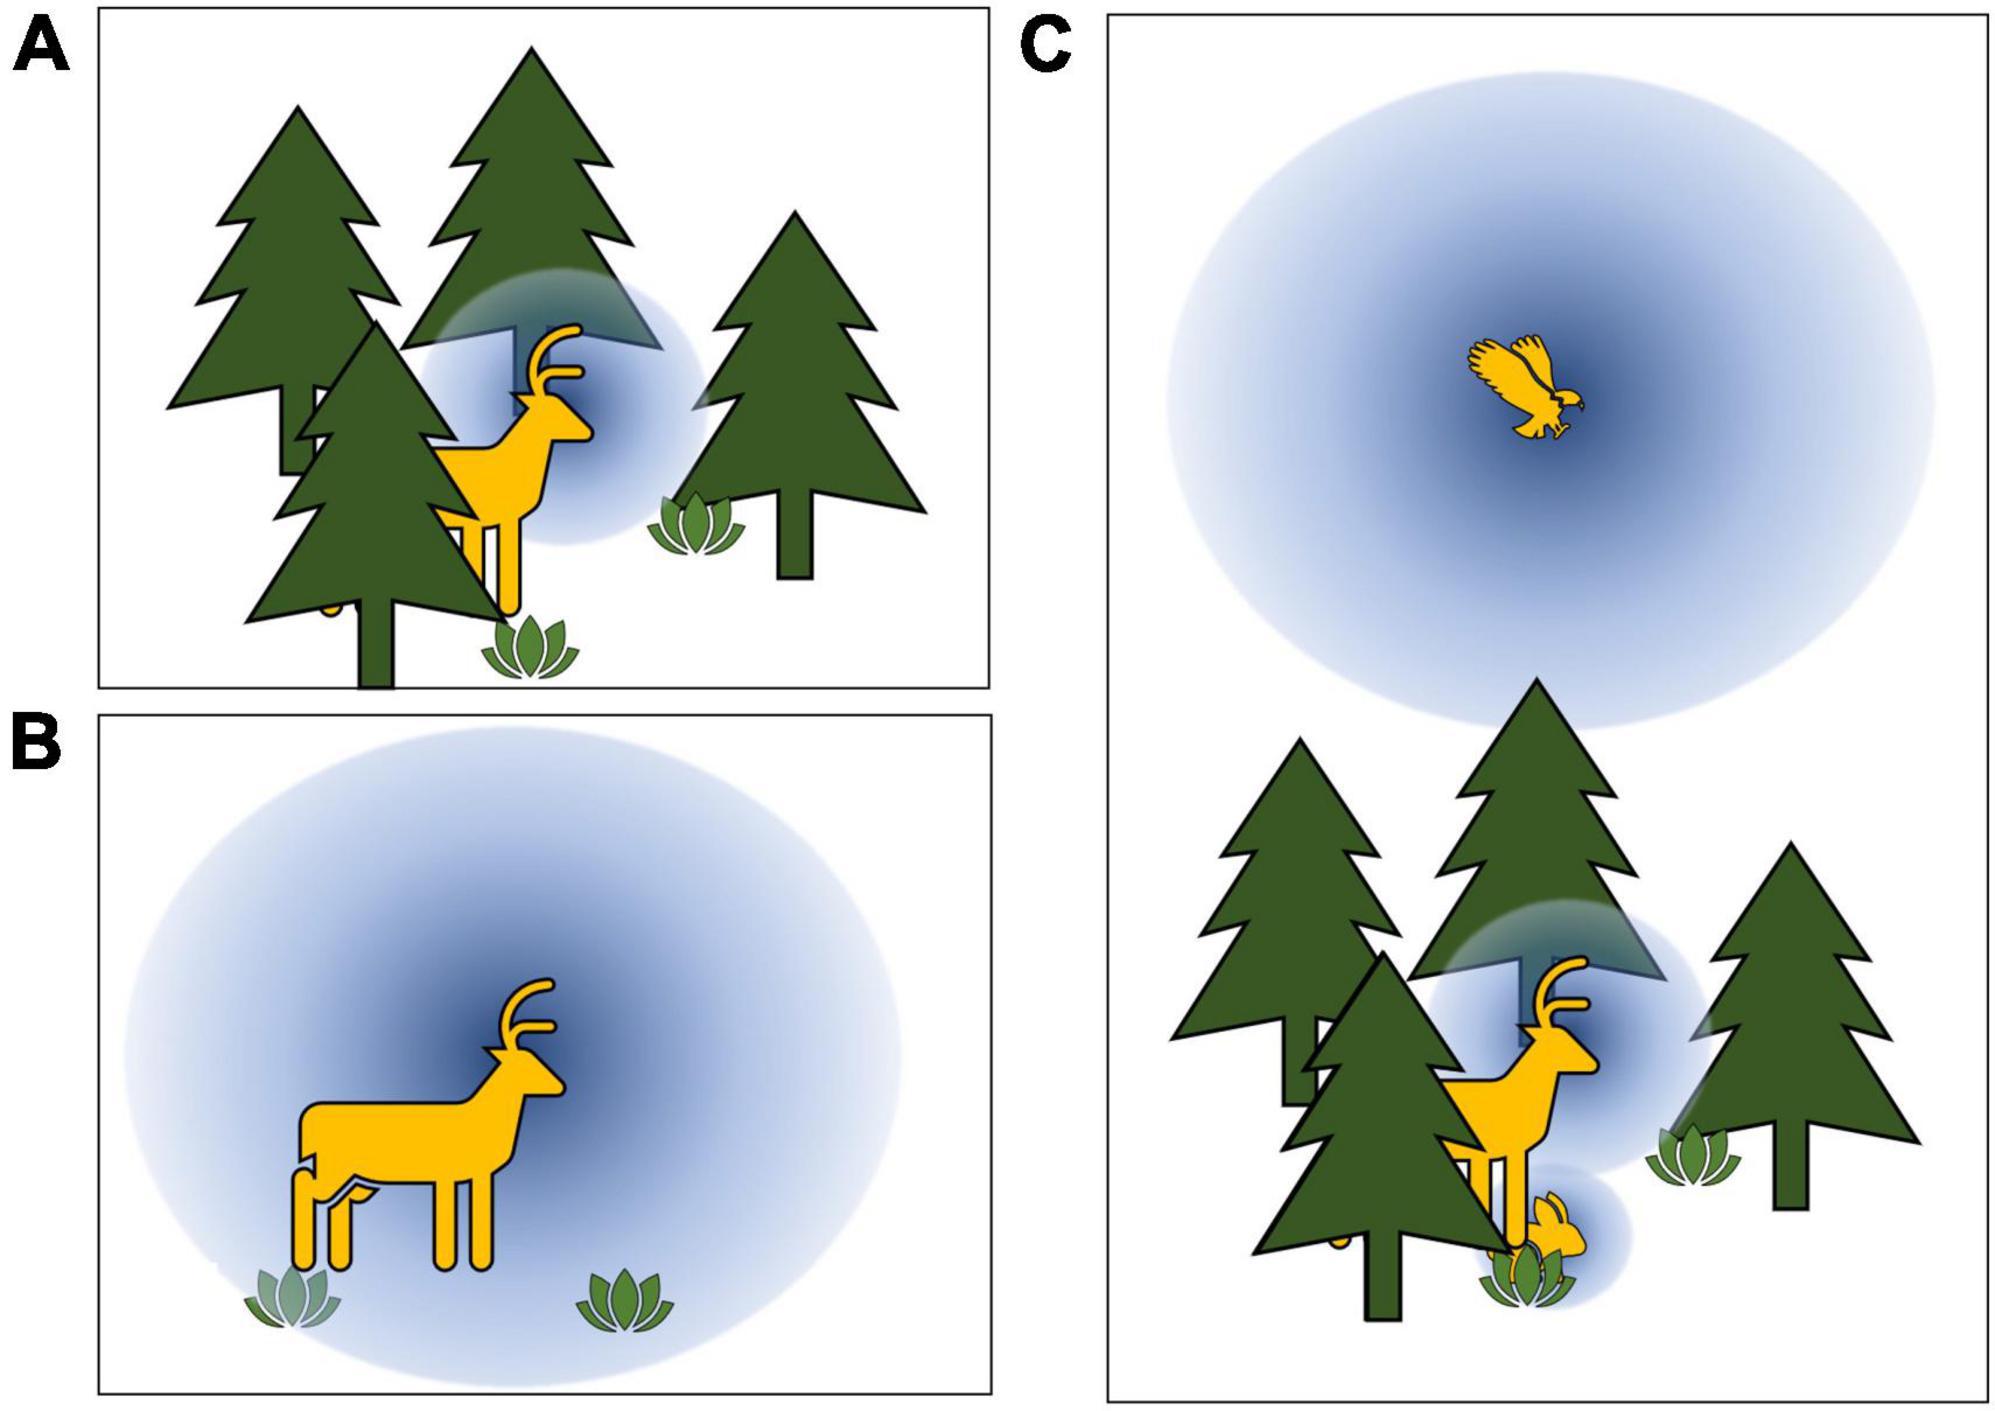
Figure 1. Conceptual representation of hypothesized relationships between visibility (blue spheres) and habitat structure and perspective. (A,B) Ecosystems with extensive vegetation structure (e.g., forests) will afford smaller viewsheds relative to ecosystems with little structure (e.g., prairies). (C) Animal position within habitat structure will influence viewsheds, with visibility generally increasing with eye-height above the ground.
The objective of this study was to assess how visibility may change across diverse natural environments as a function of ecosystem type, 3D structure, and perspective within that structure. We quantified fine-scale habitat structure using terrestrial lidar and used the R package viewshed3d (Lecigne et al., 2020) to estimate viewsheds within plots sampled at four sites representing disparate ecosystems: forest, shrub-steppe, prairie, and desert. Viewsheds measured within each ecosystem were evaluated relative to habitat structure as well as perspectives (i.e., eye-heights) accessible to native wildlife that inhabit those environments. We expected that both viewshed extent and variability would differ across eye-heights, and that values would differ among ecosystems with contrasting vegetation structure. To our knowledge, this is the first time that these relationships have been examined in any terrestrial ecosystem. Additionally, this is the first application of the lidar-viewshed3d method to ecosystems other than forests. Advancing understanding about how both habitat structure and perspective can influence visibility will increase our ability to assess the mechanisms by which habitat structure influences the ecology and behavior of animals and contribute to more realistic estimates of habitat selection and use.
Materials and methods
Study sites
We selected study sites within four ecosystems in the western United States: forest, shrub-steppe, prairie, and desert (Figure 2). These ecosystems represent a gradient of vegetation structures from prairie, which has little structure and no canopy, to shrub-steppe and desert, which have moderate structure with a single-layer shrub canopy, to forest, which has relatively dense vegetation structure and a multi-layer arboreal canopy. Within each study site, we selected plots that represented the breadth of vegetative structures within the ecosystem to understand how visibility can change in those ecosystems as a result of ecosystem-specific structures. In the forest, vegetative structure differed among plots to a greater degree than other ecosystems because tree species composition and density varied among forest plots.
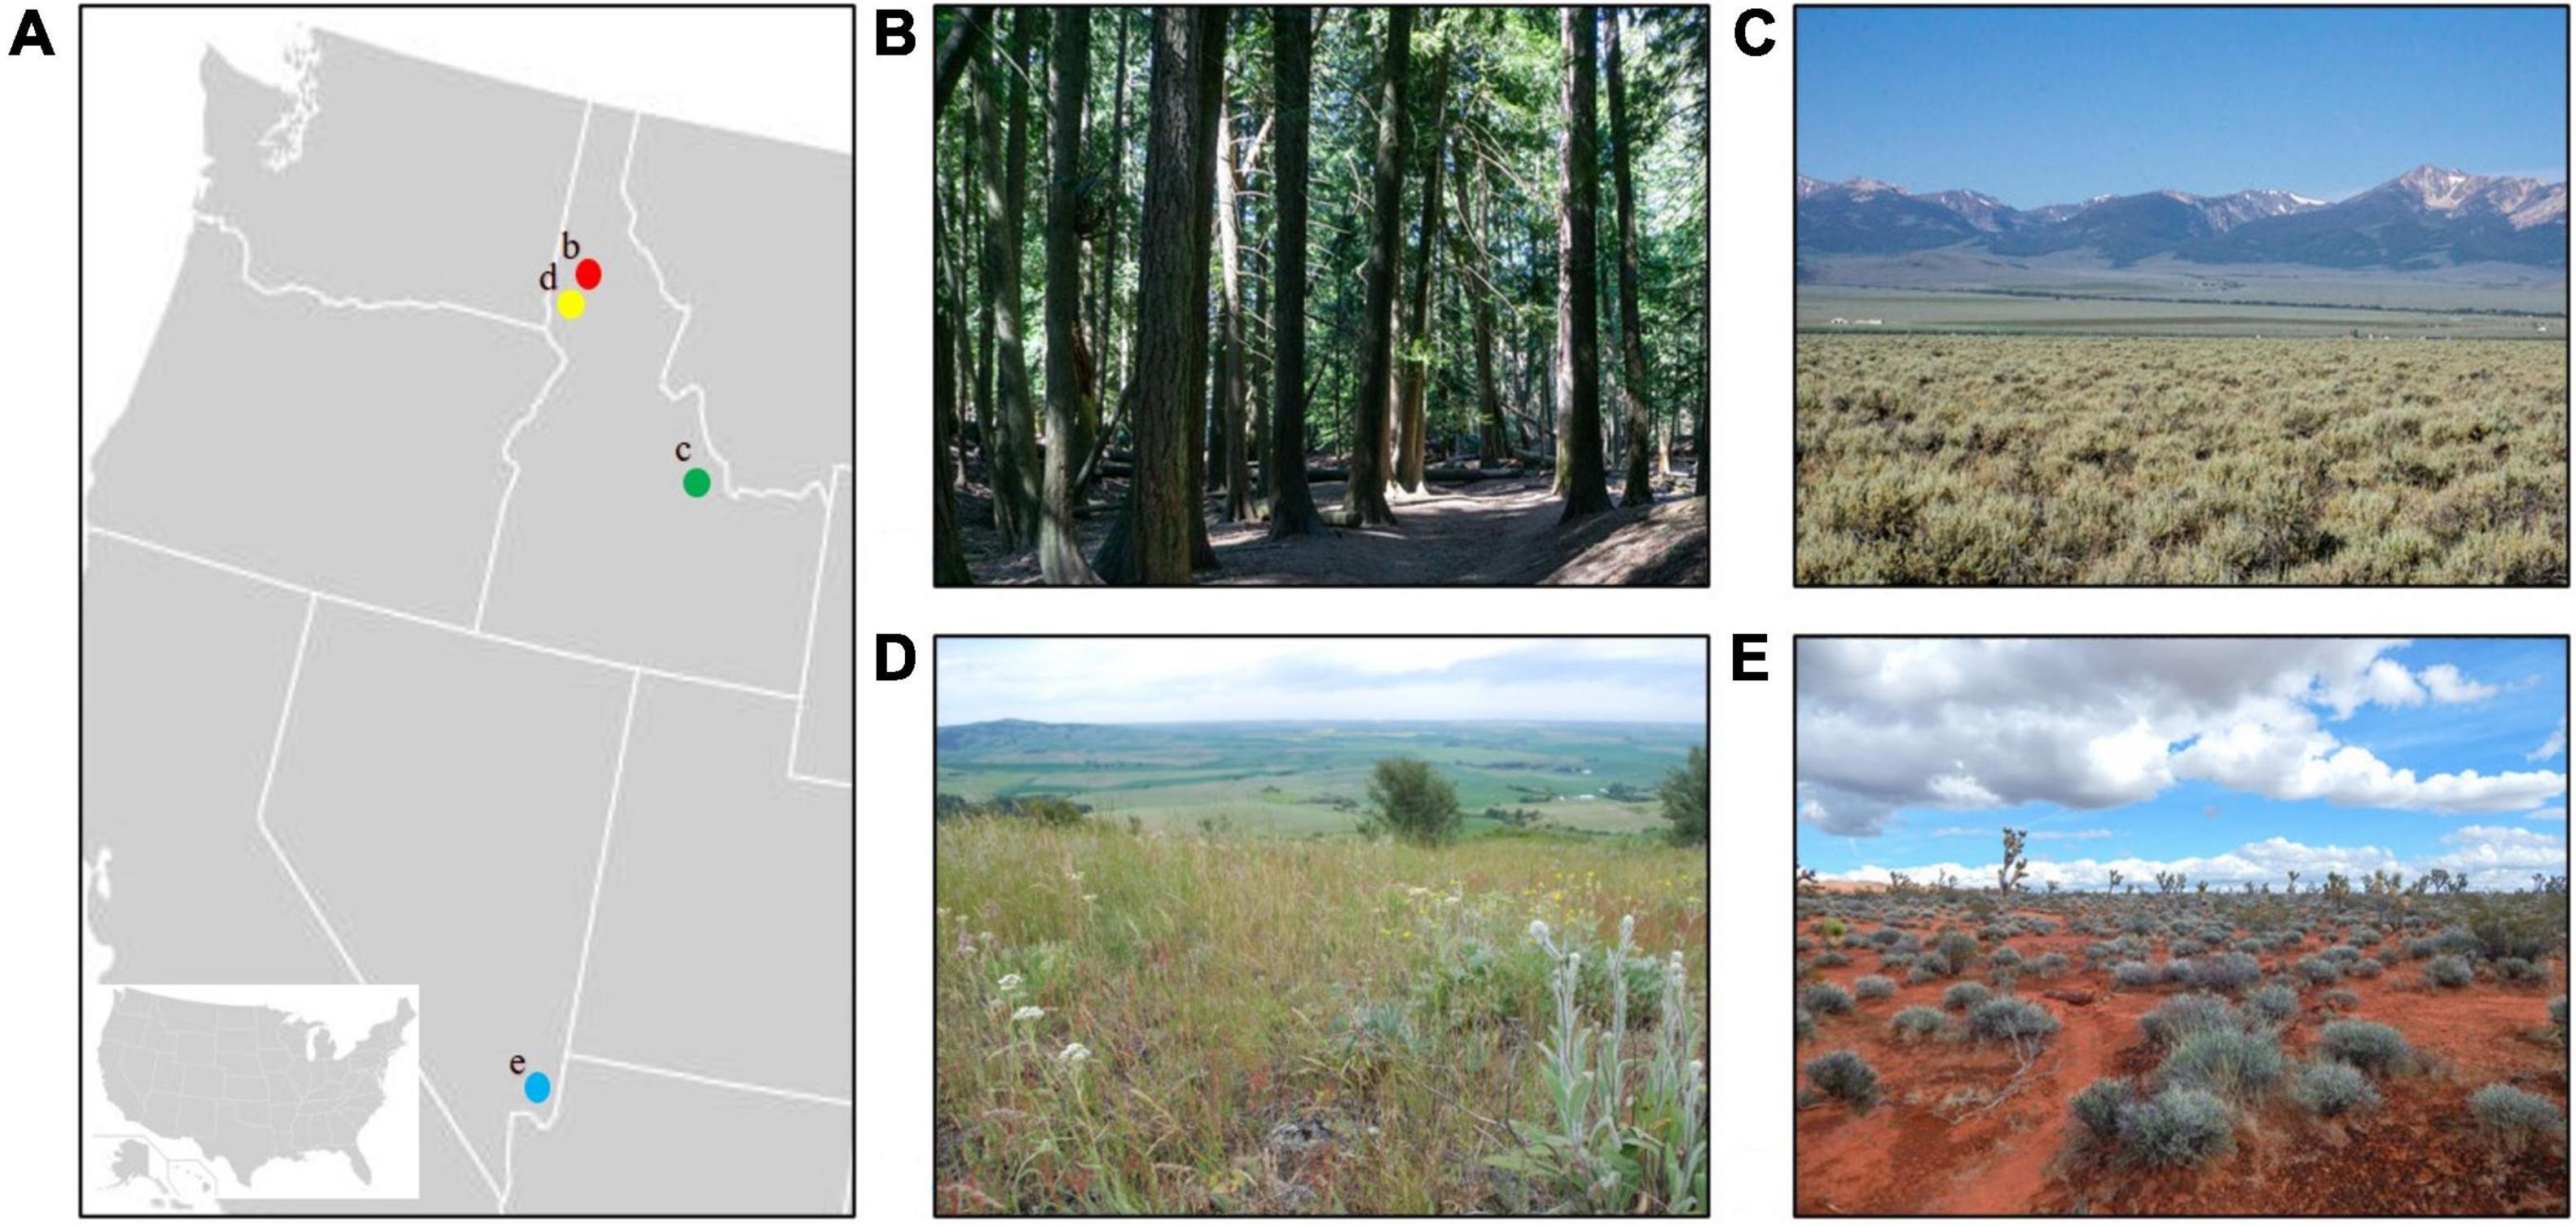
Figure 2. (A) Locations of study sites in the western United States. (B) Forest site at the University of Idaho Experimental Forest near Moscow, ID (red dot). (C) Shrub-steppe site in the Lemhi Valley, ID (green dot). (D) Prairie site at the Dave Skinner Ecological Preserve and Thorn Creek Native Seed Farm near Moscow, ID (yellow dot). (E) Desert site at Gold Butte National Monument in southern NV (blue dot).
The forest site was located at the University of Idaho Experimental Forest (UIEF) on Moscow Mountain, Idaho (Figures 2A,B). The UIEF is a temperate coniferous forest with average temperatures ranging from −6°C in winter to 31°C in summer. Precipitation averages 70 cm annually (NOAA, 2021). The UIEF supports ponderosa pine (Pinus ponderosa), Douglas fir (Pseudotsuga menziesii), western larch (Larix occidentalis), and western red cedar (Thuja plicata). Diverse wildlife species are present including snowshoe hares (Lepus americanus), black bears (Ursus americanus), coyotes (Canis latrans), white-tailed deer (Odocoileus virginianus), and moose (Alces alces), as well as a variety of birds.
The Lemhi Valley, a high elevation valley situated 1,180 m asl in east-central Idaho was selected as the shrub-steppe site (Figures 2A,C). Average temperatures range from −15°C in winter to 28°C in summer. The area annually receives about 43 cm of precipitation, most of it falling as snow (NOAA, 2021). The site is dominated by Wyoming big sagebrush (Artemis tridentata) with a sparse grass and forb understory. This site supports pygmy rabbits (Brachylagus idahoensis), American badgers (Taxidea taxus), coyotes, American pronghorn (Antilocapra americana), and diverse bird species.
We sampled a remnant of the endangered Palouse Prairie ecosystem at the Dave Skinner Ecological Preserve and the Thorn Creek Native Seed Farm near Moscow, Idaho (Figures 2A,D). Being located less than 30 km from the UIEF, this site is subject to the same climate. Palouse Prairie is a short-grass prairie composed of a multitude of small grasses and forbs including plants belonging to the sunflower (Asteraceae), bunchflower (Melanthiaceae), lily (Liliaceae), legume (Fabaceae), parsley (Apiaceae), rose (Rosaceae), broomrape (Orobanchaceae), and grass (Poaceae) families. Most of the historic extent of Palouse Prairie has been converted into farmland, and the few remaining remnants occur almost exclusively on the tops of ridges that are too rocky for agriculture. The site is regularly utilized by white-tailed deer, American badgers, coyotes, cottontails (Sylvilagus spp.), and diverse birds.
We sampled Mojave Desert vegetation at Gold Butte National Monument in southern Nevada (Figures 2A,E). The site receives <2 cm of precipitation annually. Average temperatures vary from −3°C in winter to 36°C in summer (NOAA, 2021). Joshua trees (Yucca brevifolia), creosote bushes (Larrea tridentata), and white bursage (Ambrosia dumosa) are prominent as are a number of cholla (Cylindropuntia spp.) and manzanita (Arctostaphylos spp.) species. Kangaroo rats (Dipodomys spp.), black-tailed jackrabbits (Lepus californicus), bighorn sheep (Ovis canadensis nelson), coyotes, and desert tortoises (Gopherus agassizi) are supported by the site as are numerous bird species.
Data collection
At each site, we established circular plots with a 12-m radius within which we gathered terrestrial lidar data to compile three-dimensional (3D) point clouds of fine-scale habitat structure. We selected plots within the forested ecosystem (n = 10) that encompassed a wide range of stand types and structures. Plots at the shrub-steppe (n = 6) and desert (n = 5) sites were selected in areas of known animal activity determined by scat and track identification. Due to the limited extent of the prairie site, we placed plots (n = 6) in locations that encompassed only prairie vegetation and no other encroaching ecotypes. We sampled more plots in the forest because of the greater structural diversity relative to the other ecosystems. Plot size was constrained by the limited spatial extent associated with terrestrial lidar, and plot shape was selected reflecting the viewshed3d method, which measures sightlines within a sphere (Lecigne et al., 2020).
We collected terrestrial lidar data using a Leica BLK360 Imaging Laser Scanner (Leica Geosystems, St. Gallen, Switzerland) on a tripod typically set at 1.3 m above the ground; we occasionally lowered the height of the tripod and scanner to accommodate uneven terrain or dense vegetation. We completed 15–25 scan locations per plot depending on vegetation density and structure; sites with great vegetation complexity (e.g., forest) required more scans to overcome the increased occlusion from the high level of structure (Van der Zande et al., 2006). The BLK360 is a multiple return scanner that collects data using an 830 nm infrared laser with a beam divergence of 0.4 mrad. The scanner was set to collect data at its standard point density (1 cm at 10 m). Before scanning, we deployed highly reflective targets visible from multiple scan locations.
Within each plot, we stitched individual scans together to create a single large point cloud detailing the structure of the entire plot (Figure 3 and Supplementary Figure 1). This process began with the software ReCap Pro v6.0 (Autodesk, San Rafael, CA, United States). Reflective targets provided spatial reference points that the software used to create a rough alignment of scans. We then imported the oriented scans into CloudCompare v2.11.3 (CloudCompare, 2021) and used the iterative closest point (ICP) algorithm tool for fine-scale alignment. The scans were merged into a single point cloud and the reflective targets were removed using the segment tool. Because of relatively large differences in the amount and composition of vegetation across ecosystems (Figure 4), resulting point clouds ranged in size from 20 to 97 million points. Lastly, we used ReCap Pro to define the center ground point as 0,0,0; the X,Y orientation was randomly assigned by the program, and Z was designated as elevation above the ground.
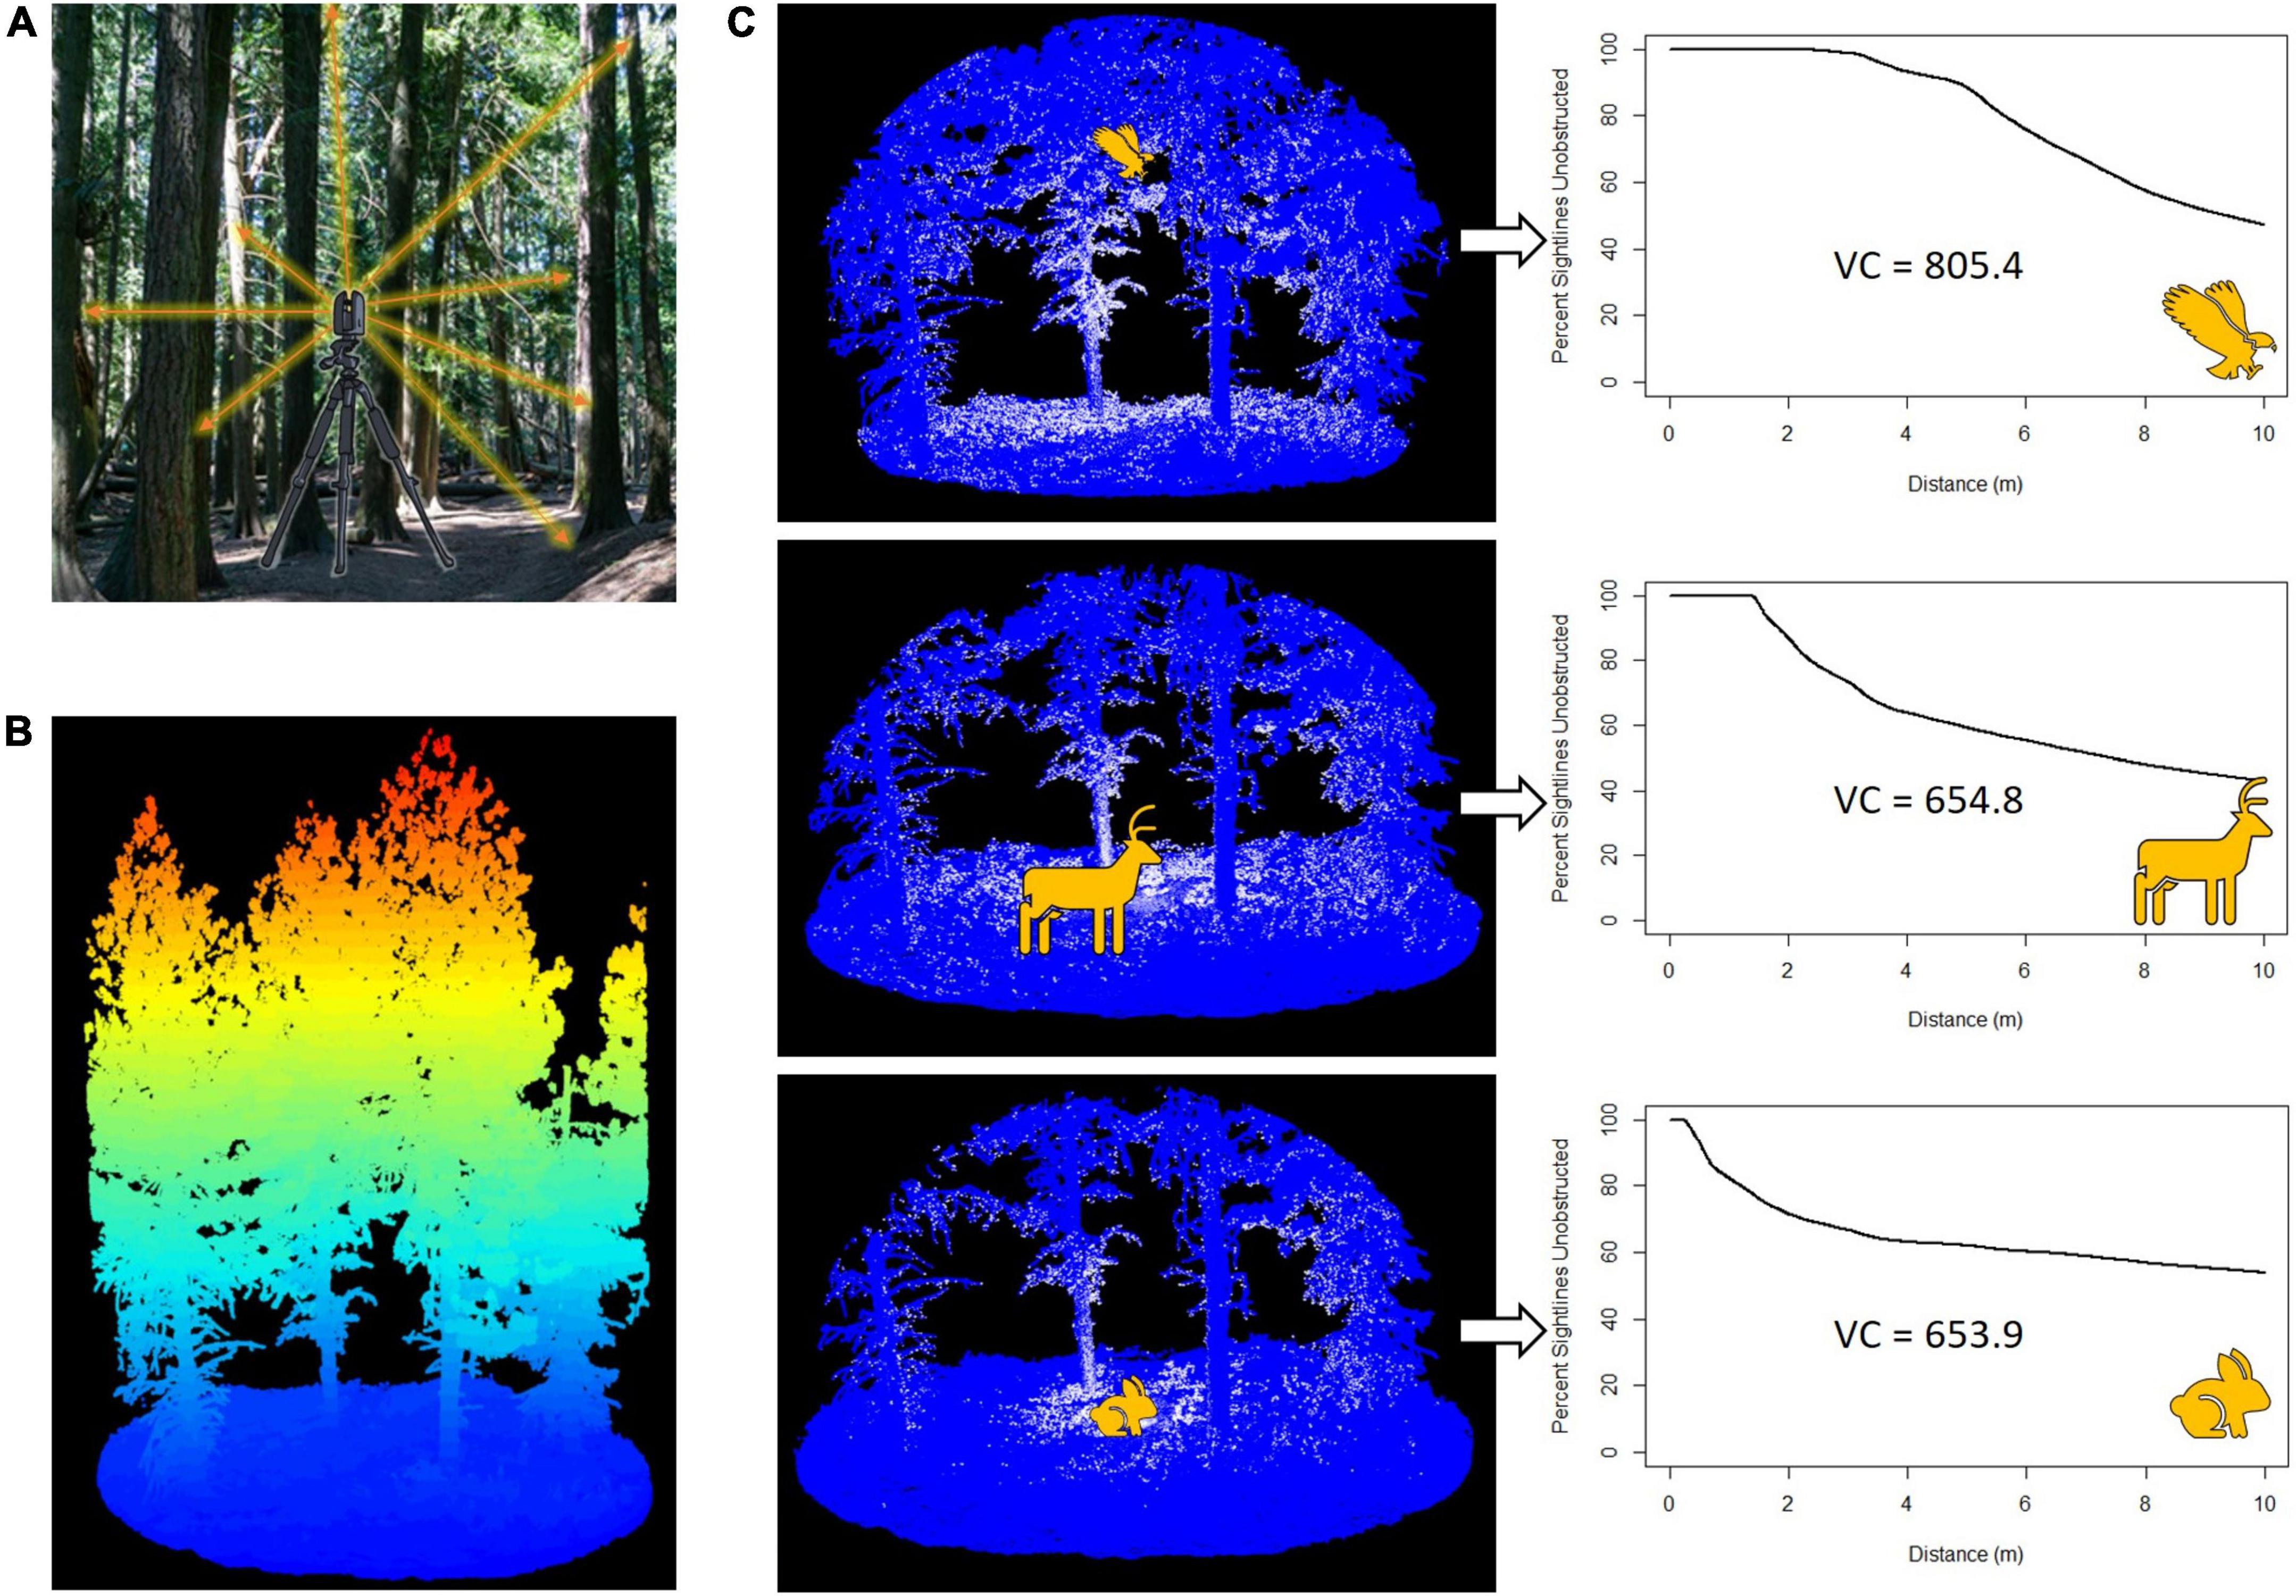
Figure 3. Method for estimating viewsheds. (A) Terrestrial laser scanner (TLS) used to collect data from multiple locations within a plot. (B) Scans gathered using the TLS are stitched together to produce lidar point clouds representing the habitat structure of the entire plot. Displayed is a forest point cloud, in which the color ramp shows relative elevation from low (blue) to high (red). (C) Application of viewshed3d to the point cloud from three eye-heights (0.25, 1.5, and 5 m) representative of animal groups that access ecosystems from those heights. The white and blue dots are lidar data points; white points are those at the ends of measured sightlines. Viewshed graphs display the percent of unobstructed sightlines as a function of distance from the animal position. The viewshed coefficient (VC) is calculated as the area under the curve and is a measure of viewshed extent.
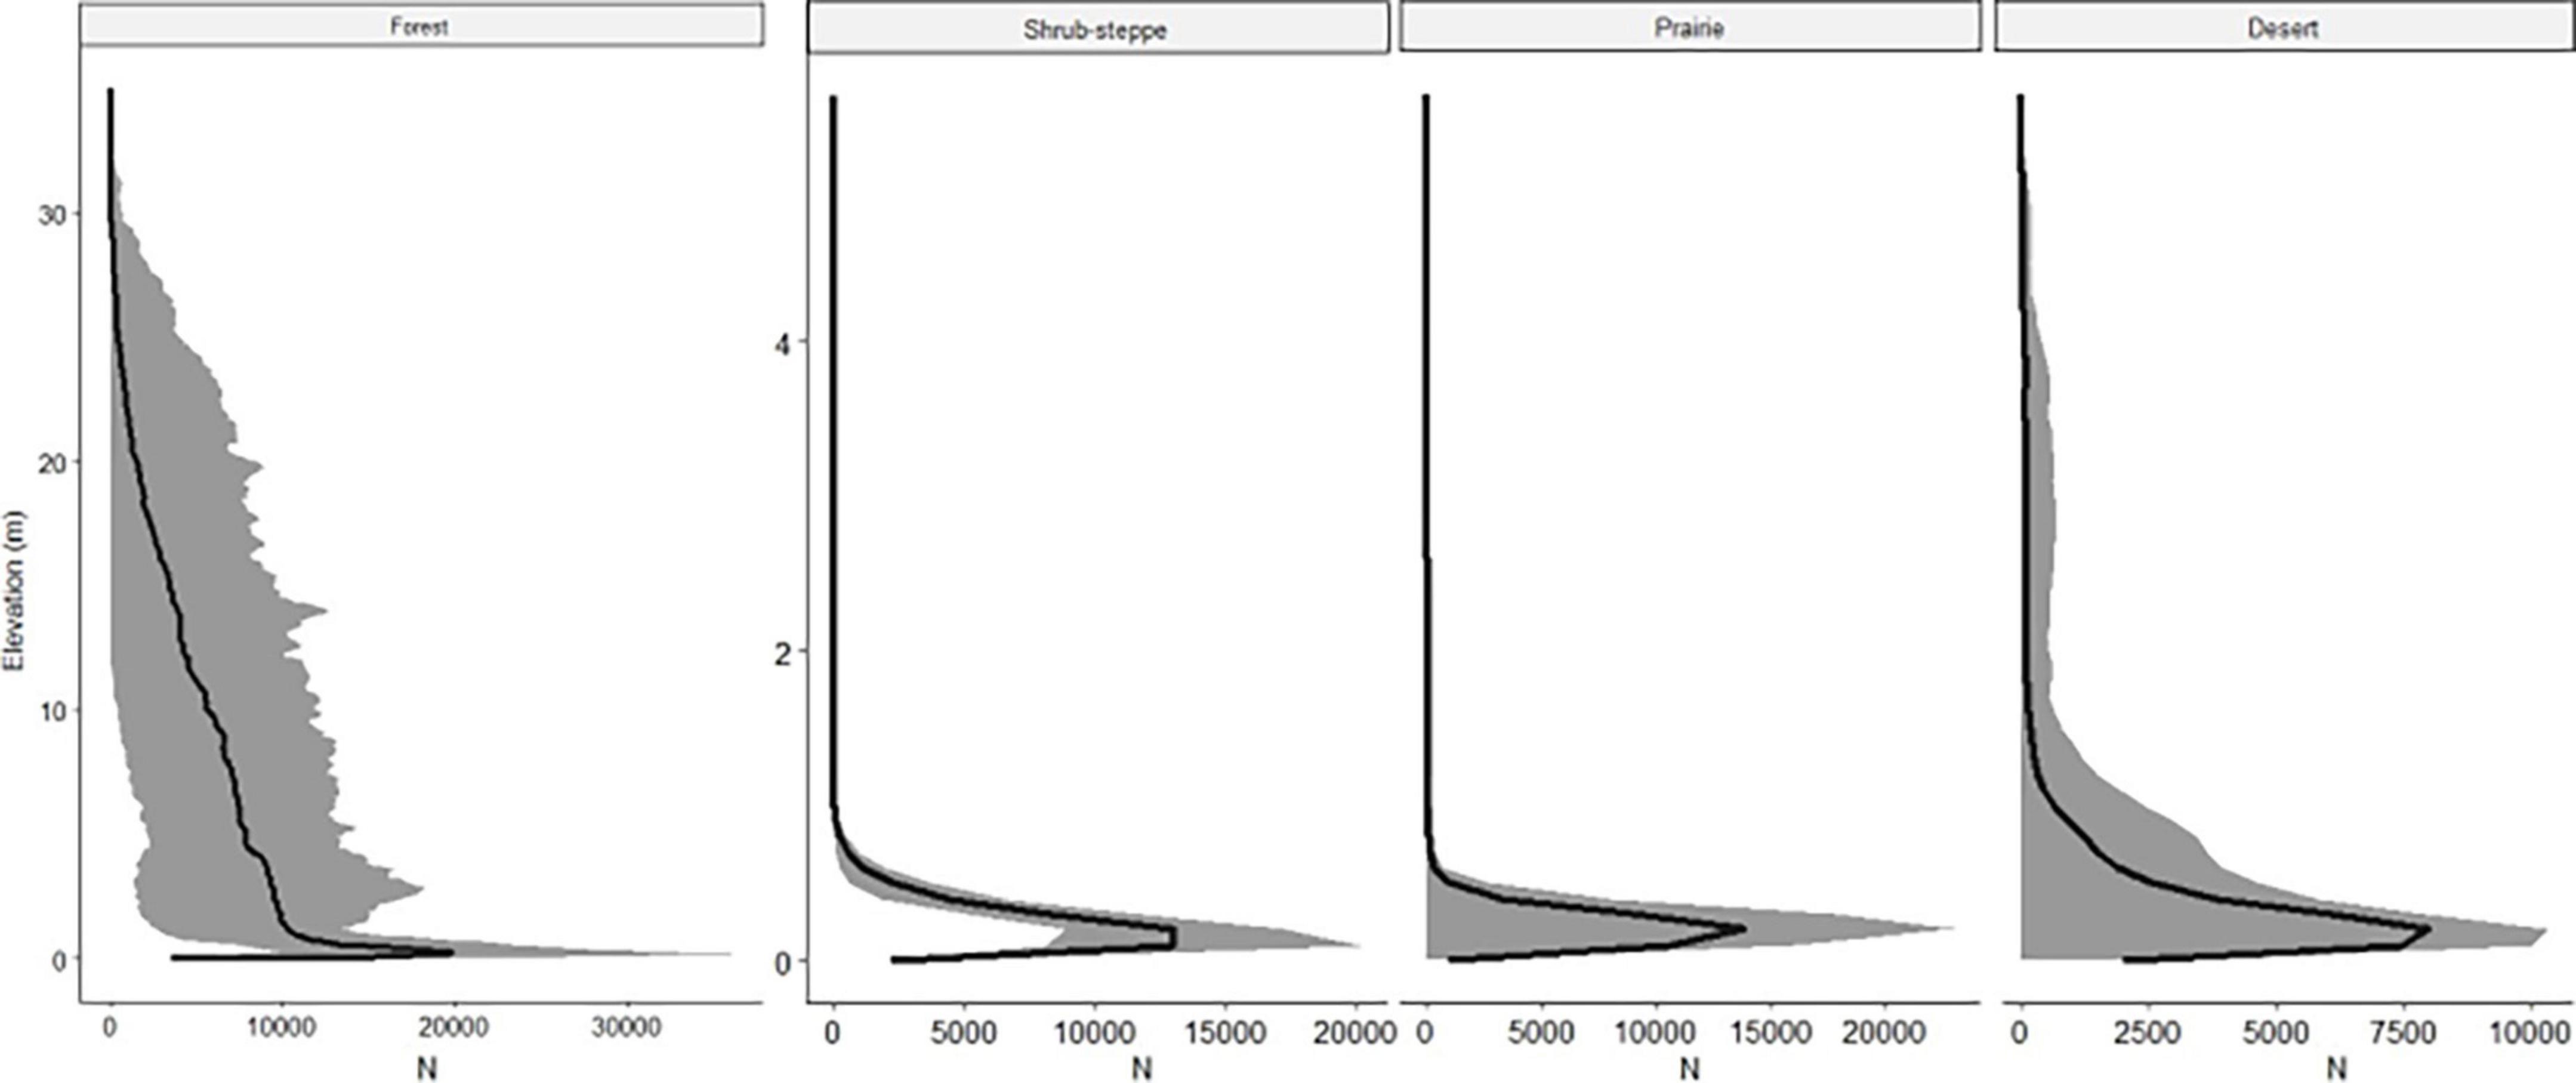
Figure 4. Vegetation distribution profiles calculated from the lidar point clouds representing the number of voxels (units of space occupied by some vegetation resolution 5 cm3, defined as N in the figure) at each elevation (m) above ground. The y-axis scale differs between the forest and the three low-structure ecosystems (shrub-steppe, prairie, and desert). Mean values (line) and ranges (shaded area) for all plots in each of four ecosystems.
We measured 10-m viewsheds within each plot from 5 X,Y locations across multiple Z positions representing eye-heights for diverse wildlife (Figure 3 and Supplementary Figure 1). Although the importance of viewshed size and orientation is likely to differ by species, our objective was to examine how these diverse structures and positions within them can influence visibility in general, so we measured all viewsheds to the 10-m maximum constrained by size of the plots to facilitate comparison across vantage points. The first X,Y location was the plot center (X, Y coordinate 0,0). The other locations were selected using a systematic sampling design applied to locations 2 m from the center location to ensure adequate coverage of the plot. These locations were oriented so that they intersected perpendicular axes that passed through the center of the plot, but the angle of the axes relative to the orientation of the plot was selected randomly for each plot (i.e., at X,Y coordinates: 0,2; 0,−2; 2,0; −2,0). These locations ensured that the 10-m radius viewsheds would not extend beyond the point cloud. The Z positions included terrestrial perspectives at 0.25, 0.75, and 1.5 m from the ground to represent eye-heights of small, medium, and large terrestrial animals. Aerial perspectives were assessed from 5 to 10 m above the ground in the three low-structure ecosystems (shrub-steppe, prairie, and desert), and in the forest, arboreal and aerial vantage points were placed every 5 m (from 5 to 30 m). Before measurement, spheres were projected onto the point clouds at the selected positions and evaluated to ensure they did not occur within a structure (e.g., a tree trunk; Supplementary Figure 1). No selected positions occurred within structures and so no further adjustments to position were required. We did not measure viewsheds from vantage points > 10 m above the ground in the low-structure ecosystems and >30 m in the forest because sightlines measured from higher vantage points were not able to interact with the point clouds since viewsheds were not measured beyond 10 m. This sampling design resulted in estimation of viewsheds at 25 distinct X,Y,Z vantage points within each of the shrub-steppe, prairie, and desert plots and 45 vantage points in each of the forest plots.
We estimated spherical viewsheds at each designated vantage point within each lidar point cloud using the R package viewshed3d (Lecigne et al., 2020), which measures 3D sightlines in all latitudinal and azimuthal directions until they are obstructed by any lidar data point (including ground points; Figure 3). We set the angular resolution of the sightlines to 0.6° which produced similar viewshed estimates to lower angular resolutions but required fewer computational resources. Measurement of sightlines is reported by the package as a graph of the percent of unobstructed sightlines as a function of distance from the designated vantage point (Figure 3). To quantify the size of viewsheds, we calculated the area under the curve to 10 m (maximum radius of the measured viewshed) and defined it as the viewshed coefficient (VC), which is a function of the spatial extent of the viewshed in all directions.
We assessed variation of sightlines within each measured viewshed to describe variability in viewshed composition in addition to viewshed extent (Supplementary Figure 2). Relative to each vantage point, we segmented the point cloud in the azimuth into 20 segments of 18° and estimated the VC of each segment. Next, we calculated the standard deviation and mean VC of these 20 segments to calculate a coefficient of variation for the viewshed at each vantage point within each ecosystem as a descriptive statistic of variation in viewshed composition.
To understand the influence of vertical structural heterogeneity, we calculated roughness, which is the standard deviation of the canopy heights within 10 m of each X,Y position, using the lidR package (Roussel et al., 2020). Roughness was selected as the only structural metric because other standard metrics (e.g., canopy cover, basal area, etc.) were not applicable to the diversity of vegetation structures across the ecosystems we studied.
Data analysis
Due to the hierarchical structure of the data, linear mixed-effects models were fit to data from each ecosystem. We modeled two viewshed characteristics (VC and the coefficient of variation) as separate response variables to examine the influence of explanatory variables on both the overall extent and variability of the viewshed. Explanatory variables were eye-height above the ground and roughness. Nested random effects were specified with random intercepts for plot and for X,Y location within each plot. These models were run separately for each ecosystem using the lme4 and nlme packages in R (Bates et al., 2015; Pinheiro et al., 2020). To correct for heteroscedasticity of the response variables, primarily due to relatively small variation among the higher vantage points where there was little vegetation structure, the highest eye-heights in all ecosystems were removed from analysis. Additionally, in the low-structure ecosystem models (shrub-steppe, prairie and desert), a variance structure was imposed on the 0.25 m eye-heights to allow the response variables to have different error variances than the other eye-heights. We applied logarithmic transformation to coefficients of variation to further account for heteroscedasticity. Eye-height was modeled as a factor with levels of 0.25, 0.75, 1.5, and 5 m in all ecosystems and also 10, 15, 20, and 25 m in the forest to give the models flexibility with respect to the statistical relationship between the response variables and height (Zuur et al., 2009).
We compared modeled VCs and coefficients of variation across vantage points using the emmeans and trtools R packages (Johnson, 2021; Length, 2021). Additionally, we compared expected VCs and coefficients of variation at each eye-height across ecosystems by calculating a Wald test statistic with 95% confidence. We did not compare viewsheds measured at eye-heights in the forest that were not also measured in the low-structure ecosystems.
Results
As expected, eye-height (i.e., vantage point) strongly influenced both the extent (viewshed coefficient) and variability (coefficient of variation) of viewsheds in all ecosystems. In all models, all eye-heights were significant predictors of both viewshed coefficient (VC) and the coefficient of variation (Supplementary Tables 1, 2). In all VC models, as eye-height increased, the viewshed extent as characterized by the VC, generally increased but the relationships were not linear across the lowest vantage points in any ecosystem nor across the highest vantage points in the forest ecosystem (Figure 5). In the low-structure ecosystems, variability in viewsheds, characterized by coefficients of variation, decreased as eye-height increased to heights above the vegetation canopy. In the forest, however, variation in viewsheds was highest at intermediate eye-heights, and markedly lower at the lowest (0.25 m) and highest (>10 m) eye-heights (Figure 6).
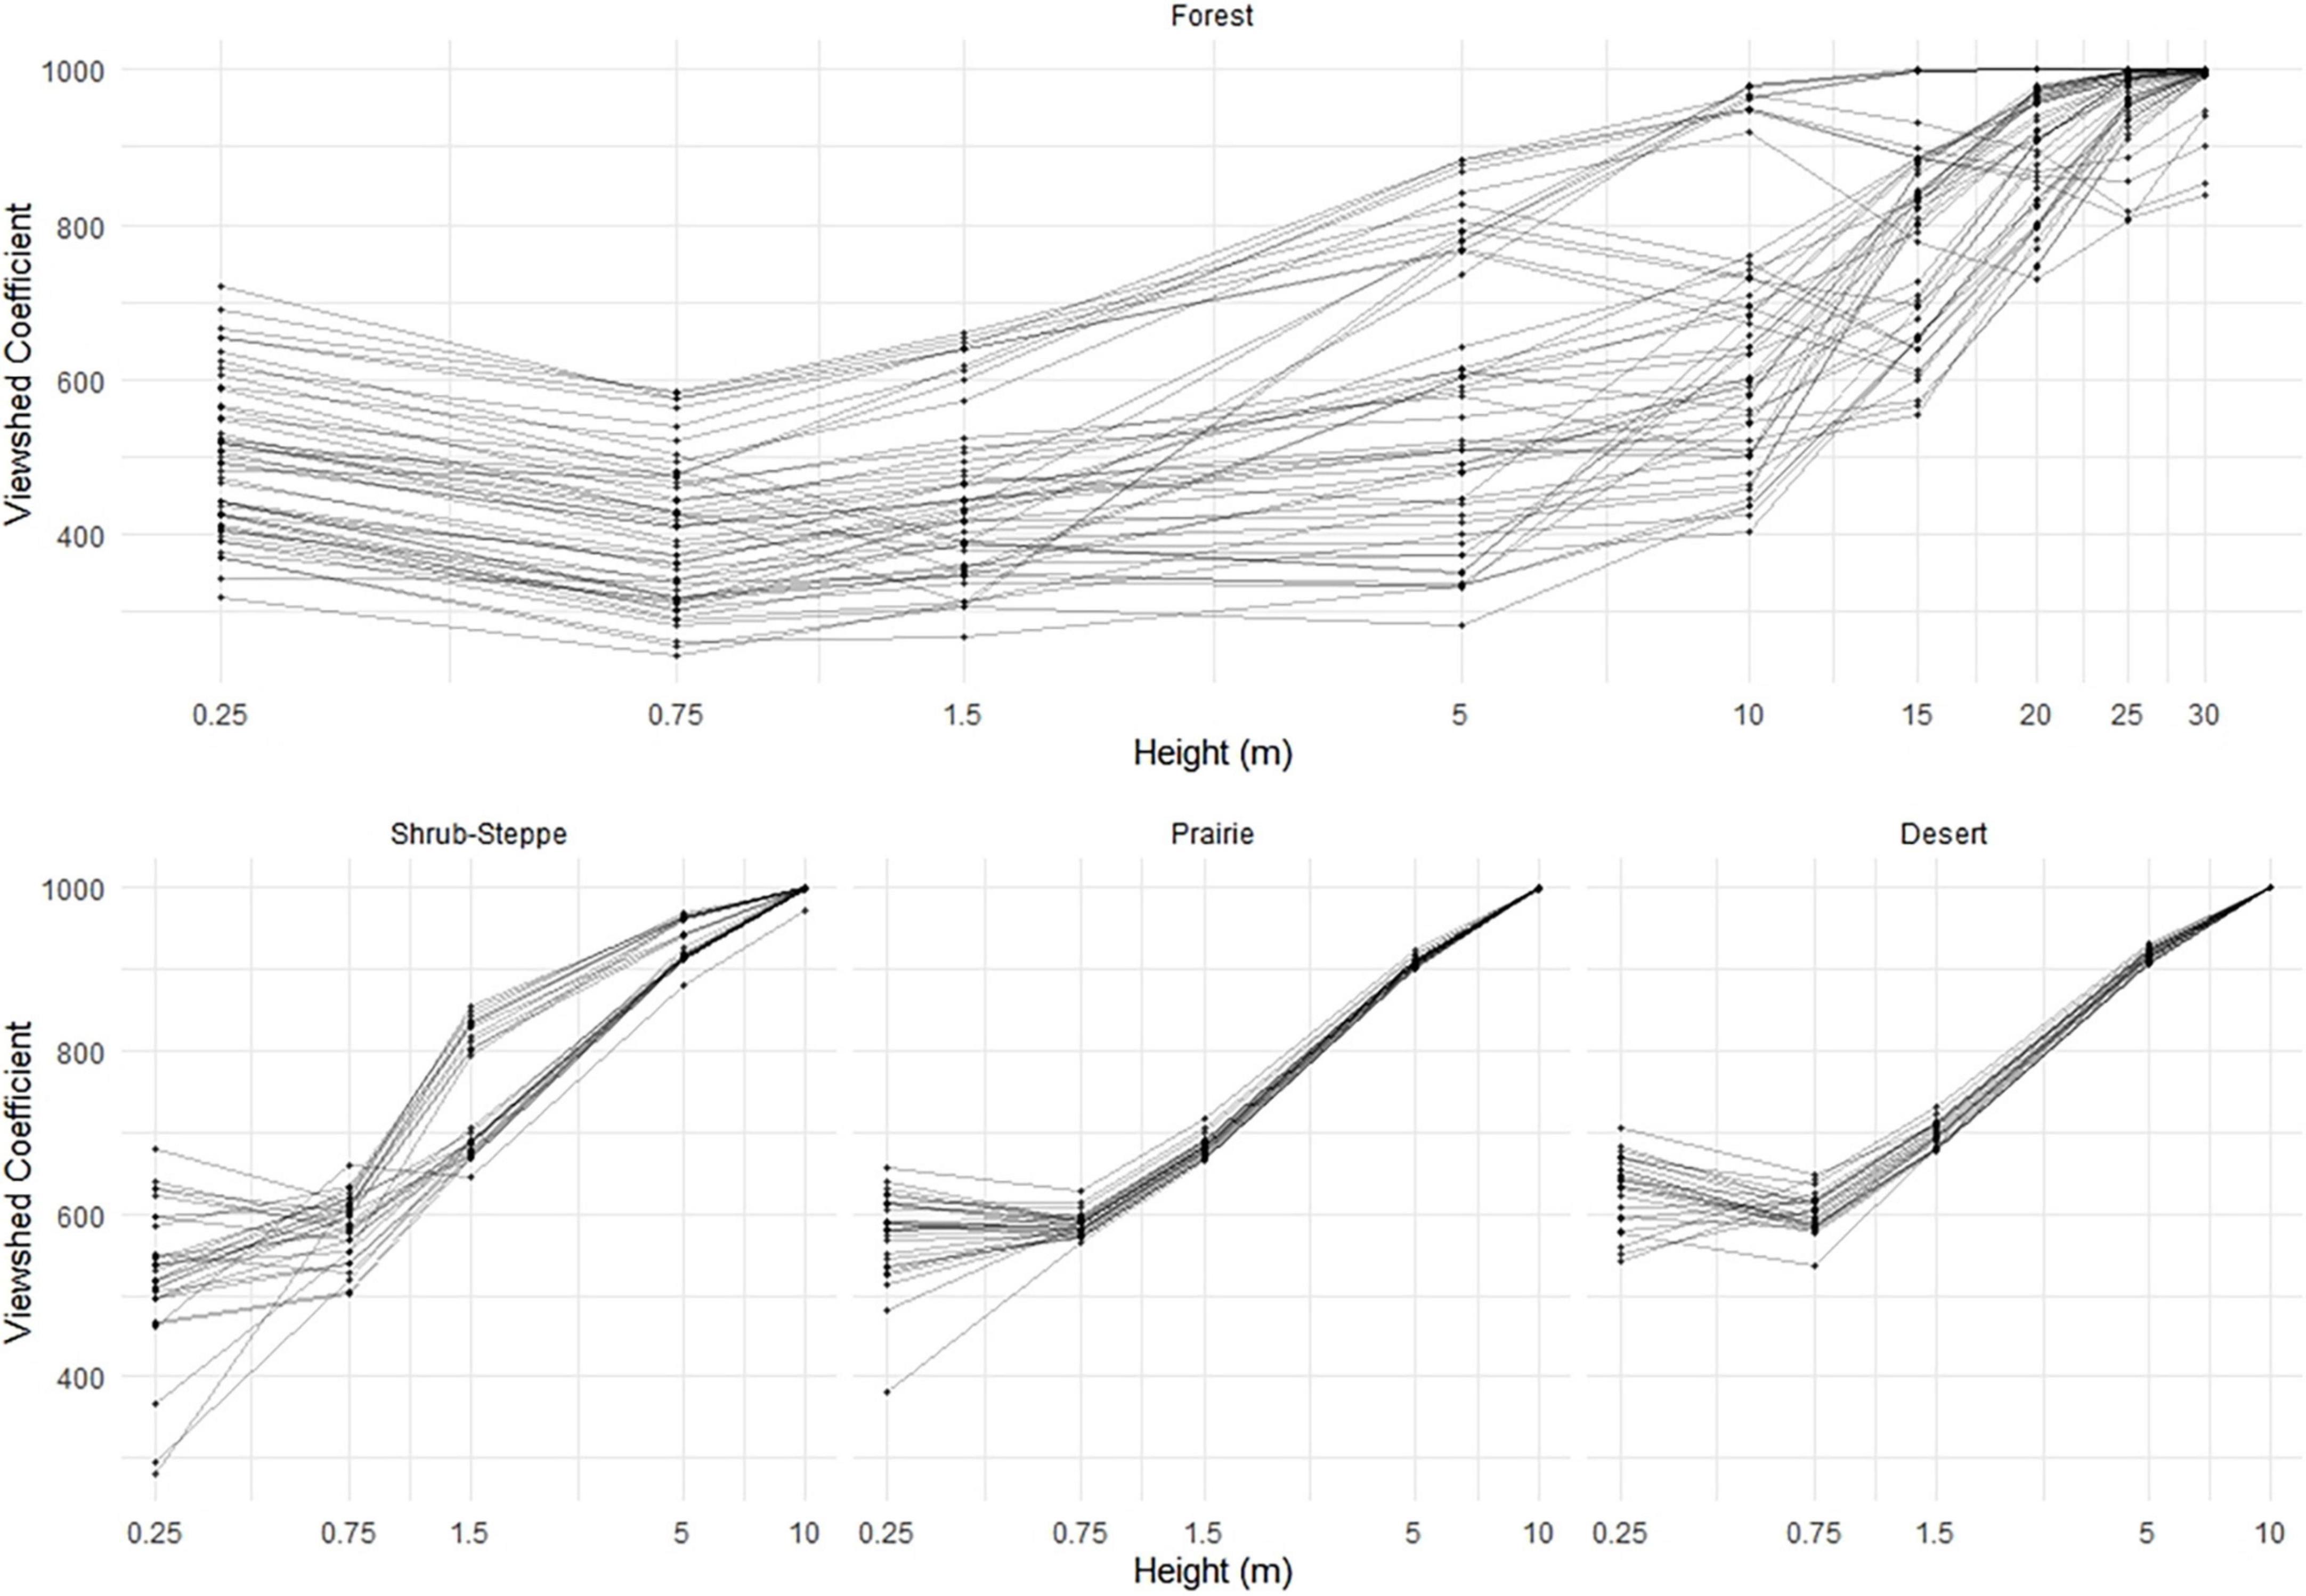
Figure 5. Extent of viewsheds (estimated as the viewshed coefficient, VC) as a function of eye-height across four ecosystems (forest, shrub-steppe, prairie, and desert). Points represent viewsheds at individual vantage points (n = 25–45/plot) within multiple plots per ecosystem (n = 5–10 plots/ecosystem). Note that the x-axis is on a logarithmic scale.
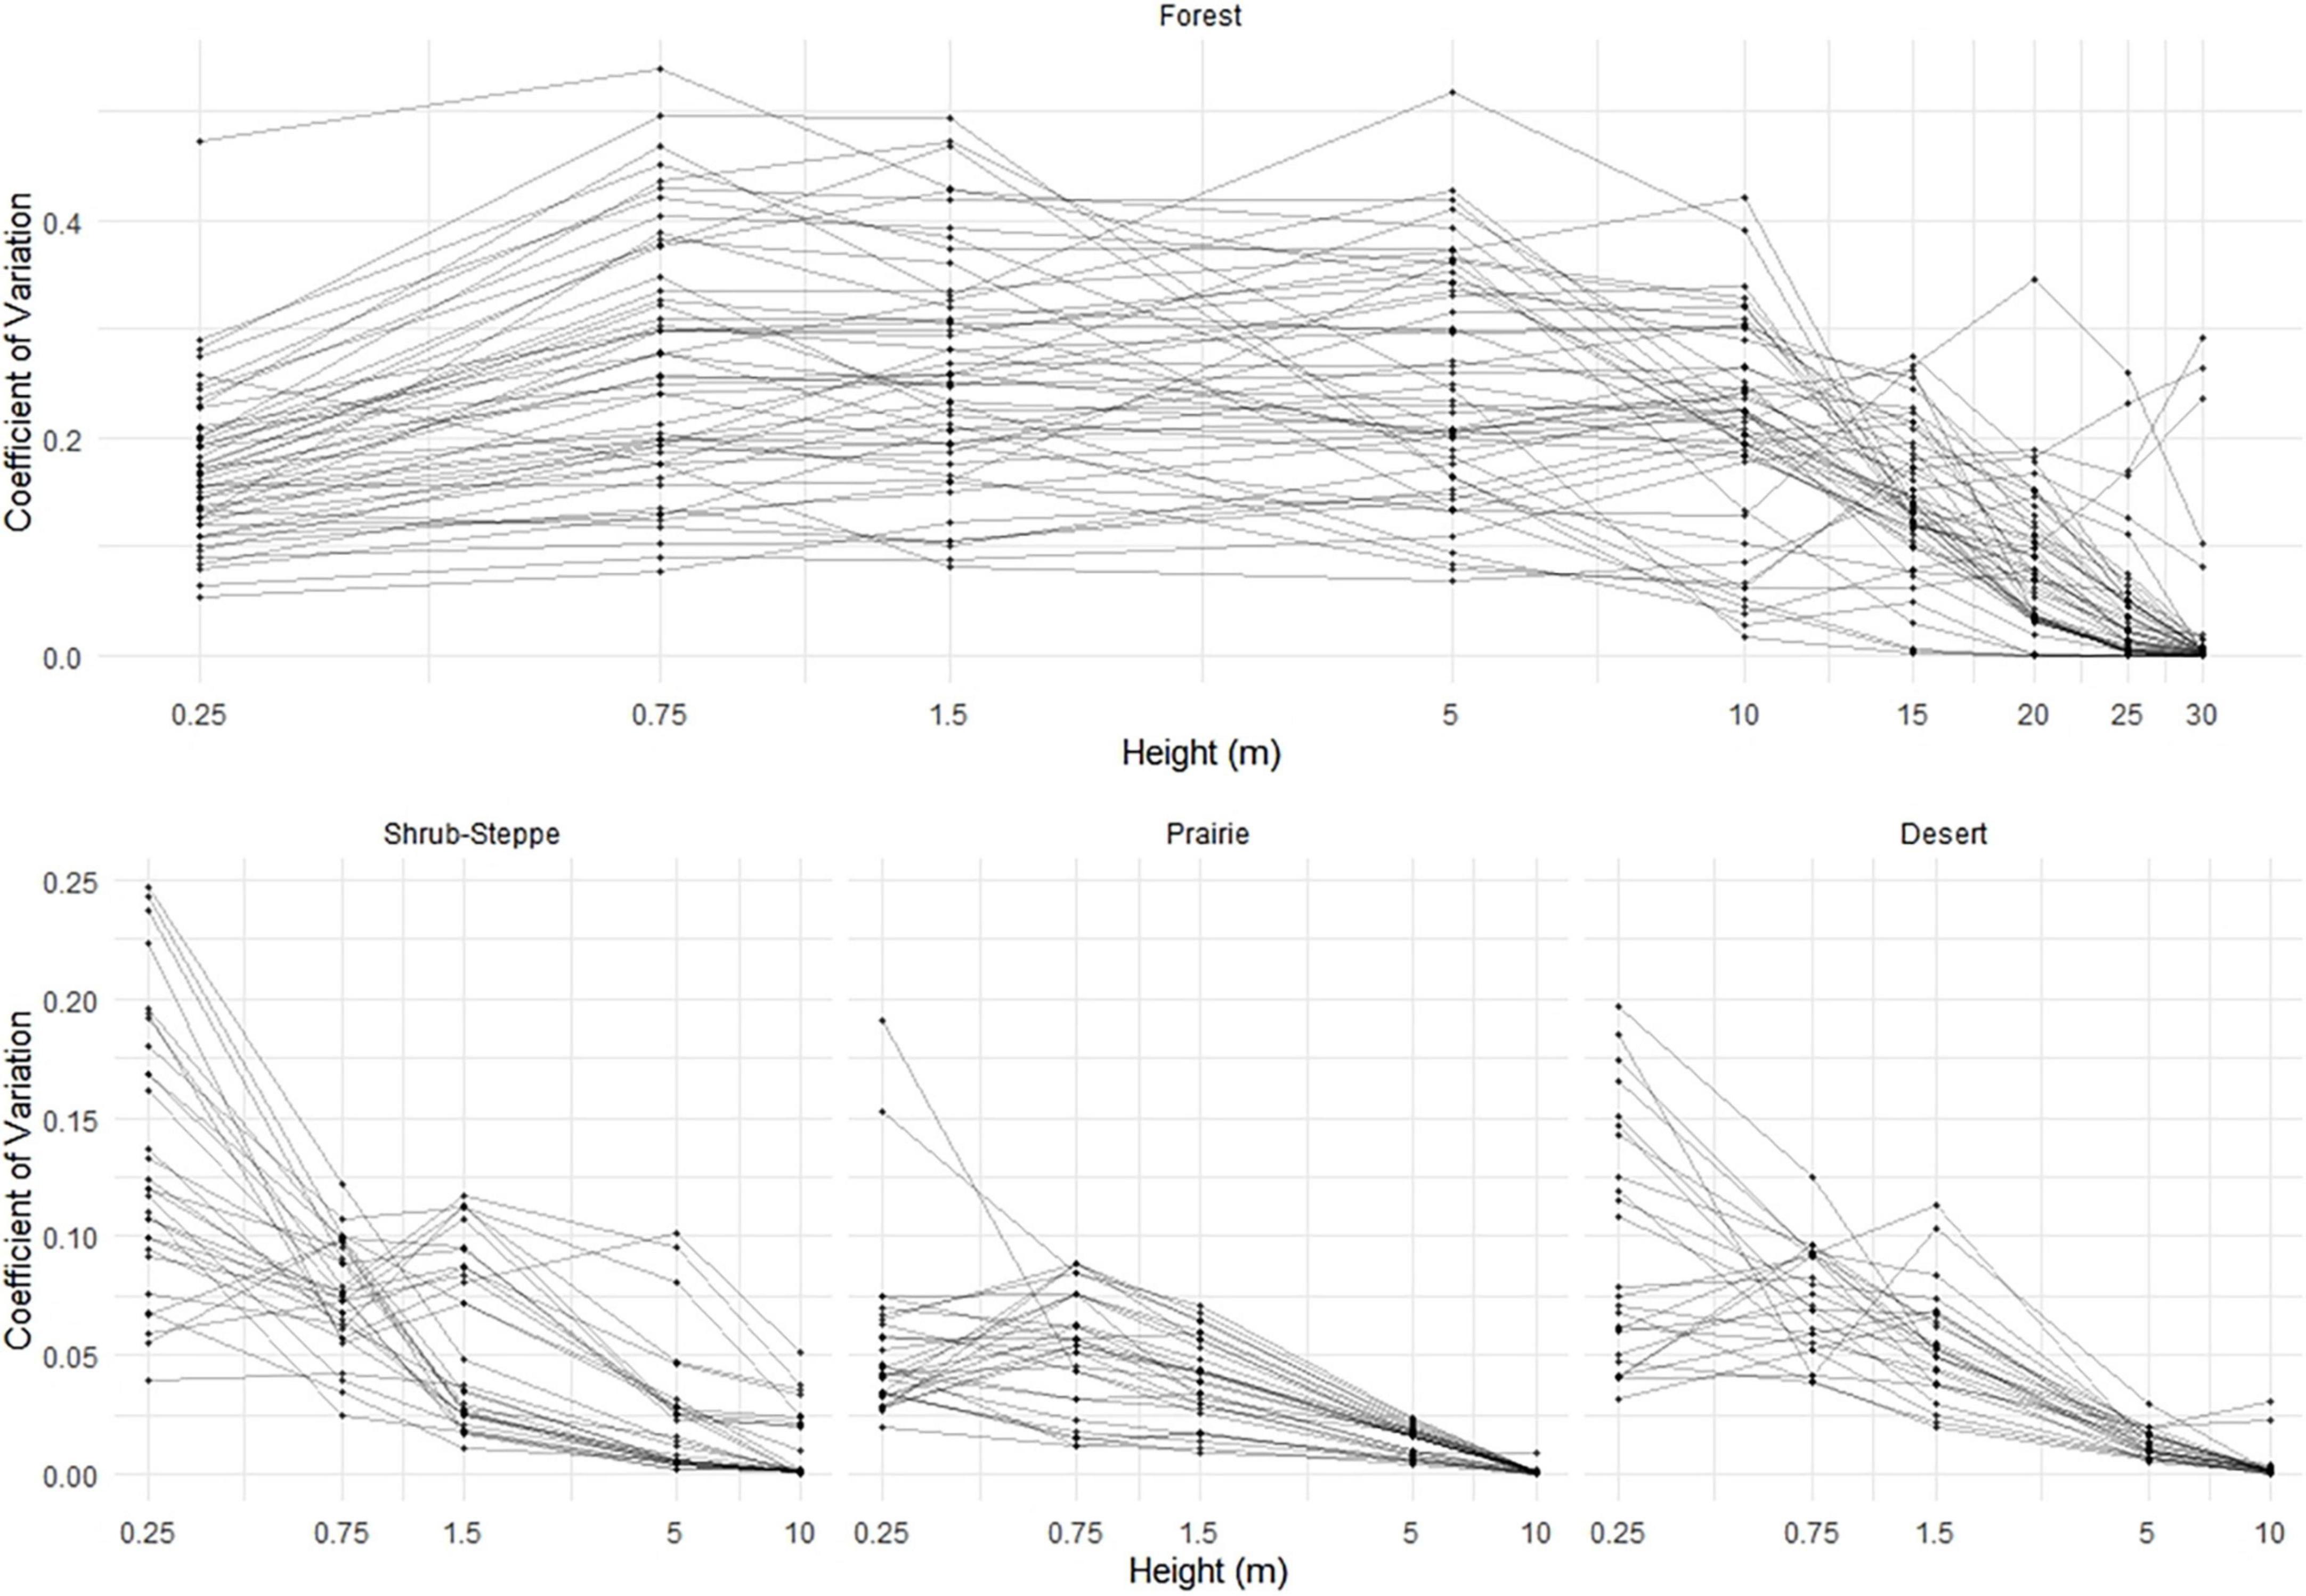
Figure 6. Variability of viewsheds (estimated as the coefficients of variation) as a function of eye-height across four ecosystems (forest, shrub-steppe, prairie, and desert). Points represent viewsheds at individual vantage points (n = 25–45/plot) within multiple plots per ecosystem (n = 5–10 plots/ecosystem). Note that the x-axis is on a logarithmic scale.
Roughness was only a significant predictor in the desert VC model and the shrub-steppe coefficient of variation model. However, we retained it in the models to account for large differences in structure for comparisons between ecosystems (Figure 4). As expected, roughness was highest and most variable in the forest where average roughness was 16.6 ± 7.7 (standard deviation). Roughness was similar in the three low-structure ecosystems (roughnessshrub = 1.6 ± 0.3, roughnessprairie = 1.9 ± 0.1, roughnessdesert = 1.6 ± 0.1).
Our models demonstrate the significant effect that an individual’s vantage point may have on the viewshed in the measured ecosystems. Using estimates from the models, we documented that both viewshed extent and variability differed across eye-heights within each measured ecosystem. In the forest, shrub-steppe, and desert, VC differed significantly across all measured eye-heights, and in the prairie, VC also differed except between the lowest two eye-heights (i.e., at 0.25 and 0.75 m; Supplementary Tables 3, 4). Comparisons of viewshed variability (i.e., coefficient of variation) were significantly different at most eye-heights in the forest (Supplementary Table 5), prairie, and desert, and across all eye-heights in the shrub-steppe (Supplementary Table 6). These results indicate that within the measured ecosystems, movement between vantage points can result in changes in both viewshed extent and composition.
The effects of ecosystem-specific habitat structure on the viewshed were more nuanced than the effects of vantage point. Viewshed extent and variability often, but not always, differed across ecosystems when compared at the same eye-heights. The VCs were significantly different in all pairwise comparisons between the forest and low-structure ecosystems except at 0.25 m (Table 2). Pairwise comparisons among the three low-structure ecosystems followed a similar pattern, however, the prairie—shrub-steppe comparisons only differed significantly at 1.5 m (Table 2). Our results indicate that animals moving between ecosystems with large differences in the amount and type of structure (e.g., between forests and prairies) may encounter viewsheds with very different extents. Coefficients of variation differed significantly at nearly all eye-heights in comparisons between the forest and low-structure ecosystems with exceptions at 0.25 m for the desert and 0.25 and 0.75 m for the prairie (Table 3). The coefficients of variation differed significantly at all eye-heights in the desert—prairie comparison, and at all eye-heights except 0.25 m in the prairie—shrub-steppe comparison. There was no significant difference in coefficients of variation at any eye-height in the desert—shrub-steppe comparison. Differences in the coefficient of variation comparisons across the low-structure ecosystems underscore the influence of diverse habitat structures (Figure 4) on viewsheds.

Table 2. Viewshed coefficients across ecosystems.
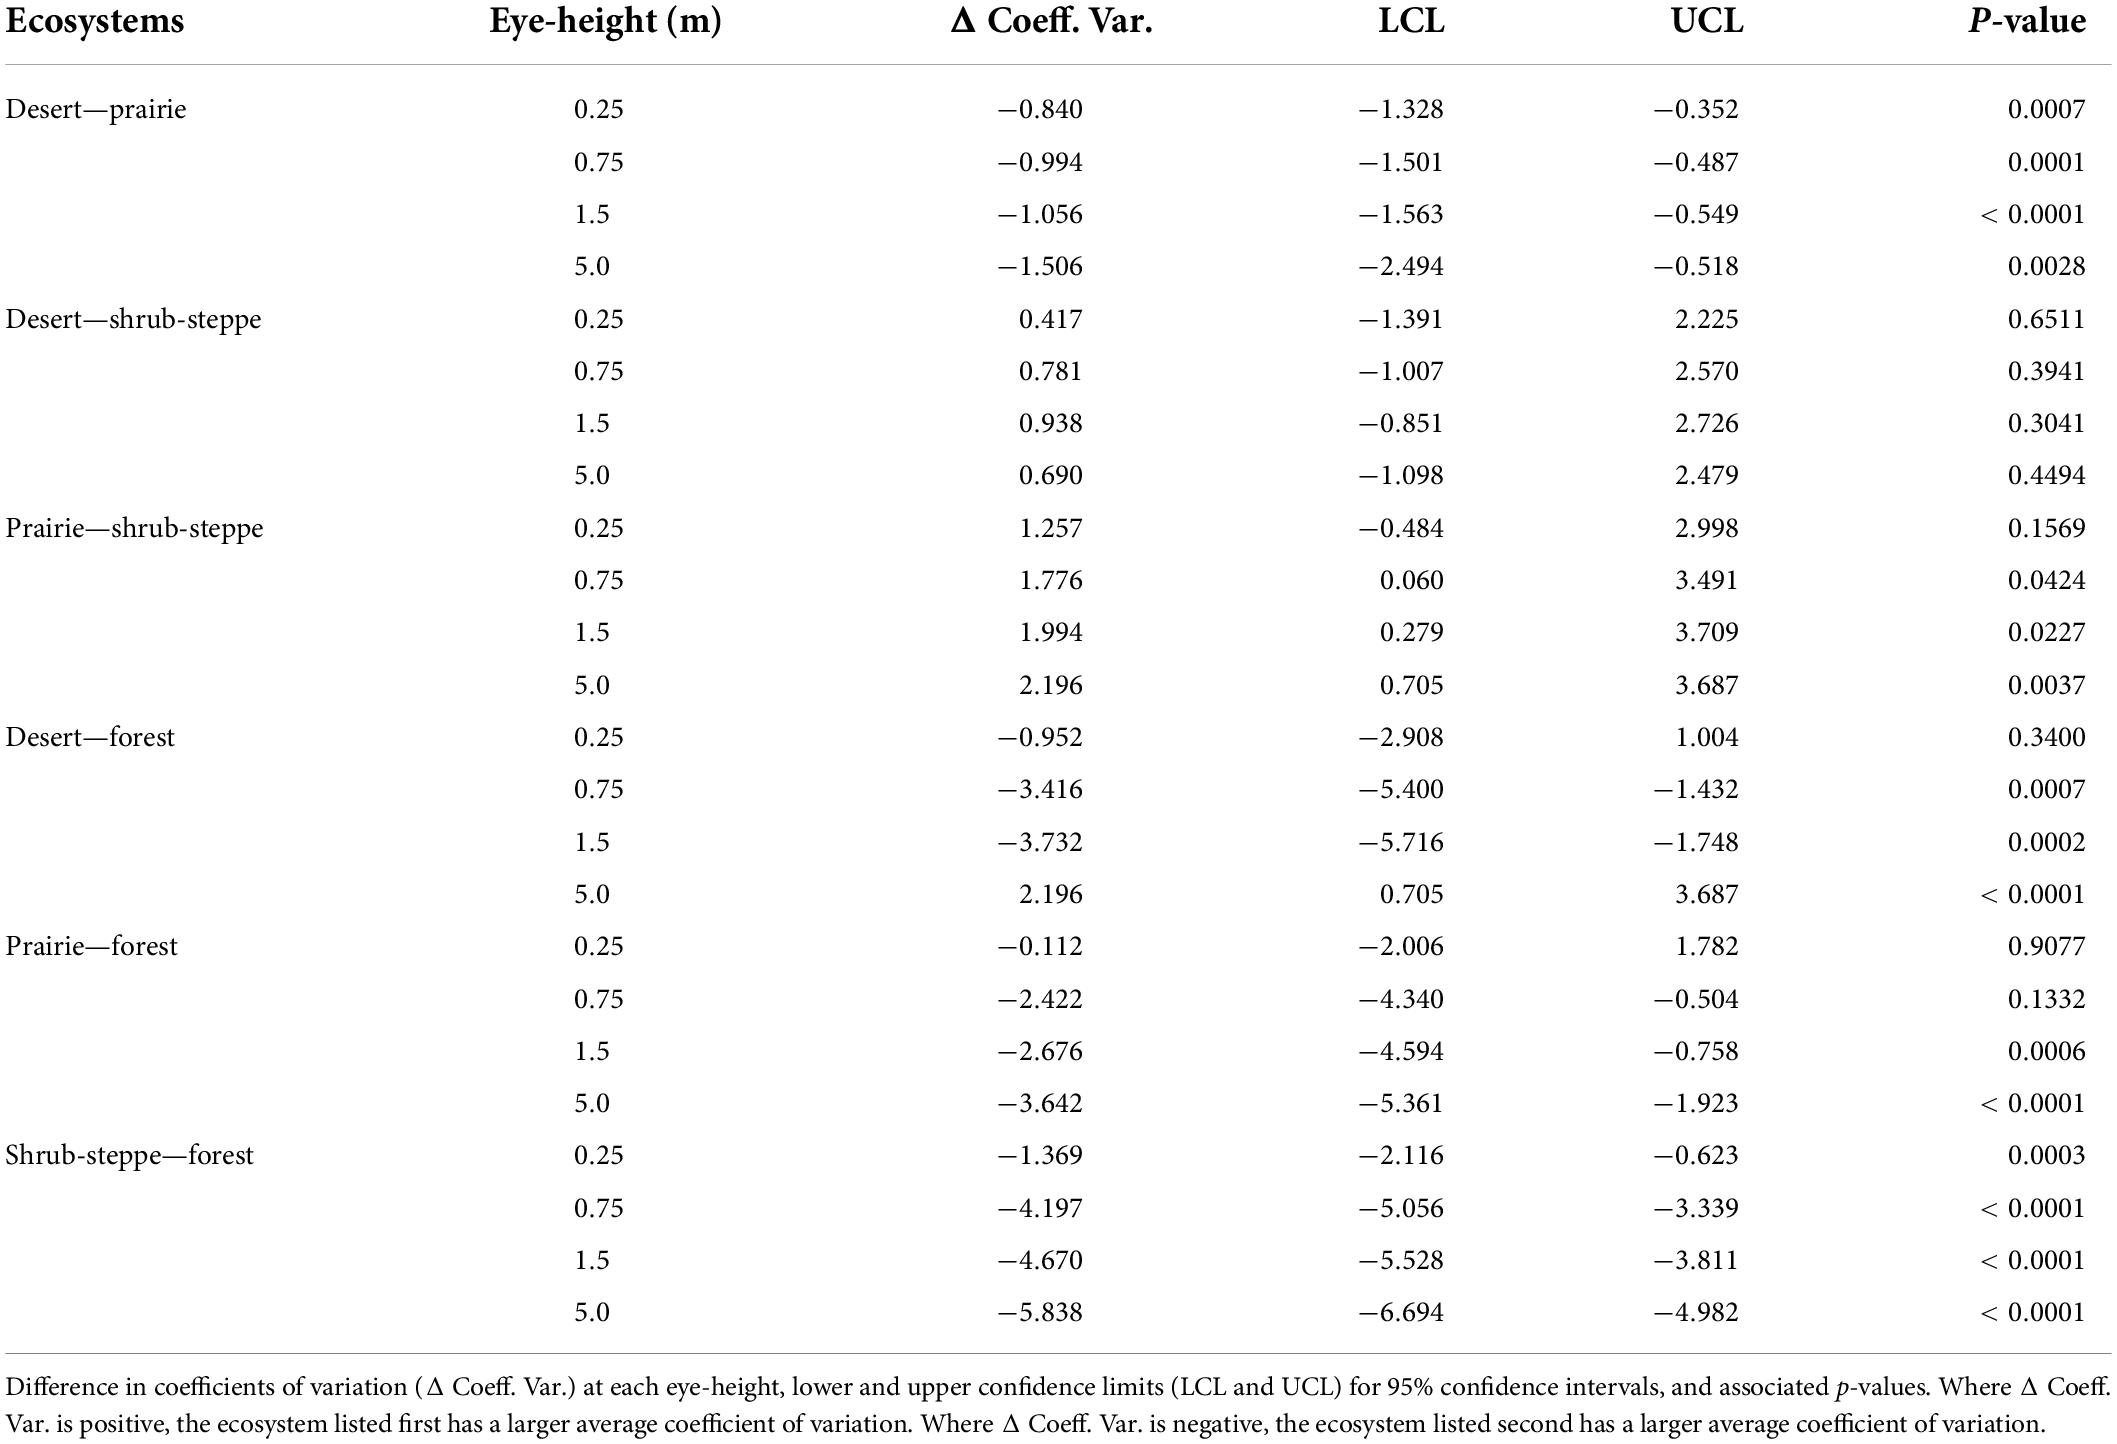
Table 3. Coefficients of variation across ecosystems.
Discussion
Our results clearly demonstrated that both ecosystem-specific habitat structure and physical perspective within that structure can influence the viewshed. Relationships between viewshed extent and variability across eye-heights were consistent in all four ecosystems. Extent of the viewshed generally increased and variability decreased with increasing elevation of vantage points. These patterns were strongly influenced by the occluding vegetation structure and height of the canopy, which was reflected in the contrast between the three low-structure habitats (shrub-steppe, prairie, and desert) and the forest habitat (Figure 4). Increased density and diversity of vegetation in the forest resulted in greater variability in viewsheds at all eye-heights below the tree canopy. These results indicate that both vegetation structure and animal position in a landscape may strongly influence the potential viewshed and consequently the visual cues accessible to individuals.
Although the extent of the viewshed generally increased with increasing eye-height in all ecosystems as expected, this pattern was not uniform. In both the forest and desert ecosystems, VC was larger at 0.25 m than at 0.75 m (Supplementary Table 4). This increased visibility close to the ground may reflect the growth forms of shrubs in these ecosystems (e.g., snowberry in the forest and creosote in the desert) with branches that occlude sightlines at slightly higher eye-heights. In contrast, the VC was significantly smaller at 0.25 m than at 0.75 m in the shrub-steppe site where sagebrush shrubs generally produce branches nearer to the ground. These results demonstrate that perspective, ecosystem-specific structure, and their interactions can influence the extent of viewsheds. It should be noted that a majority of our scans were gathered from above these eye-heights in all ecosystems, and the differences documented in the forest and desert might be partly attributable to occlusion of understory vegetation structure by the mid-level shrub structure. However, such a bias is likely minimal in our samples because of the high point density of our data that clearly identified ground structure under shrubs (Figure 5), the lack of this pattern in the shrub-steppe or prairie, and previous studies that indicate that occlusion effects in terrestrial lidar data in forests occur primarily in the arboreal canopy rather than the understory (Chasmer et al., 2006).
Not only did we find that perspective and vegetation structure influenced extent of the measured viewsheds, but both properties also influenced variability of the viewshed (i.e., coefficient of variation). Generally, as eye-height increased, viewshed variability decreased, particularly in the low-structure ecosystems (Figure 6). However, this pattern was not as consistent in the forest where variability increased from 0.25 to 0.75 m then remained relatively constant across eye-heights until decreasing at vantage points >10 m (Figure 5 and Supplementary Table 2). This zone of relatively high variation in the forest may occur because vegetation from both the understory and overstory occluded sightlines; heterogeneity in either one or both is likely to have a strong influence on variability of the viewshed. Similar to viewshed extent, interactions between perspective and vegetation structure significantly influenced variability of the viewshed. Effects of occlusion due to dense vegetation near the ground in the low-structure ecosystems, and in the highest parts of the arboreal canopy may have influenced these results, although, as with the VC results, the effects of occlusion on variability at the lower eye-heights are likely to be minimal.
Understanding how both viewshed extent and variability differ has important implications for animal ecology. The extent or size of a viewshed provides information about accessibility of visual cues whereas viewshed variability might reveal how other properties associated with 3D habitat structure also influence habitat selection in conjunction with visibility. For instance, selection for concealment (i.e., the property of habitat in which 3D structure hides animals from visual detection by others), might influence an animal’s selection for viewshed variability. Although visibility and concealment often are inversely related, they are not direct opposites, and animals can select for visibility and concealment somewhat independently (Camp et al., 2013). Heterogeneity of 3D structure is likely the primary factor that allows these properties to be decoupled. Thus, selection for viewshed variability may illuminate how animals select for both visibility and concealment simultaneously. We hypothesize that animals with access to vantage points with high variation in both viewshed extent and variability will have greater opportunities to select for visibility within their environments. Although studies have investigated the influence of visibility on medium to large-bodied (Acebes et al., 2013; Riginos, 2015), arboreal (Potash et al., 2019), and aerial species (Eason and Stamps, 2001), our results suggest that small, terrestrial animals may be ideal for studying fine-scale selection for visibility (and other properties of 3D structure) because they appear to have access to relatively large variation in viewsheds, at least in the ecosystems we assessed (Figures 5, 6). Access to vantage points with high variation in viewsheds also may have implications for biodiversity. High variation in accessible viewsheds may provide opportunities for multiple species with diverse visibility requirements to select for visibility relevant to their needs within the same environment. Because 3D structure can strongly influence multiple aspects of animal ecology including predator-prey interactions (Gibson et al., 2018), reproduction (Nenninger and Koper, 2017), foraging (Hesterberg et al., 2017), communication (Menezes and Santos, 2020), and movement patterns (McLean et al., 2016), it also influences biodiversity in terrestrial (MacArthur and MacArthur, 1961) and aquatic ecosystems (Price et al., 2019). Consequently, access to variable viewsheds may be an additional mechanism by which 3D structure influences biodiversity.
Our work has several limitations and opportunities for advancing understanding and measurement of visibility in ecological systems. First, the scope of this study is limited to four sites that represent specific ecosystems in the United States. Although our results may generally apply to other ecosystems with similar vegetation structures, we expect that differences in ecological drivers and vegetation composition will influence viewsheds differently across other systems, even habitats similar to those we measured. Second, although we could capture point clouds defining all vegetation structure in the shrub-steppe, prairie, and desert ecosystems, the upper canopy in the densest forest plots may not be well represented in our lidar data because it was gathered using a terrestrial laser scanner, which is generally most effective at estimation of structure in forests below the canopy (Chasmer et al., 2006; Hilker et al., 2012). Missing data points in the forest canopy may have caused some inaccuracies in viewsheds measured from the highest vantage points. We recommend that researchers focused primarily on those perspectives consider methods that would allow consistent data collection of structure relevant to those perspectives (e.g., UAV lidar). Additionally, as this study was focused on visibility as a property of habitat structure, we did not account for species-specific visual acuity. Researchers interested in estimating realized viewsheds (i.e., viewsheds accessible to animals defined by visual acuity) should consider limiting viewsheds to a distance equivalent to that from which the species of interest can gather visual cues. In this study, the size of the viewsheds was set to the spatial extent of our point clouds. If visual acuity is of interest, point clouds should be gathered over spatial extents that allow estimation of viewsheds applicable to the species of interest. Finally, our study was focused on terrestrial visibility purely as a function of 3D structure, and we did not account for factors other than visual acuity that also could influence access to visual information. For example, in aquatic systems, water quality and penetration of light into water layers influences behavior of aquatic animals (Ranåker et al., 2012; Beltran et al., 2021), and similarly in terrestrial systems, precipitation, fog, or pollution also might limit visibility.
Researchers studying specific species also should account for the ecological and evolutionary relevance of visibility to their species when designing studies. For example, Embar et al. (2011) documented that presence of specific predators influenced whether gerbils (Gerbillus andersoni allenbyi) perceived greater risk when aerial or terrestrial sightlines were blocked; in the presence of terrestrial predators, occlusion of terrestrial sightlines was associated with elevated risk, however, the relationship was reversed in the presence of aerial predators. These results suggest that researchers interested in selection of viewsheds by prey should consider the ecology of the predators. For example, their studies may benefit from segmenting the point clouds latitudinally into aerial and terrestrial viewsheds (a function that is now available in recent updates of viewshed3d) to estimate relevant sightlines. Likewise, specific portions of viewsheds might have ecological significance for detection of resources or communication with conspecifics, and tailoring the approach to the ecology of the specific system is necessary to achieve robust inferences.
Estimation of viewsheds provides an avenue for advancing understanding of the mechanisms by which 3D habitat structure influences the ecology and behavior of animals. Because ecosystem-specific structure significantly influences the viewshed, it may be an evolutionary driver of animal behavior. Snowshoe hares which evolved in and inhabit forest ecosystems, selected for locations with few sightlines but significant structure that aids in escape (Morris and Vijayan, 2018) in contrast to gerbils in a desert ecosystem that perceived greater risk when sightlines were blocked (Embar et al., 2011). Generally, the desert ecosystem in our study provided larger viewsheds with less variation than the forest (Figures 2, 4–6), which might influence evolution of divergent anti-predator strategies. In our prairie site, and likely in most prairies, the primary structure blocking sightlines was created by topographic relief. Terrain also can influence availability of and selection for visibility in shrub-steppe habitats like those in our study; leks of greater sage grouse (Centrocercus urophasianus) were located at sites with enhanced short-range visibility where females could more readily observe potential mates, but leks were characterized by reduced long-range visibility, which could influence detection of predators (Aspbury and Gibson, 2004). Likewise, differences in visibility across ecosystems and perspectives also may shape dynamic habitat use during movement. For example, Aben et al. (2021) reported that visibility influenced where birds flew within 3D space. Visibility afforded as a function of 3D habitat structure may strongly drive the ecology and evolution of animal communication, as well. Habitat structure was a strong evolutionary driver in development of aerial sexual displays in birds; open-habitat passerines had an evolutionary gain of aerial displays six times more frequently than forest passerines (Menezes and Santos, 2020). For example, changes in visibility as a result of 3D structure also can influence use of other communication channels. When visibility was limited by 3D structure and vegetation growth, animals altered the number and acoustic structures of vocal signals (Waser and Waser, 1977; Yahner, 1980; Koda et al., 2008).
Although visibility may strongly influence both terrestrial and aquatic animals, it is not well integrated into studies of animal ecology (Aben et al., 2018). Because visibility can affect multiple aspects of ecology and evolution from resource detection to movement decisions (Table 2), the paucity of studies that integrate visibility as an ecologically relevant factor represents a large gap in the animal ecology literature. However, increasing availability of remotely sensed 3D data products (e.g., lidar, structure from motion) may provide resources for addressing this deficit (e.g., D’Urban Jackson et al., 2020; Lepczyk et al., 2021). To date, the viewshed3d method has only been applied to terrestrial lidar data but may be applicable to point clouds gathered by other remote sensing systems. Additionally, the viewshed3d method is not the only approach to estimating visibility. For example, researches have measured horizontal sightlines from digital surface models derived from airborne lidar data (Davies et al., 2016, 2021). The advantage of the viewshed3d method is its ability to measure sightlines that penetrate gaps in 3D vegetation structure (Lecigne et al., 2020). Our work demonstrates that properties of viewsheds differ among and within landscapes in complex ways, and adds to an emerging understanding of how 3D structure can shape interactions among individuals and between organisms and their environments.
Data availability statement
The original contributions presented in this study are included in the article/Supplementary material and the original full lidar point clouds and code for measuring viewsheds can be found at doi: 10.5061/dryad.bcc2fqzgb.
Author contributions
RS and JR collected the data and led the writing of the manuscript. RS, TJ, BL, and JE analyzed the data. All authors contributed to conceptualization, design, drafts, and gave final approval for publication.
Funding
This research was funded by the NASA Idaho Space Grant Consortium Graduate Student Fellowship and Summer Internship, the Joan Barrett research fund, and a CAREER grant to CM from the National Science Foundation (NSF 1553550), and also funded by the University of Idaho – Open Access Publishing Fund.
Acknowledgments
We thank the Dave Skinner Ecological Preserve and Thorn Creek Native Seed Farm for access to their Palouse Prairie remnants. We thank the University of Idaho and UIEF managers and researchers, particularly Rob Keefe, Ryan Heiderman, and Mark Kimsey, for forest access and assistance with plot selection. Finally, we also thank many undergraduate students who assisted with lidar data collection.
Conflict of interest
All authors declare that the research was conducted in the absence of any commercial or financial relationships that could be construed as a potential conflict of interest.
Publisher’s note
All claims expressed in this article are solely those of the authors and do not necessarily represent those of their affiliated organizations, or those of the publisher, the editors and the reviewers. Any product that may be evaluated in this article, or claim that may be made by its manufacturer, is not guaranteed or endorsed by the publisher.
Supplementary material
The Supplementary Material for this article can be found online at: https://www.frontiersin.org/articles/10.3389/fevo.2022.911051/full#supplementary-material
References
Aben, J., Pellikka, P., and Travis, J. M. J. (2018). A call for viewshed ecology: Advancing our understanding of the ecology of information through viewshed analysis. Methods Ecol. Evol. 9, 624–633. doi: 10.1111/2041-210X.12902
Aben, J., Signer, J., Heiskanen, J., Pellikka, P., and Travis, J. M. J. (2021). What you see is where you go: visibility influences movement decisions of a forest bird navigating a three-dimensional-structured matrix. Biol. Lett. 17:20200478. doi: 10.1098/rsbl.2020.0478rsbl20200478
Acebes, P., Malo, J. E., and Traba, J. (2013). Trade-offs between food availability and predation risk in desert environments: The case of polygynous monomorphic guanaco (Lama guanicoe). J. Arid Environ. 97, 136–142. doi: 10.1016/j.jaridenv.2013.05.017
Adams, B. T., and Matthews, S. N. (2018). Enhancing forest and shrubland mapping in a managed forest landscape with Landsat-LiDAR data fusion. Nat. Areas J. 38, 402–418. doi: 10.3375/043.038.0509
Ahmed, O. S., Franklin, S. E., and Wulder, M. A. (2014). Integration of Lidar and Landsat Data to Estimate Forest Canopy Cover in Coastal British Columbia Photogramm. Eng. Remote Sens. 80, 953–961. doi: 10.14358/PERS.80.10.953
Alonso, J. C., Alvarez-Martínez, J. M., and Palacín, C. (2012). Leks in ground-displaying birds: hotspots or safe places? Behav. Ecol. 23, 491–501. doi: 10.1093/beheco/arr215
Aspbury, A. S., and Gibson, R. M. (2004). Long-range visibility of greater sage grouse leks: a GIS-based analysis. Anim. Behav. 67, 1127–1132. doi: 10.1016/j.anbehav.2003.06.021
Aylor, D. (1972a). Noise reduction by vegetation and ground sound attentuation through trees: Measurements and models. J. Acoust. Soc. Am. 51:1403. doi: 10.1121/1.1912830
Aylor, D. (1972b). Sound transmission through vegetation in relation to leaf area density, leaf width, and breadth of canopy. J. Acoust. Soc. Am. 51:411. doi: 10.1121/1.1912852
Bates, D., Mächler, M., Bolker, B. M., and Walker, S. C. (2015). Fitting linear mixed-effects models using lme4. J. Stat. Softw. 67, 1–48. doi: 10.18637/jss.v067.i01
Beltran, R. S., Kendall-Bar, J. M., Pirotta, E., Adachi, T., Naito, Y., Takahashi, A., et al. (2021). Lightscapes of fear: How mesopredators balance starvation and predation in the open ocean. Sci. Adv. 7:eabd9818. doi: 10.1126/sciadv.abd9818
Camp, M. J., Rachlow, J. L., Woods, B. A., Johnson, T. R., and Shipley, L. A. (2013). Examining functional components of cover: the relationship between concealment and visibility in shrub-steppe habitat. Ecosphere 4, 1–14. doi: 10.1890/ES12-00114.1
Chasmer, L., Hopkinson, C., and Treitz, P. (2006). Investigating laser pulse penetration through a conifer canopy by integrating airborne and terrestrial lidar. Can. J. Remote Sens. 32, 116–125. doi: 10.5589/m06-011
Chen, X. (2019). Application of UAV digital photogrammetry technology in marine topographic surveying and mapping. J. Coast. Res. 104, 674–679. doi: 10.2112/SI93-092.1
Coleman, B. T., and Hill, R. A. (2014). Living in a landscape of fear: the impact of predation, resource availability and habitat structure on primate range use. Anim. Behav. 88, 165–173. doi: 10.1016/j.anbehav.2013.11.027
Daniel, J., and Koper, N. (2019). Cumulative impacts of roads and energy infrastructure on grassland songbirds. Condor 121, 1–21. doi: 10.1093/condor/duz011
Davies, A. B., and Asner, G. P. (2014). Advances in animal ecology from 3D-LiDAR ecosystem mapping. Trends Ecol. Evol. 29, 681–691. doi: 10.1016/j.tree.2014.10.005
Davies, A. B., Tambling, C. J., Kerley, G. I. H., and Asner, G. P. (2016). Effects of vegetation structure on the location of lion kill sites in African thicket. PLoS One 11:e0149098. doi: 10.1371/journal.pone.0149098
Davies, A. B., Tambling, C. J., Marneweck, D. G., Ranc, N., Druce, D. J., Cromsigt, J. P. G. M., et al. (2021). Spatial heterogeneity facilitates carnivore coexistence. Ecology 102, 1–13. doi: 10.1002/ecy.3319
Detto, T. (2007). The fiddler crab Uca mjoebergi uses colour vision in mate choice. Proc. R. Soc. London B 274, 2785–2790. doi: 10.1098/rspb.2007.1059
Dokter, A. M., Åkesson, S., Beekhuis, H., Bouten, W., Buurma, L., van Gasteren, H., et al. (2013). Twilight ascents by common swifts, Apus apus, at dawn and dusk: acquisition of orientation cues? Anim. Behav. 85, 545–552. doi: 10.1016/J.ANBEHAV.2012.12.006
D’Urban Jackson, T., Williams, G. J., Walker-Springett, G., and Davies, A. J. (2020). Three-dimensional digital mapping of ecosystems: A new era in spatial ecology. Proc. R. Soc. B 287:20192383. doi: 10.1098/rspb.2019.2383
Eason, P. K., and Stamps, J. A. (1992). The effect of visibility on territory size and shape. Behav. Ecol. 3, 166–172. doi: 10.1093/beheco/3.2.166
Eason, P. K., and Stamps, J. A. (2001). The effect of visibility and space use on territorial red-capped cardinals. Behaviour 138, 19–30. doi: 10.1163/156853901750077763
Embar, K., Kotler, B. P., and Mukherjee, S. (2011). Risk management in optimal foragers: the effect of sightlines and predator type on patch use, time allocation, and vigilance in gerbils. Oikos 120, 1657–1666. doi: 10.1111/j.1600-0706.2011.19278.x
Ewald, P. W., Hunt, G. L. Jr., and Warner, M. (1980). Territory size in western gulls: Importance of intrusion pressure, defense investments and vegetation structure. Ecology 61, 80–87.
Gibson, D., Blomberg, E. J., Atamian, M. T., Espinosa, S. P., and Sedinger, J. S. (2018). Effects of power lines on habitat use and demography of greater sage-grouse (Centrocercus urophasianus). Wildl. Monogr. 200, 1–41. doi: 10.2307/26612956
Gibson, J. J. (1979). The Ecological Approach to Visual Perception. Boston: Houghton Mifflin, doi: 10.4324/9781315740218
Graf, R. F., Kramer-Schadt, S., Fernández, N., and Grimm, V. (2007). What you see is where you go? Modeling dispersal in mountainous landscapes. Landsc. Ecol. 22, 853–866. doi: 10.1007/s10980-006-9073-3
Haans, A., and de Kort, Y. A. W. (2012). Light distribution in dynamic street lighting: Two experimental studies on its effects on perceived safety, prospect, concealment, and escape. J. Environ. Psychol. 32, 342–352. doi: 10.1016/j.jenvp.2012.05.006
Hesterberg, S. G., Cole Duckett, C., Salewski, E. A., and Bell, S. S. (2017). Three-dimensional interstitial space mediates predator foraging success in different spatial arrangements. Bell Source Ecol. 98, 1153–1162. doi: 10.1002/ecy.1762
Hilker, T., Coops, N. C., Newnham, G. J., van Leeuwen, M., Wulder, M. A., Stewart, J., et al. (2012). Comparison of terrestrial and airborne LiDAR in describing stand structure of a thinned lodgepole pine forest. J. Forest. Washington 110, 97–104. doi: 10.5849/jof.11-003
Irish, J. L., and Lillycrop, W. J. (1999). Scanning laser mapping of the coastal zone: the SHOALS system. ISPRS 54, 123–129. doi: 10.1016/S0924-2716(99)00003-9
Johnson, T. (2021). trtools: Miscellaneous Tools for Teaching Statistics. Available online at: http://github.com/trobinj/trtools (accessed September 26, 2021).
Koda, H., Shimooka, Y., and Sugiura, H. (2008). Effects of caller activity and habitat visibility on contact call rate of wild Japanese macaques (Macaca fuscata). Am. J. Primatol. 70, 1055–1063. doi: 10.1002/ajp.20597
Lecigne, B., Eitel, J. U. H., and Rachlow, J. L. (2020). viewshed3d: An r package for quantifying 3D visibility using terrestrial lidar data. Methods Ecol. Evol. 11, 733–738. doi: 10.1111/2041-210X.13385
Length, R. V. (2021). emmeans: Estimated Marginal Leans, Aka Least-Squares Means. Available online at: https://cran.r-project.org/package=emmeans (accessed September 26, 2021).
Lepczyk, C. A., Wedding, L. M., Asner, G. P., Pittman, S. J., Goulden, T., Linderman, M. A., et al. (2021). Advancing landscape and seascape ecology from a 2D to a 3D science. Bioscience 71, 596–608. doi: 10.1093/biosci/biab001
Loarie, S. R., Tambling, C. J., and Asner, G. P. (2013). Lion hunting behaviour and vegetation structure in an African savanna. Anim. Behav. 85, 899–906. doi: 10.1016/j.anbehav.2013.01.018
Lochhead, I., and Hedley, N. (2021). Dry-lab benchmarking of a structure from motion workflow designed to monitor marine benthos in three dimensions. Photogramm. Rec. 36, 224–251. doi: 10.1111/PHOR.12370
Loewen, L. J., Steel, G. D., and Suedfeld, P. (1993). Perceived safety from crime in the urban environment. J. Environ. Psychol. 13, 323–331. doi: 10.1016/S0272-4944(05)80254-3
MacArthur, R. H., and MacArthur, J. W. (1961). On bird species diversity. Ecology 42, 594–598. doi: 10.2307/1932254
McLean, K. A., Trainor, A. M., Asner, G. P., Crofoot, M. C., Hopkins, M. E., Campbell, C. J., et al. (2016). Movement patterns of three arboreal primates in a Neotropical moist forest explained by LiDAR-estimated canopy structure. Landsc. Ecol. 31, 1849–1862. doi: 10.1007/s10980-016-0367-9
McNamara, J. M., and Dall, S. R. X. (2010). Information is a fitness enhancing resource. Oikos 119, 231–236. doi: 10.1111/J.1600-0706.2009.17509.X
Menezes, J. C. T., and Santos, E. S. A. (2020). Habitat structure drives the evolution of aerial displays in birds. J. Anim. Ecol. 89, 482–493. doi: 10.1111/1365-2656.13132
Morris, D. W., and Vijayan, S. (2018). Trade-offs between sight lines and escape habitat determine spatial strategies of risk management by a keystone herbivore. Facets 3, 338–357. doi: 10.1139/facets-2016-0062
Munoz, N. E., and Blumstein, D. T. (2012). Multisensory perception in uncertain environments. Behav. Ecol. 23, 457–462. doi: 10.1093/beheco/arr220
Nenninger, H. R., and Koper, N. (2017). Effects of conventional oil wells on grassland songbird abundance are caused by presence of infrastructure, not noise. Biol. Conserv. 218, 124–133. doi: 10.1016/j.biocon.2017.11.014
NOAA (2021). National Weather Service: Climate. Available online at: https://www.weather.gov/wrh/climate (accessed October 25, 2021).
Olsoy, P. J., Forbey, J. S., Rachlow, J. L., Nobler, J. D., Glenn, N. F., and Shipley, L. A. (2015). Fearscapes: Mappingfunctional properties of cover for prey with terrestrial LiDAR. Bioscience 65, 74–80. doi: 10.1093/biosci/biu189
Parsons, B. M., Coops, N. C., Kearney, S. P., Burton, A. C., Nelson, T. A., and Stenhouse, G. B. (2021). Road visibility influences habitat selection by grizzly bears (Ursus arctos horribilis). Can. J. Zool. 99, 161–171. doi: 10.1139/cjz-2020-0125
Pinheiro, J., Bates, D., DebRoy, S., and Sarkar, D. (2020). nlme: Linear and nonlinear mixed effects models. Austria: R Core Team.
Potash, A. D., Conner, L. M., and Mccleery, R. A. (2019). Vertical and horizontal vegetation cover synergistically shape prey behaviour. Anim. Behav. 152, 39–44. doi: 10.1016/j.anbehav.2019.04.007
Potier, S., Bonadonna, F., Kelber, A., Martin, G. R., Isard, P.-F., Dulaurent, T., et al. (2016). Visual abilities in two raptors with different ecology. J. Exp. Biol. 219, 2639–2649. doi: 10.1242/jeb.142083
Price, D. M., Robert, K., Callaway, A., Lo lacono, C., Hall, R. A., and Huvenne, V. A. I. (2019). Using 3D photogrammetry from ROV video to quantify cold-water coral reef structural complexity and investigate its influence on biodiversity and community assemblage. Coral Reefs 38, 1007–1021. doi: 10.1007/s00338-019-01827-3
Ranåker, L., Jönsson, M., Nilsson, P. A., and Brönmark, C. (2012). Effects of brown and turbid water on piscivore–prey fish interactions along a visibility gradient. Freshw. Biol. 57, 1761–1768. doi: 10.1111/J.1365-2427.2012.02836.X
Riginos, C. (2015). Climate and the landscape of fear in an African savanna. J. Anim. Ecol. 84, 124–133. doi: 10.1111/1365-2656.12262
Riginos, C., and Grace, J. B. (2008). Savanna tree density, herbivores, and the herbaceous community: Bottom-up vs. top-down effects. Ecology 89, 2228–2238. doi: 10.1890/07-1250.1
Roussel, J. R., Auty, D., Coops, N. C., Tompalski, P., Goodbody, T. R. H., Meador, A. S., et al. (2020). lidR: An R package for analysis of airborne laser scanning (ALS) data. Remote Sens. Environ. 251:112061. doi: 10.1016/j.rse.2020.112061
Van der Zande, D., Hoet, W., Jonckheere, I., van Aardt, J., and Coppin, P. (2006). Influence of measurement set-up of ground-based LiDAR for derivation of tree structure. Agric. Meteorol. 141, 147–160. doi: 10.1016/j.agrformet.2006.09.007
Waser, P. M., and Waser, M. (1977). Experimental studies of primate vocalization: Specializations for long-distance propagation. Z. Tierpsychol. 43, 239–263. doi: 10.1111/j.1439-0310.1977.tb00073.x
White, C. R., Day, N., Butler, P. J., and Martin, G. R. (2007). Vision and foraging in cormorants: More like herons than hawks? PLoS One 2:e639. doi: 10.1371/journal.pone.0000639
Yahner, R. H. (1980). Barking in a primitive ungulate, Muntiacus reevesi: Function and adaptiveness. Am. Nat. 116, 157–177. doi: 10.1086/283620
Keywords: 3D structure, habitat, sensory ecology, terrestrial lidar, viewshed, viewshed3d, visibility
Citation: Stein RM, Lecigne B, Eitel JUH, Johnson TR, McGowan C and Rachlow JL (2022) Vegetation and vantage point influence visibility across diverse ecosystems: Implications for animal ecology. Front. Ecol. Evol. 10:911051. doi: 10.3389/fevo.2022.911051
Received: 01 April 2022; Accepted: 29 July 2022;
Published: 24 August 2022.
Edited by:
Luís Borda-de-Água, Centro de Investigação em Biodiversidade e Recursos Genéticos (CIBIO-InBIO), PortugalReviewed by:
Susana Varela, Gulbenkian Institute of Science (IGC), PortugalEdward James Raynor, Agricultural Research Service (USDA), United States
Copyright © 2022 Stein, Lecigne, Eitel, Johnson, McGowan and Rachlow. This is an open-access article distributed under the terms of the Creative Commons Attribution License (CC BY). The use, distribution or reproduction in other forums is permitted, provided the original author(s) and the copyright owner(s) are credited and that the original publication in this journal is cited, in accordance with accepted academic practice. No use, distribution or reproduction is permitted which does not comply with these terms.
*Correspondence: Rachel M. Stein, cnN0ZWluQHVpZGFoby5lZHU=
†Present address: Bastien Lecigne, Jakarto Cartographie 3D Inc., Montreal, QC, Canada