- 1Department of Plant Medicals, Andong National University, Andong, South Korea
- 2Agriculture Science and Technology Research Institute, Andong National University, Andong, South Korea
- 3Department of Plant Protection, Faculty of Agriculture, Varamin-Pishva Branch, Islamic Azad University, Varamin, Iran
Nutritional stress is one of the major factors affecting the health of honey bees. Supplementing the pollen patty with microalgae enhances the protein content of the patty and therefore is supposed to improve bee’s health. The objective of the present study was to investigate the effect of Chlorella as a dietary supplement on the health and physiology of the honey bee (Apis mellifera). We formulated the honey bee feed by supplementing Chlorella sorokiniana, obtained commercially, with commercially available rapeseed pollen patty in different amounts—0.5, 2, 5, and 10%, and the treatment groups were named P0.5, P2, P5, and P10, respectively. Pollen patty was set as a positive control and only 50% sucrose solution (no protein) was set as a negative control. Diets were supplied ad libitum to newly emerged workers in cages; food consumption patterns; longevity; and physiology including the development of the brain in terms of protein (i.e., total amino acids), thorax muscle, fat body mass, and glands (hypopharyngeal and venom); and gene expression of nutrition-related gene vitellogenin (Vg) of honey bee at different points of time of their age were observed. The addition of Chlorella significantly increased the food consumption pattern, longevity, gland development, muscle formation, and Vg gene expression significantly in comparison to only a pollen or sugar diet. However, the response varied depending on the level of Chlorella supplementation. As depicted in most of the cases, P2, that is, the pollen diet with 2% of Chlorella supplement exhibited the best outcome in terms of all the tested parameters. Therefore, based on the results obtained in the present study, we concluded that 2% Chlorella supplementation to pollen patty could enhance the health of honey bees, which in turn improves their performance.
Introduction
Nutritional stress is one of the major factors affecting the health of honey bees. Limited intake of adequate nutrition due to habitat depletion and intensive agriculture resulting in malnutrition often amplifies the detrimental effect of parasites, pathogens, and pesticides on honey bees’ physiology, immunity, and longevity (Naug and Gibbs, 2009; van Engelsdorp et al., 2009; DeGrandi-Hoffman et al., 2010). To overcome the problem of nutritional stress, beekeepers increasingly depend on “pollen patty” to meet the nutritional requirements, particularly in the dearth period and the onset of spring (Ghosh and Jung, 2020). Ingredients such as soy powder and casein are generally used in the preparation of the pollen substitute feed for honey bees. However, pollen supplement diets are usually more acceptable presumably because of the presence of bio-stimulant compounds in pollen which is the primary component of the pollen supplement patties (Standifer and Mills, 1977). Recently, microalgae—an emerging food resource for insects, livestock, and humans (Madeira et al., 2017; Caporgno and Mathys, 2018; Qiu et al., 2019; Nagarajan et al., 2021)—are also receiving attention as an ingredient for honey bee’s nourishment because of their similar chemical composition, especially of protein and amino acids, if not superior, to bee pollen and incredible potential for biomass production (Ricigliano, 2020).
Nectar and pollen are the primary food sources of honey bees. Forager bees specialize in collecting either nectar or pollen (Arenas and Kohlmaier, 2019). Nectar is the major source of carbohydrates and also provides amino acids, antioxidants, and secondary metabolites (Baker, 1977). Pollen, on the other hand, is the source of protein, lipid, sterols, vitamins, and minerals (Keller et al., 2005). The quality and intake of pollen can show different life spans of honey bees (Schmidt et al., 1987). Low-quality pollen hinders the development of hypopharyngeal glands, which can reduce the growth of queens and larvae because of reduced royal jelly production (Brodschneider and Crailsheim, 2010). Pollen is involved in the expression of vitellogenin (Vg) synthesized in the fat body of honey bees (Wegener et al., 2018), which affects fecundity, life span, immune function, and wintering (da Silva, 2019). Even the protein of pollen is necessary for the production of venom (Lauter and Vrla, 1939; Omar et al., 2017), which is used for colony defense against predators and intruders (Schmidt, 1995; Danneels et al., 2015). Therefore, like for other animals, protein is an essential nutrient involved in key physiological processes of honey bees and is crucial for feed preference and foraging decision-making (Hendriksma et al., 2019b; Ghosh et al., 2020; Ghosh and Jung, 2022). Supplementing the pollen patty with microalgae enhances the protein content of the patty and therefore is supposed to improve bee health. Although a few studies investigated the effect of microalgae as a honey bee feed and indicated the positive effect of Chlorella (Jehlík et al., 2019; Dostálková et al., 2021), information is insufficient and fragmentary. The effect of Chlorella on the health of the honey bee on an individual basis is largely unknown. The objective of the present study was to evaluate the effects of Chlorella-supplemented patty on the food consumption pattern, longevity, and physiology including the development of the brain in terms of protein, thorax muscle, fat body mass, and glands (hypopharyngeal and venom), and gene expression of nutrition-related gene Vg of honey bee at different points of time of their age.
Materials and methods
Chlorella identification
Commercially available Chlorella powder was obtained from the market (Daesang, Seoul, South Korea). Chlorella was identified using the DNA barcoding technique (Yun et al., 2020). The total DNA from the Chlorella sample was extracted using the DNeasy Plant Mini Kit following the manufacturer’s protocol (QIAGEN Inc., Dusseldorf, Germany). Marker genes such as internal transcribed spacer (ITS) regions ITS1-F (5′–TCCGTAGGTGAACCTGCGG– 3′) and ITS4-R (5′–TCCTCCGCTTATTGATATGC– 3′) and ribulose bisphosphate carboxylase (rbcL) F-rbcL-M375 (5′–TTTGGTTTCAAAGCIYTWCGTGC–3′) and R-rbcL-1089 (5′–ATACCACGRCTACGRTCTTT– 3′) were amplified by polymerase chain reaction (PCR), which was conducted using the AccuPower PCR Premix (Bioneer, Daejeon, South Korea). PCR was conducted using the following procedure: Pre-denaturation for 5 min at 95°C, 35 cycles of denaturation for 30 s at 95°C, annealing for 30 s at 48°C (for both rbcL and ITS), and extension for 1 min at 72°C, and the final extension for 5 min at 72°C. Sequencing was performed commercially by Macrogen (Seoul, South Korea). All the sequences were generated in both directions and assembled using BioEdit v7.0.5.2 (Hall, 1999), and annotated at species level identification using the Basic Local Alignment Search Tool (BLAST) database of the National Center for Biotechnology Information (NCBI) (accessed on 31 August 2019).1 Based on the similarity (in%), the specimens were identified.
Chlorella and rapeseed pollen patty and its nutritional contents
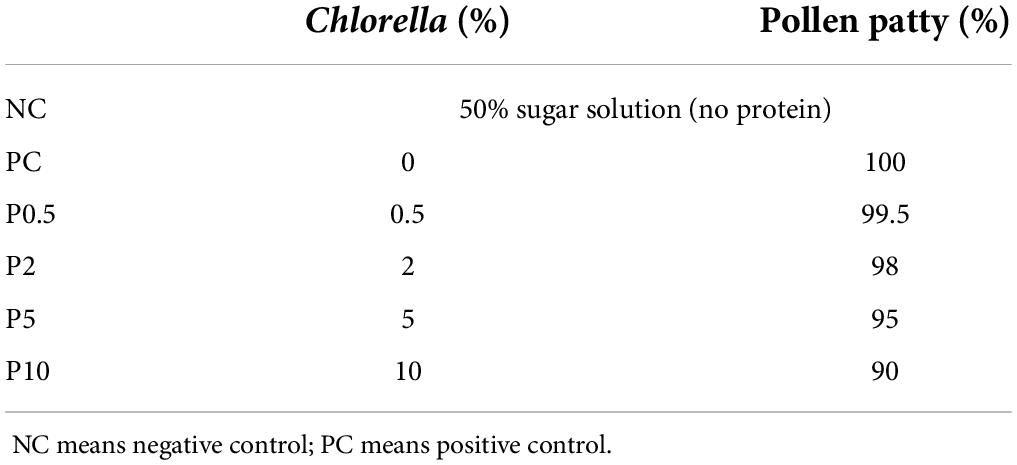
Treatments in this study included the addition of 0.5, 2, 5, and 10% of Chlorella to commercially available rapeseed pollen patty from the local commercial beekeeping store at Yongsang (Andong, South Korea). The patty was prepared with rapeseed bee pollen, soybean powder, sucrose, and yeast. Only the pollen patty without Chlorella addition acted as a positive control, and only 50% sucrose solution acted as a negative control (Table 1). Treatments and positive control were made in the form of dough by adding 10% water to promote bee intake (Williams et al., 2013).
Proximate compositions (crude protein, crude fat, crude fiber, ash, and NFE) of different diet formulations and amino acid contents of Chlorella and rapeseed pollen were estimated following the AOAC (1990). Crude protein percentage was estimated by using the Kjeldahl method and using a nitrogen-to-protein conversion factor of 6.25. The fat content was estimated by drying fats after extraction in a Soxhlet using ether. Ash percentage was calculated by combusting the samples in a silica crucible placed on a muffle furnace. The percentage of carbohydrate (NFE) was determined by subtracting all of the components from 100. The proximate composition of the different diet formulations is given in Supplementary Table 2. The amino acid content of Chlorella and rapeseed pollen is given in Supplementary Table 3.
Honey Bees for experiment
The experiment was conducted by selecting a healthy honey bee (Apis mellifera) colony raised under semi-field conditions in the bee laboratory of Andong National University, South Korea (36°32′37″N and 128°48′02″E). Sealed frames were taken from the colony and incubated in an incubator (34°C, 50% RH) under dark conditions, and 50 workers that emerged within 24 h were kept in a cage (Omar et al., 2017).
Experimental design
In order to investigate the effect of Chlorella, seven arms were included. Honey Bees recruited in the five arms were treated with different diets, and the other two arms acted as positive and negative controls. The honey bees recruited for the experimental purpose were kept in cages. For each arm, five replications were carried out. Each replication, that is, each cage, contained 50 individual honey bees. The experimental cage with the measurement of Ø 120 mm × h 80 mm was turned upside down, and a 5 cm × 5 cm wax frame was hung up inside (Omar et al., 2017; Figure 1). To fit 10-ml tubes, two holes of 1 × 0.3 cm or less were drilled to fit 10 ml tubes to provide water and 50% sucrose solution, and a larger hole was drilled in a 5-ml tube to supply patty (Köhler et al., 2013). All of them were provided ad libitum. Air circulation was facilitated on the lid of the experimental cage using a nylon grid of 5 mm or less (Omar et al., 2017). The cages were maintained in an incubator (34°C, 50% RH) under dark conditions until the experiment was finished.

Figure 1. Experimental cage (A) from the top, (B) from the front, and (C) ingredients (two 10-ml tubes for water and 50% sucrose solution, Ø 120 × h 80-mm breeding cage with mesh can ventilate, 5-ml tube for dough patty, 5 × 5-cm frame piece to relax honey bees).
In order to compare the life span and consumption of patty and sucrose, five replications were performed for each diet, and the dead bees were removed from the cage every day during the experiment. Mortality was checked every day until all bees in the cage died, and the consumption of patty and sucrose was checked until 18 days. The development of secretion glands (hypopharyngeal and venom glands), fat body mass, thorax weight, and Vg expression of honey bees were studied on days 5, 12, and 18 (Omar et al., 2017). The amino acid composition of the head of honey bees was studied on only day 12.
Measurement of consumption and longevity of honey bees
The consumption was measured by using the difference method, which was calculated by measuring the patty weight before entering the cage and the weight after 24 h. As the experimental feeds contained moisture, there was a possibility of evaporation and loss of weight of the patty provided to the honey bees. Therefore, in order to avoid overestimation of consumption, it was important to calculate the evaporation amount. To calculate the evaporation amount of patty, a cage that was the same as the experimental cage but did not contain honey bees was made, and the evaporation rate per day was calculated (Ricigliano et al., 2021). This evaporation amount was subtracted from the daily intake to obtain the actual intake and divided by the number of live honey bees and was considered as the daily food intake of one honey bee. Consumption of sucrose was measured in the same way as the patty consumption measurement but was divided by half to get the consumption of sucrose (not the 50% sucrose solution). Patty in a cage was newly replaced every day, and 50% sucrose solution and water were replaced every 3 days. We counted the number of dead bees in each case, if any, every day until all bees died in the cage and estimated the longevity following the Kaplan–Meier survival analysis.
Measurement of secretion glands
A total of 15 honey bees from each experimental group were recruited in order to measure the venom development on days 5, 12, and 18. A sting apparatus from the abdomen of a honey bee was dissected carefully and placed on a microscopic glass in a droplet of 250 mM sodium chloride solution (Hrassnigg and Crailsheim, 1998; Figure 2A). To identify the development status of the venom gland, the maximum length and width of the venom gland sac were measured via an optical microscope (BX53F, Olympus, Tokyo, Japan) and camera (IMTcamCCD5 plus, IMT i-Solution, Vancouver, Canada). The volume of the venom gland sac was calculated by using the following formula:
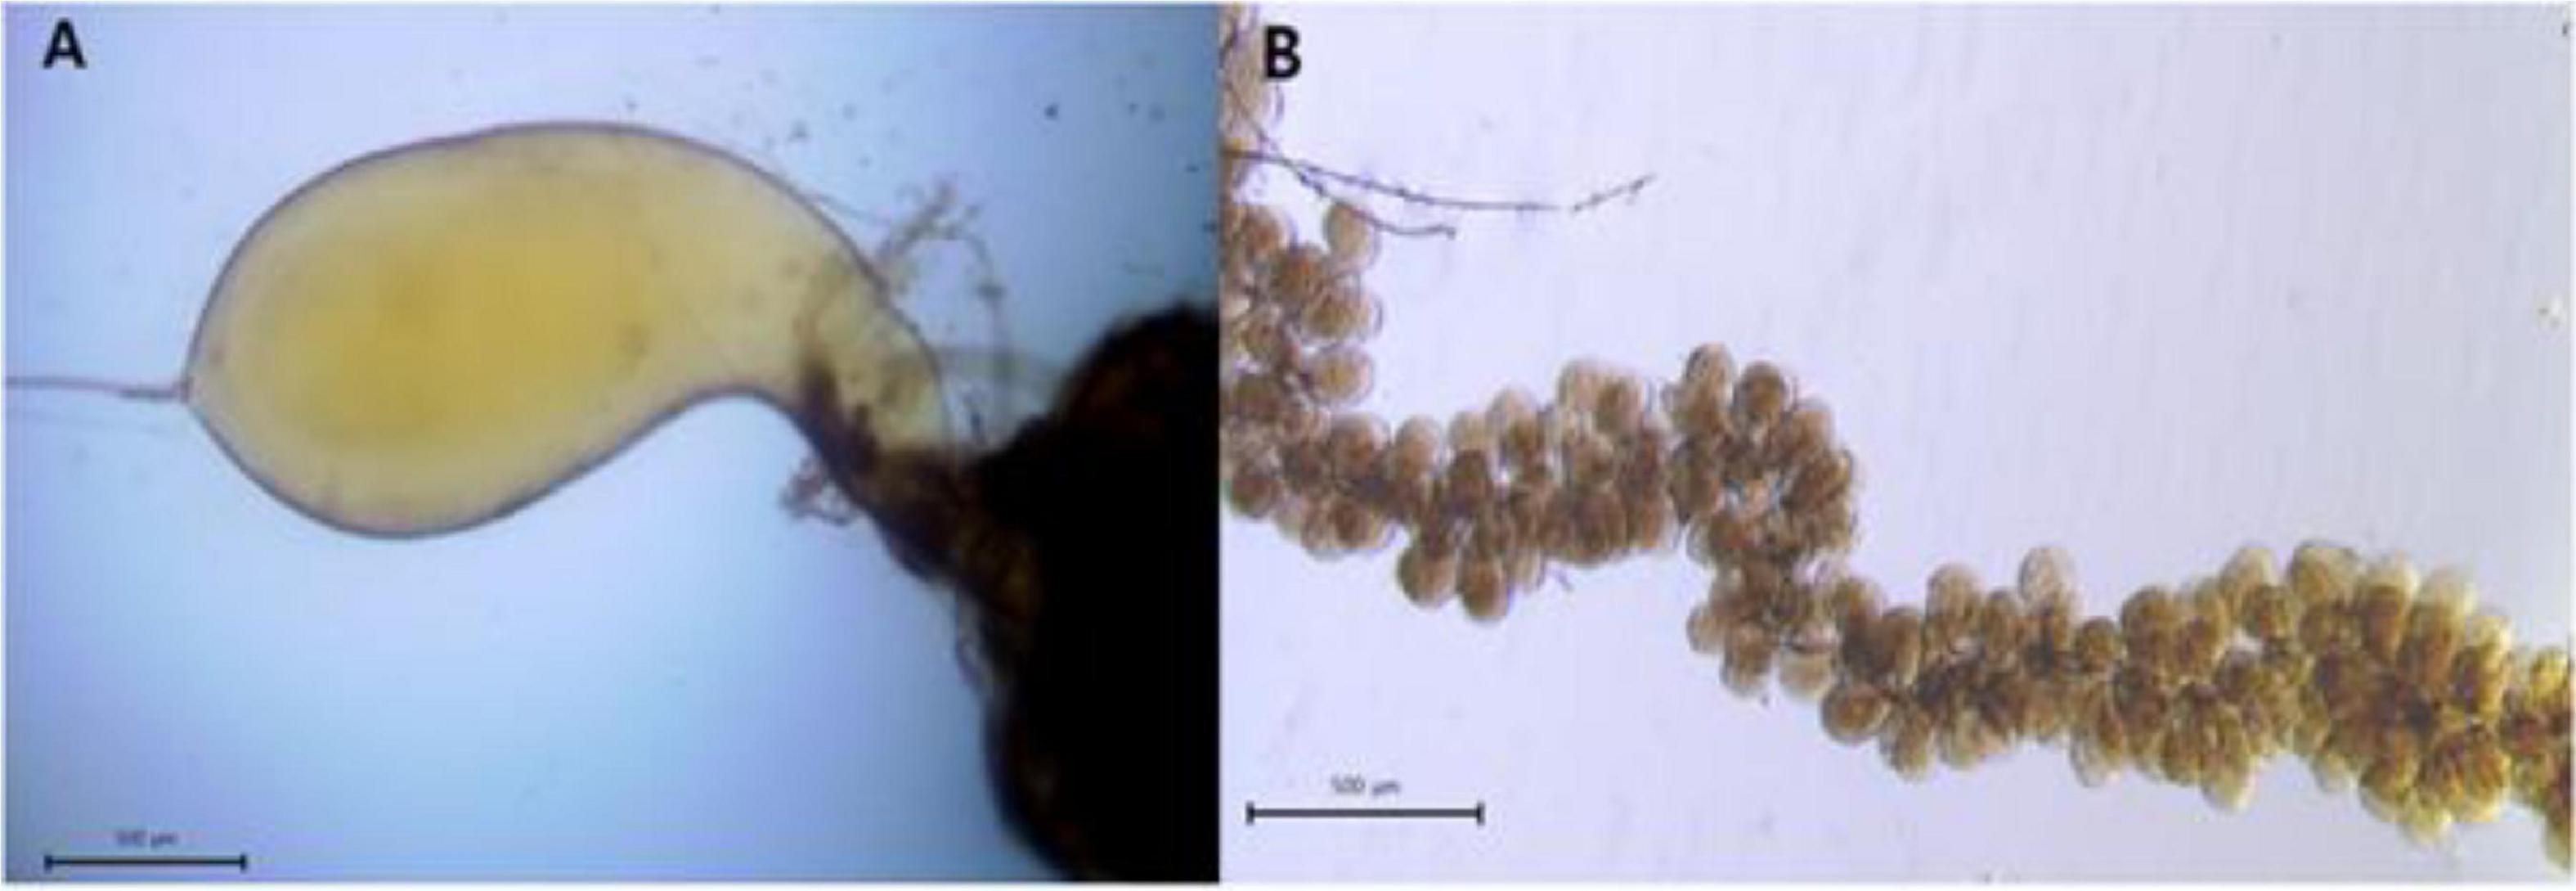
Figure 2. (A) Venom gland sac on day 18 and (B) hypopharyngeal gland acini on day 5 of caged honey bees fed with P2.
where “a” is the maximum length and b is the maximum width of the venom gland sac or acini of hypopharyngeal glands, and π = 3.14 (Omar et al., 2017).
To dissect hypopharyngeal glands, the head of the honey bee was opened, and a pair of hypopharyngeal glands were removed (Omar et al., 2017; Figure 2B). From each experimental group, 10 honey bees were recruited to carry out the measurement of a hypopharyngeal gland on days 5, 12, and 18. A total of five acini per honey bee hypopharyngeal gland were selected randomly and measured. The length and width of acini were measured like the venom gland sac, and the volume was calculated by using the aforementioned formula.
Measurement of thorax muscle and fat body mass
To measure muscle development, thoraces of 15 honey bees from each experimental group were taken, dissected, and separated from other body parts. Thoraces were dried at 60°C for about 48 h and measured with a precision balance (AX324, Ohaus, New Jersey, United States; 0.1 mg resolution) until a constant weight was achieved (Ricigliano and Simone-Finstrom, 2020).
Fat body mass was determined using the ether extraction method described by Wilson-Rich et al. (2008). The abdomens of 15 honey bees from each experimental group were separated, dried at room temperature for 3 days, and weighed with a precision balance (AX324, Ohaus, New Jersey, United States; 0.1 mg resolution). These were immersed in ethyl ether for 24 h to extract the fat body. Then, the abdomens were dried again at room temperature for 3 days and weighed using the same balance (AX324, Ohaus, New Jersey, United States; 0.1 mg resolution). The mass of fat bodies was expressed as a percentage by calculating the change in weight after removing the fat body.
Amino acid analysis of heads
Amino acids of honey bee heads were analyzed following Ghosh et al. (2017)’s study based on the standard method of AOAC (1990). The samples were freeze-dried and ground into powder in five replications. Approximately, 20 mg of samples were taken in a 10-ml glass tube, and tubes were filled with nitrogen gas. These were hydrolyzed with 6 N HCl solution for 1 day at 110°C and concentrated using a rotary evaporator. The samples were reconstituted with sample dilution buffer supplied by the manufacturer (physiological buffer 0.12 N citrate buffer, pH 2.20). The pretreated samples were estimated using an amino acid analyzer (S433, Sykam GmbH, Eresing, Germany) equipped with an LCA K07/Li 4.6 × 150-mm column. The detector was a photometer (570 nm, 440 nm), and the inert gas was N2.
Vitellogenin expression
In order to measure the expression of Vg, for RNA extraction, five replications were made, and each replication consisted of three heads; therefore, a total of 15 heads of honey bees from each group was taken. Since Vg is expressed in fat cells surrounding the brain of honey bees, the entire head was used for the experiment without removing the brain, following the procedure provided by Corona et al. (2007). The RNeasy Mini Kit (Qiagen, Hilden, Germany) was used for RNA extraction and reverse transcription. In brief, honey bee heads were disrupted in buffer RLT (lysis buffer) and homogenized; 70% ethanol was added to the lysate, mixed well, and then applied to the RNeasy Mini spin column. Total RNA was bound to the membrane; contaminants were efficiently washed away by centrifugation with different buffers provided in the kit; and high-quality RNA was eluted in RNAse-free water. Extracted RNA was subjected to reverse transcription to form cDNA using the QuantiTect (Qiagen, Hilden, Germany) cDNA synthesis protocol. An RNA-direct™ SYBR® Green Realtime PCR Master Mix (Toyobo, Osaka, Japan) was used for the qPCR process. The reaction solution was prepared by taking 10 μl 2X QuantiTect SYBR ® Green real-time PCR master mix, 1 μl of forward (Vg Forward: 5′AGTTCCGACCGACGACG3′) and reverse primer (Vg Reverse: 5′TTCCCTCCCACGGAGTCC3′) each, QuantiTect RT mix, 1μl of template cDNA, and 6.8μl of PCR-grade RNase-free water. Real-time cycler conditions were followed according to the manufacturer’s protocol (reverse transcription for 20 min at 50°C, followed by PCR initial activation step for 15 min at 95°C, denaturation: 15 s at 94°C, annealing 52.7° for 30 s, and extension: 30 s at 72°C), and the number of cycles was 40. mRNA quantification was performed using the StepOnePlus Real-Time PCR system (Applied Biosystems, Foster, United States), and the Vg expression level was normalized by calculating the actin expression level (Alaux et al., 2011; Ricigliano and Simone-Finstrom, 2020; Ricigliano et al., 2021). Actin (Ac Forward: 5′TGACCGACTACCTCATGAAGATCC3′; Ac Reverse: AGGAAGGACGGTTGGAACAGAG3′) was used as the housekeeping gene for the target, that is, Vg, gene normalization. Based on the expression stability, actin is one of the few optimal reference genes for target gene normalization across different seasons and honey bee tissue types (Jeon et al., 2020).
Statistical analysis
Statistical analyses were performed using R studio software (version 1.4.1106, R. R studio, Boston, United States) and SPSS software (version 16.0, SPSS, Chicago, United States). The distribution pattern of the data was evaluated with the Shapiro–Wilk test. The data with the normal distribution were subjected to the parametric test like one-way ANOVA, followed by post hoc Tukey’s HSD test. On the other hand, the data, that is, hypopharyngeal gland, not following the normal distribution were analyzed by using a non-parametric test like the Kruskal–Wallis test and the Mann–Whitney U-test. ANOVA was used to evaluate the effects of consumption, the weight of dried thorax, fat body mass, and Vg expression on days 5, 12, and 18 after Chlorella was added to pollen patty for honey bees. Pairwise Tukey’s HSD test was used for determining the significance of mean values. Kaplan–Meier survival analysis was used to determine the effect of Chlorella on the life span of honey bees. Differences in the time distributions between groups were tested for statistical significance using the log-rank test. One-way ANOVA, followed by a Tukey’s HSD test, was used to compare the nutrition contents of different diets, and the head amino acid content of honey bees according to diets on day 12 and two-way ANOVA was carried out to evaluate the effect of diet and age on each parameter. For all comparisons, the level of significance was P < 0.05.
Results
Identification of Chlorella
The species of Chlorella was identified as C. sorokiniana (> 98% similarity) with the standard barcoding method based on the rbcl and ITS region and compared with the available database of the NCBI. The DNA sequence is presented in Supplementary Table 1.
Consumption pattern of honey bees
The cumulative food consumption pattern of caged honey bees fed with different diets is presented in Figure 3A. The patty consumption was affected by diet [F(4, 20) = 5.389, P < 0.01] and age [F(2, 40) = 613.450, P < 0.001], but not their interaction [F(8, 40) = 1.959, P = 0.077]. On days 5, 12, and 18, cumulative consumption was highest for P2. On day 5, cumulative food consumption was lowest for P10, but on subsequent days 12 and 18, cumulative consumption was lowest for positive control. On the other hand, Figure 3B shows the cumulative sucrose consumption of caged honey bees in different treatment groups. The sucrose consumption was affected by diet [F(5, 24) = 19.539, P < 0.001], age [F(2, 48) = 5.033, P < 0.001], and their interaction [F(10, 48) = 10.897, P < 0.001]. On day 5, cumulative consumption was highest for PC and lowest for negative control. On day 12, sucrose consumption was the highest for PC and lower for NC, P0.5, and P5. On day 18, it was highest for PC and the lowest for NC.
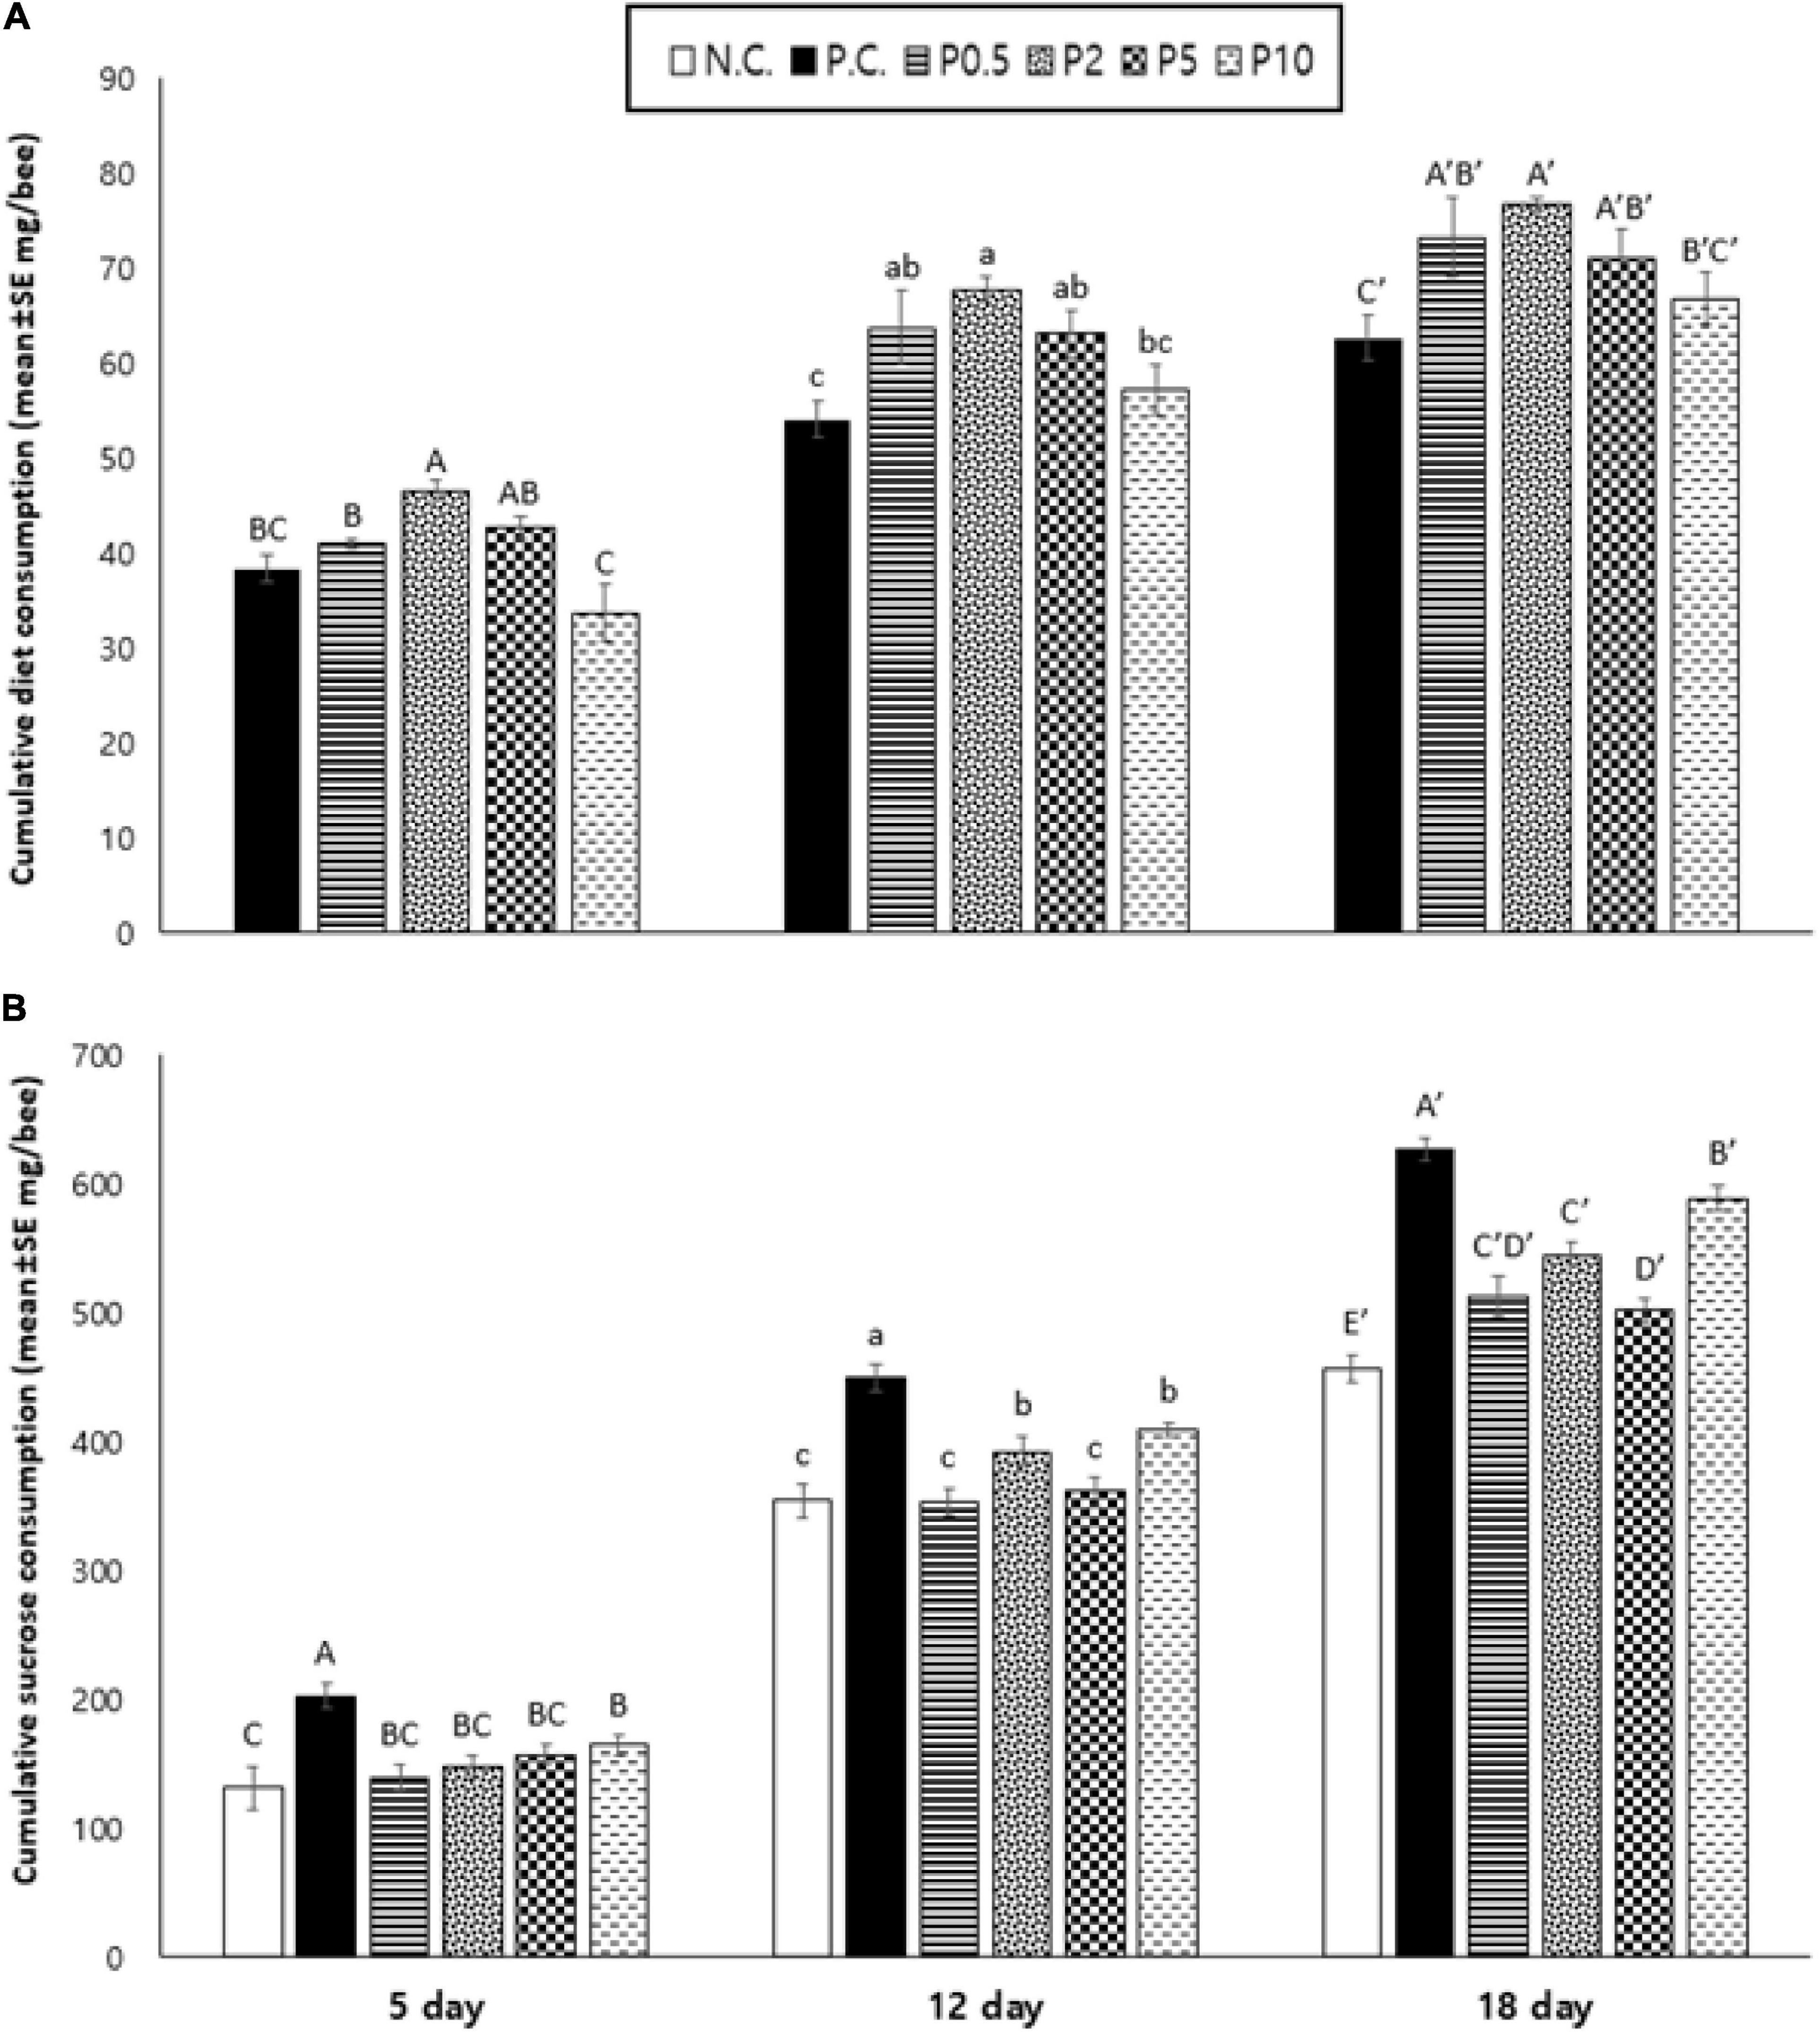
Figure 3. Cumulative consumption of (A) diet and (B) sucrose content (mean ± SE mg/bee) measured on days 5, 12, and 18 in caged honey bees fed with different diets. NC means negative control; PC means positive control. Different letters over the bar indicate statistically significant differences (p < 0.05).
Longevity of honey bees
Distinct differences in the life span among bees fed with different diets [χ2(5) = 248.467, P < 0.001] were revealed and are presented in Table 2. Life span was longest in bees fed with P2; however, no significant difference was revealed with P5. It was followed by PC and P0.5, the shortest for NC. The progress of the survival of the honey bees belonging to different feeding groups over time is shown in Figure 4. The highest mortality, along with days, was observed for honey bees belonging to the negative control. On the other hand, the mortality, along with days, was the lowest for P2, followed by P5.
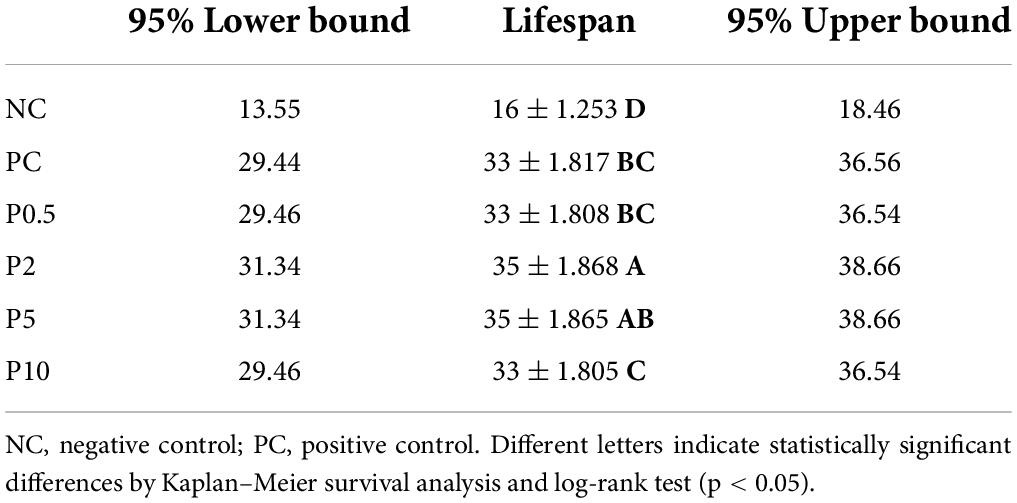
Table 2. Longevity (median ± SE days) and 95% confidence interval (median days) in caged honey bees fed with different diets.
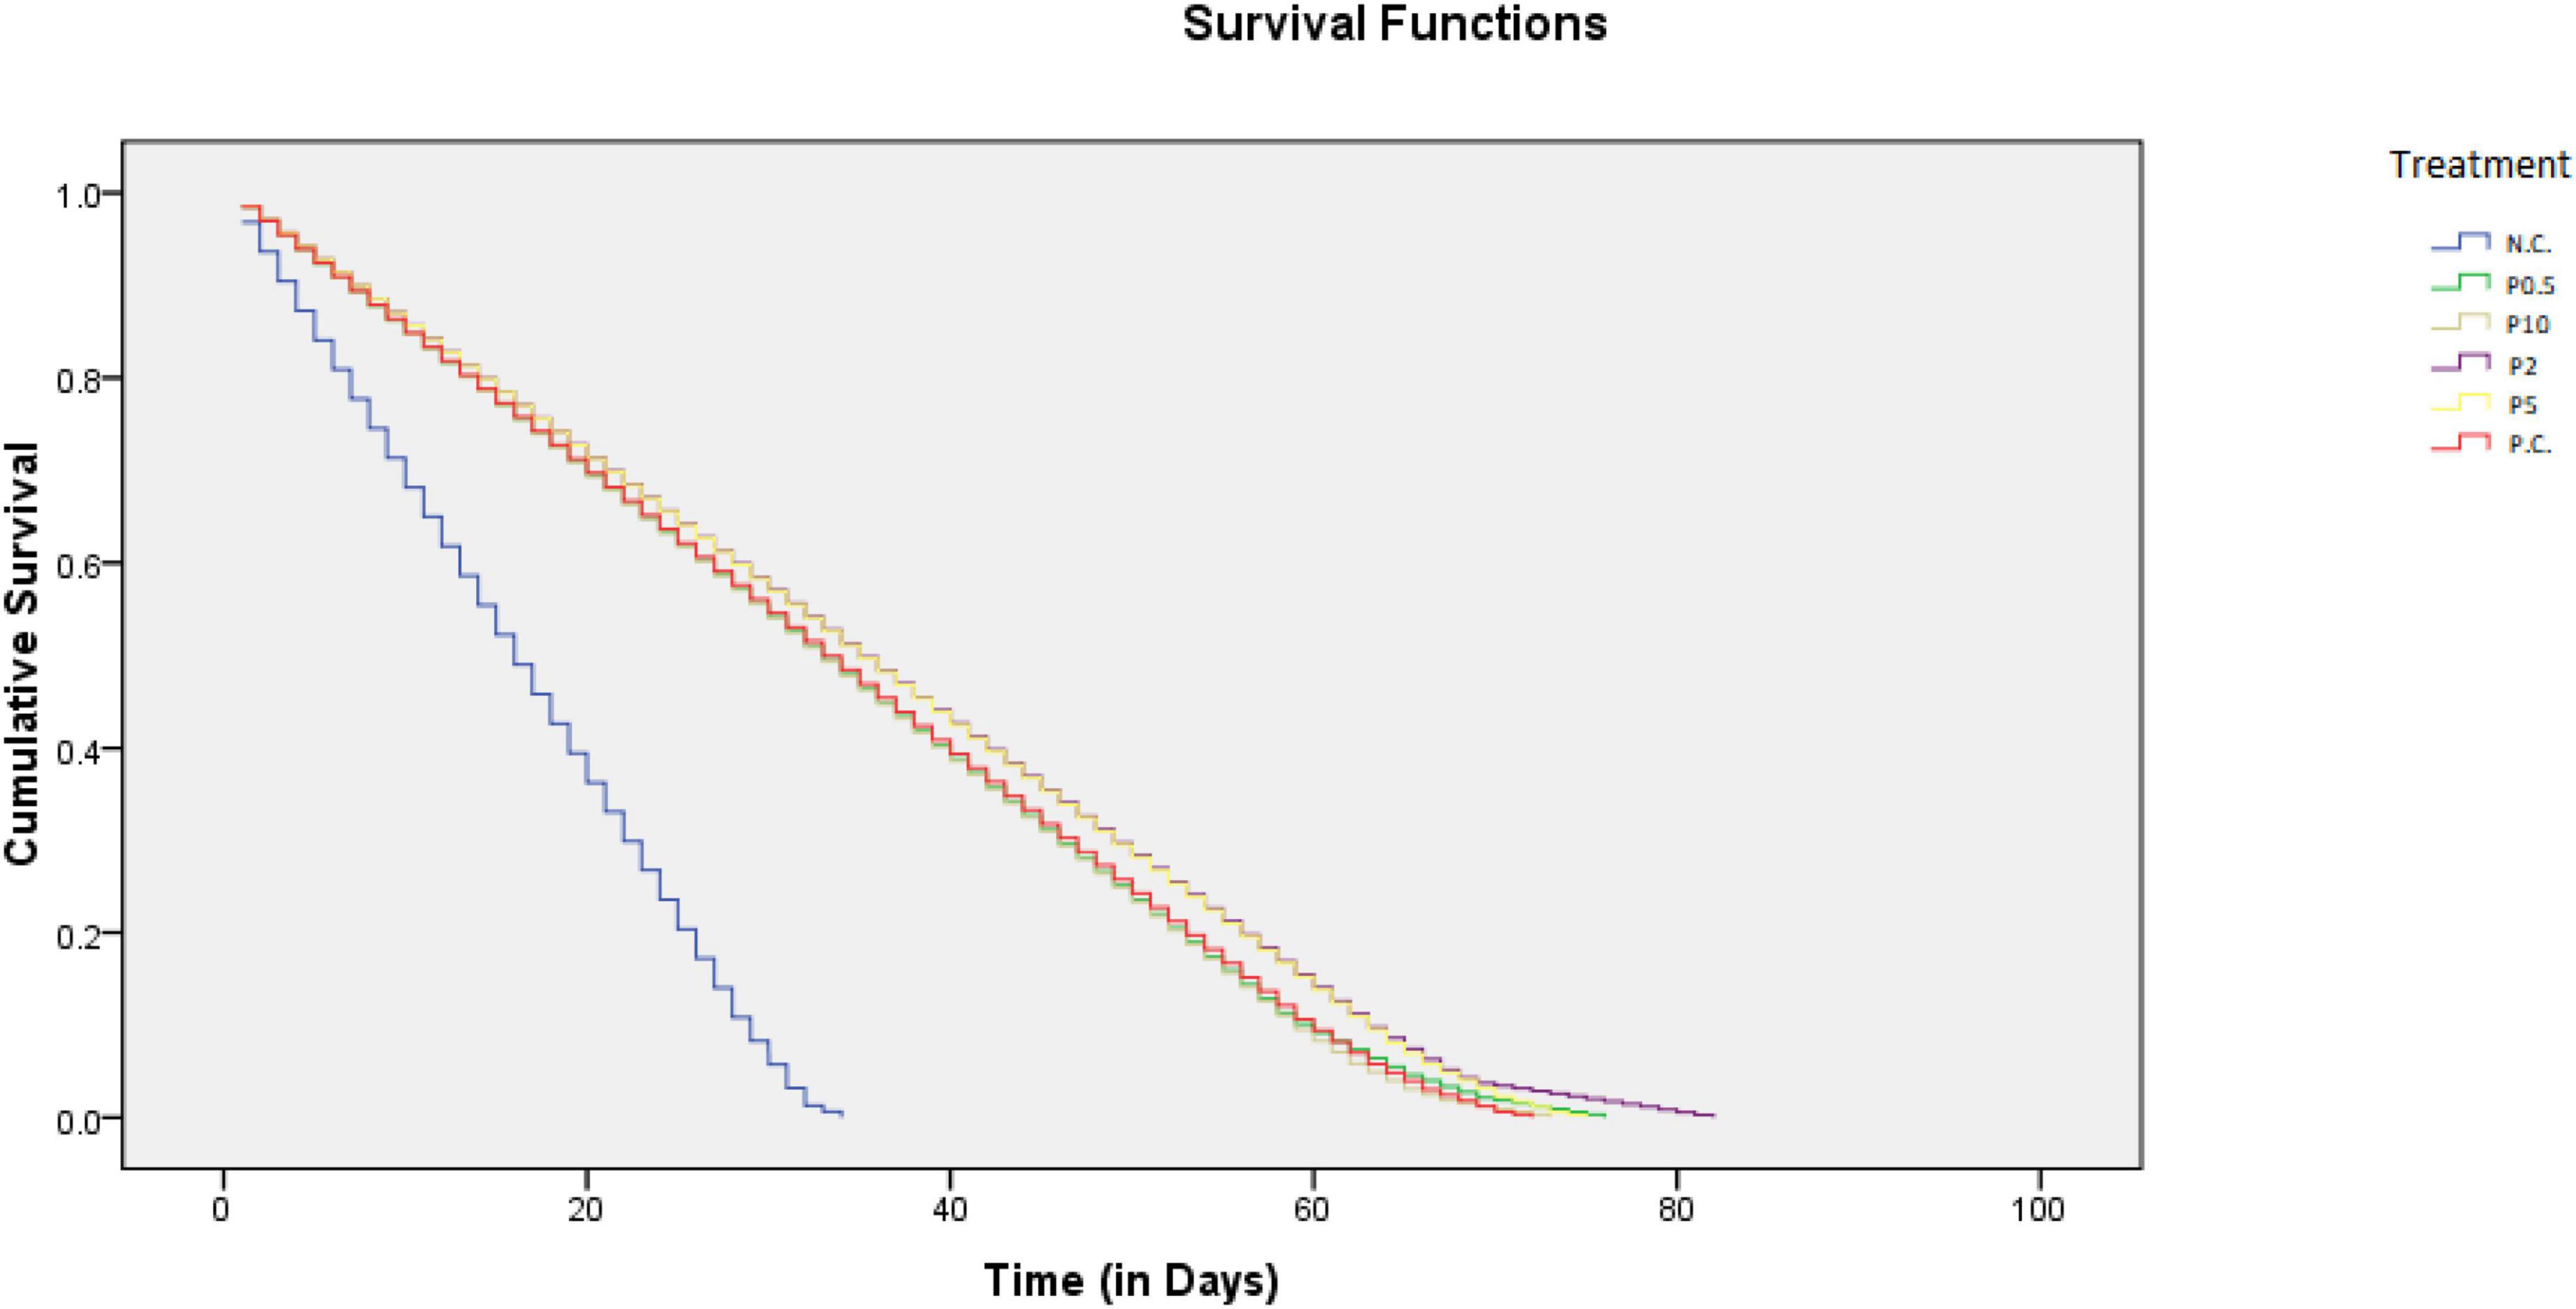
Figure 4. Progress of the survival of the honey bees belonging to different feeding groups over time.
Development of secretion glands
The venom gland sac was affected by diet [F(5, 84) = 17.307, P < 0.001], age [F(2, 168) = 156.952, P < 0.001], and their interaction [F(10, 168) = 2.551, P < 0.01], as depicted in Figure 5A. Venom gland size increased with days for all caged honey bees irrespective of their diet. On day 5, the venom gland sac was developed best in honey bees fed with P2, the least developed in comparison to that of controls. On day 12, it was also highest in bees fed with P2; however, no difference was found in other Chlorella diets. On day 18, bees fed with all Chlorella diets had significantly higher venom gland size than bees deprived of protein (NC) and bees fed with pollen patty (PC). Figure 5B shows hypopharyngeal gland development of caged honey bees fed with different diets. The results revealed that the hypopharyngeal gland acinus sac was affected by diet [F(5, 294) = 140.944, P < 0.001], age [F(2, 588) = 143.439, P < 0.001], and their interaction [F(10, 588) = 8.170, P < 0.01]. Caged honey bees from all groups had a larger hypopharyngeal gland acinus on day 5 than on days 12 and 18, and hypopharyngeal gland size decreased as days increased. On day 5, the hypopharyngeal gland acinus developed the best in caged bees fed with P2 and P5, followed by P0.5 and P10. On day 12, it was also highest in bees fed with P2 and P5, followed by P10. A similar trend was found on day 18, a protein-free diet which always resulted in the least developed acinus.
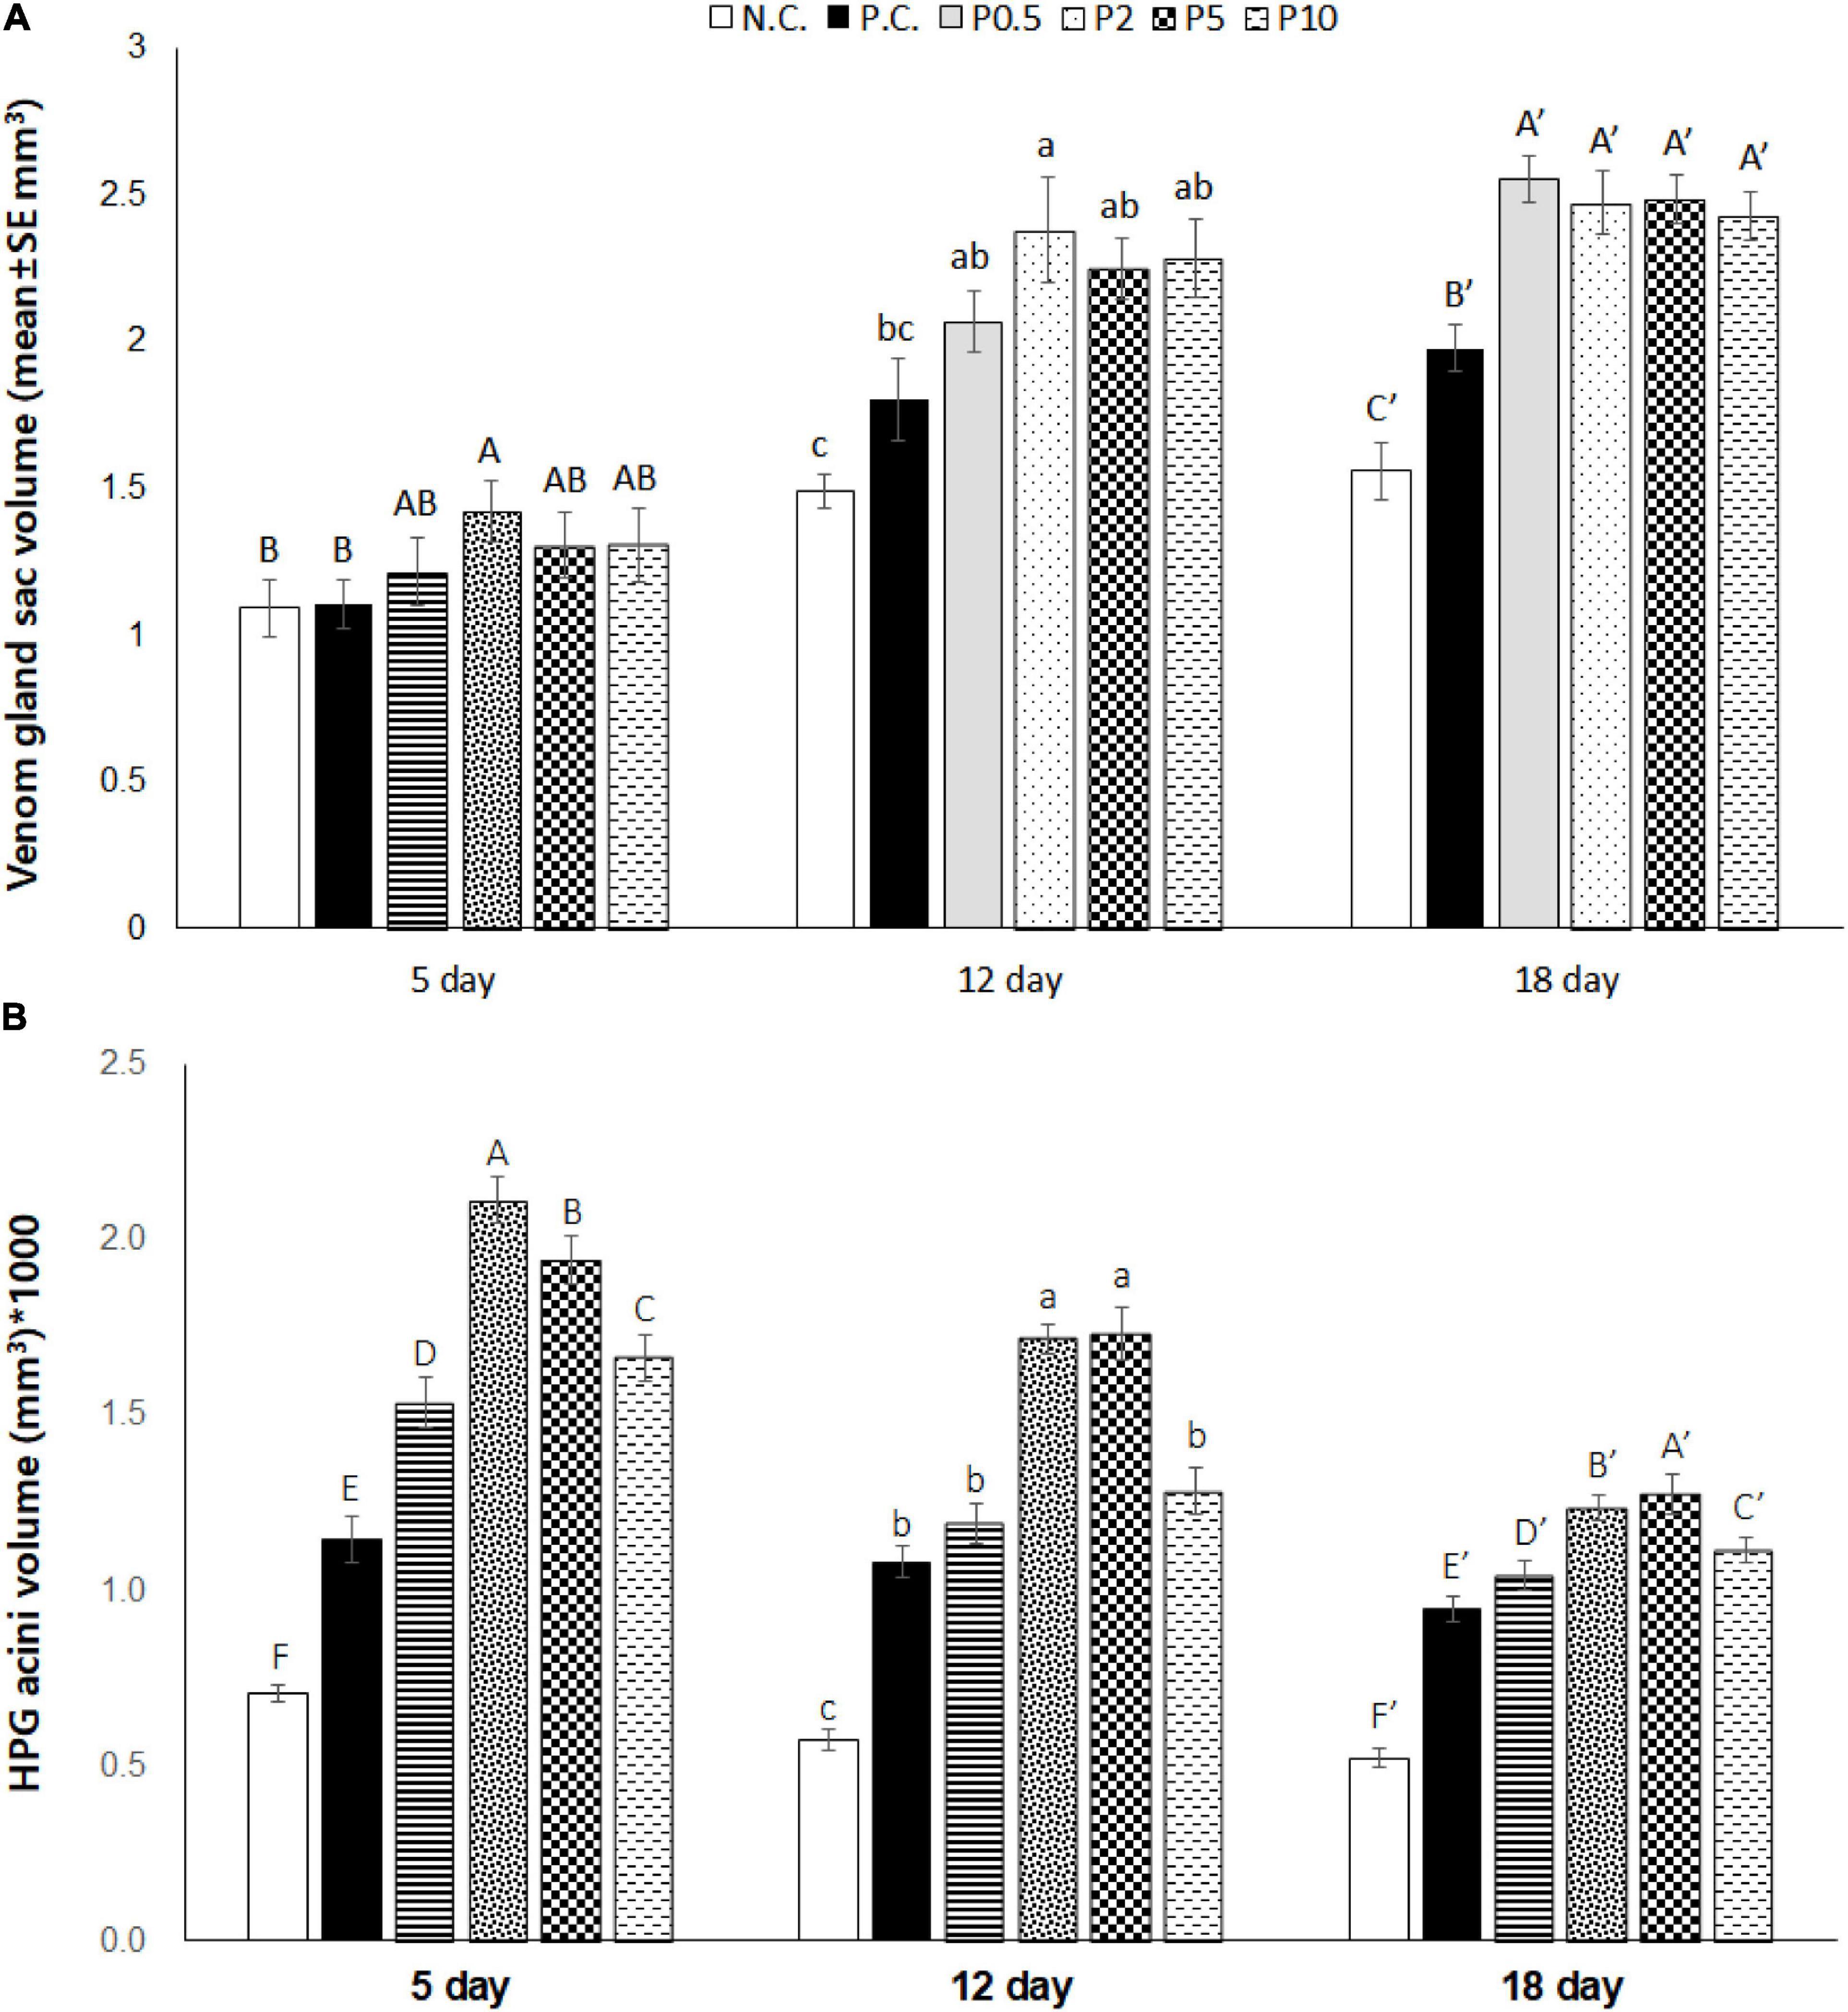
Figure 5. (A) Venom gland sac volume (mean ± SE mm3) and (B) hypopharyngeal gland acini volume (mean ± SE mm3*1,000) measured on days 5, 12, and 18 in caged honey bees fed with different diets. NC means negative control; PC means positive control. Different letters over the bar indicate statistically significant differences (p < 0.05).
Weight of dried thorax and fat body mass
The results revealed that the thorax weight was affected by diet [F(5, 84) = 19.072, P < 0.001] and age [F(2, 168) = 27.976, P < 0.001], but not their interaction [F(10, 168) = 0.525, P = 0.871), and are presented in Figure 6A. An increasing trend of thorax weight (dried) was found with days for caged honey bees irrespective of their diets. On day 5, dried thorax weight was highest in bees fed with P0.5; however, there was no significant difference between P2 and P5. On days 12 and 18, there was no statistical difference in caged bees fed all protein-containing diets. The protein-free diet always resulted in the least developed thorax. Figure 6B shows the fat body mass of caged honey bees fed with different diets. The fat body mass was affected by diet [F(5, 84) = 3.941, P < 0.01] and age [F(2, 168) = 8.850, P < 0.001], but not their interaction [F(10, 168) = 0.638, P = 0.780]. On day 5, there was no significant difference in the fat body mass of bees fed on different diets. On day 12, fat body mass in honey bees fed with P0.5 was the highest, followed by P2. On day 18, there was no statistical difference in bees fed with different diets.
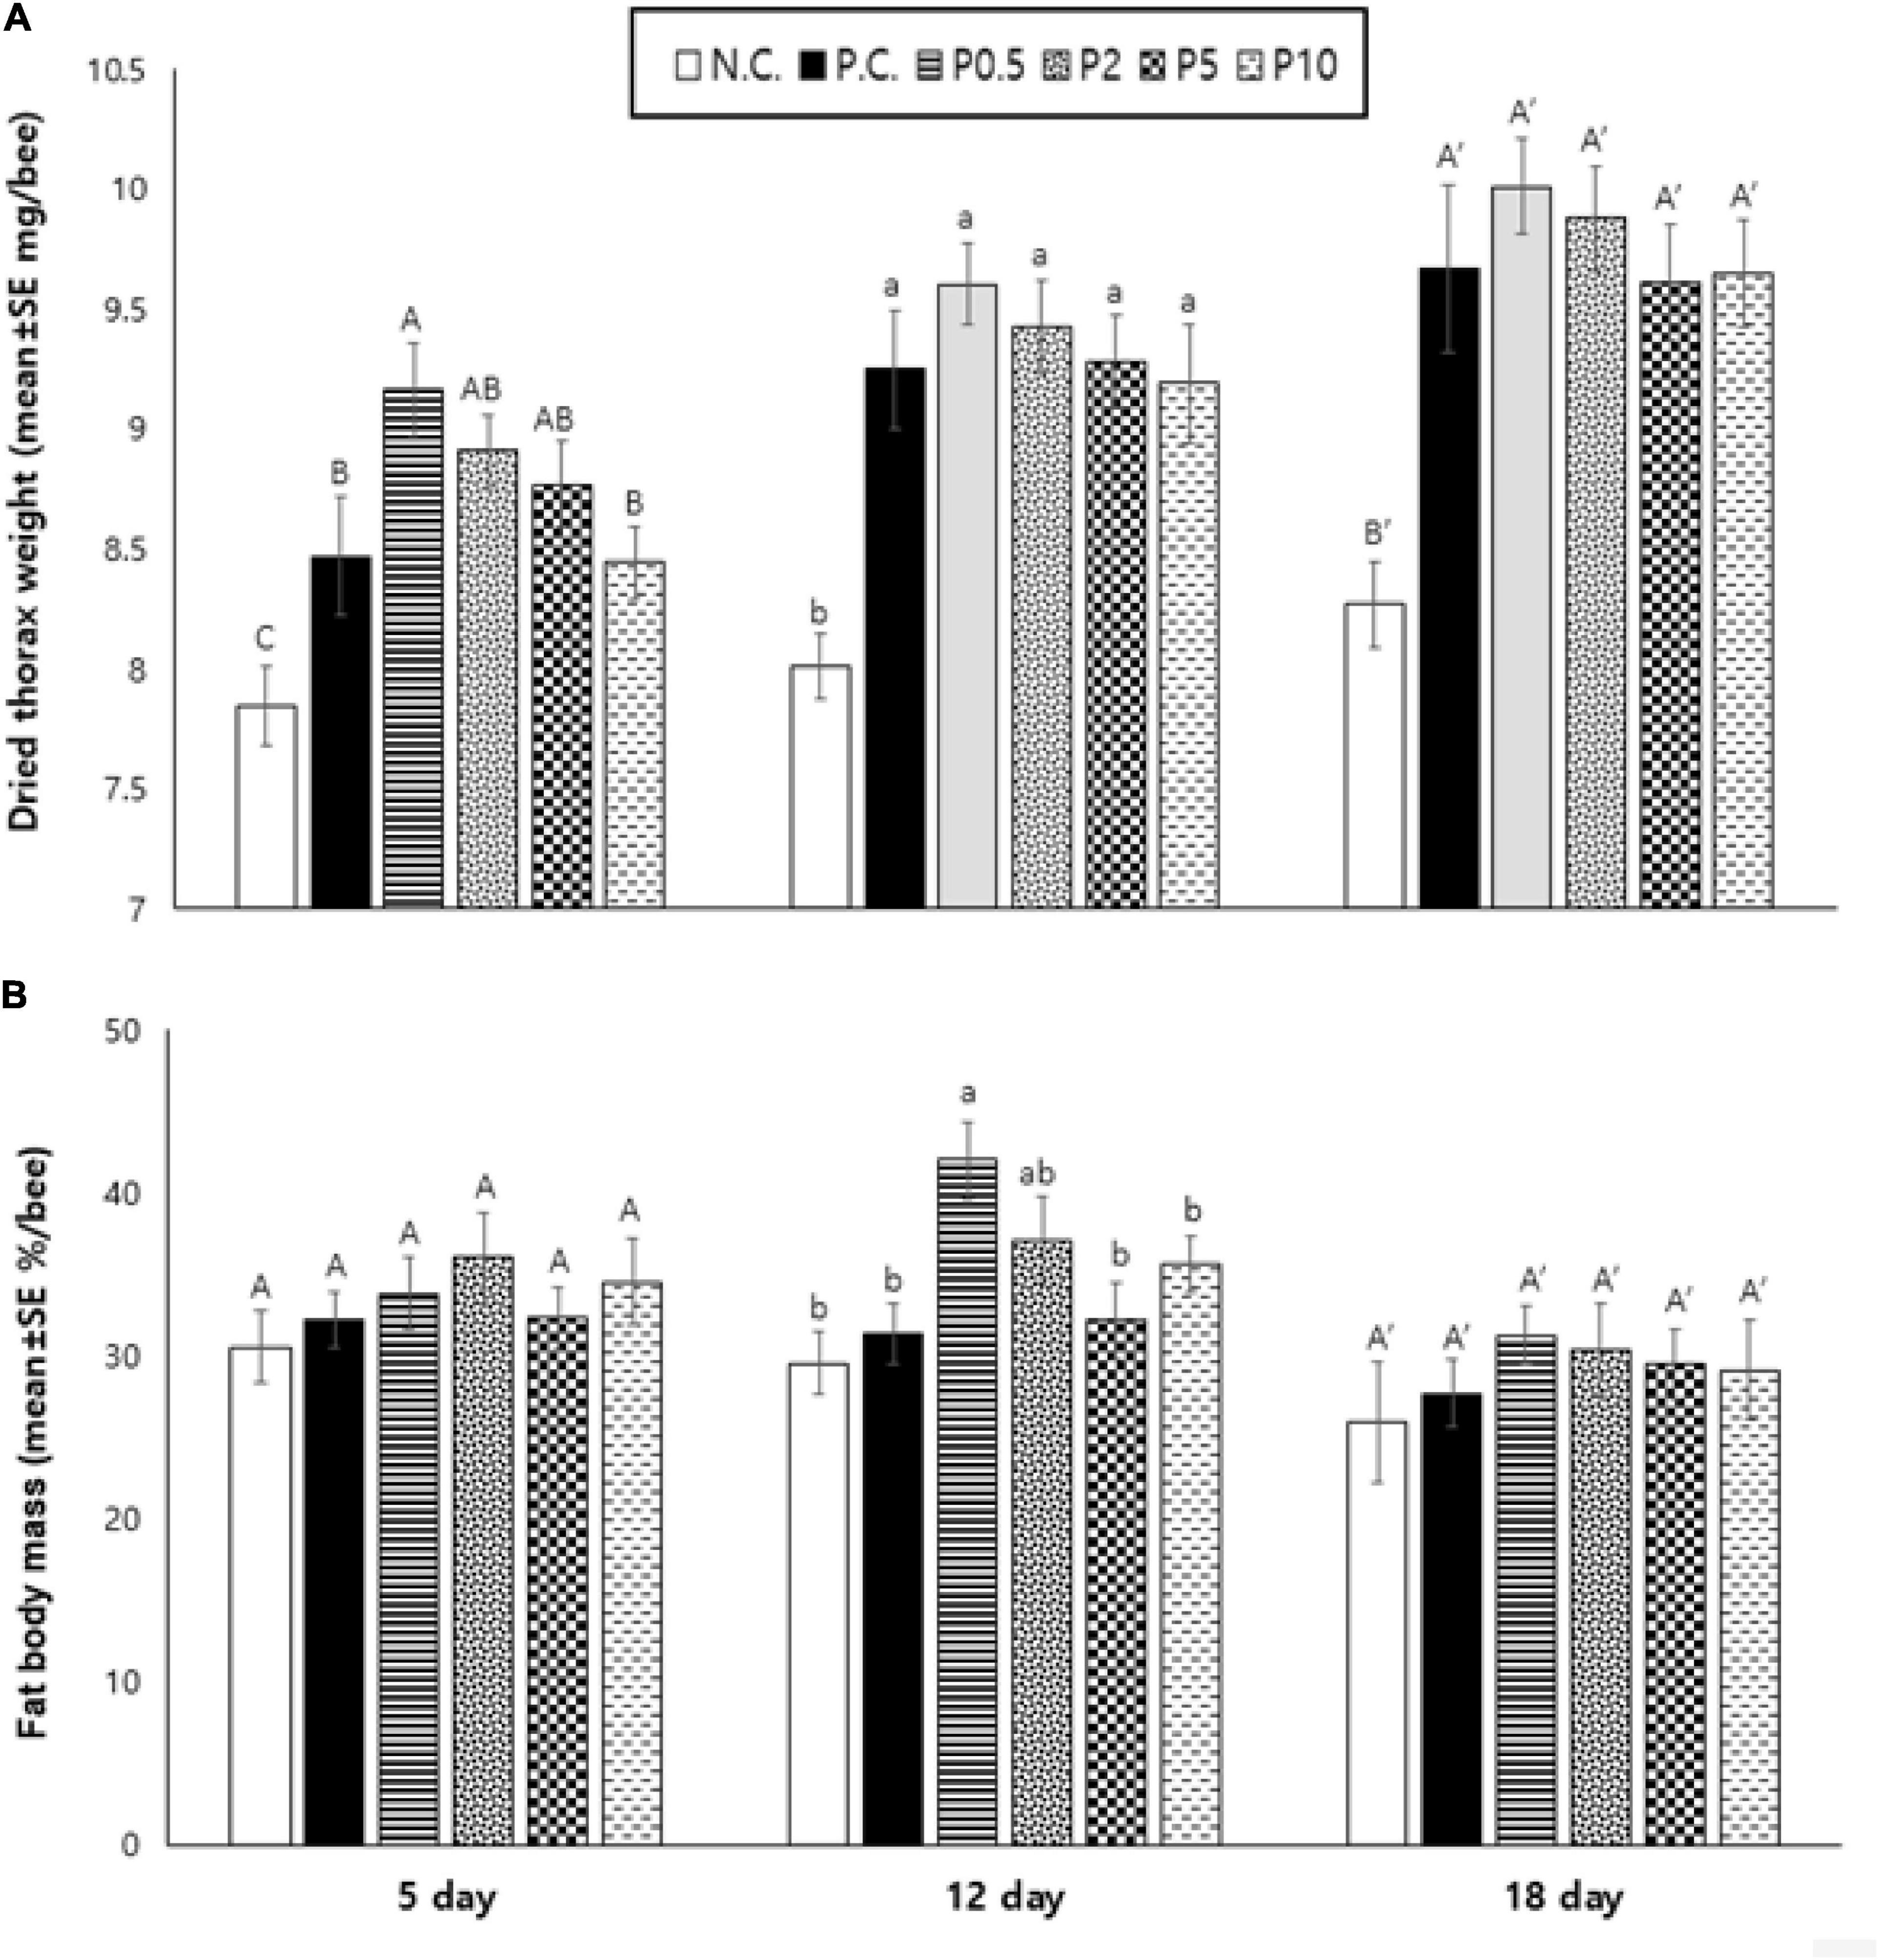
Figure 6. (A) Dried thorax weight (mean ± SE mg/bee) and (B) fat body mass (mean ± SE%/bee) measured on days 5, 12, and 18 in caged honey bees fed with different diets. NC means negative control; PC means positive control. Different letters over the bar indicate statistically significant differences (p < 0.05).
Amino acid composition of honey bee heads
Table 3 presents the comparison of head amino acid contents and composition of caged honey bees according to different diets. Total amino acid contents of the head on day 12 were highest in honey bees fed all Chlorella-containing diets, and there was no significant difference between these [F(5, 54) = 43.083, P < 0.001]. It had higher amino acid contents in bees-fed PC than in the negative control. Each amino acid content was higher in caged bees fed all Chlorella diets than in controls.
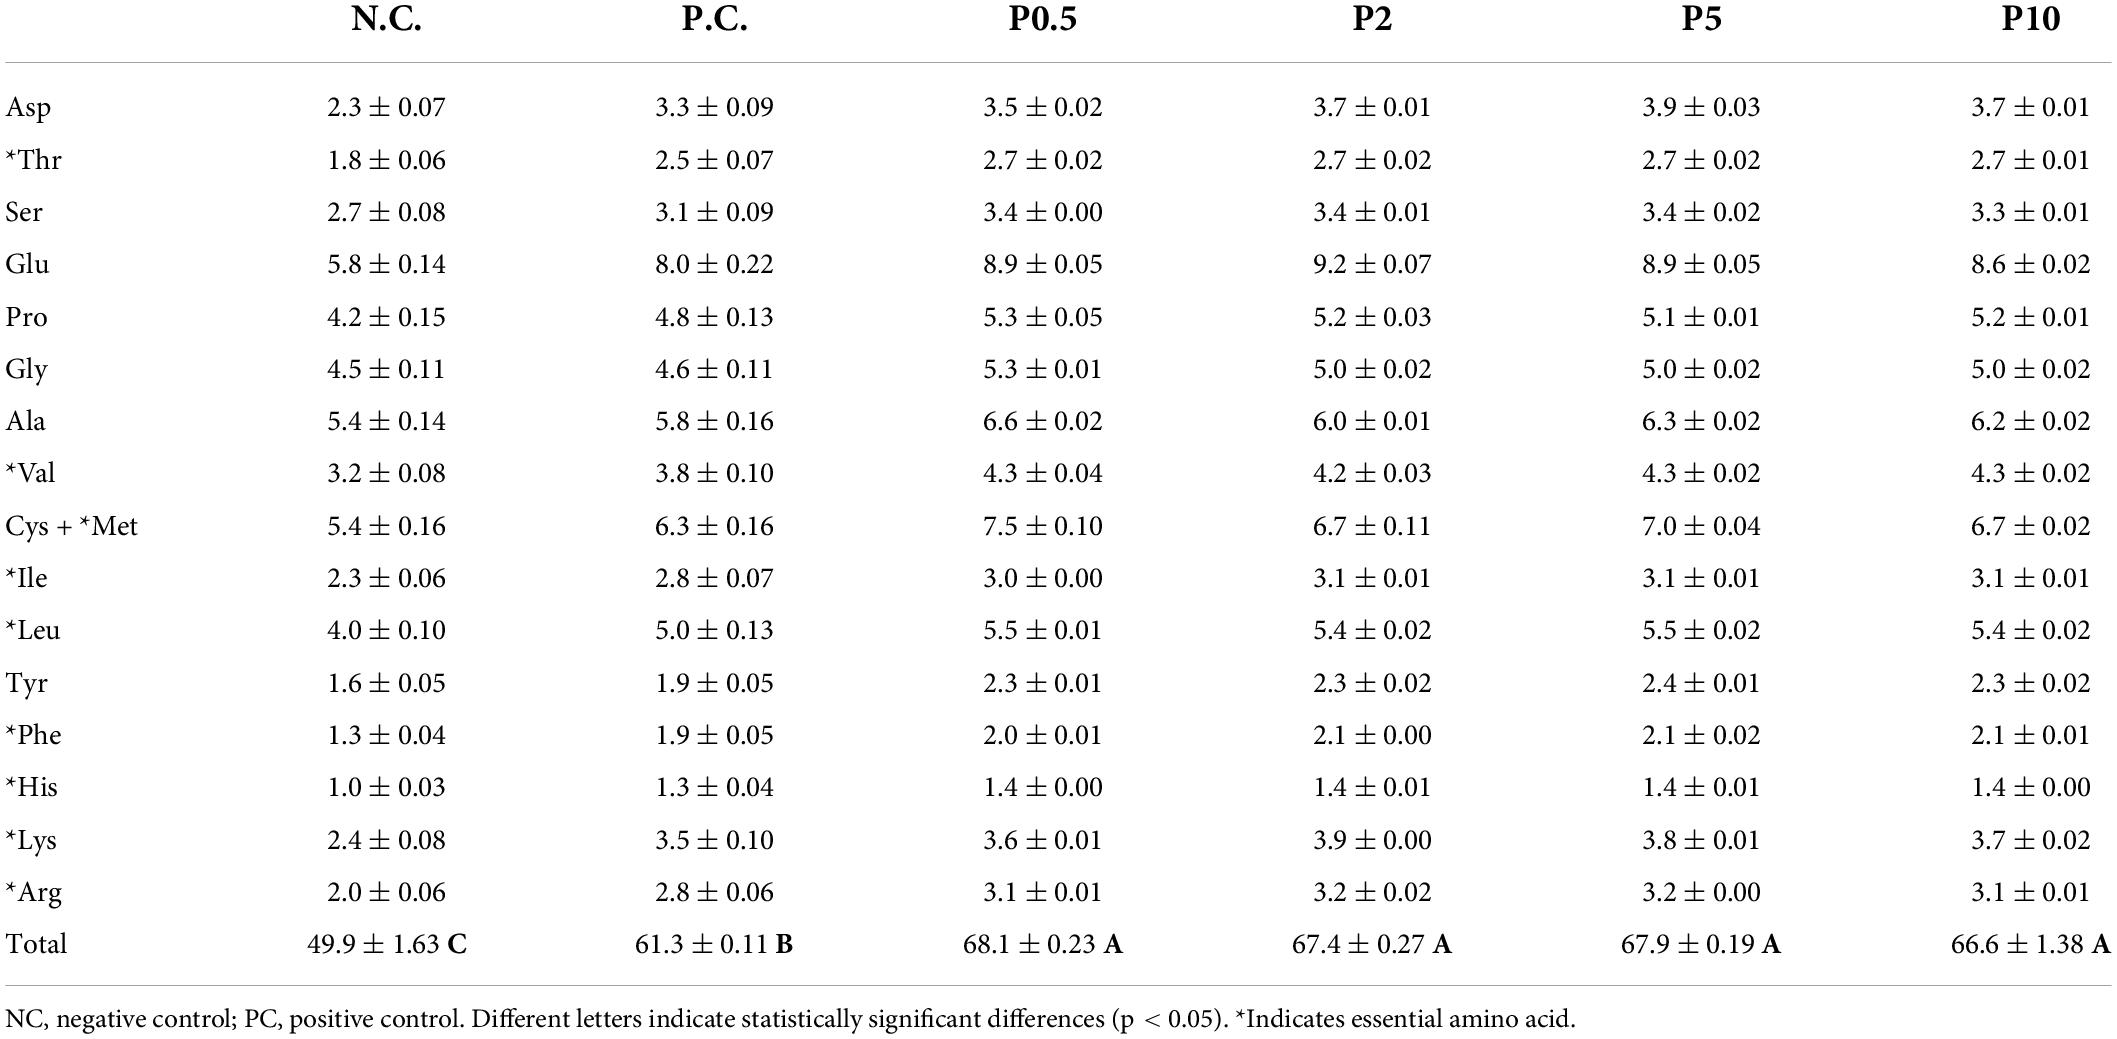
Table 3. Total amino acid content and composition (mean ± SE g/100 g DM) in the head in caged honey bees fed with different diets on day 12.
Vitellogenin expression
The relative Vg/actin expression of caged honey bees fed with different diets is given in Figure 7. Vg was affected by diet [F(5, 24) = 24.193, P < 0.001] and age [F(2, 48) = 87.216, P < 0.001], but not their interaction [F(10, 48) = 0.384, P = 0.948]. On day 5, caged honey bees fed with P2 had the highest Vg expression; however, no significant difference was observed with P5. On day 12, the expression of Vg was the highest in honey bees fed with P2, followed by P5; however, no significant difference was observed with PC, P0.5, and P10 groups. On day 18, there was no significant difference in Vg expression among honey bees fed all protein-containing diets.
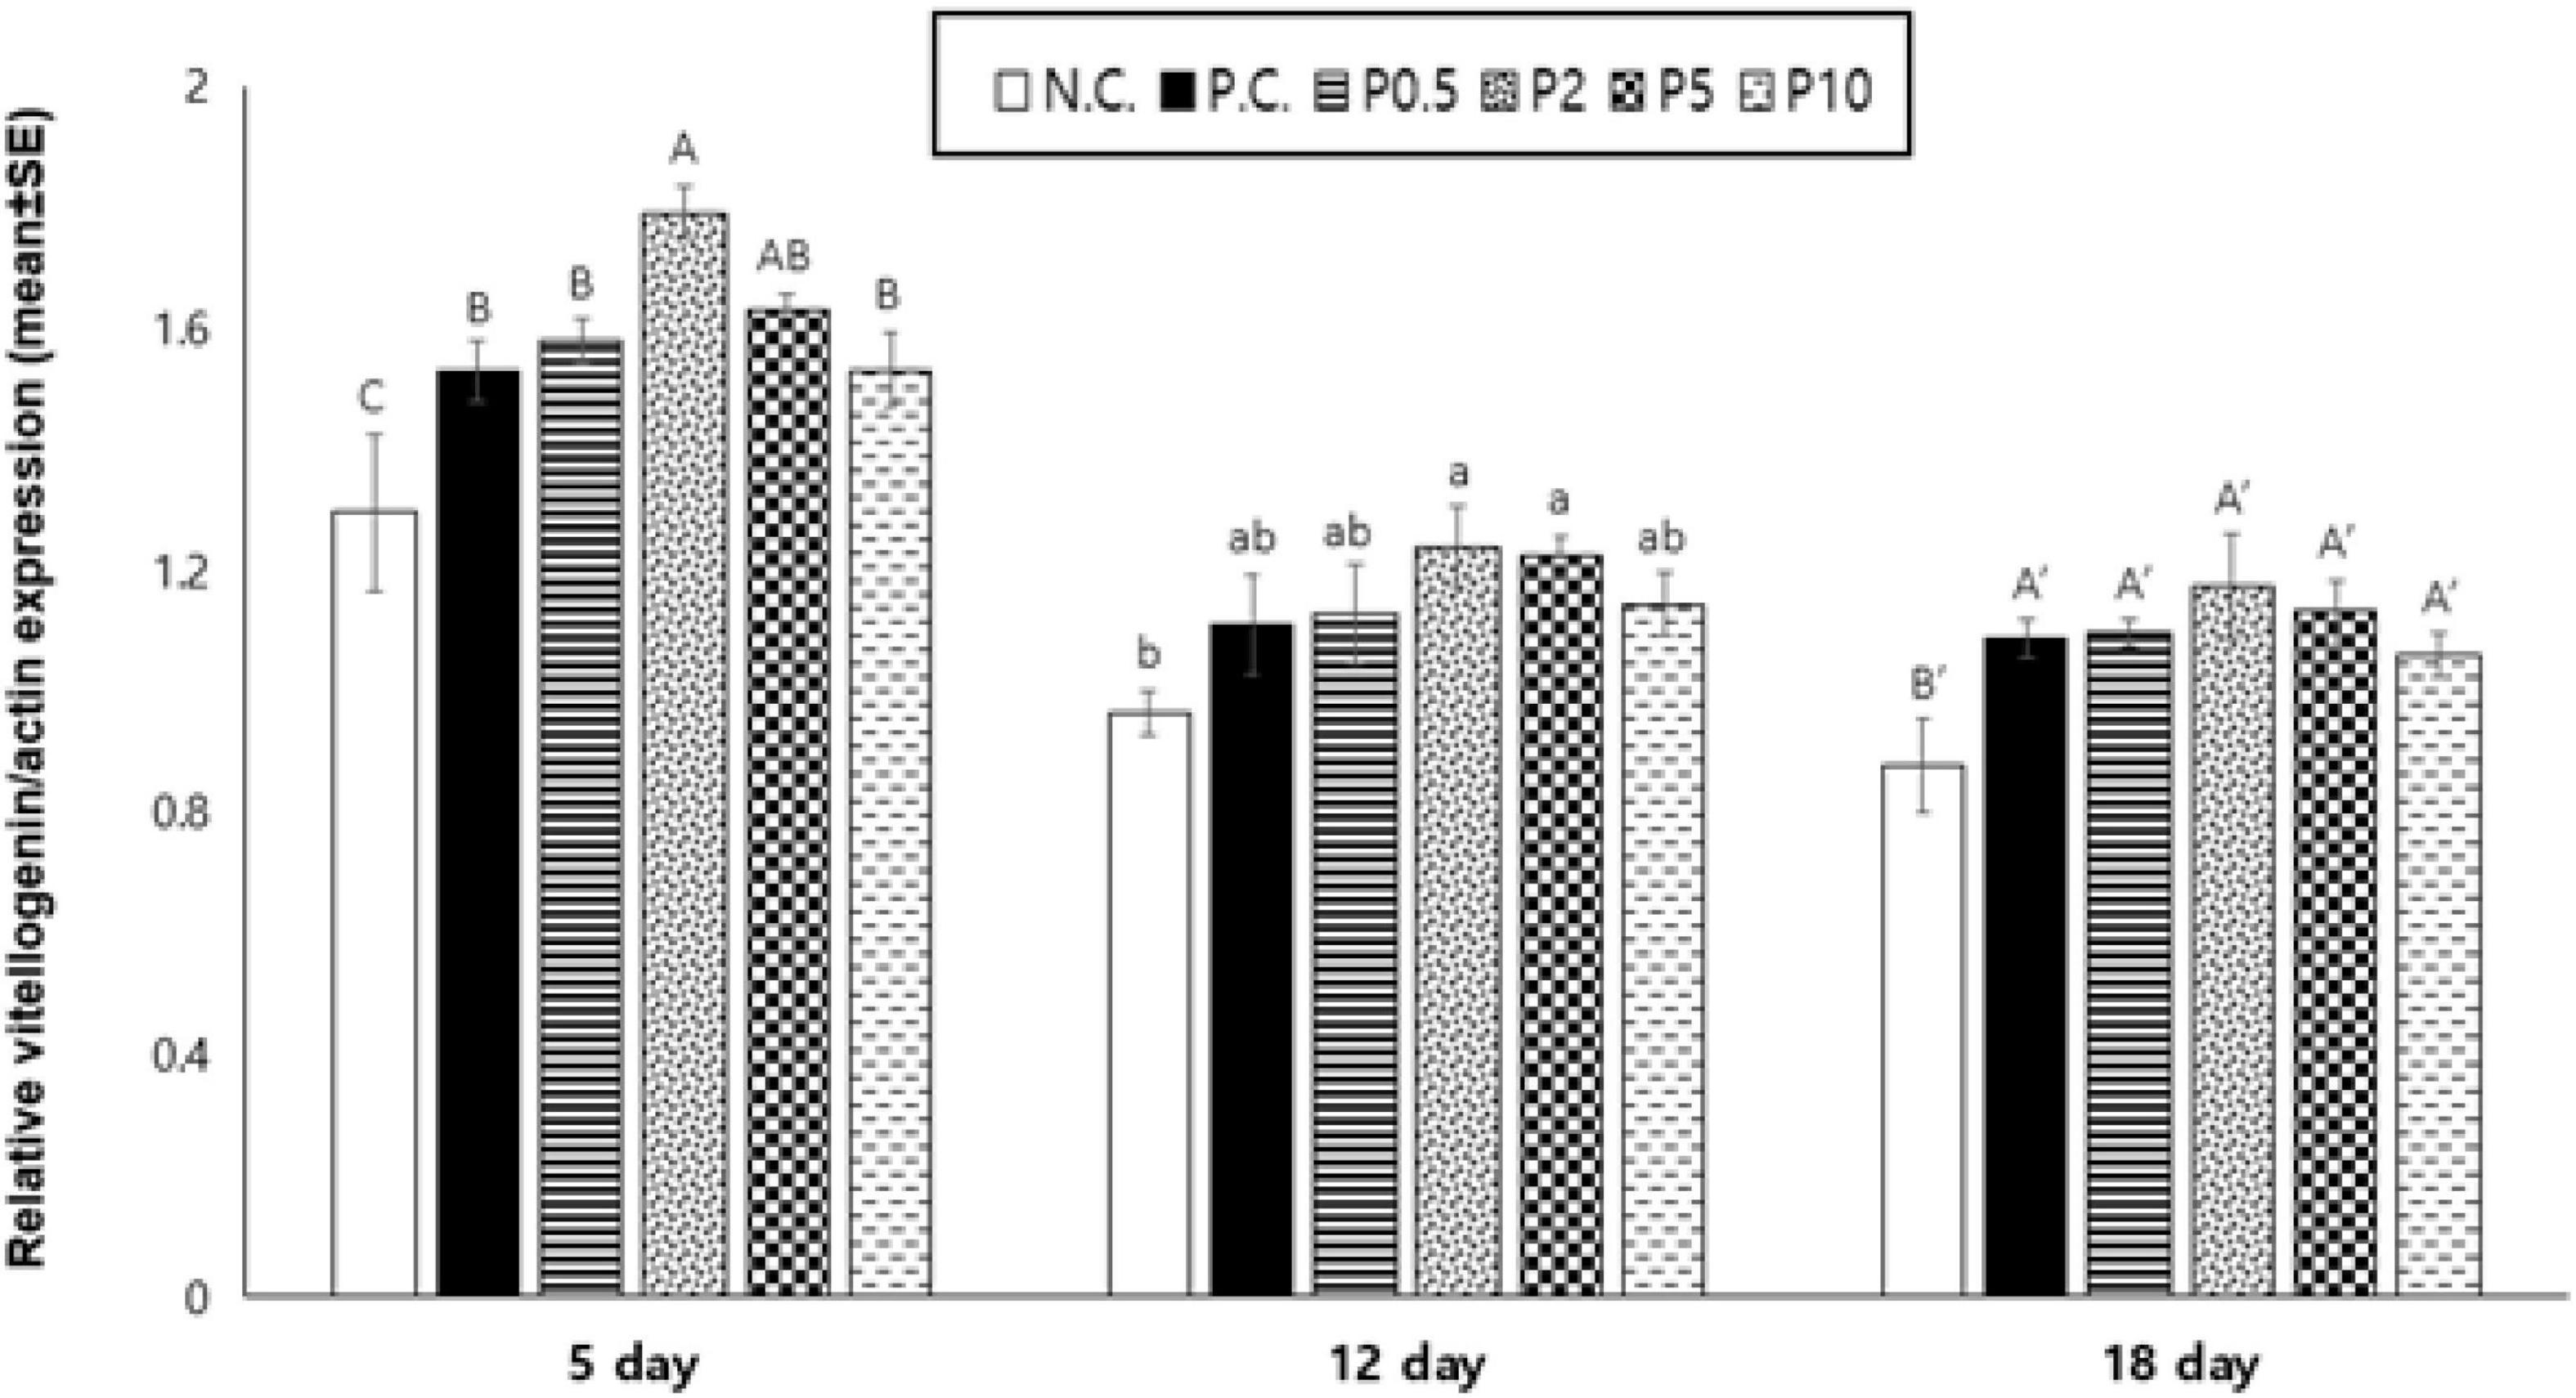
Figure 7. Relative vitellogenin expression/actin (mean ± SE) measured on days 5, 12, and 18 in caged honey bees fed with different diets. NC means negative control; PC means positive control. Different letters over the bar indicate statistically significant differences (p < 0.05).
Discussion
The addition of Chlorella enhanced the protein content of the honey bee feed significantly in comparison to the commercial rapeseed pollen patty (Supplementary Table 2). The higher nutritional value, especially the protein content, improved honey bee health as reflected by several parameters, including consumption, longevity, gland development, muscle formation, and Vg gene expression. Protein, including essential amino acids, is an important nutrient that plays an influential role in foraging behavior, food preference (Ghosh et al., 2020), and colony-level foraging decisions, which largely depend on balanced protein intake (Hendriksma et al., 2019b).
Different diet formulations were not equally consumed by bees in the experimental cages. Although consumption varies with the level of supplementation, overall, Chlorella-supplemented patty consumption was found significantly higher than the commercial rapeseed pollen patty intake. This finding is contrary to that reported in a previous study with spirulina (Arthrospira platensis), a kind of microalgae (Ricigliano and Simone-Finstrom, 2020). Ricigliano and Simone-Finstrom (2020) provided microalgae as a pollen substitute feed to honey bees, whereas Chlorella was used as a supplement with bee pollen in the present study. The presence of bio-stimulants or phagostimulants in pollen might help bees consume more pollen supplement feed (Schmidt, 1985). Furthermore, as revealed by the consumption pattern, the most favorable diet was P2, that is, pollen patty supplemented with 2% of Chlorella. On the other hand, consumption of sucrose was generally shown contrary to that of diets. For example, caged honey bees fed with P2 were shown the highest diet intake but the lowest sucrose intake among that protein diet. Generally, sugar, although not an essential nutrient, consumption indicates metabolic rate because of aerobic carbohydrate catabolism and obtained energy required for flight, walking, and maintaining the resting condition (Ricigliano et al., 2021). But when animals are provided with a single unbalanced diet and have no choice, the amount they eat should follow a “rule of compromise,” that is, over- or under-ingestion of specific nutrients can have substantial fitness consequences by homeostatic mechanisms (Paoli et al., 2014). Therefore, the pattern of diet and sugar consumption could be to meet the desired protein-to-carbohydrate ratio of honey bees.
The life span of caged honey bees fed with the P2 diet was the longest; however, no significant difference was found with P5. Herbert et al. (1977) found that caged bees fed with a high protein diet showed lower survival than those fed less protein, and presumably, the high mortality might be due to excessive protein resulting in an inability of bees to defecate (Human et al., 2007). The optimal amount of protein for caged honey bees was uncertain. The present study indicated that the protein contents of P2 and P5 diets were 19.55 and 20.47%, respectively, and could satisfy the protein requirement for the caged bees.
The venom gland sac becomes enlarged as the honey bee grows older. The size of the venom gland sac is proportional to the amount of venom that is used for colony defense (Nenchev, 2003). As protein is an important component for the development of the muscle and gland, the venom gland is supposed to be an important parameter to investigate the role of diet in bee development. On days 5 and 12, the volume of the venom sac of honey bees fed with 2% Chlorella-containing pollen patty (P2) was found significantly higher than that of controls, and the highest among the Chlorella-containing diet groups; however, there were no significant differences. Similarly, on day 18, no significant differences were found in the venom gland size of honey bees fed with different Chlorella-containing diets. However, hardly any study, to the best of our knowledge, on the correlation between production and quality of venom is available; it remains a task for future study. In contrast to the venom gland, the hypopharyngeal gland of the worker honey bee undergoes physiological changes as its role changes with the age of the honey bee (Ueno et al., 2015). The structure of the hypopharyngeal gland is age-dependent, and foragers display degenerative structures in their cells (Deseyn and Billen, 2005). Bees consume protein diets soon after emerging for their hypopharyngeal glands to fully develop for the royal jelly to care for larvae and queen bee in the colony (Hagedorn and Moeller, 1968). Our study revealed a similar pattern, that is, the hypopharyngeal gland acinus size, irrespective of the treatment groups, was higher on day 5 and gradually decreased thereafter. Honey Bees fed with P2 and P5 diets exhibited significantly higher acinus volume than those of other groups on all 3 observed days. However, the least was found in NC, followed by PC. The result obtained in the present study was in agreement with the previous study, which demonstrated that the application of Chlorella to caged honey bees modulated the hypopharyngeal gland size compared to the control (Jehlík et al., 2019).
Head protein levels are an important biomarker of nutritional status. Worker bees require increased protein synthesis in head hypopharyngeal glands to feed the colony via proteinaceous secretions (Crailsheim, 1990). As depicted by the amino acid profiling of the head of honey bees, the total amino acid and thus the protein content of heads of honey bees fed with a Chlorella-containing diet was significantly higher than that of control groups. It is noteworthy that although the protein content of different Chlorella-containing feeds exhibited statistically significant differences, no dose-dependent increment was found in the brain amino acid contents. On the other hand, the protein content of PC and P0.5 did not differ statistically, but the amino acid content of the brain was significantly higher in the P0.5 group than that of the PC group. This could be presumably because of the different digestibility of food resources. The digestibility of the bee pollen influences the nutrient value of the honey bees, and bees show different proteolytic activities depending on their age and caste (Szolderits and Crailsheim, 1993). Because of different exine and intine structures, depending on the botanical origin, the digestibility of the cell wall varies, and honey bees seem to digest pollen mainly by diffusion (Liolios et al., 2016). Although the digestibility of C. sorokiniana remains a future task, the study revealed that the ease of digestibility of Chlorella nutrients as the activity of protease, lipase, and amylase appeared to decline after Chlorella feeding in honey bees (Jehlík et al., 2019).
Dried thorax weight indicates protein assimilation of diet to flight muscle. It became heavier as honey bees became older depending on their labor, and forager bees have more developed flight muscles in the thorax than nurse bees (Brodschneider and Crailsheim, 2010). Hendriksma et al. (2019a) also reported weights of thoraces of foragers were heavier than those in nurse bees due to an increase in flight muscle mass. It had been claimed that depending on nutritional requirements, thorax development and foraging ability could be impaired (Scofield and Mattila, 2015). Chlorella supplementation enhances the thorax weight presumably because of provisioning sufficient protein requirement of honey bees. Similarly, Ricigliano and Simone-Finstrom (2020) reported that honey bees fed with a dried spirulina diet had a heavier thorax weight than those fed with a pollen substitute and only sugar solution. The fat body in insects, similar to the liver in vertebrates, is a bio-indicator of the immune response as it is associated with humoral immunity (Doums et al., 2002; Wilson-Rich et al., 2008). It can be used as an indirect indicator to evaluate the immune response and overall health (Wilson-Rich et al., 2008). The fat body is the primary organ of nutrition storage, lipid metabolism, and protein synthesis (Li et al., 2019). Nurse bees had greater fat body mass than foragers, as also depicted in the present study, indicating the greater ability of antipathogenic peptide production in young adult bees than in older bees (Brown et al., 2003). Vitellogenin is a glycolipoprotein produced in fat body cells with central storage and regulatory functions at the mRNA and protein levels by pollen consumption, supporting its use as a biomarker of diet quality and nutritional status (Amdam et al., 2005). This study revealed a similar pattern of fat body mass and Vg expression in response to the Chlorella-containing diet. Vitellogenin mRNA concentration in the head of worker honey bees decreased with age. A similar observation had been made by Corona et al. (2007). Vitellogenin is a principal storage protein in honey bees that is typically more abundant in nurses than in foragers. Amdam et al. (2006) demonstrated that the downregulation of Vg activity by RNAi caused increased gustatory responsiveness of worker bees, and perhaps, the downregulation could support the social foraging behavior of honey bees. Therefore, presumably, as the Vg expression in the honey bee head decreased with development, no effect of the diet on Vg expression on later days was observed.
Overall, the compositional changes of bee feed by the addition of Chlorella improved food consumption, longevity, gland development, muscle formation, and vitellogenin gene expression significantly in comparison to the only pollen or sugar diet, and in most of the cases, P2, that is, pollen diet with 2% of the Chlorella supplement exhibited the best outcome in terms of all the tested parameters. Therefore, based on the results obtained in the present study, we concluded that 2% Chlorella supplementation to pollen patty could enhance the health of honey bees, which in turn improves their performance. However, the colony-level study including the foraging behavior in response to the Chlorella-supplemented diet remains a further scope of the investigation.
Data availability statement
The datasets presented in this study can be found in online repositories. The names of the repository/repositories and accession number(s) can be found in the article/Supplementary material.
Author contributions
HJ: experimental design (supporting), data collection (lead), analysis (lead), and writing (lead). SG: experimental design (co-lead), data collection (supporting), analysis (co-lead), and writing (co-lead). SS and KC: data collection (supporting) and analysis (supporting). SM: identification of microalgae (supporting). CJ: experimental design (lead), writing (supporting), and supervising the project (lead). All authors edited and approved the final manuscript version.
Funding
This study was partly funded by the BSRP through the National Research Foundation of Korea (NRF), the Ministry of Education (NRF-2018R1A6A1A03024862), and the RDA agenda project on Honey Bee Health (PJ01577802).
Acknowledgments
We thank all laboratory members who helped with this work and our beekeepers.
Conflict of interest
The authors declare that the research was conducted in the absence of any commercial or financial relationships that could be construed as a potential conflict of interest.
Publisher’s note
All claims expressed in this article are solely those of the authors and do not necessarily represent those of their affiliated organizations, or those of the publisher, the editors and the reviewers. Any product that may be evaluated in this article, or claim that may be made by its manufacturer, is not guaranteed or endorsed by the publisher.
Supplementary material
The Supplementary Material for this article can be found online at: https://www.frontiersin.org/articles/10.3389/fevo.2022.922741/full#supplementary-material
Footnotes
References
Alaux, C., Folschweiller, M., McDonnell, C., Beslay, D., Cousin, M., Dussaubat, C., et al. (2011). Pathological effects of the microsporidium Nosema ceranae on honey bee queen physiology (Apis mellifera. J. Inverteb. Pathol. 106, 380–385. doi: 10.1016/j.jip.2010.12.005
Amdam, G. V., Aase, A. L. T. O., Seehuus, S. C., Fondrk, M. K., Norberg, K., and Hartfelder, K. (2005). Social reversal of immunosenescence in honey bee workers. Exp. Gerontol. 40, 939–947. doi: 10.1016/j.exger.2005.08.004
Amdam, G. V., Norberg, K., Page, R. E., Erber, J., and Scheiner, R. (2006). Downregulation of vitellogenin gene activity increases the gustatory responsiveness of honey bee workers Apis mellifera). Behav. Brain Res. 169, 201–205. doi: 10.1016/j.bbr.2006.01.006
AOAC (1990). Official methods of analysis, 15th Edn. Washington, DC: Association of Official Analytical Chemists.
Arenas, A., and Kohlmaier, M. G. (2019). Nectar source profitability influences individual foraging preferences for pollen and pollen-foraging activity of honey bee colonies. Behav. Ecol. Sociobiol. 73:34. doi: 10.1007/s00265-019-2644-5
Brodschneider, R., and Crailsheim, K. (2010). Nutrition and health in honey bees. Apidologie 41, 278–294. doi: 10.1051/apido/2010012
Brown, M. J. F., Moret, Y., and Schmid-Hempel, P. (2003). Activation of host constitutive immune defence by an intestinal trypanosome parasite of bumble bees. Parasitology 126, 253–260. doi: 10.1017/S0031182002002755
Caporgno, M. P., and Mathys, A. (2018). Trends in microalgae incorporation into innovative food products with potential health benefits. Front. Nutr. 5:58. doi: 10.3389/fnut.2018.00058
Corona, M., Velarde, R., Remolina, S., Moran-Lauter, A., Wang, Y., Hughes, K. A., et al. (2007). Vitellogenin, juvenile hormone, insulin signaling, and queen honey bee longevity. Proc. Natl. Acad. Sci. 104, 7128–7133. doi: 10.1073/pnas.0701909104
Crailsheim, K. (1990). The protein balance of the honey bee worker. Apidologie 21, 417–429. doi: 10.1051/apido:19900504
da Silva, J. (2019). Plastic senescence in the honey bee and the disposable soma theory. Am. Nat. 194, 367–380. doi: 10.1086/704220
Danneels, E. L., van Vaerenbergh, M., Debyser, G., Devreese, B., and de Graaf, D. C. (2015). Honey Bee Venom Proteome Profile of Queens and Winter Bees as Determined by a Mass Spectrometric Approach. Toxins 7, 4468–4483. doi: 10.3390/toxins7114468
DeGrandi-Hoffman, G., Chen, Y., Huang, E., and Huang, M. H. (2010). The effect of diet on protein concentration, hypopharyngeal gland development and virus load in worker honey bees (Apis mellifera L.). J. Insect Physiol. 56, 1184–1191. doi: 10.1016/j.jinsphys.2010.03.017
Deseyn, J., and Billen, J. (2005). Age-dependent morphology and ultrastructure of the hypopharyngeal gland of Apis mellifera workers (Hymenoptera Apidae). Apidologie 36, 49–57. doi: 10.1051/apido:2004068
Dostá,lková, S., Urajová, P., Činčárová, D., Vránová, T., Hrouzek, P., Petřivalský, M., et al. (2021). Fatty acids and their derivatives from Chlorella vulgaris extracts exhibit in vitro antimicrobial activity against the honey bee pathogen Paenibacillus larvae. J. Apic. Res. doi: 10.1080/00218839.2021.1994264
Doums, C., Moret, Y., Benelli, E., and Schmid-Hempel, P. (2002). Senescence of immune defence in Bombus workers. Ecol. Entomol. 27, 138–144. doi: 10.1046/j.1365-2311.2002.00388.x
Ghosh, S., Jeon, H., and Jung, C. (2020). Foraging behavior and preference of pollen source by honey bee (Apis mellifera) relative to protein contents. J. Ecol. Environ. 44:4. doi: 10.1186/s41610-020-0149-9
Ghosh, S., and Jung, C. (2020). Changes in nutritional composition from bee pollen to pollen patty used in bumblebee rearing. J. Asia Pac. Entomol. 23, 701–708. doi: 10.1016/j.aspen.2020.04.008
Ghosh, S., and Jung, C. (2022). Temporal changes of nutrient composition from pollen patty to bee bread with special emphasis on amino and fatty acids composition. J. Asia Pac. Entomol. 25, 101873. doi: 10.1016/j.aspen.2022.101873
Ghosh, S., Lee, S. M., Jung, C., and Meyer-Rochow, V. B. (2017). Nutritional composition of five commercial edible insects in South Korea. J. Asia Pac. Entomol. 20, 686–694. doi: 10.1016/j.aspen.2017.04.003
Hagedorn, H. H., and Moeller, F. E. (1968). Effect of the Age of Pollen Used in Pollen Supplements on Their Nutritive Value for the honey bee. I. Effect on Thoracic Weight, Development of Hypopharyngeal Glands, and Brood Rearing. J. Apic. Res. 7, 89–95. doi: 10.1080/00218839.1968.11100195
Hall, T. A. (1999). BioEdit: A user-friendly biological sequence alignment editor and analysis program for Windows 95/98/NT. Nucleic Acids Symp. Ser. 41, 95–98.
Hendriksma, H. P., Pachow, C. D., and Nieh, J. C. (2019a). Effects of essential amino acid supplementation to promote honey bee gland and muscle development in cages and colonies. J. Insect Physiol. 117:103906. doi: 10.1016/j.jinsphys.2019.103906
Hendriksma, H. P., Toth, A. L., and Shafir, S. (2019b). Individual and colony level foraging decisions of bumble bees and honey bees in relation to balancing of nutrient needs. Front. Ecol. Evol. 7:177. doi: 10.3389/fevo.2019.00177
Herbert, E. W., Shimanuki, H., and Caron, D. (1977). Optimum protein levels required by honey bees (Hymenoptera, Apidae) to initiate and maintain brood rearing. Apidologie 8, 141–146.
Hrassnigg, N., and Crailsheim, K. (1998). Adaptation of hypopharyngeal gland development to the brood status of honey bee (Apis mellifera L.) colonies. J. Insect Physiol. 44, 929–939. doi: 10.1016/S0022-1910(98)00058-4
Human, H., Nicolson, S. W., Strauss, K., Pirk, C. W. W., and Dietemann, V. (2007). Influence of pollen quality on ovarian development in honey bee workers (Apis mellifera scutellata). J. Insect Physiol. 53, 649–655. doi: 10.1016/j.jinsphys.2007.04.002
Jehlík, T., Kodrík, D., Krištùfek, V., Koubová, J., Sábová, M., Danihlík, J., et al. (2019). Effects of Chlorella sp. on biological characteristics of the honey bee Apis mellifera. Apidologie 50, 564–577. doi: 10.1007/s13592-019-00670-3
Jeon, J. H., Moon, K. H., Kim, Y. H., and Kim, Y. H. (2020). Reference gene selection for qRT-PCR analysis of season- and tissue-specific gene expression profiles in the honey bee Apis mellifera. Sci. Rep. 10:13935. doi: 10.1038/s41598-020-70965-4
Keller, I., Fluri, P., and Imdorf, A. (2005). Pollen nutrition and colony development in honey bees: Part 1. Bee World 86, 3–10. doi: 10.1080/0005772X.2005.11099641
Köhler, A., Nicolson, S. W., and Pirk, C. W. W. (2013). A new design for honey bee hoarding cages for laboratory experiments. J. Apic. Res. 52, 12–14. doi: 10.3896/IBRA.1.52.2.03
Lauter, W. M., and Vrla, V. L. (1939). Factors influencing the formation of the venom of the honey bee. J. Econ. Entomol. 32, 806–807. doi: 10.1093/jee/32.6.806
Li, S., Yu, X., and Feng, Q. (2019). Fat Body Biology in the Last Decade. Annu. Rev. Entomol. 64, 315–333. doi: 10.1146/annurev-ento-011118-112007
Liolios, V., Tananaki, C., Dimou, M., Kanelis, D., Goras, G., Karazafiris, E., et al. (2016). Ranking pollen from bee plants according to their protein contribution to honey bees. J. Apic. Res. 54, 582–592. doi: 10.1080/00218839.2016.1173353
Madeira, M. S., Cardoso, C., Lopes, P. A., Coelho, D., Afonso, C., Bandarra, N. M., et al. (2017). Microalgae as feed ingredients for livestock production and meat quality: A review. Livest. Sci. 205, 111–121. doi: 10.1016/j.livsci.2017.09.020
Nagarajan, D., Varjani, S., Lee, D. J., and Chang, J. S. (2021). Sustainable aquaculture and animal feed from microalgae-Nutritive value and techno-functional components. Renew. Sust. Energ. Rev. 150:111549. doi: 10.1016/j.rser.2021.111549
Naug, D., and Gibbs, A. (2009). Behavioral changes mediated by hunger in honey bees infected with Nosema ceranae. Apidologie 40, 595–599. doi: 10.1051/apido/2009039
Nenchev, P. (2003). Seasonal changes in the venom gland of the honey bee Apis mellifera L. in Bulgaria. Zhivotnovdni Nauki 40, 87–88.
Omar, E., Abd-Ella, A. A., Khodairy, M. M., Moosbeckhofer, R., Crailsheim, K., and Brodschneider, R. (2017). Influence of different pollen diets on the development of hypopharyngeal glands and size of acid gland sacs in caged honey bees (Apis mellifera). Apidologie 48, 425–436. doi: 10.1007/s13592-016-0487-x
Paoli, P. P., Donley, D., Stabler, D., Saseendranath, A., Nicolson, S. W., Simpson, S. J., et al. (2014). Nutritional balance of essential amino acids and carbohydrates of the adult worker honey bee depends on age. Amino. Acids 46, 1449–1458. doi: 10.1007/s00726-014-1706-2
Qiu, S., Wang, S., Xiao, C., and Ge, S. (2019). Assessment of microalgae as a new feeding additive for fruit fly Drosophila melanogaster. Sci. Total Environ. 667, 455–463. doi: 10.1016/j.scitotenv.2019.02.414
Ricigliano, V. A. (2020). Microalgae as a promising and sustainable nutrition source for managed honey bees. Arch. Insect Biochem. Physiol. 104:e21658. doi: 10.1002/arch.21658
Ricigliano, V. A., Ihle, K. E., and Williams, S. T. (2021). Nutrigenetic comparison of two Varroa-resistant honey bee stocks fed pollen and spirulina microalgae. Apidologie 52, 873–886. doi: 10.1007/s13592-021-00877-3
Ricigliano, V. A., and Simone-Finstrom, M. (2020). Nutritional and prebiotic efficacy of the microalga Arthrospira platensis (spirulina) in honey bees. Apidologie 51, 898–910. doi: 10.1007/s13592-020-00770-5
Schmidt, J. O. (1995). Toxinology of venoms from the honey bee genus Apis. Toxicon 33, 917–927. doi: 10.1016/0041-0101(95)00011-A
Schmidt, J. O., Thoenes, S. C., and Levin, M. D. (1987). Survival of honey bees, Apis mellifera (Hymenoptera: Apidae), fed various pollen sources. Ann. Entomol. Soc. Am. 80, 176–183. doi: 10.1093/aesa/80.2.176
Scofield, H. N., and Mattila, H. R. (2015). Honey bee workers that are pollen stressed as larvae become poor foragers and waggle dancers as adults. PLoS One 10:e0121731. doi: 10.1371/journal.pone.0121731
Standifer, L. N., and Mills, J. P. (1977). The Effects of Worker Honey Bee Diet and Age on the Vitamin Content of Larval Food. Ann. Entomol. Soc. Am. 70, 691–694. doi: 10.1093/aesa/70.5.691
Szolderits, M. J., and Crailsheim, K. (1993). A comparison of pollen consumption and digestion in honey bee (Apis mellifera carnica) drones and workers. J. Insect Physiol. 39, 877–881. doi: 10.1016/0022-1910(93)90120-g
Ueno, T., Takeuchi, H., Kawasaki, K., and Kubo, T. (2015). Changes in the gene expression profiles of the hypopharyngeal gland of worker behavior and hormonal factors. PLoS One 10:e0130206. doi: 10.1371/journal.pone.0130206
van Engelsdorp, D., Evans, J. D., Saegerman, C., Mullin, C., Haubruge, E., Nguyen, B. K., et al. (2009). Colony collapse disorder: A descriptive study. PLoS One 4:e6481. doi: 10.1371/journal.pone.0006481
Wegener, J., Jakop, U., Schiller, J., and Müller, K. (2018). The membrane phospholipid composition of honey bee (Apis mellifera) workers reflects their nutrition, fertility, and vitellogenin stores. Insect Soc. 65, 381–391. doi: 10.1007/s00040-018-0623-x
Williams, G. R., Alaux, C., Costa, C., Csáki, T., Doublet, V., Eisenhardt, D., et al. (2013). Standard methods for maintaining adult Apis mellifera in cages under in vitro laboratory conditions. J. Apic. Res. 52, 1–37. doi: 10.3896/IBRA.1.52.1.04
Wilson-Rich, N., Dres, S. T., and Starks, P. T. (2008). The ontogeny of immunity: Development of innate immune strength in the honey bee (Apis mellifera). J. Insect Physiol. 54, 1392–1399. doi: 10.1016/j.jinsphys.2008.07.016
Keywords: feed formulation, nutrition, pollen supplement, physiology, vitellogenin, gene expression, amino acid
Citation: Jang H, Ghosh S, Sun S, Cheon KJ, Mohamadzade Namin S and Jung C (2022) Chlorella-supplemented diet improves the health of honey bee (Apis mellifera). Front. Ecol. Evol. 10:922741. doi: 10.3389/fevo.2022.922741
Received: 18 April 2022; Accepted: 28 July 2022;
Published: 18 August 2022.
Edited by:
Lin Zhang, Hubei University of Chinese Medicine, ChinaReviewed by:
Ernesto Guzman-Novoa, University of Guelph, CanadaGuo Jun, Kunming University of Science and Technology, China
Copyright © 2022 Jang, Ghosh, Sun, Cheon, Mohamadzade Namin and Jung. This is an open-access article distributed under the terms of the Creative Commons Attribution License (CC BY). The use, distribution or reproduction in other forums is permitted, provided the original author(s) and the copyright owner(s) are credited and that the original publication in this journal is cited, in accordance with accepted academic practice. No use, distribution or reproduction is permitted which does not comply with these terms.
*Correspondence: Chuleui Jung, Y2p1bmdAYW5kb25nLmFjLmty
 Hyeonjeong Jang
 Sampat Ghosh
 Sukjun Sun1
 Kang Jun Cheon
 Saeed Mohamadzade Namin
 Chuleui Jung