 Kristen S. Ellis1*
 Aaron T. Pearse1David A. Brandt1Mark T. Bidwell2Wade Harrell3
 Matthew J. Butler3
 Max Post van der Burg1
- 1U.S. Geological Survey, Northern Prairie Wildlife Research Center, Jamestown, ND, United States
- 2Canadian Wildlife Service, Environment and Climate Change Canada, Saskatoon, SK, Canada
- 3U.S. Fish and Wildlife Service, Austwell, TX, United States
The expansion of human infrastructure has contributed to novel risks and disturbance regimes in most ecosystems, leading to considerable uncertainty about how species will respond to altered landscapes. A recent assessment revealed that whooping cranes (Grus americana), an endangered migratory waterbird species, avoid wind-energy infrastructure during migration. However, uncertainties regarding collective impacts of other types of human infrastructure, such as power lines, variable drought conditions, and continued construction of wind energy infrastructure may compromise ongoing recovery efforts for whooping cranes. Droughts are increasing in frequency and severity throughout the whooping crane migration corridor, and the impacts of drought on stopover habitat use are largely unknown. Moreover, decision-based analyses are increasingly advocated to guide recovery planning for endangered species, yet applications remain rare. Using GPS locations from 57 whooping cranes from 2010 through 2016 in the United States Great Plains, we assessed habitat selection and avoidance of potential disturbances during migration relative to drought conditions, and we used these results in an optimization analysis to select potential sites for new wind energy developments that minimize relative habitat loss for whooping cranes and maximize wind energy potential. Drought occurrence and severity varied spatially and temporally across the migration corridor during our study period. Whooping cranes rarely used areas <5 km from human settlements and wind energy infrastructure under both drought and non-drought conditions, and <2 km from power lines during non-drought conditions, with the lowest likelihood of use near wind energy infrastructure. Whooping cranes differed in their selection of wetland and cropland land cover types depending on drought or non-drought conditions. We identified scenarios for wind energy expansion across the migration corridor and in select states, which are robust to uncertain drought conditions, where future loss of highly selected stopover habitats could be minimized under a common strategy. Our approach was to estimate functional habitat loss while integrating current disturbances, potential future disturbances, and uncertainty in drought conditions. Therefore, dynamic models describing potential costs associated with risk-averse behaviors resulting from future developments can inform proactive conservation before population impacts occur.
Introduction
Ecological systems are increasingly affected by novel disturbance regimes that wildlife species have not experienced historically. Disturbances caused by humans have led to fragmented landscapes with altered patch sizes and configuration, likely changing selection pressures and thus the behaviors and fitness of individuals. Such disturbances can directly impact wildlife species through increased mortality (e.g., Trombulak and Frissell, 2000, Calvert et al., 2013, Frick et al., 2017), or indirectly through demographic consequences of habitat fragmentation and loss (Rybicki and Hanski, 2013). How species respond to disturbances partially depends on their degree of habitat specialization and extent to which disturbances impact limiting resources (Devictor et al., 2008). Further, disturbances can induce costly avoidance behaviors that may compromise individual fitness and consequently alter population dynamics (Frid and Dill, 2002). These avoidance behaviors can be exaggerated (and more energetically costly) compared to optimal behaviors that would be necessary for avoiding mortality, perhaps reflecting a mismatch in how wildlife perceive rapid landscape changes (Smith et al., 2021). Understanding how individuals and populations respond in post-disturbance landscapes may provide insights into the ability of species to persist in landscapes that continue to experience climate and land use changes.
This understanding of wildlife responses may be especially useful in assessing whether avoidance of disturbances or other human activities could lead to a functional loss of preferred habitats (Dyer et al., 2001, Polfus et al., 2011, Barré et al., 2018, Heinemeyer et al., 2019). Functional loss of habitats differs from direct habitat loss because seemingly suitable habitats are avoided (Dyer et al., 2001). Avoidance behaviors can vary among individuals in a population (Duchesne et al., 2010) and with environmental conditions such as severe weather (Beckmann et al., 2012, Sawyer et al., 2017). Different types of human disturbances may also vary in how they are arranged on the landscape, such as linear features (e.g., roads, power lines) or grouped features (e.g., mining, oil extraction, and wind-energy infrastructure). We expect that variation in species responses to these disturbances and the characteristics of disturbances likely exert different effects on species avoidance and have the potential to interact cumulatively (Polfus et al., 2011).
For migratory species that occupy diverse landscapes throughout their annual cycles, the type and intensity of disturbances these species encounter also presumably vary. Human disturbances and infrastructure have been shown to interrupt migration, increase reposition movements, or delay departure in migratory species (Dussault et al., 2007, Seidler et al., 2015, Wilson R. R. et al., 2016), yet much of the research evaluating habitat use across migration pathways relative to human disturbances has been conducted on ungulates. Greater uncertainty exists regarding risk-adverse responses in avian species during migration, partially due to difficulties in obtaining time-series of use data at a fine spatial scale. Such data are important because species select specific points to stop during migration and these points may be different from year-to-year or season-to-season as habitat quality changes.
Migratory waterbirds are likely to display dynamic use patterns in response to fine-scale variation in stopover habitat. Anthropogenic disturbances, layered on top of natural variation in stopover habitat, are likely to make inferring use patterns more difficult if all important variables are not accounted for. For example, most migratory waterbirds require networks of patchily distributed and ephemeral wetland habitats as stopover sites (Merken et al., 2015, Xu et al., 2019). However, human presence and vehicle disturbance have been shown to displace waterbirds at coastal stopover sites during migration (Pfister et al., 1992, Tarr et al., 2010); thus, it is plausible that human disturbances could functionally alter stopover availability. The interplay between fine-scale natural variation in stopover sites and human disturbance could make conservation planning a difficult task for this group of species (Kirby et al., 2008, Runge et al., 2015).
Conservation and recovery efforts for endangered whooping cranes (Grus americana), a migratory waterbird in North America, include preserving stopover habitats used during migration (Canadian Wildlife Service and U.S. Fish and Wildlife Service, 2005). Whooping cranes of the Aransas-Wood Buffalo population migrate through the Great Plains of the United States and Canadian Prairies between breeding and non-breeding seasons (Kuyt, 1992, Pearse et al., 2018). Wetland habitats used by whooping cranes along this extensive migration corridor have been highly modified by humans (Dahl, 2011, Lark et al., 2020). For example, a recent assessment revealed that whooping cranes avoid wind-energy infrastructure during migration, resulting in functional losses of suitable stopover habitats (Pearse et al., 2021), a pattern of displacement similarly observed in other avian species (Shaffer and Buhl, 2016, Marques et al., 2020, Fielding et al., 2021). The generation of renewable energy with wind power has rapidly expanded in recent decades, is economically competitive, and provides benefits for mitigating effects of climate change (IPCC, 2011). Because the wind energy industry is expected to continue growing (Veers et al., 2019), developing strategies for addressing the siting of new developments at the intersection of clean energy and biological conservation is of increasing importance for the conservation of species that potentially interact with wind towers (Shaffer et al., 2019).
We assessed how patterns of wind development altered habitat selection and avoidance of GPS-tagged whooping cranes while accounting for other potential disturbances during migration. A challenge in understanding impacts of anthropogenic disturbances on wildlife species occurs when environmental conditions alter distribution and habitat use, and thus mediate the severity of disturbances. Whooping cranes that migrate through the Great Plains of the United States and Canadian Prairies experience a wide range of environmental conditions, including spatially and temporally varying drought conditions that can directly affect availability of wetlands (McIntyre et al., 2014). Droughts are increasing in frequency and severity (IPCC, 2021) and have additionally been shown to influence primary productivity (Huang et al., 2016), invertebrate community composition (Neto et al., 2010), and thus refueling opportunities and movement patterns of migratory birds (Anderson et al., 2021). Consequently, we examined how the effects of drought modulate individual- and population-level habitat selection relative to three types of human disturbances: wind energy infrastructure, power lines, and towns and cities. We predicted that whooping cranes would avoid these disturbances at different distances and magnitudes because of varying perceptions of potential risk (Martin, 2011). We also predicted that drought conditions would reduce the magnitude of avoidance as there would be less available stopover habitat. Alternatively, if infrastructure avoidance is high during droughts, droughts may exacerbate effects of avoidance by forcing individuals to move farther and possibly expend more energy to locate suitable stopover habitats.
Of course, habitat use relative to natural and anthropogenic disturbance should have implications for deciding where to protect stopover sites and where to develop wind energy facilities whenever wildlife are included in valuations/cost-benefit analyses. Typically, prioritizing potential sites for wind energy infrastructure is driven by expected wind energy output and other regulatory, administrative, and societal concerns (Yu et al., 2006, Song et al., 2016, Shaffer et al., 2022). However, incorporating potential direct hazards to birds in spatial planning of wind energy developments has shown to be ecologically valuable (Kuvlesky et al., 2007, Aydin et al., 2010, Bohrer et al., 2013, May et al., 2017). We used a simple optimization algorithm to evaluate the potential tradeoff between wind energy development and conserving whooping crane conservation. Our algorithm sought to select proposed development sites that maximized wind power potential and minimized whooping crane habitat loss, while accounting for spatially explicit drought conditions during the time of the study. We discuss the findings from our analyses in terms of whether wind energy infrastructure can be expanded while minimally impacting highly selected stopover habitats for endangered whooping cranes. More generally, we provide a framework of how multiple environmental factors can be balanced to provide optimal solutions for future placement of human developments when considering impacts on wildlife species.
Materials and methods
Study area
Pearse et al. (2018) delineated a migration corridor for the Aransas-Wood Buffalo Population (the only remnant wild population) of whooping cranes migrating through central Canada and the United States. Consistent with previous work (Pearse et al., 2021), we used a 50-km buffer surrounding the 95% migration corridor in the United States as our study area which includes parts of Montana, North Dakota, South Dakota, Nebraska, Kansas, Oklahoma, and Texas. Most of the study area falls inside the Great Plains, an extensive grassland biome in central North America, which has undergone considerable agricultural conversion (Hartman et al., 2011). The region includes wetlands, lakes, reservoirs, and rivers that attract millions of migratory waterbirds, including whooping cranes (Laubhan and Fredrickson, 1997). Whooping cranes are attracted to areas with greater wetland density and use different types of surface water as nightly roosts and diurnal foraging sites during migration (Pearse et al., 2017, Niemuth et al., 2018).
Field data
As part of a long-term research project, we captured 68 whooping cranes between 2009–2014 and attached platform transmitting terminals with global position system (GPS) capabilities (North Star Science and Technology LLC, Baltimore, MD, United States and Geotrak, Inc., Apex, NC, United States) at sites in and around Wood Buffalo National Park (Canada) and along coastal Texas. Pearse et al. (2015) provides more detailed descriptions of capture and marking procedures, which included capture by hand at breeding grounds and use of modified leg snares at wintering grounds (Kuyt, 1979, Folk et al., 2005). Transmitters collected 4–5 GPS locations daily at equal time intervals. We initially inspected GPS locations for errors occurring during collection or transmission on the Argos satellite system (Service Argos, 2001) and performed multiple assessments to determine plausibility of locations and classified locations as occurring in flight when instantaneous velocity reading was >2.6 m/s (Byrne et al., 2017, Pearse et al., 2020a). Transmitter loss was minimal as 57 of 68 marked whooping cranes provided data during migration, and most individuals provided data in multiple years of the study (median number of years = 3, range = 1–6). The ages of marked whooping cranes ranged from juvenile to adult (30 individuals were initially captured as juveniles).
Locations were identified for each migration made by whooping cranes, which included the last point before migration initiation, subsequent flight and ground locations, and the first location after completion of migration. Migration initiation was defined by consistent movements away from wintering or summering areas, and completion of migration was determined by settling behavior, generally at known or traditional terminal locations (Pearse et al., 2020b). We identified two types of movements during migration that required different methods for randomly selecting paired available locations:migration movements and stopover movements (Pearse et al., 2021). Migration movements were designated as occurring between previously identified stopover sites (Pearse et al., 2020b). Using distance and bearing between successive stopover sites, we selected available locations to pair with each initial ground location at a stopover site by selecting 19 random locations that were <2 times the migration distance (constrained to distances to between 5 and 1,500 km) and at a bearing ±22.5° from the migration movement bearing (Pearse et al., 2021). When migration movements were <6 km, we selected locations between 1 km and 2 times the movement distance and removed the bearing constraint.
Available locations for stopover movements, movements occurring while whooping cranes resided at a stopover for one to multiple days, were selected using a different procedure than was used for migration movements. We first removed redundant nighttime locations, as whooping cranes generally do not move from nighttime roosts (Pearse et al., 2017). We identified nighttime periods (0.5 h after sunset to 0.5 h before sunrise) where multiple locations were acquired and randomly selected one to represent the nighttime location. For selected nighttime locations and remaining diurnal locations at stopover sites, we selected 19 available locations within a 5-km radius surrounding the used location (see Figure 1C in Pearse et al., 2021). Consistent with Pearse et al. (2021), we chose 5 km as defining available locations because 95% of movements within stopover sites were <5 km.
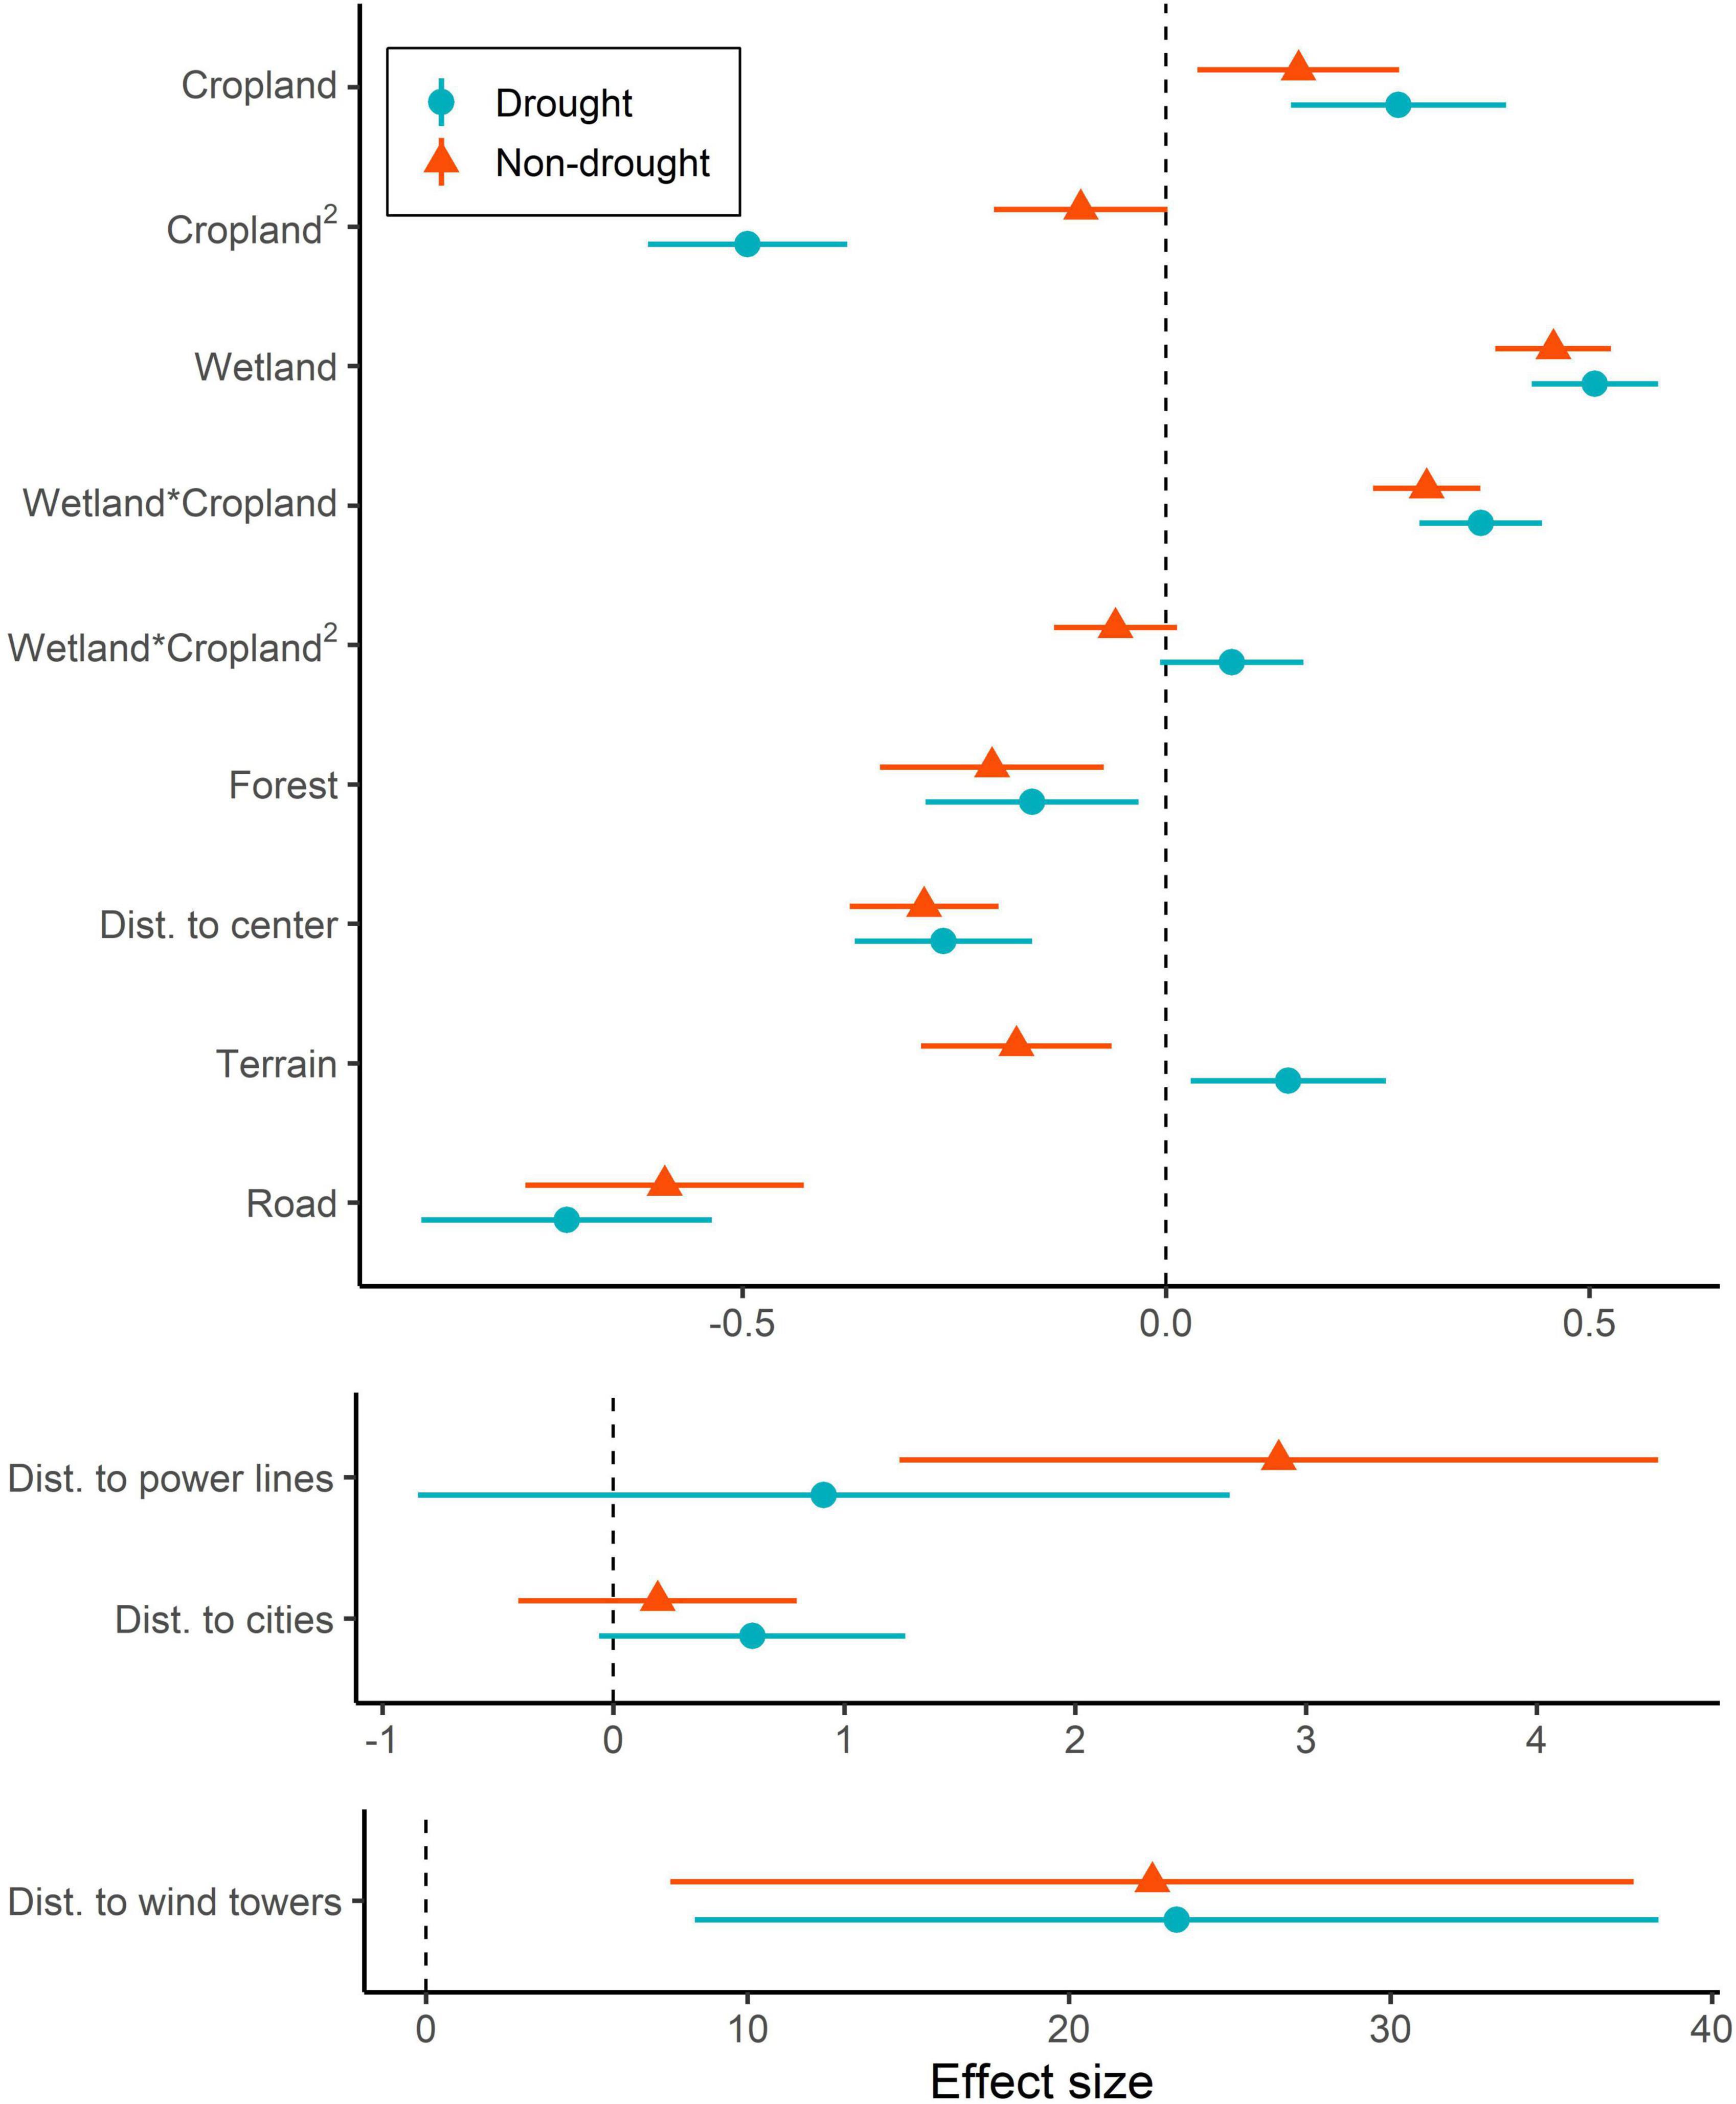
Figure 1. Population-level mean estimates and 95% credible intervals in drought and non-drought conditions from the final global model estimating resource selection functions of migrating whooping cranes (Grus americana) in the United States Great Plains, 2010–2016. Vertical dotted lines designate an effect of zero. Note that x-axes differ to allow for visualization of effects that vary in magnitude.
Predictor variables
We used landscape variables to explain space use of migrating whooping cranes based on a habitat selection model completed in North Dakota and South Dakota (Niemuth et al., 2018) and across the entire study area (Pearse et al., 2021). We created raster representations of predictor variables across the study area at a 30-m resolution. We calculated a distance raster from the center of the 95% whooping crane migration corridor (Pearse et al., 2018), which served as a variable defining geographic position along the corridor. General landform was quantified with a terrain roughness index by calculating the standard deviation of elevations within an 800-m radius moving window.
We assessed landscape composition using multiple moving windows at radii of 800, 1,200, 1,600, and 3,200 m. Because wetland use has been described as a key indicator of whooping crane habitat selection (Howe, 1989, Austin and Richert, 2005, Niemuth et al., 2018, Baasch et al., 2019), we calculated the percentage of area defined as wetland basin based on National Wetlands Inventory data (U.S. Fish and Wildlife Service, 2018). Consistent with Pearse et al. (2021), we omitted intermittent riverine features because we assumed this basin type would not be consistently available surface water to whooping cranes. Otherwise, we did not discriminate among wetland basin types, because our data were collected during years with varying wetland conditions. We derived alternative predictor variables that included only density of palustrine, lacustrine, and riverine basins as a comparison with the all-basin variable.
Wetland basins provided a metric of potential surface water but did not provide insight into the hydroperiod or dynamic availability of surface water. We summarized annual and seasonal (i.e., spring and autumn) occurrence and recurrence of surface water derived from Landsat satellite imagery (Pekel et al., 2016). Surface water occurrence was defined for each raster cell as the proportion of scenes in which water was detected. This value was averaged across all months in each year or for select months during spring (March, April, and May) and autumn (September, October, and November) for seasonal values. Surface water recurrence was also defined for each Landsat cell as the proportion of scenes in which water was detected but removing values before the first instance of water and after the last instance of water. Like wetland variables, we conducted a moving window analysis at the four spatial scales described above for overall and seasonal surface water occurrence and recurrence predictor variables.
Cropland is a dominant land cover type in the Great Plains, and migrating whooping cranes use croplands as foraging sites and roost in wetlands within croplands (Howe, 1989, Baasch et al., 2019). We used National Land Cover Databases (NLCD) from 2013 (Yang et al., 2018) to summarize percentage of cropland present at the four spatial scales. Whooping cranes have been found to select sites with little visual obstruction, presumably so that they can detect potential dangers (Armbruster, 1990). We used summarized percentage of forest land cover as identified from the NLCD using four spatial scales as a metric of cover type, because we assumed cranes would avoid using forested areas or landscapes with a high percentage of forested area.
Whooping cranes have been known to avoid anthropogenic landscape features, which affects use near potential disturbances (Armbruster, 1990, Baasch et al., 2019, Pearse et al., 2021); therefore, we quantified known and potential disturbances with multiple predictor variables. Density of all roads and roads outside of towns and cities was calculated by summing the length of road within the four spatial scales throughout the study area. We used the USGS national map to identify the road network and place boundaries (U.S. Geological Survey, 2014). We also quantified distance from towns and cities (all and municipalities >30.5 km2), power lines, and wind energy infrastructure. Power line information came from the Homeland Infrastructure Foundation-Level Data.1 We calculated values for wind energy infrastructure for each year of our study, because the number of wind towers across the region increased with time (Pearse et al., 2021). Wind tower locations and year of initial service were included in Hoen et al. (2018). We scaled predictor variables by subtracting the mean and dividing by the standard deviation to permit simpler computation and interpretation of effect sizes (Muff et al., 2020). For distance from wind infrastructure, we used mean and standard deviations for 2016 to scale other years.
Drought conditions
We gathered seasonal drought conditions as geospatial shapefiles from the U.S. Drought Monitor.2 We downloaded one condition map for each migration season 2010–2016; conditions during mid-April represented a year’s spring migration and conditions during mid-October represented a year’s autumn migration. The U.S. Drought Monitor used 5 categories of drought conditions and a category for “no drought” which were all categorized using multiple assessment indices that characterize soil moisture, streamflow, and precipitation (more information can be found at https://droughtmonitor.unl.edu/About/AbouttheData/DroughtClassification.aspx). Because we sought to investigate effects of extreme droughts, we reclassified drought conditions into two categories: (1) “no drought”, “Abnormally Dry–D0”, and “Moderate Drought–D1” into a non-drought condition and (2) “Severe Drought–D2,” “Extreme Drought–D3,” and “Exceptional Drought–D4” into a drought condition category. We converted geospatial shapefiles into geospatial raster images within our study area using 30 m spatial resolution as other predictor variables. We associated each used and available location within the dataset with a spatially and temporally specific drought condition (i.e., non-drought or drought) for use as an interacting variable in determining if whooping crane selection of landscape factors might change with environmental conditions. Finally, we created a geospatial raster that included the proportion of migration seasons from 2010–2016 in which each cell within the study area was identified as being in a drought state. We used this layer to weight drought/non-drought output from the habitat selection model.
Habitat model development
We used a resource selection function (RSF) to investigate habitat selection of migrating whooping cranes, which provided a framework in which habitat selection can be inferred by pairing and comparing each location used by an individually marked animal with a matched set of available locations (Fortin et al., 2005). We analyzed our data using weighted mixed-effects RSFs following the approach outlined in Muff et al. (2020), where the weight for used points was equal to 1 and the weight for background points was equal to 1,000. Individual birds were included as random intercepts with large, fixed variance (σ2 = 1000). Fixing the variance term for sets of used and available locations to a large value allows random intercepts to be estimated without shrinkage toward the mean (Muff et al., 2020). We used Integrated Nested Laplace Approximations (INLA; Rue et al., 2009) to fit all models in R v4.0.5 (R Core Team, 2019). We specified normal priors with large variance for fixed effect coefficients (β ∼ N (0, 104)) and penalized complexity priors (Simpson et al., 2017) for the precision of unfixed random effects (U = 0, α = 0.05). We used the widely applicable information criterion (WAIC) to evaluate relative support among candidate models (Watanabe, 2013, Gelman et al., 2014).
To obtain a final model for habitat mapping, we used a three-stage procedure. In stage one, we used an iterative process to identify appropriate spatial scales and reduce the number of candidate predictor variables, similar to a variable reduction analysis implemented by O’Neil et al. (2020). We used this approach because there were correlated (| r| > 0.6) predictors among the different spatial scales and landscape categories (e.g., wetland measurements). Furthermore, testing all combinations of predictors using conventional methods or using Bayesian variable selection procedures would have been computationally infeasible, thus an avenue of future research could consider additional methods for scale-selection. This iterative process accounted for correlated predictors by fitting multivariable models containing one randomly selected predictor from each of four uncorrelated categories including: (1) wetland (four spatial scales each of percentage of all wetlands, palustrine wetlands, lacustrine wetlands, riverine wetlands, annual surface water occurrence, annual surface water recurrence, seasonal surface water occurrence, and seasonal surface water recurrence), (2) cropland (at four spatial scales), (3) forest (at four spatial scales), and (4) roads (four spatial scales each of the sum of all roads and the sum of roads outside of cities and towns). These models additionally included a quadratic effect for cropland and an interaction between cropland and the selected wetland predictor, because these relationships have previously been shown to be important for whooping cranes (Niemuth et al., 2018, Pearse et al., 2021). Ranking the relative importance of predictors using information criterion model weights has been discouraged in ecology (Cade, 2015), therefore, to rank the importance of randomly chosen predictors, we compared the WAIC scores of models with and without each predictor and saved the difference in WAIC scores (dWAIC) for each predictor. We repeated this process 10,000 times and then ranked predictors based on their average dWAIC, which we interpreted as the loss of information from excluding each predictor (O’Neil et al., 2020). We included the highest-ranked predictor from each category (wetland, cropland, forest, and roads) in subsequent modeling stages.
In stage two, we assessed the zone of influence (ZOI) of predictor variables explaining potential disturbances to migrating whooping cranes, including distances to all towns and cities, only large cities, power lines, and wind energy infrastructure. We used a piecewise regression analysis (Toms and Lesperance, 2003) to estimate a distance threshold for the effect of these disturbance predictors (Boulanger et al., 2012, Pearse et al., 2021). For each disturbance predictor, we varied ZOI distances from 1 to 10 km in 1 km increments and created new variables by fixing values greater than the candidate ZOI distance to that candidate value. We selected the most-supported ZOI distance separately for each disturbance predictor using base habitat models containing the highest-ranked predictor variables from stage one, distance to the center of the migration corridor, and terrain roughness. We then compared the log-likelihood values of models with varied ZOI distances and considered models with the highest log-likelihood to be the best-fitting ZOI distance. We retained the quadratic effect for cropland and interaction between cropland and wetland. In addition, we included random intercepts and slopes that varied by individual whooping crane for all predictor variables. Allowing coefficients to vary by individual reduces bias in population-level (fixed) effects due to individual differences in habitat preference or availability (Hebblewhite and Merrill, 2008, Aarts et al., 2013, Harrison et al., 2018, Muff et al., 2020). Lastly, for models containing effects of wind energy infrastructure, we included random slopes by year because new wind towers were constructed each year of our study period. We estimated 95% confidence intervals for selected ZOI distances as < 1.92 of the maximum value using the shape of the log-likelihood curve (Boulanger et al., 2012).
In stage three, we constructed global models using base habitat models from stage two and disturbance predictors with selected ZOI distances. We first assessed whether a global model containing distance to all towns and cities or containing distance to large cities was more supported by the data by comparing their WAIC scores. Lastly, we added a spatially and temporally varying index of drought occurrence as an interaction term on all predictor variables, allowing slopes for habitat and disturbance features to vary between drought and non-drought conditions. To account for potential temporal autocorrelation of used points, we included a rescaled ordinal date (where the first day of migration in the spring = 1 and the first day of migration in the fall = the day after the last day of spring migration) as an autoregressive “AR1” random effect. We considered parameters to be informative when their 95% credible intervals did not overlap zero, indicated by approximate Z scores > | 1.96| (β/standard error, where β is the mean of the posterior distribution). Predictor variables included in the final global model were not correlated (| r| < 0.6).
We created separate drought and non-drought raster layers describing the relative probability of use across the study area by incorporating spatial predictor variables and parameter estimates from the final global model in an exponential function. Because drought conditions vary spatially and temporally and it is unrealistic that drought conditions would exist across our entire study area at any point in time, we created a weighted average surface accounting for the frequency of drought conditions at each 30-m pixel across our study period.
Model validation
After selecting a final global model, we generated used-habitat calibration (UHC) plots (Fieberg et al., 2018) to compare the distribution of habitat predictors at used locations to its predicted distribution. We fit our final model on ∼2/3 of the data for training (data from 2010 to 2013) and used ∼1/3 of the data for testing (data from 2014 to 2016). If the model has good predictive ability, the observed used habitat in the testing data will fall primarily within the confidence bounds of the predicted distribution (Fieberg et al., 2018). In addition, we used independent location data of 55 whooping cranes collected between 2017 and 2020 to validate the ability of the model to predict space use during migration. Validation data included one randomly selected daytime and nighttime location from multiple locations collected at each stopover site (n = 4,851 validation locations). We summarized the associations between predicted probability of use across 10 habitat classes binned by quantiles and the number of observed locations from the validation data in each class (Boyce et al., 2002, Johnson et al., 2006). To test whether the global model produced effective out-of-sample predictions, we used Kendall rank correlation (τ), where higher values (>0.9) indicate good predictive ability (Boyce et al., 2002, Johnson et al., 2006).
Optimizing development of wind energy infrastructure
In preparation of potential continued development of wind energy across the whooping crane migration corridor, we assessed scenarios for future developments while accounting for current disturbances. We implemented a simple greedy search algorithm to select candidate areas for future wind tower developments that minimized impacts on migrating whooping cranes. To represent future wind tower developments, we collected potential locations of future wind energy infrastructure from the Federal Aviation Administration’s obstruction analysis/airport airspace analysis database as summarized by the U.S. Fish and Wildlife Service.3 We used information available as of March 2021 that included sites that had been identified as “Determined without Build Date” (i.e., records in some state of construction but without a build date) and “Not Yet Determined” (i.e., records submitted without a FAA hazard determination). Sites with these designations are either under construction or in the permitting process. We combined these sites and removed any locations that were within 400 m of previously constructed wind towers (Hoen et al., 2018) to eliminate sites unlikely to be built because of their proximity to existing infrastructure. We considered remaining, non-duplicate locations (n = 20,949) as being of high interest to wind energy developers for potential construction in the future. We recreated relative probability of use raster layers using parameter estimates from our final global model and layers for distance to current (towers developed as of 2020) and future wind tower developments, and we aggregated these layers to 300-m resolution by summing pixel values for faster processing. An initial step in this process was to create circular buffers around each proposed development point with a radius equal to the ZOI distance selected in stage two of our analysis (the area of effect if a new wind tower were to be developed at that location). We then summed the pixel values within each buffer from the predicted layers for current and future developments, so we had estimates of current and future relative use by whooping cranes at each proposed wind tower. To explore potential tradeoffs of proposed wind tower sites, we used wind power density (W/m2) at 100 m height as a measure of the wind energy potential (wind velocity and air density; Global Wind Atlas4) at proposed development locations. We normalized all measures of performance at each proposed development location to be constrained to range between 0 and 1 (i.e., minimum power density = 0, maximum power density = 1; minimum loss = 1, maximum loss = 0). This normalization allowed us to directly compare relative habitat loss within ZOI buffers with wind power density associated with each location. Our objective function maximizes the total value: VT = max (VP(S)wP + VL(S)wL), where VT represents total value, VP represents total power for a set of wind tower developments (S), VL represents total habitat loss for the same set of towers, and w represents relative weight. We applied a greedy algorithm to select proposed wind towers that minimized reductions in relative use of whooping cranes based on the difference between current and future habitat use within ZOI buffers, while maximizing wind power density. This algorithm is used in the site selection literature (van Teeffelen and Moilanen, 2008, Post van der Burg et al., 2018) and essentially works by iteratively searching through all possible siting locations and picking the one that maximizes total value and then removes that location from further consideration. The algorithm then starts over and searches through the remaining locations, again picking the maximum, and adding it to the previously selected site. The algorithm proceeds until a value target or budget constraint is reached. We explored three prioritization scenarios: (1) 50:50 weights on habitat loss and wind power, (2) 90:10 weights on habitat loss and wind power, and (3) 10:90 weights on habitat loss and wind power. We considered each of these prioritization scenarios across the entire U.S. migration corridor, as well as separately in North Dakota and Oklahoma, because these states vary in their amounts of potentially suitable habitat and characterize northern and southern regions of the U.S. migration corridor. Moreover, energy policies vary among states, and permitting authority resides within individual states (Bohn and Lant, 2009).
Results
We collected whooping crane locations during migration throughout the United States’ Great Plains, 2010–2016. We used 9,347 locations for our analysis after removing locations in flight, outside of our study area, and redundant nighttime roosting locations. Years accounting for the most locations in our data were 2012 through 2015 (n = 1,605, 3,122, 1,703, 1,011, respectively), compared to 2010 (n = 517) and 2016 (n = 431). More locations were collected during spring migration (n = 6,344) compared to autumn migration (n = 3,003). Whooping crane locations occurred in areas with drought (reclassified index of drought) in 34% of our data.
From stage one of our analysis, the most-supported predictors explaining habitat use from the wetland, cropland, forest, and roads categories were percentage of all wetland basins within 800 m, percentage of cropland within 800 m, percentage of forest within 800 m, and density of all roads within 800 m (Supplementary Table 1). These four variables were advanced to subsequent modeling stages. In stage two of our analysis, we identified distance thresholds to determine zones of influence of disturbance variables (Supplementary Figure 1). A 5-km threshold was most supported by the data for distance to all towns and cities (95% CI: 4.79–5.66), whereas a larger threshold was most supported for distance to large cities (8 km, 5.95–8.25). The most supported zone of influence for power lines was 2 km (1.87–2.92). Lastly, the most supported zone of influence for wind towers was 5 km (4.17–5.27). The zones of influence for all towns and cities, power lines, and wind towers covered approximately 27, 23, and 5% of the migration corridor, respectively. Zones of influence overlapped for all towns and cities and power lines in 10% of the corridor, for towns and cities and wind towers in 1% of the corridor, for power lines and wind towers in 1% of the corridor, and for all three disturbance types in only 0.5% of the corridor.
In stage three of our analysis, a global model containing distance to all towns and cities was more supported by the data than a model containing distance to large cities (ΔWAIC = 179.8), however 95% credible intervals for the distance to large cities and distance to all towns and cities coefficients overlapped zero. The final model had strong out-of-sample predictive ability (τ = 0.96). The most influential predictors of habitat use by whooping cranes were indicated by shifts in the distribution of used locations relative to availability for predictors (Supplementary Figure 2). UHC plots illustrated that used locations fell within model-predicted 95% confidence envelopes (Supplementary Figure 2), indicating that model predictions were consistent with observed locations across predictor variables.
Whooping cranes selected stopover locations with moderate amounts of cropland when the percentage of wetland area was high, particularly during drought conditions (Figures 1A, 2). However, during non-drought conditions, the quadratic effect of cropland in landscapes with high densities of wetlands was less apparent (interaction between wetland and quadratic effect of cropland | Z| = 1.60, Figures 1A, 2), and selection for a greater percentage of cropland was higher. Whooping cranes avoided wind towers (5 km ZOI) during drought and non-drought conditions and avoided power lines (2 km ZOI) during non-drought conditions (| Z| for drought conditions = 1.01), and magnitude of these effects was greatest for wind towers relative to power lines and towns and cities (Figure 1). Whooping cranes used areas with lower road density and percentage of forest during both drought and non-drought conditions (Figure 1). The effect of terrain was positive during drought conditions and negative during non-drought conditions (i.e., whooping cranes selected more variable terrain during droughts and selected less variable terrain during non-droughts; Figure 1). Standard deviations of individual random effects suggest that whooping cranes were variable in their avoidance of towns and cities (SD = 1.77), power lines (SD = 5.38), and wind towers (SD = 22.12), whereas space use by individual birds was less variable relative to the remaining landscape predictors (SD range: 0.15–0.55). Additionally, effects of wind towers varied annually (SD = 4.94). During drought and non-drought conditions, relative habitat selection by whooping cranes was highest near the center of the migration corridor (Figure 3).
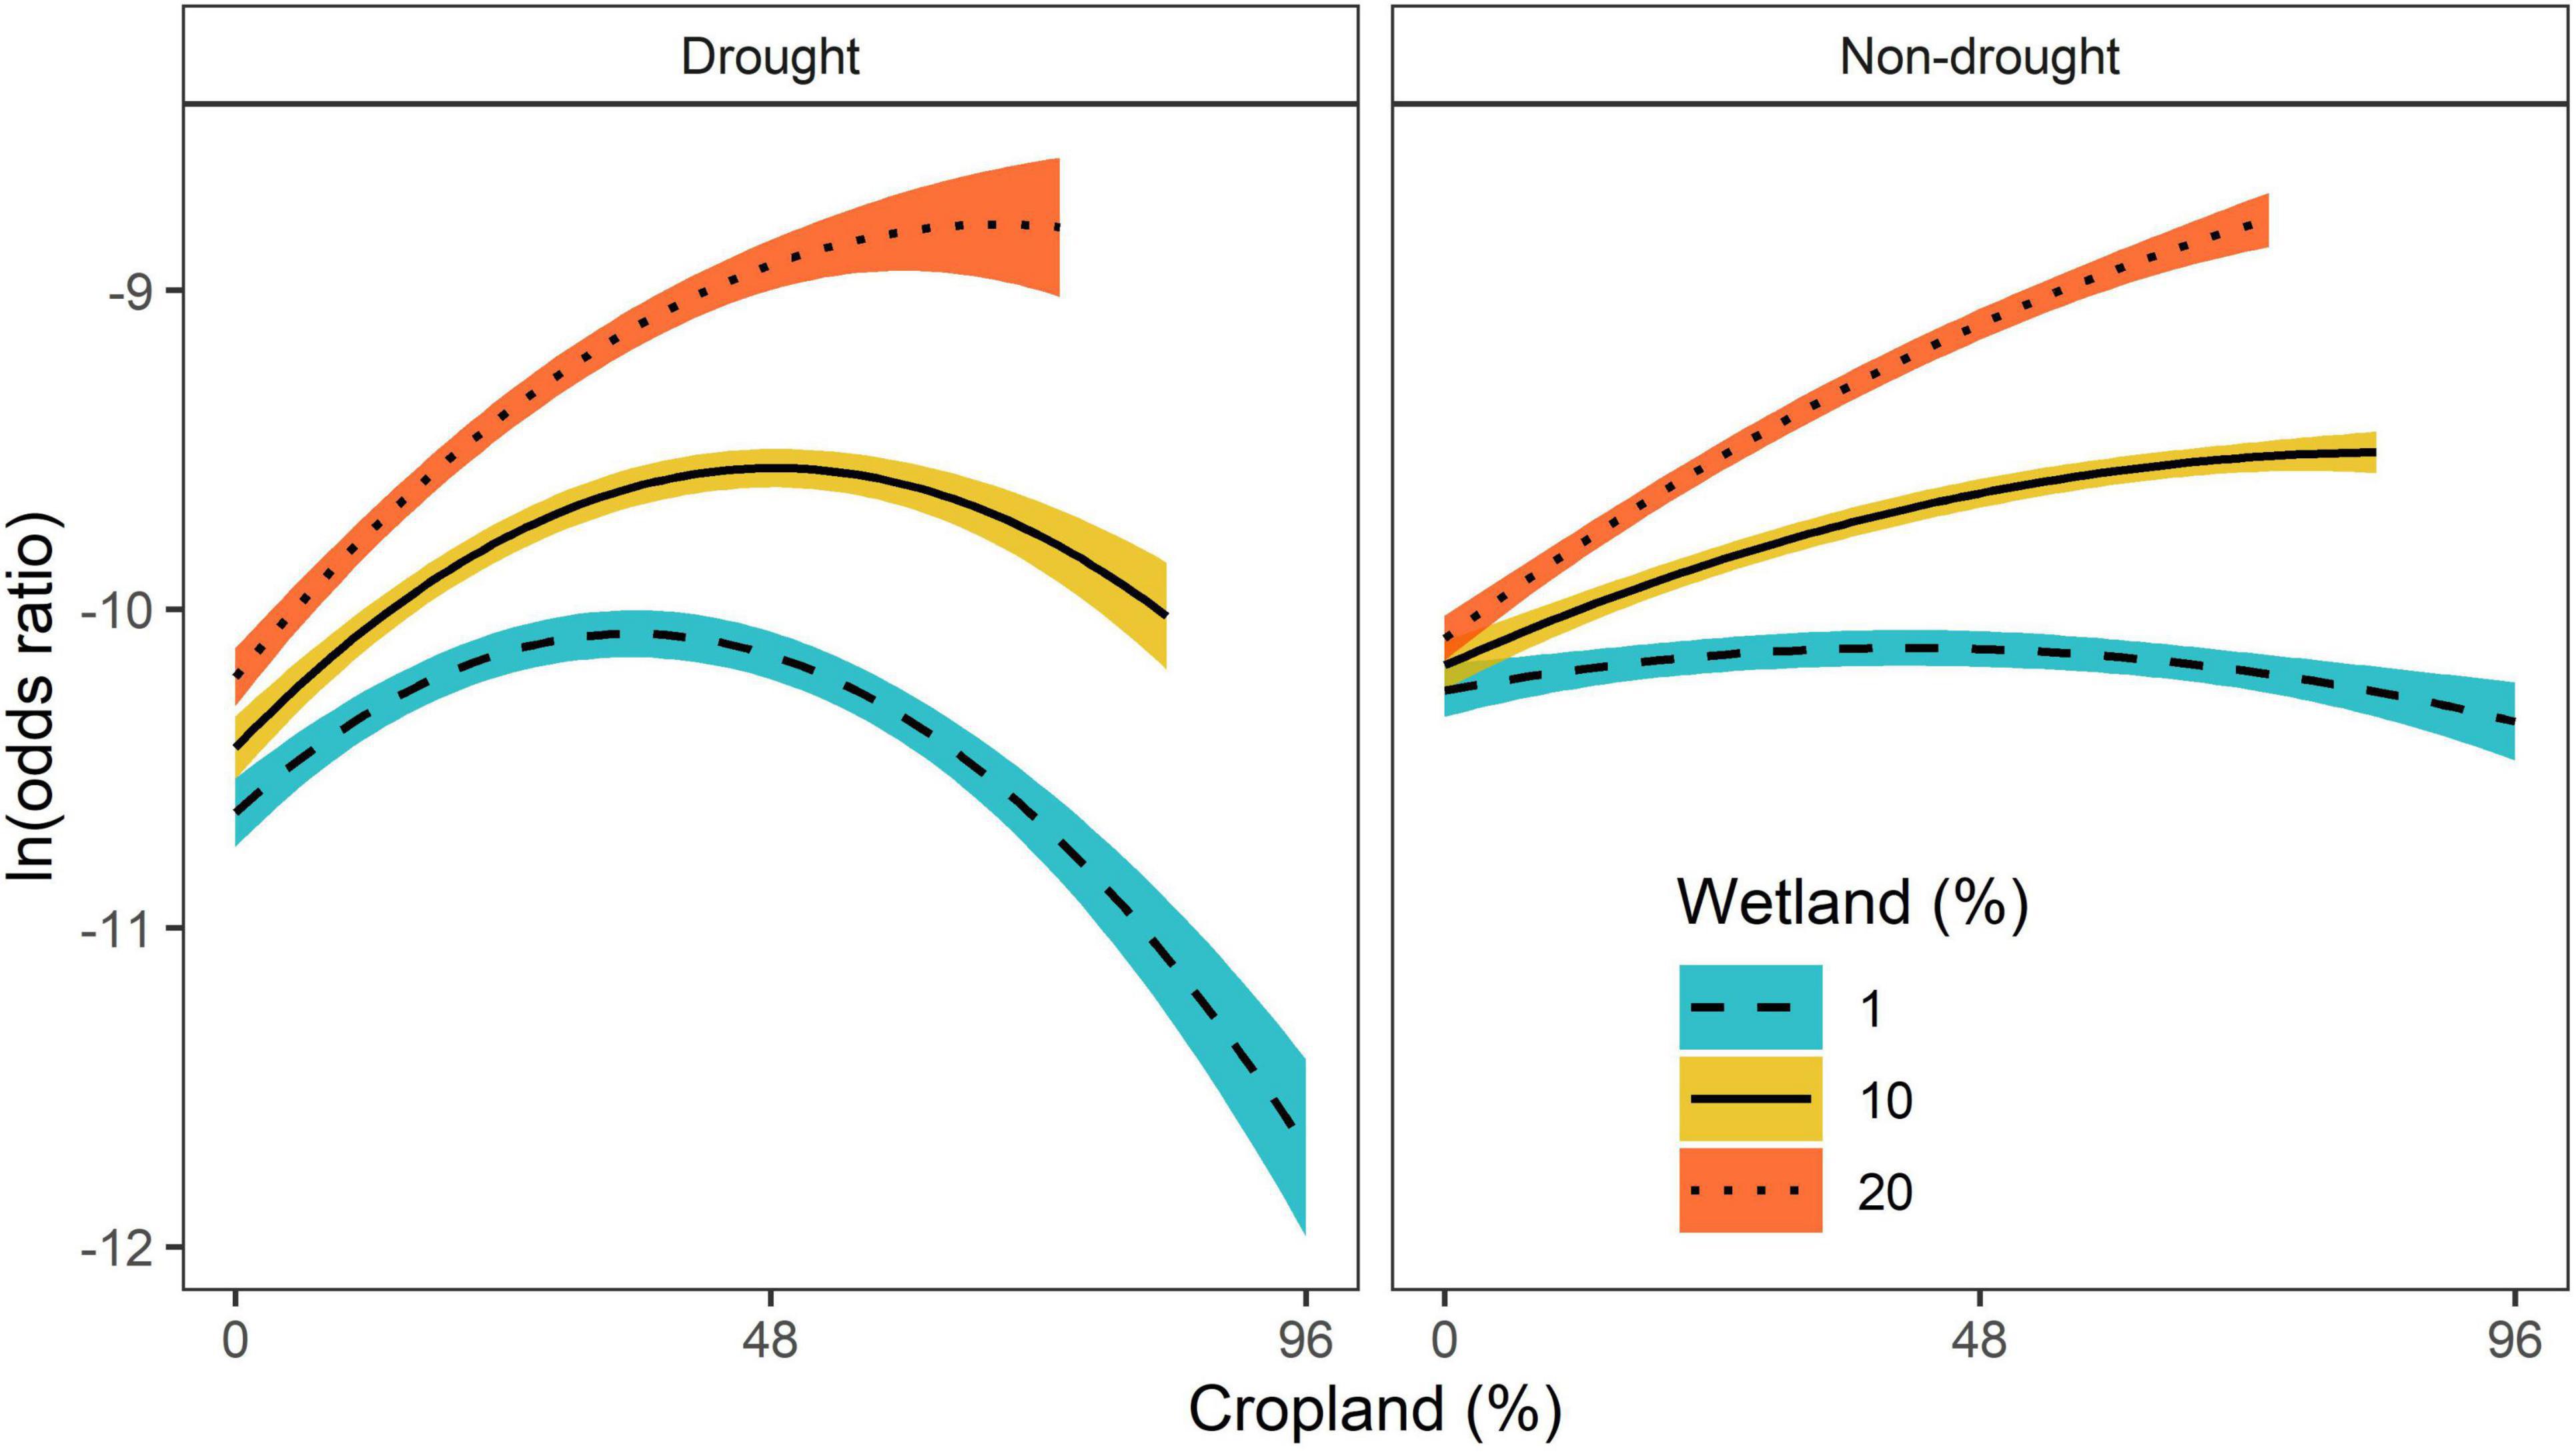
Figure 2. Predicted log odds ratios and 95% credible intervals of relative probability of use by whooping cranes (Grus americana) for percentage of cropland and wetland within 800-m radius during drought and non-drought conditions. All other variables in the model were held at their mean values. Prediction curves for 10 and 20% wetland were removed when cropland was >90 and 80%, respectively, as to not exceed 100%.
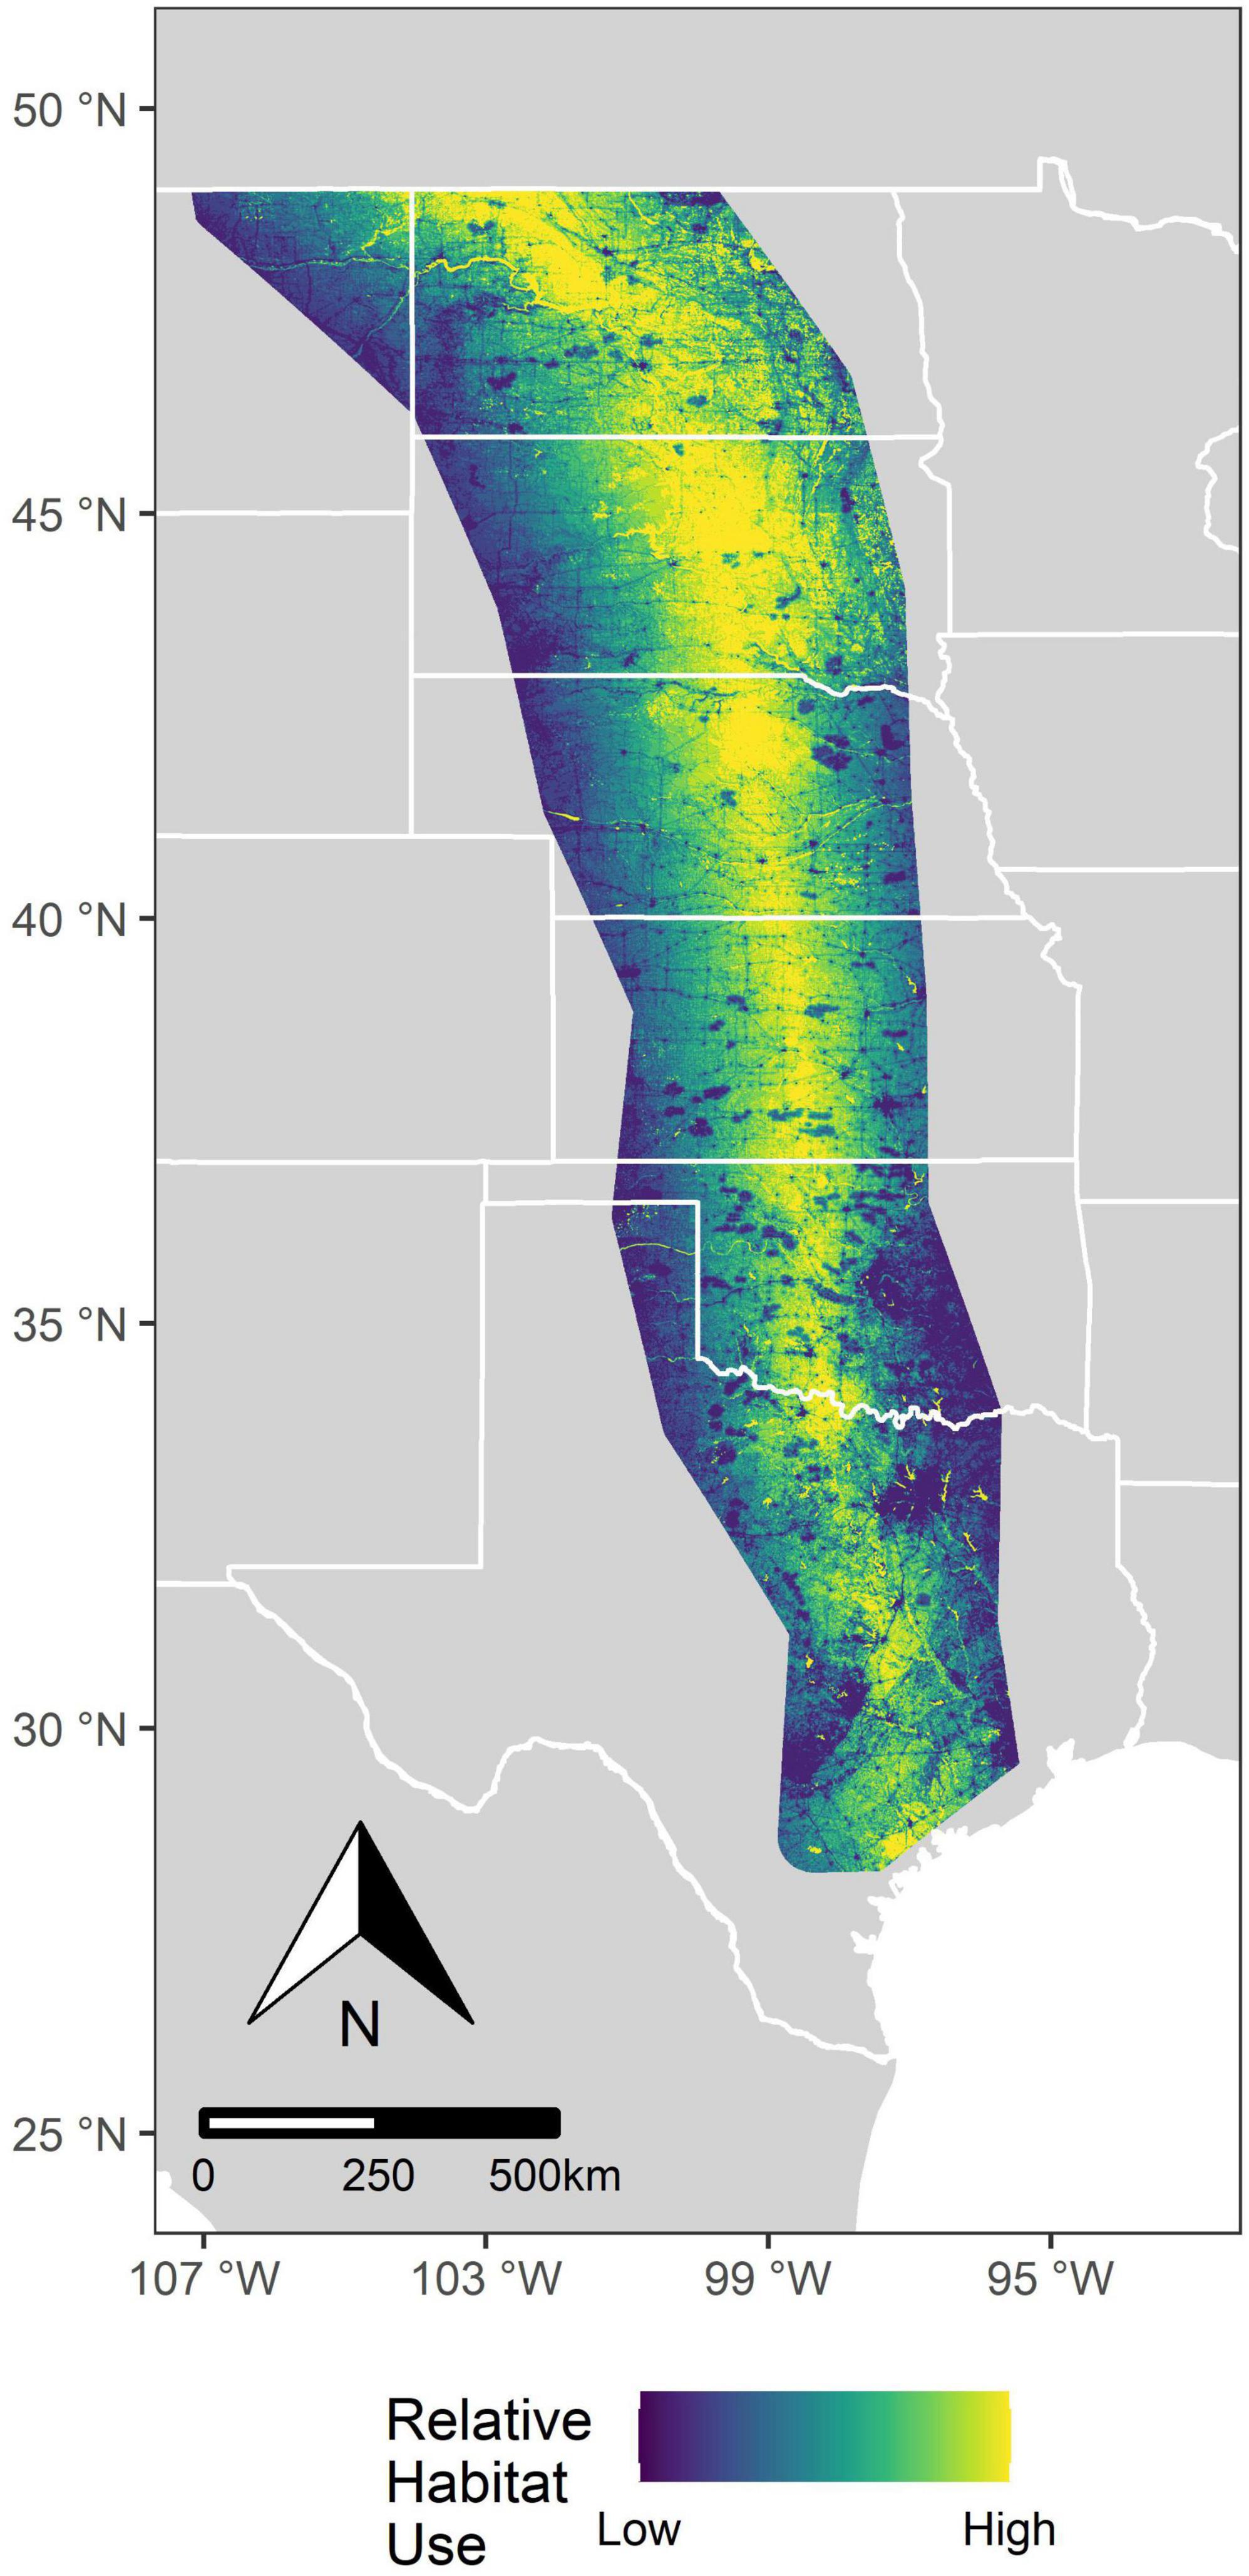
Figure 3. Predicted relative habitat selection for whooping cranes (Grus americana) across the United States Great Plains. We obtained predictions from a resource selection function using GPS locations between 2010 and 2016 during migration. This surface is a composite of drought and non-drought conditions calculated using the average drought occurrence at each pixel during our study period.
Optimization of wind energy siting
Total habitat loss (difference in the sum of pixel values of current and future habitat surfaces) resulting from avoidance if all proposed wind towers were to be developed was 2.1%. Our optimization analysis revealed that the rate of functional habitat loss associated with proposed wind tower developments differed among prioritization scenarios (Figure 4). For example, if 13,410 proposed towers were to be developed (doubling the current number of towers as of 2020; 64% of all proposed sites), associated relative habitat loss was 2.2 times greater when wind power (10:90 habitat to wind power scenario) was prioritized than when whooping crane habitat (90:10 habitat to wind power scenario) was prioritized. Similarly, relative habitat loss was 1.8 times greater when both performance measures were considered equally (50:50 habitat to wind power scenario) than when whooping crane habitat (90:10 habitat to wind power scenario) was prioritized. Further, our results suggest that if 13,410 proposed wind towers were to be developed, the tradeoff between habitat loss and wind power may be balanced when the weight on habitat is approximately 40% (based on a visual assessment of Figure 5). All prioritization scenarios supported clustering wind towers where tower selections were predominantly located within the 5 km ZOI of either current wind towers or proposed wind towers selected on previous iterations. For example, >99% of 13,140 selected towers in each of the scenarios (whooping crane habitat, equal prioritization, and wind power scenarios) had a nearest neighbor within 5 km. When 13,410 proposed wind towers were located across the entire migration corridor, the percentage of statewide habitat loss was greatest in Oklahoma (3.1–4.4%) and lowest in Texas (<0.1%), regardless of prioritization scenario (Table 1). South Dakota would realize the greatest habitat savings statewide by implementing prioritization of crane habitat over wind energy potential (86% reduction in loss; 0.3 vs. 2.1%; Table 1). Prioritizing crane habitat over wind potential provided more modest benefits (for habitat loss) in states with little planned development (MT) and states with less overall crane habitat (TX, KS, OK).
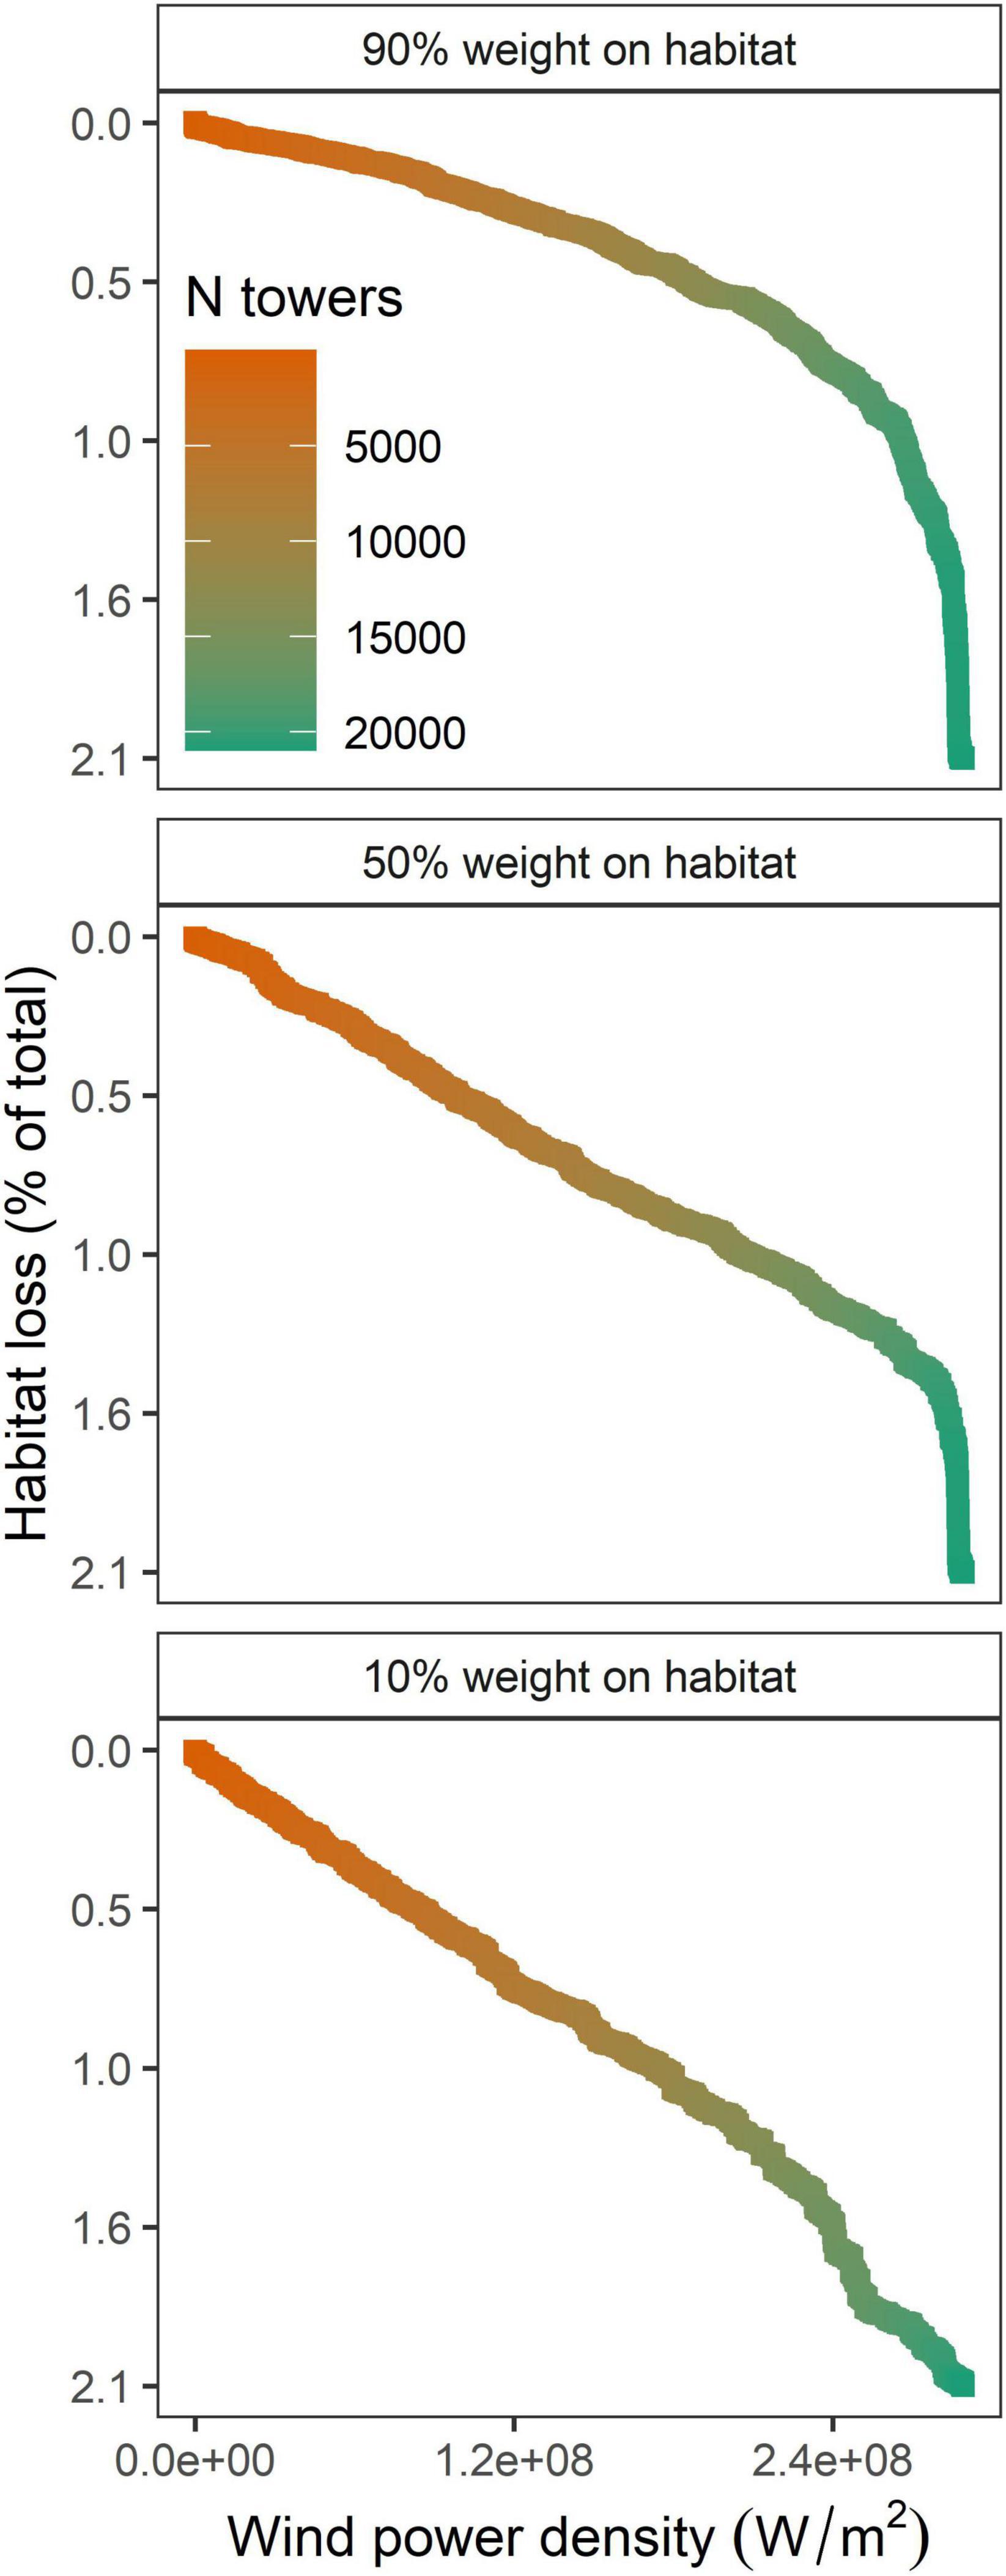
Figure 4. Percentage of relative habitat loss for migrating whooping cranes (Grus americana) and the cumulative gain in wind power density (W/m2) if all proposed wind towers were to be developed across the U.S. migration corridor. We optimized wind tower selection using three prioritization scenarios with different weights on habitat loss and wind power.
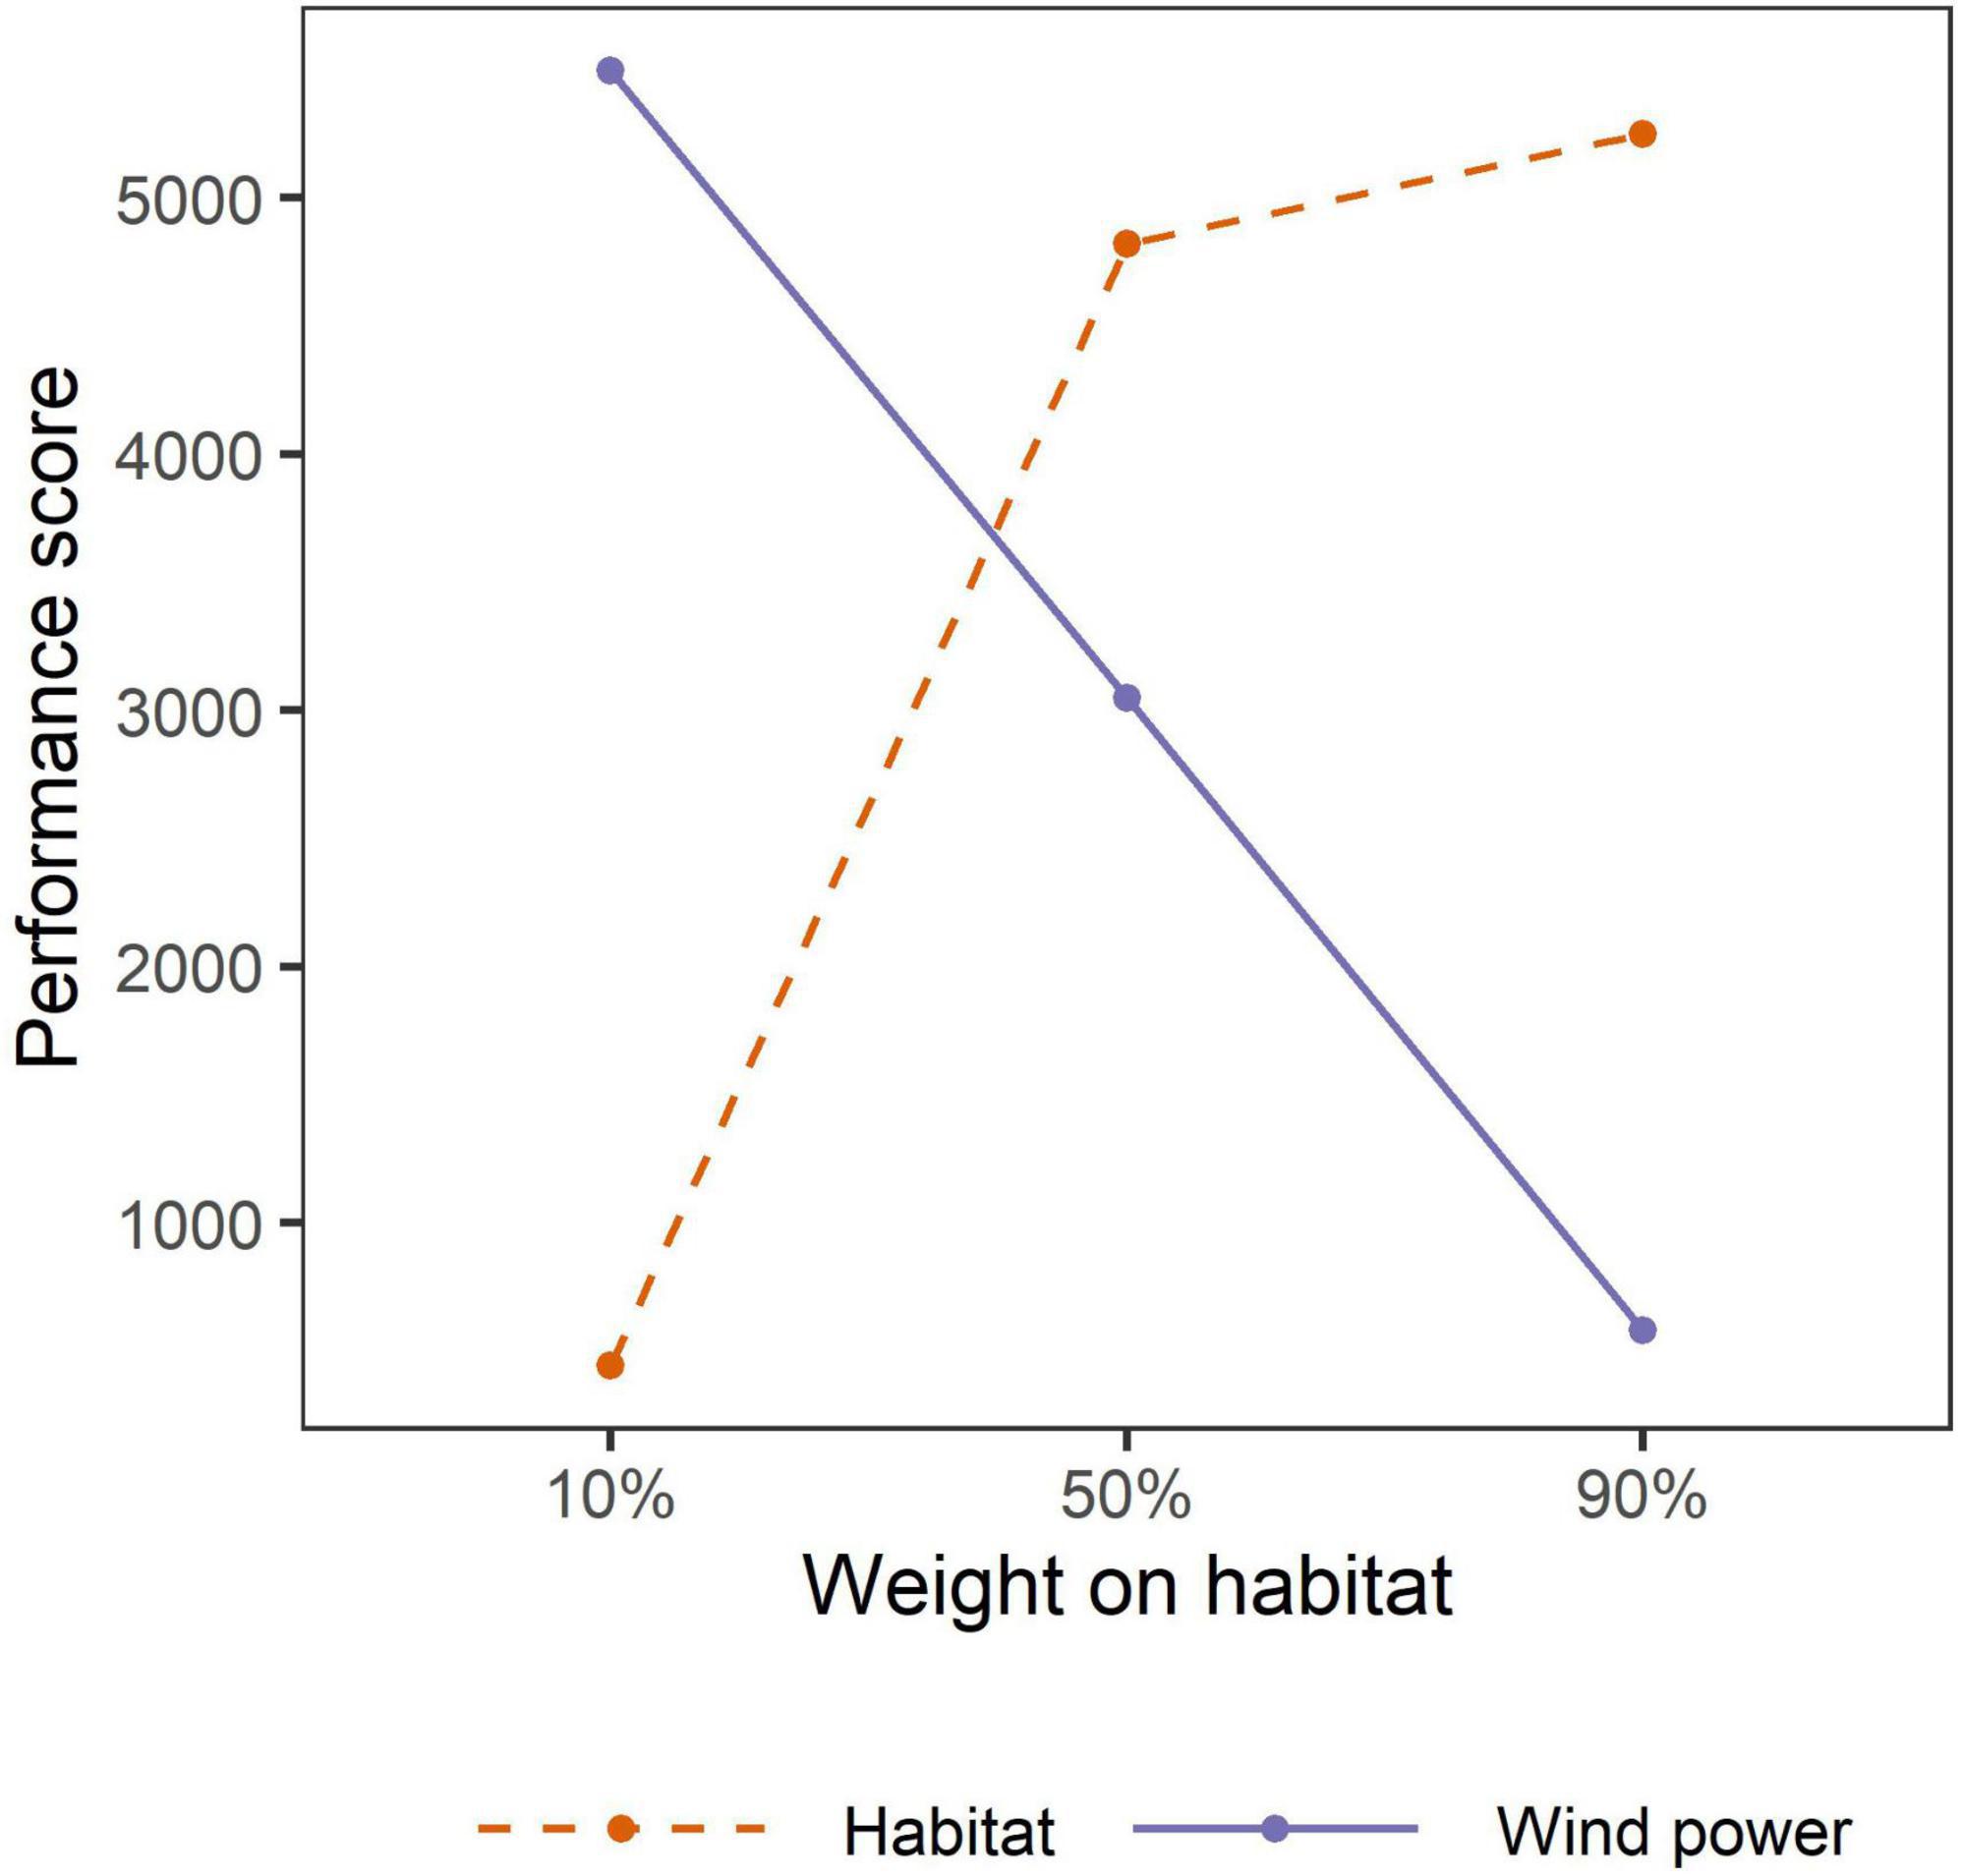
Figure 5. Sum of weighted performance scores for habitat and wind power values if wind towers were doubled (n = 13,410) across the U.S. migration corridor under three weighting scenarios. The intersection of the two lines could be considered an indifference point where the tradeoff between wind power and habitat loss is balanced.
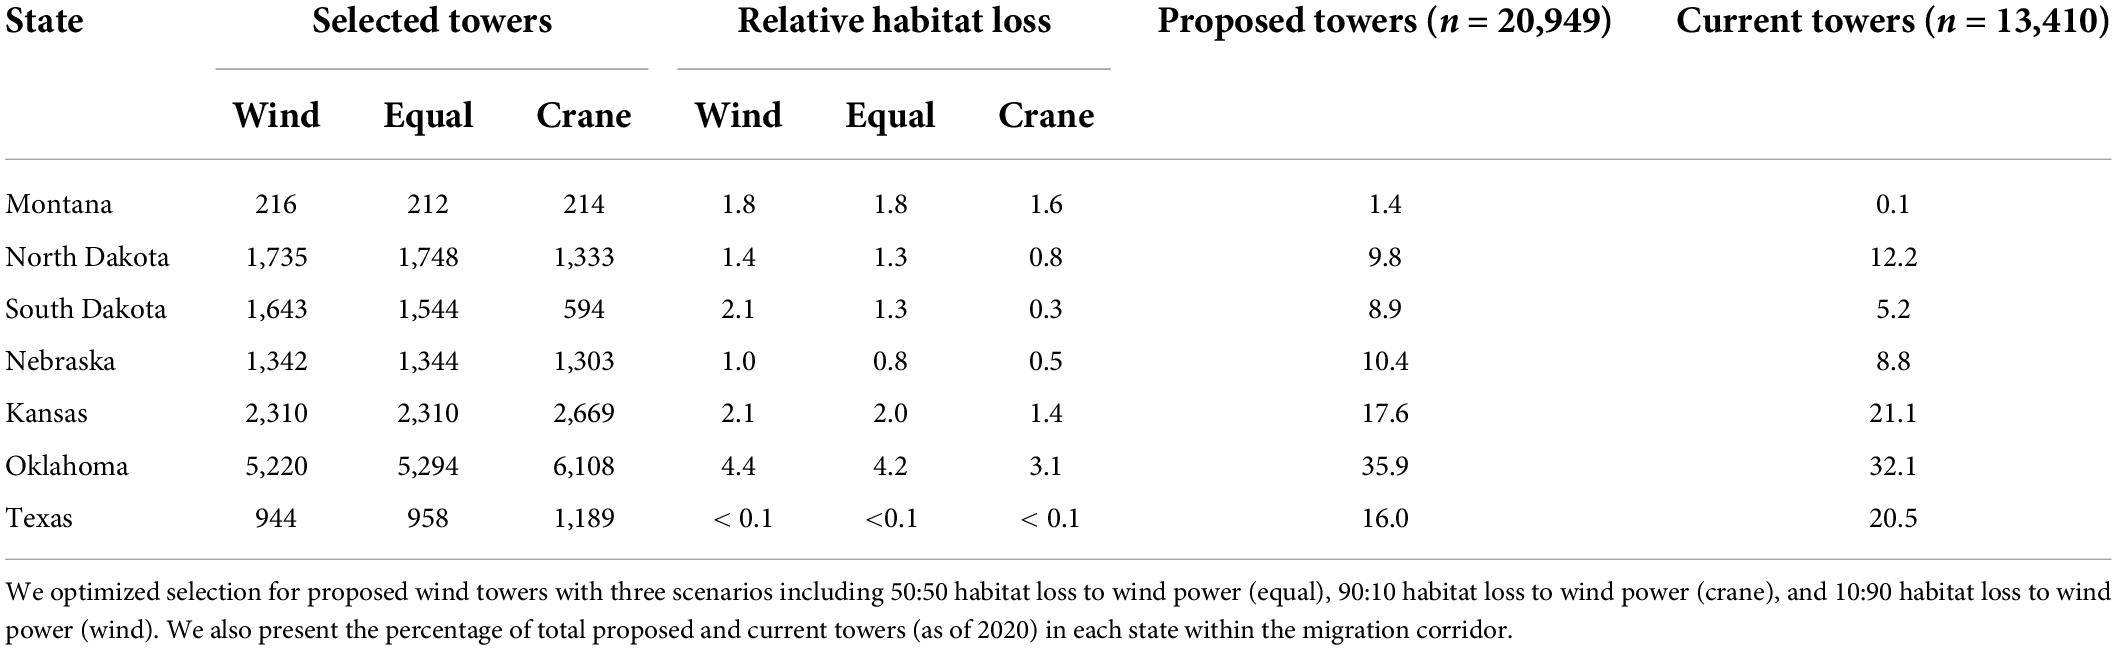
Table 1. Number of selected towers in each state and percentage of statewide relative habitat loss if wind towers were doubled (n = 13,410 as of 2020) across the migration corridor for whooping cranes (Grus americana).
Of the 20,949 potential future wind tower locations, 36% were located in Oklahoma and 10% in North Dakota. When we restricted proposed sites to North Dakota and Oklahoma separately, the rate of habitat loss was less divergent among prioritization scenarios in North Dakota compared to the entire migration corridor or Oklahoma (Supplementary Figure 3). For example, if 2,000 new towers were to be developed in North Dakota, statewide relative habitat loss ranged between 1.4% and 1.5% among scenarios. If 2,000 new towers were to be developed in Oklahoma, statewide relative habitat loss was 1.3% in the wind power scenario and 0.5% in the whooping crane habitat scenario. Additionally, overall predicted habitat loss across the migration corridor was 2.7–9.2 times less, depending on prioritization scenario if 2,000 new towers were to be developed in Oklahoma compared to North Dakota (Supplementary Figure 3).
Discussion
In assessing landscape features associated with whooping crane avoidance behaviors during migration, we found whooping cranes exhibited avoidance of several anthropogenic disturbance features. Our analysis can be further applied in a dynamic framework, where updated prediction layers using additional data could be considered to iteratively refine our optimization procedure to aid decision makers tasked with balancing habitat loss and energy development. During migration, whooping cranes typically select stopover sites with open lines of sight, presumably to facilitate detection of predators (Armbruster, 1990, Austin and Richert, 2005, Baasch et al., 2019). Selection for open areas likely contributed to our findings that whooping cranes were able, on average, to perceive and avoid some forms of human infrastructure at distances greater than would presumably be necessary to avoid collision. Common cranes (Grus grus) similarly avoided human disturbances across long distance migrations and varying ecological conditions (Végvári et al., 2011). Mismatches between wildlife responses and the risk posed by infrastructure can have fitness consequences if behaviors lead to over- or under-response by individuals (Smith et al., 2021). Thus, further work addressing the potential of increased energetic costs of migration associated with large areas of avoidance is warranted. In addition, avoidance behavior varied among types of human infrastructure, with greater zones of influence for towns and cities and wind energy infrastructure (5 km) than for power lines (2 km). It has been hypothesized that a restricted field of view during flight of blue cranes (Anthropoides paradiseus) may hinder detection of certain obstacles (e.g., suspended power lines; Martin and Shaw, 2010). Therefore, differences in the relative size of disturbance features and the ability of whooping cranes to perceive different types of infrastructure may have led to varied avoidance distances.
The magnitude of whooping crane avoidance was greatest for wind towers relative to other disturbances we considered, and this effect varied with individuals and annually across our study. Annual variation in effects of wind towers did not indicate that whooping cranes consistently increased or decreased avoidance through time (Pearse et al., 2021). Consequently, the annual variation we observed suggests that habitat availability or other environmental conditions mediate the severity of wind tower avoidance. We did not find that effects of wind towers on relative habitat selection varied with drought conditions, suggesting that even with reduced availability of habitats during droughts (Livneh and Hoerling, 2016), whooping cranes continued to select stopover sites away from wind towers. It is possible that the index of drought occurrence included in our analysis was insufficient to describe surface water fluctuations or other conditions that influence availability of preferred habitats. However, it is also plausible that during droughts, whooping cranes continued to avoid wind towers but were forced to travel longer distances to locate suitable stopover sites, thus contributing to a potential increased energetic cost of migration (Pearse and Selbo, 2012). Linking migration costs to environmental conditions will likely aid future recovery planning for whooping cranes, as drought frequency is predicted to increase across the Great Plains (Zhao et al., 2020).
Power line collisions have been identified as a source of mortality in whooping cranes, and 11 other crane species (Stehn and Haralson-Strobel, 2014, Dwyer et al., 2019). Evidence suggests that power line collisions can represent significant threats for endangered bird populations (Shaw et al., 2010). Many studies evaluating impacts of power lines on bird species estimate rates of collision at a local scale, whereas relatively few have evaluated broad scale demographic impacts or avoidance behaviors (D’Amico et al., 2018). Strategies for mitigating power line collisions include marking power lines to increase visibility and allow birds to detect and maneuver away from lines (Morkill and Anderson, 1991, Dwyer et al., 2019). Sandhill cranes (Antigone canadensis) have been shown to strongly react to power lines at short distances (<25 m), and reaction distances varied between daytime and nighttime flights (Morkill and Anderson, 1991, Murphy et al., 2016). Our results suggest that during drought conditions, whooping cranes may be less likely to avoid transmission power lines near suitable habitats, and future research should consider if power line collisions and mortalities are more frequent in these conditions. Because our data supported a 2-km ZOI rather than the shortest distance we tested, and functional habitat loss was not absolute within 2 km from power lines (whooping cranes used these areas, but at a lower rate), transmission power lines may exert varying direct and indirect impacts on whooping cranes during migration across spatial scales and environmental conditions. The magnitude and variation in potential direct and indirect effects of more widely distributed and abundant distribution lines will require additional investigation.
Whereas our results do not provide evidence that droughts influenced effects of disturbances on whooping crane space use (with the exception of power lines), droughts did influence relative selection for other landscape characteristics. Migrating whooping cranes have previously been shown to select stopover habitats with a diversity of wetland and upland land cover types for foraging and roosting (Lingle et al., 1991, Pearse et al., 2017, Niemuth et al., 2018). A non-linear effect of cropland has generally been supported, where intermediate levels of cropland are more highly selected (Niemuth et al., 2018, Pearse et al., 2021). We found that this non-linear relationship as it interacted positively with wetland availability was primarily supported during drought conditions, whereas in non-drought conditions, whooping cranes selected greater amounts of cropland when wetland basin density was moderate to high. This shift in the interaction between cropland and wetland may be driven by a greater mismatch between defined wetland basins and actual surface water levels during droughts relative to non-droughts. In addition, the effect of terrain switched from negative during non-droughts (selection of less variable terrain) to positive during droughts (selection of more variable terrain), likely reflecting use of more permanent wetland basins. This apparent shift in habitat use depending on drought conditions is valuable to understand and can help guide management related to the long-term sustainability of stopover habitats as drought frequencies change (Zhao et al., 2020). Wetlands and riparian areas in the Great Plains have been extensively modified (Dahl, 2011; Horn et al., 2012; Wright and Wimberly, 2013; Lark et al., 2020). Additionally, conversion of native grasslands in the Great Plains to crop fields (Olimb and Robinson, 2019) and changing wetland hydrology due to climate change (McIntyre et al., 2014) will likely further alter the availability and quality of whooping crane stopover habitats.
A potential explanation for why we did not detect differences in the effects of wind towers, towns and cities, or road density on relative habitat use during drought and non-drought conditions may reflect adequate availability of stopover habitat. In other words, when suitable habitats are not limited by drought, individuals may be more capable of behaviorally responding to disturbances than when habitats are limited, and avoidance behaviors may not be linked to population-level consequences (Gill et al., 2001). However, as the Aransas-Wood Buffalo population of whooping crane continues to grow (Wilson S. et al., 2016, Butler et al., 2020, Caven et al., 2020), stopover habitats may become increasingly limited in drought years or across specific regions of the migration corridor. Ecological theory suggests that population density influences habitat selection by individuals, making suboptimal habitats more attractive as density increases (Fretwell and Lucas, 1970). Associations between population dynamics and avoidance of disturbances have yet to be identified in whooping cranes, and the functional habitat losses we observed may appear minimal. At the scale of individual lifetimes, particularly in long-lived species like whooping cranes, recurring avoidance responses and cumulative habitat loss from the avoidance of all disturbances may be substantial (Dyer et al., 2001). As negative effects accumulate or as habitat becomes more limiting, there may be a critical point where consequences are observed on fitness or population dynamics (Johnson and St-Laurent, 2011). As such, there are still numerous uncertainties regarding the sensitivity of whooping cranes to periodic or regional changes in habitat availability across the migration corridor.
We predicted a 2% loss of additional stopover habitat resulting from the construction of > 20,000 proposed wind towers in the migration corridor, yet population-level effects of this loss are not known. In a study of pronghorn (Antilocapra americana) avoidance of natural gas developments, Beckmann et al. (2012) suggested that overall effects of development, including demographic consequences, may be partially obscured when a population is below carrying capacity. Similarly, as an endangered and recovering species, whooping cranes are likely well below carrying capacity, as evidenced by long-term exponential growth (Butler et al., 2014). As speculated by Beckmann et al. (2012), if negative effects of human infrastructure development are obscured or delayed before substantial impacts become evident, development may continue until habitat loss related to collective effects of infrastructure development crosses a threshold, which can compound negative consequences (Swift and Hannon, 2010). Therefore, evidence of avoidance to energy and other human infrastructure may serve as an early warning for negative consequences to wildlife populations.
Infrastructure sighting optimization
Our use of multiple prioritization scenarios explored how society can balance increased demand for the land base for energy infrastructure while minimizing future habitat loss. Prioritizing whooping crane habitat over wind power potential in the hypothetical siting of 13,410 (doubling existing towers as of 2020) new wind towers across the entire whooping crane migration corridor reduced potential habitat loss by ∼50%. Moreover, our results suggests that many potential wind tower sites were proposed in areas less likely to be used by whooping cranes, potentially because these sites were previously vetted by companies and environmental consultants to reduce potential exposure to this high-profile species. Using proposed wind tower sites listed by the Federal Aviation Administration in our optimization analysis provided a level of realism, as each of these locations were of interest to developers and assumed to conform to local regulations (Shaffer et al., 2022). Our results provide evidence that considering impacts of proposed wind tower sites on relative whooping crane habitat selection can integrate habitat conservation and energy development in a common strategy.
Our state-constrained optimization results indicated that constructing new wind towers in states with more existing towers and less potential whooping crane habitat can result in less additional habitat loss than states with fewer existing towers and more habitat. Different prioritization schemes resulted in varying functional habitat loss between states. When prioritizing habitat, Oklahoma consistently resulted in less habitat lost when adding ≤2,000 towers, whereas in North Dakota, prioritizing whooping crane habitat realized a net benefit only up to ∼75% of sites. Compared with North Dakota, Oklahoma contained more proposed wind tower sites (n = 7,670 in Oklahoma and n = 2,177 in North Dakota) and more towers currently operating as of 2020 (n = 4,299 in Oklahoma and n = 1,634 in North Dakota). In combination, these numerical differences suggest that there were fewer proposed sites in North Dakota available in suboptimal whooping crane habitats and fewer already-disturbed areas to site new developments. In addition, when prioritizing whooping crane habitat and wind power equally, we found that siting 2,000 towers in either state resulted in approximately the same state-wide habitat loss (∼1%), but loss across the entire corridor was 4 times greater when placing towers in North Dakota. Compared with Oklahoma, North Dakota contained more available and undisturbed whooping crane habitat than in southern regions of the migration corridor where new wind towers could be developed and have less impact on whooping crane habitats.
Although constructing wind towers in southern regions of the corridor might reduce overall habitat loss, migratory whooping cranes require stopover habitat distributed across the entire migration corridor to maintain reliable and stable migration connectivity. Statewide habitat loss was variable when locating towers across the entire corridor, suggesting that the maintenance of continuous stopover habitats when siting new wind towers may rely on a broad-scale perspective, rather than solely state-specific considerations. Stopover habitats are briefly occupied each migration but are essential for migratory species to move between breeding and non-breeding locations, and the loss of relatively small amounts of stopover habitat can have large effects on flyway connectivity (Murray et al., 2018, Donnelly et al., 2021). Population declines may become more probable if barriers prevent direct routes between preferred stopover sites or if sites become spaced too far apart to maintain a positive energy balance. The ∼4,000 km migration undertaken biannually by the Aransas-Wood Buffalo population of whooping cranes is assumed to be energetically costly (Kuyt, 1992). Yet clarifying the mechanisms by which avoidance behaviors could scale up to negative consequences at the population level will likely be challenging (Dyer et al., 2001, Gill et al., 2001). In addition, new human developments and disturbances tend to arise in small increments, which can complicate patterns of cumulative impacts of multiple disturbances spatially and temporally (Polfus et al., 2011). Our approach to estimate functional habitat loss while integrating current disturbances, potential future disturbances, and uncertainty in drought conditions can inform proactive conservation before population impacts occur (Patthey et al., 2008) and dynamic models of potential costs associated with risk-averse behaviors resulting from future developments. To support our optimization scenarios, we developed spatial predictions of whooping crane relative abundance during migration based on known landscape and disturbance features (Pearse et al., 2022).
Data availability statement
The original contributions presented in this study are included in the article/Supplementary material, further inquiries can be directed to the corresponding author.
Ethics statement
The animal study was reviewed and approved by Northern Prairie Wildlife Research Center and Environment and Climate Change Canada.
Author contributions
KE, AP, and MPvdB contributed to design of the study. DB, MTB, WH, and MJB contributed to the data collection and project management. KE performed statistical analyses and wrote the first draft of the manuscript. AP wrote sections of the manuscript. All authors contributed to the manuscript revision and approved the submitted version.
Funding
This project was funded by the Nebraska Army National Guard, Canadian Wildlife Service, Crane Trust, U.S. Fish and Wildlife Service, U.S. Geological Survey, the Platte River Recovery Implementation Program, and under the Oil Sands Monitoring (OSM) Program; it is independent of any position of the OSM Program.
Acknowledgments
Logistical and administrative support was provided by the Canadian Wildlife Service, Crane Trust, U.S. Fish and Wildlife Service, U.S. Geological Survey, and the Platte River Recovery Implementation Program, with additional support from the Gulf Coast Bird Observatory, International Crane Foundation, and Parks Canada. F. Chavez-Ramirez, B. Strobel, B. Hartup, J. Conkin, G. Wright, and T. Stehn were integral to the initiation and continuation of the field project. Marking and capture were conducted under Federal Fish and Wildlife Permit TE048806, Texas research permit SPR-1112-1042, Aransas National Wildlife Refuge special use permit, Canadian Wildlife Service Scientific Permit NWT-SCI-10-04, Parks Canada Agency Research and Collection Permit WB-2010-4998, and Northwest Territories Wildlife Research Permits WL004807, WL004821, and WL500051. Procedures were approved by Animal Care and Use Committee at Northern Prairie Wildlife Research Center and Environment Canada’s Animal Care Committees. Any use of trade, firm, or product names is for descriptive purposes only and does not imply endorsement by the U.S. Government. The findings and conclusions in this article do not necessarily represent the views of the U.S. Fish and Wildlife Service. This article has been peer reviewed and approved for publication consistent with USGS Fundamental Science Practices (https://pubs.usgs.gov/circ/1367/).
Conflict of interest
The authors declare that the research was conducted in the absence of any commercial or financial relationships that could be construed as a potential conflict of interest.
Publisher’s note
All claims expressed in this article are solely those of the authors and do not necessarily represent those of their affiliated organizations, or those of the publisher, the editors and the reviewers. Any product that may be evaluated in this article, or claim that may be made by its manufacturer, is not guaranteed or endorsed by the publisher.
Supplementary material
The Supplementary Material for this article can be found online at: https://www.frontiersin.org/articles/10.3389/fevo.2022.931260/full#supplementary-material
Footnotes
- ^ https://hifld-geoplatform.opendata.arcgis.com/datasets/electric-power-transmission-lines
- ^ https://droughtmonitor.unl.edu/
- ^ https://www.fws.gov/southwest/es/Energy_Wind_FAA.html
- ^ https://globalwindatlas.info/
References
Aarts, G., Fieberg, J., Brasseur, S., and Matthiopoulos, J. (2013). Quantifying the effect of habitat availability on species distributions. J. Anim. Ecol. 82, 1135–1145. doi: 10.1111/1365-2656.12061
Anderson, A. M., Friis, C., Gratto-Trevor, C. L., Harris, C. M., Love, O. P., Morrison, R. I., et al. (2021). Drought at a coastal wetland affects refueling and migration strategies of shorebirds. Oecologia 197, 661–674. doi: 10.1007/s00442-021-05047-x
Armbruster, M. J. (1990). Characterization of habitat used by whooping cranes during migration. Washington, DC: U.S. Fish and Wildlife Service.
Austin, J. E., and Richert, A. L. (2005). “Patterns of habitat use by whooping cranes during migration: Summary from 1977–1999 site evaluation data,” in Patterns of habitat use by whooping cranes during migration: summary from 1977-1999 site evaluation data,” in Proceedings of the Ninth North American Crane Workshop, ed. F. Chavez-Ramirez (Sacramento, CA: North American Crane Working Group), 79–104.
Aydin, N. Y., Kentel, E., and Duzgun, S. (2010). GIS-based environmental assessment of wind energy systems for spatial planning: A case study from Western Turkey. Renew. Sustain. Energy Rev. 14, 364–373. doi: 10.1016/j.rser.2009.07.023
Baasch, D. M., Farrell, P. D., Pearse, A. T., Brandt, D. A., Caven, A. J., Harner, M. J., et al. (2019). Diurnal habitat selection of migrating whooping crane in the Great Plains. Avian Conserv. Ecol. 14:1–14. doi: 10.5751/ACE-01317-140106
Barré, K., Voil, I. L., Bas, Y., Julliard, R., and Kerbiriou, C. (2018). Estimating habitat loss due to wind turbine avoidance by bats: Implications for European siting guidance. Biol. Conserv. 226, 205–214. doi: 10.1016/j.biocon.2018.07.011
Beckmann, J. P., Murray, K., Seidler, R. G., and Berger, J. (2012). Human-mediated shifts in animal habitat use: Sequential changes in pronghorn use of a natural gas field in Greater Yellowstone. Biol. Conserv. 147, 222–233. doi: 10.1016/j.biocon.2012.01.003
Bohn, C., and Lant, C. (2009). Welcoming the wind? Determinants of wind power development among U.S. States. Prof. Geogr. 61, 87–100. doi: 10.1080/00330120802580271
Bohrer, G., Zhu, K., Jones, R. L., and Curtis, P. S. (2013). Optimizing wind power generation while minimizing wildlife impacts in an urban area. PLoS One 8:e56036. doi: 10.1371/journal.pone.0056036
Boulanger, J. K., Poole, K. G., Gunn, A., and Wierzchowski, J. (2012). Estimating the zone of influence of industrial developments on wildlife: A migratory caribou Rangifer tarandus greenlandicus and diamond mine case study. Wildl. Biol. 18, 164–179. doi: 10.2981/11-045
Boyce, M. S., Vernier, P. R., Nielsen, S. E., and Schmiegelow, F. K. (2002). Evaluating resource selection functions. Ecol. Modell. 157, 281–300. doi: 10.1016/S0304-3800(02)00200-4
Butler, M. J., Metzger, K. L., and Harris, G. (2014). Whooping crane demographic responses to winter drought focus conservation strategies. Biol. Conserv. 179, 72–85. doi: 10.1016/j.biocon.2014.08.021
Butler, M. J., Sanspree, C. R., and Harrell, W. (2020). Whooping crane survey results: Winter 2019–2020. Austwell, TX: Aransas National Wildlife Refuge.
Byrne, M. E., Holland, A. E., Bryan, A. L., and Beasley, J. C. (2017). Environmental conditions and animal behavior influence performance of solar-powered GPS-GSM transmitters. Condor 119, 389–404. doi: 10.1650/CONDOR-16-76.1
Cade, B. S. (2015). Model averaging and muddled multimodel inferences. Ecology 96, 2370–2382. doi: 10.1890/14-1639.1
Calvert, A. M., Bishop, C. A., Elliot, R. D., Krebs, E. A., Kydd, T. M., Machtans, C. S., et al. (2013). A synthesis of human-related avian mortality in Canada. Avian Conserv. Ecol. 8:11. doi: 10.5751/ACE-00581-080211
Canadian Wildlife Service and U.S. Fish and Wildlife Service (2005). International recovery plan for the whooping crane. Recovery of Nationally Endangered Wildlife (RENEW). Ottawa, ON: U.S. Fish and Wildlife Service.
Caven, A. J., Rabbe, M., Malzahn, J., and Lacy, A. E. (2020). Trends in the occurrence of large Whooping Crane groups during migration in the great plains, USA. Heliyon 6:e03549. doi: 10.1016/j.heliyon.2020.e03549
Dahl, T. E. (2011). Status and trends of wetlands in the conterminous United States 2004 to 2009. Washington, DC: U.S. Fish and Wildlife Service.
D’Amico, M., Catry, I., Martins, R. C., Ascensão, F., Barrientos, R., and Moreira, F. (2018). Bird on the wire: Landscape planning considering costs and benefits for bird populations coexisting with power lines. Ambio 47, 650–656. doi: 10.1007/s13280-018-1025-z
Devictor, V., Julliard, R., and Jiguet, F. (2008). Distribution of specialist and generalist species along spatial gradients of habitat disturbance and fragmentation. Oikos 117, 507–514. doi: 10.1111/j.0030-1299.2008.16215.x
Donnelly, J. P., King, S. L., Knetter, J., Gammonley, J. H., Dreitz, V. J., Grisham, B. A., et al. (2021). Migration efficiency sustains connectivity across agroecological networks supporting sandhill crane migration. Ecosphere 12:e03543. doi: 10.1002/ecs2.3543
Duchesne, T., Fortin, D., and Courbin, N. (2010). Mixed conditional logistic regression for habitat selection studies. J. Anim. Ecol. 79, 548–555. doi: 10.1111/j.1365-2656.2010.01670.x
Dussault, C., Ouellet, J. P., Laurian, C., Courtois, R., Poulin, M., and Breton, L. (2007). Moose movement rates along highways and crossing probability models. J. Wildl. Manage. 71, 2338–2345. doi: 10.2193/2006-499
Dwyer, J. F., Pandey, A. K., McHale, L. A., and Harness, R. E. (2019). Near-ultraviolet light reduced Sandhill Crane collisions with a power line by 98%. Condor 121:duz008. doi: 10.1093/condor/duz008
Dyer, S. J., O’Neill, J. P., Wasel, S. M., and Boutin, S. (2001). Avoidance of industrial development by woodland caribou. J. Wildl. Manage. 65, 531–542. doi: 10.2307/3803106
Fieberg, J. R., Forester, J. D., Street, G. M., Johnson, D. H., ArchMiller, A. A., and Matthiopoulos, J. (2018). Used-habitat calibration plots: A new procedure for validating species distribution, resource selection, and step-selection models. Ecography 41, 737–752. doi: 10.1111/ecog.03123
Fielding, A. H., Anderson, D., Benn, S., Dennis, R., Geary, M., Weston, E., et al. (2021). Non-territorial GPS-tagged golden eagles Aquila chrysaetos at two Scottish wind farms: Avoidance influenced by preferred habitat distribution, wind speed and blade motion status. PLoS One 16:e0254159. doi: 10.1371/journal.pone.0254159
Folk, M. J., Nesbitt, S. A., Schwiker, S. T., Schmidt, J. A., Sullivan, K. A., Miller, T. J., et al. (2005). “Techniques employed to capture whooping cranes in central Florida,” in Proceedings of the Ninth North American Crane Workshop, ed. F. Chavez-Ramirez (Sacramento, CA: North American Crane Working Group), 141–144.
Fortin, M.-J., Keitt, T. H., Maurer, B. A., Taper, M. L., Kaufman, D. M., and Blackburn, T. M. (2005). Species’ geographic ranges and distributional limits: Pattern analysis and statistical issues. Oikos 108, 7–17. doi: 10.1111/j.0030-1299.2005.13146.x
Fretwell, D. S., and Lucas, H. L. (1970). On territorial behavior and other factors influencing habitat distribution in birds. Acta Biotheor. 19, 16–32. doi: 10.1007/BF01601953
Frick, W. F., Baerwald, E. F., Pollock, J. F., Barclay, R. M. R., Szymanski, J. A., Weller, T. J., et al. (2017). Fatalities at wind turbines may threaten population viability of a migratory bat. Biol. Conserv. 209, 172–177. doi: 10.1016/j.biocon.2017.02.023
Frid, A., and Dill, L. (2002). Human-caused disturbance stimuli as a form of predation risk. Conserv. Ecol. 6:11. doi: 10.5751/ES-00404-060111
Gelman, A., Hwang, J., and Vehtari, A. (2014). Understanding predictive information criteria for Bayesian models. Stat. Comput. 24, 997–1016. doi: 10.1007/s11222-013-9416-2
Gill, J. A., Norris, K., and Sutherland, W. J. (2001). Why behavioural responses may not reflect the population consequences of human disturbance. Biol. Conserv. 97, 265–268. doi: 10.1016/S0006-3207(00)00002-1
Harrison, X. A., Donaldson, L., Correa-Cano, M. E., Evans, J., Fisher, D. N., Goodwin, C. E. D., et al. (2018). A brief introduction to mixed effects modelling and multi-model inference in ecology. PeerJ 6:e4794. doi: 10.7717/peerj.4794
Hartman, M. D., Merchant, E. R., Parton, W. J., Gutmann, M. P., Lutz, S. M., and Williams, S. A. (2011). Impact of historical land-use changes on greenhouse gas exchange in the U.S Great Plains, 1883–2003. Ecol. Appl. 21, 1105–1119. doi: 10.1890/10-0036.1
Hebblewhite, M., and Merrill, E. (2008). Modelling wildlife-human relationships for social species with mixed-effects resource selection models. J. Appl. Ecol. 45, 834–844. doi: 10.1111/j.1365-2664.2008.01466.x
Heinemeyer, K., Squires, J., Hebblewhite, M., O’Keefe, J. J., Holbrook, J. D., and Copeland, J. (2019). Wolverines in winter: Indirect habitat loss and functional responses to backcountry recreation. Ecosphere 10:e02611. doi: 10.1002/ecs2.2611
Hoen, B. D., Diffendorfer, J. E., Rand, J. T., Kramer, L. A., Garrity, C. P., and Hunt, H. E. (2018). United States Wind Turbine Database (ver. 4.0). U. S. Geological Survey, American Wind Energy Association, and Lawrence Berkeley National Laboratory data release. Available online at: https://www.sciencebase.gov/catalog/item/57bdfd8fe4b03fd6b7df5ff9 (accessed April 29, 2021).
Horn, J. D., Joeckel, R. M., and Fielding, C. R. (2012). Progressive abandonment and planform changes of the central Platte River in Nebraska, central USA, over historical timeframes. Geomorphology 139, 372–383. doi: 10.1016/j.geomorph.2011.11.003
Howe, M. A. (1989). Migration of radio-marked whooping cranes from the Aransas-Wood Buffalo Population: Patterns of habitat use, behavior, and survival. Technical report. Washington, DC: U.S Fish and Wildlife Service.
Huang, L., He, B., Chen, A., Wang, H., Liu, J., Lû, A., et al. (2016). Drought dominates the interannual variability in global terrestrial net primary production by controlling semi-arid ecosystems. Sci. Rep. 6:24639. doi: 10.1038/srep24639
IPCC (2011). IPCC special report on renewable energy sources and climate change mitigation: Summary for policymakers. Cambridge: Cambridge University Press.
IPCC (2021). “Climate Change 2021: The physical science basis,” in Contribution of Working Group I to the Sixth Assessment Report of the Intergovernmental Panel on Climate Change, ed. V. Masson-Delmotte P. Zhai, A. Pirani, S. L. Connors, C. Péan, S. Berger, et al. (Cambridge: Cambridge University Press).
Johnson, C. J., Nielsen, S. E., Merrill, E. H., McDonald, T. L., and Boyce, M. S. (2006). Resource selection functions based on use-availability data: Theoretical motivation and evaluation methods. J. Wildl. Manage. 70, 347–357. doi: 10.2193/0022-541X(2006)70[347:RSFBOU]2.0.CO;2
Johnson, C. J., and St-Laurent, M. H. (2011). “Unifying framework for understanding impacts of human developments on wildlife,” in Energy development and wildlife conservation in Western North America, ed. D. Naugle (Washington, DC: Island Press), 27–54. doi: 10.5822/978-1-61091-022-4_3
Kirby, J. S., Stattersfield, A. J., Butchart, S. H., Evans, M. I., Grimmett, R. F., Jones, V. R., et al. (2008). Key conservation issues for migratory land-and waterbird species on the world’s major flyways. Bird Conserv. Int. 18, S49–S73. doi: 10.1017/S0959270908000439
Kuvlesky, W. P. Jr., Brennan, L. A., Morrison, M. L., Boydston, K. K., Ballard, B. M., and Bryant, F. C. (2007). Wind energy development and wildlife conservation: Challenges and opportunities. J. Wildl. Manage. 71, 2487–2498. doi: 10.2193/2007-248
Kuyt, E. (1979). Banding of juvenile whooping cranes on the breeding range in the Northwest Territories, Canada. North Am. Bird Bander 4, 24–25.
Kuyt, E. (1992). Aerial radio-tracking of whooping cranes migrating between Wood Buffalo National Park and Aransas National Wildlife Refuge, 1981-84. Ottawa: Canadian Wildlife Service.
Lark, T. J., Spawn, S. A., Bougie, M., and Gibbs, H. K. (2020). Cropland expansion in the United States produces marginal yields at high costs to wildlife. Nat. Commun. 11:4295. doi: 10.1038/s41467-020-18045-z
Laubhan, M. K., and Fredrickson, L. H. (1997). “Wetlands of the Great Plains: Habitat characteristics and vertebrate aggregations,” in Ecology and conservation of great plains vertebrates, eds F. L. Knopf and F. B. Samson (New York, NY: Springer), 20–48. doi: 10.1007/978-1-4757-2703-6_2
Lingle, G. R., Wingfield, G. A., and Ziewitz, J. W. (1991). “The migration ecology of whooping cranes in Nebraska, U.S.A,” in Proceedings 1987 International Crane Workshop, ed. J. T. Harris (Baraboo, WI: International Crane Foundation), 395–401.
Livneh, B., and Hoerling, M. P. (2016). The physics of drought in the U.S central Great Plains. J. Clim. 29, 6783–6804. doi: 10.1175/JCLI-D-15-0697.1
Marques, A. T., Santos, C. D., Hanssen, F., Muñoz, A. R., Onrubia, A., Wikelski, M., et al. (2020). Wind turbines cause functional habitat loss for migratory soaring birds. J. Anim. Ecol. 89, 93–103. doi: 10.1111/1365-2656.12961
Martin, G. R. (2011). Understanding bird collisions with man-made objects: A sensory ecology approach. IBIS 153, 239–254. doi: 10.1111/j.1474-919X.2011.01117.x
Martin, G. R., and Shaw, J. M. (2010). Bird collisions with power lines: Failing to see the way ahead? Biol. Conserv. 143, 2695–2702. doi: 10.1016/j.biocon.2010.07.014
May, R., Gill, A. B., Köppel, J., Langston, R. H., Reichenbach, M., Scheidat, M., et al. (2017). “Future research directions to reconcile wind turbine–wildlife interactions,” in Wind energy and wildlife interactions, ed. J. Köppel (New York, NY: Springer), 255–276. doi: 10.1007/978-3-319-51272-3_15
McIntyre, N. E., Wright, C. K., Swain, S., Hayhoe, K., Liu, G., Schwartz, F. W., et al. (2014). Climate forcing of wetland landscape connectivity in the Great Plains. Front. Ecol. Environ. 12, 59–64. doi: 10.1890/120369
Merken, R., Deboelpaep, E., Teunen, J., Saura, S., and Koedam, N. (2015). Wetland suitability and connectivity for trans-Saharan migratory waterbirds. PLoS One 10:e0135445. doi: 10.1371/journal.pone.0135445
Morkill, A. E., and Anderson, S. H. (1991). Effectiveness of marking powerlines to reduce Sandhill Crane collisions. Wildl. Soc. Bull. 19, 442–449.
Muff, S., Signer, J., and Fieberg, J. (2020). Accounting for individual-specific variation in habitat-selection studies: Efficient estimation of mixed-effects models using Bayesian or frequentist computation. J. Anim. Ecol. 89, 80–92. doi: 10.1111/1365-2656.13087
Murphy, R. K., Dwyer, J. F., Mojica, E. K., McPherron, M. M., and Harness, R. E. (2016). Reactions of Sandhill Cranes approaching a marked transmission power line. J. Fish Wildl. Manage. 7, 480–489. doi: 10.3996/052016-JFWM-037
Murray, N. J., Marra, P. P., Fuller, R. A., Clemens, R. S., Dhanjal-Adams, K., Gosbell, K. B., et al. (2018). The large-scale drivers of population declines in a long-distance migratory shorebird. Ecography 41, 867–876. doi: 10.1111/ecog.02957
Neto, J. M., Teixeira, H., Patrício, J., Baeta, A., Veríssimo, H., Pinto, R., et al. (2010). The response of estuarine macrobenthic communities to natural-and human-induced changes: Dynamics and ecological quality. Estuaries Coasts 33, 1327–1339. doi: 10.1007/s12237-010-9326-x
Niemuth, N. D., Ryba, A. J., Pearse, A. T., Kvas, S. M., Brandt, D. A., Wangler, B., et al. (2018). Opportunistically collected data reveal habitat selection by migrating whooping cranes in the U.S. Northern plains. Condor 120, 343–356. doi: 10.1650/CONDOR-17-80.1
Olimb, S. K., and Robinson, B. (2019). Grass to grain: Probabilistic modeling of agricultural conversion in the North American Great Plains. Ecol. Indic. 102, 237–245. doi: 10.1016/j.ecolind.2019.02.042
O’Neil, S. T., Coates, P. S., Brussee, B. E., Ricca, M. A., Espinosa, S. P., Gardner, S. C., et al. (2020). Wildfire and the ecological niche: Diminishing habitat suitability for an indicator species within semi-arid ecosystems. Glob. Change Biol. 26, 6296–6312. doi: 10.1111/gcb.15300
Patthey, P., Wirthner, S., Signorell, N., and Arlettaz, R. (2008). Impact of outdoor winter sports on the abundance of a key indicator species of alpine ecosystems. J. Appl. Ecol. 45, 1704–1711. doi: 10.1111/j.1365-2664.2008.01547.x
Pearse, A. T., Brandt, D. A., Baasch, D. M., Bidwell, M. T., Conkin, J. A., Harner, M. J., et al. (2020a). Location data for whooping cranes of the Aransas-Wood Buffalo Population, 2009-2018. U.S Geological Survey. Available online at: https://www.sciencebase.gov/catalog/item/5ea3071582cefae35a19349a (accessed November 1, 2020).
Pearse, A. T., Metzger, K. L., Brandt, D. A., Bidwell, M. T., Harner, M. J., Baasch, D. M., et al. (2020b). Heterogeneity in migration strategies of whooping cranes. Condor 122:duz056. doi: 10.1093/condor/duz056
Pearse, A. T., Brandt, D. A., Harrell, W. C., Metzger, K. L., Baasch, D. M., and Hefley, T. J. (2015). Whooping crane stopover site use intensity within the Great Plains. Reston, VA: U.S Geological Survey. doi: 10.3133/ofr20151166
Pearse, A. T., Ellis, K. S., Brandt, D. A., Bidwell, M. T., and Harrell, W. (2022). Whooping crane migration habitat selection disturbance data and maps. U.S Geological Survey data release. Reston, VA: U.S Geological Survey.
Pearse, A. T., Harner, M. J., Baasch, D. M., Wright, G. D., Caven, A. J., and Metzger, K. L. (2017). Evaluation of nocturnal roost and diurnal sites used by whooping cranes in the Great Plains, United States. Reston, VA: U.S Geological Survey. doi: 10.3133/ofr20161209
Pearse, A. T., Metzger, K. L., Brandt, D. A., Shaffer, J. A., Bidwell, M. T., and Harrell, W. (2021). Migrating whooping cranes avoid wind-energy infrastructure when selecting stopover habitat. Ecol. Appl. 31:e02324. doi: 10.1002/eap.2324
Pearse, A. T., Rabbe, M., Juliusson, L. M., Bidwell, M. T., Craig-Moore, L., Brandt, D. A., et al. (2018). Delineating and identifying long-term changes in the whooping crane (Grus americana) migration corridor. PLoS One 13:e0192737. doi: 10.1371/journal.pone.0192737
Pearse, A. T., and Selbo, S. M. (2012). Model of whooping crane energetics as foundation for development of a method to assess potential take during migration. U.S Geological Survey Open File Report 2012–1156. Reston, VA: U.S Geological Survey. doi: 10.3133/ofr20121156
Pekel, J.-F., Cottam, A., Gorelick, N., and Belward, A. S. (2016). High-resolution mapping of global surface water and its long-term changes. Nature 540, 418–422. doi: 10.1038/nature20584
Pfister, C., Harrington, B. A., and Lavine, M. (1992). The impact of human disturbance on shorebirds at a migration staging area. Biol. Conserv. 60, 115–126. doi: 10.1016/0006-3207(92)91162-L
Polfus, J. L., Hebblewhite, M., and Heinemeyer, K. (2011). Identifying indirect habitat loss and avoidance of human infrastructure by northern mountain woodland caribou. Biol. Conserv. 144, 2637–2646. doi: 10.1016/j.biocon.2011.07.023
Post van der Burg, M., Chartier, N., and Drum, R. (2018). Implications of spatially variable costs and habitat conversion risk in landscape-scale conservation planning. J. Fish Wildl. Manage. 9, 402–414. doi: 10.3996/102016-JFWM-080
R Core Team (2019). A language and environment for statistical computing. Vienna: R Foundation for Statistical Computing.
Rue, H., Martino, S., and Chopin, N. (2009). Approximate Bayesian inference for latent Gaussian models by using integrated nested Laplace approximations. J. R. Stat. Soc. Series B Stat. Methodol. 71, 319–392. doi: 10.1111/j.1467-9868.2008.00700.x
Runge, C. A., Watson, J. E., Butchart, S. H., Hanson, J. O., Possingham, H. P., and Fuller, R. A. (2015). Protected areas and global conservation of migratory birds. Science 350, 1255–1258. doi: 10.1126/science.aac9180
Rybicki, J., and Hanski, I. (2013). Species–area relationships and extinctions caused by habitat loss and fragmentation. Ecol. Lett. 16, 27–38. doi: 10.1111/ele.12065
Sawyer, H., Korfanta, N. M., Nielson, R. M., Monteith, K. L., and Strickland, D. (2017). Mule deer and energy development—long-term trends of habituation and abundance. Glob. Change Biol. 23, 4521–4529. doi: 10.1111/gcb.13711
Seidler, R. G., Long, R. A., Berger, J., Bergen, S., and Beckmann, J. P. (2015). Identifying impediments to long-distance mammal migrations. Conserv. Biol. 29, 99–109. doi: 10.1111/cobi.12376
Shaffer, J. A., and Buhl, D. A. (2016). Effects of wind-energy facilities on breeding grassland bird distributions. Conserv. Biol. 30, 59–71. doi: 10.1111/cobi.12569
Shaffer, J. A., Loesch, C. R., and Buhl, D. A. (2019). Estimating offsets for avian displacement effects of anthropogenic impacts. Ecol. Appl. 29:e01983. doi: 10.1002/eap.1983
Shaffer, J. A., Niemuth, N. D., Loesch, C. R., Derby, C. E., Pearse, A. T., Barnes, K. W., et al. (2022). Limited land base and competing land uses force societal tradeoffs when siting energy development. J. Fish Wildl. Manage. 13, 106–123. doi: 10.3996/JFWM-21-036
Shaw, J. M., Jenkins, A. R., Smallie, J. J., and Ryan, P. G. (2010). Modelling power-line collision risk for the Blue Crane Anthropoides paradiseus in South Africa. IBIS 152, 590–599. doi: 10.1111/j.1474-919X.2010.01039.x
Simpson, D., Rue, H., Riebler, A., Martins, T. G., and Sørbye, S. H. (2017). Penalising model component complexity: A principled, practical approach to constructing priors. Stat. Sci. 32, 1–28. doi: 10.1214/16-STS576
Smith, J. A., Gaynor, K. M., and Suraci, J. P. (2021). Mismatch between risk and response may amplify lethal and non-lethal effects of humans on wild animal populations. Front. Ecol. Evol. 9:604973. doi: 10.3389/fevo.2021.604973
Song, M., Chen, K., Zhang, X., and Wang, J. (2016). Optimization of wind turbine micro-siting for reducing the sensitivity of power generation to wind direction. Renew. Energy 85, 57–65. doi: 10.1016/j.renene.2015.06.033
Stehn, T. V., and Haralson-Strobel, C. L. (2014). An update on mortality of fledged whooping cranes in the Aransas-Wood Buffalo Population. Proc. North Am. Crane Workshop 12, 43–50.
Swift, T. L., and Hannon, S. J. (2010). Critical thresholds associated with habitat loss: A review of the concepts, evidence, and applications. Biol. Rev. 85, 35–53. doi: 10.1111/j.1469-185X.2009.00093.x
Tarr, N. M., Simons, T. R., and Pollock, K. H. (2010). An experimental assessment of vehicle disturbance effects on migratory shorebirds. The J. Wildl. Manage. 74, 1776–1783. doi: 10.2193/2009-105
Toms, J. D., and Lesperance, M. L. (2003). Piecewise regression: A tool for identifying ecological thresholds. Ecology 84, 2034–2041. doi: 10.1890/02-0472
Trombulak, S. C., and Frissell, C. A. (2000). Review of ecological effects of roads on terrestrial and aquatic communities. Conserv. Biol. 14, 18–30. doi: 10.1046/j.1523-1739.2000.99084.x
U.S. Fish and Wildlife Service (2018). National Wetlands Inventory. US Fish and Wildlife Service. Washington, DC: U.S. Fish and Wildlife Service.
U.S. Geological Survey (2014). USGS National Transportation Dataset (NTD) Downloadable Data Collection. Available online at: http://nationalmap.gov/transport.html. (accessed January 9, 2020)
van Teeffelen, A., and Moilanen, A. (2008). Where and how to manage: Optimal selection of conservation actions for multiple species. Biodivers. Inform. 5:39. doi: 10.17161/bi.v5i0.39
Veers, P., Dykes, K., Lantz, E., Barth, S., Bottasso, C. L., Carlson, O., et al. (2019). Grand challenges in the science of wind energy. Science 366:eaau2027. doi: 10.1126/science.aau2027
Végvári, Z., Barta, Z., Mustakallio, P., and Székely, T. (2011). Consistent avoidance of human disturbance over large geographical distances by a migratory bird. Biol. Lett. 7, 814–817. doi: 10.1098/rsbl.2011.0295
Watanabe, S. (2013). A widely applicable Bayesian information criterion. J. Mach. Learn. Res. 14, 867–897.
Wilson, R. R., Parrett, L. S., Joly, K., and Dau, J. R. (2016). Effects of roads on individual caribou movements during migration. Biol. Conserv. 195, 2–8. doi: 10.1016/j.biocon.2015.12.035
Wilson, S., Gil-Weir, K. C., Clark, R. G., Robertson, G. J., and Bidwell, M. T. (2016). Integrated population modeling to assess demographic variation and contributions to population growth for endangered whooping cranes. Biol. Conserv. 197, 1–7. doi: 10.1016/j.biocon.2016.02.022
Wright, C. K., and Wimberly, M. C. (2013). Recent land use change in the Western Corn Belt threatens grasslands and wetlands. Proc. Natl. Acad. Sci. U.S.A. 110, 4134–4139. doi: 10.1073/pnas.1215404110
Xu, Y., Si, Y., Yin, S., Zhang, W., Grishchenko, M., Prins, H. H., et al. (2019). Species-dependent effects of habitat degradation in relation to seasonal distribution of migratory waterfowl in the East Asian–Australasian Flyway. Landsc. Ecol. 34, 243–257. doi: 10.1007/s10980-018-00767-7
Yang, L., Jin, S., Danielson, P., Homer, C. G., Gass, L., Bender, S. M., et al. (2018). A new generation of the United States National Land Cover Database—Requirements, research priorities, design, and implementation strategies. ISPRS J. Photogramm. Remote Sens. 146, 108–123. doi: 10.1016/j.isprsjprs.2018.09.006
Yu, W., Benoit, R., Girard, C., Glazer, A., Lemarquis, D., Salmon, J. R., et al. (2006). Wind energy simulation toolkit (WEST): A wind mapping system for use by the wind energy industry. Wind Eng. 30, 15–33. doi: 10.1260/030952406777641450
Keywords: avoidance behavior, drought, migration, optimization, stopover habitat, waterbird, wind energy infrastructure
Citation: Ellis KS, Pearse AT, Brandt DA, Bidwell MT, Harrell W, Butler MJ and Post van der Burg M (2022) Balancing future renewable energy infrastructure siting and associated habitat loss for migrating whooping cranes. Front. Ecol. Evol. 10:931260. doi: 10.3389/fevo.2022.931260
Received: 28 April 2022; Accepted: 27 July 2022;
Published: 12 August 2022.
Edited by:
Diana Hamilton, Mount Allison University, CanadaReviewed by:
Julia M. Touza, University of York, United KingdomDevin R. de Zwaan, Independent Researcher, Amsterdam, Netherlands
Copyright © 2022 Ellis, Pearse, Brandt, Bidwell, Harrell, Butler and Post van der Burg. This is an open-access article distributed under the terms of the Creative Commons Attribution License (CC BY). The use, distribution or reproduction in other forums is permitted, provided the original author(s) and the copyright owner(s) are credited and that the original publication in this journal is cited, in accordance with accepted academic practice. No use, distribution or reproduction is permitted which does not comply with these terms.
*Correspondence: Kristen S. Ellis, a2VsbGlzQHVzZ3MuZ292