 Gebreslassie Gebru1,2,3*
 Gurja Belay2
 Tadelle Dessie3Mulalem Zenebe Kelkay1
 Minister Birhanie Dagnhegn1
 Olivier Hanotte3,4,5*
- 1Tigray Agricultural Research Institute, Mekelle, Ethiopia
- 2Department of Microbial, Cellular and Molecular Biology, College of Natural Resource, Addis Ababa University, Addis Ababa, Ethiopia
- 3International Livestock Research Institute (ILRI), Addis Ababa, Ethiopia
- 4School of Life Sciences, University of Nottingham, Nottingham, United Kingdom
- 5Centre for Tropical Livestock Genetics and Health (CTLGH), The Roslin Institute, The University of Edinburgh, Edinburgh, United Kingdom
Ecogeographical habitat heterogeneity in wild endotherm species results in morphological variability associated with physiological mechanisms for maintaining their body temperature at a thermoneutral state in different environments. This habitat-induced morphological variation has led to the proposal of three main ecogeographical and biological rules (Rensch, Bergmann, and Allen). Whether or not domesticated animal species, under the care and management of humans, follow the same rules has not yet been investigated in detail. In this study, we randomly sampled 333 adult indigenous chickens (Gallus gallus domesticus) from three habitats representing the highland, midland and lowland agro-ecologies in the Tigray Region (Ethiopia). We aimed to assess the importance of Rensch’s, Bergmann’s, and Allen’s rules in shaping their morphology and osteology. For Bergmann’s and Allen’s rules, we analyzed the morphological characteristics of 297 (208 female, 89 male) and the osteological characteristics of 36 (19 female, 17 male) indigenous chickens. For the morphological validation of Rensch’s rule, we used 89 male chickens and randomly selected 89 female chickens, while for the osteological validation, 17 male and female chickens were analyzed. Chickens from the lowland agro-ecology (warm climate) had a smaller body mass index (BMI) and larger appendages, while chickens from the highland agro-ecology (cold climate) had a larger BMI and smaller appendages (Bergmann’s and Allen’s rules). Morphological and osteological sexual dimorphism were observed, with the male chickens being larger than the female chickens and with size differences proportional to the body size (Rensch’s rule). In both sexes, regression analysis showed a relationship between BMI and altitude as well as temperature. Shank length, wingspan, and the length and surface area (earlobe, wattle, and beak) of the appendages were significantly associated with climatic variables. Moreover, our regression model revealed that wingspan and shank length could be predicted from the greatest length of the humerus and tarsometatarsus. Our findings support the idea that indigenous chickens’ adaptation mechanisms to environmental challenges largely agree with the expectation of Rensch’s, Bergmann’s, and Allen’s biogeographical rules across the different altitudinal habitats of the Tigray Region.
Introduction
The oldest osteological chicken (Gallus gallus domesticus) remains on the African continent were found in the Tigray Region (Ethiopia) dating to around 800–400 BCE (Woldekiros and D’Andrea, 2017). Since then, chickens have been crucial to the farming activities of local communities, where they are still managed under a free-range production system with little supplementation (e.g., kitchen leftovers). They are continuously challenged by environmental pressures (feed, water, disease, weather, and predation) (Mcqueen et al., 2022), and natural selection, rather than human selection, is expected to have primarily shaped their phenotypes and genotypes. Moreover, indigenous chicken populations living in the great majority of the agro-ecologies of the country are undescribed and therefore may not be referred to as breeds.
Ecogeographical habitat variation has led to morphological diversity in endotherm species (Pitt et al., 2016) to maintain their physiology at a thermoneutral state (Yahav, 2015), which requires keeping their energy balance steady through a heat conservation/dissipation mechanism. As an endothermic species, the chicken had to develop mechanisms to adapt to different environmental temperature conditions. The generally accepted pattern is that chickens living in warm environments need to dissipate more heat energy to avoid stress, while chickens living in a cold environment need to conserve heat to keep their body temperature warm. Body temperature regulation may be achieved through changes in the morphological and osteological traits associated with internal physiological adaptation.
Not only do wild endothermic avian species exhibit phenotypic variation across different agro-ecological habitats, but they may follow biological (Rensch) and ecogeographical (Bergmann and Allen) rules (e.g., Symonds and Tattersall, 2010; Meiri, 2011). Rensch’s rule applies to species exhibiting sexual dimorphism. It states that when the male is the larger sex, following male–male competition, sexual dimorphism increases with body size (Rensch, 1959). Bergmann’s rule is an ecogeographical rule associated with latitude and altitude (Bergmann, 1848). It states that within broadly geographically distributed species, populations of larger body sizes are found in colder regions, while populations of smaller sizes are found in warmer regions, with the increasing body surface area facilitating thermoregulation (Salewski and Watt, 2017). Allen’s rule is an extension of Bergmann’s rule, predicting that the appendage size in endotherms (e.g., combs, wattles, and beaks) becomes larger in warm regions for similar thermoregulatory reasons (Allen, 1877).
Several studies have tried to validate these rules (Rensch, Bergmann, and Allen) in endothermic species, including avian and mammalian wild species (Meiri, 2011; McCollin et al., 2015; de Moura Bubadué et al., 2016, 2018; Fan et al., 2019; Mcqueen et al., 2022). Recent studies by Fan et al. (2019) and Mcqueen et al. (2022) have validated Allen’s and Bergmann’s rules in passerine birds and shorebirds, respectively. de Moura Bubadué et al. (2018) and Symonds and Tattersall (2010) illustrated the application of Rensch’s rule in howler monkeys (genus Alouatta) and across bird species, respectively. However, these two studies found no relationship between body size and latitude or altitude, an expectation of Bergmann’s rule. McCollin et al. (2015) tested Allen’s and Bergmann’s rules in four bird species of the United Kingdom (blackbird Turdus merula, song thrush Turdus philomelos, house sparrow Passer domesticus and European robin Erithacus rubecula). The results were broadly in line with the predictions from Bergmann’s and Allen’s rule, except for the European robin. As pointed out by McCollin et al. (2015), both natural and sexual selection may here play a role in shaping bird morphology.
Osteological studies can potentially differentiate groups of similar species (Tschopp et al., 2022). In domestic animals, they have played an important role in the identification of their wild ancestors. In Galliformes, they may also contribute to distinguishing the bone remains of domestic chickens from local African francolins (species belonging to the genera Dendroperdix/Ortygornis, Scleroptila, Pternistis, and Peliperdix) and Numidinae (Woldekiros et al., 2019). Thomas et al. (2016) also highlighted the importance of chicken osteology in determining chicken age. So far, little intraspecific osteological evidence has been made available for the domestic and wild chicken (MacDonald, 1992; Thomas et al., 2016; Woldekiros and D’Andrea, 2017), including indigenous populations.
Osteological studies of indigenous chickens may also provide insights into how environmental factors modified their morphology and osteology by correlating agro-climatic variables with internal and external measurements. This approach also bares potential for exploring the link between chicken osteology and their external phenotypes, which is highly relevant to archaeozoologists interested in understanding the evolution of domestic chicken morphological traits in relation to human societies (Taylor et al., 2020).
In this study, we examined how environmental climatic conditions (temperature and precipitation) may have shaped the morphology and osteology of indigenous chicken populations from three agro-ecologies (lowland, midland, and highland) of the Tigray Region (Ethiopia). We included temperature as directly related to thermotolerance and precipitation, as it affects food and water availability and thermotolerance. These two environmental variables are often associated with latitude and altitude. Besides the morphological and osteological characterization, we also assessed the validity of Rensch’s, Bergmann’s, and Allen’s rules by comparing the results within and across the three agro-ecologies. Finally, our analysis allowed us to propose an osteological model to predict chicken morphology.
Materials and methods
Sampling sites
The study was conducted in the Tigray Region in northern Ethiopia (12°15′2″′ to 14°57′2″′ north latitude, 36°27′2″ to 39°59′2″ east longitude). The region encompasses a 54,000 km2 area (Yihdego et al., 2018) categorized into three main agro-ecological zones based on elevation. The lowland agro-ecology is characterized by a proportion of land <1,500 meters above sea level (m.a.s.l.) of 53%, the midland agro-ecology will have a proportion of land ranging from 1,500 to 2,300 m.a.s.l. at a minimum of 39% of the area, while the highland agro-ecology will have at least 8% of its surface area >2,300 m.a.s.l. (Beyene et al., 2001). In all these regions, the warmest months are those from March to May, whereas the coldest months are those from June to August.
The sampling area map and the climatic and altitude variables are presented in Figures 1A, B and Supplementary Figure 1, respectively (the GPS coordinates are shown in Supplementary Table 1). For each agro-ecology, the sample size (including the number of birds of each sex) is presented in Supplementary Table 2.
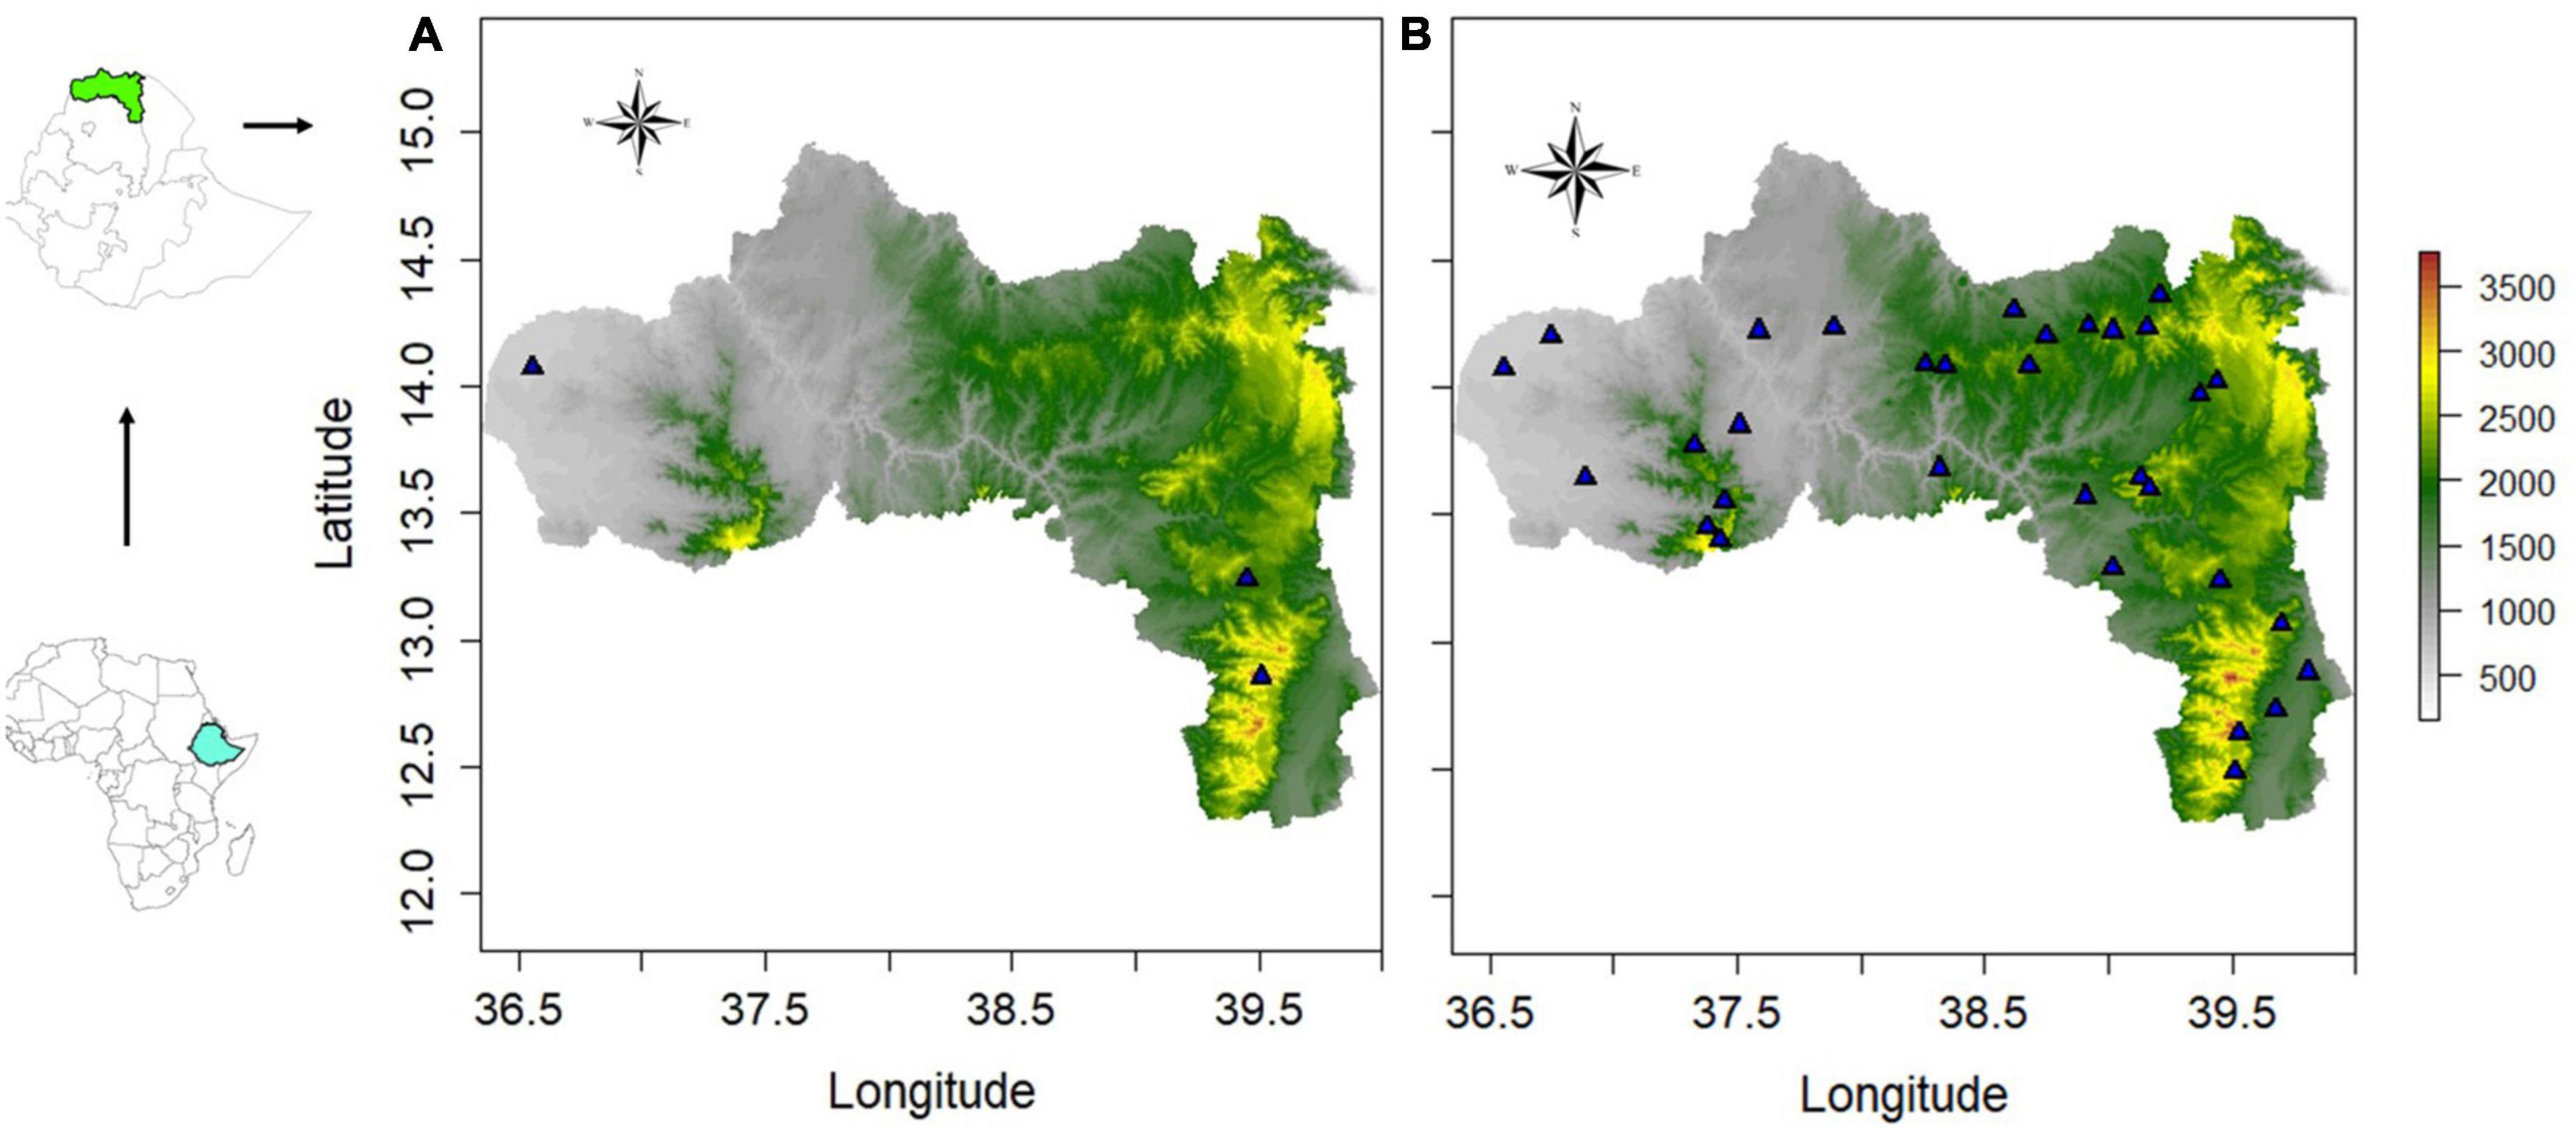
Figure 1. Sampling sites. (A) Osteological study. (B) Morphological study. See Supplementary Table 1 for the GPS coordinates.
For the morphological study we sampled the whole region (Supplementary Tables 1, 2). Whereas, three villages (one for each agro-ecology) were sampled for the osteological study. Tsibet encompasses the highest elevation in the region (3,965 m.a.s.l.) and represents the highland agro-ecology. Here, the temperature drops as low as 2°C in the coldest month. The main crops grown here are tef (Eragrostis tef) along with wheat (Triticum aestivum). Mesanu stretches over an elevation ranging from 1,825 to 2,625 m.a.s.l. and represents the midland agro-ecology. The main crops grown in this village are barley (Hordeum vulgare), sorghum (Sorghum bicolor), millet (Eleusine coracana), tef, and wheat. Maykadra is a lowland agro-ecology village with an altitude of around 626 m.a.s.l. The peak temperatures can reach up to 46°C in the hottest month (May), and the main crops are sesamum (Sesamum indicum) and sorghum.
Samples
To examine the morphological and osteological differences of indigenous chickens across the three agro-ecologies, we measured 297 individuals (208 female and 89 male) for the morphology and 36 individuals (19 female and 17 male) for the osteology (Supplementary Table 2). We used this sample size to validate Bergmann’s and Allen’s rules. However, we needed an equal sample size for validating Rensch’s rule, so we used an equal number of chickens of each sex. This rule requires the calculation of the sexual size dimorphism index (SSDI: a ratio value). For the morphological trait validation of Rensch’s rule, we used 89 male chickens and randomly selected 89 female chickens. Similarly, for Rensch’s rule validation using osteological traits, we used the 17 male and female chickens by iteratively and randomly removing two chickens (Supplementary Table 3). The sampled chickens had to fulfill the following criteria: (i) the owner had kept them for more than 8 years or inherited them from a family member; (ii) the household had no history of market exchange and crossing with exotic chickens; (iii) they were either healthy 1 year (or older) cocks or 7 month-old (or older) hens that had reproduced at least once (to avoid biases associated with immaturity). In addition, we only sampled one chicken per household to avoid the sampling of related birds. The sampling protocols and procedures were approved by the Institutional Animal Care and Use Committee of the International Livestock Research Institute (IREC2017-26).
Environmental variables
Eleven climatic variables were selected (Fan et al., 2019). These included temperature-related variables such as annual mean temperature (bio1), temperature seasonality (bio4), maximum temperature of the warmest month (bio5), minimum temperature of the coldest month (bio6), annual temperature range (bio7), mean temperature of the warmest quarter (bio10) and mean temperature of the coldest quarter (bio11), as well as precipitation-related variables such as annual precipitation (bio12), precipitation seasonality (bio15), precipitation of the warmest quarter (bio18), and precipitation of the coldest quarter (bio19) (Supplementary Table 4). We also included altitude (meters above sea level, m.a.s.l.) as a variable (de Moura Bubadué et al., 2018). Gridded climatic data (1970–2000 mean value) were extracted from the WorldClim database1 with a spatial resolution of 1 km2 (Hijmans et al., 2005; Fick and Hijmans, 2017).
Morphological and osteological traits
The following morphological traits were recorded: (i) morphology—body weight, body mass index, wingspan, body length, chest circumference, shank circumference, and shank length; (ii) appendage length—length and width of the beak, comb, earlobe, and wattle; (iii) appendage area—comb, earlobe, wattle, and beak surface area. Body length and wingspan, as well as chest and shank circumference, were measured using a plastic tailor meter with a 1- mm space reading. Body weight was measured using a balance with a 10-gg difference reading. The appendage length and surface area categories were measured using the ImageJ software by taking a picture of the desired trait using a 20-megapixel quality camera and a vernier caliper for the scale. Then, we applied ImageJ to convert the pixel measurement to the desired metric measurement: pixel size to length (mm) and area to surface (mm2) (Figure 2 and Supplementary Figures 2A–D).
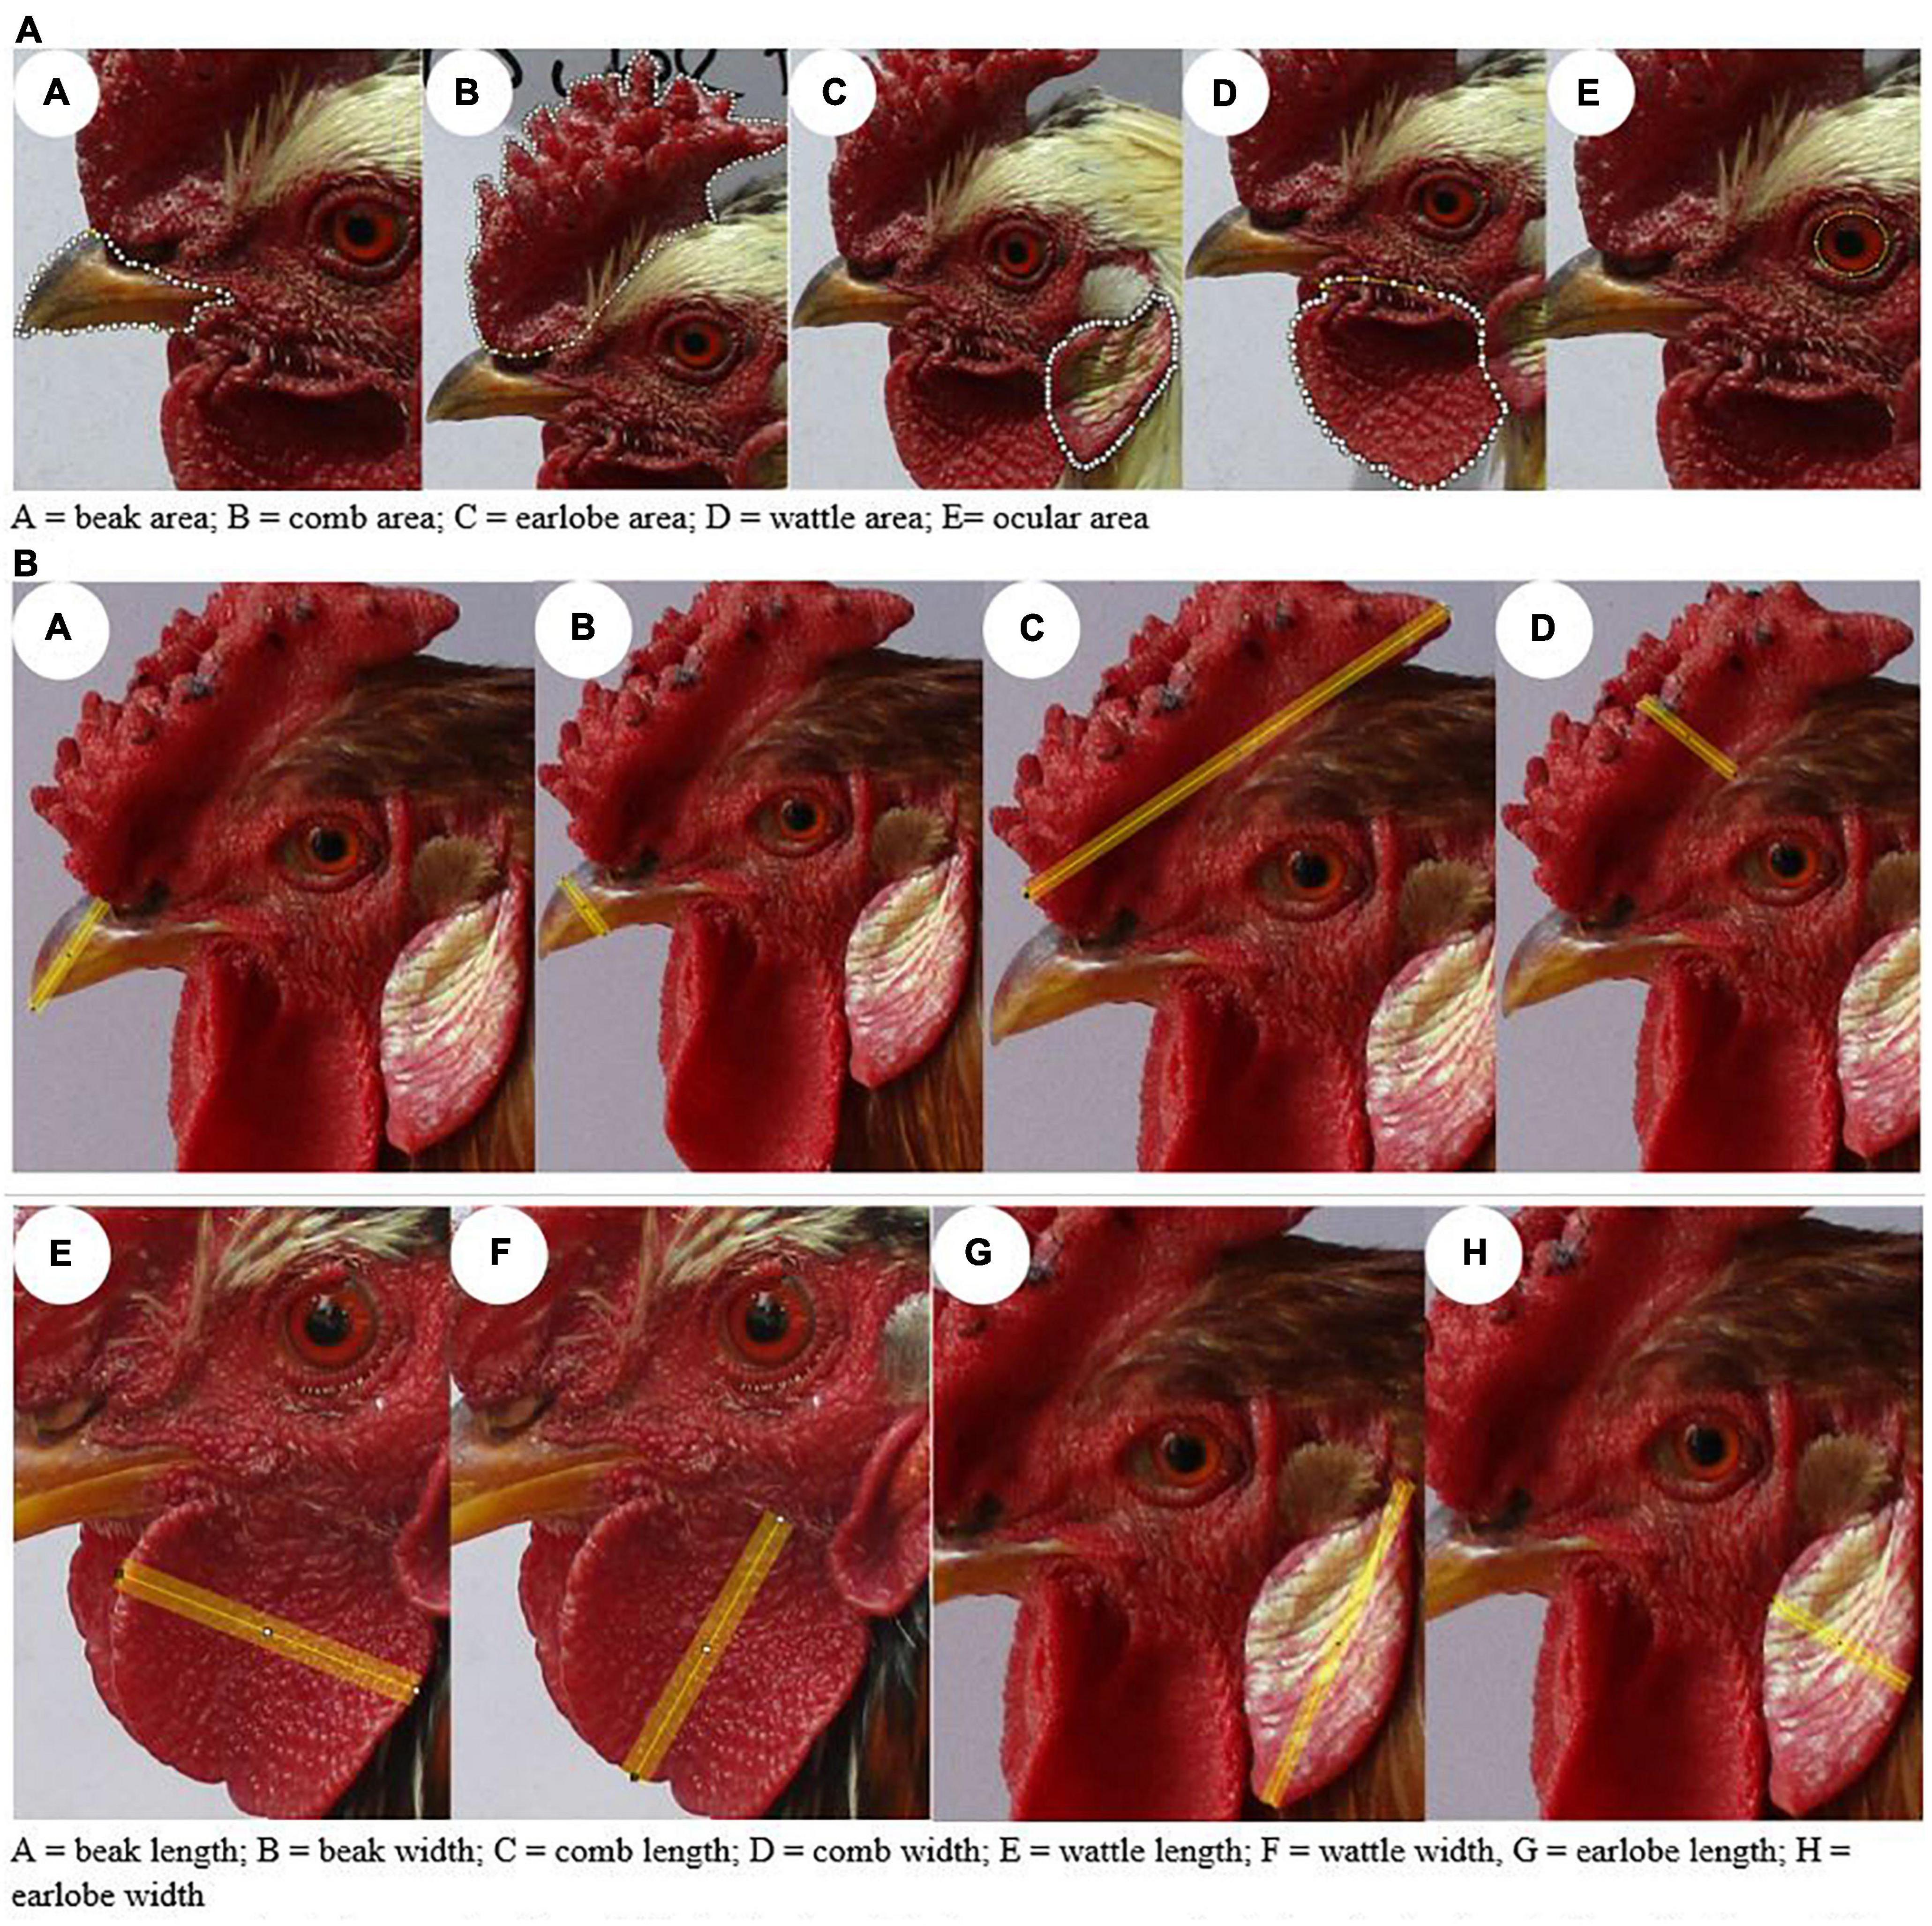
Figure 2. Example of photographs of morphological traits and their measurements for their analysis using the ImageJ software. (A) Surface area. (B) Length.
The chickens were slaughtered, deboned and boiled to remove any meat and tendon following the procedure recommended by Davis and Payne (1992). The bones were then measured using a digital vernier caliper with a 0.01 mm accuracy following Von den Driesch (1976) (Supplementary Figure 3). For osteological measurements, we distinguished two categories: (i) forelimb greatest length—scapula, coracoid, humerus, ulna, radius, and carpometacarpus; (ii) hindlimb greatest length—femur, tibiotarsus, and tarsometatarsus.
Data analysis
For all statistical analysis, R program version 4.2.2 was employed (R Core Team, 2021). We used multivariate analysis of variance (MANOVA) to differentiate the osteological trait variances (between sex and/or agro-ecology) and the relationship between the response variables (Smith et al., 1962). The analysis was carried out by assigning agro-ecology and/or sex as an independent variable and osteological measurements as the dependent variable (by grouping the data into the hindlimb and forelimb greatest length categories). The assumptions of MANOVA include independent random sampling, level and measurement of the variables, absence of multicollinearity, normality, and homogeneity of variance. Such assumptions were assessed with the R packages “rstatix” (Kassambara, 2021), “heplots” (Fox et al., 2009), “mvnormalTest” (Zhou and Shao, 2014) and cor.test syntax. After performing the MANOVA analysis using “MANOVA” syntax in R (Lars and Wold, 1990), we used the “effectivesize” package (Ben-Shachar et al., 2020) to calculate the eta-square value and the “MASS” package (Ripley, 2021) for linear discriminate analysis (lda). However, as the morphological measurements did not meet the MANOVA assumptions, we analyzed these data using permutation multivariate analysis of variance (PERMANOVA) (Anderson, 2014), which works with non-parametric and parametric data. We used the agro-ecology and sex as independent variables and grouped morphology, appendage length, and surface area measurements as dependent variables. Hence, we applied the Bray–Curtis method implemented in the “vegan” package (Dixon, 2003) to explore the patterns of similarity or dissimilarity in chicken morphology across agro-ecologies and sex. For the post hoc analysis, we used the “pairwiseAdonis” package (Arbizu, 2020).
Spatial autocorrelation between variables may produce a statistical type one error (Diniz-filho et al., 2003). In particular, this might be the case for environmental variables (Dormann et al., 2007; Crase et al., 2012; de Moura Bubadué et al., 2016, 2018). Therefore, we checked the autocorrelation of the environmental variables with two procedures. First, we produced a bubble plot of the model residuals with the “sp” package (Pebesma and Bivand, 2005; Supplementary Figure 4). Here, we used bubble program syntax by using sampling geographic coordinates to produce the spatial data frame of the environmental variables. In addition, we also confirmed the spatial autocorrelation with Moran’s test (Supplementary Tables 5, 6) using the “spdep” package (Bivand et al., 2015). As suggested by Dormann et al. (2007), incorporating only residuals as covariates when dealing with spatial autocorrelated variables may not be appropriate for mobile animals. This may be overcome by using model-based solutions. Hence, we applied linear, rational quadratic, exponential, Gaussian and spherical models. From these models, we chose the candidate correlation structure with the lowest Akaike information criterion (AIC) to validate Bergmann’s and Allen’s rules for each trait. We used the “nlme” package (Pinheiro et al., 2007) with generalized least square (gls) syntax with their data frame incorporating the geographic coordinates of the samples to generate the model.
Hence, to validate Bergmann’s and Allen’s rules, we employed “gls” syntax by setting the morphological and osteological traits as response variables and all the environmental variables as the dependent variable. For each model, we incorporated their correlation structure (corLin, corRatio, corExp, corGaus, and corSpher) and chose a model with minimum AIC. Finally, from the model residual values, we rechecked the presence of spatial autocorrelation for the selected model using Mora’s test. The slope, (R2) and probability values were considered in accepting or rejecting the rules (Bergmann, Allen, and Rensch). Similar procedures were applied to assess the relationship between the osteological and morphological traits. To run the “gls” syntax, we put each osteological trait as a independent variable and the morphological traits as a dependent variable.
To validate Rensch’s rule, we also calculated the SSDI value using the formula ([male / female] − 1) proposed by Lovich and Gibbons (1992). The linear regression model was then applied, and the packages “ggpmisc” (Aphalo, 2021) and “ggplot2” (Wickham et al., 2016) were used to plot the outputs. For this analysis, we set the SSDI as an independent variable and the log-transformed morphology and osteology measurements as a dependent variable.
Results
Morphological traits
PREMANOVA showed that the hen and cock morphological traits were significantly different (P-value 0.001), with model explanation percentages of 51, 66, and 69% for the morphology, appendage length, and appendage surface area categories, respectively (Supplementary Table 7 and Figure 3). The pairwise comparison between sexes showed that the cocks were significantly larger than the hens (P-value < 0.001). Similarly, the PERMANOVA analysis also showed that the morphological traits (morphology) of the hen and cock displayed significant differences across the agro-ecologies (P-value < 0.002 to 0.001) (Supplementary Table 8). For the hens, the models explained 34, 14, and 17% of the morphology, appendage length, and appendage surface area, respectively. Meanwhile, for the cocks, the models explained 37, 14, and 11% of the morphology, appendage length, and appendage surface area, respectively. The pairwise comparisons between the agro-ecologies showed that the morphology and appendage measurements for chickens of both sexes, in the lowland and midland agro-ecologies, were significantly larger compared to the chickens from the highlands (P-value < 0.001) (Supplementary Table 9).
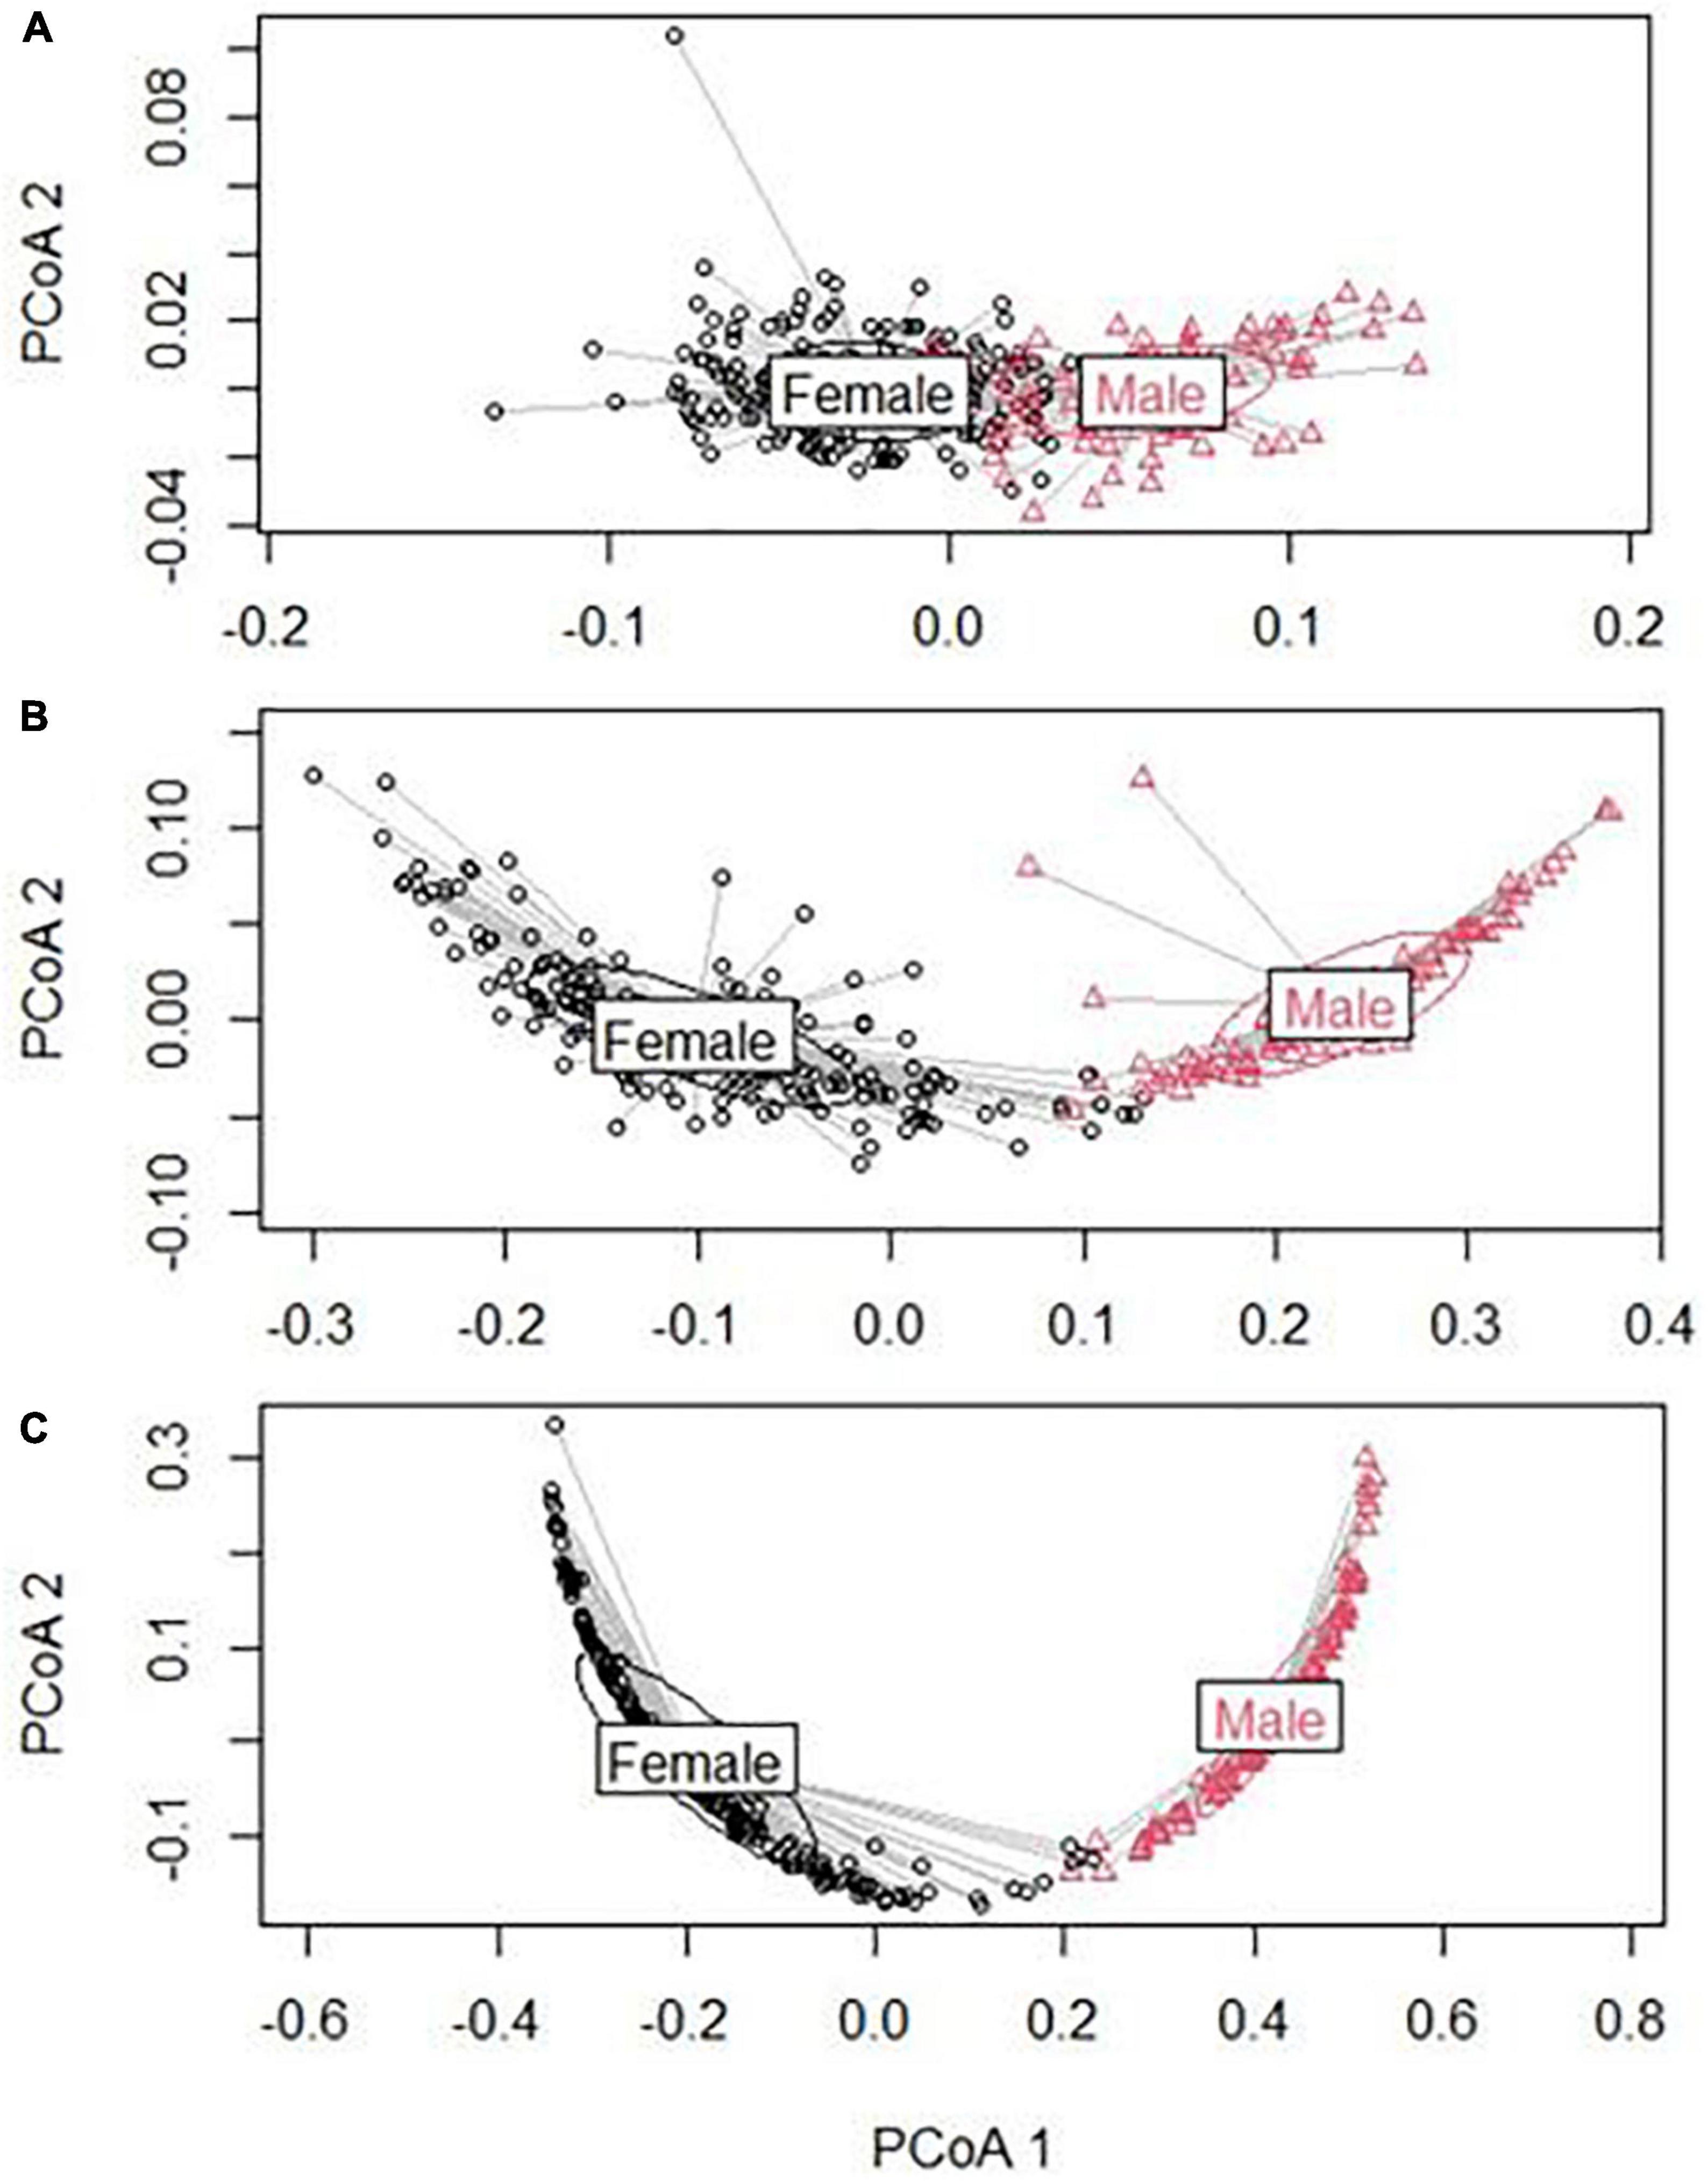
Figure 3. Principal component analysis (PERMANOVA result) based on morphology data (male and female). (A) Morphology; (B) appendix length; and (C) appendix surface area.
Osteological traits
Multivariate analysis of variance indicated the sexual size dimorphism for the chicken osteology. For the forelimb greatest length, the values were Pillai’s = 0.75, F(6,29) = 14.64, P-value < 0.0001 with the highest eta-square value 0.75 (0.6,1). For the hindlimb greatest length, the values were Pillai’s = 0.74, F(3,32) = 30.6, P-value < 0.0001 with the highest eta-square value 0.74 (0.6,1) (Supplementary Table 10). The agro-ecology had a significant impact on the chicken hindlimb greatest length size difference [Pillai’s = 0.46, F(6,30) = 1.48, P-value < 0.0001 and Pillai’s = 0.76, F(6,26) = 2.7, P-value < 0.04, for hens and cocks, respectively]. The highest eta-square values were 0.23 (0,1) and 0.38 (0.02,1) for the female and male chickens, respectively. They explain the power of the independent traits in describing the variation associated with the agro-ecologies. The lowland chicken displayed the larger hindlimb greatest length, followed by the midland chicken (both sexes) (Figure 4 and Supplementary Table 11). The first and second principal components (PC) explained 90.6 and 9.4% of the variation in the female chickens. PC1 and PC2 explained 96 and 4% of the variations in the male chickens (MANOVA analysis followed by discriminate analysis). Conversely, the agro-ecology was not associated with the forelimb greatest length measurements [Pillai’s = 0.96, F(12,24) = 1.85, P-value > 0.1 and Pillai’s = 0.51, F(12,20) = 0.57, P-value > 0.57 for hens and cocks, respectively].
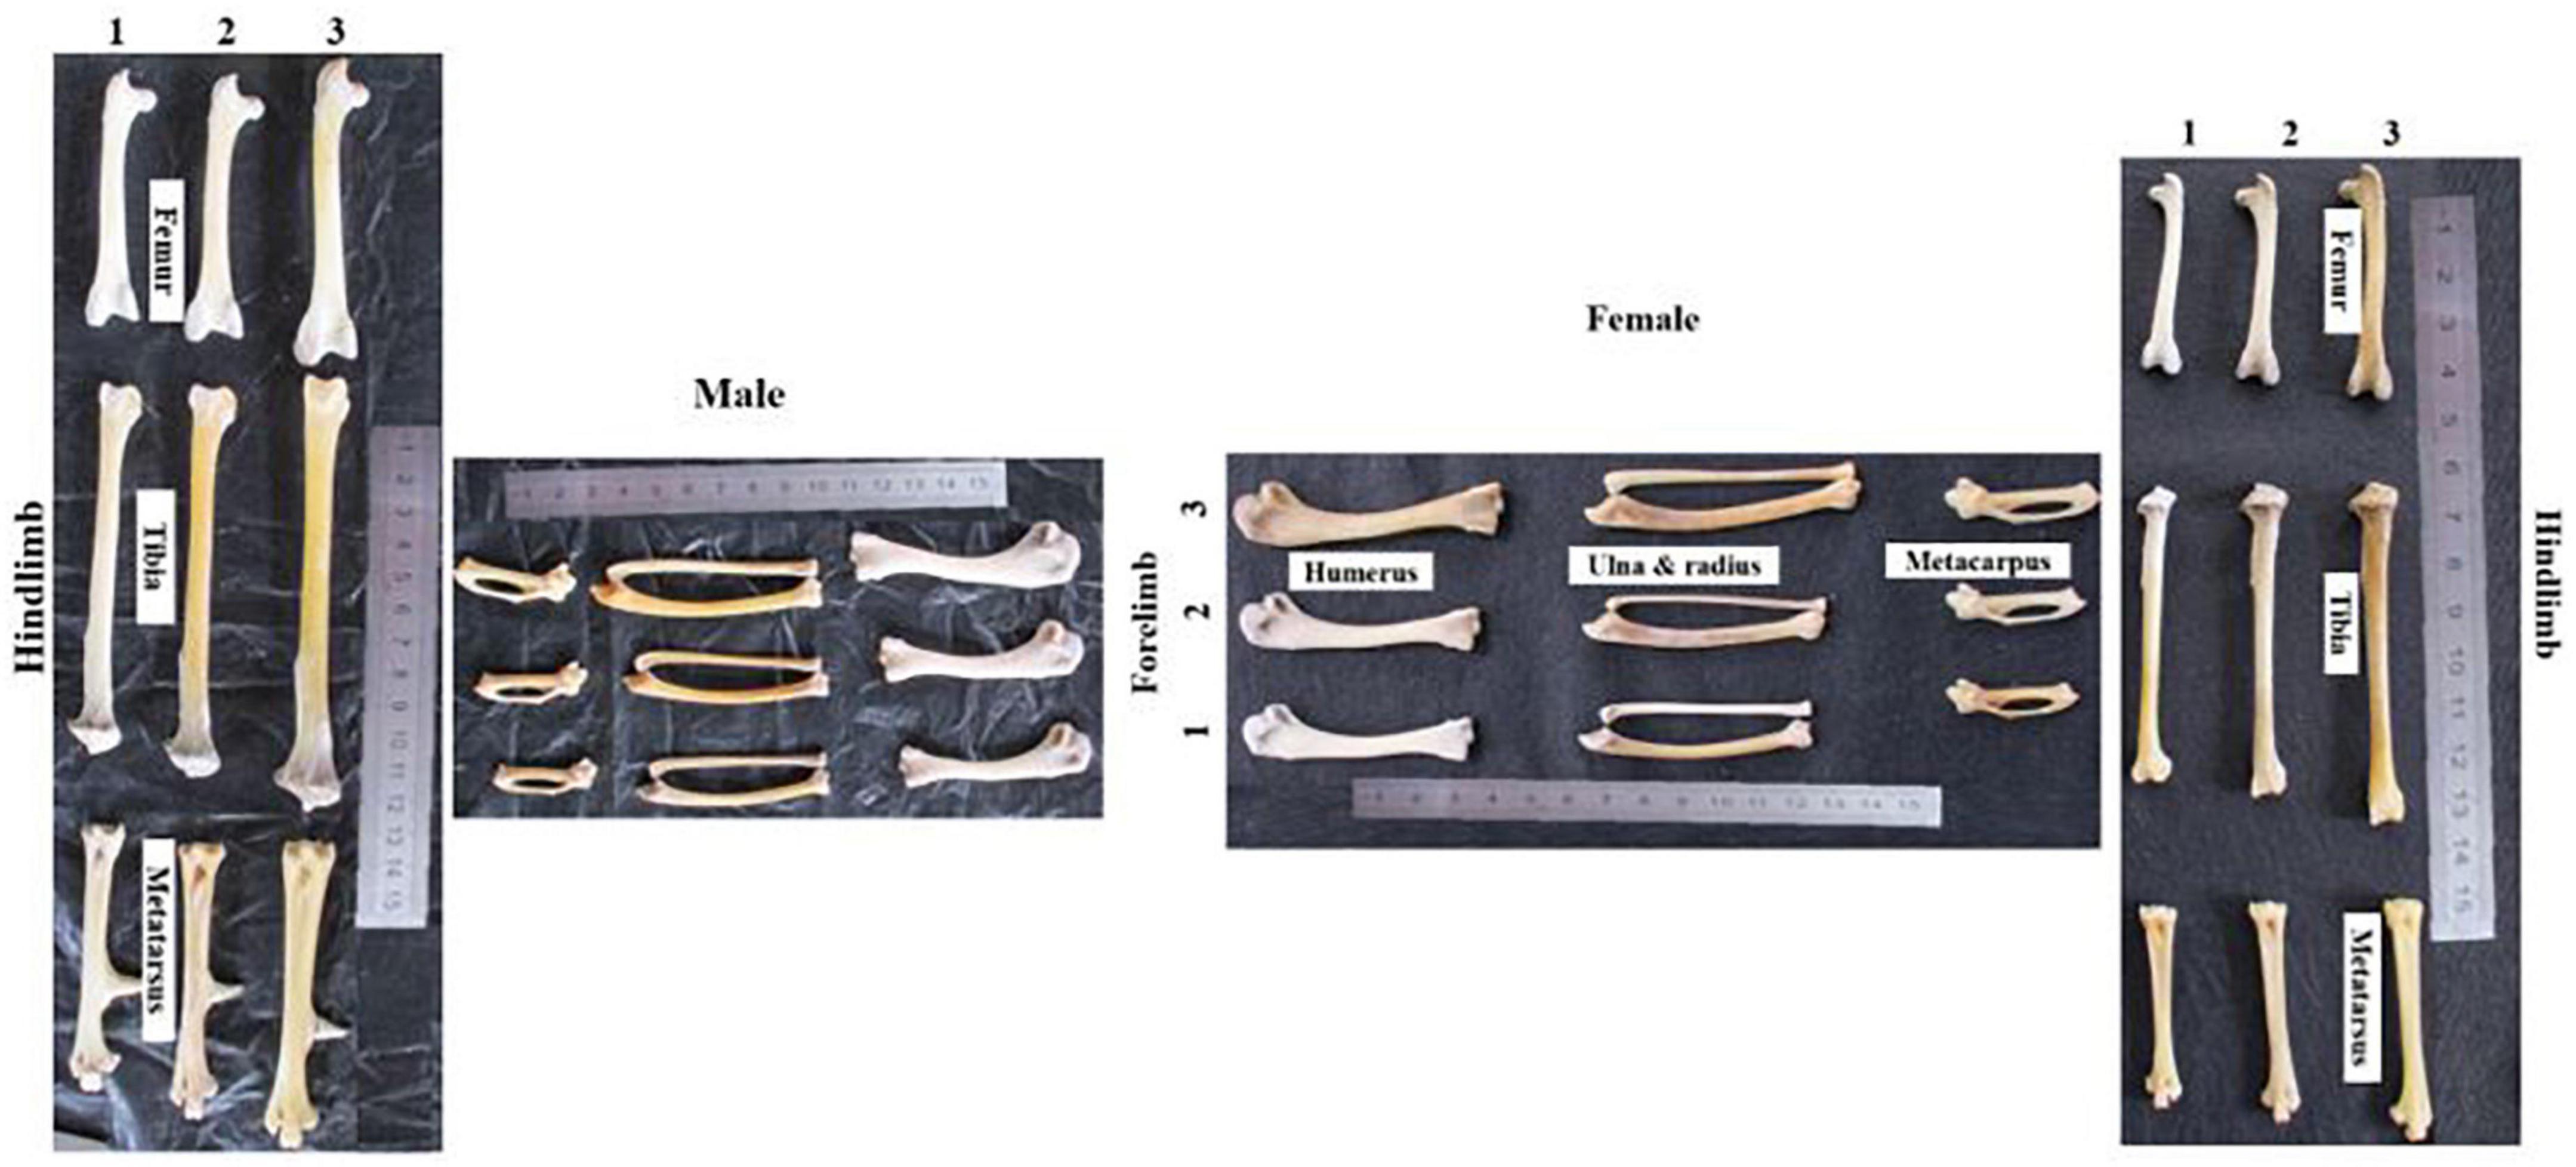
Figure 4. Osteology picture of male and female chicken across the three agroecologies. 1, highland; 2, midland; and 3, lowland.
Predicting morphological traits from osteological measurements
We observed a linear and significant relationship between the morphological and osteological traits (Table 1). Moreover, we detected a strong positive correlation among the osteological traits (Supplementary Tables 12A, 13A), supporting their collinearities. Hence, we chose humerus -Gl and tarsometatarsus -Gl to assess their predictive power for the total wingspan and shank length, respectively. For this purpose, we developed two linear regression models (Supplementary Tables 12A–E, 13A–E). These two traits contributed more significantly to predicting wingspan and shank length than the other osteological traits (Supplementary Tables 12B, 13B). A high (R2) of 0.89 (Supplementary Table 12C) and 0.94 (Supplementary Table 13C) with significant positive correlation values (P < 0.001) was observed for humerus -Gl and tarsometatarsus -Gl, respectively (Supplementary Tables 12D, 13D). For our wingspan prediction model, we developed the following equation: Y = 0.187 + 0.591X, with the Y value being the estimated wingspan and the X value the recorded humerus -Gl length (Figure 5A). For the estimation of the shank length, the equation was Y = −12.4 + 1.1X, with the Y value being the estimated shank length and X the measured tarsometatarsus -Gl length (Figure 5B).
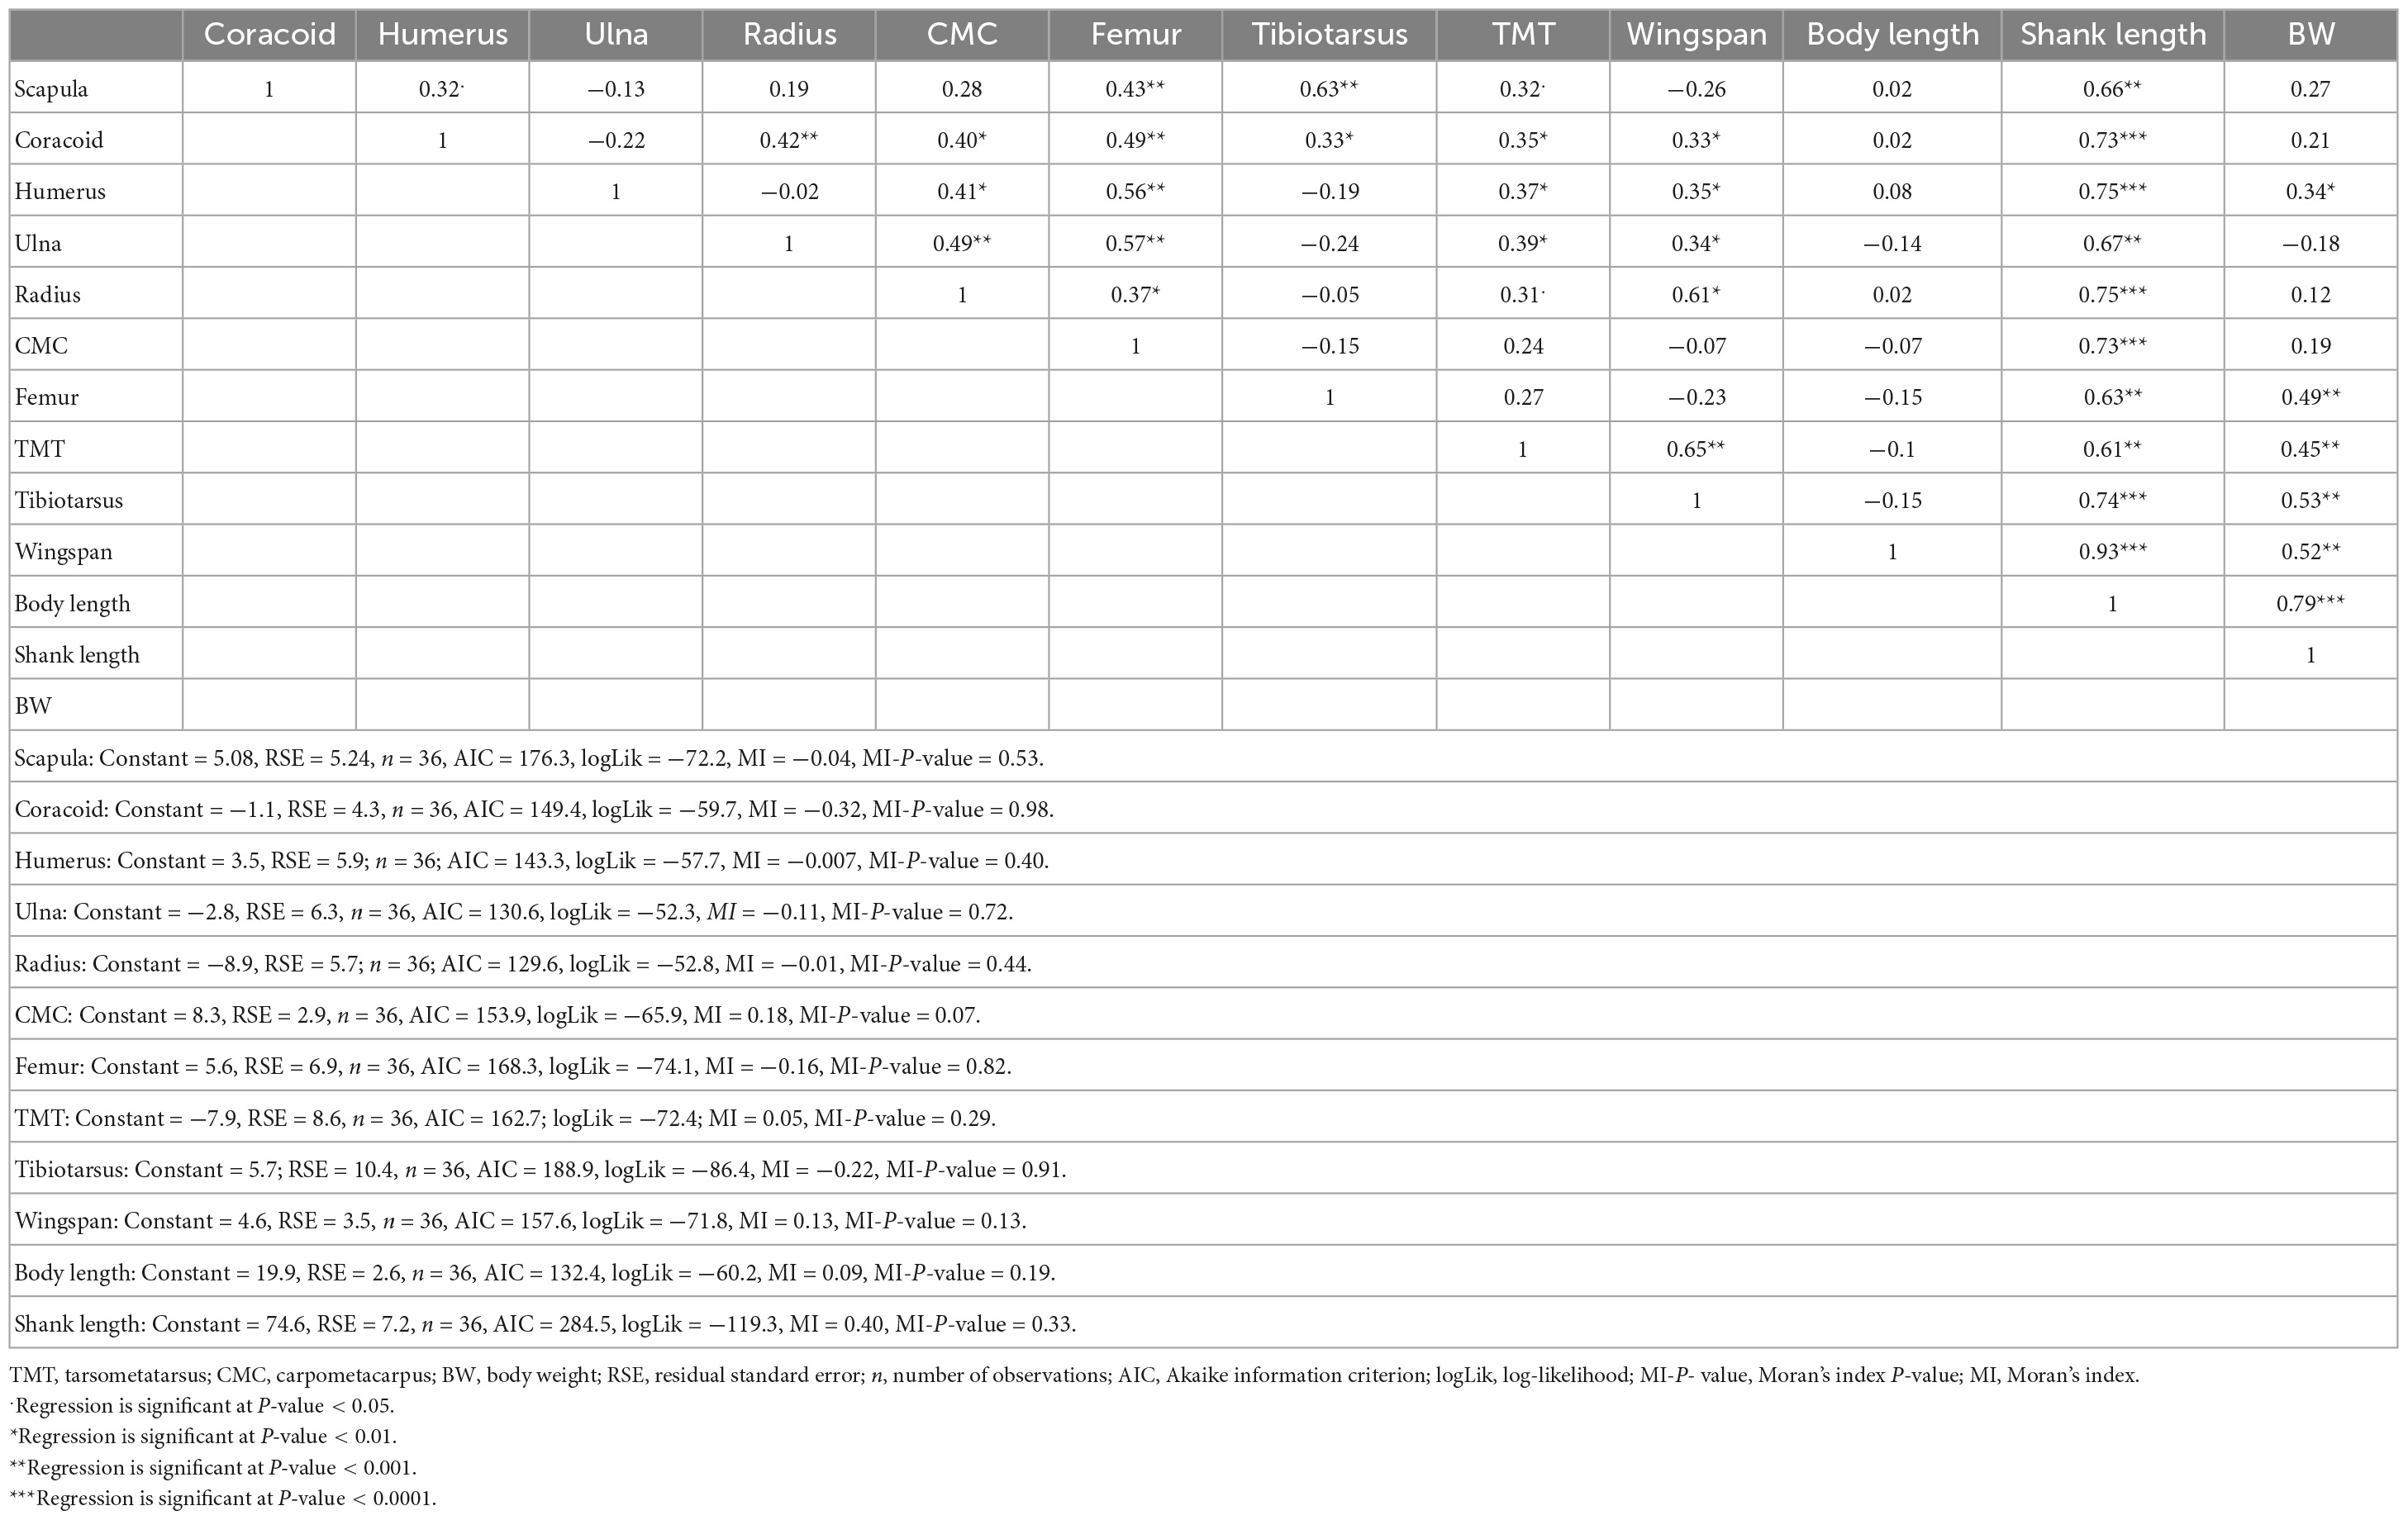
Table 1. Relationships (multiple linear regression) between morphological and osteological variables.
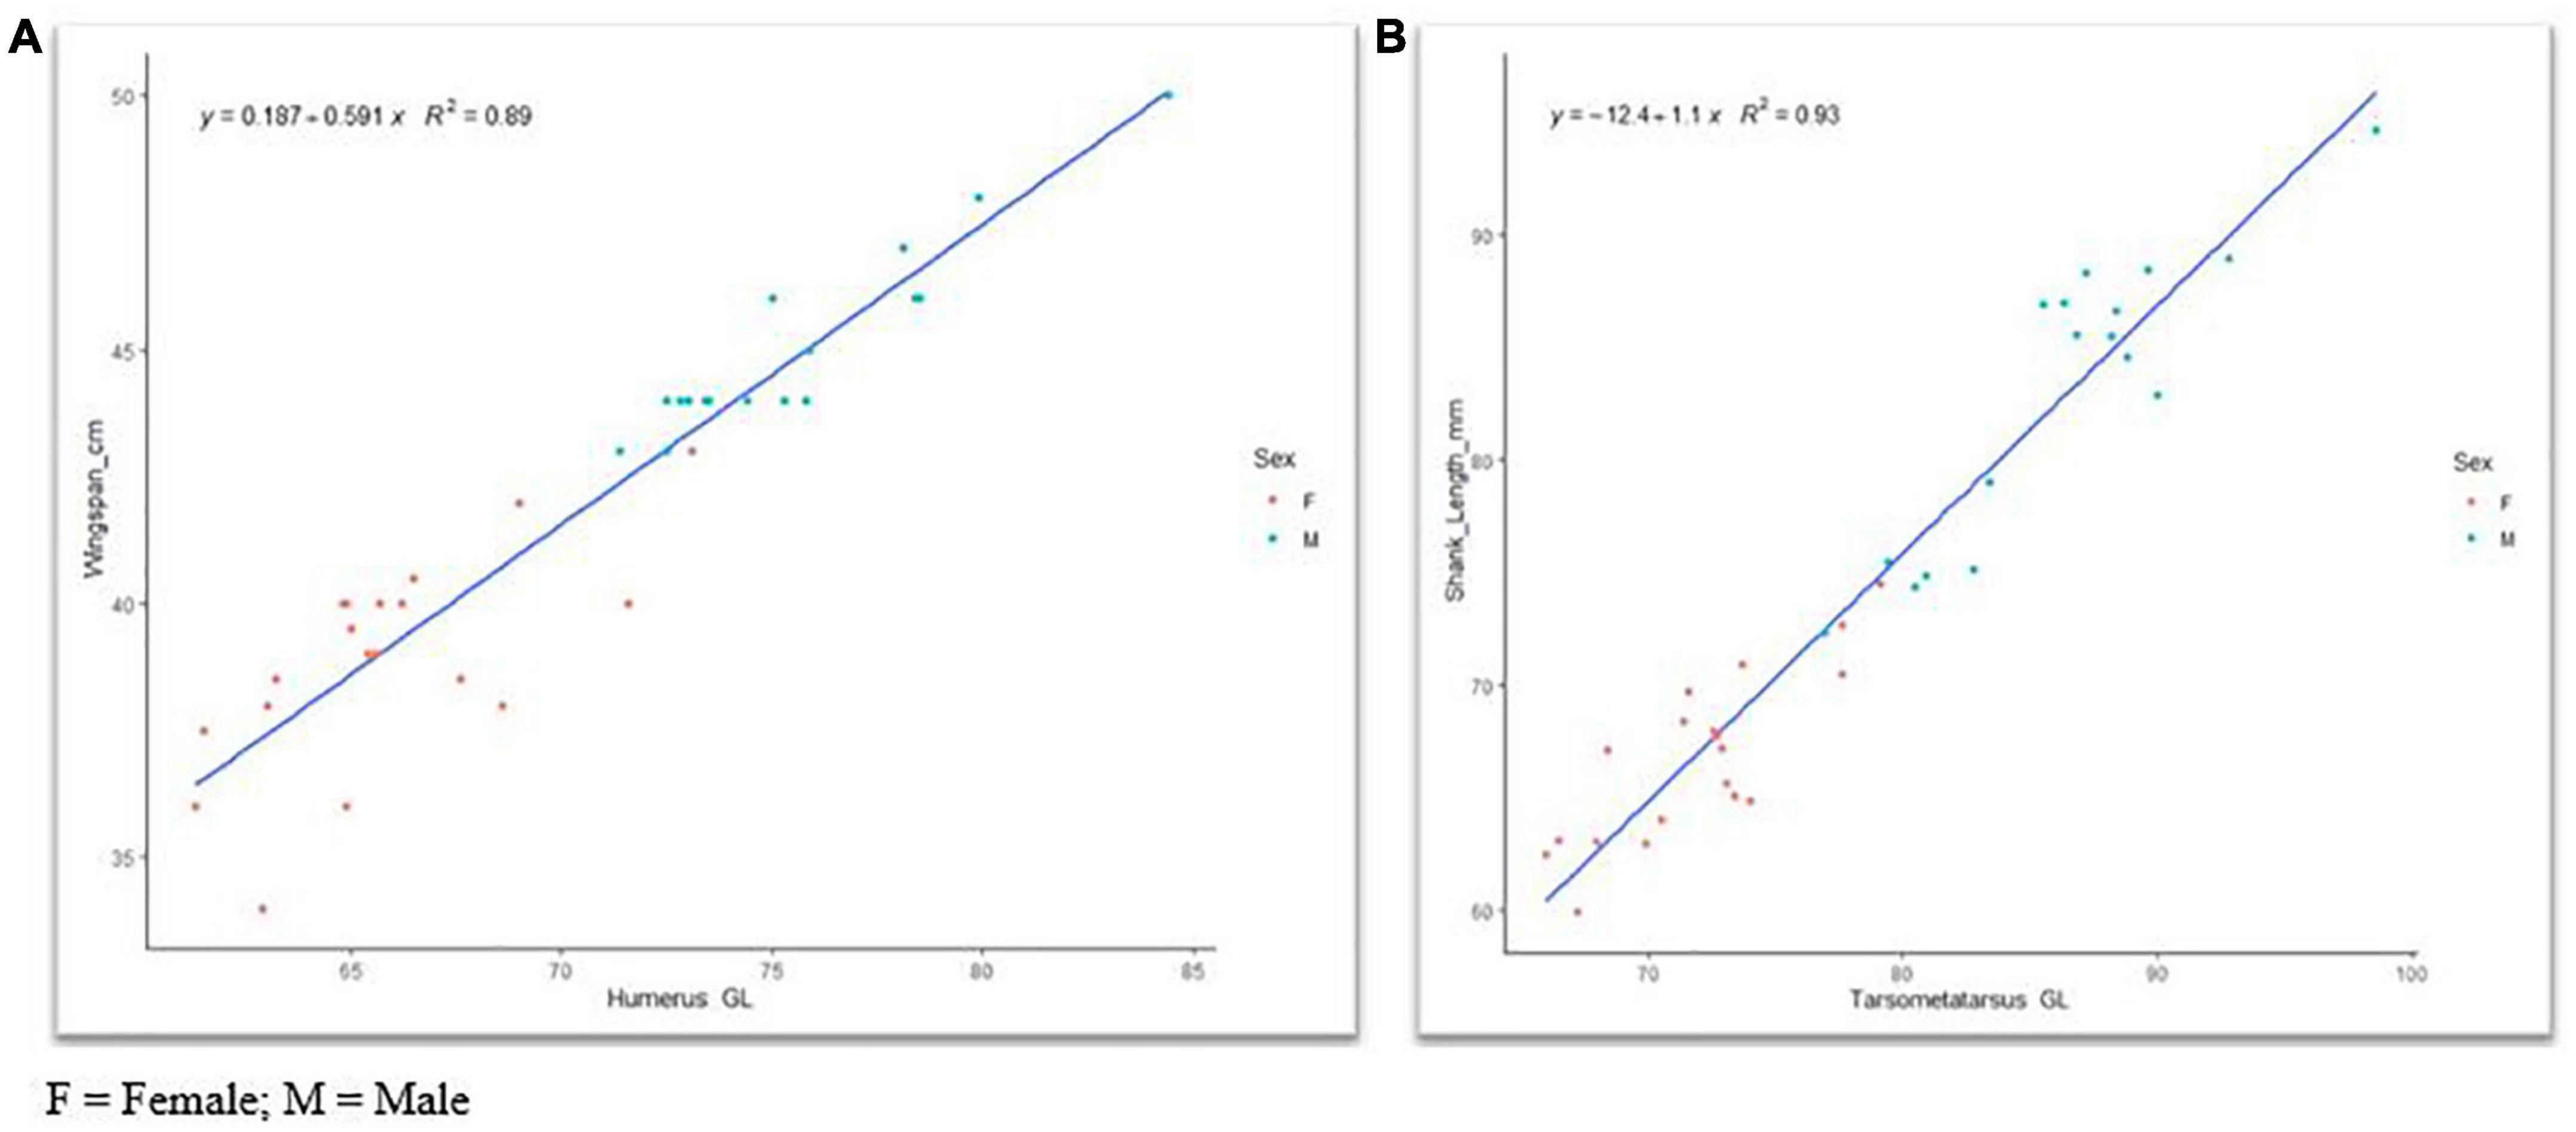
Figure 5. Linear regression model of (A) wingspan versus humerus and (B) shank length versus tarsometatarsus greatest length. F, female; M, male.
Bergmann’s rule
Overall, our findings agreed with the expectation of Bergmann’s rule. However, more temperature variable gradients (3 out of 7) than precipitation ones (1 out of 4) were correlated with BMI in both sexes (Tables 2, 3 and Figure 6). Specifically, in the highland cocks, the mean temperature of the coldest quarter (bio11) was correlated with BMI (R2 = 0.05, P-value = 0.04), as was the precipitation of the warmest quarter (bio18) (R2 = 0.05, P-value = 0.07). The lowland cocks’ BMI was also correlated with the maximum temperature of the warmest month (bio5) (R2 = 0.01, P-value = 0.05). Similarly, the hens adapted to the lowland agro-ecology also showed an association between the BMI and minimum temperature of the coldest month (bio6) (R2 = 0.007, P-value 0.09). There was no association between the BMI of the hens and cocks and the remaining environmental variables or the altitude (P-value > 0.1).
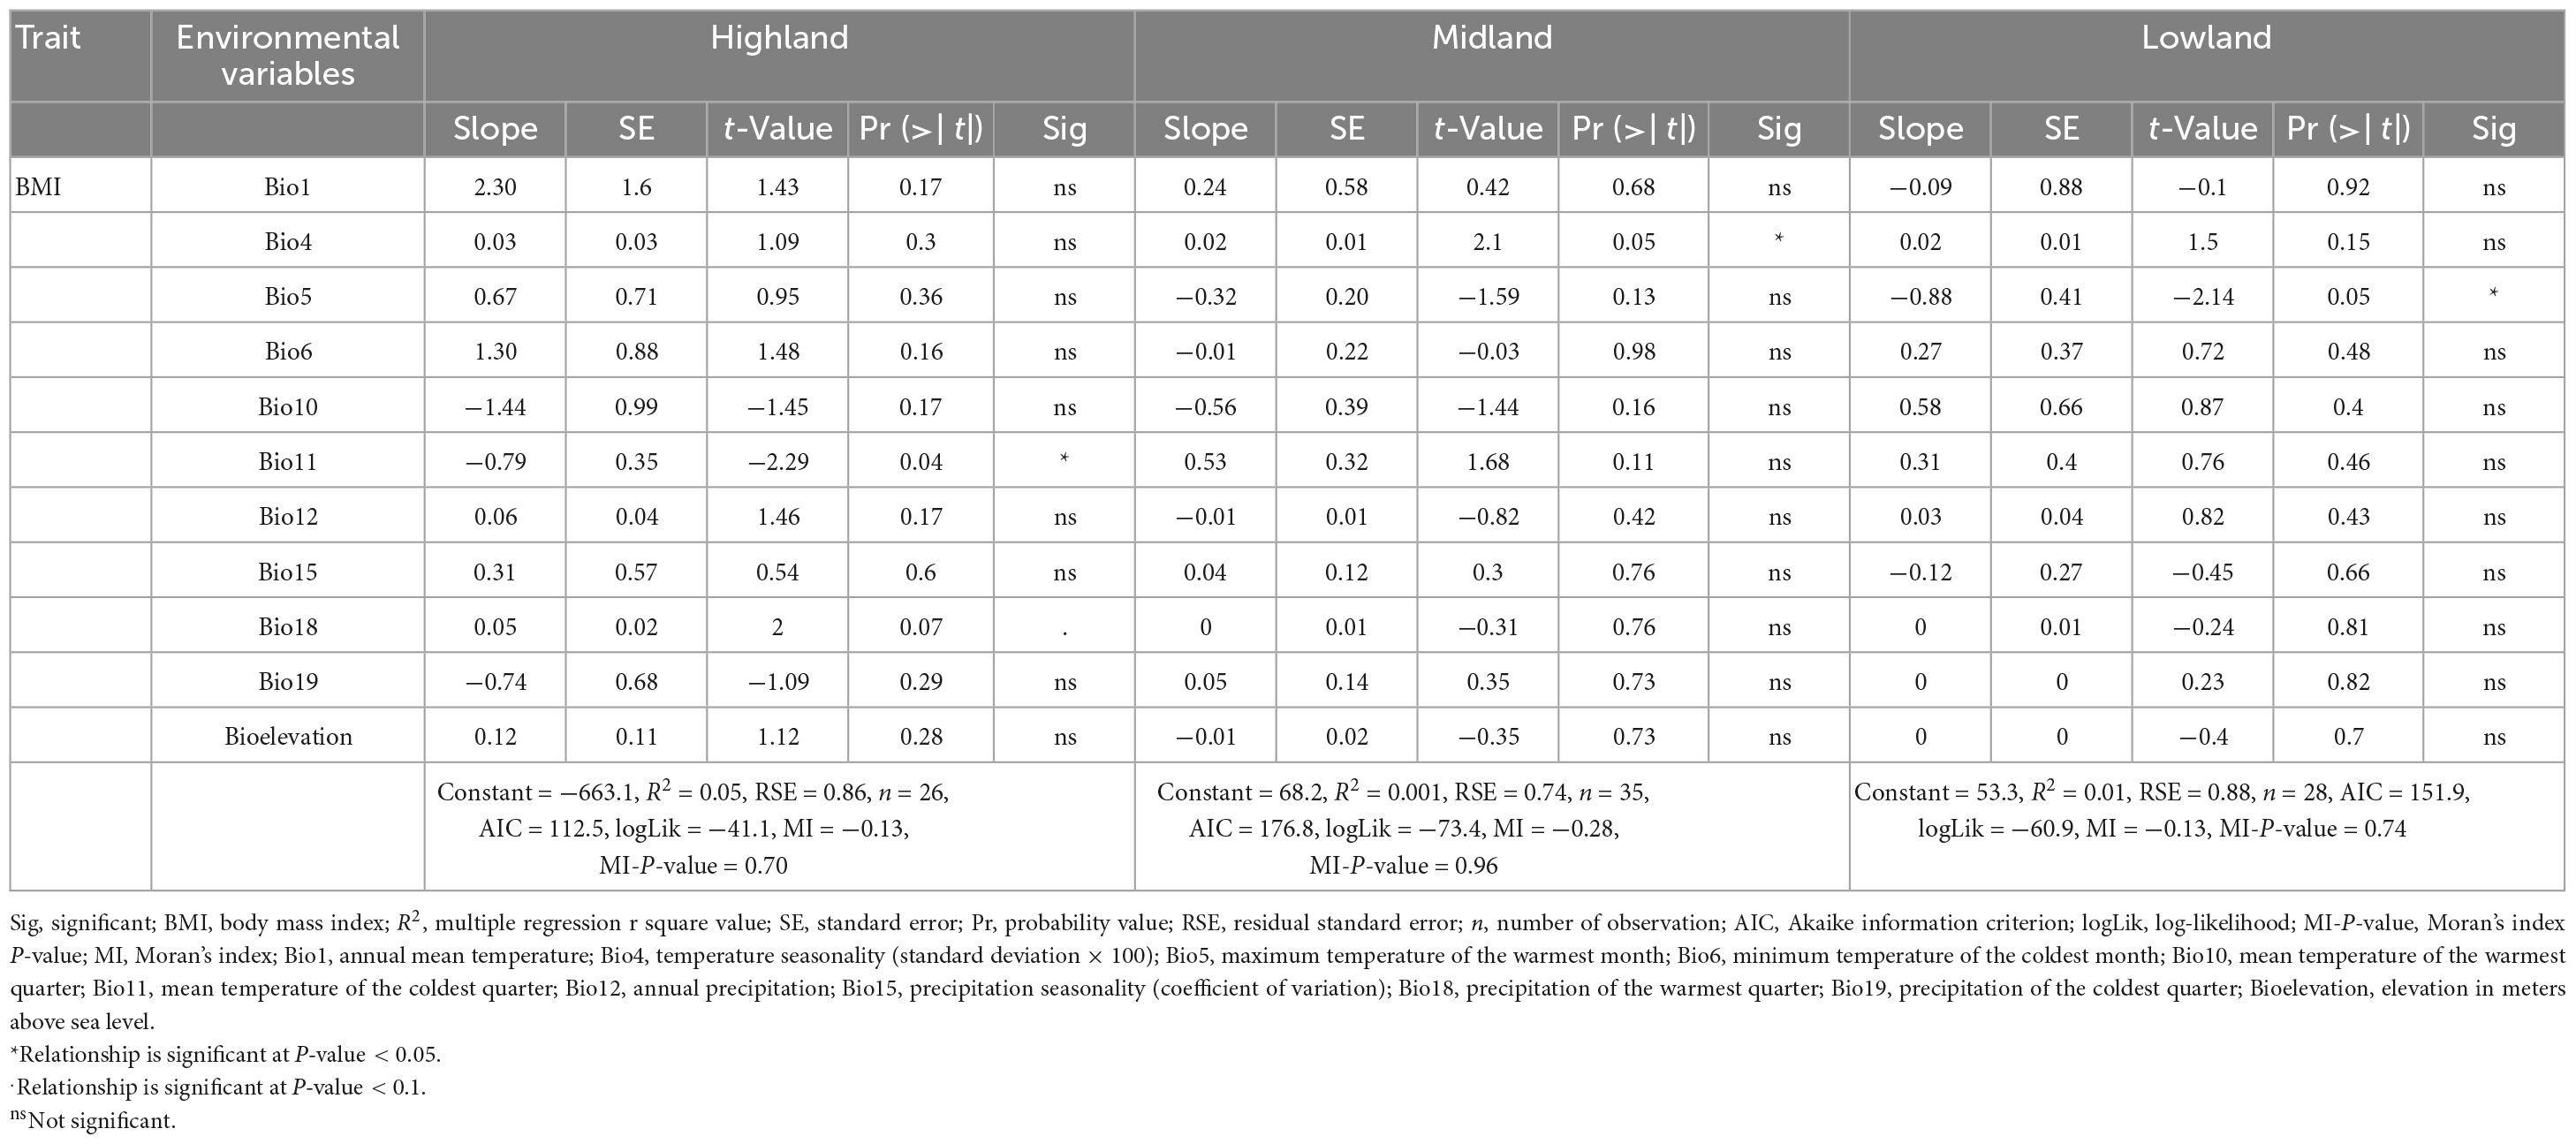
Table 2. Relationships (multiple linear regression) between male chicken phenotypes and environmental variables (Bergmann’s rule).
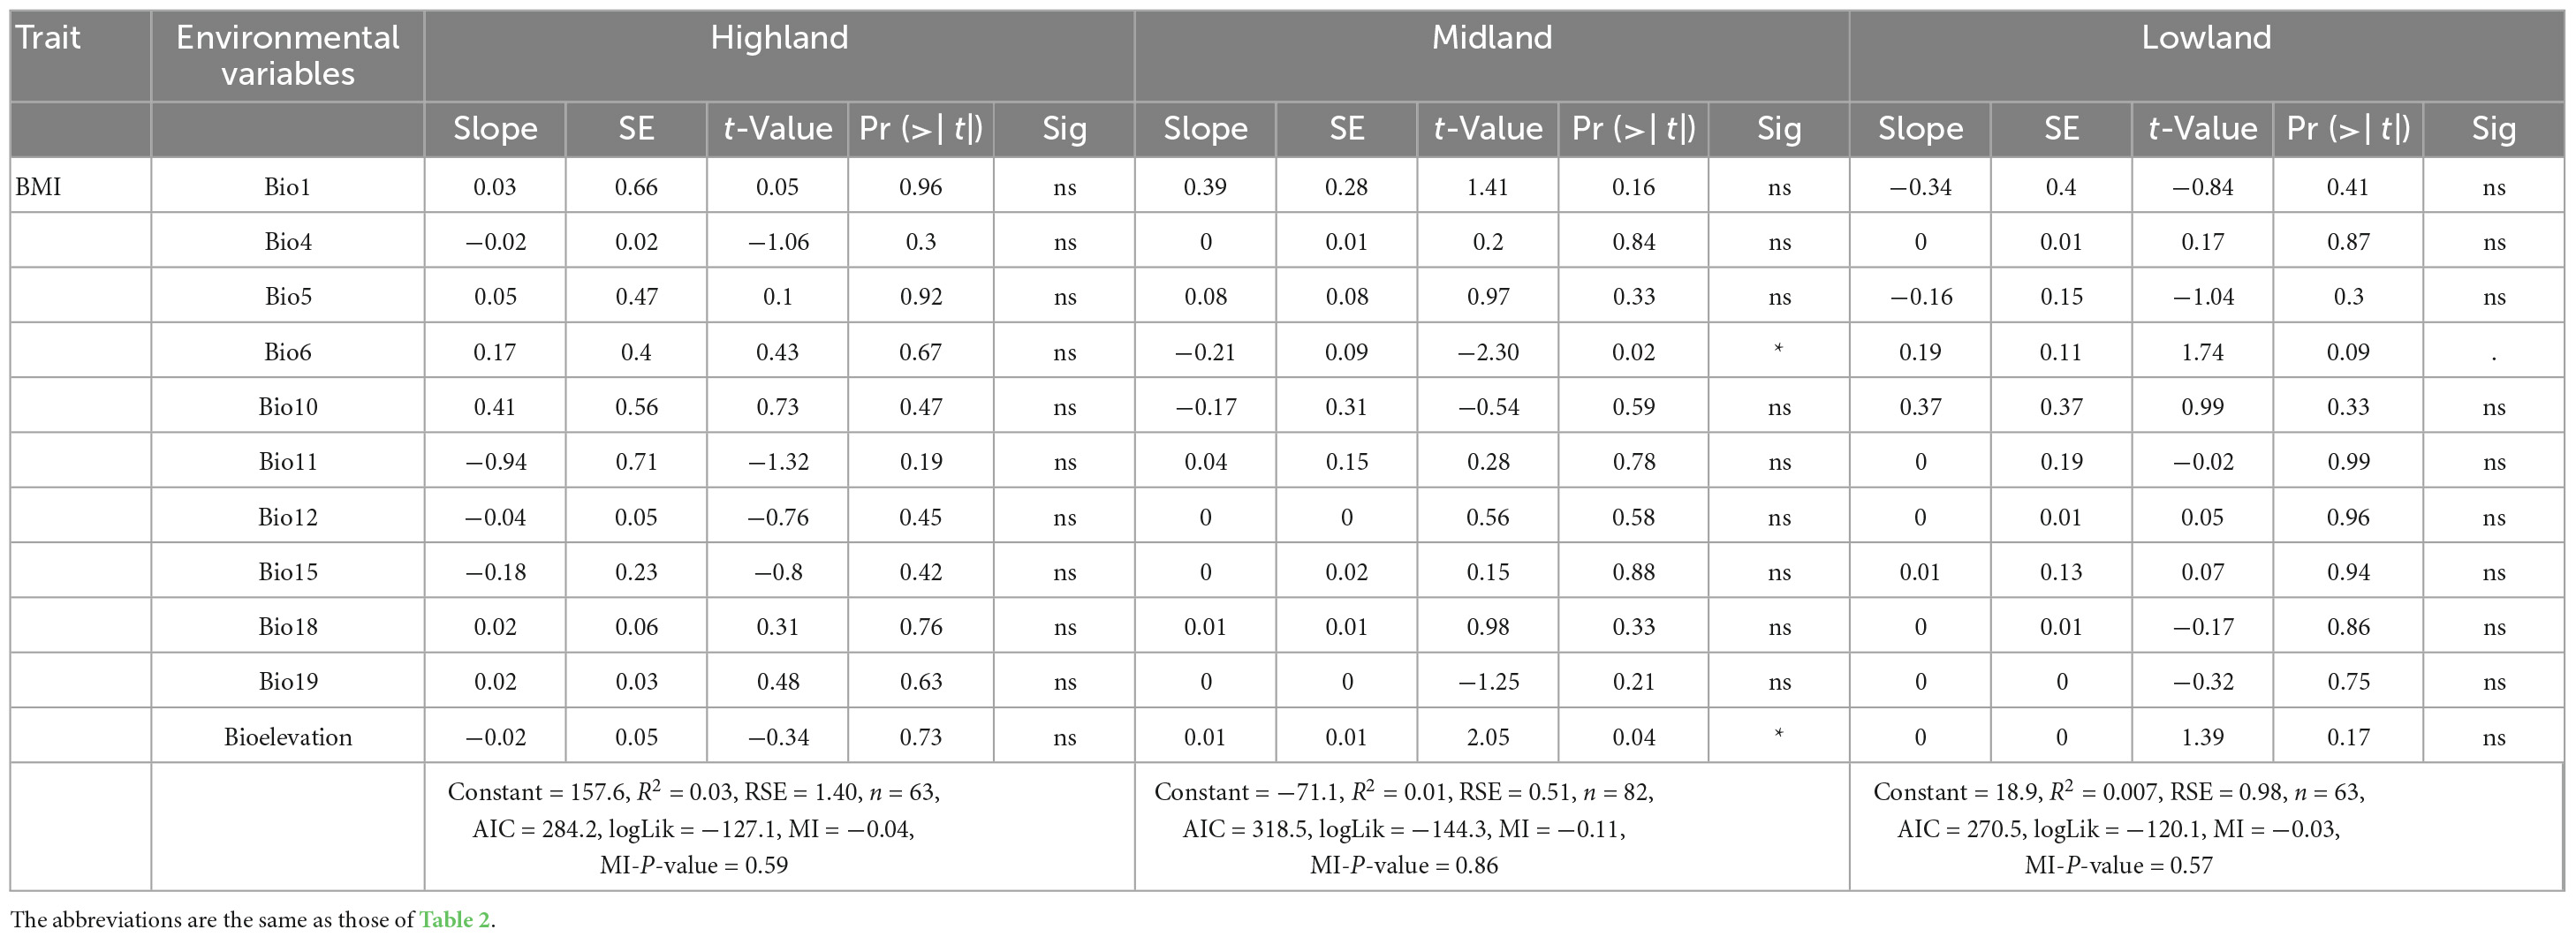
Table 3. Relationships (multiple linear regression) between female chicken phenotypes and environmental variables (Bergmann’s rule).
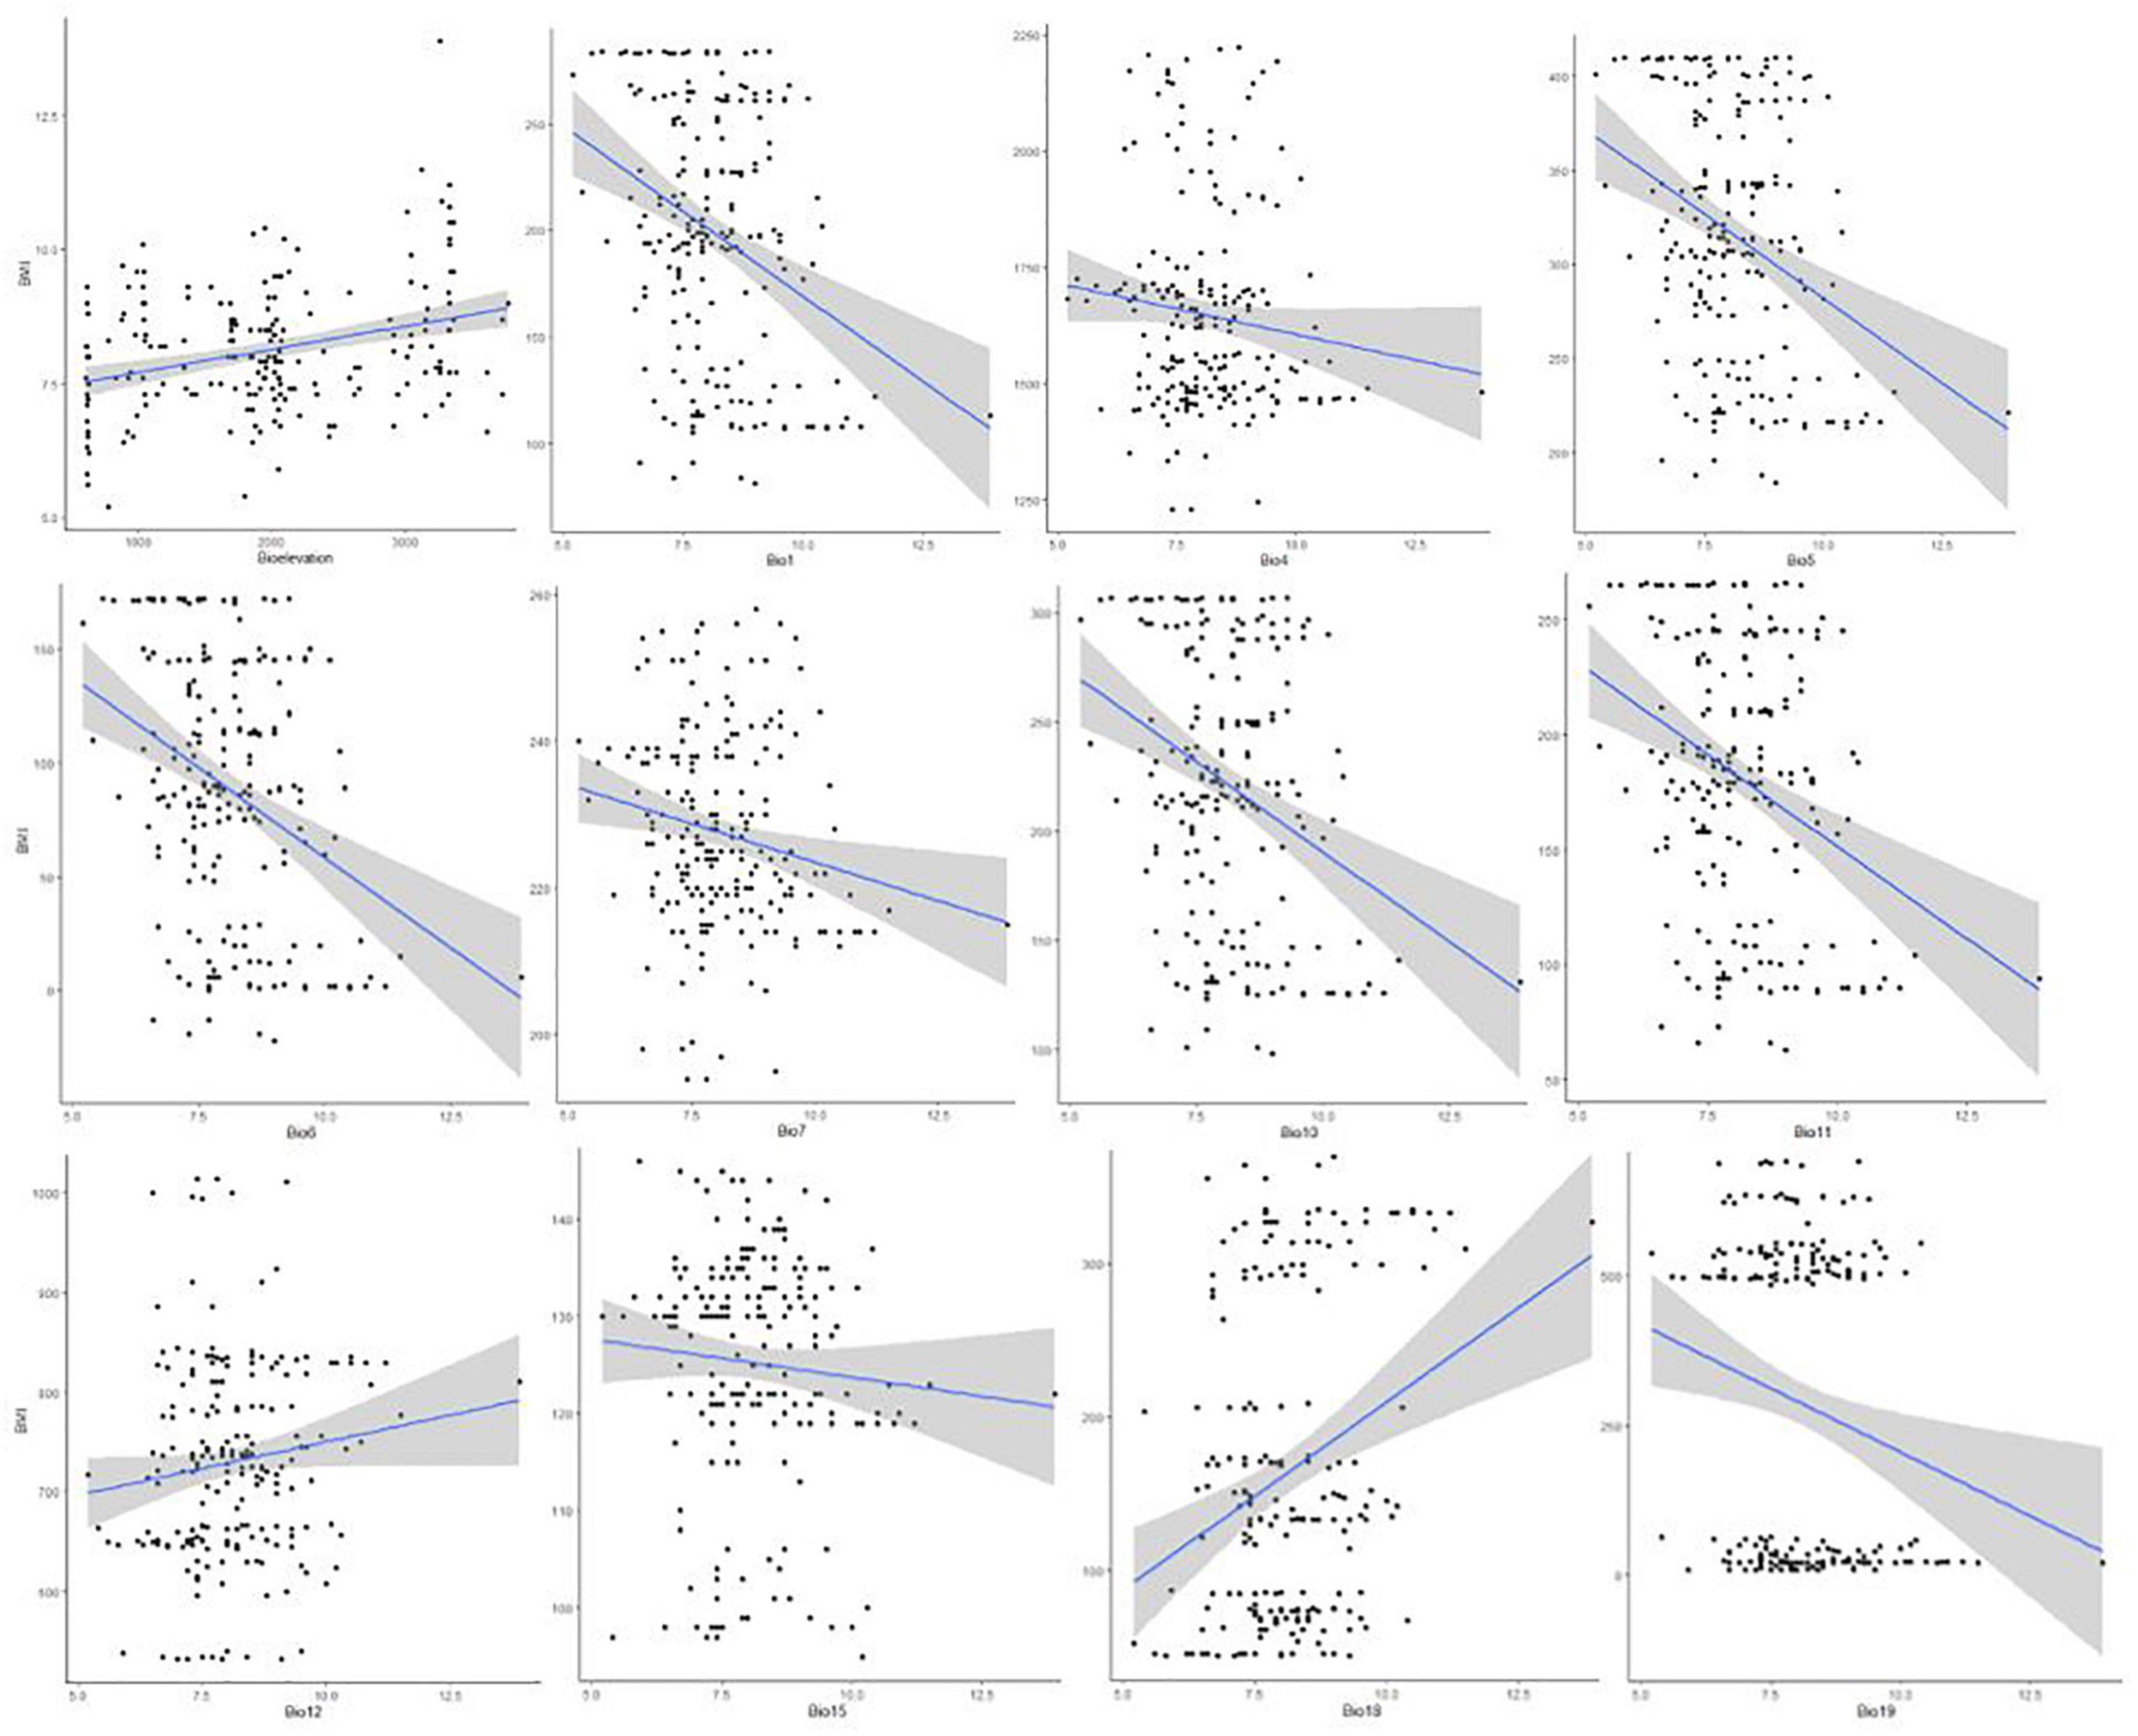
Figure 6. Correlation between environmental variables and chicken morphology (BMI) to validate Bergmann’s rule.
Allen’s rule
The chicken appendage measurements agreed with Allen’s rule expectations (both sexes) (Tables 4, 5). For example, the appendage size measurements decreased with altitude and increased with temperature (Supplementary Figures 5A–D). Furthermore, the patterns of variation explained between appendage sizes and climatic variables were similar for both sexes. Chicken sampled from the lowland agro-ecology had larger appendages than those from the highland agro-ecology (Supplementary Tables 8, 9). The highland agro-ecology cocks’ shank length, wingspan, surface area of comb, wattle, and beak were significantly associated with temperature variables (R2 = 0.01–0.04, P-value 0.08–0.001) but not with altitude (P-value > 0.1), except for the wattle surface area (R2 = 0.012, P-value 0.03) (Table 4). Similarly, the cocks’ shank length, wingspan and the surface area of the comb and earlobe at the lowland agro-ecology were also significantly associated with temperature variables (R2 = 0.001–0.01, P-value 0.1–0.06) but not with altitude. The earlobe surface area of the highland cocks and the wattle and the beak surface area of the lowland cocks were not influenced by the temperature and altitude variables (Table 4).
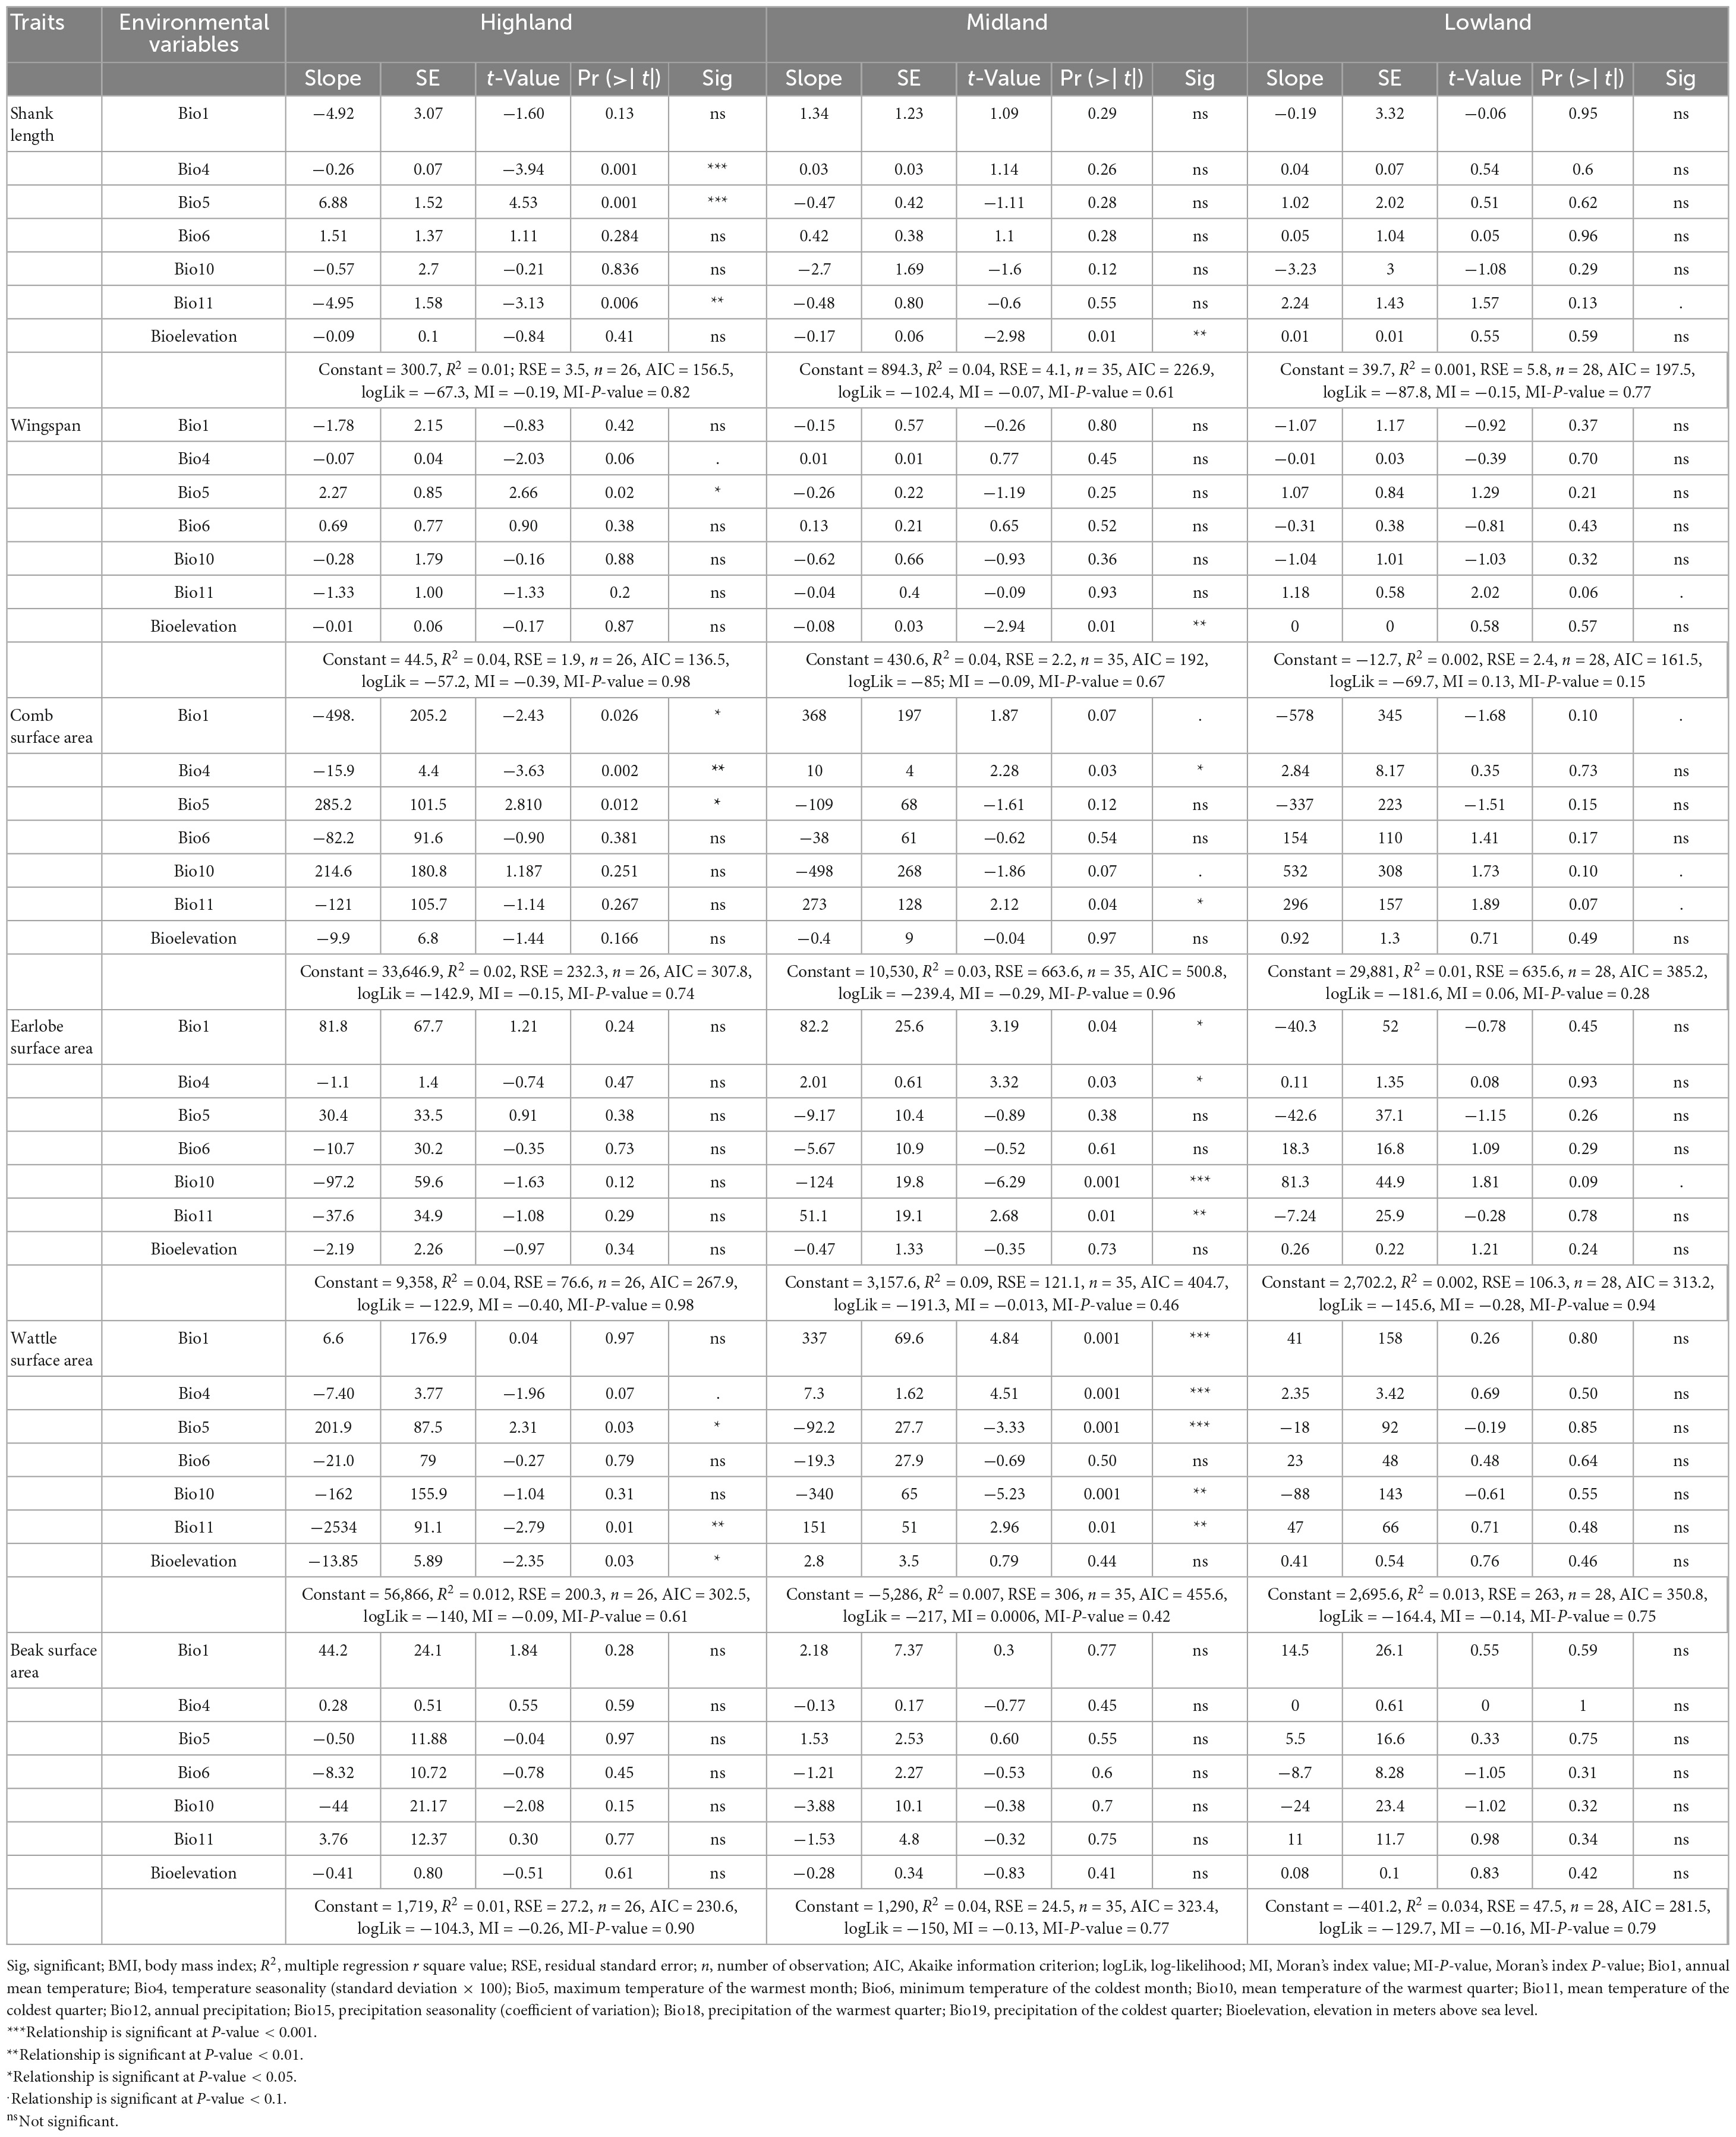
Table 4. Relationships (multiple linear regression) between male chicken appendages and environmental variables (Allen’s rule).
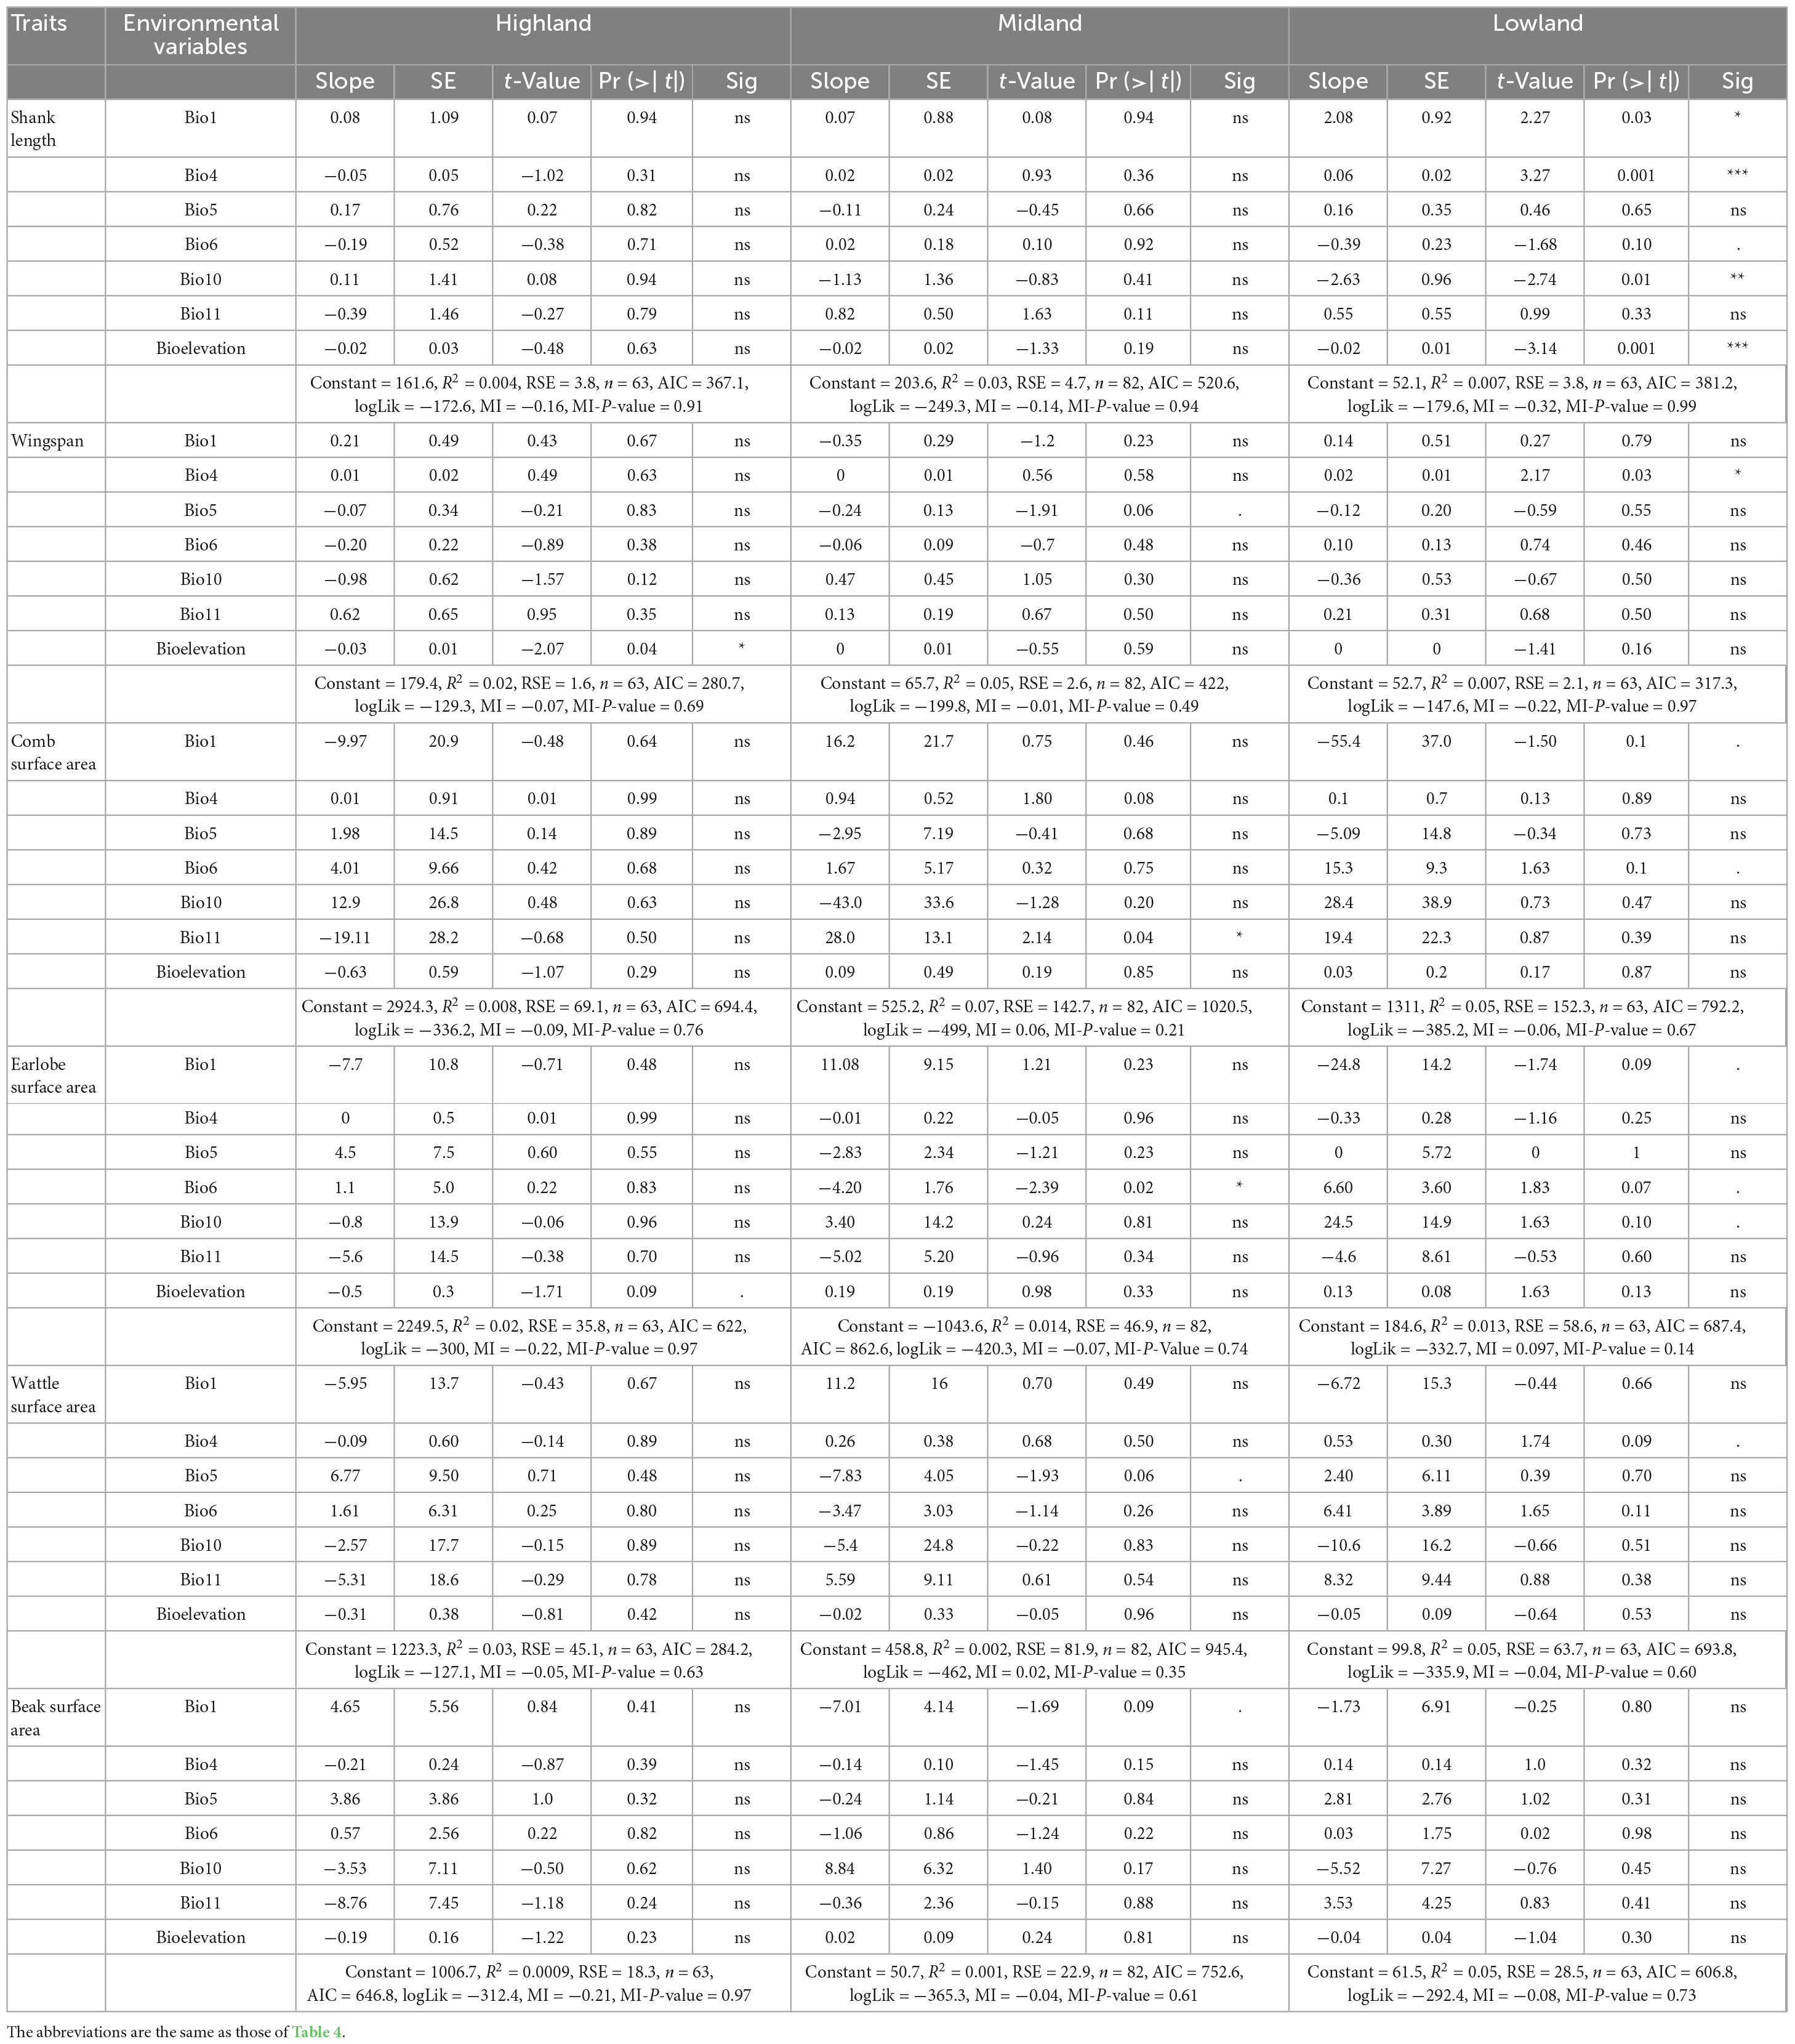
Table 5. Relationships (multiple linear regression) between female chicken appendages and environmental variables (Allen’s rule).
How the indigenous chicken measurements follow Bergmann’s and Allen’s rules are further presented in Figure 7. In the highland agro-ecology, the hen wingspan and earlobe surface area were significantly associated with altitude (R2 = 0.02, P-value 0.09–0.04) but not with the temperature variables. However, in the hens from the lowland agro-ecology, the shank length, wingspan and the surface areas of the comb, wattle and earlobe were associated with the temperature variables (R2 = 0.007–0.05, P-value 0.1–0.001). They were not associated with altitude, except for the shank length (R2 = 0.007, P-value 0.001). The temperature and altitude variables did not influence the beak surface area of the hens in either agro-ecology (Table 5).
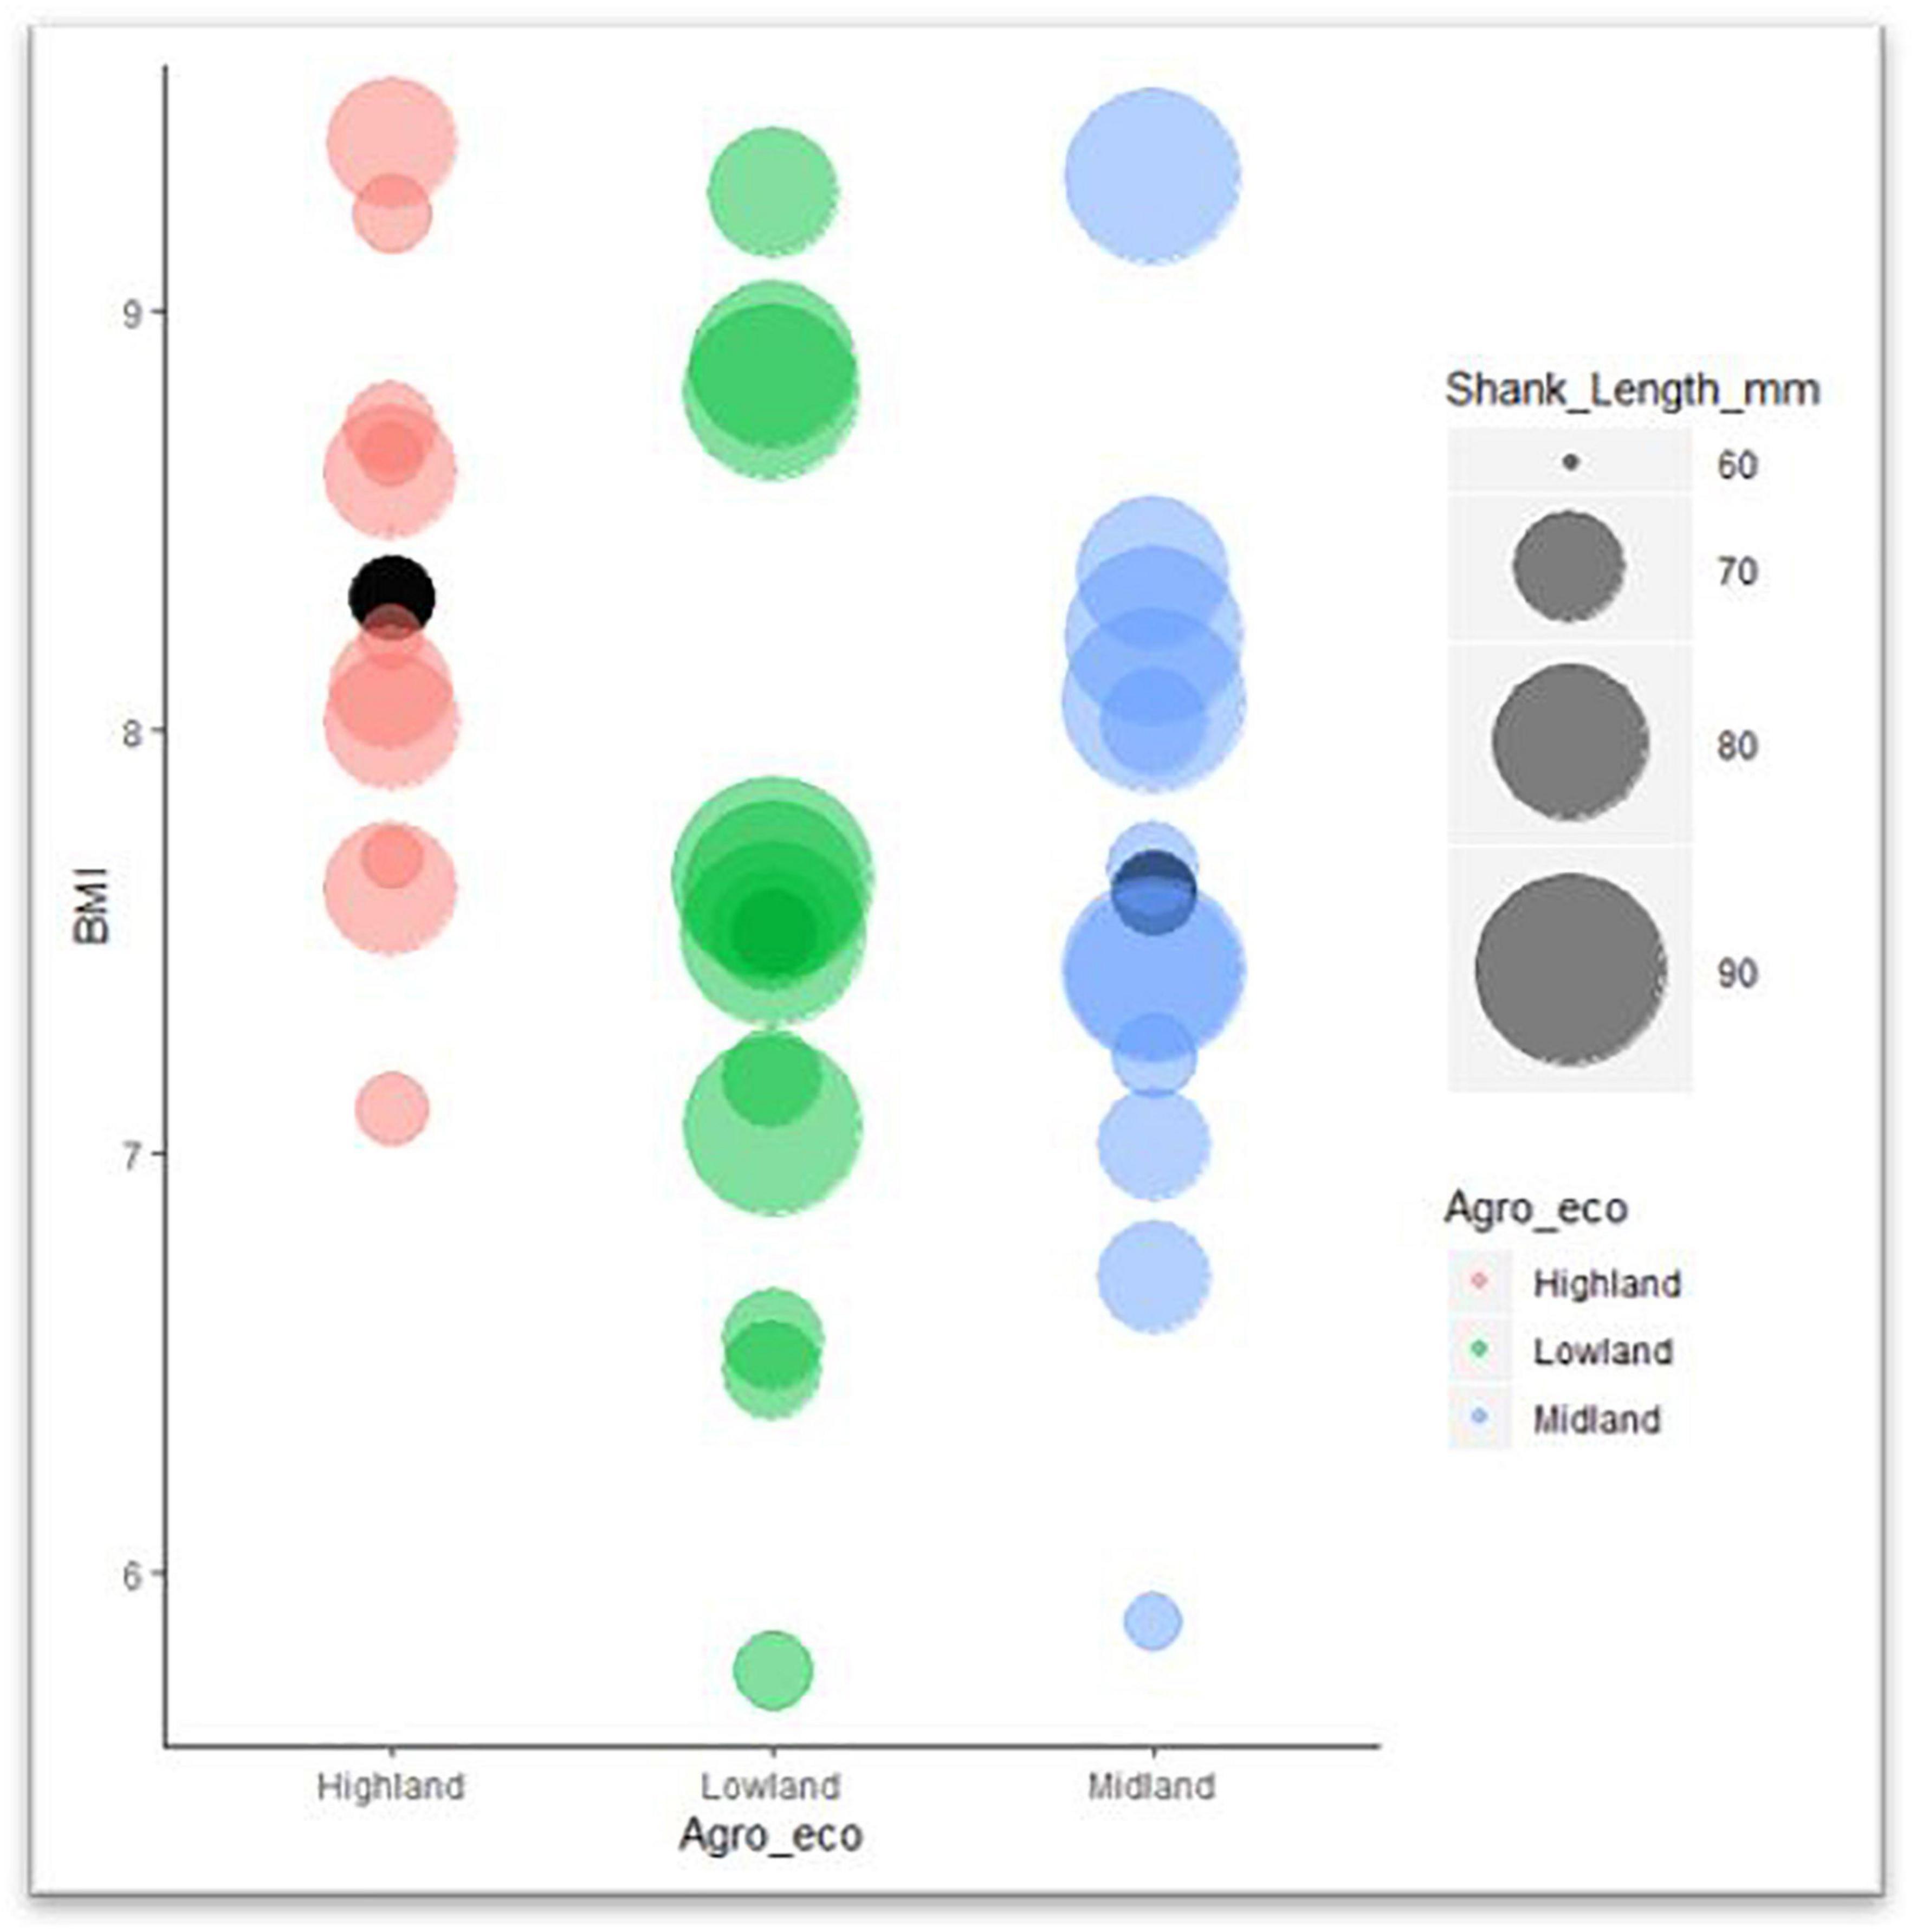
Figure 7. Bubble graph of BMI and shank length for indigenous chicken.
Rensch’s rule
We found sexual size dimorphism (SSD) to increase with body size in male chickens, in agreement with Rensch’s rule (Figures 8, 9). Body weight, body length and shank length had significant slope increments with values of 2.15, 1.38, and 1.59 and (R2) of 0.37, 0.36, and 0.43 (P-value < 0.0001), respectively. Similarly, the chicken osteology measurements also supported the validity of Rensch’s rule, with the femur, tibiotarsus, humerus, and tarsometatarsus showing significant (P-value < 0.0001) slope increments with values of 2.29, 1.81, 2.37, and 1.99, and (R2) of 0.68, 0.38, 0.47, and 0.40, respectively.
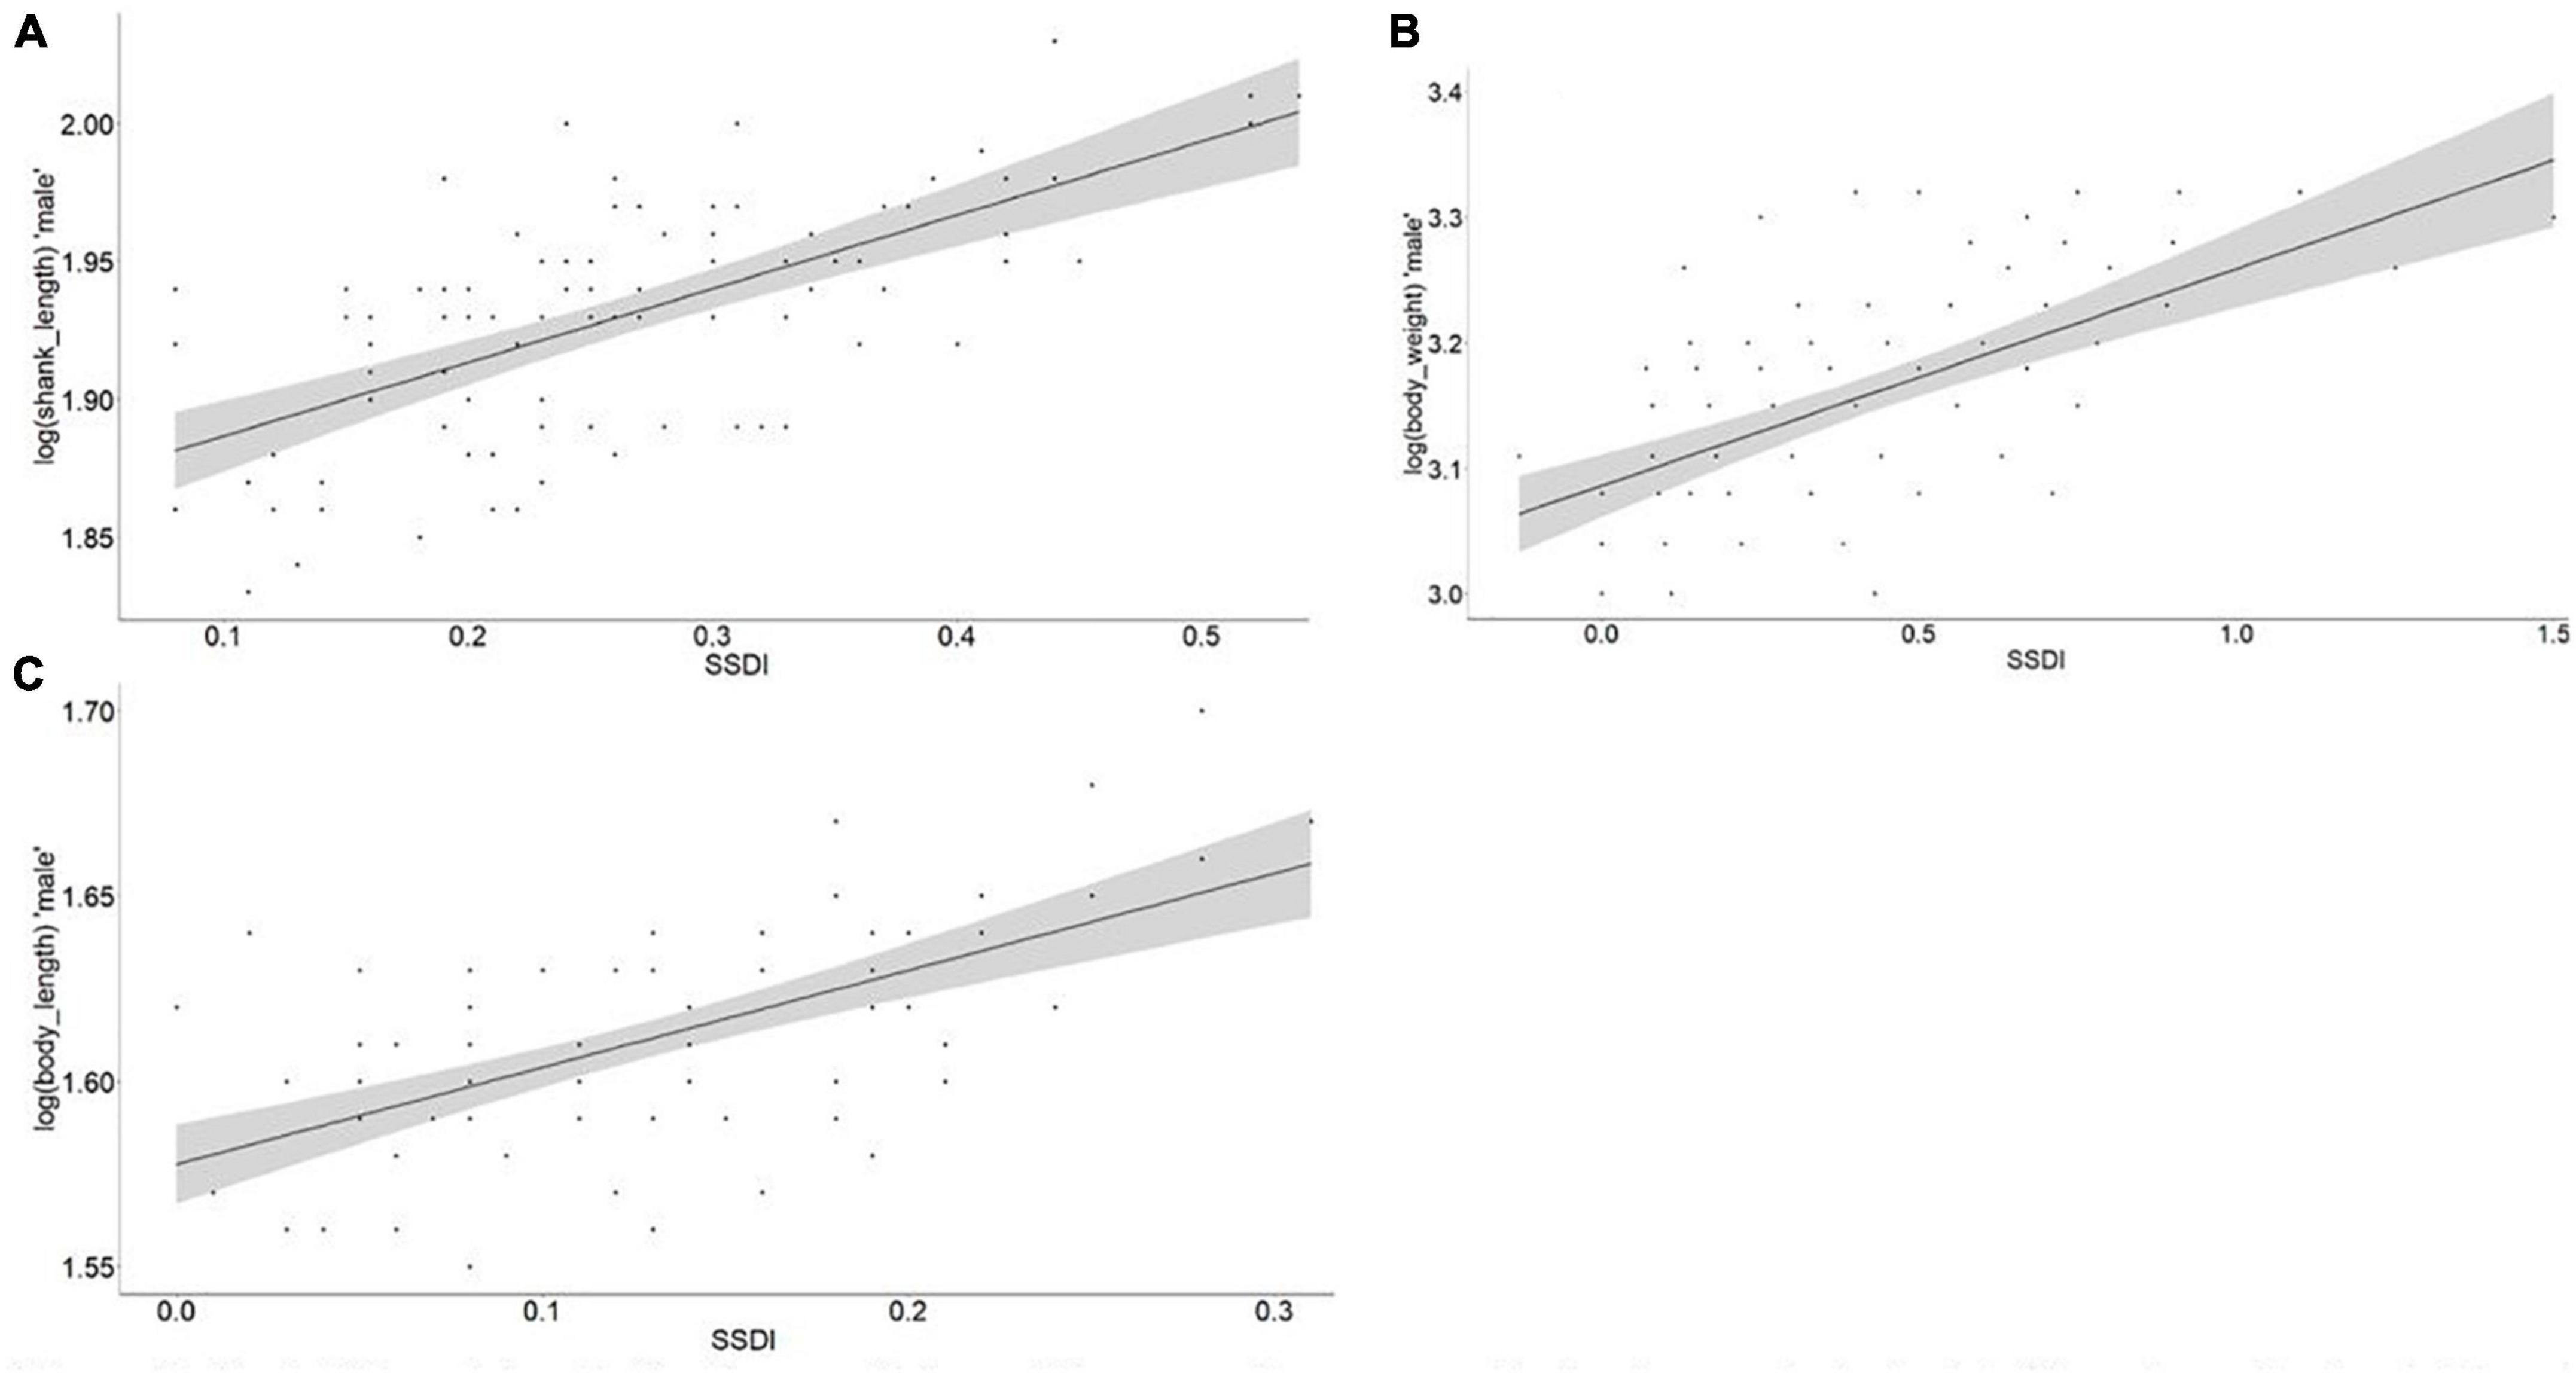
Figure 8. Test of Rensch’s rule for the morphology. The regression was run log (male morphological trait) as dependent variable and SSDI value (Lovich and Gibbons, 1992) was calculated with the following formula ([Male/Female] – 1) as independent variable; (A) shank length, R2 = 0.43, slope = 1.59, P-value = 0.0001; (B) body weight, R2 = 0.37, slope = 2.15, P-value = 0.0001; (C) body length, R2 = 0.36, slope = 1.38, P-value = 0.0001.
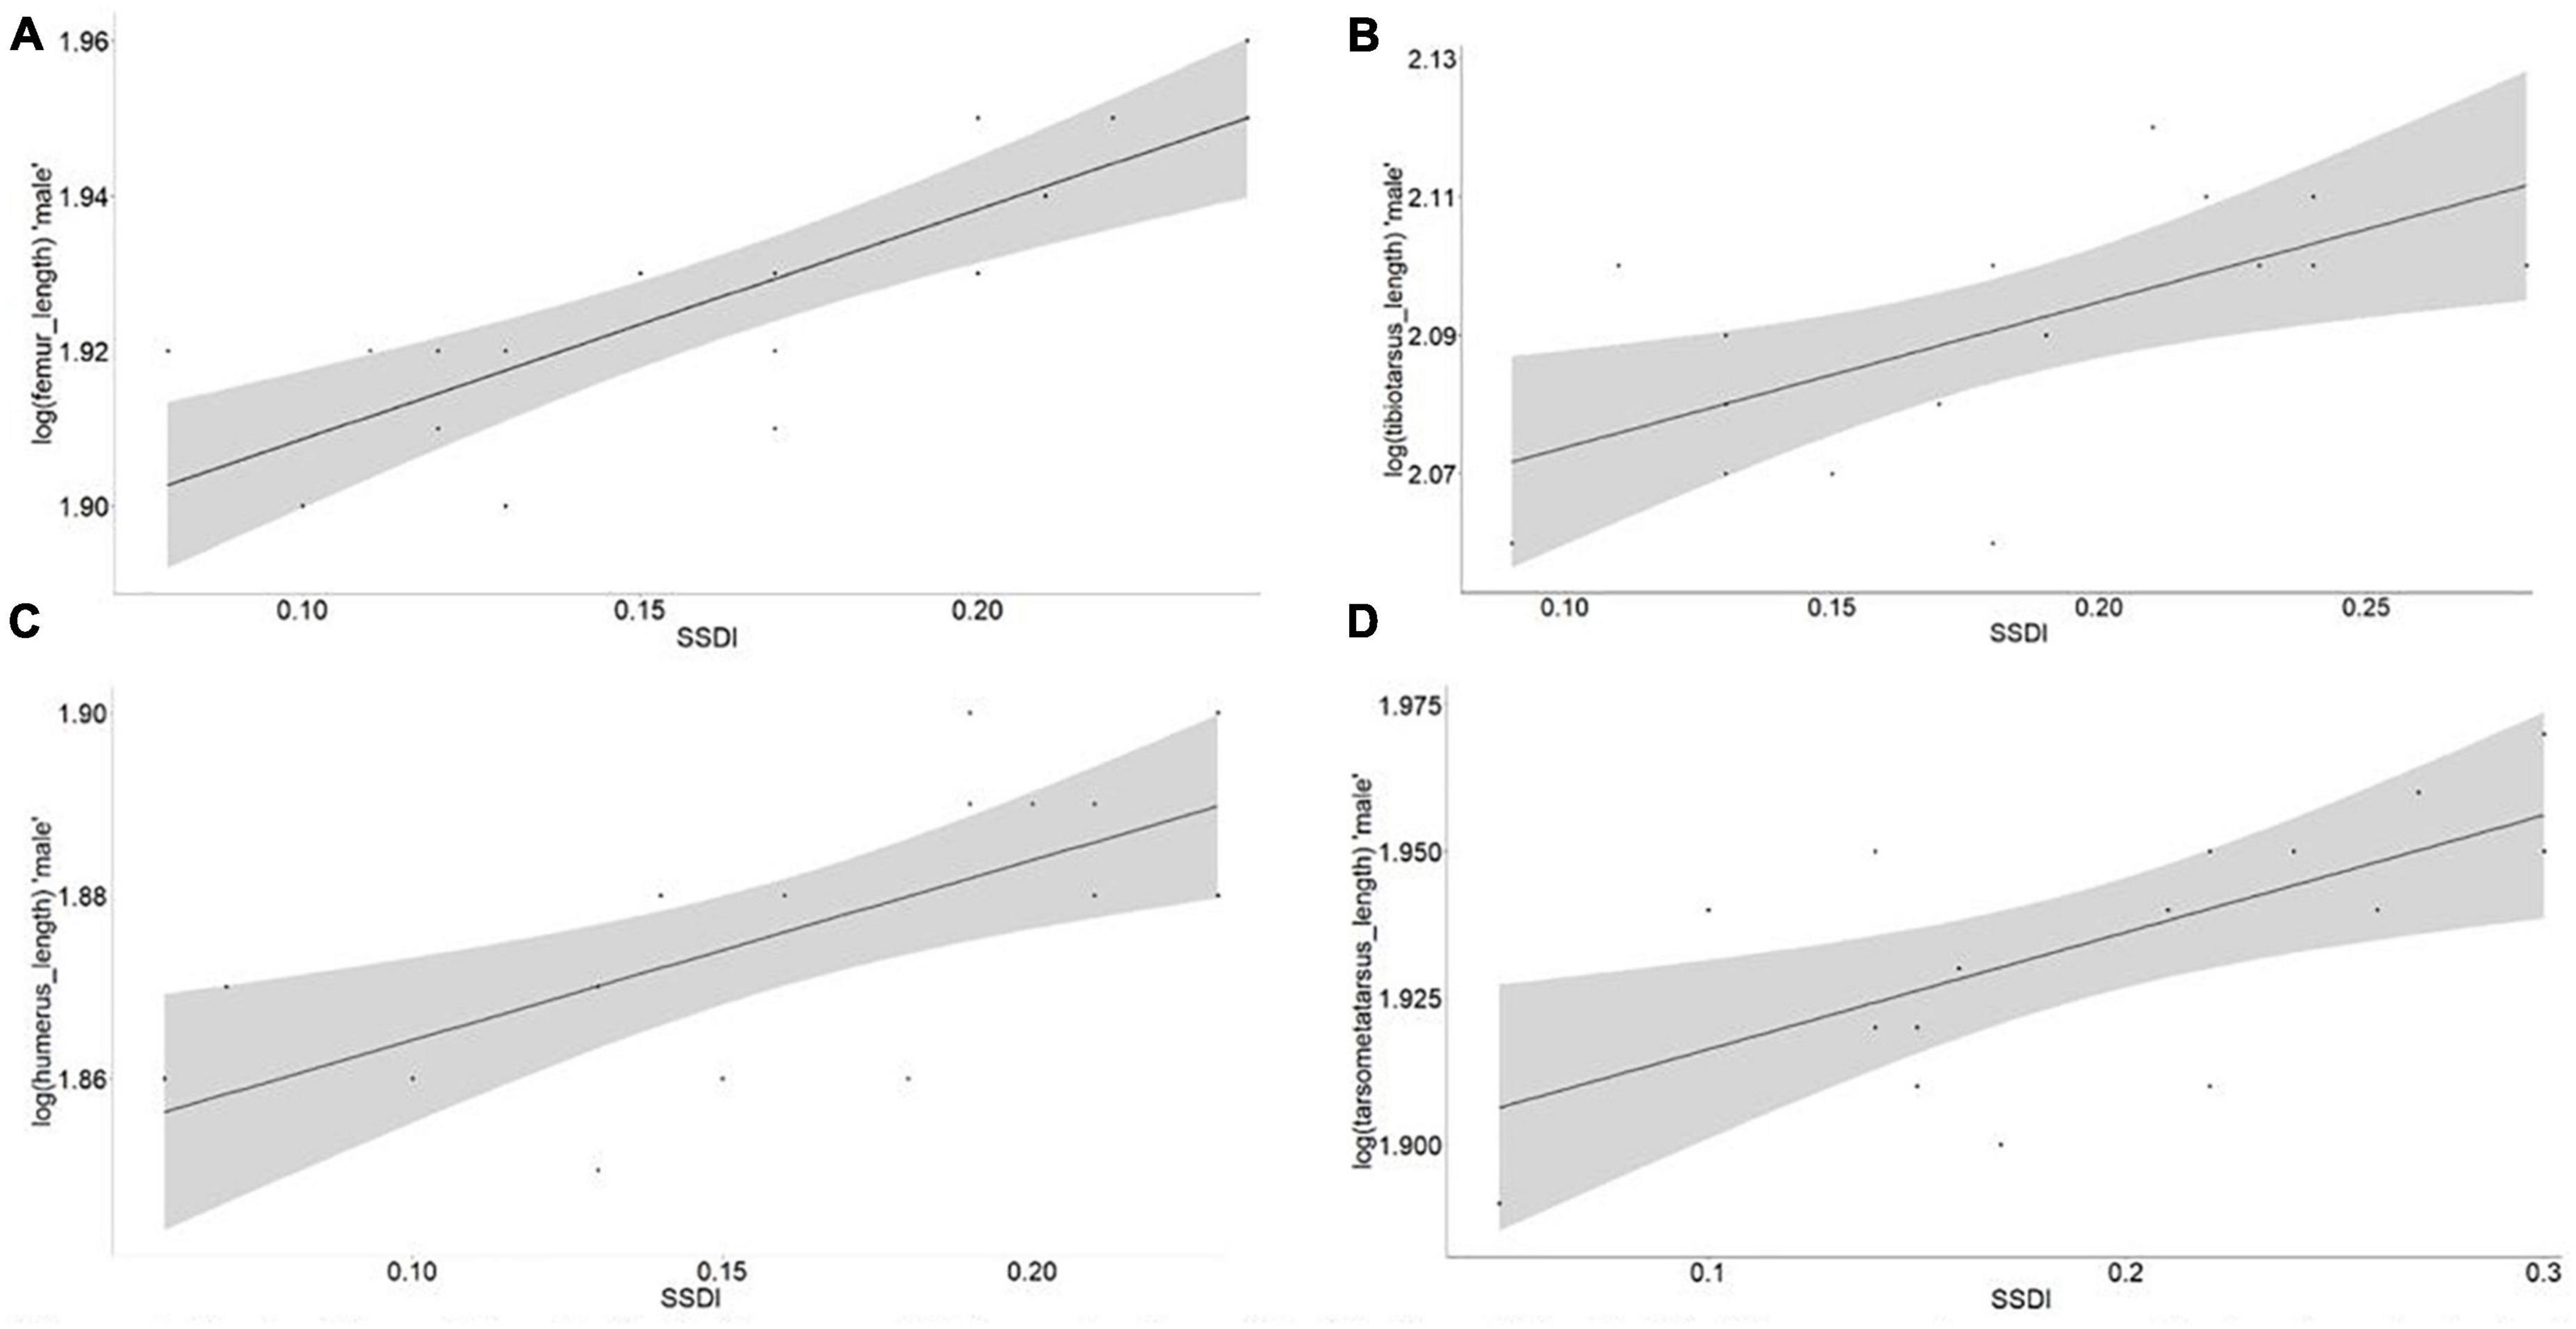
Figure 9. Test of Rensch’s male for indigenous chicken osteology (hindlimb and forelimb). The regression was run log (male osteological trait) as dependent variable and SSDI value (Lovich and Gibbons, 1992) was calculated with the following formula ([Male/Female] – 1) as independent variable. (A) Femur, R2 = 0.68, slope = 2.29, P-value = 0.0001; (B) tibiotarsus, R2 = 0.38, slope = 1.81, P-value = 0.0001; (C) humerus, R2 = 0.47, slope = 2.37, P-value = 0.0001; (D) tarsometatarsus length, R2 = 0.40, slope = 1.99, P-value = 0.0001.
Discussion
Morphological and osteological traits
In the Tigray Region of Ethiopia, we detected morphological and osteological differences in indigenous chickens inhabiting lowland, midland, and highland agro-ecologies. Sexual size dimorphism in both morphological and osteological traits were also present (Figure 3 and Supplementary Tables 7, 10), with larger male chickens in the three agro-ecologies (Supplementary Table 9), in overall agreement with previous studies (e.g., Cabarles et al., 2012; Getachew et al., 2016). Chickens inhabiting the lowland agro-ecology had larger surface area appendages than their highland counterparts (Supplementary Table 9). Similar findings have been reported in the Oriental magpie (Pica serica) (Fan et al., 2019) and in four parrot species (Van De Ven et al., 2016), which showed larger appendages in low-altitude populations compared to the high-altitude ones, likely an adaptation to heat stress. Indeed, larger vascularized surface areas will better dissipate heat in a hot environment; conversely, in cold regions, smaller surface areas appendages will help to minimize heat loss. Removing chicken appendages in temperate and cold regions is recommended as a management practice in the commercial breed (AL-Ramamneh et al., 2016).
Correlation between morphological and osteological traits
With larger bones required to hold bigger muscles and vice versa, a strong positive correlation between some morphological and osteological traits (Table 1) was expected. In particular, we detected a linear relationship between the body weight and humerus (R2 = 0.85) as well as the tarsometatarsus length (R2 = 0.81) (Supplementary Figure 6). Woldekiros et al. (2019) also reported a linear relationship between morphology and osteology in domestic chickens from Tigray. Concordantly, Thomas et al. (2016) highlighted that chicken morphology and bone size follow a similar pattern, with light chickens having smaller bone sizes. Our study and others, therefore, support the hypothesis that the measurement of osteological characters may inform chicken morphological traits, which is of particular interest to zooarchaeologists and other researchers interested in understanding the evolution of the morphology of indigenous chickens in relation to their value as a food commodity.
However, the presence of collinearities among the osteological variables (Supplementary Tables 12A, 13A) affects the estimated regression coefficients and tends to inflate the standard errors. Thus, we only selected humerus -Gl and tarsometatarsus -Gl (Supplementary Tables 12B, 13B) to predict the wingspan and shank length, respectively. These two selected bones are crucial in identifying and separating chicken bones from other Galliformes species in mixed avifauna remains. They are also recognized for their strength and may remain relatively intact over a long period without decomposition in the soil. The humerus is the largest and strongest forelimb bone (Tiwari et al., 2011; Mostafa et al., 2022) that conjugates the forelimb and the chicken body (Vistro et al., 2015). The tarsometatarsus is the site of spurs attachment, and its morphology helps to distinguish chickens from other avian species (MacDonald, 1992; Sasson and Arter, 2020), to differentiate sexes (Croft, 2005) and to determine age (Thomas et al., 2016). This bone has played a key role in the identification of chicken remains at Tel Lachish, Israel (Croft, 2005), and at Mezber (Tigray Region, Ethiopia) (Woldekiros et al., 2019). The accumulation of medullary bone in the hollow structures of the humerus and tarsometatarsus may also help to differentiate chicken sex and age (Neer et al., 2002).
Bergmann’s rule
The BMI variation in indigenous Tigrayan chickens was correlated with altitude and several climatic clines (Tables 2, 3), e.g., temperature (bio1, bio 4–7, and bio 10–11) and precipitation (bio12, bio15, and bio18–19) (Figure 6). This is in agreement with the expectation of Bergmann’s rule. Thus, our study provides strong support for this biological rule in indigenous chickens by incorporating relevant abiotic factors beyond altitude and annual temperature.
At high altitudes and hence colder geographic areas, we found that chickens have a smaller surface area-to-volume ratio (larger BMI), which helps to maintain their body temperature. On the contrary, at a lower altitude and warm environment, chickens tended to have a larger surface area-to-volume ratio (smaller BMI), facilitating heat dissipation (Figure 6). Therefore, the BMI patterns of the indigenous chickens in our study follow the ecogeographical rule proposed by Bergmann. Larger-sized animals benefit from a cold environment, as they can produce more heat to keep their body temperature warm (Delgado et al., 2019). Avian species tend to follow Bergmann’s rule, with larger species living at higher altitudes (Olson et al., 2009; McCollin et al., 2015; Salewski and Watt, 2017; Sun et al., 2017).
Allen’s rule
Our study clearly showed that indigenous chickens of both sexes had larger appendage sizes at lower altitudes (warmer areas) and smaller appendages at higher altitudes (colder areas) (Supplementary Table 9). Moreover, appendages (earlobe, wattle, and beak surface areas) in both sexes significantly correlated with altitude and climatic clines (Tables 4, 5), with the lowland chicken having larger appendages than their highland counterparts (Supplementary Figures 5A–D). Our results, therefore, support Allen’s rule. Comparable findings were reported in populations of several wild bird species: bill length in Oriental magpie (Fan et al., 2019), honeyeaters (Meliphagidae) (Friedman et al., 2017), parrots (Psittaciformes) (Campbell-Tennant et al., 2015) and elepaio (Chasiempis spp.) (VanderWerf, 2012); feet and wings in waterbirds (Scholander, 1955); wingspan in elepaio (VanderWerf, 2012), tree sparrow (Passer montanus) (Sun et al., 2017) and Oriental tit (Parus minor) (Fan et al., 2019); wing length in owls (Strigiformes) (Romano et al., 2021). In these taxa, appendage size tends to decrease as elevation increases to help maintain homeostasis. Smaller appendages were observed in the highland chicken, which will reduce heat loss, while the larger appendages in the lowland chickens will facilitate heat loss. Notably, larger appendages are key for endotherms to dissipate heat in hot environments (Symonds and Tattersall, 2010; Van De Ven et al., 2016). The absence of an association between the beak surface area with environment and altitude clines is not surprising, as the beak morphology is linked to feeding habits rather than climatic challenges (VanderWerf, 2012; Campbell-Tennant et al., 2015; Friedman et al., 2017; Fan et al., 2019).
Rensch’s rule in relation to morphological and osteological traits
To the best of our knowledge, this study is the first to assess the validity of Rensch’s rule in indigenous domestic chickens. Our results showed that both chicken morphology and osteology supported the presence of SSD, with larger male than female chickens (Figure 3 and Supplementary Tables 7, 10). SSD increments were associated with the environment (Figures 8, 9). We selected body weight, body length and shank length traits with weight-based measurements that were expected to show variation within the species (Dale et al., 2007; Piross et al., 2019). The variation of these morphological traits was in line with this biological rule (Figure 8). Importantly, besides natural selection, human and sexual selection for larger male chickens may also have played a role. However, we have no evidence for the studied population that these selection pressures may have acted differently across populations and altitudinal zones.
We selected traits associated not only with body weight but also with bone measurements (femur, tibiotarsus, humerus, and tarsometatarsus) to assess the validity of Rensch’s rule. These traits showed a high association with the live weight (Table 1). Likewise, the selected osteological trait measurements were in agreement with Rensch’s rule expectations. Traits such as the femur, tibiotarsus, humerus, and tarsometatarsus showed a significant slope increment with environmental clines (Figure 9). Furthermore, the SSDI for the osteological traits linearly increased (slope >1) with the average osteological size (Figure 9). These observations are in agreement with the findings reported in wild species (e.g., Dale et al., 2007; Remeš and Szekely, 2010; Blanckenhorn et al., 2011; Piross et al., 2019).
Conclusion
For the indigenous chickens of the Tigray Region of Ethiopia, we have shown that the variation of morphological and osteological traits across the agro-ecologies follows the expectation of the three main biological rules (Bergmann, Allen, and Rensch). Whether or not it is the case for chicken populations in other regions of Ethiopia, other countries or continents remains to be studied. An important next step will also be to assess to what extent the morphological and osteological trait differences are genetically determined or are a consequence of the phenotypic plasticity of the species. This study may also pave the way for similar studies in other livestock species. The model developed to predict chicken morphology from osteological measurements will also help to predict chicken morphology from zooarchaeological remains.
Data availability statement
The raw data supporting the conclusions of this article will be made available by the authors, without undue reservation.
Ethics statement
This animal study was reviewed and approved by the Institutional Animal Care and Use Committee of the International Livestock Research Institute (IREC2017-26).
Author contributions
GG and OH conceived the research, and analyzed and interpreted the data. GG, MZ, and MB collected the data. GG, GB, TD, MZ, MB, and OH wrote the manuscript. All authors approved the manuscript.
Funding
The authors would like to acknowledged the following institutions and personnel for funding and facilitating the research: the International Livestock Research Institute (ILRI) LiveGene Program, supported by the CGIAR Research Program on Livestock (CRP livestock project) and sponsored by the CGIAR funding contributors to the Trust Fund (http://www.cgiar.org/about-us/our-funders/), the Bill and Melinda Gates Foundation and UK aid from the UK Foreign, Commonwealth and Development Office (Grant Agreement OPP1127286) under the auspices of the Centre for Tropical Livestock Genetics and Health (CTLGH), established jointly by the University of Edinburgh, SRUC (Scotland’s Rural College). This study was conducted as part of GB’s Ph.D. research that was funded by the Tigray Agricultural Research Institute and Addis Ababa University (College of Natural and Computational Science, Department of Microbial Cellular and Molecular Biology).
Acknowledgments
An early draft of the manuscript was reviewed by Drs. Yayneshet Tesfay and Gebregziabher Gebreyohanes. We thank both reviewers for their constructive comments on enhancing the manuscript. We also appreciate Jacqueline Smith’s contribution to reviewing the revised version of the manuscript English write-up.
Conflict of interest
The authors declare that the research was conducted in the absence of any commercial or financial relationships that could be construed as a potential conflict of interest.
Publisher’s note
All claims expressed in this article are solely those of the authors and do not necessarily represent those of their affiliated organizations, or those of the publisher, the editors and the reviewers. Any product that may be evaluated in this article, or claim that may be made by its manufacturer, is not guaranteed or endorsed by the publisher.
Author disclaimer
The findings and conclusions contained within were those of the authors and do not necessarily reflect the positions or policies of BMGF nor the UK Government.
Supplementary material
The Supplementary Material for this article can be found online at: https://www.frontiersin.org/articles/10.3389/fevo.2023.1032082/full#supplementary-material
Footnotes
References
Allen, J. A. (1877). The influence of physical conditions in the genesis of species. Radic. Rev. 1, 108–140. doi: 10.1038/scientificamerican05251907-26247supp
AL-Ramamneh, D. S., Makagon, M. M., and Hester, P. Y. (2016). The ability of White Leghorn hens with trimmed comb and wattles to thermoregulate. Poul. Sci. 95, 1726–1735. doi: 10.3382/ps/pew110
Anderson, B. M. J. (2014). Permutational multivariate analysis of variance (PERMANOVA). Wiley statsref: statistics reference online. 1–15. Available online at: https://doi.org/10.1002/9781118445112.stat07841
Arbizu, M. P. (2020). pairwiseAdonis: Pairwise multilevel comparison using adonis. R package version 0.4, 1.
Ben-Shachar, M., Lüdecke, D., and Makowski, D. (2020). Effectsize: Estimation of effect size indices and standardized parameters. J. Open Sour. Softw. 5:2815. doi: 10.21105/joss.02815
Bergmann, C. (1848). Über die verhältnisse der wärmeökonomie der thiere zu ihrer grösse (1847). Available online at: https://books.google.com.et/books?id=EHo-AAAAcAAJ&printsec=frontcover&source=gbs_ge_summary_r&cad=0#v=onepage&q&f=false
Beyene, A., Gibbon, D., and Haile, M. (2001). Understanding diversity in farming practices in Tigray, Ethiopia. IIED. Managing Africa’s Soils: No. 24. Nottingham: Russell Press.
Bivand, R., Altman, M., Anselin, L., and Assunção, R. (2015). Spatial dependence: Weighting schemes, statistics. White Pap. Retriev. 8:p2016. doi: 10.1111/gean.12319
Blanckenhorn, W. U., Stillwell, R. C., Young, K. A., Fox, C. W., and Ashton, K. G. (2011). When Rensch meets Bergmann: Does sexual size dimorphism change systematically with latitude? Evolution 60, 2004–2011.
Cabarles, J. C., Lambio, A. L., Vega, S. A., Capitan, S. S., and Mendioro, M. S. (2012). Distinct morphological features of traditional chickens (Gallus gallus domesticus L.) in Western Visayas, Philippines. Anim. Genet. Resour. 51, 73–87. doi: 10.1017/S2078633612000410
Campbell-Tennant, D. J. E., Gardner, J. L., Kearney, M. R., and Symonds, M. R. E. (2015). Climate-related spatial and temporal variation in bill morphology over the past century in Australian parrots. J. Biogeogr. 42, 1163–1175. doi: 10.1111/jbi.12499
Crase, B., Liedloff, A. C., and Wintle, B. A. (2012). A new method for dealing with residual spatial autocorrelation in species distribution models. Ecography 35, 879–888. doi: 10.1111/j.1600-0587.2011.07138.x
Croft, P. (2005). “Archaeozoological studies; Section a: The osteological remains (mammalian and avian),” in The Renewed Archaeological Excavations at Lachish (1973-1994) Volumes, Vol. I, ed. D Ussishkin (Tel Aviv: Emery and Claire Yass publications in archaeology).
Dale, J., Dunn, P. O., Figuerola, J., Lislevand, T., Székely, T., and Whittingham, L. A. (2007). Sexual selection explains Rensch’s rule of allometry for sexual size dimorphism. Proc. R. Soc. B Biol. Sci. 274, 2971–2979. doi: 10.1098/rspb.2007.1043
Davis, S. J. M., and Payne, S. (1992). 101 ways to deal with a dead hedgehog: Notes on the preparation of disarticulated skeletons for zoo-archaeological use. Circaea 8, 95–104.
de Moura Bubadué, J., Cáceres, N., dos Santos Carvalho, R., Sponchiado, J., Passaro, F., Saggese, F., et al. (2016). Character displacement under influence of Bergmann’s rule in Cerdocyon thous (Mammalia: Canidae). Hystrix 27, 83–90. doi: 10.4404/hystrix-27.2-11433
de Moura Bubadué, J., Polidoro, G., Melo, G., Sponchiado, J., Serio, C., Melchionna, M., et al. (2018). Rensch’s and Bergmann’s rules in Cis-Andean South-American Howler Monkeys (Mammalia: Alouatta). Hystrix 29, 122–127. doi: 10.4404/hystrix-00052-2018
Delgado, M. D. M., Bettega, C., Martens, J., and Päckert, M. (2019). Ecotypic changes of alpine birds to climate change. Sci. Rep. 9, 1–7. doi: 10.1038/s41598-019-52483-0
Diniz-filho, J. A. F., Bini, L. M., and Hawkins, B. A. (2003). Spatial autocorrelation and red herrings in geographical. Glob. Ecol. Biogeogr. 12, 53–64.
Dormann, C. F., Mcpherson, J. M., Arau, M. B., Bivand, R., Bolliger, J., Carl, G., et al. (2007). Methods to account for spatial autocorrelation in the analysis of species distributional data?: A review. Ecology 30, 609–628. doi: 10.1111/j.2007.0906-7590.05171.x
Fan, L., Cai, T., Xiong, Y., Song, G., and Lei, F. (2019). Bergmann’s rule and Allen’s rule in two passerine birds in China. Avian Res. 10, 1–11. doi: 10.1186/s40657-019-0172-7
Fick, S. E., and Hijmans, R. J. (2017). WorldClim 2: New 1-km spatial resolution climate surfaces for global land areas. Int. J. Climatol. 4315, 4302–4315. doi: 10.1002/joc.5086
Fox, J., Friendly, M., and Monette, G. (2009). Visualizing hypothesis tests in multivariate linear models: The heplots package for R. Comput. Stat. 24, 233–246. doi: 10.1007/s00180-008-0120-1
Friedman, N. R., Lenka, H., Economo, E. P., and Vladimír, R. (2017). Smaller beaks for colder winters: Thermoregulation drives beak size evolution in Australasian songbirds. Evolution 71, 2120–2129. doi: 10.1111/evo.13274
Getachew, F., Abegaz, S., Assefa, A., Misganaw, M., Emshaw, Y., Hailu, A., et al. (2016). Multivariate analyses of morphological traits in indigenous chicken populations of Metekel zone, Northwestern Ethiopia. Anim. Genet. Resour. 59, 15–25. doi: 10.1017/s2078633616000084
Hijmans, R. J., Cameron, S. E., Parra, J. L., Jones, G., and Jarvis, A. (2005). Very high resolution interpolated climate surfaces for global land areas. Int. J. Climatol. J. R. Meteorol. Soc. 25, 1965–1978. doi: 10.1002/joc.1276
Kassambara, A. (2021). Pipe-friendly framework for basic statistical tests [R Package “rstatix” version 0.7. 0]. Vienna: R Foundation for Statistical Computing.
Lars, S., and Wold, S. (1990). Multivariate analysis of variance (MANOVA). Chemometr. Intell. Lab. Syst. 9, 127–141. doi: 10.1201/9780203027066-10
Lovich, J. E., and Gibbons, J. W. (1992). A review of techniques for quantifying sexual size dimorphism. Growth Dev. Aging 56, 269–281.
MacDonald, K. C. (1992). The domestic chicken (Gallus gallus domesticus) in sub-Saharan Africa: A background to its introduction and its osteological differentiation from indigenous fowls (Numidinae and Francolinus sp.). J. Archaeol. Sci. 19, 303–318. doi: 10.1016/0305-4403(92)90019-Y
McCollin, D., Hodgson, J., and Crockett, R. (2015). Do British birds conform to Bergmann’s and Allen’s rules? An analysis of body size variation with latitude for four species. Bird Stud. 62, 404–410. doi: 10.1080/00063657.2015.1061476
Mcqueen, A., Klaassen, M., Tattersall, G. J., Atkinson, R., Jessop, R., Hassell, C. J., et al. (2022). Thermal adaptation best explains Bergmann’s and Allen’s Rules across ecologically diverse shorebirds. Nat. Commun. 13:4727.
Mostafa, E., Imonugo, O., and Varacallo, M. (2022). “Anatomy, shoulder and upper limb, humerus,” in StatPearls [Internet]. Treasure Island, FL: StatPearls Publishing
Neer, W. V., Noyen, K., Cupere, B. D., and Beuls, I. (2002). On the use of endosteal layers and medullary bone from domestic fowl in archaeozoological studies. J. Archaeol. Sci. 29, 123–134. doi: 10.1006/jasc.2001.0696
Olson, V. A., Davies, R. G., Orme, C. D. L., Thomas, G. H., Meiri, S., Blackburn, T. M., et al. (2009). Global biogeography and ecology of body size in birds. Ecol. Lett. 12, 249–259. doi: 10.1111/j.1461-0248.2009.01281.x
Pebesma, E., and Bivand, R. (2005). Classes and methods for spatial data: The sp package. R News 5, 9–13.
Pinheiro, J., Bates, D., DebRoy, S., Sarkar, D., and Team, R. C. (2007). Linear and nonlinear mixed effects models. R Package Version 3, 1–89.
Piross, I. S., Harnos, A., and Rózsa, L. (2019). Rensch’s rule in avian lice: Contradictory allometric trends for sexual size dimorphism. Sci. Rep. 9, 1–9. doi: 10.1038/s41598-019-44370-5
Pitt, J., Gillingham, P. K., Maltby, M., and Stewart, J. R. (2016). New perspectives on the ecology of early domestic fowl: An interdisciplinary approach. J. Archaeol. Sci. 74, 1–10. doi: 10.1016/j.jas.2016.08.004
R Core Team (2021). R: A language and environment for statistical computing. Vienna: R foundation for statistical computing.
Remeš, V., and Szekely, T. (2010). Domestic chickens defy Rensch’s rule: Sexual size dimorphism in chicken breeds. Evol. Biol. 23, 2754–2759. doi: 10.1111/j.1420-9101.2010.02126.x
Ripley, B. (2021). Support functions and datasets for venables and ripley’s MASS. R package MASS version 7.3-45.
Romano, A., Séchaud, R., and Roulin, A. (2021). Generalized evidence for Bergmann’s rule: Body size variation in a cosmopolitan owl genus. J. Biogeogr. 48, 51–63. doi: 10.1111/jbi.13981
Salewski, V., and Watt, C. (2017). Bergmann’s rule: A biophysiological rule examined in birds. Oikos 126, 161–172. doi: 10.1111/oik.03698
Sasson, A., and Arter, S. (2020). Earliest utilization of chicken in upper California: The zooarchaeology of avian remains from the San Diego Royal Presidio. Am. Antiq. 85, 516–534. doi: 10.1017/aaq.2020.27
Smith, H., Gnanadesikan, R., and Hughes, J. B. (1962). Multivariate Analysis of Variance (MANOVA). Biometrics 18, 22–41.
Sun, Y., Li, M., Song, G., Lei, F., Li, D., and Wu, Y. (2017). The role of climate factors in geographic variation in body mass and wing length in a passerine bird. Avian Res. 8, 1–9. doi: 10.1186/s40657-016-0059-9
Symonds, M. R. E., and Tattersall, G. J. (2010). Geographical variation in bill size across bird species provides evidence for Allen’s rule. Am. Nat. 176, 188–197. doi: 10.1086/653666
Taylor, W., Wang, J., and Hart, I. (2020). Understanding the prehistory of domestic animals in East and Central Asia through scientific archaeozoology. J. Archaeol. Sci. 32:102397. doi: 10.1016/j.jasrep.2020.102397
Thomas, R., Sadler, P., and Cooper, J. (2016). Developmental osteology of cross-bred red junglefowl (Gallus gallus domesticus L. 1758) and the implications for ageing chickens from archaeological sites. Int. J. Osteoarchaeol. 26, 176–188. doi: 10.1002/oa.2417
Tiwari, Y., Pandey, A., Shrivastav, A. B., and Tomar, M. P. S. (2011). Gross morphometrical studies on pectoral limb of Pariah Kite (Milvus migrans). Ann. Rev. Res. Biol. 1, 111–116.
Tschopp, E., Napoli, J. G., Wencker, L. C., Delfino, M., and Upchurch, P. (2022). How to render species comparable taxonomic units through deep time: A case study on intraspecific osteological variability in extant and extinct lacertid lizards. Syst. Biol. 71, 875–900. doi: 10.1093/sysbio/syab078/6380963
Van De Ven, T. M. F. N., Martin, R. O., Vink, T. J. F., Mckechnie, A. E., and Cunningham, S. J. (2016). Regulation of heat exchange across the hornbill beak: Functional similarities with Toucans. PLoS One 11:e0154768. doi: 10.1371/journal.pone.0154768
VanderWerf, E. A. (2012). Ecogeographic patterns of morphological variation in elepaios (Chasiempis spp.): Bergmann’s, Allen’s, and Gloger’s rules in a microcosm. Ornithol. Monogr. 73, 1–34. doi: 10.1525/om.2011.73.1.1
Vistro, W. A., Kalhoro, I. B., and Ghias, M. (2015). Comparative anatomical studies on humerus of commercial broiler and Desi chicken. Acad. Res. Int. 6, 153–158.
Von den Driesch, A. (1976). A guide to the measurement of animal bones from archaeological sites, Vol. 1. Cambridge, MA: Peabody Museum Press.
Wickham, H., Chang, W., and Wickham, M. H. (2016). Package ‘ggplot2’. Create elegant data visualisations using the grammar of graphics. Version 2, 1–189.
Woldekiros, H. S., and D’Andrea, A. C. (2017). Early evidence for domestic chickens (Gallus gallus domesticus) in the Horn of Africa. Int. J. Osteoarchaeol. 27, 329–341. doi: 10.1002/oa.2540
Woldekiros, H. S., D’Andrea, A. C., Thomas, R., Foster, A., Lebrasseur, O., Miller, H., et al. (2019). Archaeological and biometric perspectives on the development of chicken landraces in the Horn of Africa. Int. J. Osteoarchaeol. 29, 728–735. doi: 10.1002/oa.2773
Yahav, S. (2015). “Regulation of Body Temperature: Strategies and Mechanisms,” in Sturkie’s Avian Physiology, 6 Edn, ed. Scanes, C. G (London: Academic Press), 869–905. doi: 10.1016/B978-0-12-407160-5.00037-3
Yihdego, Y., Salem, H. S., Ayongaba, B., and Veljkovic, Z. (2018). Mining sector challenges in developing countries, Tigray, Ethiopia and inspirational success stories from Australia. Int. J. Min. Miner. Eng. 9, 321–367.
Keywords: adaptation, appendage, bone, climate, environment, poultry, shank length, Tigray
Citation: Gebru G, Belay G, Dessie T, Zenebe Kelkay M, Birhanie Dagnhegn M and Hanotte O (2023) Morphological and osteological characterization of indigenous domestic chickens (Gallus gallus domesticus): validation of Rensch’s, Bergmann’s and Allen’s rules. Front. Ecol. Evol. 11:1032082. doi: 10.3389/fevo.2023.1032082
Received: 16 September 2022; Accepted: 31 March 2023;
Published: 28 April 2023.
Edited by:
Daniel de Paiva Silva, Federal Institute Goiano (IFGOIANO), BrazilReviewed by:
Francesco Carotenuto, University of Naples Federico II, ItalyGiovanni Forcina, University of Alcalá, Spain
Copyright © 2023 Gebru, Belay, Dessie, Zenebe Kelkay, Birhanie Dagnhegn and Hanotte. This is an open-access article distributed under the terms of the Creative Commons Attribution License (CC BY). The use, distribution or reproduction in other forums is permitted, provided the original author(s) and the copyright owner(s) are credited and that the original publication in this journal is cited, in accordance with accepted academic practice. No use, distribution or reproduction is permitted which does not comply with these terms.
*Correspondence: Gebreslassie Gebru, Z2VicmUxOTJAZ21haWwuY29t, Z2VicmVzbGFzc2llLmdlYnJ1QGFhdS5lZHUuZXQ=; Olivier Hanotte, by5oYW5vdHRlQGNnaWFyLm9yZw==, b2xpdmllci5oYW5vdHRlQG5vdHRpbmdoYW0uYWMudWs=