- 1School of Business, Hubei University, Wuhan, China
- 2School of Accountancy, Hubei University of Economics, Wuhan, China
- 3Collaborative Innovation Center for Emissions Trading System Co-Constructed by the Province and Ministry, Hubei University of Economics, Wuhan, China
- 4School of Economics and Management, Huazhong University of Agriculture, Wuhan, China
- 5Office of Integrated Technology, Qingdao Qianwan Container Terminal Co., Ltd., Qingdao, China
Environmental regulation is an important tool for achieving environmental protection. This study investigated how climate change affects firms' actions to reduce pollutant emissions through environmental regulations. We conducted a pooled OLS regression analysis using data from Chinese industrial firms that were above the designated size from 2006 to 2013. The results showed that firms reduce SO2 emissions in response to climate change, particularly when environmental regulations are more stringent. However, firms prefer to reduce productivity and implement “end-of-pipe” interventions than engage in more green innovation. Our findings highlight how firms deal with climate change under the pressure of environmental regulations and whether ecological considerations align or conflict with economic goals.
1. Introduction
Climate change is a pressing global issue that threatens environmental conditions essential to human survival. In addition to causing rising sea levels and damaging ecological systems, climate change exacerbates environmental deterioration by increasing the likelihood of contaminants breaking down into harmful substances at higher temperatures. However, “going green” is difficult (Clarke et al., 1994). As the main sources of pollutant emissions, firms have little incentive to reduce pollution without regulations (Coase, 1960). Furthermore, reducing pollutant emissions may cause an economic lag that can limit productivity. The conflict between environmental concerns and economic growth is a complex issue that perplexes many developing countries.
Developing countries have sacrificed the environment for economic development resulting in many adverse repercussions for the global ecological system and public health (Ebenstein, 2012). To achieve sustainable development, developing countries must overcome the following challenges. First, there is insufficient incentive for firms to reduce pollutant emissions, which is due to the characteristics of the public goods environment and the externality of emissions. As a result, firms lack the motivation to actively reduce pollution without external regulations, which leads to public demand for regulations (Nordhaus, 2019).
Second, achieving a harmonious coexistence between economic growth and the environment is essential. In the process of economic growth, production demands resources and emits pollutants into the environment. Reducing pollutant emissions means accepting the loss of economic growth opportunities (Gray and Shadbegian, 2003).
Most existing studies suggest that climate change has a negative effect on firms' production processes and financial behavior, such as capital income (Dell et al., 2009), industry outputs (Hsiang et al., 2017), employees' mental and physical health (Ito and Zhang, 2020), and the overall economic system (Stern, 1995; Dell et al., 2012). Faced with climate change, firms tend to passively accept its consequences and bear the associated costs and damages (Clarkson et al., 2004). However, little is known about whether firms take responsibility for reducing pollutant emissions. China, as the world's largest developing country and emerging market, has achieved remarkable economic growth (Allen et al., 2005) while also serving as the world's industrial factory with the world's largest population. Consequently, it faces significant threats from climate change. However, China's success in environmental protection can be viewed as an exemplar of promoting green development worldwide (He et al., 2020).
In contrast to the market-oriented behavior in developed Western countries, political incentives encourage firms in China to trade-off public welfare. China has a land area of 9.6 million sq km, making it difficult for the central government to manage the country (Li and Zhou, 2005). As a result, local governments manage local affairs with guidance from the central government (Tang et al., 2017). Based on the Scientific Outlook on Development of former President Hu Jintao, the China State Council proposed the Decision on Implementing the Scientific Outlook on Development and Strengthening Environmental Protection in 2006,1 which changed China's development model. The central government places great emphasis on environmental problems which have become an essential factor in their evaluation of the local government's performance, which has become an important consideration in promoting local government officials to higher positions2 (He et al., 2020).
Consequently, climate change threatens politicians' political careers. Faced with climate change, politicians have a greater incentive to supervise local firms and curb pollutant emissions to address climate change. In this study, we first examined the effect of climate change on firms' incentives to reduce pollutant emissions. We employed a pooled ordinary least squares (OLS) regression and used data from the Daily Surface Climatological Data (DSCD) between 2006 and 2013 to measure climate change, which provides China's historical surface temperature information. To measure pollutant emissions, we used the data on Chinese industrial firms above the designated size from the China Annual Survey of Industrial Firms (ASIF) database, focusing on sulfur dioxide (SO2) emissions, which is consistent with Liu et al. (2021) research due to the integrity and authority of SO2 emission data. These data are monitored by the China Environmental Protection Bureau, have abundant observations and less missing value.
Climate change is induced more by air contaminants than liquid contaminants. Therefore, we examined whether environmental regulations amplify or diminish the effects of climate change on firms' pollution emission reduction efforts, both at the central and local levels, as suggested by Liu et al. (2021). Additionally, we investigated the mechanisms and approaches that firms use to reduce pollution. One approach involves changing the production process by reducing operating time, while the other approach involves “end-of-pipe” interventions, such as purchasing treatment facilities (He et al., 2020). Furthermore Acemoglu et al. (2011) and Brown et al. (2022) proposed that green innovation can be an effective way to eliminate pollutant emissions while maintaining economic competitiveness.
2. Hypothesis development
2.1. Effect of climate change on firms' pollution emission reduction efforts
Developing countries pursue economic growth at the expense of the ecological environment. Climate change accelerates the worsening of pollution, such as pollutant deterioration into more harmful contaminants, leading to serious ecological problems that have sparked widespread social concern (He et al., 2020). Moreover, climate change affects not only the ecological system but also human health (Fu et al., 2021). There is growing public pressure on the government to tighten its supervision to constrain firms' pollutant emissions and impose heavy pollution taxes and penalties. The public also requires the judicial system to punish firms when they suffer serious pollution incidents (Jaffe et al., 2002). Therefore, the government has responded to public demands by exerting pressure on firms to reduce pollution.
Climate change also increases the risk of metamorphic and secondary pollution, forcing governments to focus on this aspect. China practices a “from top to bottom” environmental regulation approach. The central government takes the lead in environmental planning and policymaking, while local governments are responsible for executing these plans (He et al., 2020). Since 2006, environmental problems have become to an essential factor in determining the career advancement of local politicians under the one-vote veto system of the 12th 5-year plan of China. Consequently, firms that emit pollutants have seriously affected the competitiveness of local government officials for political promotion. This has forced local governments to exert pressure on firms to reduce pollutant emissions. Governments must tighten their supervision and urge local firms to reduce emissions to avoid being voted down because of environmental problems. Consequently, when climate change is severe, environmental regulations may be used to prevent environmental pollution incidents.
H1: Firms reduce their pollutant emissions to address climate change.
2.2. Effect of environmental regulations
The issue of firms' pollutant emissions has become a focus of public criticism, forcing the government to adopt environmental regulations to encourage firms to start reducing pollutant emissions. Environmental regulations by the government should address the negative externalities of environmental pollution and hold firms accountable for environmental protection (Brown et al., 2022). Environmental regulations in China are enacted by both central and local governments. The decision to implement the Scientific Outlook on Development and Strengthening Environmental Protection3 has changed China's development model, which only considers economic development. The central government has placed more weight on environmental problems in evaluating the performance of local governments. This is particularly relevant given the competition for political promotion within the different hierarchies of local governments (Piotroski et al., 2015), where local officials strive to avoid being negatively impacted by environmental issues.
Administrative power plays a significant role in firms' decision-making processes (Dong et al., 2021). The government requires firms to comply with the environmental policies of the region in which they are registered. Firms also have a strong incentive to comply with government regulations and public demands to avoid disagreements and punishments (Liu et al., 2021). Based on China's “from top to bottom” environmental regulation approach, He et al. (2020) found that firms located upstream of environmental monitoring stations in rivers reduce approximately 57% of chemical oxygen demand emissions. Chen et al. (2017) also discovered that the disclosure of environmental information by listed firms is beneficial to social welfare and environmental protection. When environmental regulations are stringent, firms place greater emphasis on environmental problems and take action to reduce pollutant emissions.
H2: Rigorous environmental regulations strengthen firms' efforts to reduce their pollutant emissions in the face of climate change.
3. Materials and methods
3.1. Data and sample
We use annual data of China's above-scale industrial firms from 2006 to 2013, and ordinary least squares (OLS) regression with province- and year- fixed effects, to investigate how climate change affects firms' pollution behavior, with a focus on environmental reregulations. Before 2006, local governments' performance was evaluated based mostly on economic indicators, and it was observed that local governments paid little attention to environmental protection. We searched the Environmental Survey and Reporting Database and the ASIF database for data up to 2013, the end year of our search.
Climate change data were downloaded from DSCD, a dataset published daily by the China National Meteorological Administration. We converted the daily data into annual data by calculating the average for the whole year from Jan-1-2006 to Dec-31-2013. We then merged the climate change data from DSCD with firm-year data from ASIF. Data on pollutant emissions (SO2) and firms' abatement methods were collected annually from the Environmental Survey and Reporting Database.
Country-level environmental regulation data were manually collected according to the list of “Two control zones,” which were designated at the city level in 1998 by the State Council of China.4 We merged this list of the two control zones with the firm's location. Data on environmental regulations at the local level were obtained from two sources: The first was from the China Statistical Yearbook, published by the China National Bureau of Statistics, which provides province-level information. The second source was based on the geographical proximity to the boundaries of regions within provinces, cities, and counties, as determined using the Baidu map and the Python framework. Green innovation data were manually collected at the firm level. First, we manually collected annual information on international patent classification (IPC), which uniquely identifies the technological field of each firm, from the China State Intellectual Property Office (CSIPO) using the names of firms. We then matched the IPCs with the patent lists from the World Intellectual Property Organization (WIPO) and the Organization for Economic Co-operation and Development (OECD). The remaining data, such as size and leverage, were collected at the firm level from the ASIF database. Data on region-level variables, such as economic and population data, were obtained from the China Statistical Yearbook database.
We then deleted samples that could influence the accuracy of the regression analysis based on the recommendations by Brandt et al. (2009) and He et al. (2020). These samples included omitted observations at any variable level and those related to environmental protection facilities. A total of 29, 3,848 observations were included in our sample.
3.2. Regression model and variable definition
To investigate how climate change affects firms' emission reduction efforts on SO2, we used a regression model (1), where the independent variable is Climate and the dependent variable is Emission. Year FE and Province FE represent year and province fixed effects, respectively, while ξ is the stochastic error term. The specific definitions of each variable are as follows.
3.2.1. Climate change (Detatem3 and Detatem5)
Sea level rise was widely used in previous studies to measure climate change and its repercussions (Bernstein et al., 2019). However, the applicability of this measurement method in China remains questionable. There are two main reasons for this: first, China generally has a high terrain, especially in the central and western regions, which have mountains and plateaus. As a result, sea level rise has a limited impact on numerous non-coastal firms in the short term. Second, unlike the geographical characteristics of the United States, which is adjacent to both the Atlantic and Pacific oceans, China is located on the western Pacific continental shelf, which has a distinct continental character, and its geographical depth makes it more resistant to the impact of sea level rise. The increasing occurrences of extreme temperatures in China have alerted the awareness for public to restrain firms' pollutant emissions. For example, the observed extreme temperatures caused by the West Pacific subtropical high in the middle and lower reaches of the Yangtze River in 2022. According to Montzka et al. (2011), the temperature increase is an appropriate measure of climate change that can be directly observed. The DSCD database, which offers practical and feasible materials for studying climate change, provides annual average temperature data for various regions in China. Based on Deschenes and Greenstone (2007), we calculated the difference between the average temperature of each city in the current year and the average temperature of the past 3 and 5 years. The larger the value, the greater the climate change.
3.2.2. Firms' pollution behavior (Emission)
We used SO2 emissions to measure firms' pollution behavior based on the recommendations by Liu et al. (2021). SO2 is a primary contaminant that causes acidification, which is harmful to natural resources and directly contributes to human health issues (Liu et al., 2021). First, since climate change is calculated according to temperature changes in a specific region, it is more closely related to air contaminants than liquid contaminants. SO2 emissions destroy the atmosphere and lead to numerous pollution incidents. Acidification and photochemical smog may have severe negative effects on public health and result in significant ecological damage. Second, SO2 emissions are better monitored in comparison to other air contaminants, such as industrial dust and nitric oxide, and have fewer omitted observations in the Environmental Survey and Reporting Database, guaranteeing a certain level of data quality for our sample (Liu et al., 2021).
We measured pollution using the natural logarithm of kilograms of SO2 emissions, following Akey and Appel (2021). We excluded observations where SO2 emissions were equal to zero because it was difficult to distinguish whether the value was a genuine zero or omitted, which may have introduced noise into our research. Furthermore, we followed the approach recommended by Liu et al. (2021) and calculated a relative number by dividing the kilograms of SO2 emission by the constant price of gross industrial output, adjusted for inflation, in the robustness check.
3.2.3. Control variables (Controls)
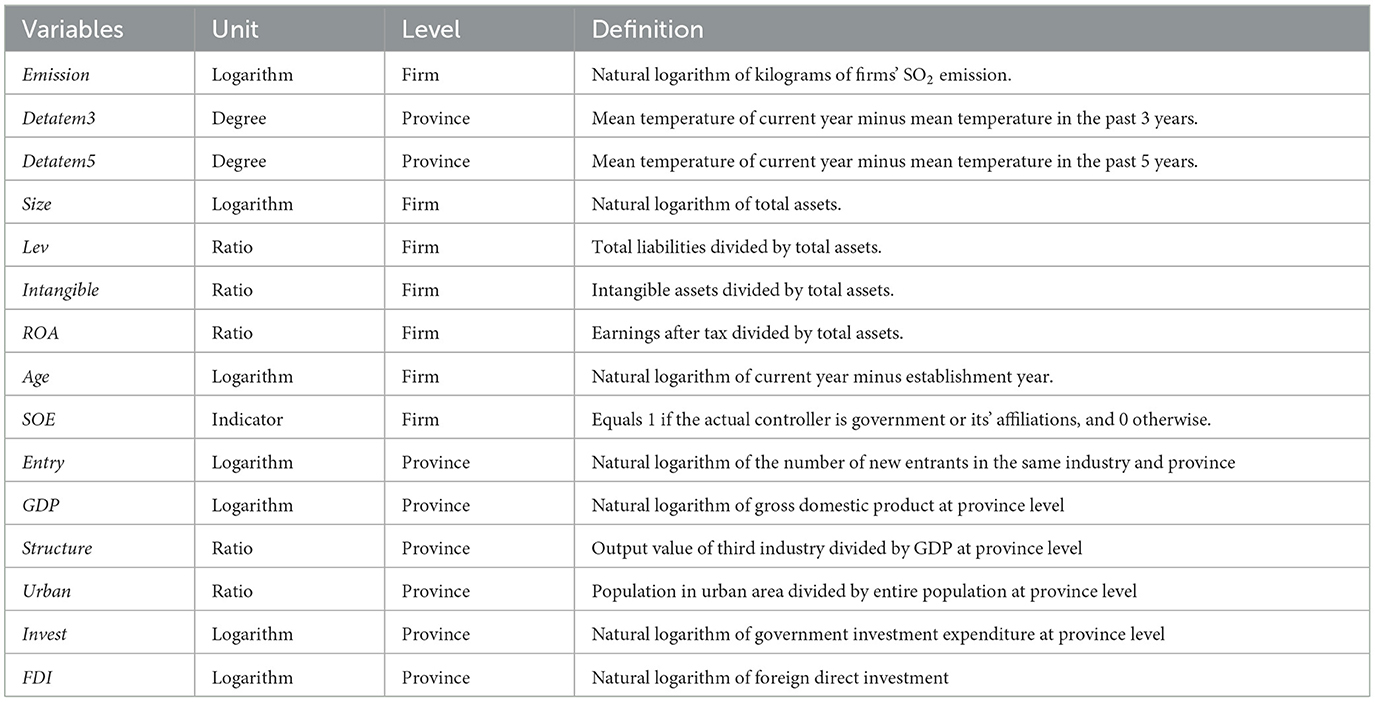
The control variables consisted of both firm-specific and city-level variables, which may have affected firms' emission behavior, as recommended by Brandt et al. (2009) and He et al. (2020). Table 1 presents the definitions of the control variables.
4. Results
4.1. Summary statistics
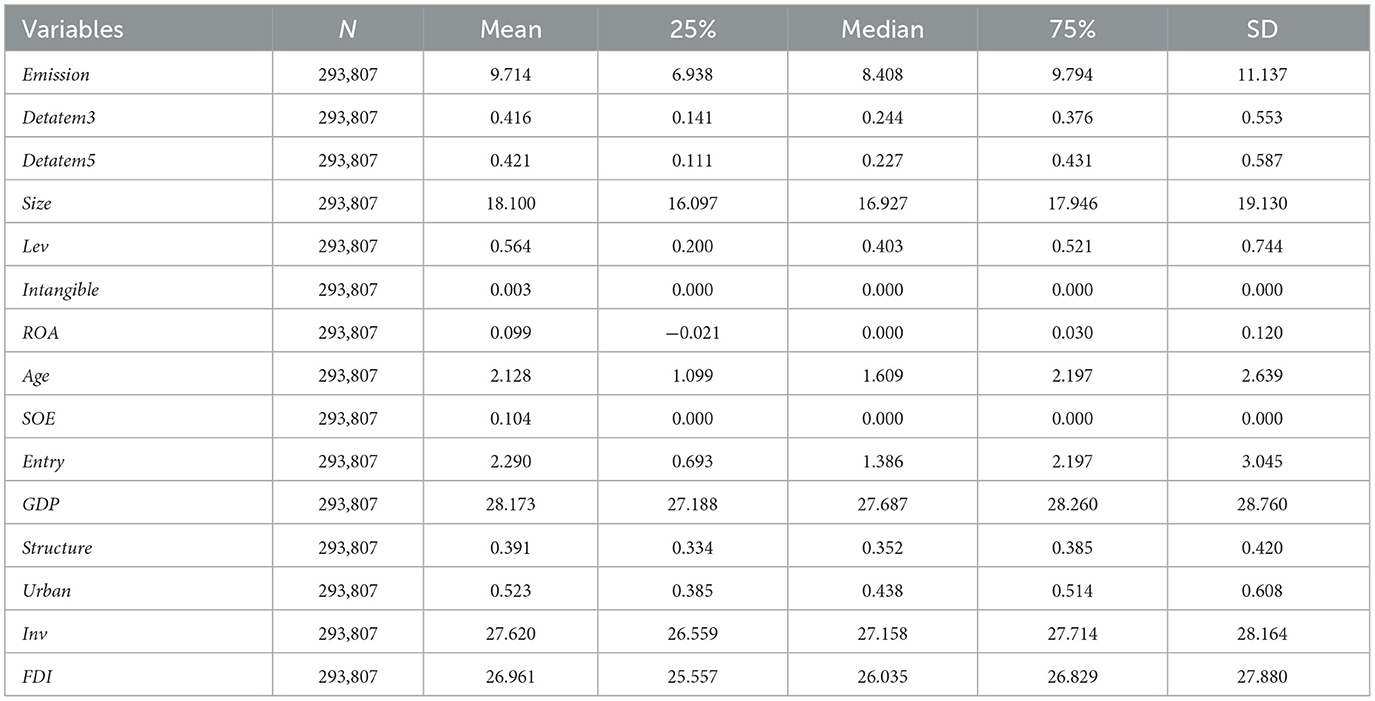
Table 2 shows that the mean value of Emission is 9.714, which implies that, during our sampling period, firms released an average of 16, 547 kg of SO2 annually. The means of Detatem3 and Detatem5 were 0.416 and 0.421, respectively, indicating that, on average, the temperature of the current year is higher than that in the past 3 and 5 years. This is consistent with the overall trend of increasing temperatures. The other control variables in our study were consistent with those of prior research (He et al., 2020).
4.2. Baseline results
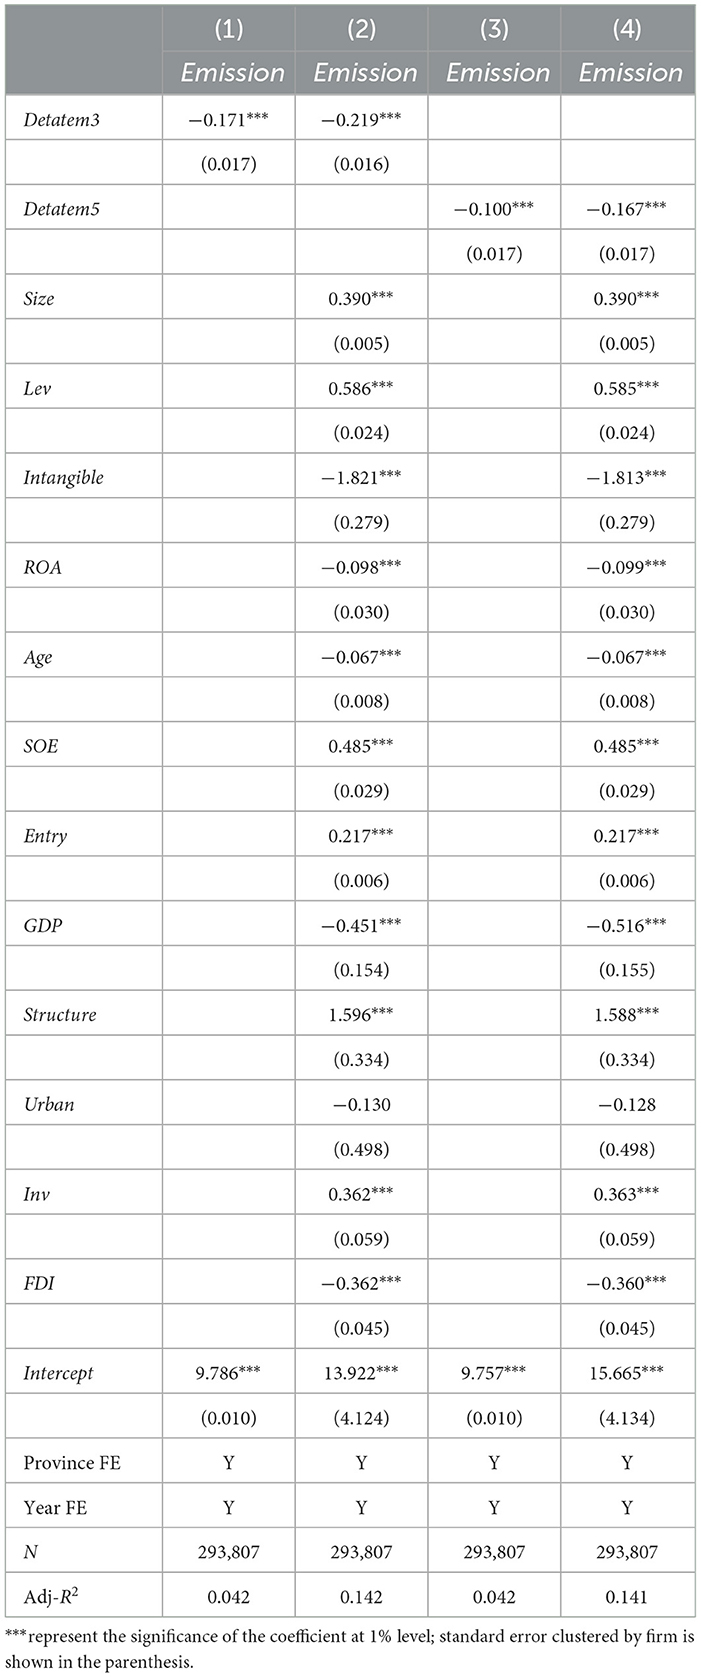
Table 3 shows how climate change affects firms' SO2 emissions behavior. Columns (1) and (3) excluded the control variables, whereas columns (2) and (4) included them. Regardless of whether the independent variable was Detatem3 or Detatem5, the coefficients among the four columns were negative and significant at the 1% level. Considering the example of column (2), a unit of Detatem3 increase led to an emission reduction of 6.18% [0.220 × (11.137 – 8.4.8)/9.714] from the 25th percentile to the 75th percentile, indicating that an increase in climate change bolstered firms' efforts to mitigate SO2 emissions. Thus, Hypothesis 1 was confirmed.
The results for the control variables are as follows: The coefficient of Size was significantly positive, suggesting that big firms had to engage in more productive activities to maintain their going-concern status, compensate for marginally increasing costs, and consequently produce more SO2 emissions. The coefficient of Lev was significantly positive, suggesting that firms with large financial leverage undertook more obligations to pay off their debt; therefore, they created more cash flow by increasing productivity at the expense of the environment. The coefficient of Intangible was significantly negative, indicating that a greater number of innovative firms were equipped to improve production efficiency while using fewer resources and emitting less pollution. The coefficient of ROA was significantly negative. High economic efficiency is benefit for going green. The coefficient of Age was significantly negative, indicating that startups lag behind compared to incumbents. The coefficient of SOE was significantly positive, indicating that state-owned firms were less worried about their pollution behavior due to government assurance and having more capital resources to increase their scale, leading to more pollution (Allen et al., 2005). The coefficient of Entry was significantly positive, indicating that new market entrants faced resistance from incumbents who preferred to increase their productivity to occupy the marketplace, leading to more SO2 emissions (Aghion et al., 2001). Variables at the province level indicated that GDP and FDI were negatively correlated with SO2 emissions, whereas Inv was positively correlated with SO2 emissions, which is consistent with the findings presented by Li and Zhou (2005), Chen et al. (2017), He et al. (2020), and Liu et al. (2021).
4.3. Robustness check
4.3.1. Alternate measurements of SO2 emissions
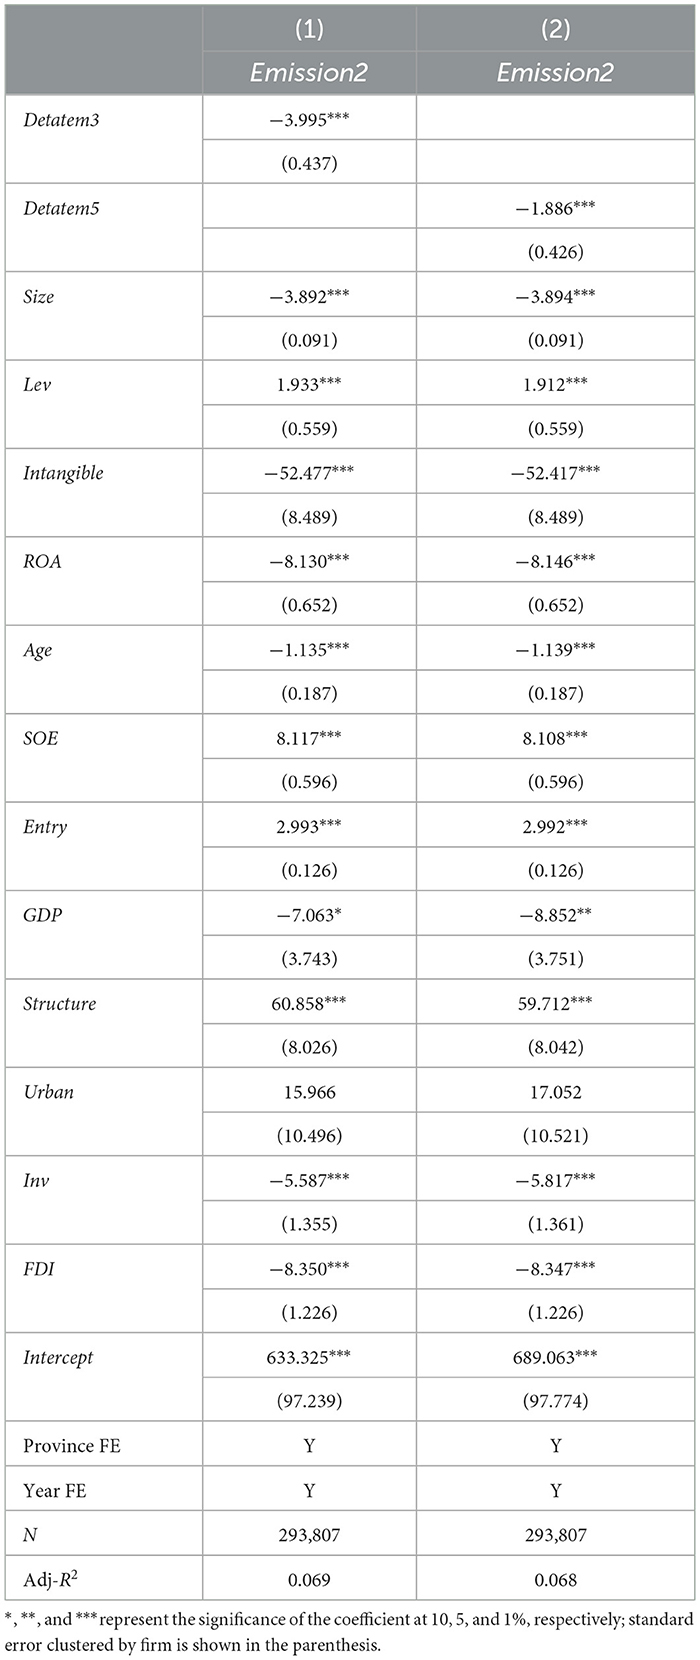
Following the recommendations of Liu et al. (2021), we replaced the dependent variable with a relative indicator of SO2 emission, which was adjusted by the industrial output value. Table 4 shows that Detatem3 and Detatem5 in columns (1)–(2) are both negative and significant at the 1% level, ensuring the robustness of our main results.
4.3.2. Alternate measurements of climate change
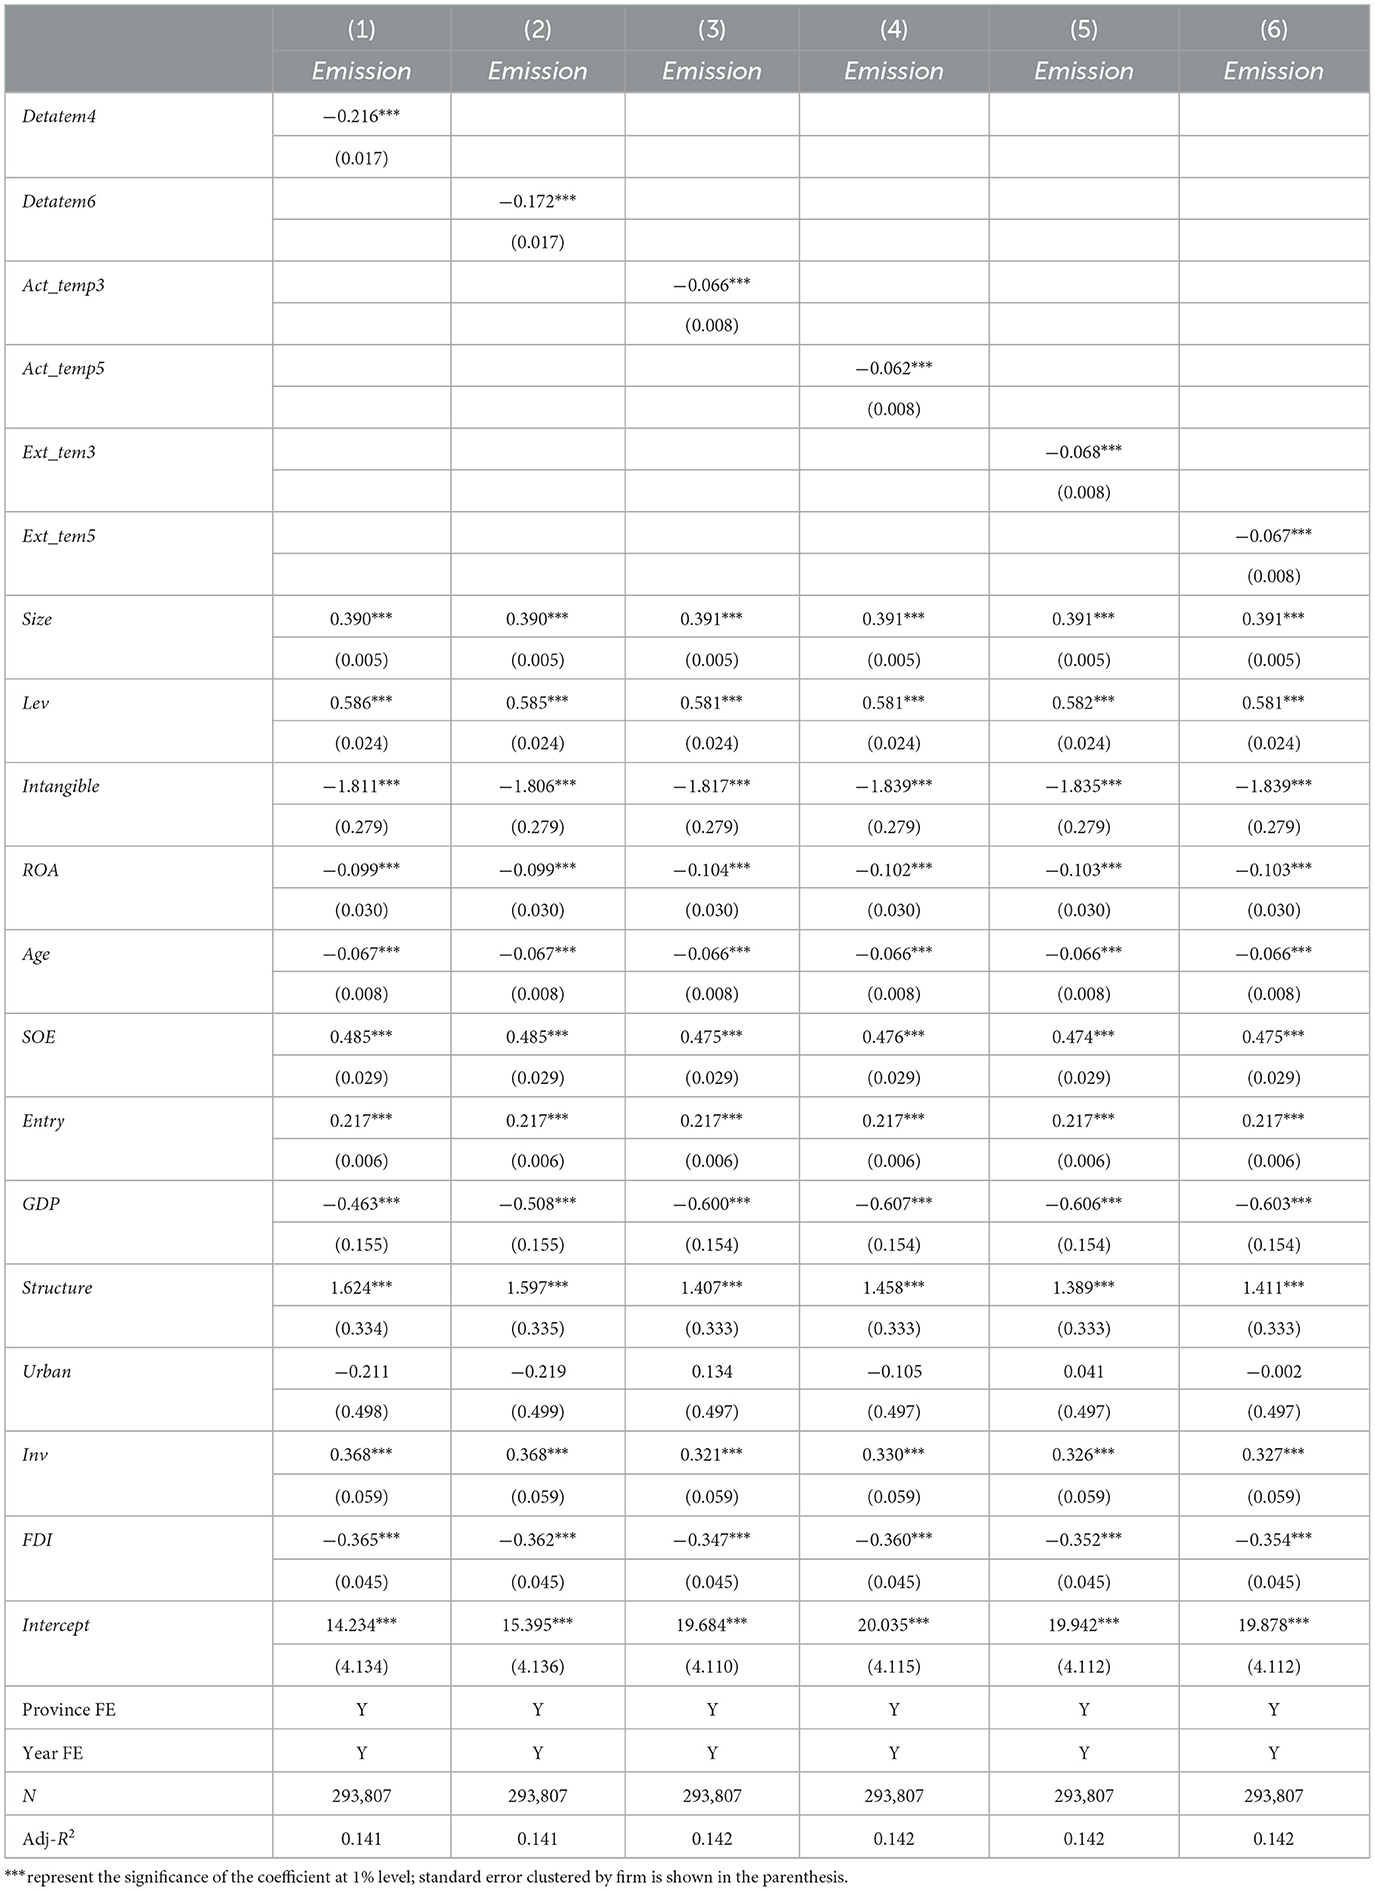
We made several revisions to our measurement of climate change. First, we modified the calculation window period of the core independent variable to 4 and 6 years, referred to as Detatem4 and Detatem6, respectively. Subsequently, we included the mean and the highest temperature of each city over the past 3 years as Act_temp3 and Ext_temp3, respectively, as well as over the past 5 years as Act_temp5 and Ext_temp5, respectively. Table 5 illustrates that all coefficients of the alternative, independent variables were negatively significant at the 1% level, confirming the robustness of our baseline results.
4.3.3. Change the time series
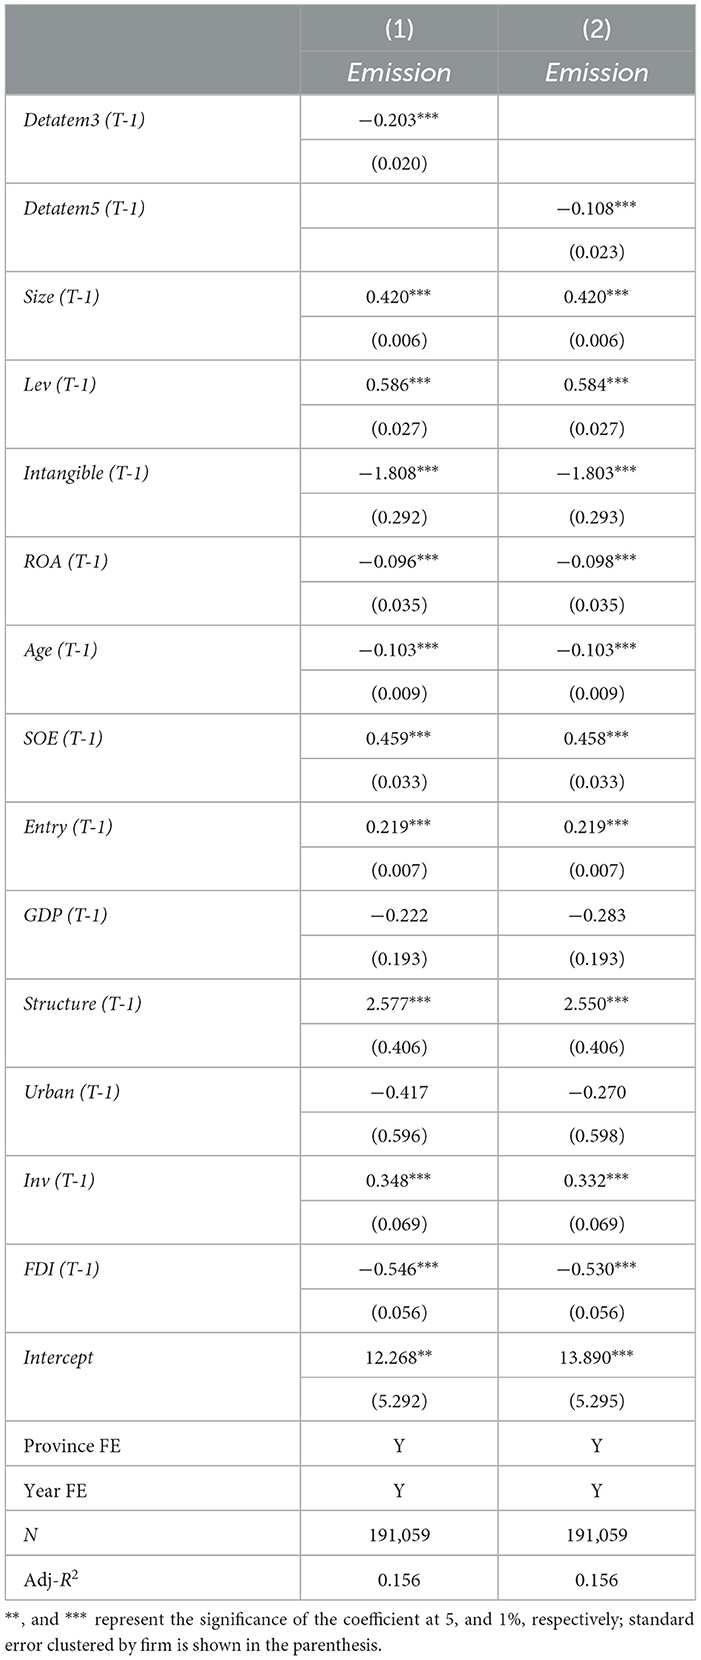
We then tested whether firms' SO2 emissions in the current year were influenced by climate change in the previous year. Table 6 illustrates that both lags of Datatem3 and Datetem5 were negative and significant at the 1% level, confirming the robustness of our baseline results.
4.3.4. Difference model
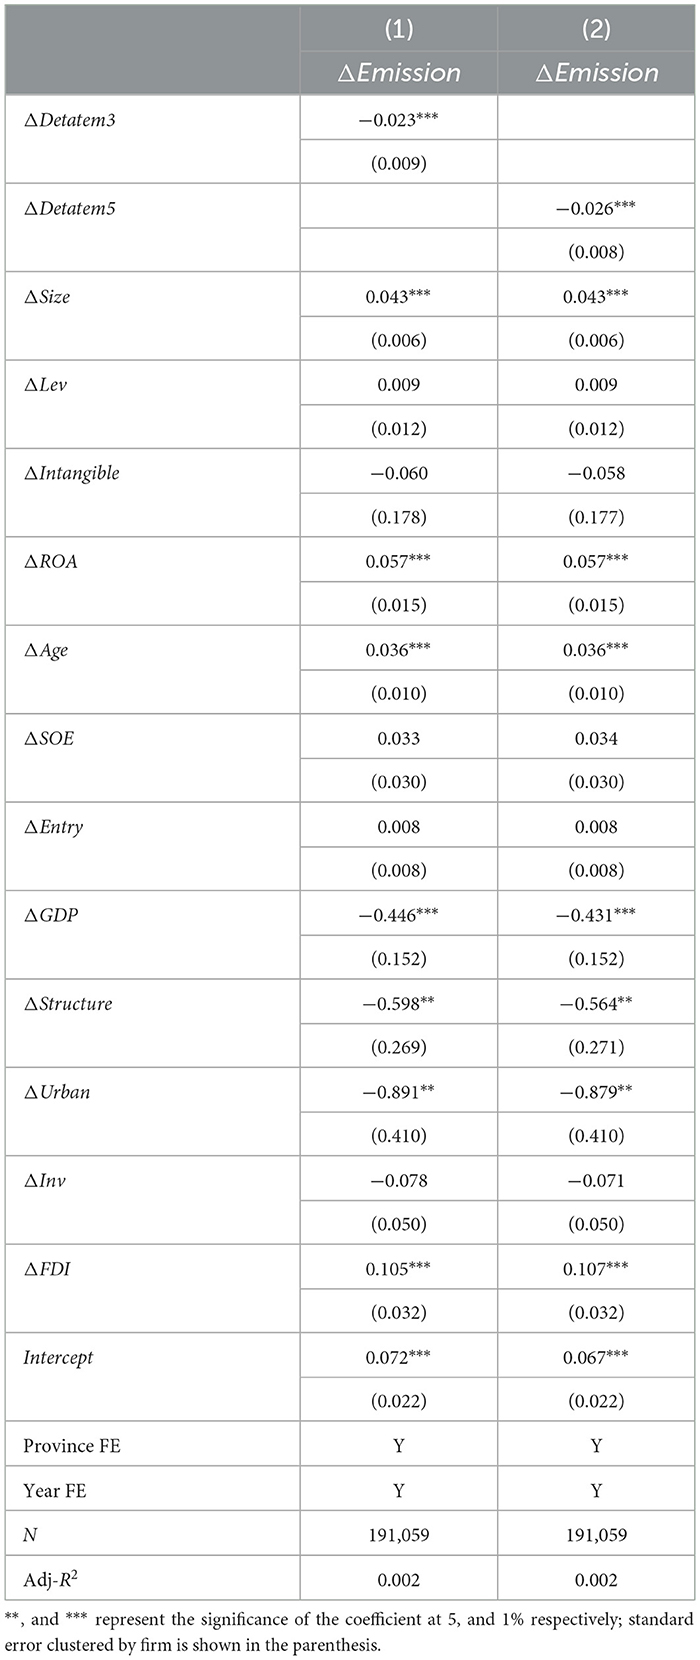
We attempted to overcome the problem of omitted variables by using the change model, following the recommendations by Chen et al. (2018), which involved regressing the difference between the current year and the previous year for all variables. Table 7 shows the negative coefficients at the 1% significance level for Detatem3 (column 1) and Detatem5 (column 2). As the temperatures rose, firms acted to reduce their SO2 emissions, confirming the robustness of our baseline results.
4.3.5. Evidence from CO2 emissions at the province level
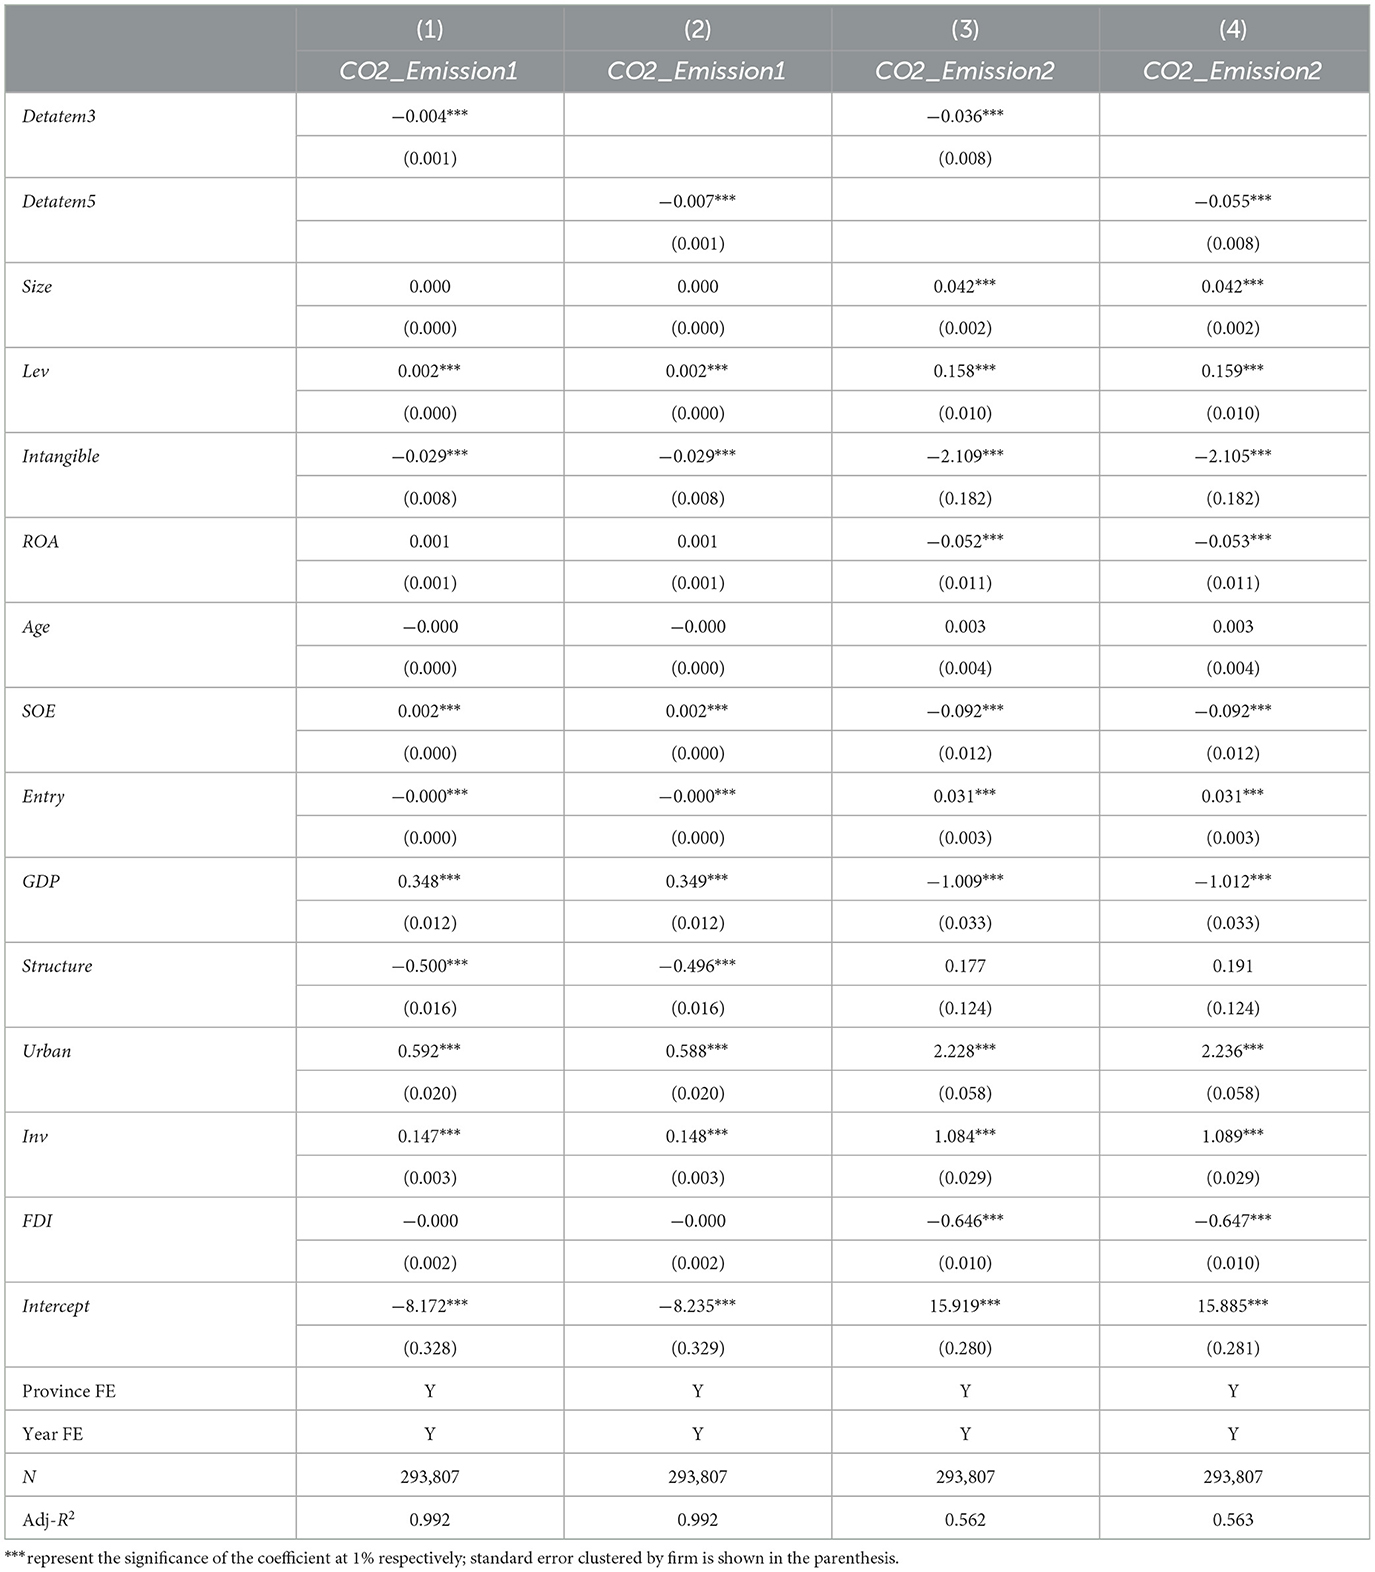
Furthermore, we examined the impact of climate change on carbon dioxide emissions at the provincial level.5 To measure CO2 emissions, we employed the following two approaches: the natural logarithm of the amount of CO2 emissions in kilograms for every province (CO2_Emission1) and the ratio of kilograms of CO2 emissions to total assets for every province (CO2_Emission2).
Table 8 illustrates that the coefficients of Detatem3 and Detatem5 were negatively correlated with CO2 emissions, confirming the robustness of our results.
5. Cross-sectional tests
China has a large territory, which makes it difficult for the government to adequately address the environmental issues of the entire country. To address this issue, local governments are responsible for executing environmental policies within their respective jurisdictions, which are guided by the central government's principles of protecting the environment (Fu et al., 2021).
Political incentives are essential for promoting environmental protection and recovery (Acemoglu and Robinson, 2013). According to the public choice theory, political decisions are based on the balance of cost and benefit for politicians (Buchanan, 1983), while the goal of obtaining as many votes as possible is a top priority for them. As the sole ruling party in China, the Community Party of China places great importance on improving public welfare in its governance of the whole country. Therefore, the central government should regulate firms' emission behavior to benefit public health. The central government assigns regulatory functions to local governments and monitors local governments' environmental protection performance, which is essential for local politicians' promotions. In this way, local politicians are incentivized to constrain pollutant emissions by requiring firms to obey local environmental policies. We examined cross-sectional data to evaluate the effectiveness of environmental regulations by both the central and local governments.
5.1. Environmental regulations at the country level
Several studies have attempted to determine how environmental regulations implemented by the Chinese central government can help achieve emission reduction targets. For example, He et al. (2020) utilized water quality monitoring stations located in the rivers of China and found lower chemical oxygen demand emissions upstream rather than downstream. Liu et al. (2021) examined the “Two control zones” designated by the Chinese central government and found that stronger regulations led to reduced pollutant emissions for firms facing earnings pressure. The central government has formulated environmental policies and appraisal programs at the national level (He et al., 2020). In this study, we manually collected data on acid and SO2 from the “Two control zones.”
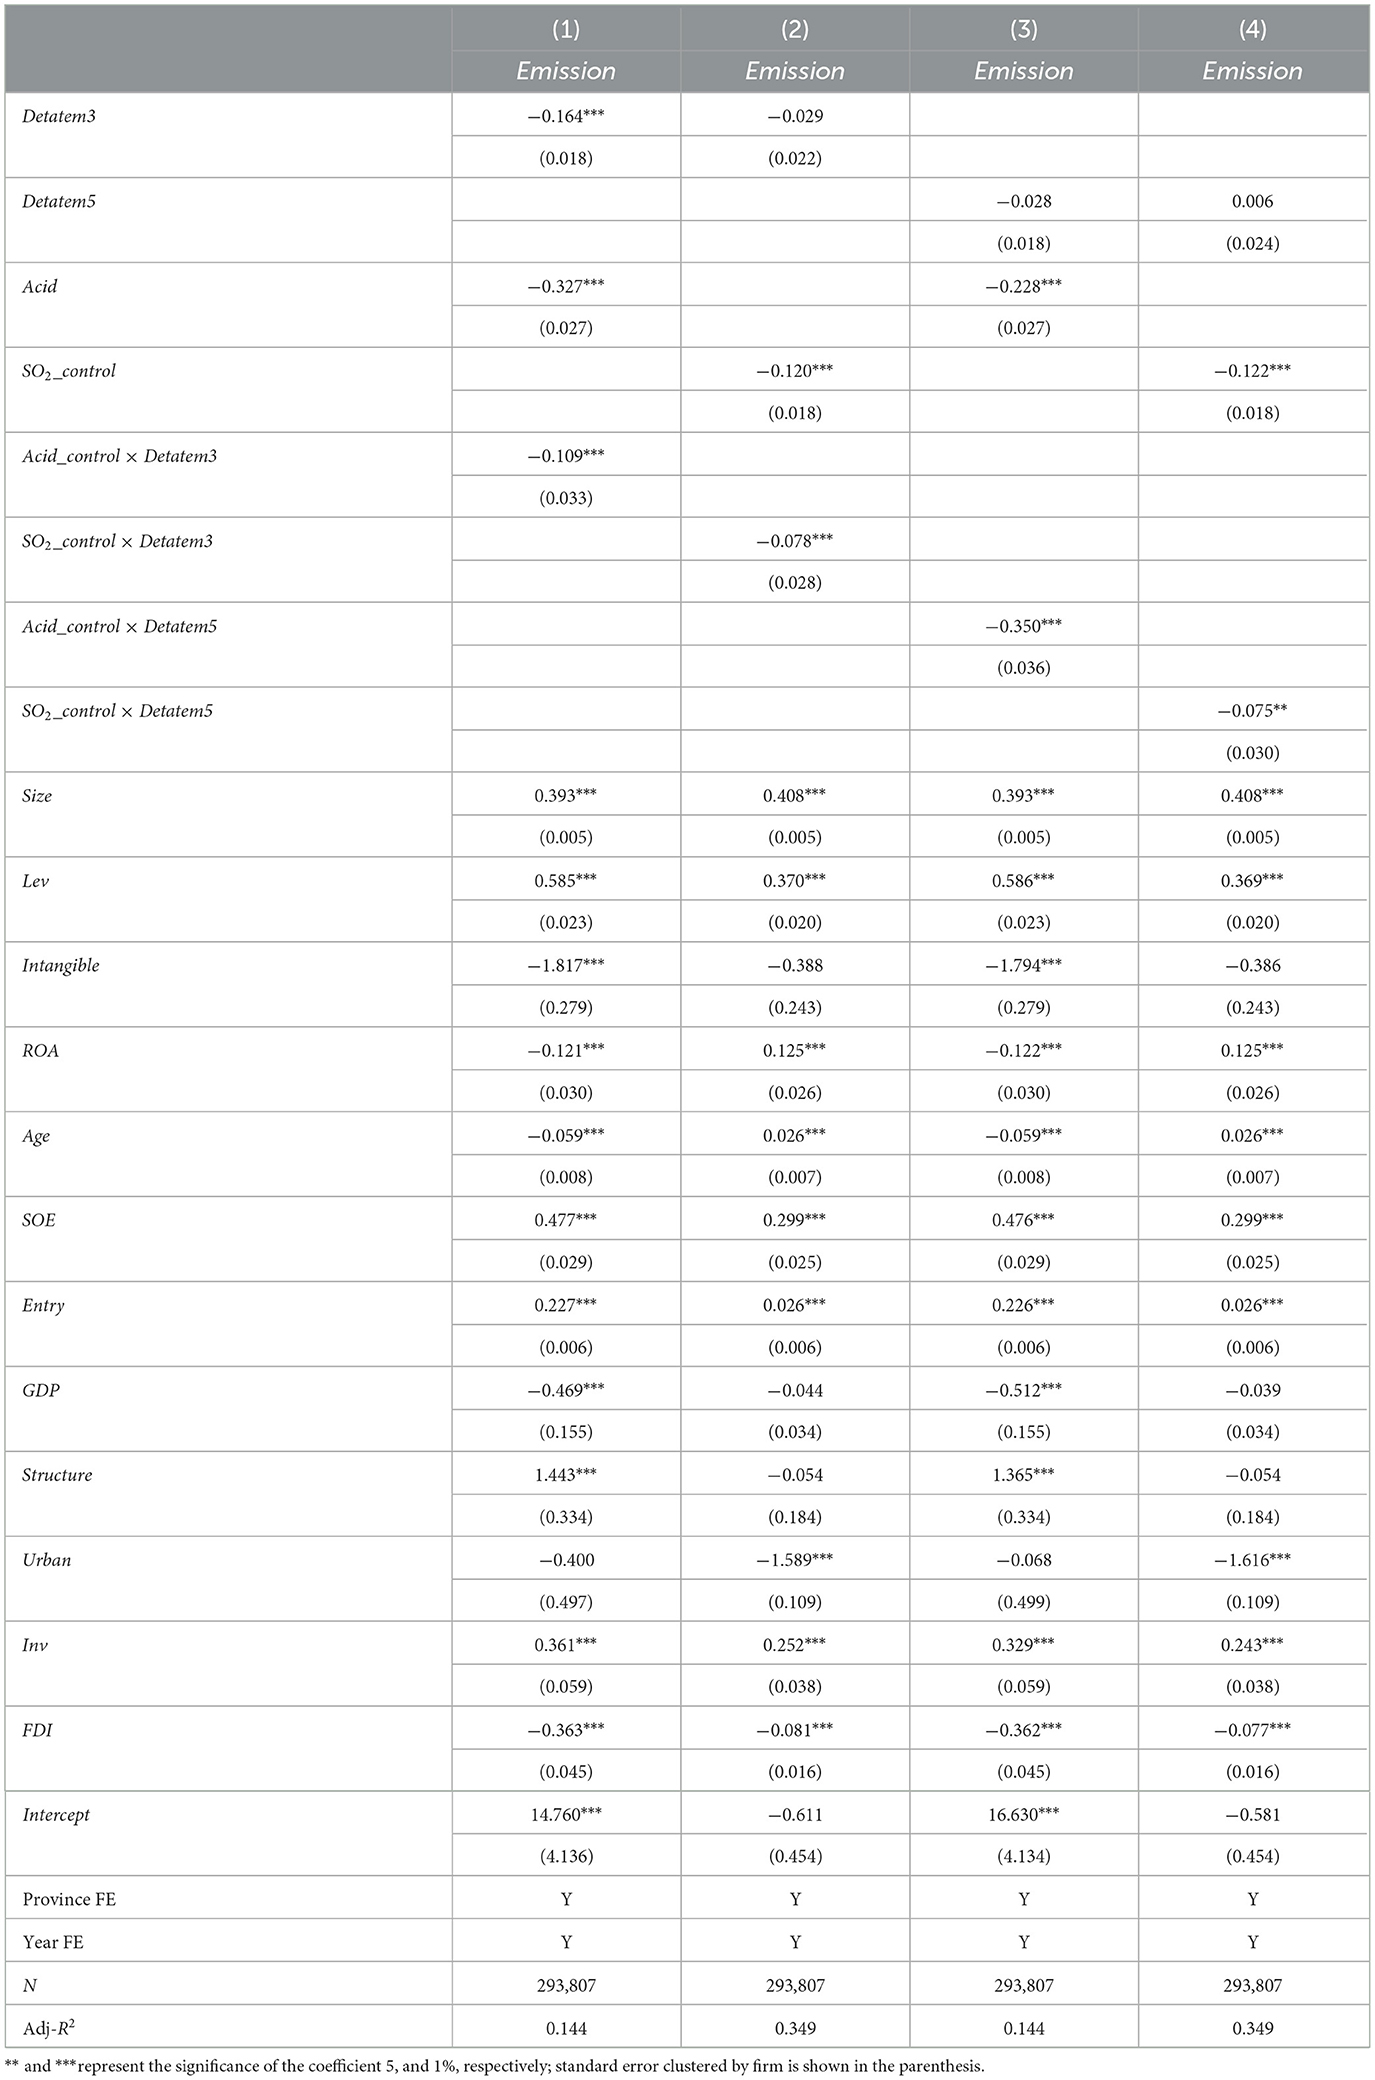
Table 9 shows that the coefficients of the interaction terms Acid_control×Detatem3, SO2_control×Detatem3, Acid_control×Detatem5, and SO2_control×Detatem5 were negative and significant at the 1% level, illustrating that stronger environmental regulations implemented by the central government led to a greater reduction in SO2 emissions among firms facing climate change.
5.2. Environmental regulations at the local level
5.2.1. The strength of environmental regulations by local governments
In China, local governments implement environmental policies and formulate local regulations with regional characteristics. China is a large country and, therefore, it is difficult for the central government to comprehensively collect and disseminate information to the entire country (Hayek, 1945). In addition, local customs and interest preferences vary across different local areas, making it difficult to impose inflexible regulations uniformly across the country. To address this issue, various local governments manage local areas and execute laws and regulations. The central government has established measures to evaluate local governments' performance in local development (Li and Zhou, 2005).
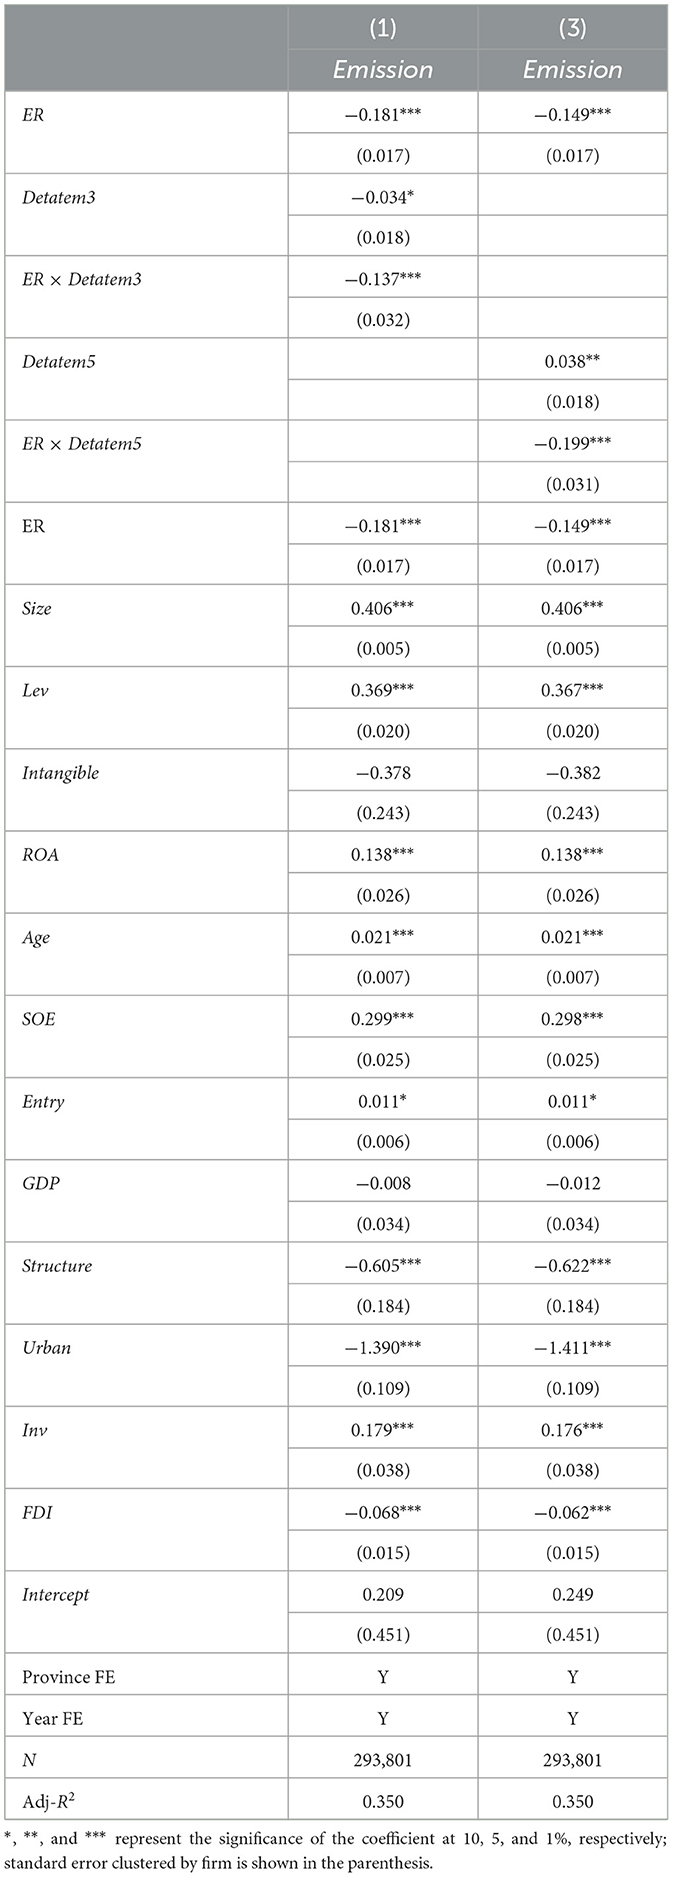
The Scientific Outlook on Development has had a profound effect on China's economic growth by emphasizing the importance of environmental protection in evaluating local governments' performance. Consequently, local officers generally implement stronger environmental regulations to reduce pollutant emissions from firms. Additionally, local fiscal authorities are responsible for assessing environmental damage and developing various environmental prevention measures. We investigated how the strength of local environmental regulations affects the reduction of SO2 emissions caused by climate change. According to previous research, the strength of environmental regulations can be assessed by evaluating investments in addressing regional environmental pollution at the provincial level (Berman and Bui, 2001). Specifically, we identified the median value among all provinces per year, and samples above the median value indicated that the firms' location is subject to stringent environmental regulations. We used an indicator variable, ER, that equals 1 if regulations are stringent or 0 otherwise.
Table 10 shows that the interaction terms ER × Detatem3 and ER × Detatem5 were negative at the 1% significance level. The more stringent the environmental regulations, the greater the reduction in SO2 emissions due to climate change.
5.2.2. Boundary effect of local governments' environmental regulations
Local governments are limited in their ability to enforce environmental regulations. First, fierce competition among local governments in the same rank aggravates their short-sighted behaviors and makes them prefer beggar-thy-neighbor policies that only benefit them and undermine neighboring provinces (Li and Zhou, 2005). Second, there is an information asymmetry between local and central governments, aggravating local governments' opportunistic behaviors (Piotroski et al., 2015). Economic growth and environmental protection are two major factors determining local government officials' likelihood of promotion. However, the inherent contradiction between economic and environmental indicators is difficult to mediate (Acemoglu et al., 2011).
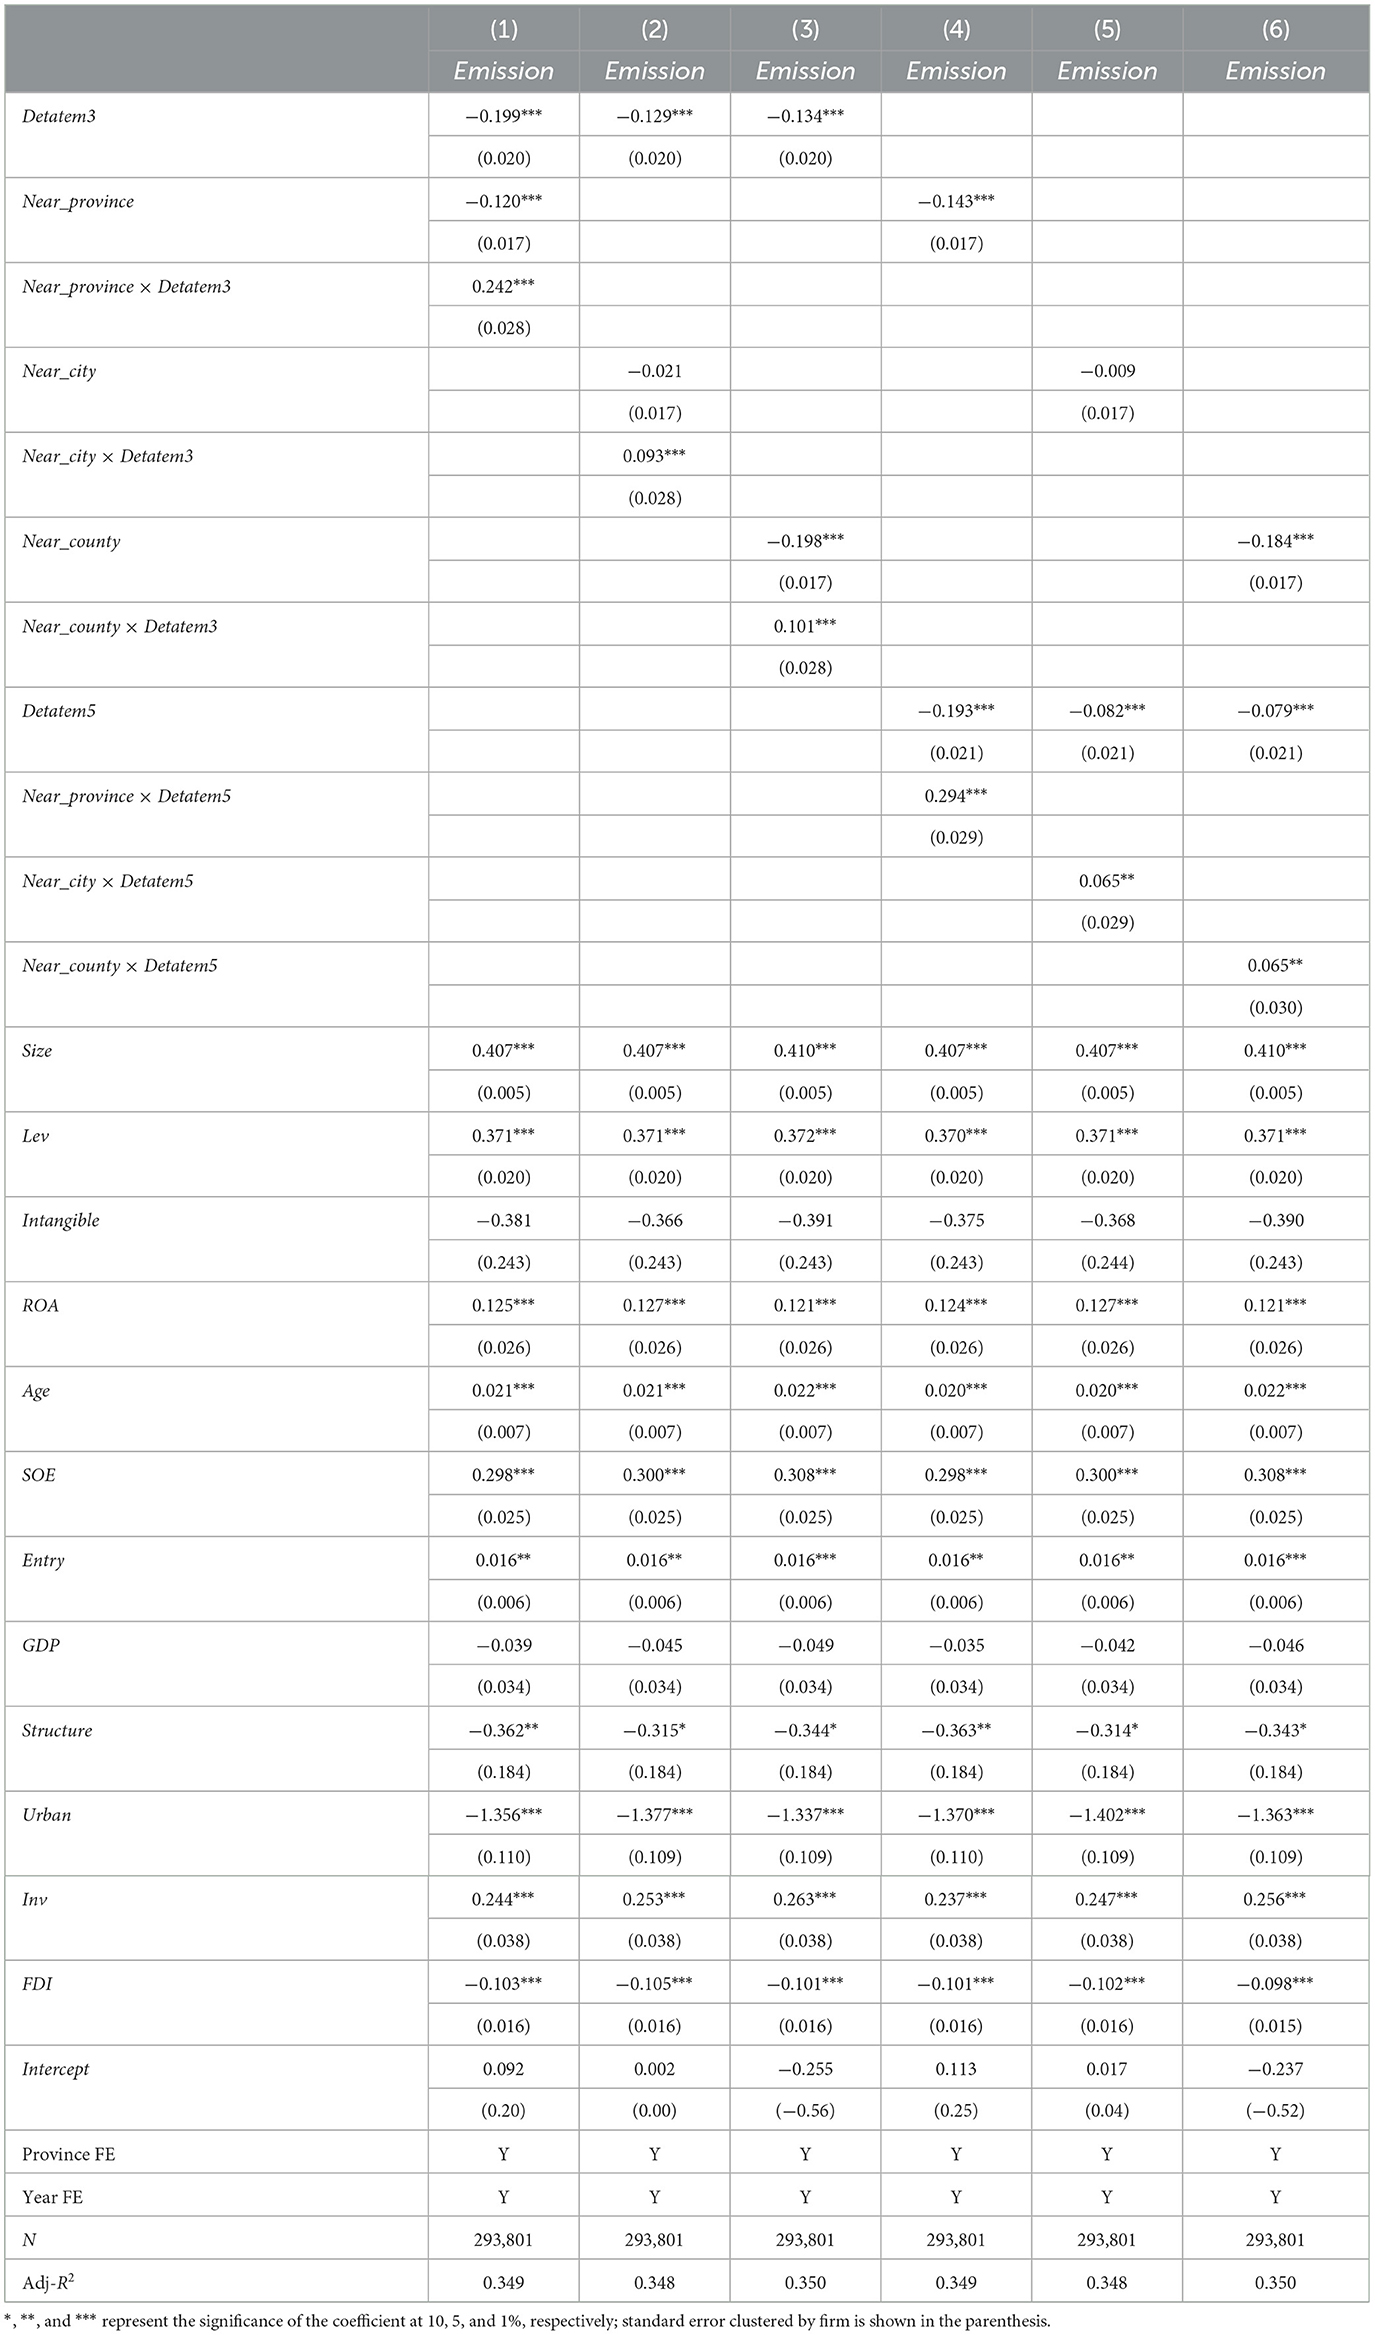
Previous studies found that local governments improve local economic indicators at the cost of the welfare of surrounding areas, especially along provincial boundaries (Sigman, 2005). However, pollutants are mobile and diffusive (Akey and Appel, 2021). Pollutants released at the boundaries of administrative regions spread to other areas through the air, water, and other channels, resulting in the spillover effects of pollution. Economic figures and tax benefits generated by polluting firms are captured by local governments, while environmental governance costs spill over to other administrative regions. Therefore, to improve their own economic indicators and disperse environmental costs, local governments tend to strengthen environmental regulations on firms located far from the borders and relax environmental regulations on firms located close to the borders. We first identified the latitude and longitude of the firms based on the Baidu map and calculated their geographical distance to the nearest provincial border. We then identified whether the firms were closer to the province, city, or county border. Firms closer to the border, that is, whose distance from the border is below the median of all firms in the same region, were subject to fewer local government environmental regulations. Near_province, Near_city, and Near_county were 1 if the firms were near the border or 0 otherwise.
The results shown in Table 11 confirm our inference. At the provincial boundary level, the coefficients of interaction terms Near_province × Detatem3 and Near_province × Detatem5 in columns (1) and (4) were significantly positive at the 1% level. Moreover, the sum of Near_province × Detatem5 and Near_province was positive, indicating that climate change has a positive influence on firms' SO2 emissions when they are near the provincial boundary. These firms emit more SO2 compared to firms that are far from the province boundary. The results are also supported by the evidence at the city and county levels of boundaries where the coefficients for Near_city × Detatem3, Near_city × Detatem5, Near_county × Detatem3, and Near_county × Detatem5 were significantly positive at the 1% level.
6. Additional tests: Emission reduction efforts
Is environmental protection detrimental or beneficial to firms' competitiveness? The relationship between environmental protection and economic growth indicates that environmental regulations and firms' efforts to reduce pollutants have two aspects. Rugman and Verbeke (1998) proposed an analytical framework for understanding how firms mitigate environmental risks and comply with regulations. From a conflict viewpoint, environmental risks and regulations may restrict firms' competitiveness, leading to a trade-off between economic growth and environmental protection (Clarkson et al., 2004). The static conflict view suggests that firms only passively mitigate environmental risks and comply with regulations, which makes it difficult to identify and capture potential green development opportunities (Gray and Shadbegian, 2003). However, the dynamic conflict view suggests that firms implement measures actively to reduce the negative impact of environmental risks and regulations on economic performance, but they do not commit to green development (Walley, 1994). As the concept of “green development” has become the consensus of all members of society, the possibility that environmental regulations and economic performance complement each other has attracted wider attention (Buysse and Verbeke, 2003). According to the static coordination view, firms proactively invest in environmental protection to simultaneously protect the environment and maintain their own economic interests. According to the dynamic coordination view, a compensation effect occurs when firms are devoted to green innovation by reducing negative externalities. Through green innovation, firms create unique green competitive advantages and generate additional economic benefits, leading to environmental risks and regulations (Porter and Linde, 1995). Based on the aforementioned four different views, Rugman and Verbeke (1998) believe that environmental risks and regulations have various impacts on firms. Examining the measures that managers implement to cope with environmental risks and regulations can clarify whether environmental protection and economic performance are complementary or incompatible.
According to previous studies, to address climate change and environmental regulation pressure, firms implement measures such as constraining pollution productivity processes (e.g., directly reducing input and pollutant emission) and implementing “end-of-pipe” interventions (e.g., purchasing environmental protection equipment to achieve terminal control of pollutant emission) (He et al., 2020). Clarke et al. (1994) believe that firms facing environmental problems (e.g., climate change) and regulatory pressure need a breakthrough in product and technology innovation rather than passively accepting these challenges. Green innovation can create a harmonious coexistence between environmental protection and economic growth for firms (Brown et al., 2022) and can be incorporated into the production process. Firms' green technology advantage creates barriers to entry, which helps firms maintain green market competitiveness and drives them to produce new green kinetics for continuous development (Acemoglu et al., 2011).
In this study, we explored how firms approach environmental protection measures in the face of climate change and environmental regulations. Drawing on previous research such as that by Acemoglu et al. (2011) and He et al. (2020), we identified three strategies that firms devise to reduce pollution. First, firms should aim to reduce the input of production factors that contribute to pollution. This involves measures such as shortening the production process and reducing energy consumption, which, in turn, reduces the emission of toxic SO2. Second, through “end-of-pipe” interventions, firms should invest in environmental protection equipment and expand the capacity of their equipment to deal with waste. Finally, firms should invest in green innovation to develop more green patents.
6.1. Reducing pollutive productivity process
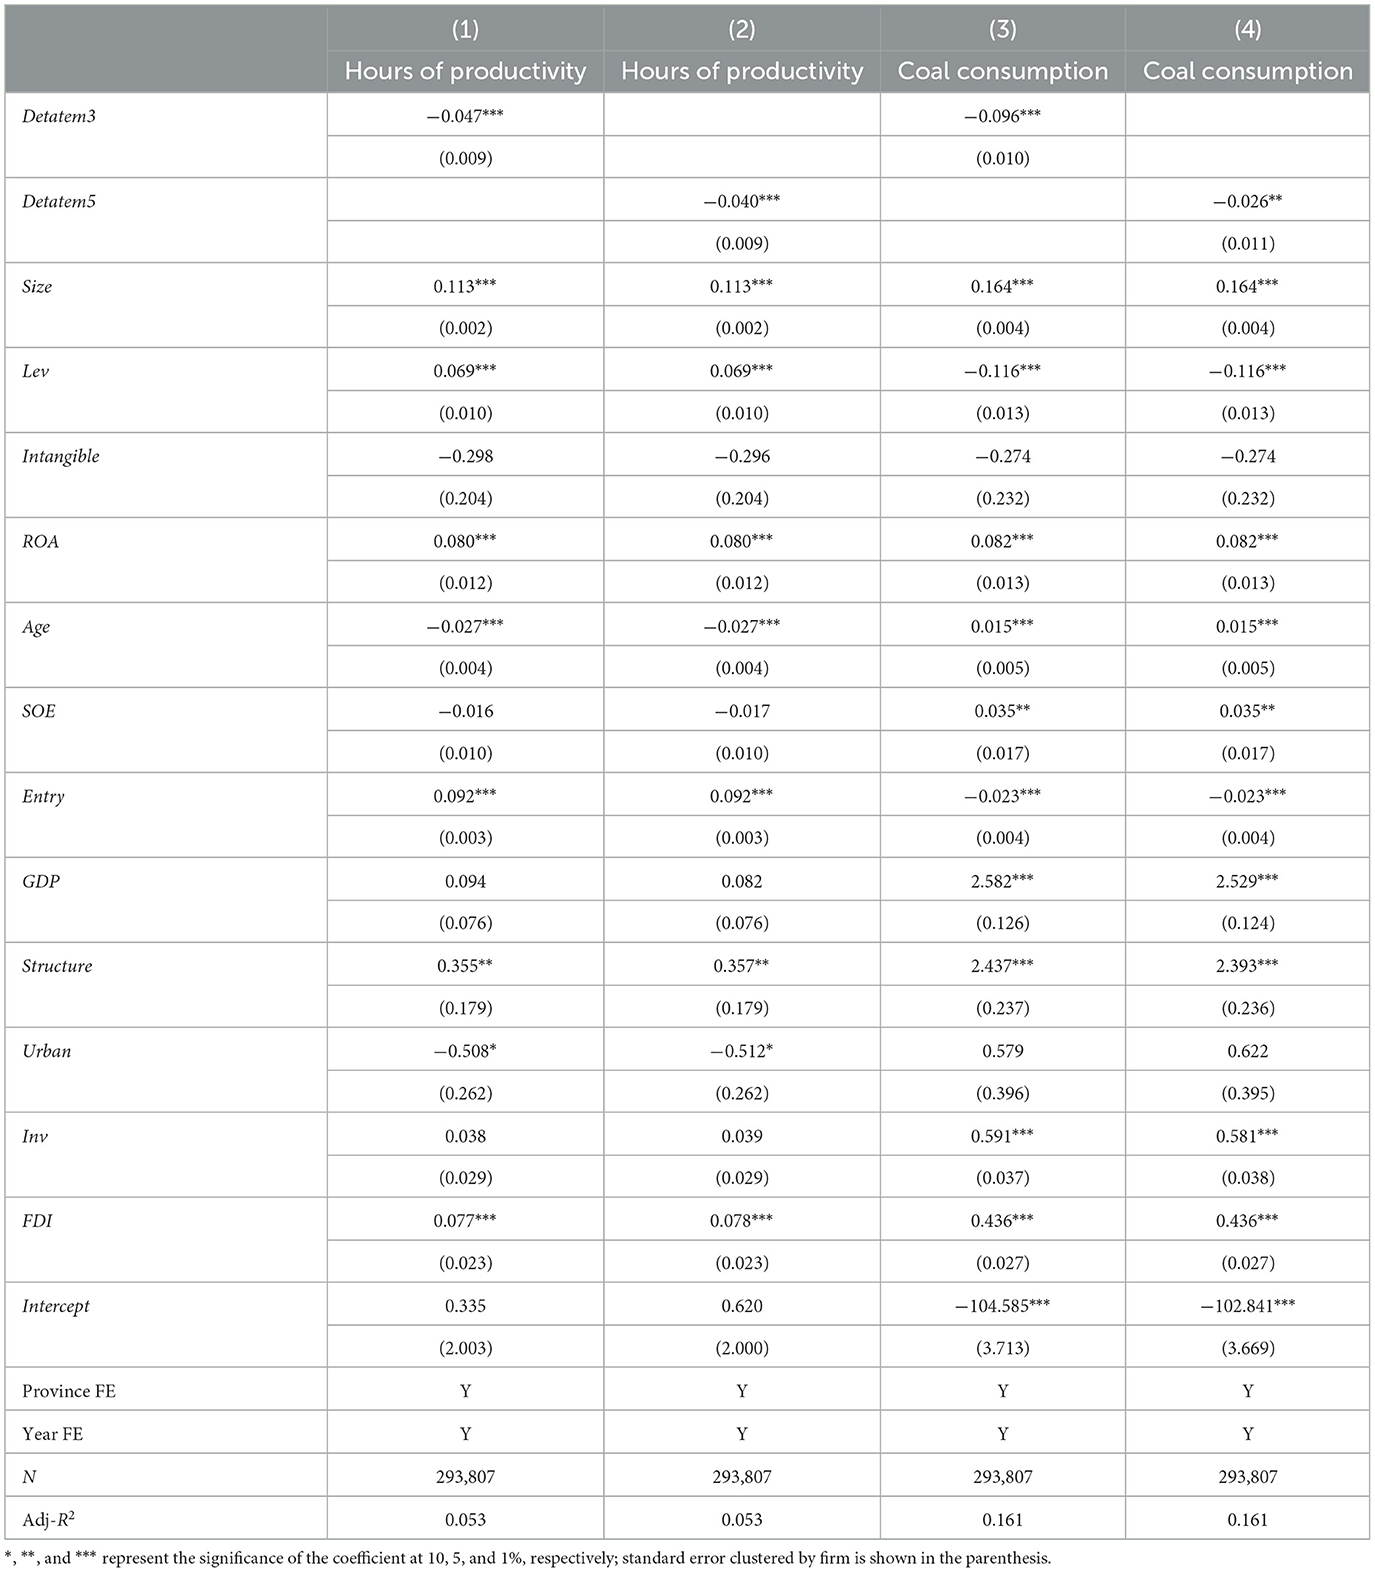
Table 12 shows how climate change helps firms reduce pollution by reducing production factor inputs. Columns (1) and (2) used the natural logarithm of the enterprise's annual production hours as the dependent variable. Columns (3) and (4) used the natural logarithm of firms' annual coal tonnage as the dependent variable. The results showed that the coefficients of Detatem3 and Detatem5 were all significantly negative, indicating that the greater the climate change, the fewer the annual production hours of firms and the energy consumption of coal. Therefore, the results confirmed that firms generally address climate change and environmental regulations by reducing the input of production factors in the productivity process.
6.2. Investing in the improvement of the ability to reduce pollutant emissions
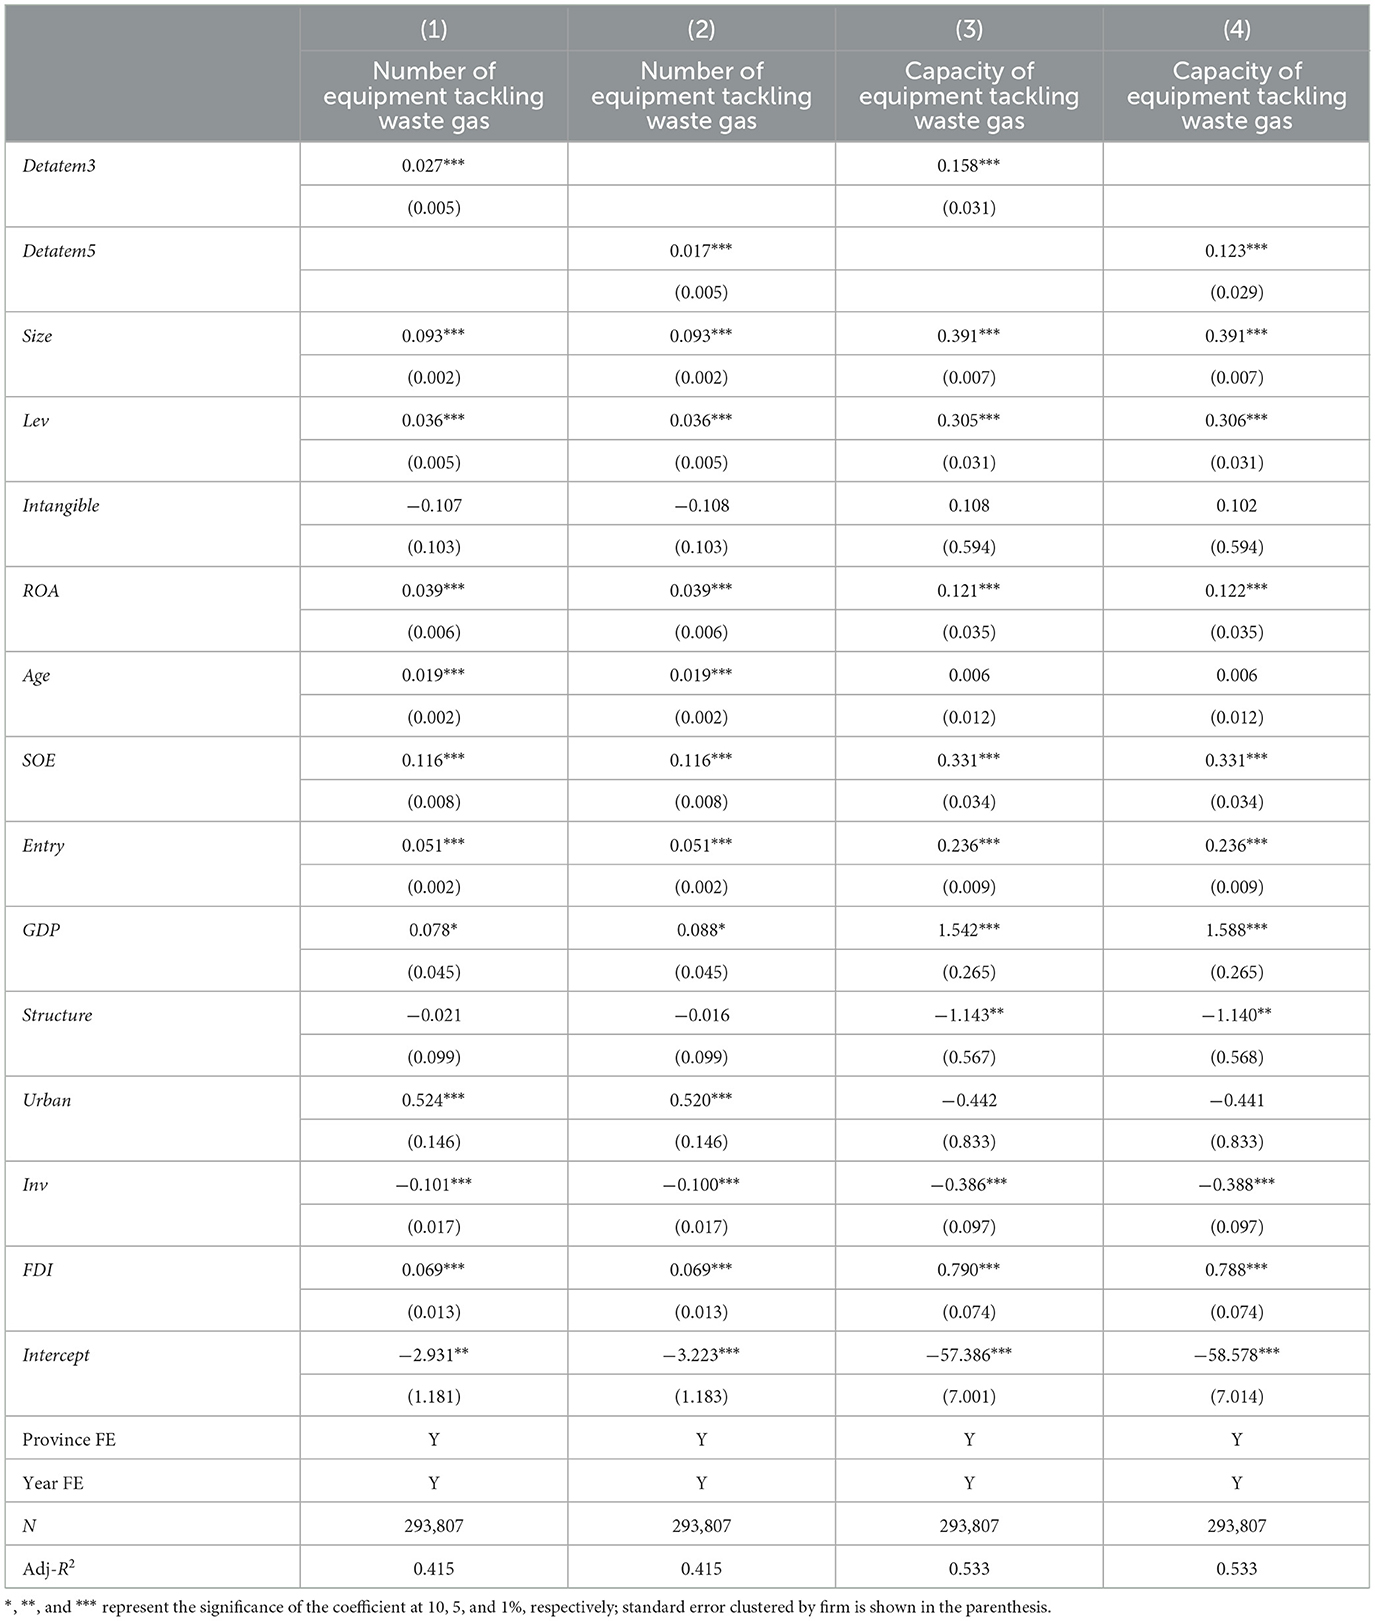
Table 13 shows whether firms adopted the end-of-pipe intervention strategy by investing in environmental protection equipment to reduce contaminant emissions in the face of climate change. The dependent variable in columns (1) and (2) was the natural logarithm of the number of environmental protection equipment of the firm. The independent variable in columns (3) and (4) was the unit capacity of the environmental protection equipment to tackle contaminants, which is the unit indicator of the end-of-pipe intervention. The results showed that the coefficients of climate change are significantly positive, suggesting that firms increased their environmental protection investments, including purchasing equipment and improving their capacity, to reduce emissions as climate change intensifies.
6.3. Green innovation
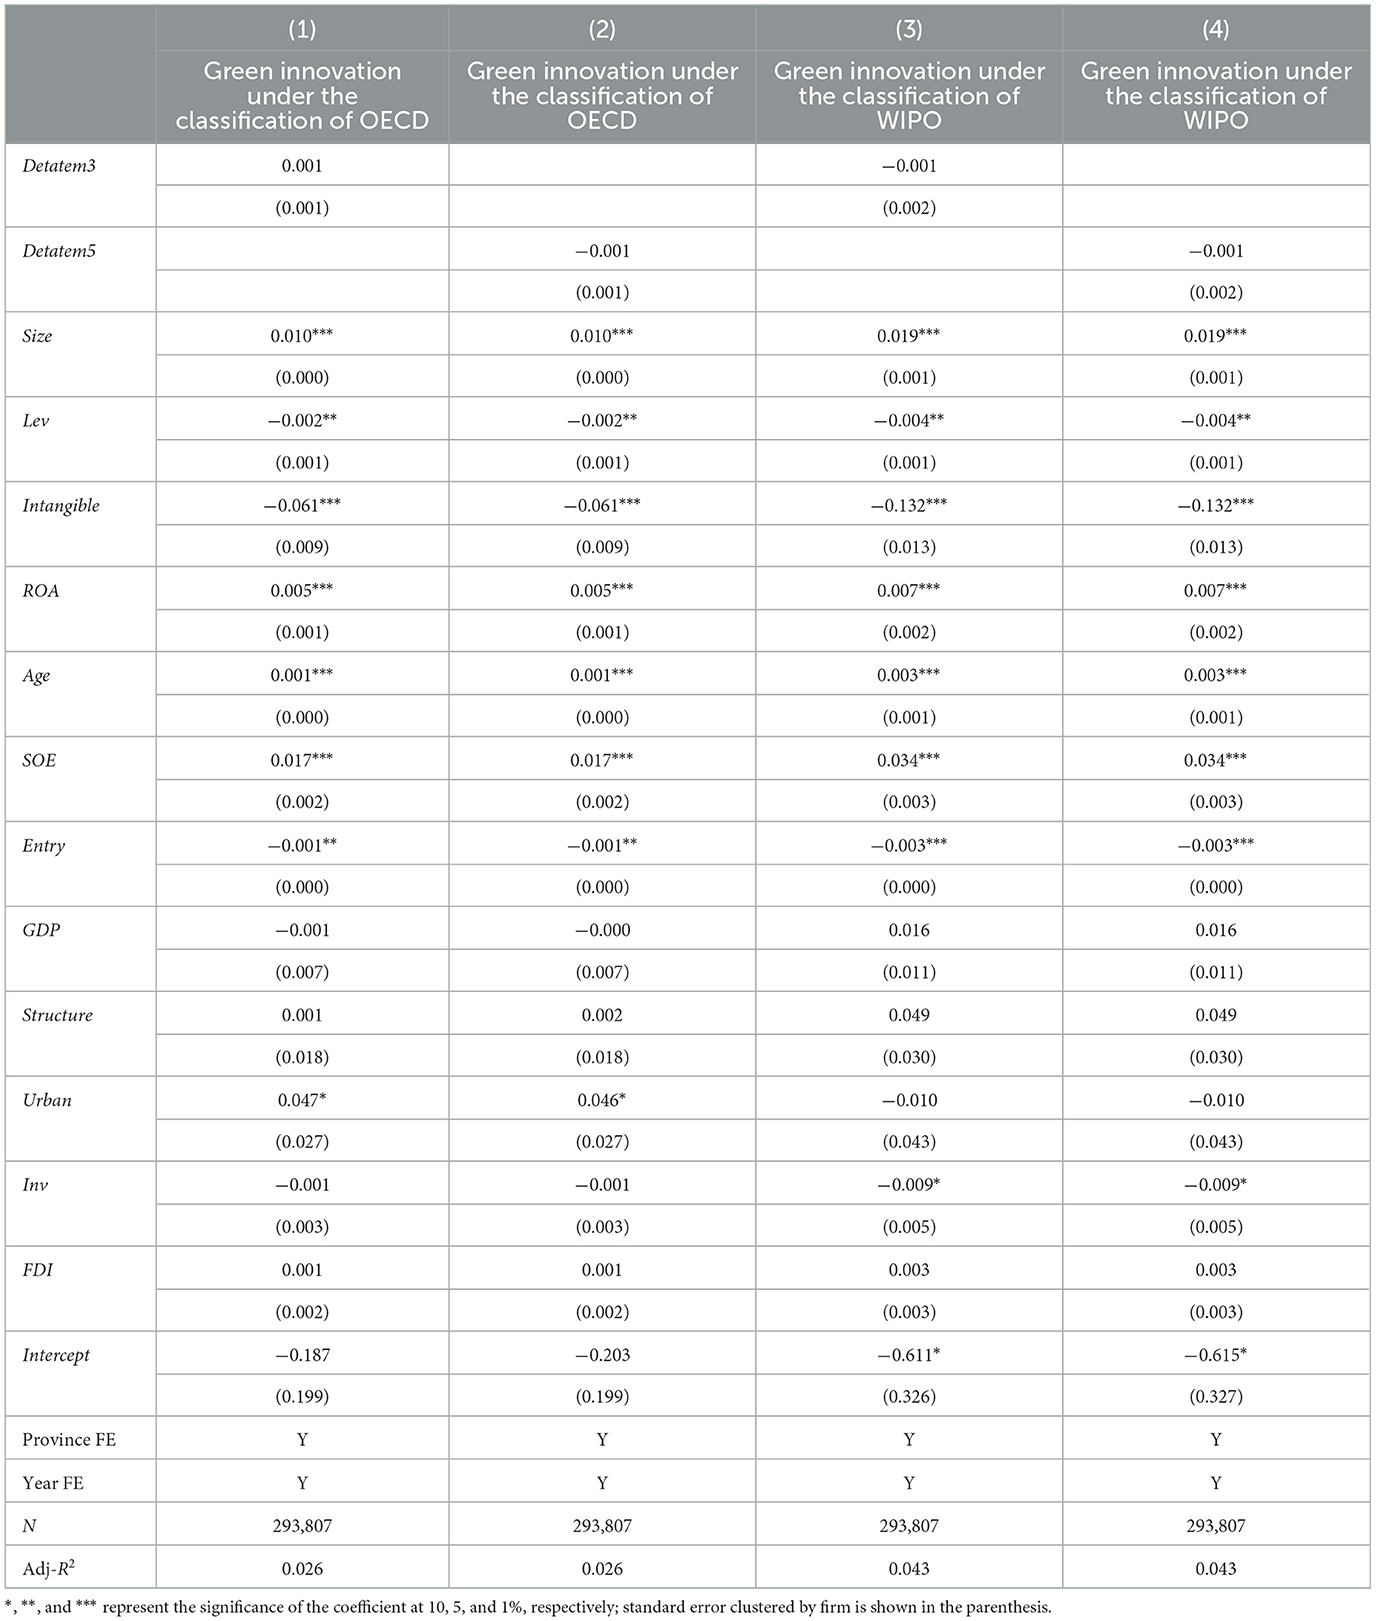
The existing studies used the number of patents successfully applied for by firms in the current year as the measurement of innovation capability; that is, the applications applied for by firms in the current year are eventually approved in the future (Moshirian et al., 2021). Following this approach, we used an authoritative list to identify green patents and then examined whether firms successfully innovate more green patents in the face of climate change. The WIPO and OECD have put forward lists identifying whether a patent is green. The WIPO green patent list is based on the patent's IPC, while the OECD green patent list is based on both the patent's IPC and Communist Party of China classification. However, China's patent system only adopts the IPC number of CSIPO. Therefore, this study followed the recommendations by Cohen et al. (2020) and adopted the IPC number in the green patent classification of the OECD.
We manually collected the IPC number from green patent classification lists issued by WIPO and OECD and then searched for the IPC classification of each enterprise's patent from the CSIPO website. We matched the aforementioned three datasets to identify whether a given patent was green and then examined whether it was authorized by CSIPO. We retained green patents applied for by firms in the current year and eventually granted them in future years under two sets of green patent classification criteria. We summarized them at the firm-year level and transferred them to one plus the natural logarithm. However, we did not find any evidence that climate change improves firms' green innovation. Table 14 shows that the coefficients of Detatem3 and Detatem5 were insignificant.
The results in Tables 12–14 showed that, faced with climate change and environmental regulatory pressures, firms resort to reducing factor input and expanding investment in environmental protection rather than actively engaging in green innovation to achieve technological breakthroughs. Our findings are similar to those of Cohen and Zarowin (2010) and Liu et al. (2021), who found that, when facing pressure, firms tend to prioritize short-term gains over long-term benefits.
7. Discussion and conclusion
7.1. Discussion
This study examined the impact of climate change on firms' pollutant emissions in China. Climate change raises awareness among the public and government regarding environmental problems. China's environmental regulations are led by the central government, while local governments implement the central government's guidelines. Since environmental problems have become a important factor for local politicians to advance in their careers, the government has mandated that firms adhere to environmental regulations to avoid being outvoted. Therefore, firms have been compelled to reduce pollutant emissions to avoid incurring social and political costs and to maintain their relationships with local governments.
This study contributes to the existing literature in the following ways: First, this study bridges the gap in the literature regarding the effect of climate change on firm behavior. Prior research mainly focused on the adverse effects of climate change on firms' behavior, such as reduced productivity (Fu et al., 2021), lower stock market returns (Bolton and Kacperczyk, 2021), altered asset pricing (Barnett et al., 2020), and changes in investment decisions (Pástor et al., 2021). However, there was little research on how climate change affects firms' green efforts. Therefore, using temperature data, environmental regulations, and firms' pollutant emissions in China, we examined whether firms facing climate change would undertake positive actions to adopt more sustainable practices or “go green.”
Second, we determined how environmental regulations affect firms' environmental protection behavior. Unlike the voting system in developed countries, the pressure of championship (Li and Zhou, 2005) and supervision of the central government (Piotroski et al., 2015) motivate Chinese local government officials to constrain pollutant emissions to ensure the success of their political careers (He et al., 2020; Liu et al., 2021). We also discovered that environmental regulations enforced by both central and local governments affect the pollutant emissions of firms when they are confronted with the challenges of addressing climate change.
Finally, we clarified whether environmental considerations and economic goals are complementary or incompatible (Rugman and Verbeke, 1998). We also expanded on the research of He et al. (2020) by investigating which approach to environmental protection is most effective under the pressure of climate change and environmental regulations. These approaches include direct reduction of pollutive productivity and energy consumption, implementing “end-of-pipe” interventions such as purchasing environmental protection equipment (He et al., 2020) and promoting green innovation (Acemoglu et al., 2011).
7.2. Conclusion
Our results revealed that firms in China reduce pollutant emissions because of climate change, an action that is motivated by political pressure. Cross-sectional tests indicated that in areas with “Two control zones” established by the central government and in areas where local governments enforce more stringent environmental regulations, firms are more effective in reducing pollutant emissions when faced with climate change. Furthermore, firms reduce pollutant emissions by limiting productivity and implementing end-of-pipe interventions. However, there was no evidence to suggest that climate change enhances firms' green innovation. These results indicated that, although firms in China actively decrease pollutant emissions due to political pressure from climate change and environmental regulations, this phenomenon is driven by production factors and investments rather than innovation, which reflects conflicting views on the environment and economy.
This study has two practical implications. First, the government should encourage firms to play an active role in addressing climate change. Environmental regulations are an important factor in internalizing pollution externalities and guiding enterprises to actively reduce their pollutant emissions. In addition, the government should implement a more intensive and accurate national environmental pollution monitoring system to monitor the pollutant emissions from enterprises in a timely manner and ensure that they take primary responsibility for pollution control. Furthermore, the central government should actively implement measures to eliminate cross-boundary pollution, compensate for the limitations of local governments in implementing environmental regulation policies, and increase punishment for cross-boundary pollution. In addition, the concept of green development should be actively promoted to both firms and the public to reach a consensus on green development in society.
Second, when evaluating the effectiveness of firms' environmental governance and emission reduction efforts, the government should provide greater incentives for innovative approaches to achieving environmental protection goals. In China, firms' environmental protection and pollutant reduction efforts are almost entirely driven by restrictions. Considering that the conflict between environmental protection and economic growth seems to be unavoidable (Nordhaus, 2019), firms tend to prioritize their short-term benefits over long-term benefits (Cohen and Zarowin, 2010; Liu et al., 2021). Additionally, innovation is viewed as risky, requires massive input, and is time consuming (Moshirian et al., 2021). As such, firms choose to invest more in environmental protection equipment instead of engaging in green innovation. The government should incentivize firms to engage in green innovation to create a win-win situation for economic growth and environmental protection.
The government should also promote cooperation between public and private capital in green innovation projects. Moreover, the government can provide appropriate services to help firms overcome challenges that arise during green innovation processes, such as by providing information and knowledge resources.
Data availability statement
The original contributions presented in the study are included in the article/supplementary material, further inquiries can be directed to the corresponding author.
Author contributions
ZX: conceptualization, methodology, software, and the writing of the manuscript. CC: substantially revised the article and polished the language of the latest manuscript. LW: wrote part of the manuscript. YM: prepared the original data for key variables and prepared the original draft. All authors contributed to the article and approved the submitted version.
Acknowledgments
We would like to express our gratitude for the valuable feedback provided by the editors and reviewers, which has greatly contributed to the quality improvement of our research and the Fundamental Research Funds for the Central University (Grant No. 2662020JGQD001).
Conflict of interest
YM was employed by Qingdao Qianwan Container Terminal Co., Ltd. The remaining authors declare that the research was conducted in the absence of any commercial or financial relationships that could be construed as a potential conflict of interest.
Publisher's note
All claims expressed in this article are solely those of the authors and do not necessarily represent those of their affiliated organizations, or those of the publisher, the editors and the reviewers. Any product that may be evaluated in this article, or claim that may be made by its manufacturer, is not guaranteed or endorsed by the publisher.
Footnotes
1. ^Refer to the China State Council website here: http://www.gov.cn/gongbao/content/2006/content_169993.htm.
2. ^China State Council has proposed Opinions of The State Council on Strengthening Key Work of Environmental Protection in 2011. The action requires “One vote against” for politicians of local governments.
3. ^Refer to the China State Council website here: http://www.gov.cn/gongbao/content/2006/content_169993.htm.
4. ^The two control zones policy ended in 2015, which did not fall in our sample period.
5. ^Because of a lack of data, we could not obtain data on carbon dioxide emission at the firm level. China's disclosure regulations on carbon emissions were weak, especially for the unlisted firms (Chen et al., 2017).
References
Acemoglu, D., Aghion, P., Bursztyn, L., and Hemous, D. (2011). The environment and directed technical change. Am. Econ. Rev. 102, 131–166. doi: 10.2139/ssrn.1668575
Acemoglu, D., and Robinson, J. A. (2013). Economics versus politics: pitfalls of policy advice. J. Econ. Perspect. 27, 173–192. doi: 10.1257/jep.27.2.173
Aghion, P., Harris, C., Howitt, P., and Vickers, J. (2001). Competition, imitation and growth with step-by-step innovation. Rev. Econ. Stud. 68, 467–492. doi: 10.1111/1467-937X.00177
Akey, P., and Appel, I. (2021). The limits of limited liability: evidence from industrial pollution. J. Finan. 76, 5–55. doi: 10.1111/jofi.12978
Allen, F., Qian, J., and Qian, M. (2005). Law, finance, and economic growth in China. J. Financ. Econ. 77, 57–116. doi: 10.1016/j.jfineco.2004.06.010
Barnett, M., Brock, W., and Hansen, L. P. (2020). Pricing uncertainty induced by climate change. Rev. Finan. Stud. 33, 1024–1066.
Berman, E., and Bui, L. T. (2001). environmental regulation and productivity: evidence from oil refineries. Rev. Econ. Stat. 83, 498–510. doi: 10.1162/00346530152480144
Bernstein, A., Gustafson, M. T., and Lewis, R. (2019). Disaster on the horizon: the price effect of sea level rise. J. Financ. Econ. 134, 253–272. doi: 10.1016/j.jfineco.2019.03.013
Bolton, P., and Kacperczyk, M.. (2021). Do investors care about carbon risk? J. Finan. Econom. 142, 517–549.
Brandt, L., Biesebroeck, J., and Zhang, Y. (2009). Creative accounting or creative destruction? Firm-level productivity growth in Chinese manufacturing. J. Dev. Econ. 97, 339–351. doi: 10.1016/j.jdeveco.2011.02.002
Brown, J. R., Martinsson, G., and Thomann, C. (2022). Can environmental policy encourage technical change? Emissions taxes and R&D investment in polluting firms. Rev. Finan. Stud. 35, 4518–4560. doi: 10.1093/rfs/hhac003
Buchanan, J. M. (1983). Rent seeking, noncompensated transfers, and laws of succession. J. Law Econ. 26, 71–85. doi: 10.1086/467026
Buysse, K., and Verbeke, A. (2003). Proactive environmental strategies: a stakeholder management perspective. Strat. Manag. J. 24, 453–470. doi: 10.1002/smj.299
Chen, D., Kim, J., Li, O. Z., and Liang, S. (2018). China's closed pyramidal managerial labor market and the stock price crash risk. Account. Rev. 93, 105–131. doi: 10.2308/accr-51867
Chen, Y. C., Hung, M., and Wang, Y. (2017). The effect of mandatory csr disclosure on firm profitability and social externalities: evidence from China. Soc. Sci. Electron. Publ. 65, 169–190. doi: 10.1016/j.jacceco.2017.11.009
Clarke, R. A., Stavins, R. N., Greeno, J. L., Bavaria, J. L., Cairncross, F., Esty, D. C., et al. (1994). The challenge of going green. Harv. Bus. Rev. 72, 37–48.
Clarkson, P. M., Li, Y., and Richardson, G. D. (2004). The market valuation of environmental capital expenditures by pulp and paper companies. Account. Rev. 79, 329–353. doi: 10.2308/accr.2004.79.2.329
Cohen, D. A., and Zarowin, P. (2010). Accrual-based and real earnings management activities around seasoned equity offerings. J. Account. Econ. 50, 2–19. doi: 10.1016/j.jacceco.2010.01.002
Cohen, L., Gurun, U., and Nguyen, Q. H. (2020). “The Esg-innovation disconnect: evidence from green patenting,” in Ssrn Working Paper.
Dell, M., Jones, B. F., and Olken, B. A. (2009). Temperature and income: reconciling new cross-sectional and panel estimates. Am. Econ. Rev. 99, 198–204. doi: 10.1257/aer.99.2.198
Dell, M., Jones, B. F., and Olken, B. A. (2012). Temperature shocks and economic growth: evidence from the last half century. Am. Econ. J. 4, 66–95. doi: 10.1257/mac.4.3.66
Deschenes, O., and Greenstone, M. (2007). The economic impacts of climate change: evidence from agricultural output and random fluctuations in weather: reply. Am. Econ. Rev. 97, 354–385. doi: 10.1257/aer.97.1.354
Dong, R., Fisman, R., Wang, Y., and Xu, N. (2021). Air pollution, affect, and forecasting bias: evidence from Chinese financial analysts. J. Financ. Econ. 139, 971–984. doi: 10.1016/j.jfineco.2019.12.004
Ebenstein, A. (2012). The consequences of industrialization: evidence from water pollution and digestive cancers in China. Rev. Econ. Stat. 94, 186–201. doi: 10.1162/REST_a_00150
Fu, S., Viard, V. B., and Zhang, P. (2021). Air pollution and manufacturing firm productivity: nationwide estimates for China. Econ. J. 131, 3241–3273. doi: 10.1093/ej/ueab033
Gray, W. B., and Shadbegian, R. J. (2003). Plant vintage, technology, and environmental regulation. J. Environ. Econ. Manage. 46, 384–402. doi: 10.1016/S0095-0696(03)00031-7
He, G., Wang, S., and Zhang, B. (2020). Watering down environmental regulation in China*. Q. J. Econ. 135, 2135–2185. doi: 10.1093/qje/qjaa024
Hsiang, S., Rising, J., Kopp, R., Jina, A., Delgado, M., Mohan, S., et al. (2017). Estimating economic damage from climate change in the United States. Science 356, 1362–1369. doi: 10.1126/science.aal4369
Ito, K., and Zhang, S. (2020). Willingness to pay for clean air: evidence from air purifier markets in China. J. Polit. Econ. 128, 1627–1672. doi: 10.1086/705554
Jaffe, A. B., Newell, R. G., and Stavins, R. N. (2002). Environmental policy and technological change. Environ. Resour. Econ. 22, 41–70. doi: 10.1023/A:1015519401088
Li, H., and Zhou, L. (2005). Political turnover and economic performance: the incentive role of personnel control in China. J. Public Econ. 89, 1743–1762. doi: 10.1016/j.jpubeco.2004.06.009
Liu, Z., Shen, H., Welker, M., Zhang, N., and Zhao, Y. (2021). Gone with the wind: an externality of earnings pressure. J. Account. Econ. 72, 101403. doi: 10.1016/j.jacceco.2021.101403
Montzka, S. A., Dlugokencky, E. J., and Butler, J. H. (2011). Non-Co2 greenhouse gases and climate change. Nature 476, 43–50. doi: 10.1038/nature10322
Moshirian, F., Tian, X., Zhang, B., and Zhang, W. (2021). Stock market liberalization and innovation. J. Financ. Econ. 139, 985–1014. doi: 10.1016/j.jfineco.2020.08.018
Nordhaus, W. (2019). Climate change: the ultimate challenge for economics. Am. Econ. Rev. 109, 1991–2014. doi: 10.1257/aer.109.6.1991
Pástor, L., Stambaugh, R. F., and Taylor, L. A. (2021). Sustainable investing in equilibrium. J. Finan. Econom. 142, 550–571.
Piotroski, J. D., Wong, T. J., and Zhang, T. (2015). Political incentives to suppress negative information: evidence from Chinese listed firms. J. Account. Res. 53, 405–459. doi: 10.1111/1475-679X.12071
Porter, M., and Linde, C. (1995). Toward a new conception of the environment-competitiveness relationship. J. Econ. Perspect. 9, 97–118. doi: 10.1257/jep.9.4.97
Rugman, A. M., and Verbeke, A. (1998). Corporate strategies and environmental regulations: an organizing framework. Strat. Manag. J. 19, 363–375. doi: 10.1002/(SICI)1097-0266(199804)19:4<363::AID-SMJ974>3.0.CO;2-H
Sigman, H. (2005). Transboundary spillovers and decentralization of environmental policies. J. Environ. Econ. Manage. 50, 82–101. doi: 10.1016/j.jeem.2004.10.001
Tang, T., Mo, P., and Chan, K. H. (2017). Tax collector or tax avoider? An investigation of intergovernmental agency conflicts. Account. Rev. 92, 247–270. doi: 10.2308/accr-51526
Keywords: climate change, environmental regulation, pollutant emission, factor input of productivity process, end of pipe intervention, green innovation
Citation: Xiao Z, Cai C, Wang L and Ma Y (2023) Climate change, environmental regulations, and firms' efforts to reduce pollutant emissions. Front. Ecol. Evol. 11:1050642. doi: 10.3389/fevo.2023.1050642
Received: 22 September 2022; Accepted: 20 February 2023;
Published: 22 March 2023.
Edited by:
Ruidong Chang, University of Adelaide, AustraliaReviewed by:
Jiaying Peng, Hunan Agricultural University, ChinaBeibei Niu, Shandong Agricultural University, China
Copyright © 2023 Xiao, Cai, Wang and Ma. This is an open-access article distributed under the terms of the Creative Commons Attribution License (CC BY). The use, distribution or reproduction in other forums is permitted, provided the original author(s) and the copyright owner(s) are credited and that the original publication in this journal is cited, in accordance with accepted academic practice. No use, distribution or reproduction is permitted which does not comply with these terms.
*Correspondence: Cheng Cai, Y2FpY3NtaWxlQGhidWUuZWR1LmNu
 Zehua Xiao
 Cheng Cai
 Lumeng Wang4