 John L. Berini
 Bryan Runck
 Jody Vogeler
 David L. Fox
 James D. Forester
- 1Department of Biology, Carleton College, Northfield, MN, United States
- 2Department of Fisheries, Wildlife, and Conservation Biology, University of Minnesota, Minneapolis, MN, United States
- 3GEMS Informatics Center, University of Minnesota, Minneapolis, MN, United States
- 4Natural Resource Ecology Laboratory, Colorado State University, Fort Collins, CO, United States
- 5Department of Earth and Environmental Sciences, University of Minnesota, Minneapolis, MN, United States
- 6Institute on the Environment, University of Minnesota, 325 Learning and Environmental Sciences, Minneapolis, MN, United States
Contemporary methods used to predict isotopic variation at regional scales have yet to include underlying distributions of the abundance of isotopic substrates. Additionally, traditional kriging methods fail to account for the potential influences of environmental grouping factors (i.e., random effects) that may reduce prediction error. We aim to improve upon traditional isoscape modeling techniques by accounting for variation in the abundances of isotopic substrates and evaluating the efficacy of a mixed-effects, regression kriging approach. We analyzed common moose forage from northeast Minnesota for δ13C and δ15N and estimated the isotopic landscape using regression kriging, both with and without random effects. We then compared these predictions to isoscape estimates informed by spatial variation in above-ground biomass. Finally, we kriged the regression residuals of our best-fitting models, added them to our isoscape predictions, and compared model performance using spatial hold-one-out cross validation. Isoscape predictions driven by uninformed and biomass-informed models varied by as much as 10‰. Compared to traditional methods, incorporating biomass estimates improved RMSE values by as much as 0.12 and 1.00% for δ13C and δ15N, respectively, while random effects improved r2 values by as much as 0.15 for δ13C and 0.87 for δ15N. Our findings illustrate how field-collected data, ancillary geospatial data, and novel spatial interpolation techniques can be used to more accurately estimate the isotopic landscape. Regression kriging using mixed-effects models and the refinement of model predictions using measures of abundance, provides a flexible, yet mechanistically driven approach to modeling isotopic variation across space.
Introduction
Understanding how animals interact with their environment, specifically where they go and what they eat, is foundational to the fields of ecology and animal behavior (Kingsland, 1991; Owen-Smith et al., 2010). One way to study animal behavior is by using stable isotope analysis, which has become increasingly common in studies of animal movement and foraging (Cerling et al., 2006). A major advantage of using stable isotope analysis over other methods is its flexibility in allowing us to reconstruct ecological processes and activities without witnessing them firsthand (West et al., 2006). For example, the isotopic signatures of plants are reflected in the biogenic materials of the herbivores that consume them, and as a result, we can determine not only what an herbivore ate and where it went, but also why it may have gone there (Cerling et al., 2006; Raynor et al., 2016). Additionally, spatial variation of stable isotope ratios, often referred to as isotopic landscapes or isoscapes (West et al., 2009), has become increasingly valuable in our efforts to gain a better understanding of various aspects of organismal behavior and ecology. For example, using marine isoscapes of δ15N and δ13C in conjunction with isotopes from the hair of recently weaned elephant seal pups, one study was able to observe niche partitioning and thus the seasonal feeding grounds of lactating and pregnant females (Aurioles et al., 2006). Additionally, spatiotemporal variation in stable isotopes of strontium (87Sr/86Sr) has been used to evaluate shifts in the geographic ranges of caribou herds in North America, and ultimately, the causes of their precipitous decline throughout parts of their historical range (Miller et al., 2021). As the number and diversity of studies utilizing isoscapes increases, our ability to predict heterogeneity precisely and accurately in the isotopic landscape will continue to improve as will our ability to use isoscapes as inferential ecological tools.
To model isotopic variation at large spatial scales, it is essential first to predict spatial variation in the abundances of different isotopic substrates used to estimate this variation (if two or more substrates differ in their isotopic composition). For example, C3 and C4 plants have distinct δ13C signatures, and thus, the relative abundances of these two functional groups are important to consider when predicting spatial variation of δ13C values (aggregated across functional groups) at regional to continental scales (Still and Powell, 2010). However, estimating geographic variation of δ13C values at smaller spatial scales (i.e., within a single functional group or species) is more complicated, due in part to the intensive sampling required to establish relationships between δ13C values and environmental covariates. Although early studies of isotopic variation in plants were unable to find significant differences in δ13C among plant taxa (Craig, 1953), more recent work has identified differences in the isotopic composition both within and among plant species (Garten and Taylor, 1992; Marshall et al., 2007). Royle and Rubenstein (2004) noted that geographic variation in species abundance is an important consideration when spatial variation in the isotopic landscape is highly non-uniform. Although their work focused on properly assigning the geographic origin of birds based on δD and δ13C values, many of the arguments they make for incorporating spatial variation in species abundance into isoscape models are broadly applicable. Nevertheless, models depicting isotopic heterogeneity across space have yet to include variation in the abundance of different taxonomic or functional groups. Here, for the first time, we use spatial variation in plant biomass, both across and within species, to create “biomass-informed” models of the isotopic landscape for δ13C and δ15N.
Traditionally, models depicting geographic variation in stable isotopes have relied on isotopic data derived from sampled locations, while locations without measurements were filled in via methods of spatial interpolation (Bowen and Wilkinson, 2002). However, the need to estimate error in isoscape models has led to the development of new geospatial modeling techniques (Bowen and Revenaugh, 2003). For example, regression kriging, which uses regression models to inform the kriging process, is now commonly used to inform spatial interpolation, thereby allowing researchers to estimate and potentially minimize prediction error by also kriging regression residuals (Bowen and Wilkinson, 2002; Hengl et al., 2007; Keskin and Grunwald, 2018). Moreover, increased access to high-resolution spatial data has allowed for prediction of isotopic variation at higher resolutions over limited spatial extents (e.g., field-scale; Hellmann et al., 2016). With recent advancements, opportunities now exist to develop mechanistic isoscape models that have even greater accuracy and precision, thereby conferring a deeper understanding of how and why stable isotopes vary across space.
When estimating the isotopic landscape, currently employed methods often fail to account for the potential effects of environmental variables that may influence model estimates. For example, δ13C in leaf tissue is known to vary as a function of canopy height, irradiance levels, and water-use efficiency (Ometto et al., 2006), all of which may be indirectly influenced by disturbance. Thus, by incorporating disturbance type as a random effect (i.e., categorical groups with consistent but unmeasured differences in environmental conditions that may contribute to model error), we are better able to identify meaningful fixed effects (i.e., measured predictor variables of interest) that might otherwise be obscured. Regression kriging that incorporates mixed-effects models (i.e., models incorporating both fixed and random effects) makes it possible for researchers to account for these unmeasured (and likely complicated) influences while also improving upon the prediction accuracy of currently employed methods.
As a case study, we used biomass-informed, mixed-effects models in a regression kriging framework to study how the isotopic composition of summer moose forage in northeast Minnesota changes across space and to test whether our method improves upon the accuracy of more traditional techniques. This study system provides a unique opportunity to test our novel method in a context that may also have conservation implications, as moose in this region have been declining since approximately 2005, with nutritional suppression suggested as a potential driver (Monteith et al., 2015; Wünschmann et al., 2015). Models estimating spatial variation in forage availability (i.e., biomass) can serve as a powerful tool in habitat improvement projects (Severud et al., 2019), while models estimating spatial variation in the isotopic landscape can be combined with animal movement data to provide insight into spatially explicit habitat use behavior (Found et al., 2022). Finally, while regression kriging with mixed-effects models has been applied to improve digital mapping of soil properties (Omuto and Vargas, 2015), to our knowledge this method has not previously been used to predict spatial variation in stable isotopes.
We use this approach to investigate four questions associated with the estimation of isotopic variation at the landscape scale. First, are different forage-preference groups isotopically distinct from one another (Q1) and second, are kriging predictions of the abundances of different preference groups distinct from one another and spatially heterogeneous (Q2)? Third, do mixed-effects models characterizing spatial variation in stable isotopes improve predictions over those created via simple linear models (Q3)? Finally, do biomass-informed isoscapes provide predictions that are distinct from those provided by uninformed isoscapes (i.e., isoscapes in which we assume equal abundance of all sampled species; Q4)? The answers to these questions will help refine our understanding of how stable isotopes vary across space and potentially, how to model this variation more accurately.
Materials and methods
Model system
The study area in northeastern Minnesota covers approximately 1.3-million hectares, and is composed primarily of southern boreal forest, including large portions of Superior National Forest and the Boundary Waters Canoe Area Wilderness (BWCAW). This region is a mosaic of upland and lowland forest types characterized by black spruce (Picea mariana) and northern white cedar (Thuja occidentalis) in the lowlands and balsam fir (Abies balsamea), trembling aspen (Populus tremuloides), and paper birch (Betula papyrifera) on the uplands, with large stands of jack (Pinus banksiana), red (P. resinosa), and white pine (P. strobus) occurring throughout. While large swaths of unlogged areas remain (i.e., 169,000 ha within the BWCAW), fire and logging are common and routine forms of disturbance in this ecosystem (Heinselman, 1996). Topography across the study area varies from relatively flat to moderately hilly, with elevation ranging from 183 m at the surface of Lake Superior, to 701 m at Eagle Mountain, the highest point in the state. The area is sparsely inhabited, with few paved roads and much of the region accessible only by foot, logging road, or canoe (Lenarz et al., 2010).
We established 0.04 ha plots throughout northeastern Minnesota (n = 70) to characterize the isotope composition (i.e., δ13C and δ15N values) and biomass (i.e., the dry weight of the stems and leaves, excluding the bole) of plant species within each plot (Figure 1). Plots covered a range of disturbance ages (i.e., 13 years, 9 years, 4 years, and undisturbed), types (i.e., canopy burn, clear cut, and insect-defoliation), and severities, as well as a range of landcover types (i.e., wetland and wetland forest, coniferous forest, deciduous forest, mixed forest, and regenerating forest). Because temperature has been implicated as one of the leading causes of decline for moose in Minnesota (Murray et al., 2006; Lenarz et al., 2009), plots were originally established as part of a parallel study investigating the influences of high summer temperatures on moose forage. Thus, our network of plots was distributed across the study region into three discrete temperature zones (cool, moderate, and warm) that span a mean-maximum summer temperature gradient of approximately 5.5°C (PRISM Climate Group, 2017). It is important to note that while our sample plots are spatially clumped, the fact that we sampled across a range of values within numerous spatial covariates helps to minimize potential issues associated with spatial autocorrelation within a clumped sampling design.
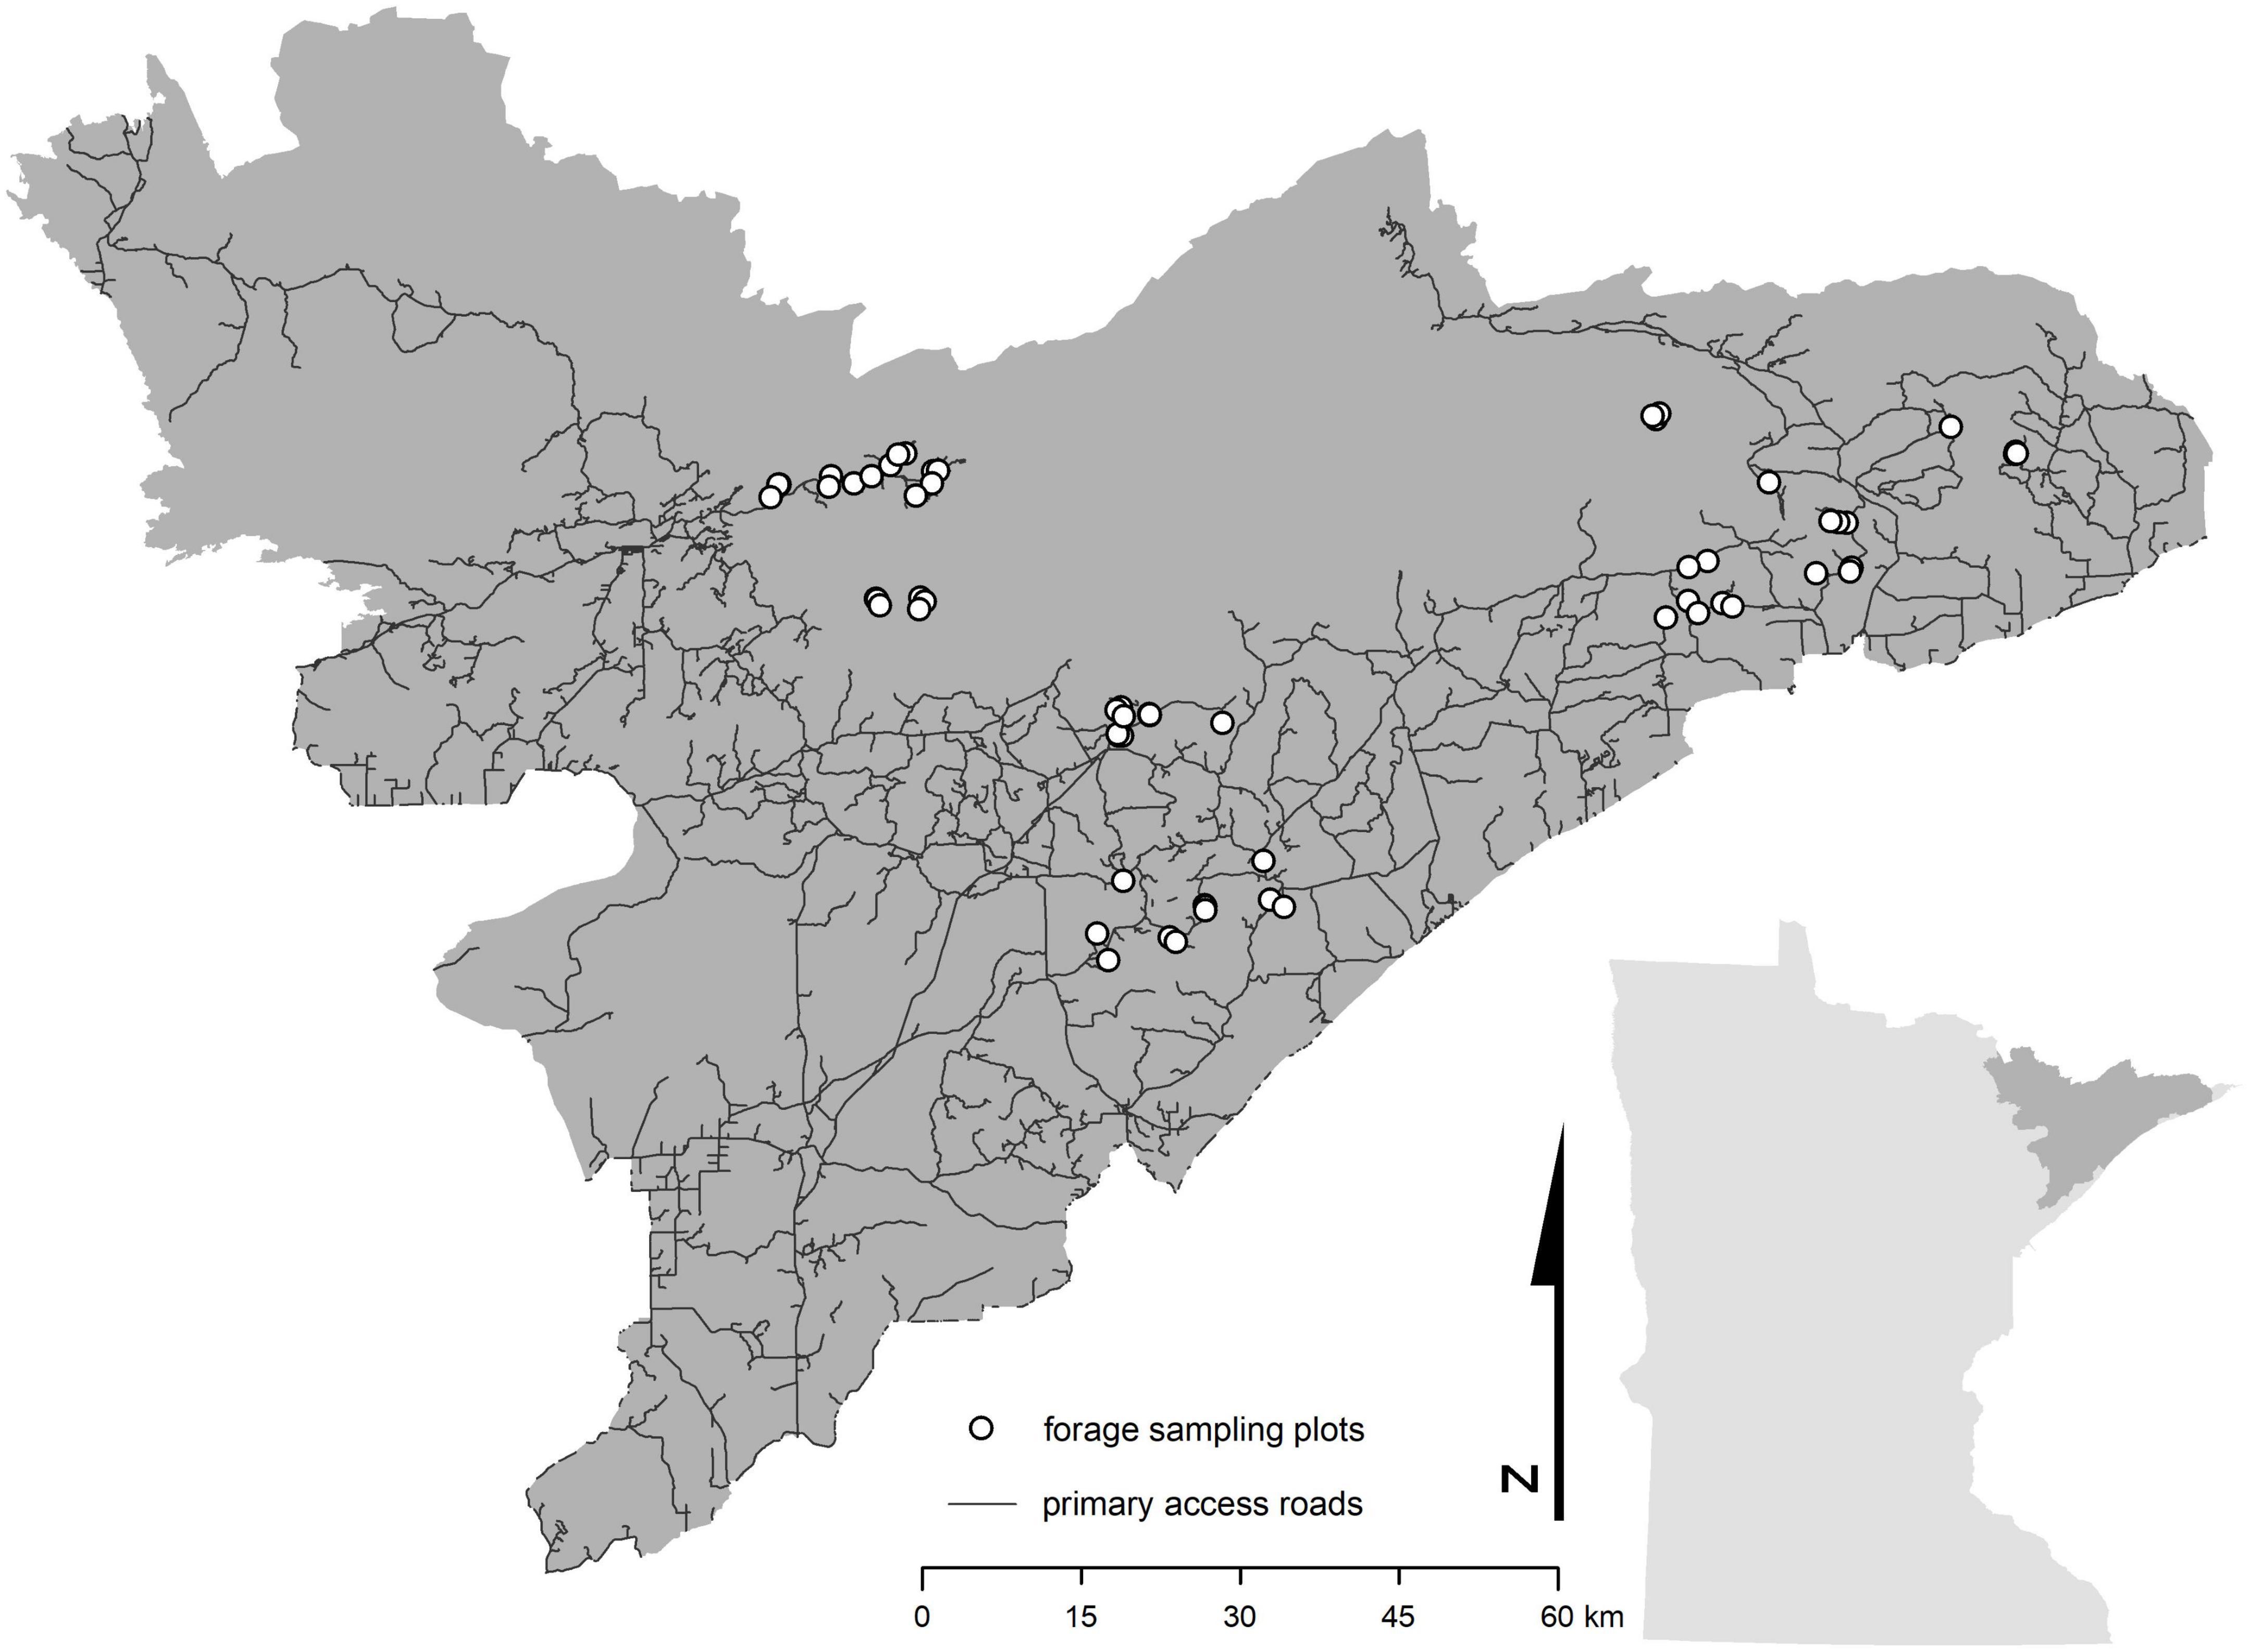
Figure 1. Forage sampling plots across northeast Minnesota. Dark gray area in inset map represents the study region and Minnesota Moose Management Area as determined by the Minnesota Department of Natural Resources.
Stable isotopes
We sampled summer forage in each of the 70 plots from late May to early August during each year from 2012 to 2016 (Figure 1). In total, we collected 2,718 summer forage samples from more than 30 species (Supplementary appendix table A1). We categorized all species into one of three groups, based on the dietary preference of moose – high, medium, and low (Supplementary appendix table A1; Peek et al., 1976). These groups also vary according to %N, which is often used as an indicator of forage quality (Supplementary appendix table A1). Where possible, we collected up to five samples of each species we encountered in each plot, where each sample consisted of 5–7 leaves collected from a peripheral stem located between 0.5 to 1.0 m from the forest floor. Once collected, samples were placed in a cloth bag labeled with the plot and sample ID.
In preparation for stable isotopes analysis, samples were dried in a 60°C oven for 24 to 48 h and subsequently placed in light-proof, tin containers. A small portion of each sample was collected and ground to a homogenous powder using a Spex SamplePrep GenoGrinder bead mill. Once homogenized, we weighed 2.5 ± 0.1 mg of each sample into a 5 × 9 mm Costech tin capsule. All samples were analyzed either at the Stable Isotope Laboratory in the Department of Earth Sciences at the University of Minnesota (UMN) or the Stable Isotope Laboratory in Earth and Planetary Sciences at the University of California, Santa Cruz (UCSC). At UMN, samples were analyzed for δ15N and δ13C values via flash combustion in a Costech 4010 Elemental Analyzer (EA) coupled to a Thermo-Finnegan Delta V Plus isotope ratio mass spectrometer (IRMS). At UCSC, samples were analyzed via flash combustion in a CE Instruments NC2500 EA interfaced to a Thermo Finnigan Delta Plus XP IRMS. At each location, the resulting gas was analyzed for elemental concentration of 13C/12C and 15N/14N ratios and expressed in standard δ notation, representing the differences between sample ratios and ratios found in international standards for carbon (VPDB) and nitrogen (atmospheric N2). Additionally, both laboratories used internal (PUGel) and externally calibrated standards (acetanilide) for quality assessment and control. Because samples were analyzed in two different laboratories, we alleviated concerns of machine or lab specific analytical biases by running five samples from six different species in each lab and creating offset and linearity corrections that we then applied to all samples analyzed at UCSC. Finally, to ensure that δ15N and δ13C values from the same site did not differ as a function of sample year, we randomly selected five sites and conducted Levene’s Test for Homogeneity of Variance to evaluate equality of variance of δ15N and δ13C values within preference group as a function of sample year. Of the 30 tests we conducted, none had p-values of less than 0.05, suggesting little to no within site variation in stable isotope values across sampling years.
Woody biomass calculations
Within each 0.04 ha plot, we measured smaller woody stems (i.e., stems ≤ 6 cm of diameter at breast height, DBH, and ≥ 15 cm in height) within three nested subplots along the 30, 150, and 270° azimuths, at 5.5 m from the plot centroid. Within a 25 m2 subplot, we tallied the number of individuals of each species having a DBH ≥ 2.5 cm and ≤ 6 cm (i.e., saplings), with tallies for each species recorded for each 0.5 cm DBH interval. Within a smaller, 10 m2 subplot, we measured diameter at 15 cm height of all woody plants that were ≥ 15 cm in height but <2.5 cm in DBH (i.e., shrubs or advanced regeneration). We tallied the number of individuals of each species within each 0.5 cm size class, from 0.5 to 2.5 cm. Anything with a diameter < 0.5 cm at 15 cm height was omitted. Additionally, moose are known to snap-off the tops of trees with a DBH ≤ 6 cm to access tree-top foliage (Geist, 1963). Thus, all trees with a DBH > 6 cm were excluded from our analysis.
We calculated estimates of above-ground biomass using species-specific allometric equations based on the measurements detailed above. For saplings, we used equations from Jenkins et al. (2003), to estimate above-ground biomass using DBH. While allometric equations developed from a small and localized sampling effort may lead to bias when estimating tree biomass, Jenkins et al. (2003) compiled all available diameter-based allometric equations for all species across the United States. Using a metanalytical approach, the authors then developed a set of consistent, national-scale allometric equations for estimating biomass across regional boundaries, thereby minimizing analytical uncertainty. We also used equations for shrubs and small saplings, (Smith and Brand, 1983; Perala and Alban, 1993), the vast majority of which were developed using samples collected from the Upper Great Lakes Region, allowing us to estimate above ground biomass based on stem diameter at 15 cm height. For some species, equations for whole, above-ground biomass were not available. For those species, we calculated biomass for stems and foliage separately, and then added those values to estimate total biomass of each species in each plot. All estimates were converted to kg/m2.
Creating isoscapes
To model carbon and nitrogen isotopes across the landscape, we needed to aggregate the isotope data within each preference group at each plot. We did this in two ways. First, we took a traditional approach in which we simply averaged all isotope samples within a given preference group in each plot. This approach, which did not account for sample density or available biomass, we refer to as “biomass uninformed.” However, our primary goal was to represent the isotopic composition of different groups of plants as those groups are perceived by a large herbivore. Because isotope samples were not collected in proportion to availability within plots or on the landscape, we used a “biomass-informed” approach, in which we generated bootstrapped samples of the isotope data (weighted by our biomass estimates) for each preference group in each plot (see section “Bootstrap sampling”). Once plot-level estimates were made for the biomass uninformed and informed approaches, we developed linear models (with and without random effects) to determine what biotic and abiotic factors influenced variation in isotope values (see section “Model selection”). Finally, we used regression kriging to make spatial predictions of how isotope compositions of each preference group vary across the landscape (see section “Regression kriging”), and then compared prediction accuracy using spatial leave-one out cross validation (see section “Comparison of models and predictions”). While the following sections describe each step in the modeling process in detail, Figure 2 provides a visual schematic of our approach.
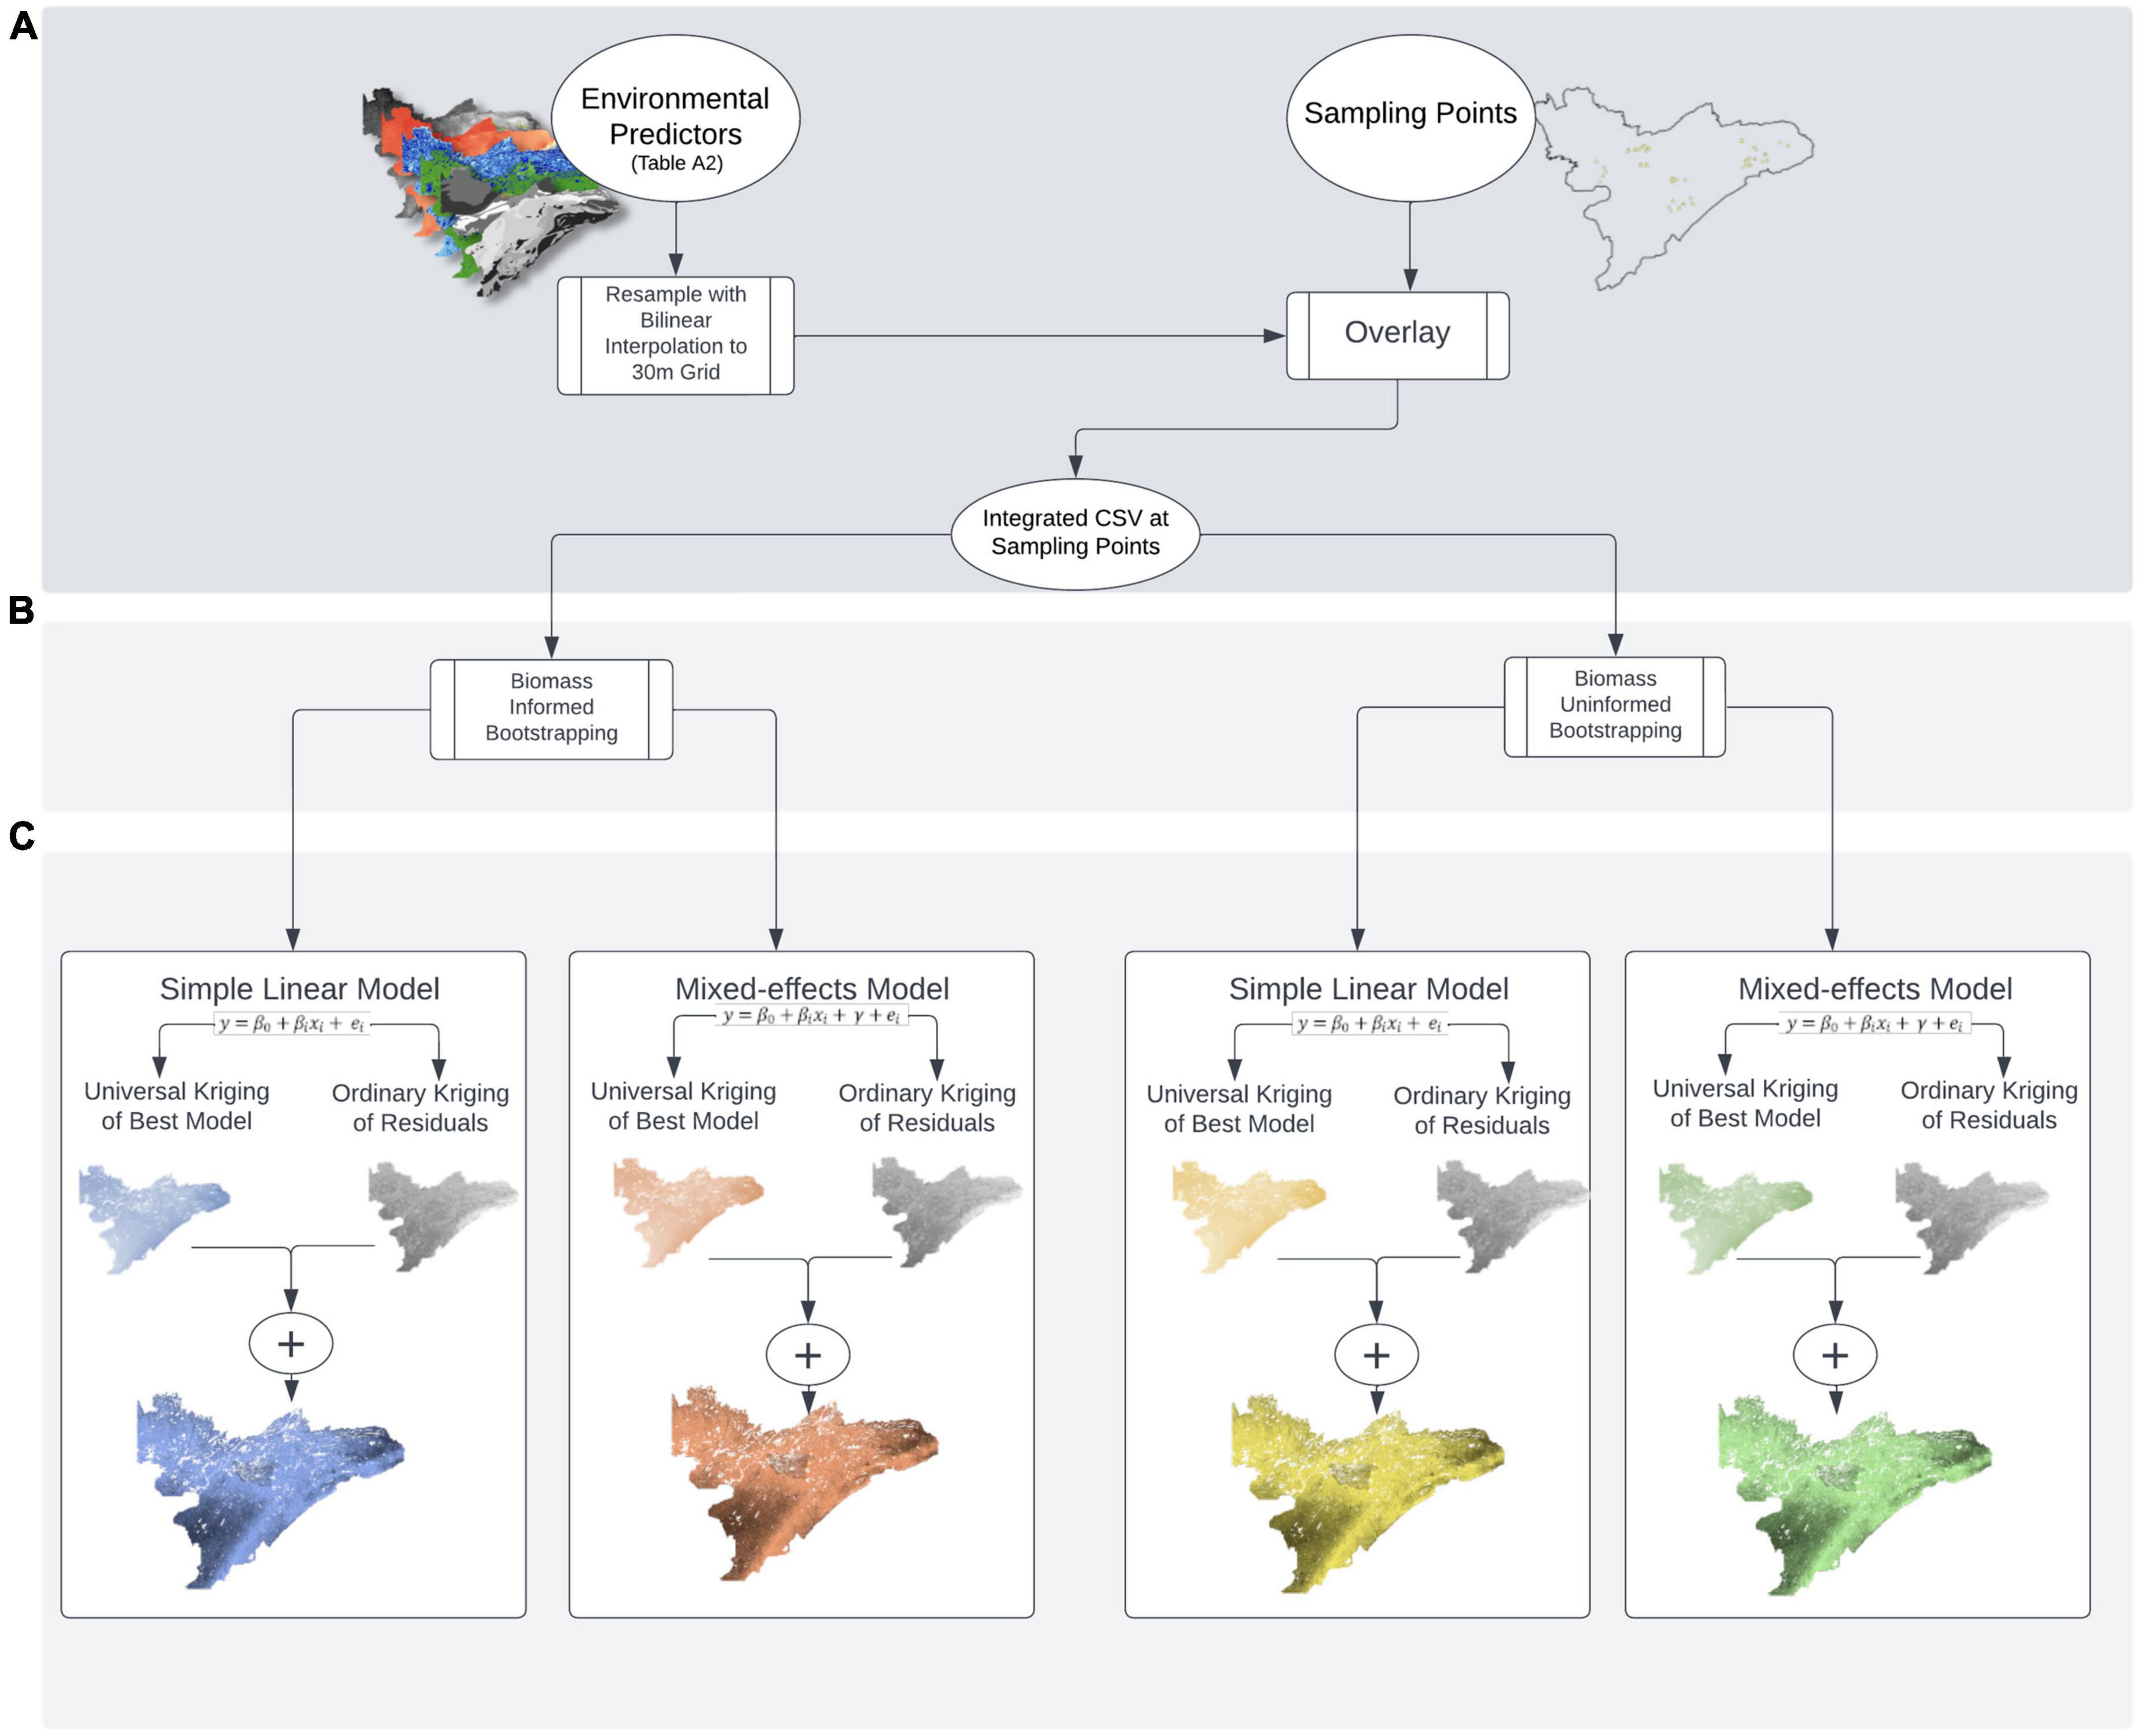
Figure 2. Schematic of (A) sample collection and data pre-processing, (B) bootstrapping with and without weights, and (C) modeling with simple linear and mixed-effected regression kriging approaches.
Bootstrap sampling
Bootstrapping was used to generate “biomass informed” and “biomass uninformed” distributions of isotope composition. For biomass informed estimates, we used the biomass estimates from each plot to generate bootstrapped data reflecting the mean stable isotope composition of each forage preference group as a function of the relative abundance of each group within each plot (Figure 2B). To do this, we used the sample function in the base package of R (R Core Team, 2018), which can use a vector of probability weights (referred to below as “selection probability vector”) for selecting individual values from the sampled data set (i.e., the prob argument within the sample function). Each plot had three selection probability vectors, one for each preference group. Within each plot, each vector consisted of a string of numbers representing the selection probabilities of all samples within a given preference group. Each sample had its own selection probability that was equal to the proportional abundance of that species within its preference group, divided by the number of samples collected for that species.
As an example, in a hypothetical plot A, the low-preference forage samples consist of 3 balsam firs, 2 speckled alders, and 1 beaked hazel, for 6 total samples in this preference group—each species making up 72, 19, and 9% of the low-preference forage biomass in plot A, respectively. Given this, our selection probability vector for low-preference forage in plot A would be a string of 6 values: 3 values of 0.72/3 (0.24), 2 values of 0.19/2 (0.095), and one value of 0.09, all of which sum to 1.00. Once our selection probability vectors were established, we sampled each plot-preference group combination 500 times, with replacement, informed by our selection probability vectors. We then calculated the mean of this sample, which represents the mean stable isotope composition of a given preference group within a plot. To account for potential variation from one sampling effort to the next, we repeated this procedure 1,000 times, which yielded a single vector of 1,000 means. We then calculated the mean of this vector and saved it as our “biomass-informed” isotope value for that forage-preference group, within the given plot. We repeated this procedure for each plot and each forage-preference group, for both δ13C and δ15N values.
The bootstrapping procedure was comparable for our uninformed data, but we assumed equal abundance across all species found within each forage-preference group at each plot. For illustration building on the example above, in the uninformed case, our vector of selection probabilities for low-preference forage in plot A for our uninformed data would also be a string of 6 values–3 values of 0.33/3, 2 values of 0.33/2, and one value of 0.33, all of which sum to 1.00. Thus, rather than simply use mean isotope values for each preference group in each plot (i.e., mean stable isotopes values not scaled by biomass), we use bootstrapping in a comparable manner for the sake of methodological parity rather than directly incorporating species-specific proportional abundances.
Model selection
We selected 15 landscape covariates as candidate predictors of plant biomass isotopic composition, of which 13 were fixed and 2 random (Figure 2 and Supplementary appendix table A2). To select final covariates, we performed a two-step, Akaike’s information criterion (AIC) -based backward elimination to define the best fitting linear mixed-effects model (Feng et al., 2021) for δ15N and δ13C for each forage-preference group, across all plots. Our “full model” contained all fixed and random effects, and for the first step of the model-selection process, we held our random effects constant and removed one fixed covariate at a time until we reached the fixed-effects structure yielding the lowest AIC score. Once we achieved the fixed-effects structure yielding the lowest possible AIC score, for the second step of the model selection process we performed AIC-based backward elimination on the random effects. We used the lmer function in the lme4 R package for all linear mixed-effects models (Bates et al., 2015). When defining our fixed-effects structure we set the REML argument in lmer to FALSE, and when defining our random effects structure, we set this argument to TRUE (Faraway, 2016). In one scenario (i.e., δ15N for low-preference forage), our best fitting model was rank deficient (i.e., insufficient data to estimate the chosen model due to too many covariates). To alleviate rank deficiency, we removed the set of factor covariates that altered the model’s AIC score the least.
Data pre-process for regression kriging
To prepare our spatial data for regression kriging, all spatial covariate data that were originally formatted as shapefiles were converted into raster datasets in ArcGIS 10.8.1 (Figure 2A; ESRI, 2020). Once all data were converted, we needed to make sure that the cell size of all raster datasets were equal. Thus, for any raster dataset with a cell size larger than 30 × 30 m, we used bilinear interpolation via the resample tool in ArcGIS to reduce the cell size without altering the raster’s extent. Next, we needed to ensure that all raster datasets were of the same extent. We accomplished this with the extract by mask function in ArcGIS, using the raster with the smallest extent as our “mask.” Finally, we used the raster to ASCII conversion tool in ArcGIS to convert each raster to an ASCII file that could then easily be read into R as a single, multi-layered spatial grid data frame. To initiate regression kriging in R, we used the readGDAL function from the rgdal package (Bivand et al., 2018) to read in our ASCII landscape covariate data and the read.csv function in the base package to read in our plot locational data (i.e., the easting and northing of each plot’s centroid). To align our plot location data with our landscape covariates, we used the over function from the sp package (Pebesma and Bivand, 2005; Bivand et al., 2013) and then combined the corresponding landscape covariate data with our plot locational data file.
Regression kriging
By definition, regression kriging is a method of spatial interpolation that combines universal kriging (i.e., spatial interpolation informed via regression modeling) with ordinary kriging of the regression residuals, thereby allowing for more complicated forms of regression (Hengl et al., 2007). Kriging the residuals has been shown to improve spatial predictions substantially by allowing for small-scale autocorrelation while also accounting for measurement and modeling error (Prudhomme and Reed, 1999; Omuto and Vargas, 2015). For spatial interpolation of the residuals from our best-fitting models, we used the autoKrige function in the automap package (Hiemstra et al., 2009). We determined the best fitting variogram model both by means of visual inspection and the sum of squared errors of the fitted model, and then incorporated the best fitting variogram model into the autoKrige function via the model argument (Supplementary Figures A1, 2). We then used the predict function in the stats package (R Core Team, 2018) to predict δ13C and δ15N values across the entire study area and added these predictions to our kriged residuals, which helps to account both for local autocorrelation and measurement and modeling error. We saved the resulting data as grid files using the write.asciigrid function in the sp package (Pebesma and Bivand, 2005; Bivand et al., 2013). For visualization purposes, we then converted these ASCII files into raster data sets in ArcGIS using the ASCII to raster conversion tool. All R code, sample data, and resulting output for this portion of our analysis can be found online, at the Data Repository for the University of Minnesota (DRUM).
Comparison of models and predictions
In general, we would expect that accounting for variation in the abundance of different substrates (e.g., forage biomass) would inherently result in improved estimates of the isotopic landscape because such estimates should more accurately reflect the true isotopic mean at any point in space. Regardless, we conservatively compare across models with both qualitative and quantitative methods in order to determine which models provide better fits and predictions. The following provides a brief description of the evaluation approach used for each question:
1. Q1: we used a one-way ANOVA followed by Tukey’s Test for Honestly Statistical Differences to determine if different forage-preference groups are isotopically distinct from one another.
2. Q2: to evaluate if kriging predictions of the abundances of different preference groups are distinct from one another and spatially heterogeneous, we mapped both the absolute and proportional abundances of all preference groups and inspected differences in model structure for each preference group. We also evaluated the efficacy of model structure using marginal and conditional r2 values for all preference groups. To evaluate model performance, we used hold-one-out cross validation and estimated the root-mean-squared error (RMSE) for all models.
3. Q3: to evaluate if mixed-effects models characterizing spatial variation in stable isotopes improve predictions over those created via simple linear models, we calculated marginal and conditional r2 values. To evaluate model performance, we used hold-one-out cross validation and estimated the RMSE for all models.
4. Q4: to determine if biomass-informed isoscapes provide predictions that are distinct from those provided by uninformed isoscapes, we calculated the absolute difference between each model type for each preference group and mapped these differences using the raster calculator in ArcGIS 10.8.1 (ESRI, 2020). To estimate model accuracy for both uninformed and biomass informed models, we used spatial, hold-one-out cross validation approach and calculated the RMSE for all models.
To elaborate on the hold-one-out cross validation for Q4, we held out all data from an individual plot and re-kriged δ13C and δ15N for each preference group using the remaining plots and our best fitting linear mixed-effects models. We then compared the predicted values of the held-out plot (i.e., δ13C and δ15N for high-, medium-, and low-preference forage) to the true values and continued this process across all plots. We then calculated the RMSE to determine how well our regression-kriging process predicted the values of our held-out sites, for both uninformed and biomass-informed models.
Results
When evaluating raw isotope data to determine if different forage preference groups were distinct (Q1, Figure 3), results of one-way ANOVA for δ13C [F(2,2691) = 129.9, p < 0.00001, η2 = 0.084] and δ15N [F(2,2691) = 24.9, p < 0.00001, η2 = 0.085] were statistically significant. Furthermore, Tukey HSD Tests comparing preference groups against one another for both δ13C and δ15N revealed that all groups were isotopically distinct, with each comparison yielding p < 0.0001. Values for δ13C for low preference forage ranged from −33.8 to −24.2‰ and from −33.5 to −23.9% for medium preference forage. For high-preference forage, δ13C ranged from −32.9 to −22.2%. Values for δ15N ranged from −10.1 to 6.1% for low-preference forage and from −12.0 to 6.5% for medium preference forage. For high-preference forage, δ15N ranged from −7.4 to 7.1%.
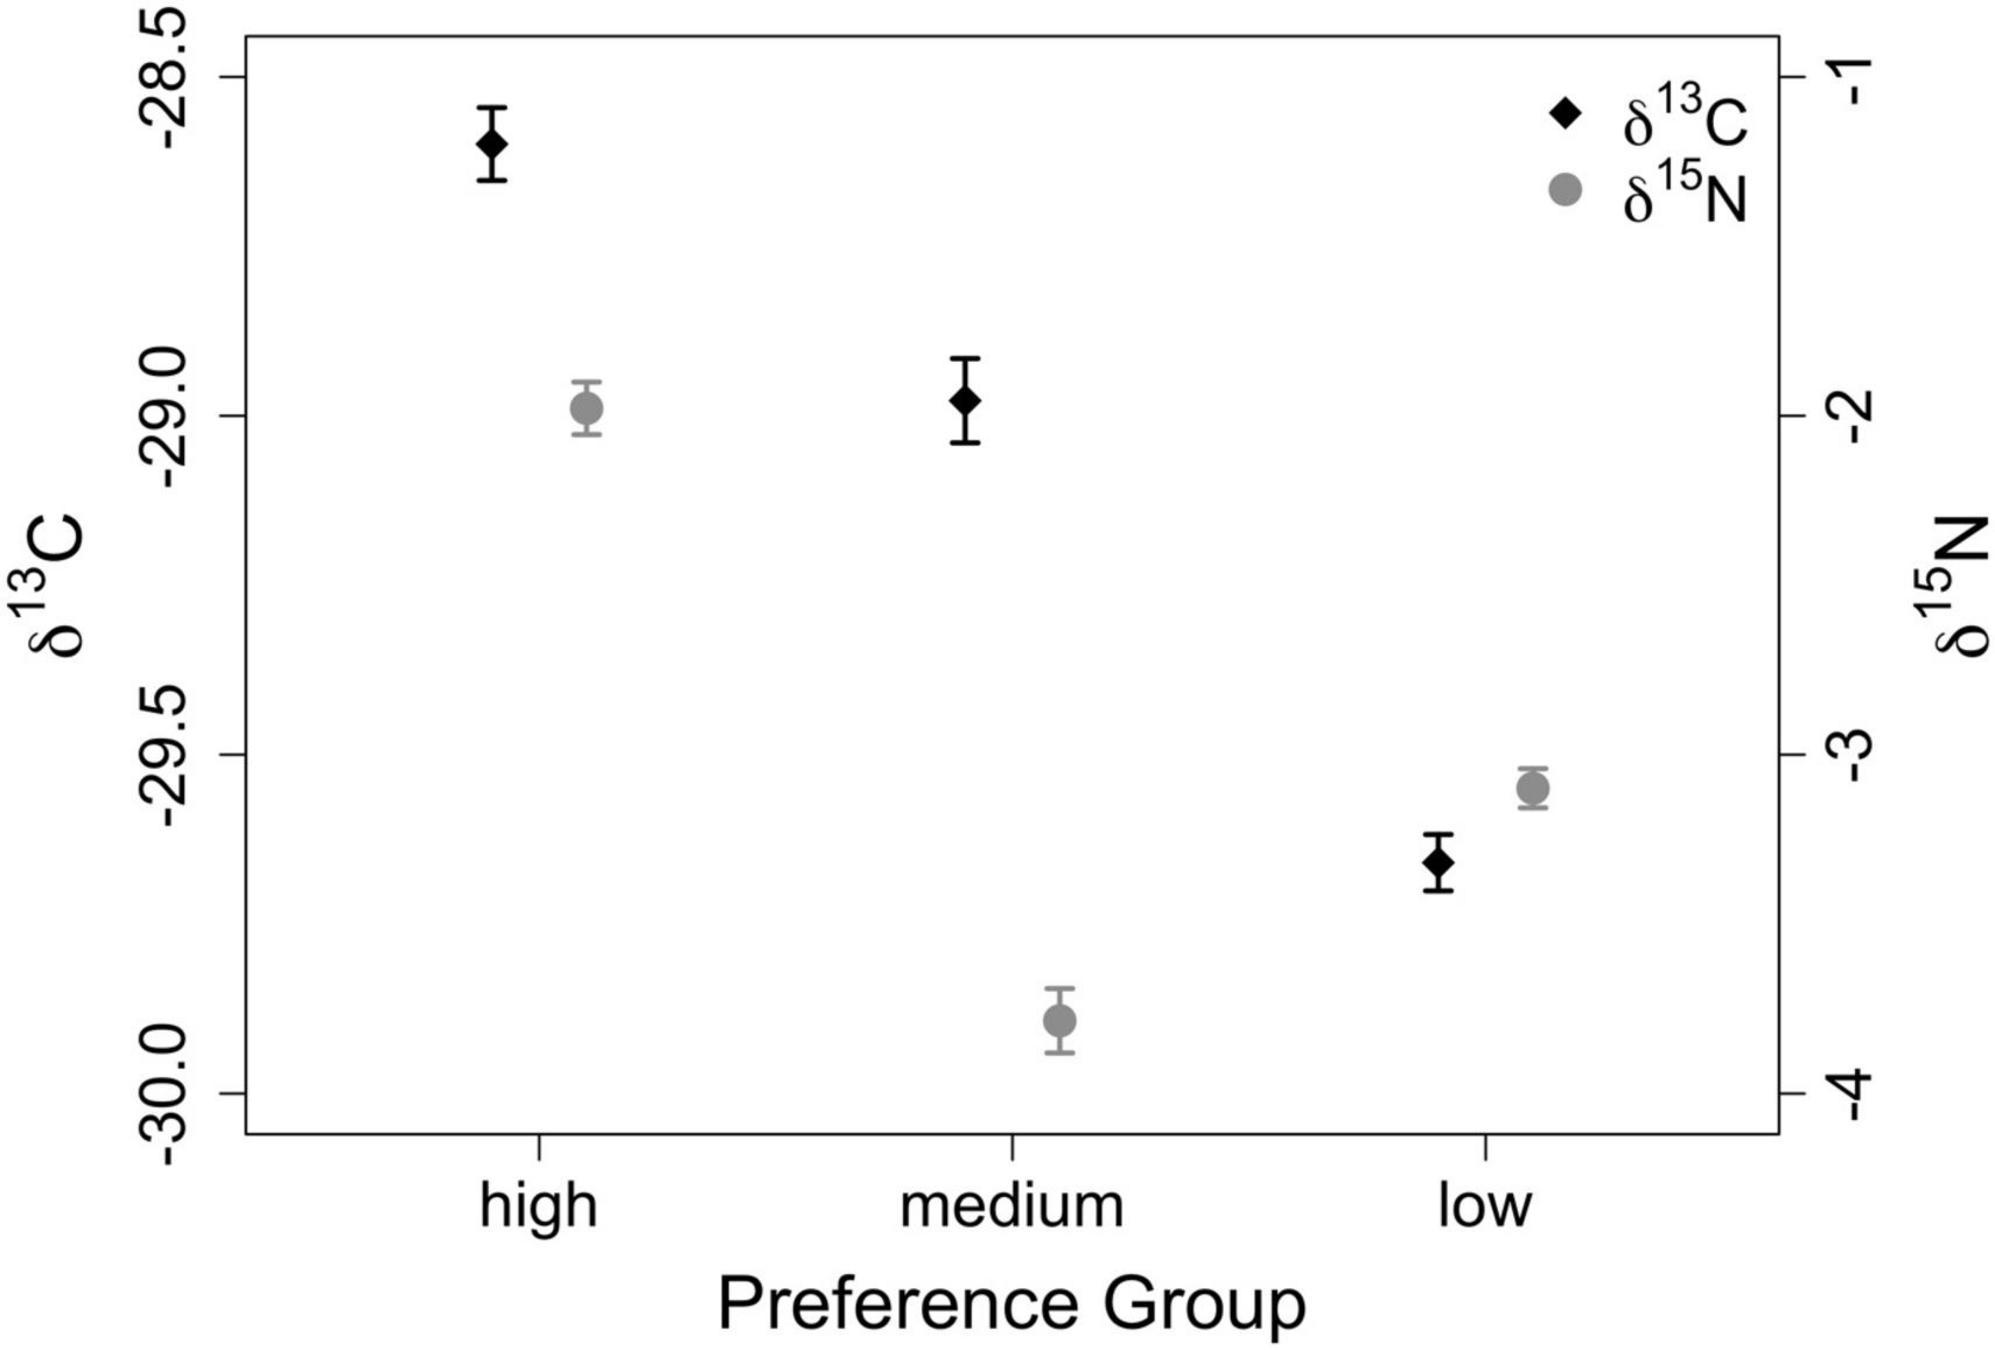
Figure 3. Isotopic variation of raw δ13C and δ15N values (‰) across preference groups. Mean values are represented by symbols, while error bars represent standard error.
When inspecting model predictions for the proportional and absolute abundance of different forage preference groups (Q2), both measures of abundance exhibited substantial variation across all preference groups (Figure 4). Predictions of low-preference forage exhibited the greatest mean abundance across the study region (49%) and predictions of medium-preference forage exhibited the smallest mean abundance (18%). Additionally, each preference group exhibited a high degree of spatial heterogeneity across the study region. For example, proportional abundance of low-preference forage ranged from 0 to 100% with a standard deviation of 28%, while the proportional abundance of high-preference forage also ranged from 0 to 100% with a standard deviation of 23% (Figure 4). Moreover, only two of the thirteen fixed effects (i.e., northing and mean annual precipitation) appeared in all models used to predict the abundance of different forage groups (Supplementary appendix table A3). In general, lower-preference forages were more abundant throughout the study region than higher-preference forages (Figure 4).
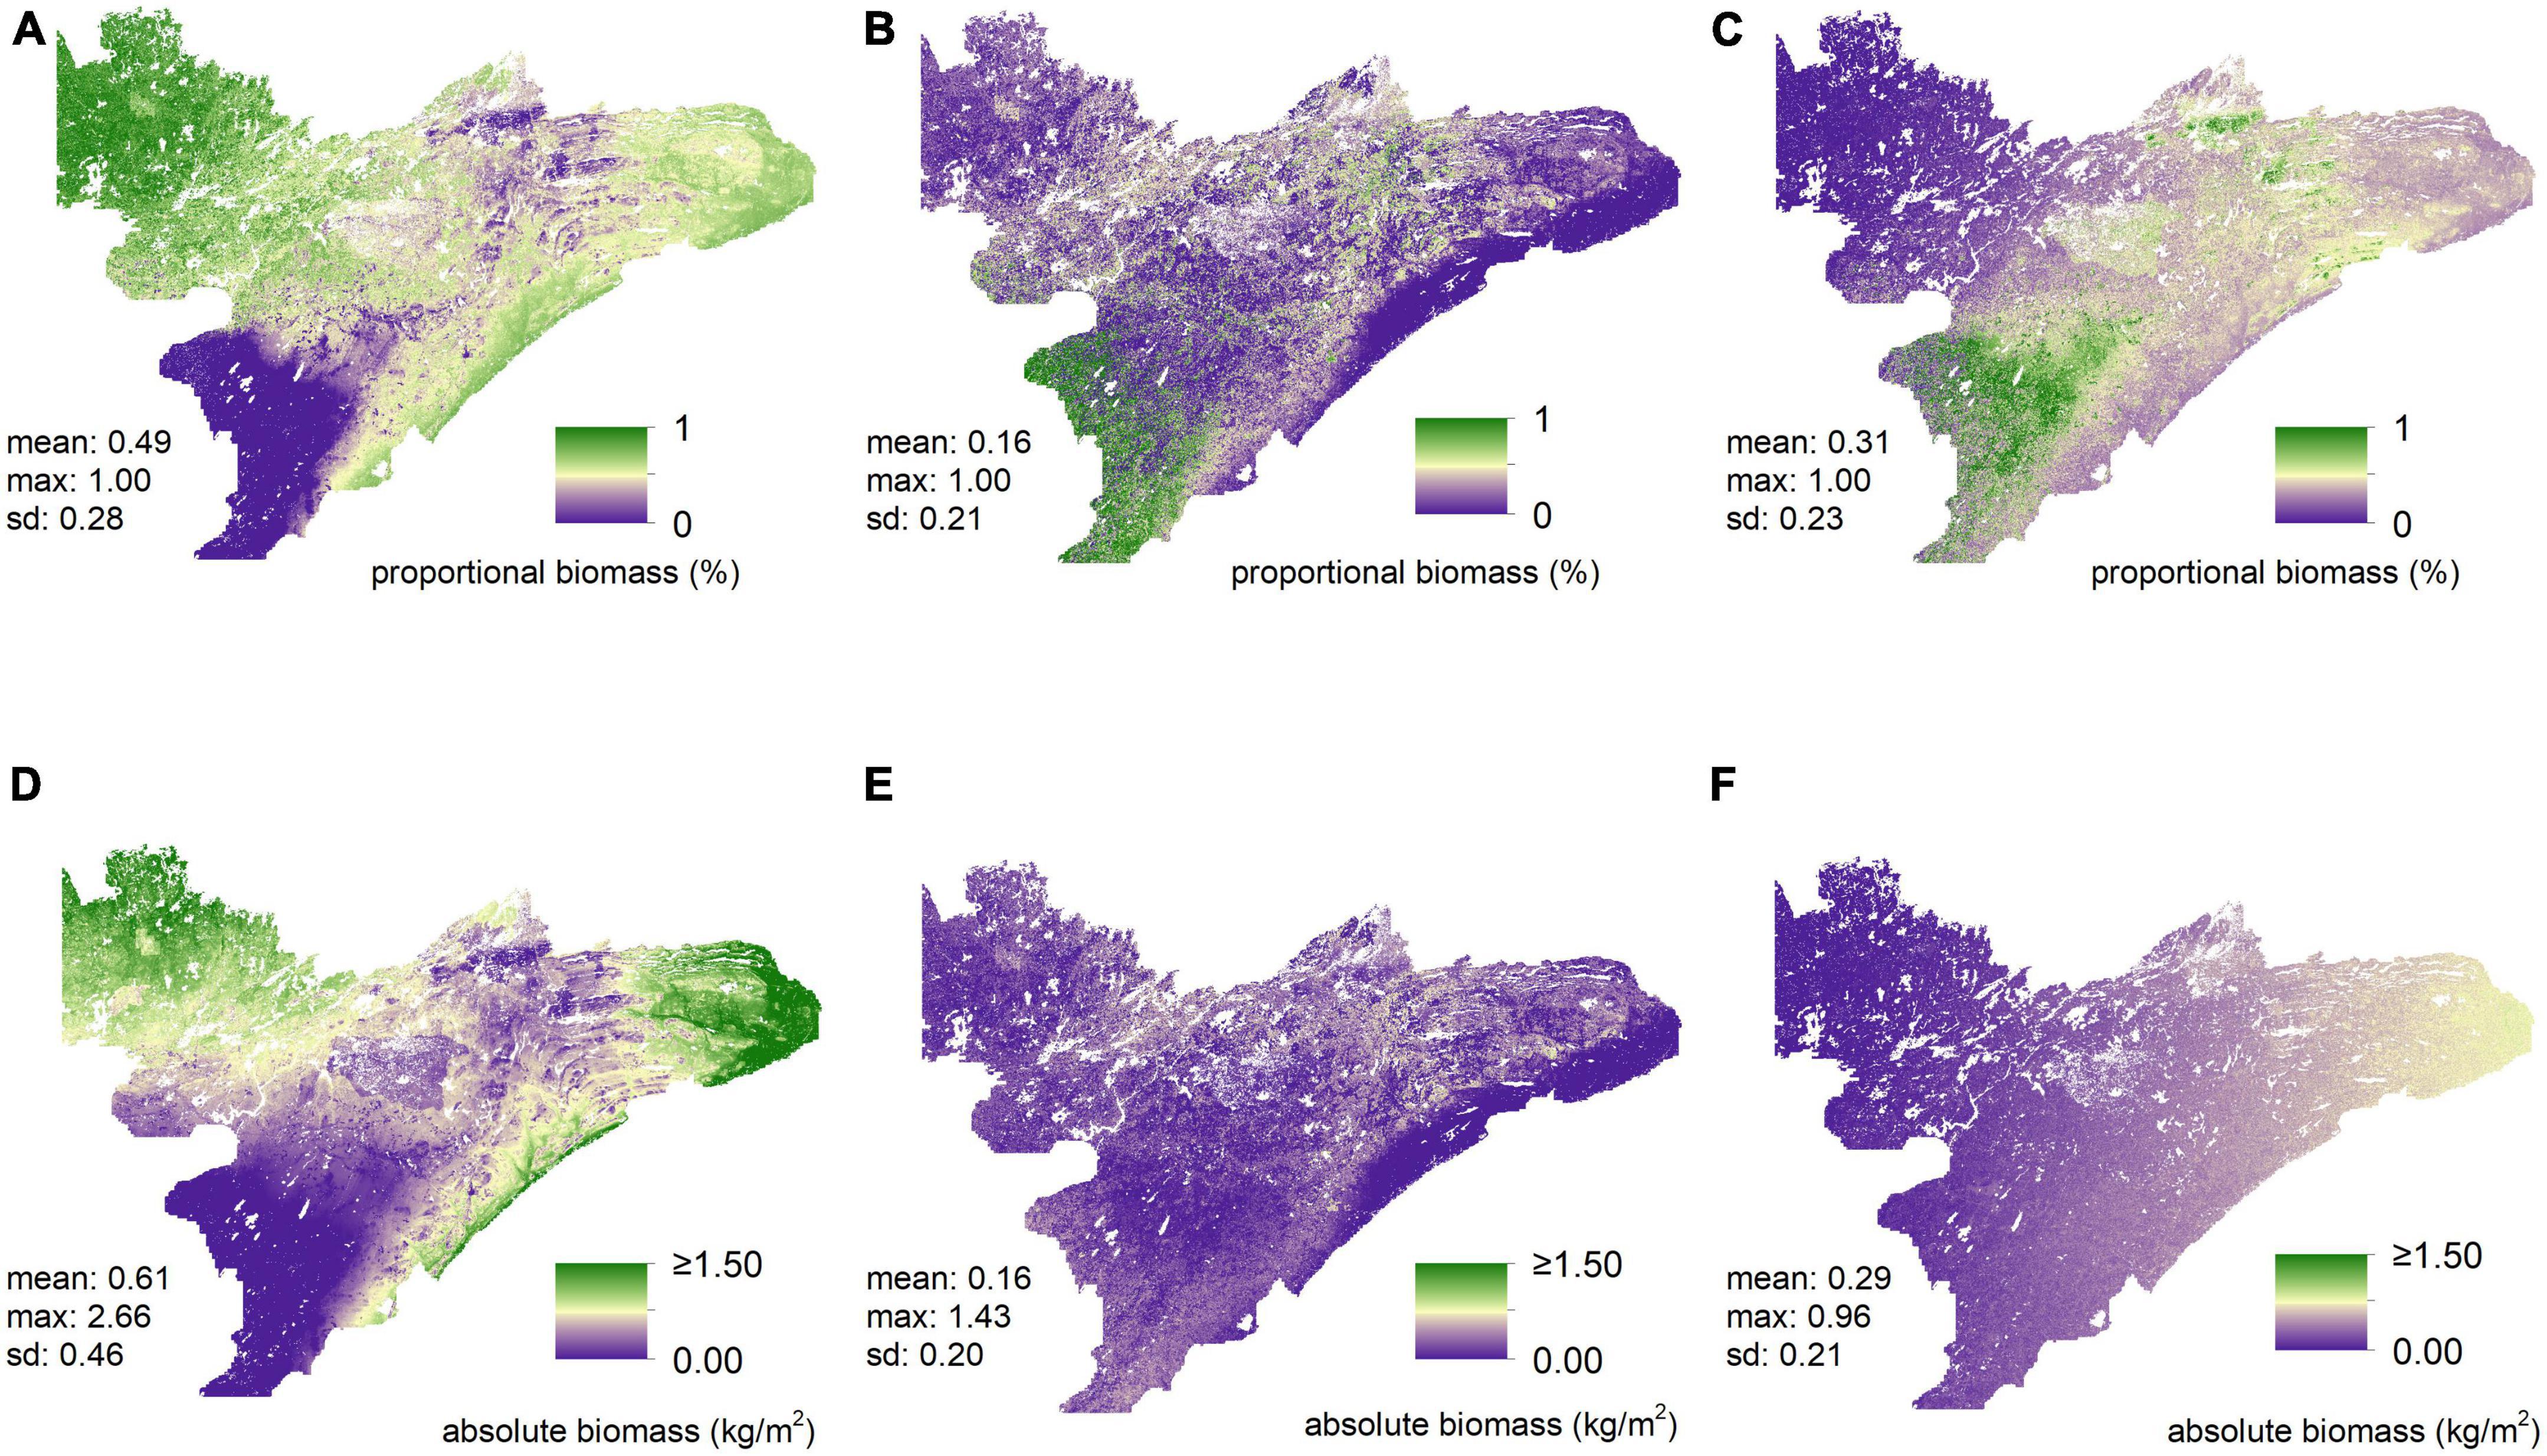
Figure 4. Predictions of proportional abundances and absolute amounts (kg/m2), respectively, for low- (A,D), medium- (B,E), and high-preference (C,F) forage. Visual inspection of these maps suggests substantial differences in both the proportional abundances and the absolute amounts of biomass of all three forage-preference groups.
We found that incorporating random effects improved our ability to predict δ13C for medium-preference forage for both our uninformed and our biomass-informed models (Figures 5, 6 and Supplementary appendix tables A4, 5). The inclusion of random effects improved r2 values by as much as 0.151 for δ13C values and by as much as 0.868 for δ15N (Supplementary appendix tables A4–7).
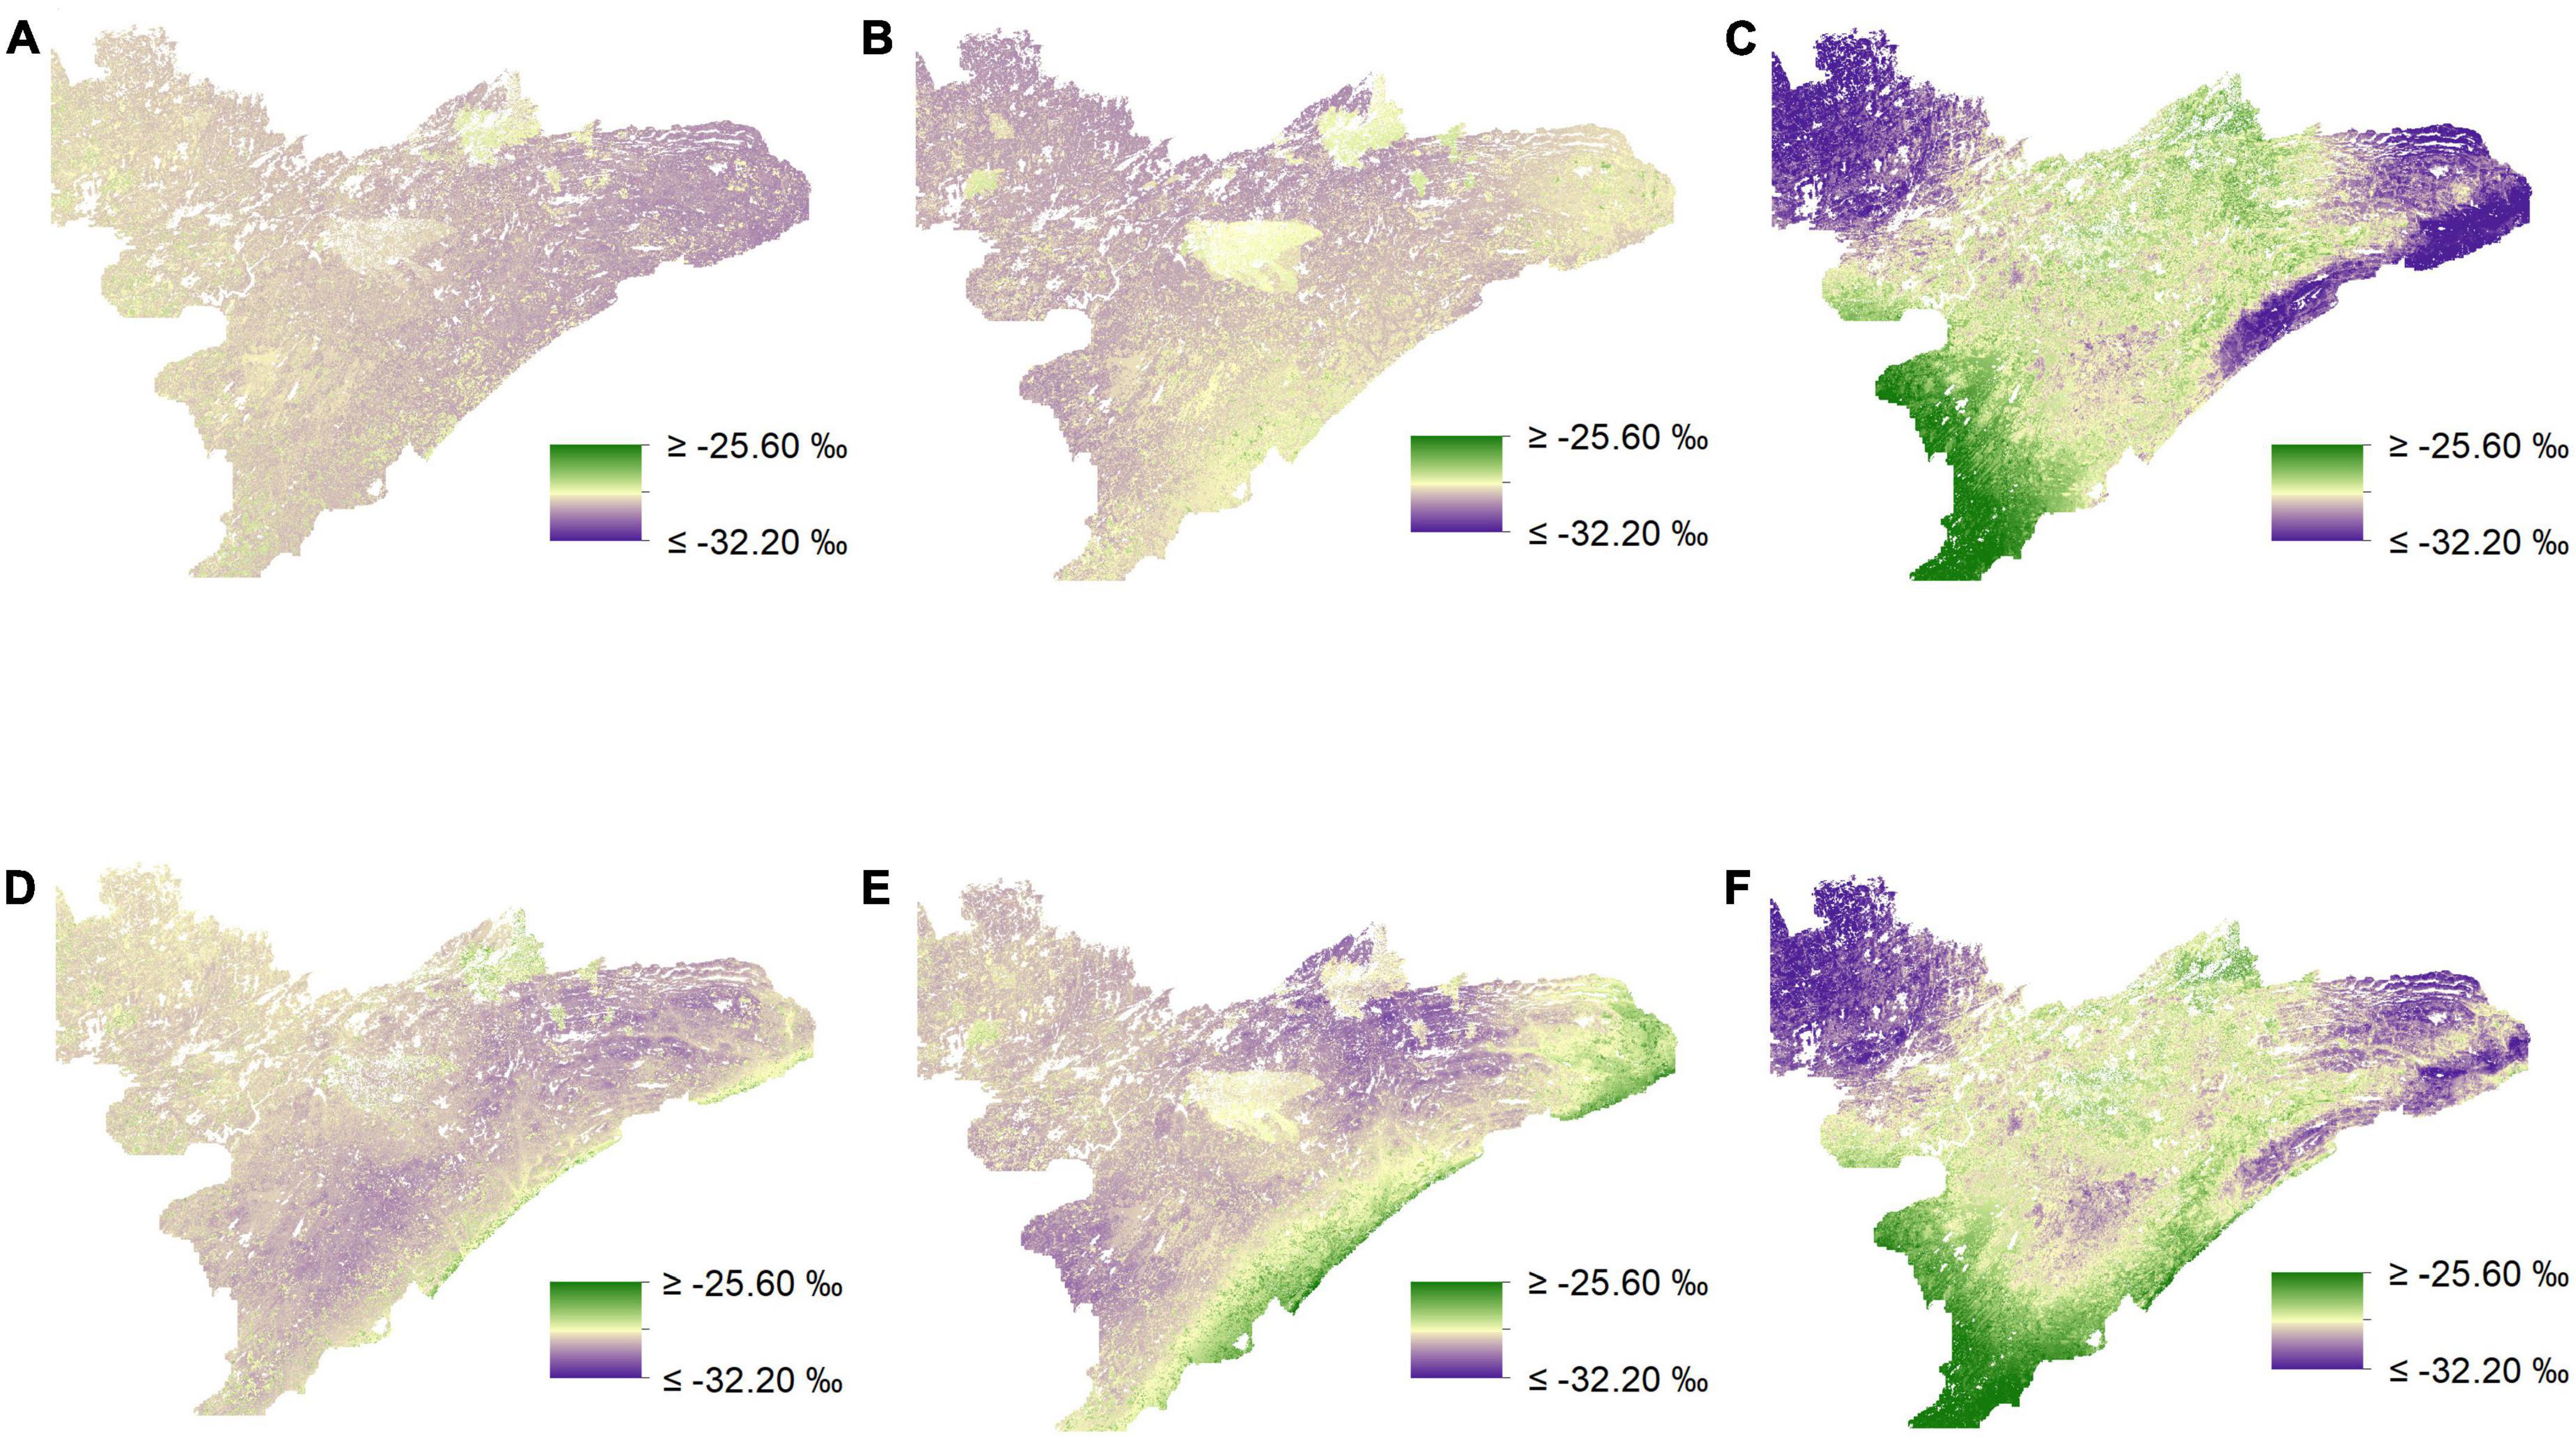
Figure 5. Isoscapes depicting spatial variation in δ13C (‰) across northeastern Minnesota from mixed-effects models. Visual inspection of prediction maps reveals distinct differences when comparing uninformed isoscapes for low (A), medium (B), and high-preference forage (C) to those derived from biomass-informed models for low (D), medium (E), and high-preference forage (F).
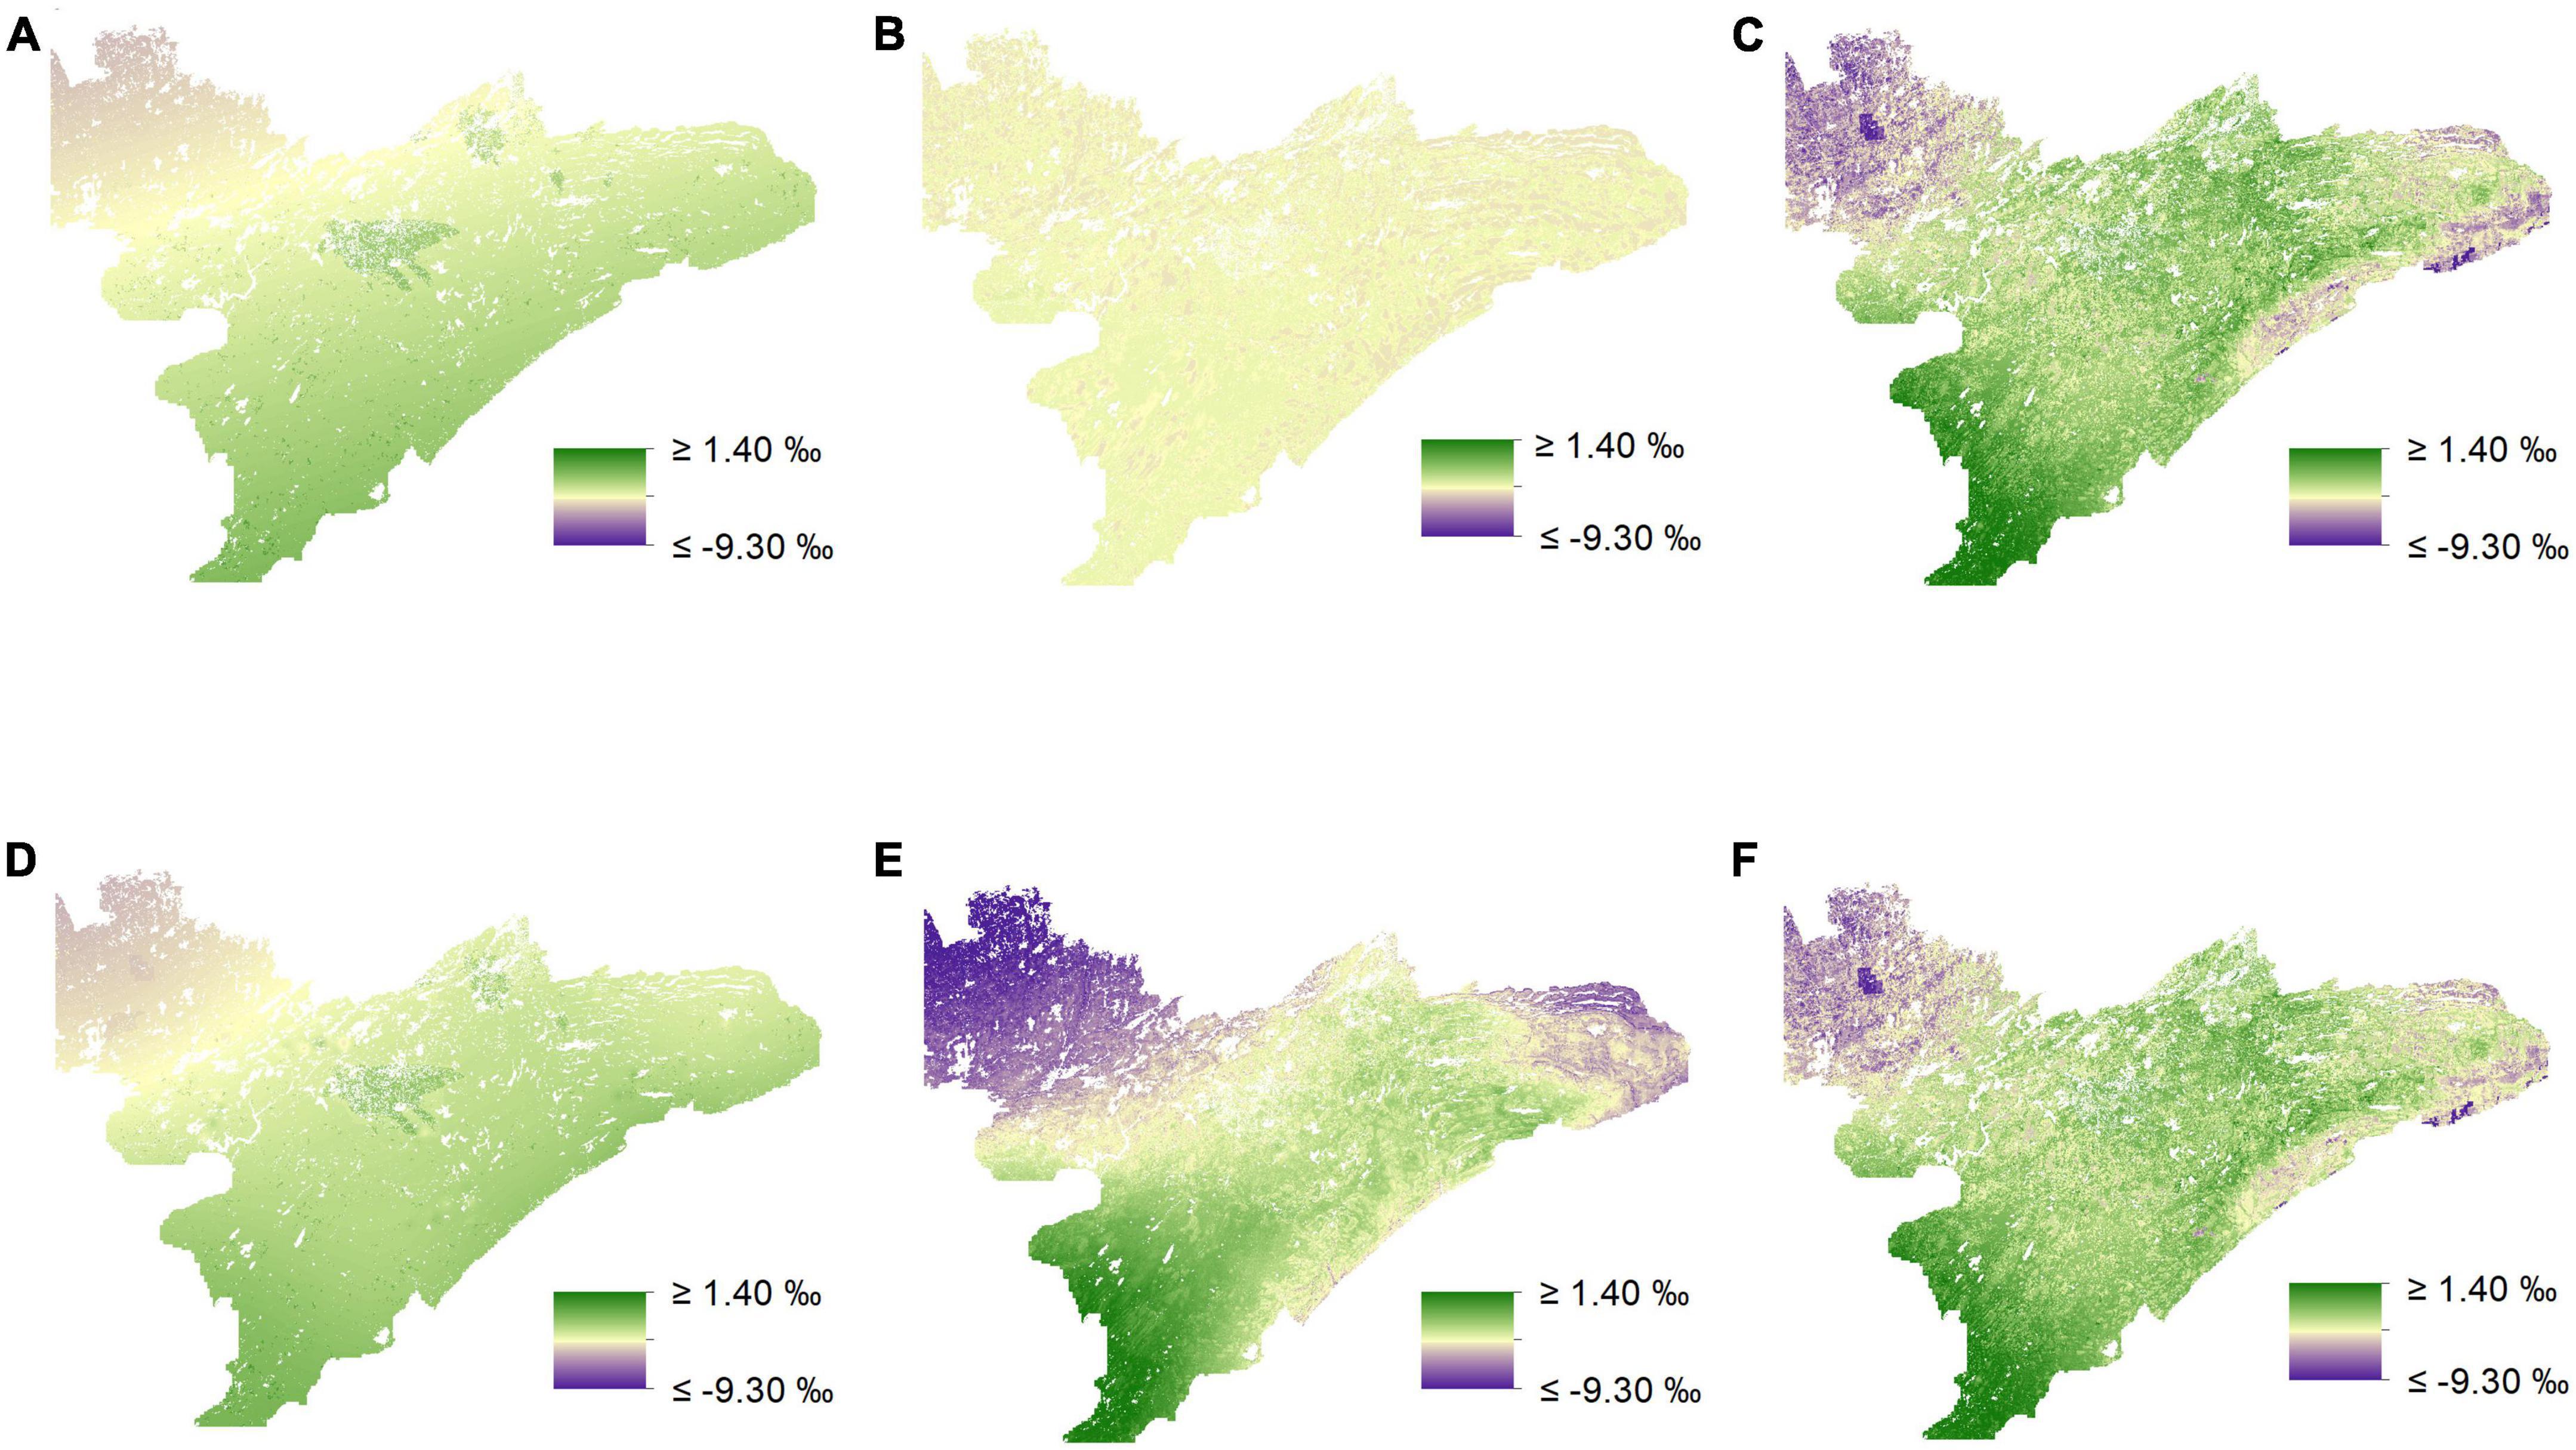
Figure 6. Isoscapes depicting spatial variation in δ15N (‰) across northeastern Minnesota from mixed-effects models. Visual inspection of prediction maps reveals distinct differences when comparing uninformed isoscapes for low (A) and medium-preference forage (B) to those informed by biomass estimates (D,E), respectively. However, isoscapes predictions for high-preference forage, both uninformed (C), and biomass-informed (F), appear to be very similar.
In general, uninformed and biomass-informed isoscape models were best characterized by distinct sets of predictor variables across different preference groups (Q4, Supplementary appendix tables A3–7). However, there were varying degrees of overlap in the fixed effects of the best fitting models for different preference groups, and this was true for both uninformed and biomass-informed models. For example, δ15N for medium-preference forage had a single fixed effect in the uninformed model, while the biomass-informed model for δ15N values of the medium-preference group had six fixed effects (Supplementary appendix tables A6, 7). Conversely, models characterizing δ15N for high-preference forage for both uninformed and biomass-informed had identical structures (Supplementary appendix tables A6, 7). When predicting held out data, RMSE estimates ranged from 0.649 to 0.823% for δ13C and from 0.897 to 1.908% for δ15N (Supplementary appendix tables A4–7). Maps depicting the differences between uninformed and biomass informed isotopes suggest strong differences between different prediction methods (Figure 7) and reveal that accounting for biomass when modeling the isotopic landscape can yield substantially different predictions (Figure 7) that vary by as much as 10% (Figure 7E).
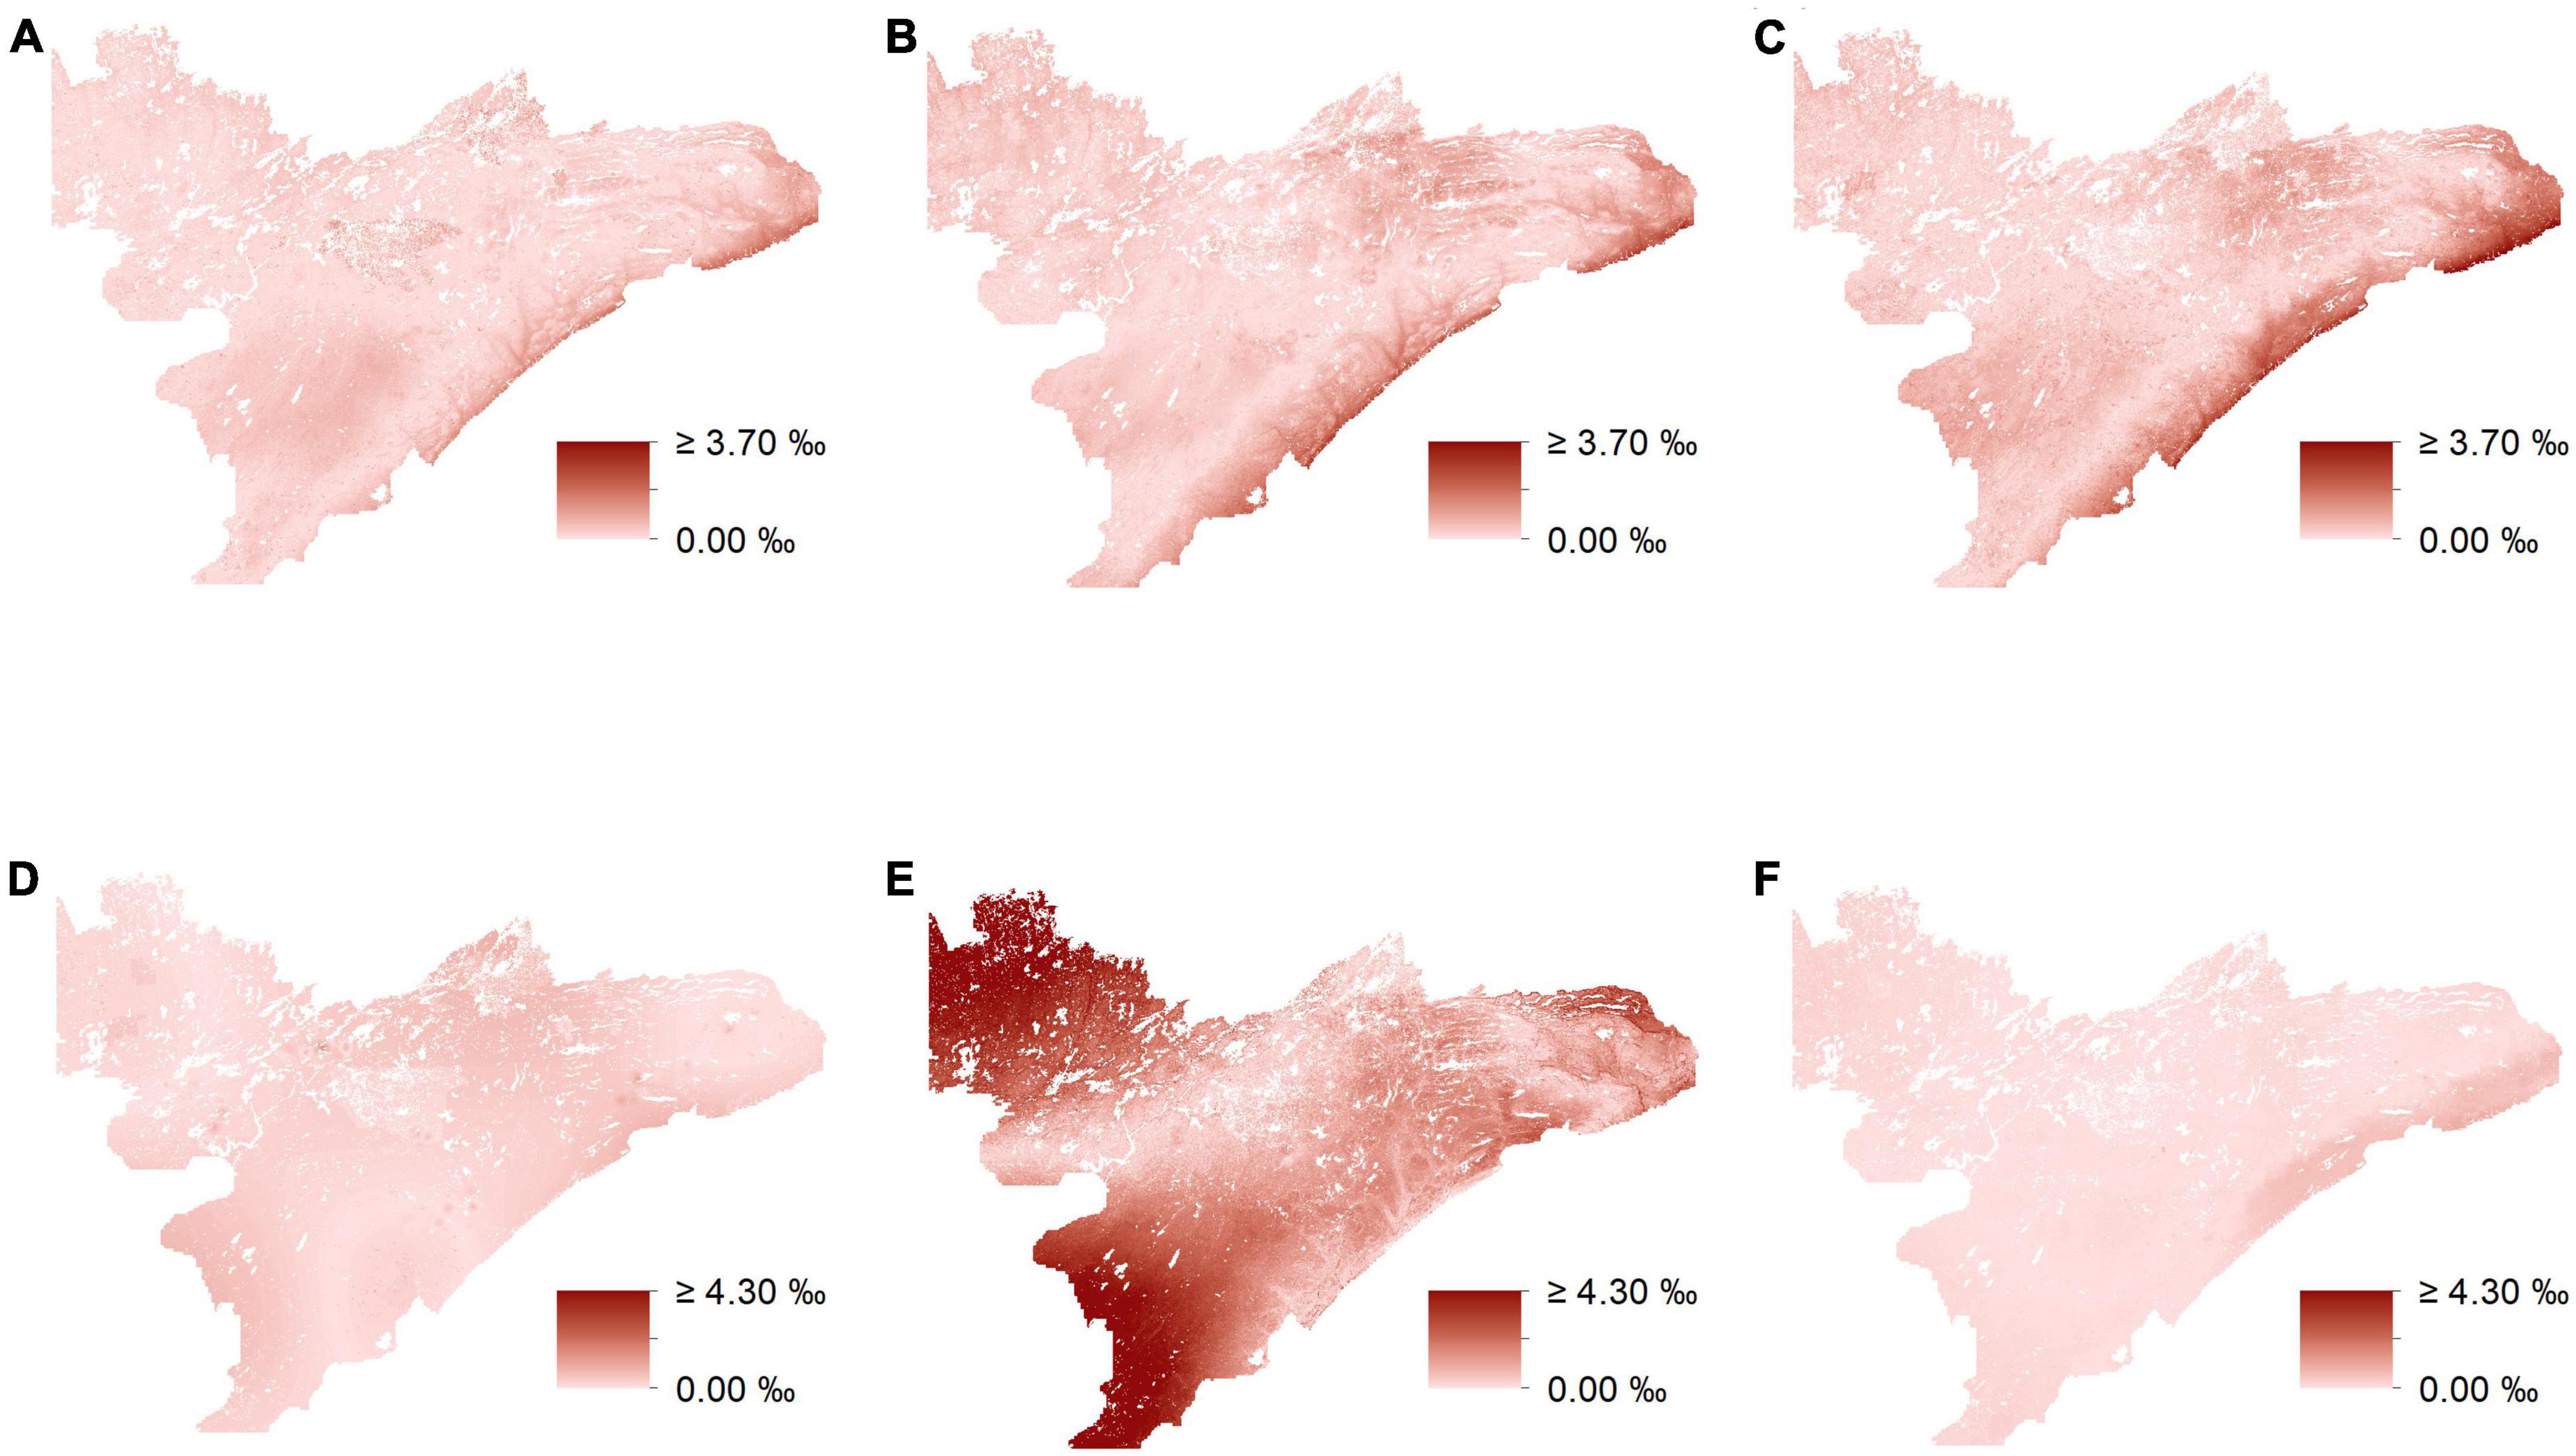
Figure 7. Differences in isoscape predictions (‰) utilizing uninformed-isotope data and biomass-informed isotopes. Maps depict the absolute values of unformed predictions minus biomass-informed predictions from mixed-effects models for δ13C and δ15N for low (A,D), respectively, mid (B,E), respectively, and high-preference forage (C,F), respectively.
Discussion
In this study, isoscape estimates based on plant groups that vary both in their abundance and isotopic composition exhibit substantial variation between models that account for abundance (i.e., biomass) and those that do not. Moreover, accounting for the abundances of different plant groups often led to the inclusion or omission of landscape covariates resulting in models that better predict variation in the isotopic landscape. However, even though some models had identical structures (e.g., δ15N for high-preference forage, both informed and uninformed), accounting for site-to-site variation in the abundance of different preference groups still led to differences in isoscape estimates (e.g., up to 1.3%, Figure 7F) that could influence the results of any study utilizing model output as an important source of inference. Overall, our results suggest that accounting for variation in the abundance of different isotopic substrates, can lead to isoscape estimates that are distinct from those that do not (Figure 7), and that better reflect the actual isotopic variation present across the landscape (CVLMER RMSE values in Supplementary appendix tables A4–7).
Currently, most models used to characterize variation in the isotopic landscape use simple linear models, however, we show here that incorporating random effects can substantially improve model fit. Incorporating random effects improved the performance of nine of our 12 isoscape models, and improved model predictive ability by as much as 87% in one instance (i.e., uninformed δ15N for mid-preference forage, RMSE = 0.92%). While the inclusion of random covariates had no influence on the performance of three of our models, this could change with the inclusion of different covariates. We used bedrock geology and disturbance as random effects for both δ13C and δ15N values. However, given our results, values of δ15N are clearly more impacted by these covariates than those of δ13C. The inclusion of different random covariates would likely influence how well these models perform. While the incorporation of random effects did not always help account for more of the variance, mixed-effects models provide researchers with a relatively simple approach to investigating mechanistic drivers underlying spatial heterogeneity.
The method we present here is flexible and easy to implement. Yet, we recognize that spatial variation in the isotopic composition of individual plants or plant parts is a spatially explicit process resulting from a series of spatiotemporally related events (Goldsmith et al., 2019). As a result, this variation both across space and through time could be characterized using a series of conditional probabilities (Taalab et al., 2015), and thus, it would be interesting to explore how the predictions of a hierarchical modeling approach compare to the predictions we present here. Additionally, estimating uncertainty becomes difficult to impossible in highly parameterized models when using a simple linear or mixed effects approach. Hierarchical spatial modeling may lead to more accurate estimates of spatial variation and any associated uncertainty, due to the ability of these models to handle high-level parameterization. This approach does not come without tradeoffs, however, as hierarchical spatial models can be difficult to implement and may be computationally expensive (Arab et al., 2008; Cavieres et al., 2021). It is our hope that the approach we present here motivates others to estimate the isotopic landscape using a hierarchical approach, such that researchers can weigh the potential costs of each approach against the prediction accuracy of these different methods to evaluate their efficacy in different analytical contexts.
Different plant species vary in their isotopic composition and therefore, methods that do not account for spatial variation in the abundance of these species may lead to a misrepresentation of the isotopic landscape. Accounting for variation in the relative abundance of different preference groups altered our estimates of the isotopic landscape by as much as 10%, equivalent to the isotopic difference estimated between two trophic levels (Flynn et al., 2018). While it is important to note that the method we present here helps identify significant variation that would typically go unnoticed, a potentially more important consideration than differences in average estimates, however, may be the refined depictions of spatial heterogeneity in these models and how it may inform our knowledge of ecological systems. For example, performance of the moose population across northeastern Minnesota is relatively heterogeneous, with the population in some areas performing relatively well, while at the same time performing poorly in other areas (DelGiudice, 2018). Because different forage-preference groups are isotopically distinct and the isotopic values for these groups are heterogeneous across the study region, moose traveling through this landscape will carry with them an isotopic signature of where they have been and what they have eaten. Thus, models that accurately characterize spatial heterogeneity in the isotopic landscape could be beneficial when evaluating how diet and habitat-use behavior of moose may be contributing to spatial heterogeneity in population performance. It is also important to note that utilizing biomass to help refine isoscape predictions will be even more useful for landscapes in which substrate groups are more isotopically distinct than that which we use here (e.g., landscapes that include C4 grasses). Finally, we recognize that the distribution of sample plots used to estimate the isotopic landscape can be highly influential. Thus, future studies should try to sample along the periphery of the study region in order to more accurately estimate the isotopic landscape in these areas.
Animal behavior is, at least in part, a manifestation of how individuals respond to heterogeneity in their environment (Dall et al., 2005), and stable isotopes are a powerful tool that makes it possible to evaluate the behavioral response of animals to this heterogeneity (Rubenstein and Hobson, 2004). Although we use a declining moose population in northeast Minnesota as our model system, the principles, concepts, and methods we apply throughout are applicable to a range of species across a variety of habitat types. For example, numerous studies have reported declines in pollinators worldwide (Potts et al., 2010; Tylianakis, 2013), with pesticide exposure and forage decline as primary drivers of this decline (Mola et al., 2021; Janousek et al., 2023; Liu et al., 2023). The approach that we present here could be used to model the abundance and distribution of both pollinator resources and threats at a range of spatial and temporal scales, thereby providing critical spatial tools necessary for successful pollinator conservation (Crowther et al., 2019; Niemuth et al., 2021; Warzecha et al., 2021). Finally, the approach to kriging that we describe here is highly flexible and broadly applicable to many scenarios in which kriging is part of the analytical process. As a result, this method could be used to model spatial variation of a range of continuous variables across a variety of spatial scales. Regardless of the application, regression kriging using mixed-effects models and the refinement of model predictions using measures of abundance, provides a flexible, yet mechanistically driven approach to modeling heterogeneity both across space and through time.
Data availability statement
The raw data supporting the conclusions of this article will be made available by the authors, without undue reservation.
Author contributions
JB, DF, and JF contributed to the study conception and design. JB, BR, and JV performed the material preparation, data collection, and analysis. JB wrote the first draft of the manuscript. All authors commented on previous versions of the manuscript, read, and approved the final manuscript.
Funding
This research was supported by the Environment and Natural Resources Trust Fund, Science to Achieve Results Graduate Fellowship (Grant No. F13B20220), the University of Minnesota Graduate School (Fellowship support for JB), and the Minnesota Experiment Station.
Conflict of interest
The authors declare that the research was conducted in the absence of any commercial or financial relationships that could be construed as a potential conflict of interest.
Publisher’s note
All claims expressed in this article are solely those of the authors and do not necessarily represent those of their affiliated organizations, or those of the publisher, the editors and the reviewers. Any product that may be evaluated in this article, or claim that may be made by its manufacturer, is not guaranteed or endorsed by the publisher.
Supplementary material
The Supplementary Material for this article can be found online at: https://www.frontiersin.org/articles/10.3389/fevo.2023.1060689/full#supplementary-material
References
Arab, A., Hooten, M. B., and Wikle, C. K. (2008). Hierarchical spatial models. Encycl. GIS 14, 425–431. doi: 10.1007/978-0-387-35973-1_564
Aurioles, D., Koch, P. L., and Le Boeuf, B. J. (2006). Differences in foraging location of Mexican and California elephant seals: Evidence from stable isotopes in pups. Mar. Mamm. Sci. 22, 326–338. doi: 10.1111/j.1748-7692.2006.00023.x
Bates, D., Maechler, M., Bolker, B., and Walker, S. (2015). Fitting linear mixed-effects models using lme4. J. Stat. Softw. 67, 1–48. doi: 10.18637/jss.v067.i01
Bivand, R. S., Pebesma, E. J., and Gomez-Rubio, V. (2013). Applied spatial data analysis with R, 2nd Edn. New York, NY: Springer. doi: 10.1007/978-1-4614-7618-4
Bivand, R., Keitt, T., and Rowlingson, B. (2018). rgdal: bindings for the “geospatial” data abstraction library. Available online at: https://CRAN.R-project.org/package=rgdal (accessed September 17, 2018).
Bowen, G. J., and Revenaugh, J. (2003). Interpolating the isotopic composition of modern meteoric precipitation. Water Resour. Res. 39:1299. doi: 10.1029/2003WR002086
Bowen, G. J., and Wilkinson, B. (2002). Spatial distribution of δ18O in meteoric precipitation. Geology 30, 315–318. doi: 10.1130/0091-7613(2002)030<0315:SDOOIM>2.0.CO;2
Cavieres, J., Monnahan, C. C., and Vehtari, A. (2021). Accounting for spatial dependence improves relative abundance estimates in a benthic marine species structured as a metapopulation. Fish. Res. 240:105960. doi: 10.1016/j.fishres.2021.105960
Cerling, T. E., Wittemyer, G., Rasmussen, H. B., Vollrath, F., Cerling, C. E., Robinson, T. J., et al. (2006). Stable isotopes in elephant hair document migration patterns and diet changes. Proc. Natl. Acad. Sci. U.S.A. 103, 371–373. doi: 10.1073/pnas.0509606102
Craig, H. (1953). The geochemistry of the stable carbon isotopes. Geochim. Cosmochim. Acta 3, 53–92. doi: 10.1016/0016-7037(53)90001-5
Crowther, L. P., Wright, D. J., Richardson, D. S., Carvell, C., and Bourke, A. F. G. (2019). Spatial ecology of a range-expanding bumble bee pollinator. Ecol. Evol. 9, 986–997. doi: 10.1002/ece3.4722
Dall, S. R. X., Giraldeau, L.-A., Olsson, O., McNamara, J. M., and Stephens, D. W. (2005). Information and its use by animals in evolutionary ecology. Trends Ecol. Evol. 20, 187–193. doi: 10.1016/j.tree.2005.01.010
Faraway, J. J. (2016). Extending the linear model with R: generalized linear, mixed effects and nonparametric regression models, second edition. Boca Raton, FL: CRC Press. doi: 10.1201/9781315382722
Feng, H., Chen, Q., Hu, Y., Du, Z., Lin, G., Wang, C., et al. (2021). Estimation of forest aboveground biomass by using mixed-effects model. Int. J. Remote Sens. 42, 8675–8690. doi: 10.1080/01431161.2021.1984611
Flynn, K. J., Mitra, A., and Bode, A. (2018). Toward a mechanistic understanding of trophic structure: Inferences from simulating stable isotope ratios. Mar. Biol. 165:147. doi: 10.1007/s00227-018-3405-0
Found, R., Baker, J. A., Fryxell, J. M., McLaren, A. A. D., Rodgers, A. R., Shuter, J., et al. (2022). Stable isotopes indicate reduced body condition of caribou in disturbed areas. Anim. Biol. 72, 415–433. doi: 10.1163/15707563-bja10092
Garten, C. T., and Taylor, G. E. (1992). Foliar δ13C within a temperate deciduous forest: Spatial, temporal, and species sources of variation. Oecologia 90, 1–7. doi: 10.1007/BF00317801
Geist, V. (1963). On the behaviour of the North American moose (Alces alces andersoni Peterson 1950) in British Columbia. Behaviour 20, 377–415. doi: 10.1163/156853963X00095
Goldsmith, G. R., Allen, S. T., Braun, S., Engbersen, N., González-Quijano, C. R., Kirchner, J. W., et al. (2019). Spatial variation in throughfall, soil, and plant water isotopes in a temperate forest. Ecohydrology 12:e2059. doi: 10.1002/eco.2059
Heinselman, M. L. (1996). The boundary waters wilderness ecosystem. Minneapolis, MN: University of Minnesota Press.
Hellmann, C., Rascher, K. G., Oldeland, J., and Werner, C. (2016). Isoscapes resolve species-specific spatial patterns in plant–plant interactions in an invaded Mediterranean dune ecosystem. Tree Physiol. 36, 1460–1470. doi: 10.1093/treephys/tpw075
Hengl, T., Heuvelink, G. B., and Rossiter, D. G. (2007). About regression-kriging: From equations to case studies. Comput. Geosci. 33, 1301–1315. doi: 10.1016/j.cageo.2007.05.001
Hiemstra, P. H., Pebesma, E. J., Twenhöfel, C. J., and Heuvelink, G. B. (2009). Real-time automatic interpolation of ambient gamma dose rates from the Dutch radioactivity monitoring network. Comput. Geosci. 35, 1711–1721. doi: 10.1016/j.cageo.2008.10.011
Janousek, W. M., Douglas, M. R., Cannings, S., Clément, M. A., Delphia, C. M., Everett, J. G., et al. (2023). Recent and future declines of a historically widespread pollinator linked to climate, land cover, and pesticides. Proc. Natl. Acad. Sci. U.S.A. 120:e2211223120. doi: 10.1073/pnas.2211223120
Jenkins, J. C., Chojnacky, D. C., Heath, L. S., and Birdsey, R. A. (2003). National-scale biomass estimators for United States tree species. For. Sci. 49, 12–35.
Keskin, H., and Grunwald, S. (2018). Regression kriging as a workhorse in the digital soil mapper’s toolbox. Geoderma 326, 22–41. doi: 10.1016/j.geoderma.2018.04.004
Kingsland, S. E. (1991). “Defining ecology as a scienceFoundations of Ecology,” in Classic papers with commentaries, eds L. A. Real and J. H. Brown (Chicago, IL: University of Chicago Press).
Lenarz, M. S., Fieberg, J., Schrage, M. W., and Edwards, A. J. (2010). Living on the edge: Viability of moose in northeastern Minnesota. J. Wildl. Manag. 74, 1013–1023. doi: 10.2193/2009-493
Lenarz, M. S., Nelson, M. E., Schrage, M. W., and Edwards, A. J. (2009). Temperature mediated moose survival in northeastern Minnesota. J. Wildl. Manag. 73, 503–510. doi: 10.2193/2008-265
Liu, F., Zhang, G., Zhang, C., Zhou, W., Xu, X., Shou, Q., et al. (2023). Pesticide exposure and forage shortage in rice cropping system prevents honey bee colony establishment. Environ. Res. 219:115097. doi: 10.1016/j.envres.2022.115097
Marshall, J. D., Brooks, J. R., and Lajtha, K. (2007). Sources of variation in the stable isotopic composition of plants. Stable Isot Ecol. Environ. Sci. 2, 22–60. doi: 10.1002/9780470691854.ch2
Miller, J. H., Crowley, B. E., Bataille, C. P., Wald, E. J., Kelly, A., Gaetano, M., et al. (2021). Historical landscape use of migratory caribou: New insights from old antlers. Front. Ecol. Evol. 8:590837. doi: 10.3389/fevo.2020.590837
Mola, J. M., Richardson, L. L., Spyreas, G., Zaya, D. N., and Pearse, I. S. (2021). Long-term surveys support declines in early season forest plants used by bumblebees. J. Appl. Ecol. 58, 1431–1441. doi: 10.1111/1365-2664.13886
Monteith, K. L., Klaver, R. W., Hersey, K. R., Holland, A. A., Thomas, T. P., and Kauffman, M. J. (2015). Effects of climate and plant phenology on recruitment of moose at the southern extent of their range. Oecologia 178, 1137–1148. doi: 10.1007/s00442-015-3296-4
Murray, D. L., Cox, E. W., Ballard, W. B., Whitlaw, H. A., Lenarz, M. S., Custer, T. W., et al. (2006). Pathogens, nutritional deficiency, and climate influences on a declining moose population. Wildl. Monogr. 166, 1–30. doi: 10.2193/0084-0173(2006)166[1:PNDACI]2.0.CO;2
Niemuth, N. D., Wangler, B., LeBrun, J. J., Dewald, D., Larson, S., Schwagler, T., et al. (2021). Conservation planning for pollinators in the U.S. Great Plains: Considerations of context, treatments, and scale. Ecosphere 12:e03556. doi: 10.1002/ecs2.3556
Ometto, J. P. H. B., Ehleringer, J. R., Domingues, T. F., Berry, J. A., Ishida, F. Y., Mazzi, E., et al. (2006). The stable carbon and nitrogen isotopic composition of vegetation in tropical forests of the Amazon Basin, Brazil. Biogeochemistry 79, 251–274. doi: 10.1007/s10533-006-9008-8
Omuto, C. T., and Vargas, R. R. (2015). Re-tooling of regression kriging in R for improved digital mapping of soil properties. Geosci. J. 19, 157–165. doi: 10.1007/s12303-014-0023-9
Owen-Smith, N., Fryxell, J. M., and Merrill, E. H. (2010). Foraging theory upscaled: The behavioural ecology of herbivore movement. Philos. Trans. R. Soc. Lond. B Biol. Sci. 365, 2267–2278. doi: 10.1098/rstb.2010.0095
Pebesma, E. J., and Bivand, R. (2005). Classes and methods for spatial data in R. Available online at: https://cran.r-project.org/doc/Rnews/ (accessed September 17, 2018).
Peek, J. M., Urich, D. L., and Mackie, R. J. (1976). Moose habitat selection and relationships to forest management in northeastern Minnesota. Wildl. Monogr. 32, 3–65.
Perala, D. A., and Alban, D. (1993). Allometric biomass estimators for aspen-dominated ecosystems in the upper Great Lakes. St. Paul, MN: U.S. Dept. of Agriculture, Forest Service, North Central Forest Experiment Station. doi: 10.2737/NC-RP-314
Potts, S. G., Biesmeijer, J. C., Kremen, C., Neumann, P., Schweiger, O., and Kunin, W. E. (2010). Global pollinator declines: Trends, impacts and drivers. Trends Ecol. Evol. 25, 345–353. doi: 10.1016/j.tree.2010.01.007
PRISM Climate Group (2017). PRISM Clim. Group. Available online at: http://prism.oregonstate.edu (accessed February 25, 2019).
Prudhomme, C., and Reed, D. W. (1999). Mapping extreme rainfall in a mountainous region using geostatistical techniques: A case study in Scotland. Int. J. Climatol. 19, 1337–1356. doi: 10.1002/(SICI)1097-0088(199910)19:12<1337::AID-JOC421>3.0.CO;2-G
R Core Team (2018). R: A language and environment for statistical computing. Vienna: R Foundation for Statistical Computing.
Raynor, E. J., Joern, A., Nippert, J. B., and Briggs, J. M. (2016). Foraging decisions underlying restricted space use: Effects of fire and forage maturation on large herbivore nutrient uptake. Ecol. Evol. 6, 5843–5853. doi: 10.1002/ece3.2304
Royle, A. J., and Rubenstein, D. R. (2004). The role of species abundance in determining breeding origins of migratory birds with stable isotopes. Ecol. Appl. 14, 1780–1788. doi: 10.1890/04-0175
Rubenstein, D. R., and Hobson, K. A. (2004). From birds to butterflies: Animal movement patterns and stable isotopes. Trends Ecol. Evol. 19, 256–263.
Severud, W. J., DelGiudice, G., and Obermoller, T. R. (2019). Association of moose parturition and post-parturition habitat with calf survival. J. Wildl. Manag. 83, 175–183. doi: 10.1002/jwmg.21570
Smith, W. B., and Brand, G. J. (1983). Allometric biomass equations for 98 species of herbs, shrubs, and small trees. Res. Note NC-299. St. Paul, MN: North Central Forest Experiment Station, Forest Service, U.S.D.A. doi: 10.2737/NC-RN-299
Still, C. J., and Powell, R. L. (2010). “Continental-scale distributions of vegetation stable carbon isotope ratios,” in Isoscapes, eds J. West, G. Bowen, T. Dawson, and K. Tu (Dordrecht: Springer), 179–193. doi: 10.1007/978-90-481-3354-3_9
Taalab, K., Corstanje, R., Mayr, T. M., Whelan, M. J., and Creamer, R. E. (2015). The application of expert knowledge in Bayesian networks to predict soil bulk density at the landscape scale. Eur. J. Soil Sci. 66, 930–941. doi: 10.1111/ejss.12282
Tylianakis, J. M. (2013). The global plight of pollinators. Science 339, 1532–1533. doi: 10.1126/science.1235464
Warzecha, D., Diekötter, T., Wolters, V., and Jauker, F. (2021). Spatial configuration and landscape context of wildflower areas determine their benefits to pollinator α- and β-diversity. Basic Appl. Ecol. 56, 335–344. doi: 10.1016/j.baae.2021.08.001
West, J. B., Bowen, G. J., Cerling, T. E., and Ehleringer, J. R. (2006). Stable isotopes as one of nature’s ecological recorders. Trends Ecol. Evol. 21, 408–414. doi: 10.1016/j.tree.2006.04.002
West, J. B., Bowen, G. J., Dawson, T. E., and Tu, K. P. (2009). Isoscapes: understanding movement, pattern, and process on Earth through isotope mapping. Berlin: Springer.
Keywords: boreal-temperate ecotone, moose, regression kriging, stable isotopes, stable isotopes of carbon, stable isotopes of nitrogen
Citation: Berini JL, Runck B, Vogeler J, Fox DL and Forester JD (2023) Estimates of woody biomass and mixed effects improve isoscape predictions across a northern mixed forest. Front. Ecol. Evol. 11:1060689. doi: 10.3389/fevo.2023.1060689
Received: 03 October 2022; Accepted: 17 April 2023;
Published: 10 May 2023.
Edited by:
Bradley S. Case, Auckland University of Technology, New ZealandReviewed by:
Xun Wang, Chinese Academy of Sciences (CAS), ChinaHaochun Zhang, Harbin Institute of Technology, China
Copyright © 2023 Berini, Runck, Vogeler, Fox and Forester. This is an open-access article distributed under the terms of the Creative Commons Attribution License (CC BY). The use, distribution or reproduction in other forums is permitted, provided the original author(s) and the copyright owner(s) are credited and that the original publication in this journal is cited, in accordance with accepted academic practice. No use, distribution or reproduction is permitted which does not comply with these terms.
*Correspondence: John L. Berini, amJlcmluaUBjYXJsZXRvbi5lZHU=