 Marcus W. Beck1*
 Douglas E. Robison2
 Gary E. RaulersonMaya C. Burke1Justin Saarinen2Christine Sciarrino2
 Edward T. Sherwood1
 David A. Tomasko3
- 1Tampa Bay Estuary Program, St. Petersburg, FL, United States
- 2Environmental Science Associates, Tampa, FL, United States
- 3Sarasota Bay Estuary Program, Sarasota, FL, United States
Native habitats in Florida face dual pressures at the land-sea interface from urban development and sea-level rise. To address these pressures, restoration practitioners require robust tools that identify reasonable goals given historical land use trends, current status of native habitats, and anticipated future impacts from coastal stressors. A restoration framework for native habitats was created for the Tampa Bay watershed that identifies current opportunities and establishes short-term (2030) targets and long-term (2050) goals. The approach was informed through a three-decade habitat change analysis and over 40 years of habitat restoration projects in the region. Although significant gains in subtidal habitats have been observed, expansion of mangroves into salt marshes and loss of native upland habitats to development highlights the need to target these locations for restoration. The long-term loss of potentially restorable lands to both coastal and upland development further underscores the diminishing restoration opportunities in the watershed. The established targets and goals identified habitats to maintain at their present level (e.g., mangroves) and those that require additional progress (e.g., oyster bars) based on past trends and an expected level of effort given the restoration history of the region. The new approach also accounts for the future effects of sea-level rise, climate change, and watershed development by prioritizing native coastal habitats relative to subtidal or upland areas. Maps were created to identify the restoration opportunities where practitioners could focus efforts to achieve the targets and goals, with methods for repeatable analyses also available using an open source workflow.
1. Introduction
The health of estuarine systems and coastal habitats is tightly linked to land use and management of the watershed (Yoskowitz and Russell, 2015). Coastal habitats provide multiple ecosystem services, including wildlife shelter and migratory corridors (Yoskowitz and Russell, 2015), fisheries production (Houde and Rutherford, 1993), water quality improvement (Kushlan, 1990; Sprandel et al., 2000; Ávila-García et al., 2020), erosion and flood attenuation (Calil et al., 2015; Menéndez et al., 2018), carbon sequestration (Dontis et al., 2020) and recreation (Chung et al., 2018). Anthropogenic stressors can negatively impact the services provided by coastal habitats and restoration practitioners must consider the anticipated effects of these stressors during planning (Elliott et al., 2007; White and Kaplan, 2017). The combined effects of land development and climate change are especially problematic for prioritizing habitat restoration activities in coastal environments. Habitat changes in response to climate change include landward migration of mangroves into salt marshes, upstream migration of salt marshes within tidal tributaries, and upland forest migration (Brinson et al., 1995; Vogelmann et al., 2012; Cavanaugh et al., 2019). Landward migration of critical habitats in response to sea-level rise may not be possible due to anthropogenic barriers in the watershed. Sea-level rise can occur quicker than landward migration of salt marshes and the upland slope may already be lost to urban development and hardening (Titus et al., 2009). Given projected habitat losses and the limited resources available, appropriate and realistic sites for restoration need to be identified that account for future stressors and past trends.
Past approaches for guiding restoration planning have been successfully used in other contexts, but they do not fully balance competing needs among public and private sectors, nor do they fully account for anticipated effects of multiple stressors. For example, an integrated watershed approach (Environmental Protection Agency, 1996) has been utilized since the early 1990s to diagnose and manage water quantity and quality problems by addressing issues within hydrologically-defined geographic areas. Additionally, the habitat mosaic approach (Henningsen, 2005) of including multiple habitat types within restoration projects has been recognized as an effective means of allowing ecosystem state changes in response to different environmental pressures (Duarte et al., 2009; Palmer, 2009). Adaptive management (Holling, 1978; Gregory et al., 2006) components have also been used to address challenges of sea-level rise, climate change, and development stressors, including monitoring to identify critical restoration decision points and needed intervention with contingency plans. Elements of each of these approaches could be combined to create a more holistic approach to guide restoration and conservation activities for coastal habitats in urban settings.
The Tampa Bay watershed (Florida, United States) is a valuable case study for developing a habitat restoration plan that addresses pervasive coastal stressors. Compared to other estuaries, the ratio of watershed to estuary area is small and the area is heavily developed with 42% of land use classified as urban and suburban residential (Southwest Florida Water Management District, 2018). A retrospective approach to setting habitat protection and restoration targets in Tampa Bay was previously used (Lewis and Robison, 1996; Robison, 2010; Cicchetti and Greening, 2011; Russell and Greening, 2015). Priority was given to restoration activities focused on habitat types that were important for a suite of estuarine faunal guilds disproportionately lost or degraded compared to a circa 1950 benchmark period considered as pre-development. Criticisms of this approach included lack of consideration for future sea-level rise and other climate change factors (Yoskowitz and Russell, 2015), use of expanded and different habitats outside the Tampa Bay watershed (Robison, 2010), lack of attention to upland or freshwater wetland habitats, and little recognition of land development trends or actual available space for restoration efforts. These challenges are shared by restoration practitioners in other coastal environments and an approach that accommodates these challenges for planning would be highly transferable.
In this paper, we describe an approach for habitat restoration and conservation planning that addresses the above challenges by considering the whole watershed, addressing historical changes, focusing on trajectories that have occurred during contemporary time periods, and considering both current and future stressors – particularly land development and sea-level rise. Current and historical data are available for most Tampa Bay habitats, representing a time period when federal, state and local regulations were in effect and regional impacts from climate change have been documented (Raabe et al., 2012; Cavanaugh et al., 2014). The approach establishes a framework that can guide both watershed-level habitat planning and site-level restoration activities and incorporates applicable elements of other habitat restoration paradigms discussed above (Palmer, 2009). The general approach includes (1) designation of habitat types by strata relative to the aquatic-terrestrial gradient, (2) quantification of historical trends by habitat types to identify appropriate future targets in coverage, and (3) identification of opportunity areas that could be used by practitioners to achieve restoration goals based on habitat type and past trajectories. These opportunity areas provide a first assessment of where restoration could occur and where on the ground assessments could be pursued to further quantify restoration potential. The outcomes of the approach are also spatially specific by providing maps to identity opportunity areas and reproducible using an open science workflow (Lowndes et al., 2017) that allows regular updates as new data become available.
2. Methods
2.1. Study area
Tampa Bay is a large open water estuary (surface area approximately 983 km2) on the west-central coast of Florida (Figure 1). The watershed covers approximately 5,872 km2, for a total combined area of approximately 6,855 km2. The climate is subtropical and within the 2020 ecotone for mangrove and salt marsh habitats. Native habitats in the watershed include pine flatwoods, forested freshwater wetlands and non-forested vegetated wetlands. The watershed is heavily developed with an estimated population of 3.3 million people in the four major counties (Rayer and Wang, 2020). Numerous anthropogenic changes have altered the natural habitats of Tampa Bay, including direct removal of habitat (e.g., dredge and fill of bay bottom, mining activities), alteration of hydrology, and destruction and fragmentation of habitat from development.
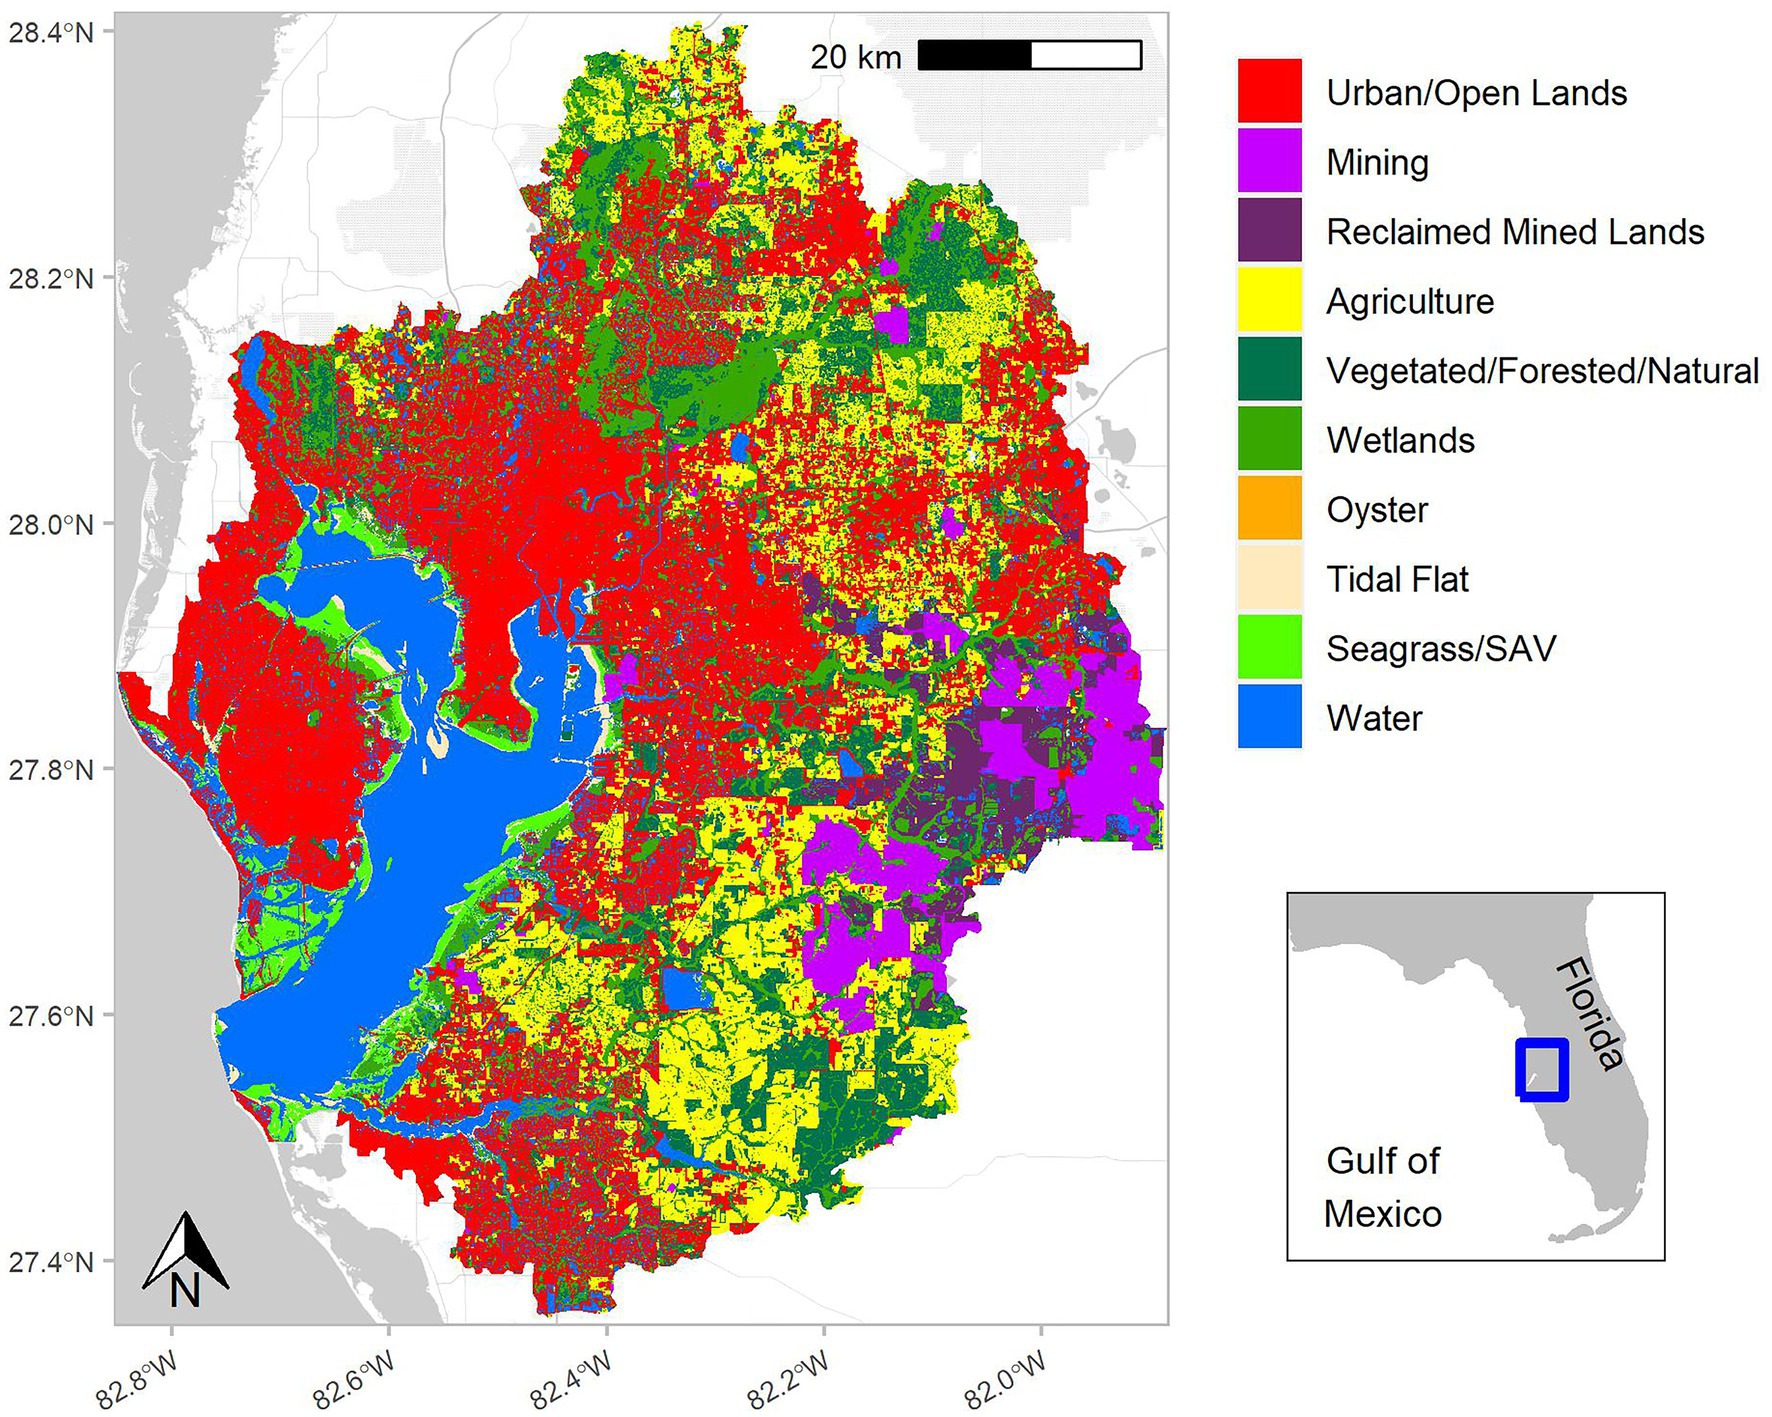
Figure 1. Land use, cover, and subtidal habitats for the Tampa Bay watershed, Florida, United States. The watershed includes the natural hydrologic boundary with minor modifications to include partners working with the Tampa Bay Estuary Program. Categories are based on the Florida Land Use Cover and Forms Classification System (Florida Department of Transportation, 1999; Southwest Florida Water Management District, 2014; Kawula and Redner, 2018) with relevant codes combined for presentation in the figure.
2.2. Habitats of Tampa Bay
The major habitat types of Tampa Bay were stratified by tidal influence and location in the watershed to define broad categories for restoration planning. Subtidal habitats included those that are submerged all or most of the time, intertidal habitats included emergent tidal wetlands that are submerged during high tides but exposed during low tides, and supratidal habitats included those that occur above the high tide line (i.e., the remainder of the watershed).
Subtidal habitats included hard bottom (Jaap and Hallock, 1990; Ash and Runnels, 2005; Kaufman, 2017; CSA Ocean Sciences, 2019), artificial reefs (Dupont, 2008), tidal flats (Moore et al., 1968; Eisma, 1998), seagrasses (Heck et al., 2003; Sherwood et al., 2017), and oyster reefs (Coen et al., 2007; Ermgassen et al., 2013). Intertidal habitats (or emergent tidal wetlands) included mangroves (Odum and McIvor, 1990), salt marshes (Comeaux et al., 2012; Raabe et al., 2012), salt barrens (Bertness, 1985; Hsieh, 2004), tidal tributaries (Sherwood, 2008; Wessel et al., 2022), and living shorelines (National Oceanic and Atmospheric Administration, 2015; Restore America’s Estuaries, 2015; Smith et al., 2018). Supratidal habitats included non-developed uplands (Meyers and Ewel, 1990), freshwater forested wetlands (Conner et al., 2007), and freshwater non-forested wetlands (Kushlan, 1990). Data sources are described below and in Supplementary Table S1. Uplands were further sub-divided into coastal and non-coastal uplands based on location relative to the 5-foot contour (~1.5 m elevation) that covers an area of land from the local Mean Lower Low Water (MLLW) elevation landward to an elevation 5 feet above Mean Sea Level. This 5-foot contour or coastal stratum is an area of intense urban development and is expected to be affected by sea-level rise based on current estimates (Burke et al., 2019). Since 1946, the St. Petersburg tidal gauge (NOAA gauge 872,650) has documented a nearly 20 cm increase in mean tidal height to present day. Projections from the year 2000 to 2,100 suggest sea levels can increase between 58 and 259 cm in the region (Burke et al., 2019). The coastal stratum within the 5-foot contour is used to better identify and prioritize coastal habitats at risk of landward migration and coastal development given that it includes the area of land within the sea level rise projections.
2.3. Approach
Coverage targets for habitat types and opportunity areas for restoration were identified by integrating multiple datasets available for the region. First, habitat status and historical trends were quantified using land use/land cover and subtidal datasets to understand relative changes that have occurred over time. Second, historic habitat restoration efforts conducted in the watershed were synthesized to inform on a practical and feasible level of effort that could be conducted by restoration practitioners in the future. The first two steps were used to identify short-term (2030) targets and long-term (2050) goals for native habitat coverage (hectares). The short-term targets provided an interim set of native habitat coverages to attain within a reasonable planning horizon, after which progress in attaining the long-term goals will be re-assessed. Finally, remaining restoration opportunities were spatially identified by combining current coverages with existing or proposed protected areas and areas anticipated to be affected by sea-level rise. As such, the approach identifies reasonable goals and targets based on past trends and provides spatially explicit information that identifies where restoration practitioners could prioritize projects based on opportunities within their respective jurisdictions.
2.4. Habitat status and trends
For the majority of subtidal, intertidal and supratidal habitats, coverages were quantified from two routine spatial assessment programs conducted by the Southwest Florida Water Management District (SWFWMD). For subtidal habitats, 2018 data were used to estimate current coverage of seagrasses, tidal flats, and oysters (Southwest Florida Water Management District, 2019). These data include vector polygon coverages of the major subtidal habitats in Tampa Bay, as interpreted from 1:24,000 scale natural color aerial photographs flown in winter 2018 under cloud free conditions. Accuracy assessments of the photo-interpreted map included field verification by random sample points, with a requirement of 90% accuracy for the seagrass categories. The minimum mapping unit for seagrass polygons is reported as 0.25 acres (~0.1 ha). Historical datasets for subtidal habitats using identical methods began in 1988 with updates occurring on an approximate biennial basis (Sherwood et al., 2017; Tomasko et al., 2020). Oyster bed coverage has been routinely estimated in these data products beginning in 2014.
Current intertidal and supratidal habitat coverages were estimated using the 2017 SWFWMD Land Use Land Cover (LULC) maps (Southwest Florida Water Management District, 2018). Land use and cover types (natural and developed) are classified following the Florida Land Use Cover and Forms Classification System (FLUCCS; Florida Department of Transportation, 1999; Southwest Florida Water Management District, 2014; Kawula and Redner, 2018). Similar methods as the subtidal habitats described above are used for the intertidal and supratidal coverage maps, although at a slightly higher spatial resolution (1:12,000). Mangroves, salt barrens, and salt marshes were reported individually. While the photointerpretation of specific freshwater wetland types is often difficult, forested wetlands and non-forested wetlands can be distinguished with these data. Therefore, all applicable FLUCCS codes representing natural freshwater wetlands were combined for these classifications. Native upland habitats were also combined in one classification. Historical estimates for all intertidal and supratidal habitats were also quantified starting with the earliest database in 1990 and occurring every 2 to 3 years until the current estimate in 2017.
To address data gaps for habitats not included in the routine SWFWMD datasets, results from special studies were compiled to obtain current estimates. These included hard bottom subtidal habitats, artificial reefs, tidal creeks, and living shorelines (Robison et al., 2020). No information on historical trends is available for these habitats.
Finally, a habitat coverage change analysis between the terminal years of data (1988 to 2018 for subtidal, 1990 to 2017 for intertidal and supratidal) was conducted to understand how habitats were changing between types. This required an intersection of the data layers to quantify if habitat types were unchanged or changed for any given location and identifying the type of change (e.g., seagrass to tidal flats). Specifically, the spatial datasets were unionized and the total areal change of the polygons for each habitat type was quantified by calculating the difference between the two terminal years. For example, the area that remained as native uplands between the 1990 and 2017 intertidal and supratidal layers was quantified, whereas the area that changed from native uplands to another habitat category was also quantified. This process was repeated for all native habitats, including developed and restorable lands (described below). The results were summarized as Alluvial diagrams showing relative proportions of habitat change by type and between years (Allaire et al., 2017).
2.5. Restoration and enhancement projects
Restoration and enhancement projects conducted over the past 40 years were quantified for each of the major habitat types to inform expectations for setting short-term targets and long-term goals. Here and throughout, restoration describes the process of assisting the recovery of an ecosystem that has been degraded, damaged, or destroyed (Gann et al., 2019). Restoration projects in the database were also those that involved earthwork to reshape the land or the addition of structural elements (e.g., rock). This distinct categorization is useful for restoration practitioners familiar with the projects in the region. Enhancement was defined as any activity not including earthwork that improved the environment (e.g., planting native vegetation, invasive species or debris removal, prescribed burns, etc.). Data were gathered from the SWFWMD Surface Water Improvement and Management Program, Federal Government Performance and Results Act reporting, the Tampa Bay Water Atlas,1 Tampa Bay Watch, and the Technical Advisory Committee of the Tampa Bay Estuary Program. The collected data included project name, year, description, size (area or length), and location (latitude and longitude). Data gaps were supplemented by archival research, site visits, contacting entities, and expert knowledge from local professionals. The synthesized dataset is available.2
2.6. Opportunity areas and restoration potential
Spatially explicit estimates of the opportunity areas and their restoration potential in the Tampa Bay watershed were obtained using a spatial analysis shown in Figure 2. The two main processes included (1) binning existing datasets into relevant categories and (2) overlaying multiple datasets to identify opportunities. Opportunity areas were defined as locations where habitat protection and restoration activities are possible and where they could occur to attain the targets and goals described above. Identifying opportunity areas is necessary to quantify the restoration potential for a particular habitat type, which is a measure of what is actually possible given underlying soil conditions, expected land use change, and sea-level rise. The identification of these areas on a broad spatial scale serves as a planning tool for restoration practitioners, where follow-up assessments are expected to more fully quantify restoration potential at selected sites.
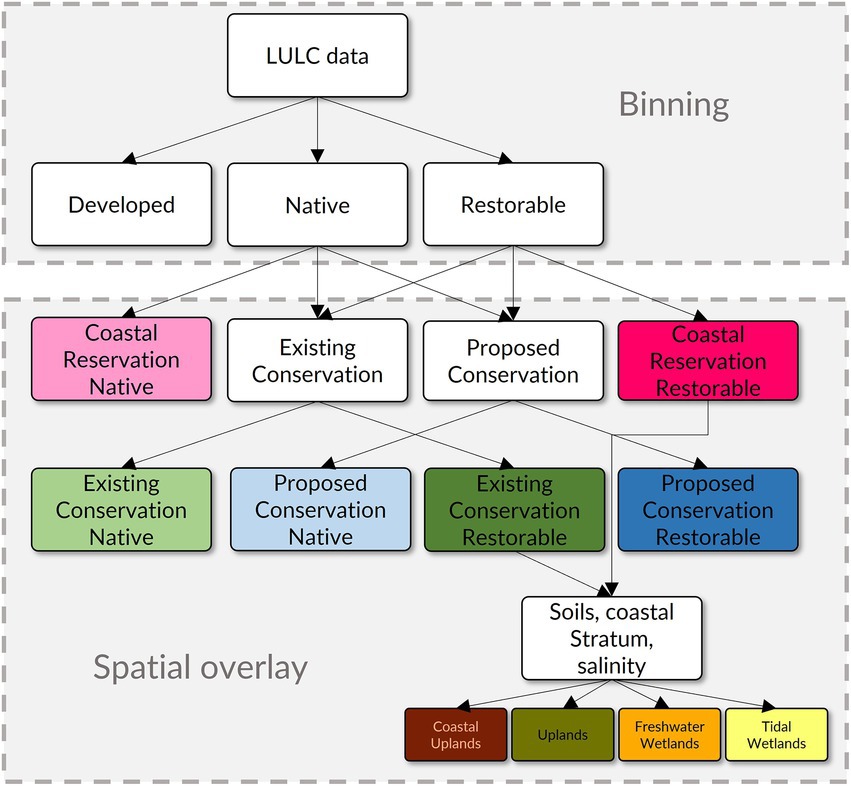
Figure 2. Spatial analysis workflow used to identify opportunity areas (existing conservation native, proposed conservation native, existing conservation restorable, proposed conservation restorable, reservation native, reservation restorable) and restoration potential (coastal uplands, uplands, freshwater wetlands, tidal wetlands) in the Tampa Bay watershed. Workflows are divided into binning of land use/land cover categories into relevant habitat types and spatial overlay of datasets to identify the opportunity areas and restoration potential. The approach was applied to both the intertidal and supratidal strata of the watershed.
The Land Use Land Cover 2017 dataset from SWFWMD was used for binning existing coverages into the relevant habitat types in the intertidal and subtidal strata. All FLUCCS classification codes were placed into one of three categories. First, native habitats were those that included the full range of natural plant communities and other habitats that are endemic to the watershed. Second, restorable habitats included existing altered but non-hardened and pervious FLUCCS codes that could potentially support native habitats through restoration. Third, existing development included developed land FLUCCS codes that are hardened and impervious (e.g., structures and pavement) and not suitable for habitat restoration.
After binning, the native and restorable lands were overlaid with additional layers to identify (1) coastal reservation native and coastal reservation restorable areas, and (2) existing and proposed native and restorable areas. Collectively, each of these unique products are considered the opportunity areas in the Tampa Bay watershed (Table 1). The coastal reservation native and coastal reservation restorable areas are native and restorable habitats, respectively, that occur in the 5-foot contour or coastal stratum and do not occur in existing or proposed conservation areas (described in the following paragraph). Native habitats in this stratum were identified as those to be reserved, whereas restorable habitats were identified as those where tidal wetlands or coastal uplands could be restored.
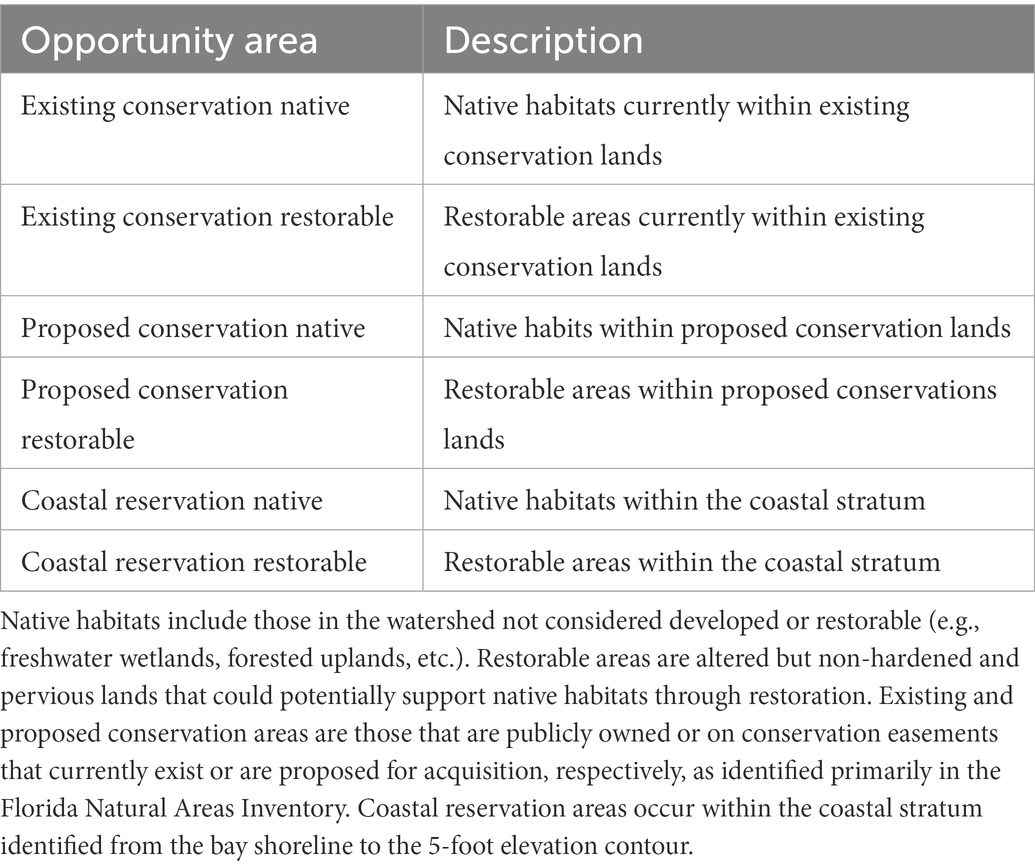
Table 1. Description of the opportunity areas in the Tampa Bay watershed identified through spatial analysis.
The existing and proposed native and restorable areas were those that occurred in public lands that are currently acquired or proposed for acquisition. To identify these areas, native and restorable lands were intersected with data created from the Florida Natural Areas Inventory (FNAI) and permit databases of conservation and drainage easements (Florida Natural Areas Inventory, 2020). The FNAI data are Florida Managed Areas as vector polygons of public and some private lands identified as having natural resource value and that are being managed at least partially for conservation. The source data for this layer are provided to FNAI directly from the managing agency in digital format or as paper maps that are digitized using appropriate topographic quadrangles, ortho-imagery, and property appraiser parcel data at a minimum spatial resolution of 1:5,000. Intersecting the native and restorable lands in these areas produced four unique opportunity areas: existing conservation native, proposed conservation native, existing conservation restorable, and proposed conservation restorable. This workflow created the existing conservation and proposed conservation layers in Figure 2.
All opportunity areas identified as restorable included coastal reservation restorable, existing conservation restorable, and proposed conservation restorable. To identify discrete habitat types that could be the goal of future restoration projects, restorable lands in the coastal stratum and on existing conservation areas (coastal reservation native and existing conservation restorable) were further grouped into their restoration potential by underlying soil types. Proposed conservation areas were excluded from the analysis to provide a more confident assessment of restoration potential in areas that have already been acquired (i.e., existing conservation) or are immediately threatened by sea-level rise and/or coastal development (i.e., the coastal stratum).
Compared to vegetation communities, soil characteristics typically change slowly (e.g., decades to centuries) in response to hydrologic impacts, unless physically disturbed (Osland et al., 2012; Stockmann et al., 2014). Therefore, soil distributions can be used to estimate historical habitat distribution and restoration potential. A soils suitability layer was used for the Tampa Bay watershed (Ries and Scheda, 2014) that classified soils as xeric, mesic, or hydric. The mesic and hydric categories were combined to represent wetland restoration potential and the xeric category was used to represent upland restoration potential. A distinction was made between tidal and freshwater wetland restoration potential by intersecting the mesic and hydric soils with the coastal stratum. Mesic or hydric soils that occur below the 5-foot contour were assigned a restoration potential for tidal wetlands, whereas mesic or hydric soils above the 5-foot contour were assigned a restoration potential for freshwater wetlands. This distinction explicitly accounts for potential salinity changes to soil properties as a function of sea-level rise based on regional projections in the time period for establishing the targets and goals.
Two distinct mapping products were created from the above analysis. The first was an opportunities map that showed areas in the watershed identified as existing conservation native, existing conservation restorable, proposed conservation native, proposed conservation restorable, coastal reservation native, and coastal reservation restorable. The second was a map that identified the restorable lands (either existing or coastal reservation) based on their restoration potential as coastal uplands, freshwater wetlands, native uplands, or tidal wetlands. All spatial analyses described above and as outlined in Figure 2 were conducted using the R statistical programming language (R Core Team, 2022), specifically leveraging functions from the tidyverse package for data wrangling (Wickham et al., 2019) and the simple features (sf) package for geospatial analysis (e.g., the st_intersection and st_union functions for intersect and union operations, Pebesma, 2018). All spatial data were transformed to the NAD83(2011) / Florida West (ftUS) projection prior to analysis. The workflows and data are provided in an open-access repository available on GitHub3 (Beck et al., 2022).
3. Results
3.1. Habitat status and trends
Current estimates and trend information on subtidal habitats were available for seagrasses, tidal flats, and oyster bars (Table 2). Oyster bars were estimated at 67 ha in 2018 (Table 2), showing a 29% increase since mapping began in 2014. The increase in oyster bars may represent improved ground-truthing and photointerpretation. Tidal flats have generally increased from 1988 to the mid − 2000s, followed by a decrease to present. The current estimate for tidal flats is 6,569 hectares, showing a 24% decline compared to the 1988 estimate of 8,700 hectares. Seagrasses have increased by 75% (6,986 ha) since 1988 to a current estimate of 16,293 ha. The change analysis comparing 1988 to 2018 for subtidal habitats (Figure 3) confirmed trends in Table 2 and showed that the seagrass increases were primarily associated with the colonization of non-vegetated areas of tidal flats, as well as unclassified areas of open water. Current estimates for subtidal habitats without historical trend information included 171 ha for hard bottom habitat and 67 hectares for artificial reefs.
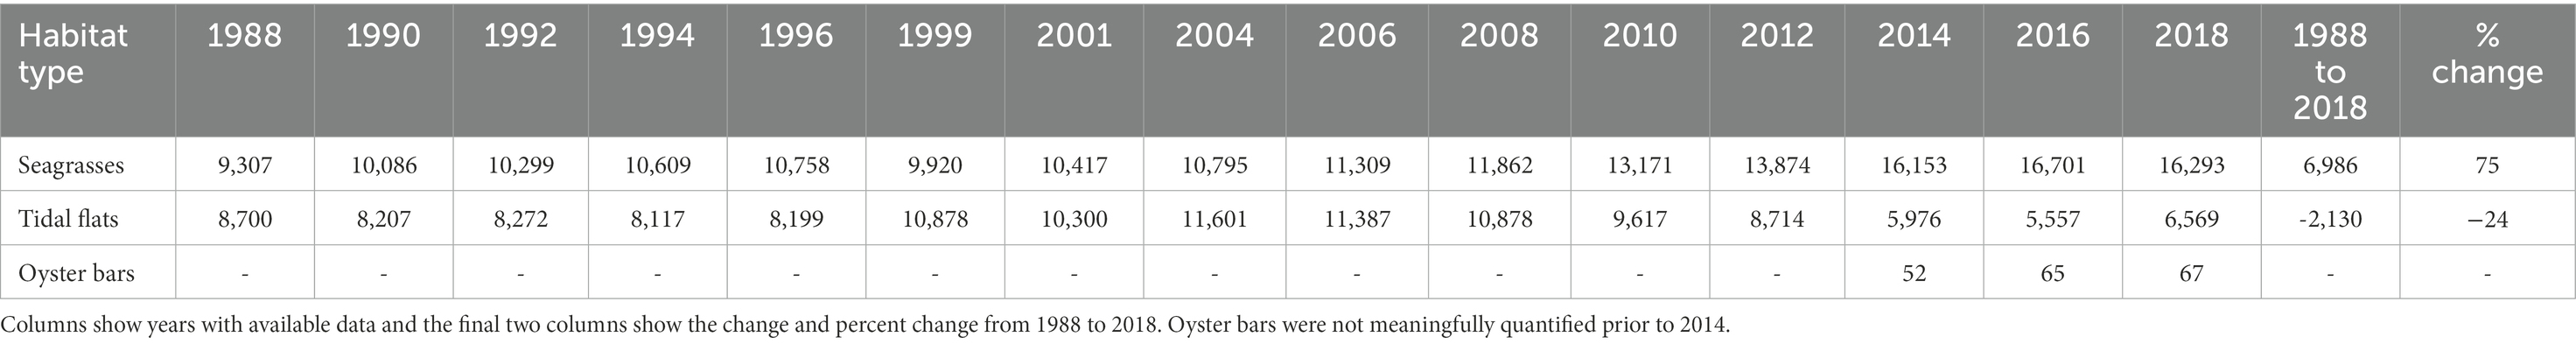
Table 2. Change over time in hectares for subtidal habitats in Tampa Bay.
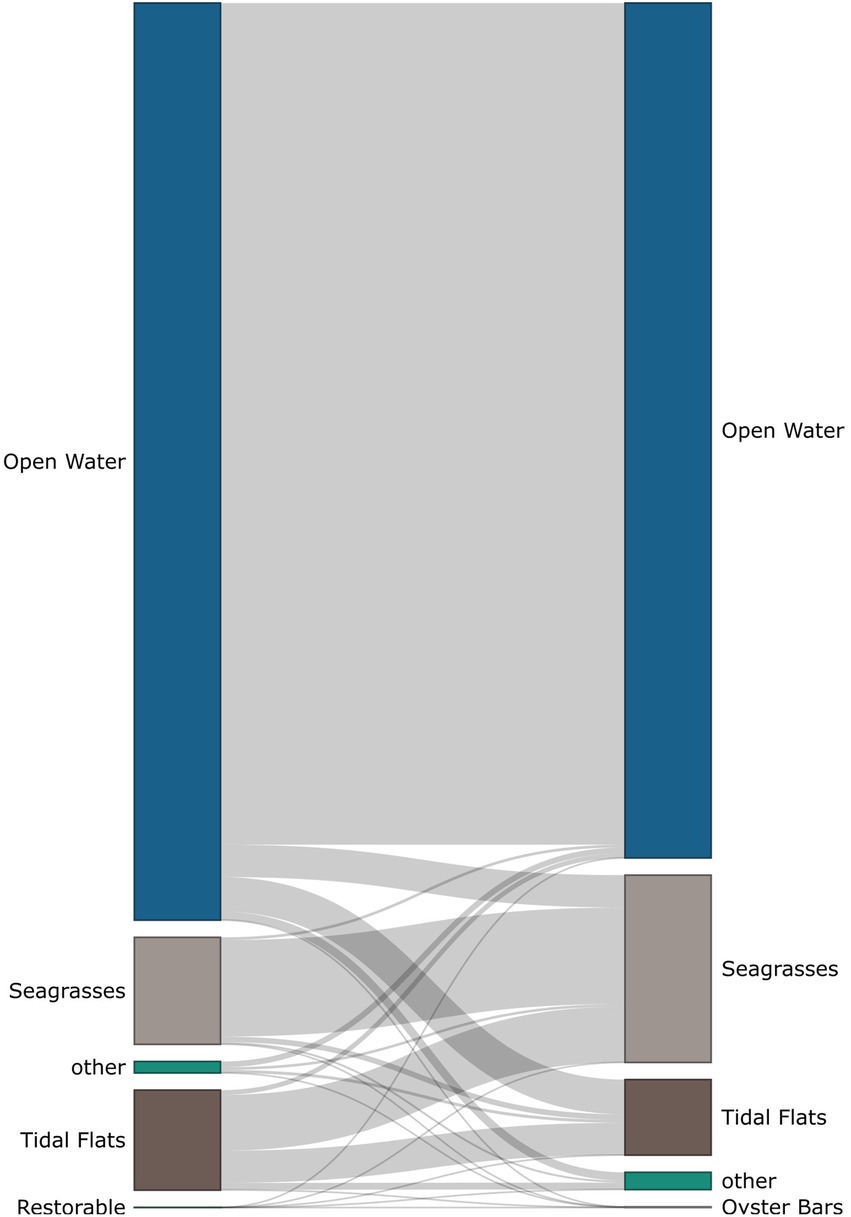
Figure 3. Change analysis of habitat categories in the subtidal strata of the Tampa Bay watershed. The left column shows relative areas in 1988 and the right column shows relative areas in 2018 for each habitat category, where the bar heights are proportional to extents in each year. The grey lines show the proportional change in area of each habitat category between the years.
Total intertidal habitat (mangroves, salt barrens, and salt marshes) increased by 12% to 8,340 ha from 1990 to 2017 (Table 3). Mangroves increased by 15% to 6,276 ha, salt barrens increased by 7% to 203 ha, and salt marshes increased by 3% to 1,861 ha. Despite a net increase in salt marsh habitat, the change analysis showed that 153 ha were replaced by mangroves (Figure 4). The current extent of tidal tributary length is 622 km (no trend information is available).
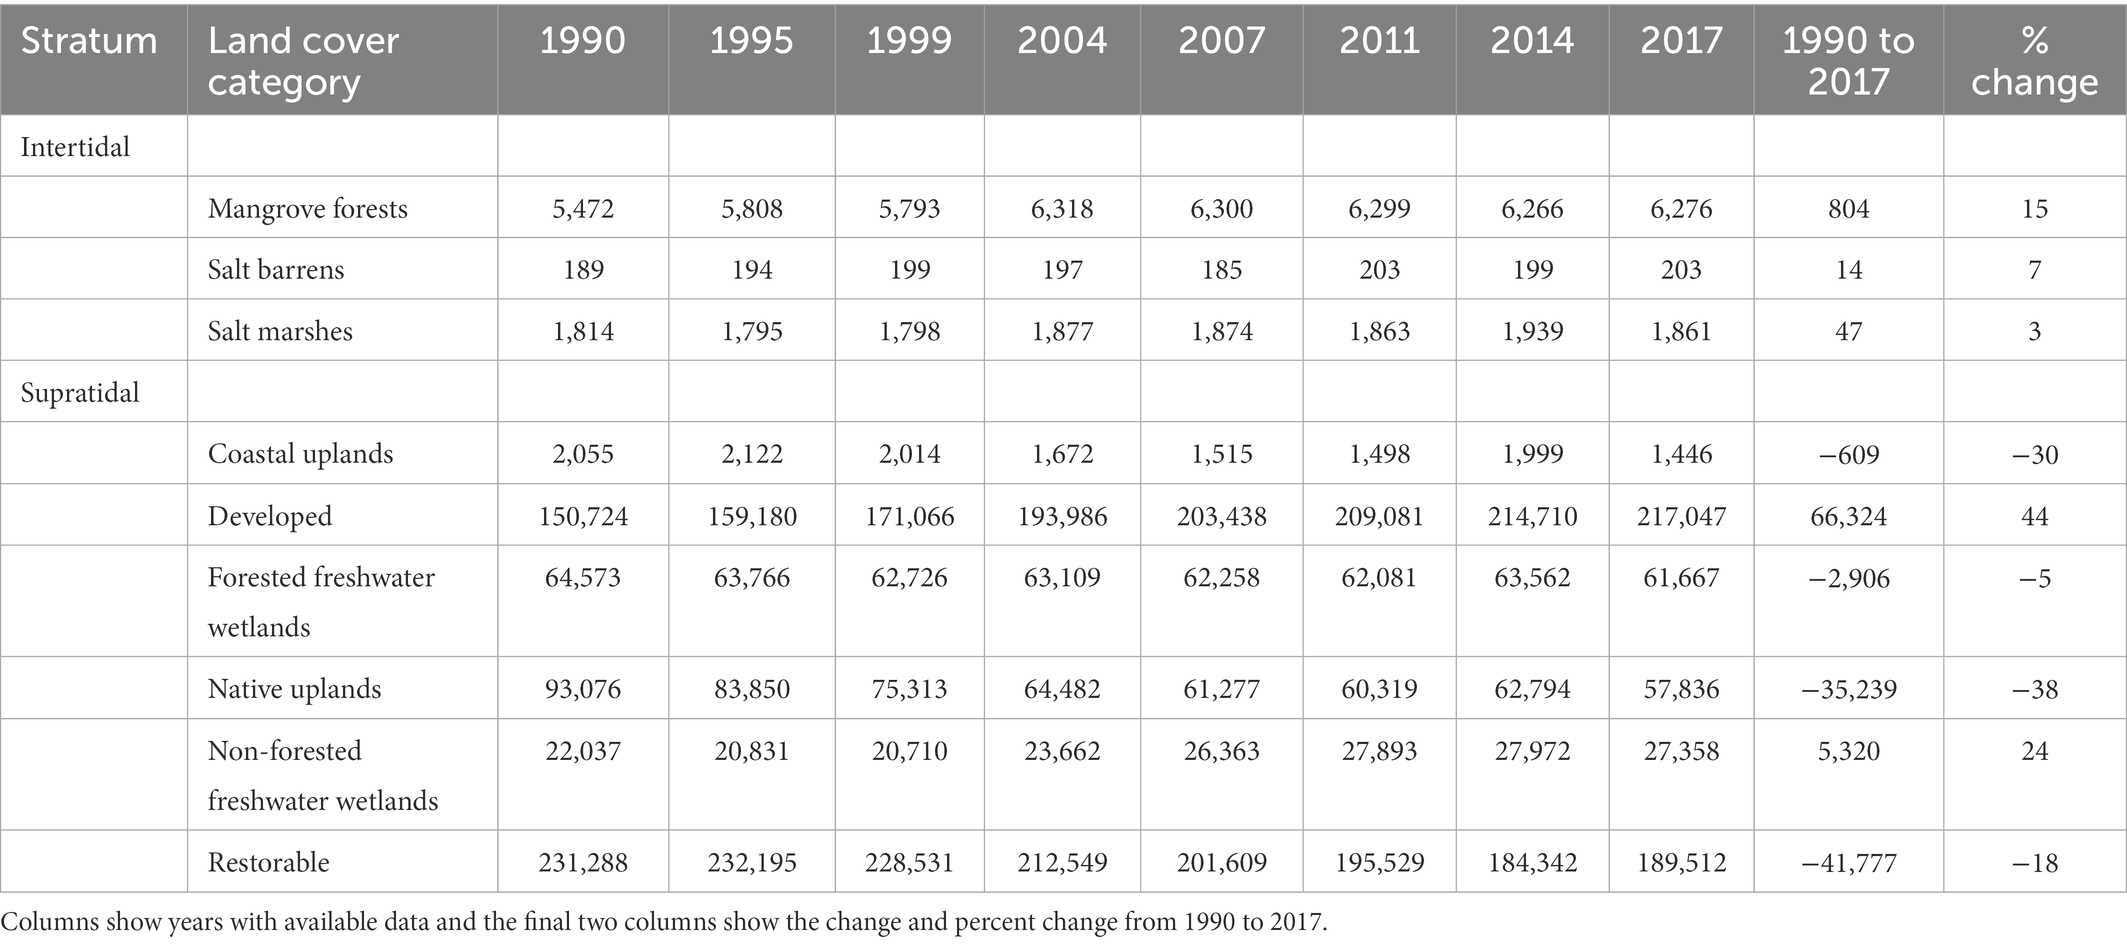
Table 3. Change over time in hectares for intertidal and supratidal land cover in Tampa Bay.
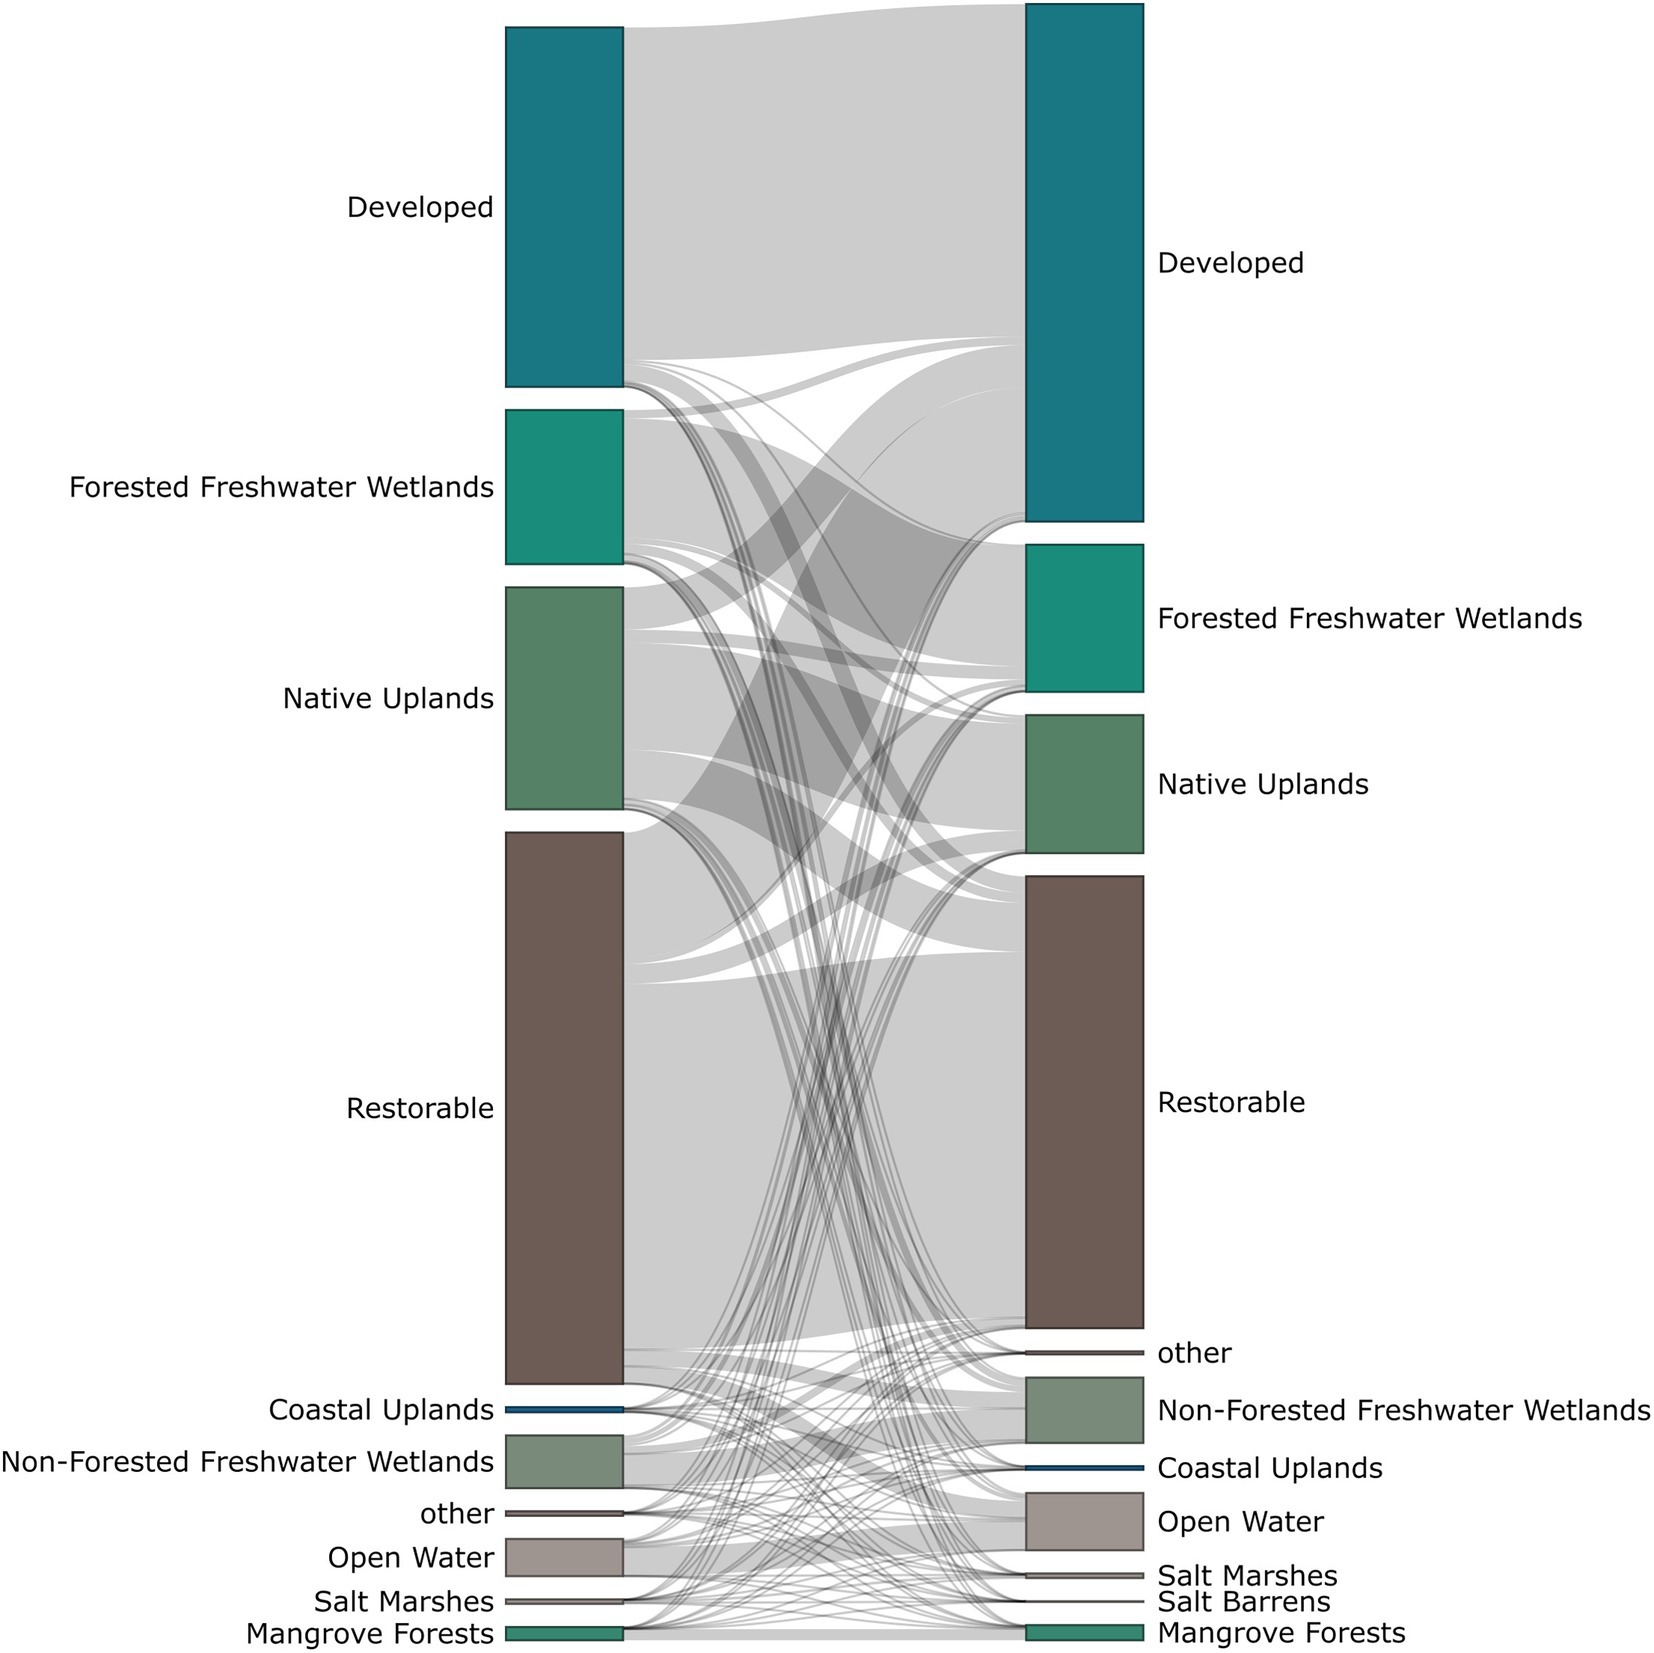
Figure 4. Change analysis of habitat categories in the intertidal and supratidal strata of the Tampa Bay watershed. The left column shows relative areas in 1990 and the right column shows relative areas in 2017 for each habitat category, where the bar heights are proportional to extents in each year. The grey lines show the proportional change in area of each habitat category between the years.
Trend assessments for supratidal habitats showed the effects of increasing land development and loss of restorable habitats in the Tampa Bay watershed (Table 3). Developed lands increased by 44% to 217,047 ha from 1990 to 2017. Coastal uplands decreased by 30% to 1,446 ha, native uplands decreased by 38% to 57,836 ha, and restorable lands decreased by 18% to 189,512 ha. Non-forested freshwater wetlands increased by 24% to 27,358 ha, whereas forested freshwater wetlands decreased by 5% to 61,667 ha. The change analysis (Figure 4) showed that a majority of conversion to developed lands came from restorable areas (21,292 ha) and native uplands (7,184 ha), with smaller proportions converted from forested freshwater wetlands (1,407 ha) and coastal uplands (193 ha). Habitats converted to restorable areas primarily included native uplands (8,304 ha), forested freshwater wetlands (1,700 ha), and developed lands (2,794 ha). The increase in non-forested freshwater wetlands was primarily from restorable lands (2,759 ha).
3.2. Habitat restoration and enhancement
A total of 460 restoration projects were documented in Tampa Bay and its watershed between 1971 and 2019. These projects were divided among habitat types that included estuarine (n = 228), freshwater (n = 53), uplands (n = 119), and a mix of all three (n = 60). A total of 1,978 ha have been restored, whereas 12,930 ha and 42.8 km (as shoreline or tributaries) were enhanced. Forty partners were responsible for these projects, although some were from departments within the same agency. Eighty-nine living shoreline projects, seawall enhancements, and oyster reef installations were documented, totaling 18.2 km. Although projects were documented for the whole period of record, few projects were completed prior to 1990. From 1990 to 2010 and from 2010 to 2019, an annual mean of 68 ha/yr. and 81 ha/yr. of habitat was restored, respectively. These means were used to define appropriate expectations for future restoration, described below.
3.3. Summary of opportunity areas and restoration potential
The current extent of each habitat type is shown in Table 4 as summaries for the opportunity areas and restoration potential. The extent of each habitat in existing conservation lands and proposed conservation lands is shown. Summaries of the restoration potential under existing and proposed conservation lands is also shown. Most restoration opportunities on existing conservation lands are for native uplands and freshwater wetlands. Less opportunities exist for intertidal wetlands (mangrove forests, salt barrens, and salt marshes). These summaries are also shown spatially in Figures 5, 6.
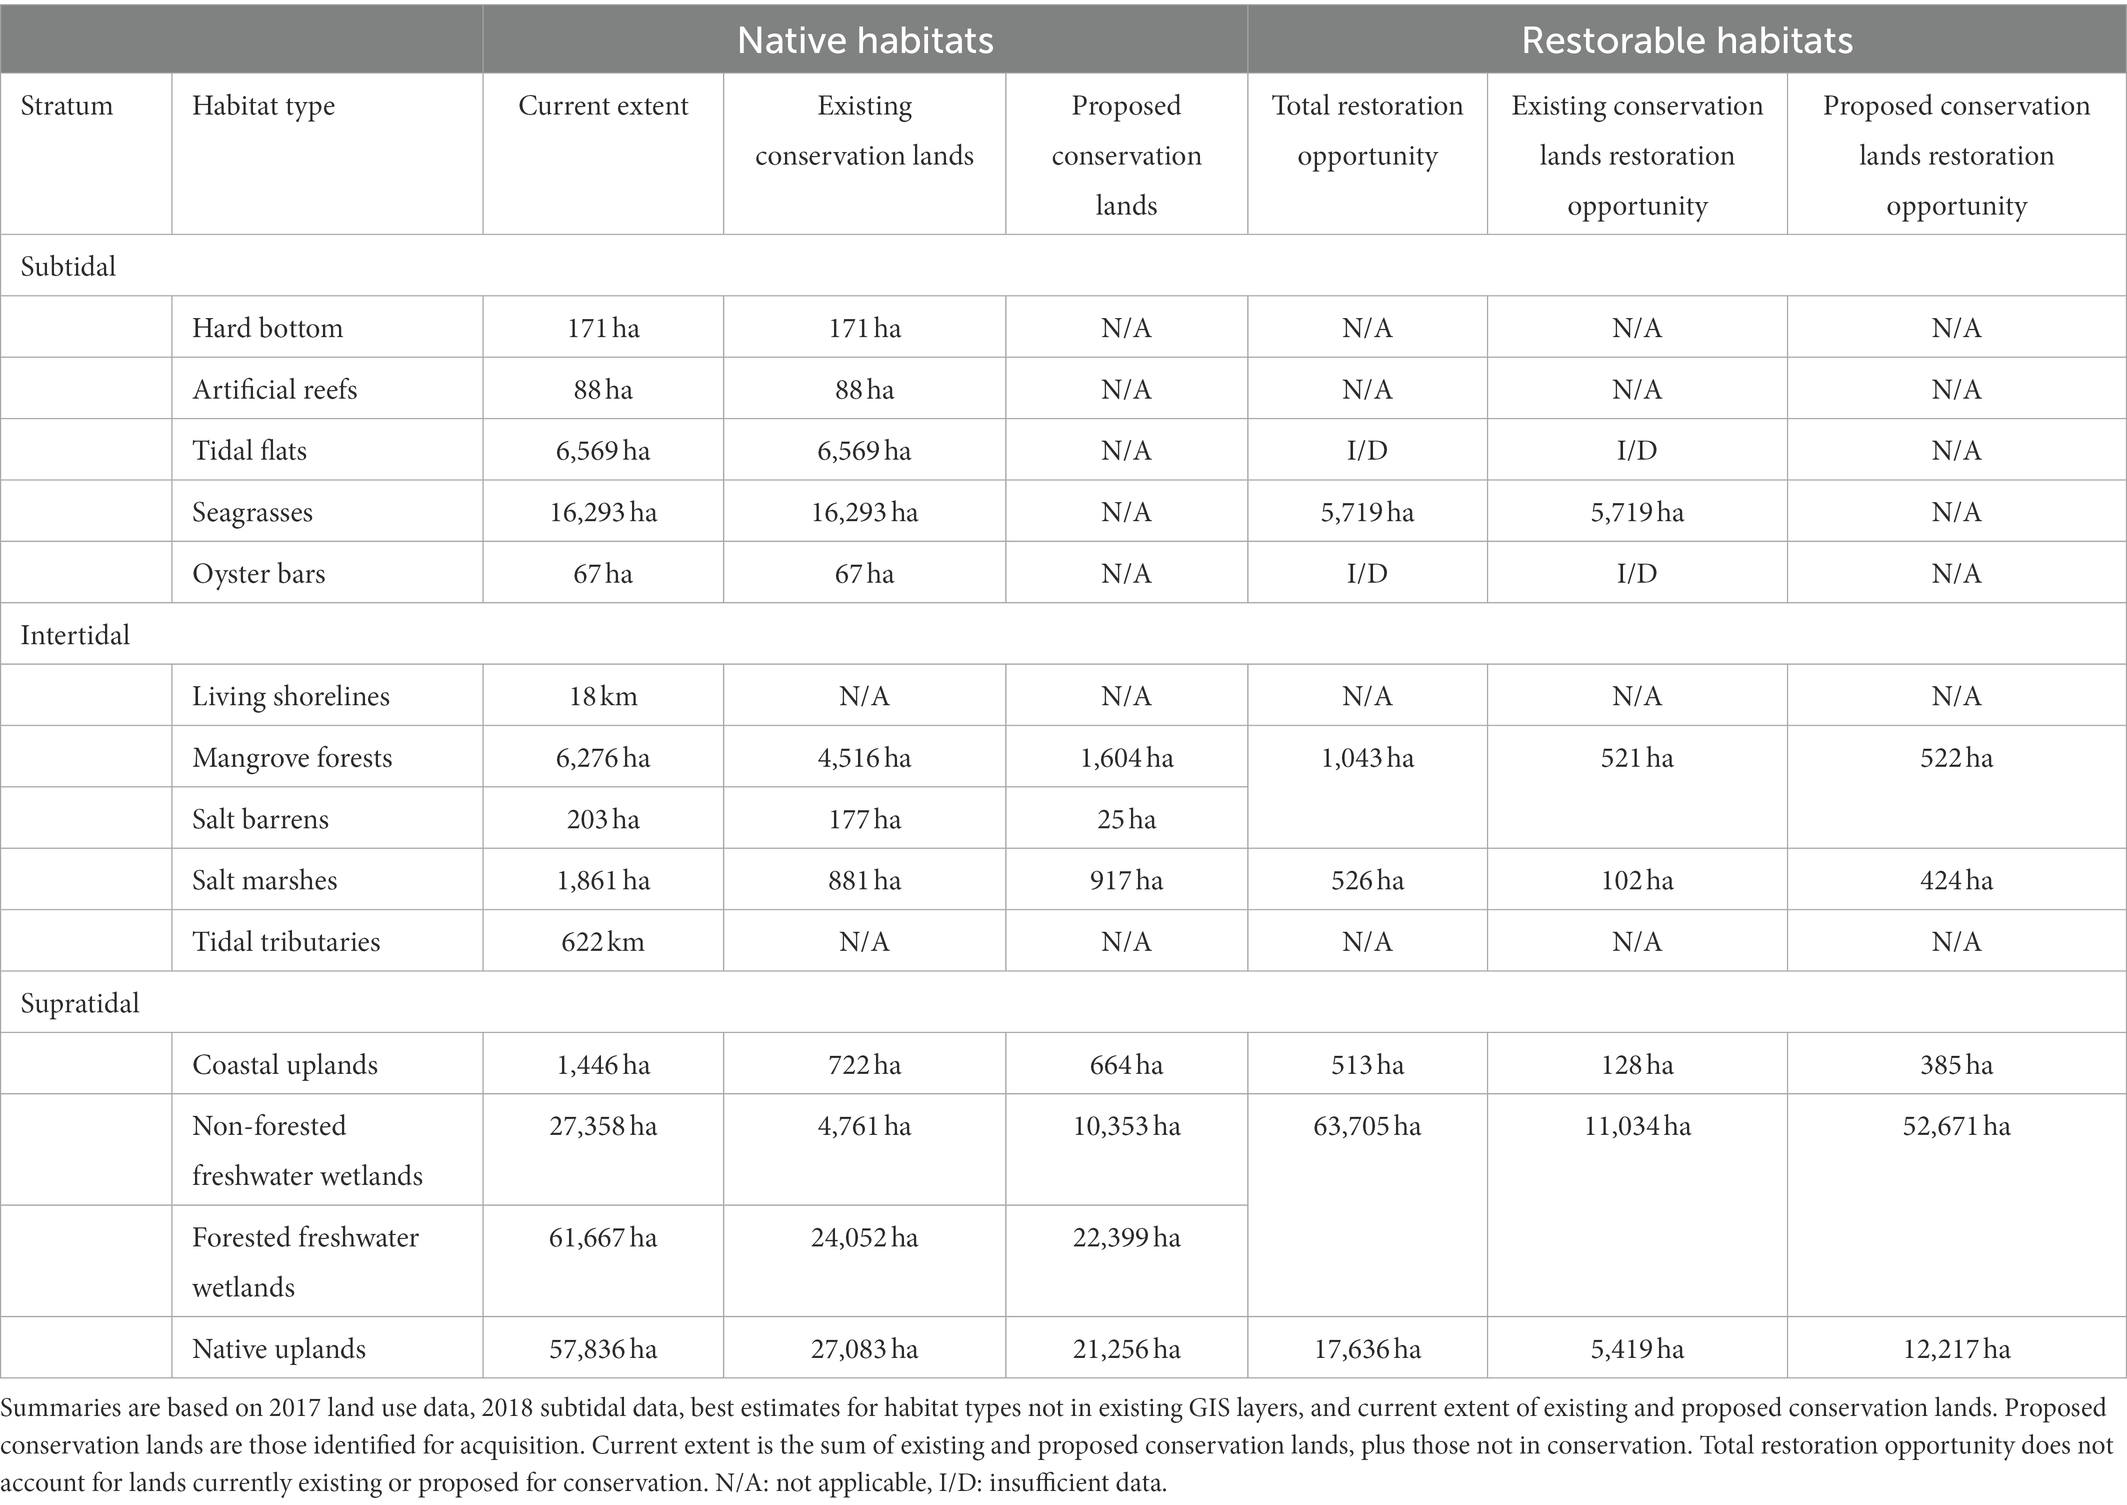
Table 4. Summary of habitat restoration opportunities in the Tampa Bay watershed.
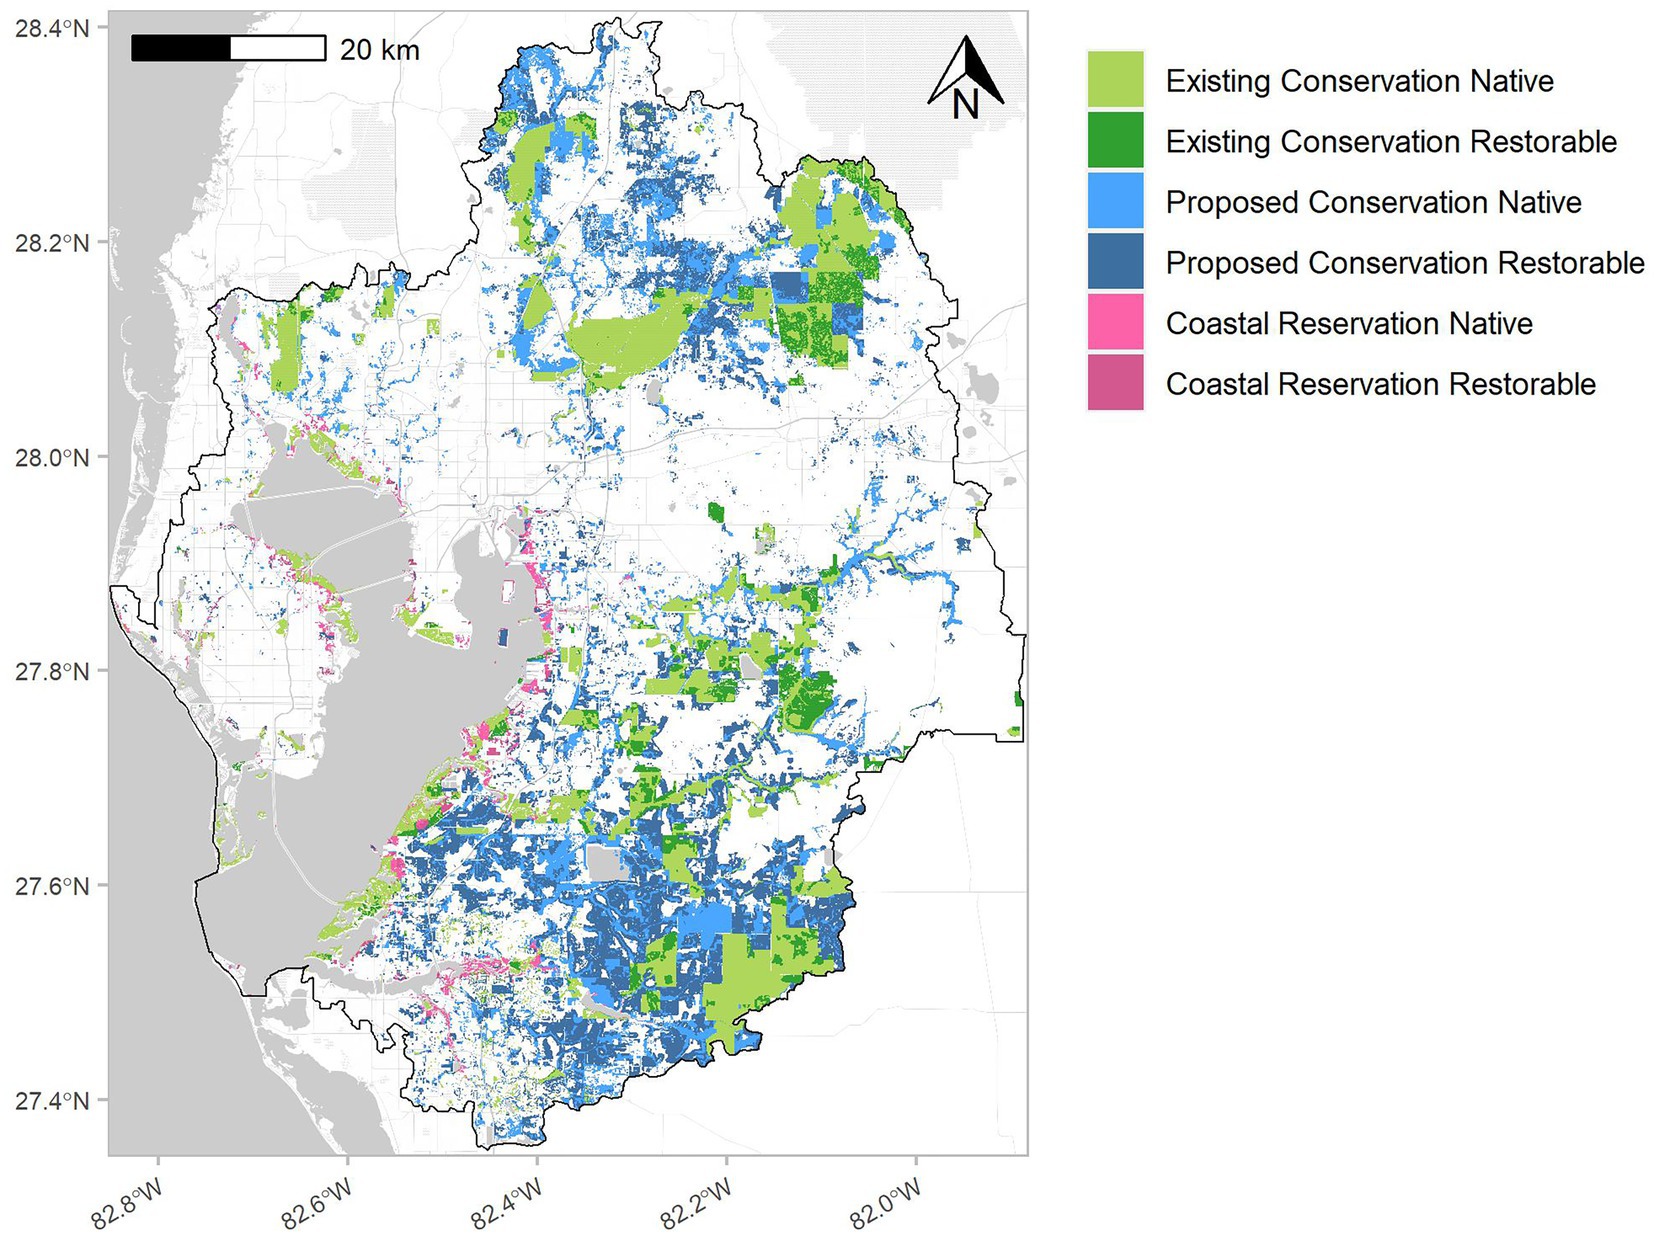
Figure 5. Opportunity areas for habitat restoration in the Tampa Bay watershed. Green indicates existing conservation, blue indicates proposed conservation, and pink indicates reservation opportunities. Each category is also grouped into native and restorable habitats. The outline is the Tampa Bay watershed.
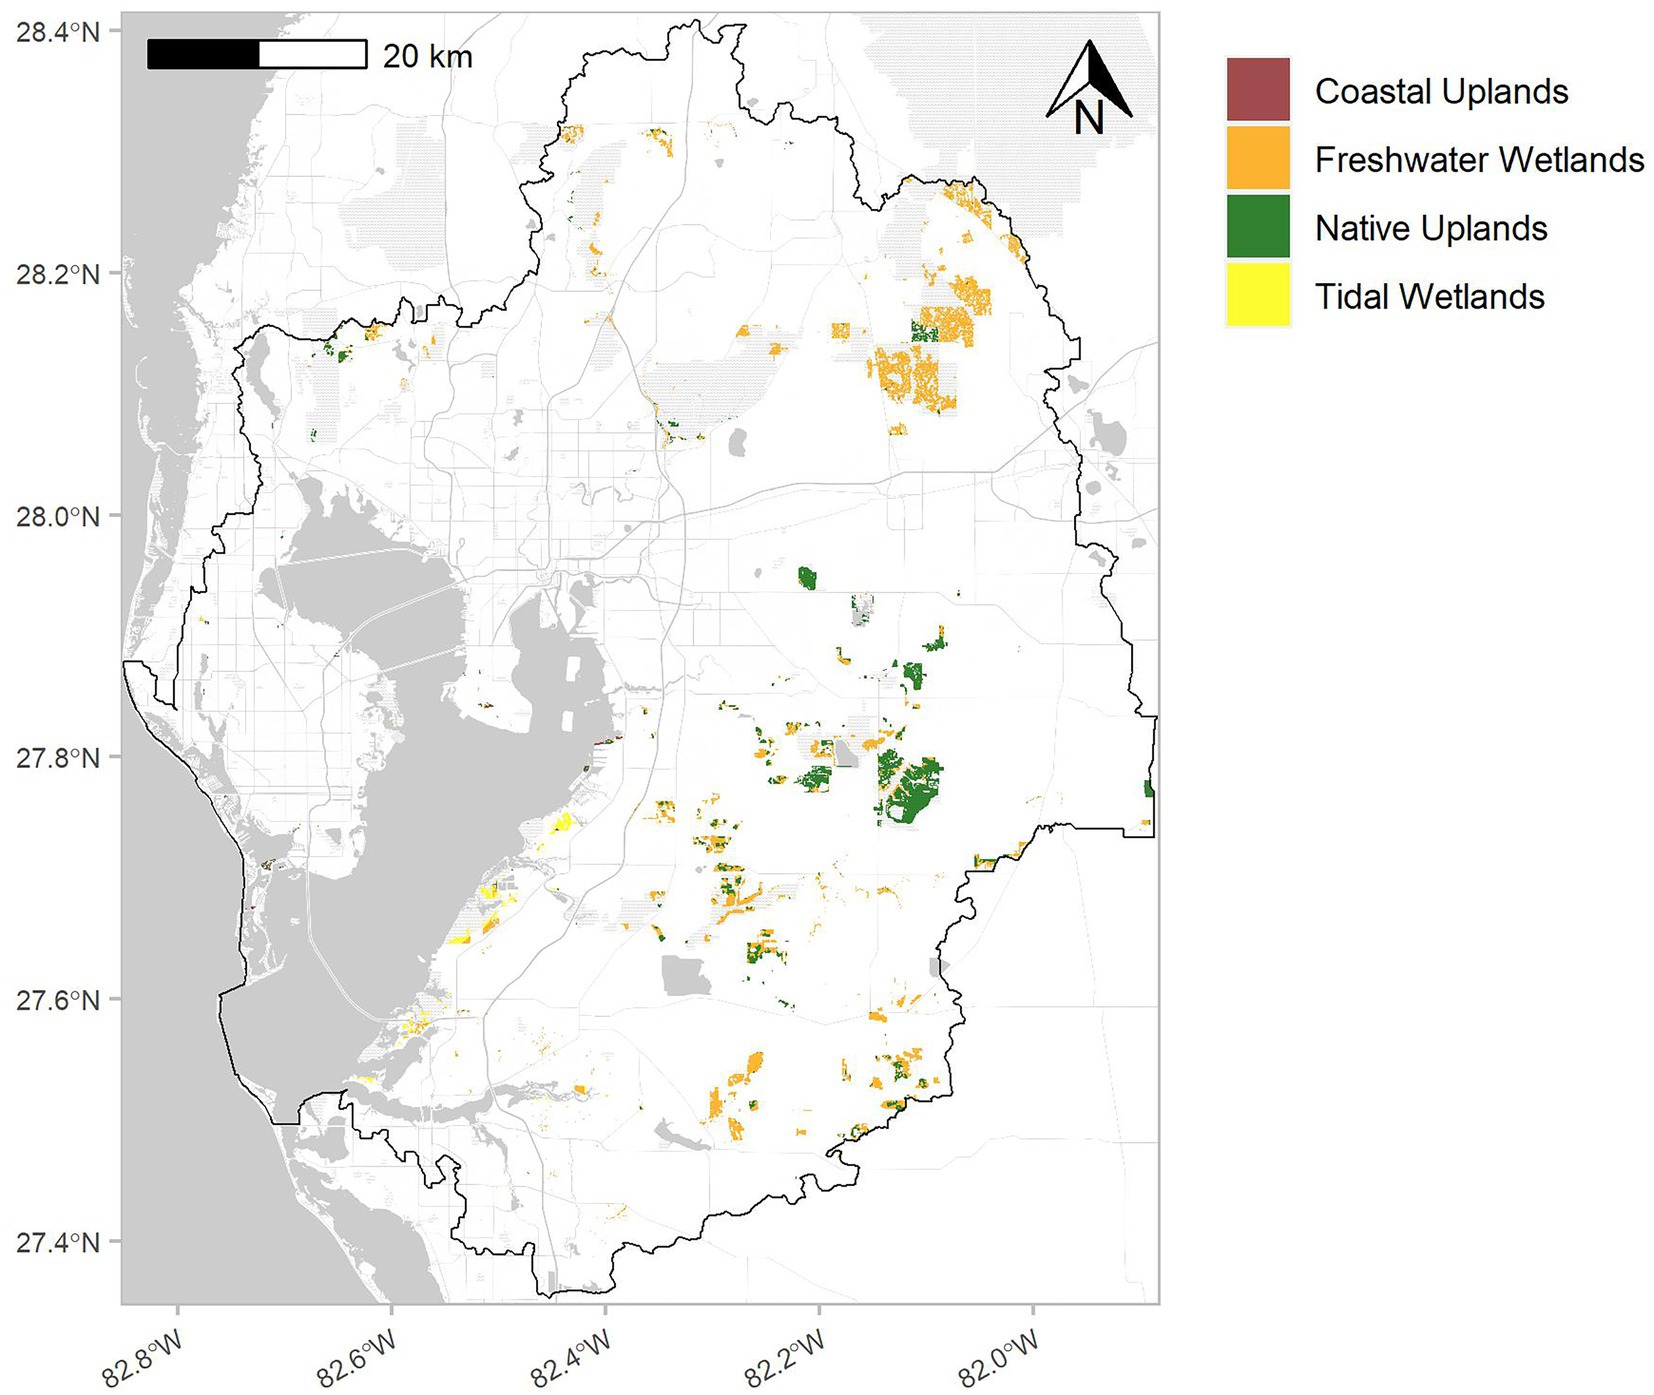
Figure 6. Habitat restoration potential in the Tampa Bay watershed. Areas are identified as those where habitat restoration could target the four identified categories as coastal uplands, freshwater wetlands, native uplands, or tidal wetlands. Categories are based on the opportunity areas, soil types, and coastal boundaries. The outline is the Tampa Bay watershed.
The map of the remaining opportunity areas provided a spatial summary of where practitioners could target future restoration projects (Figure 5). Native habitats currently protected (existing conservation native), proposed for protection (proposed conservation native), or in the coastal stratum (coastal reservation native) totaled 119,410 ha (20.3% of the watershed above MLLW). Similarly, restorable lands currently protected (existing conservation restorable), proposed for protection (proposed conservation restorable), or in the coastal stratum (coastal reservation restorable) totaled 83,423 ha (14.2% of the watershed). Understandably, most of the native and restorable lands occurred in undeveloped areas in northern and southeastern areas of the watershed (Figure 6). Existing conservation lands (existing conservation native, existing conservation restorable) totaled 79,396 ha (13.5% of the watershed) and proposed conservation lands (proposed conservation native, proposed conservation restorable) totaled 123,437 ha (21% of the watershed). Reservation areas in the coastal stratum (coastal reservation native, coastal reservation restorable) totaled 6,498 ha (1.1% of the watershed).
Combining the restorable lands on existing conservation areas and in the coastal stratum with soils data provided a spatial summary of the restoration potential grouped by habitat type (Figure 6). A total of 17,205 ha (2.9% of the watershed) of potentially restorable lands on existing conservation areas were identified, further partitioned as coastal uplands (128 ha, < 0.1% of the watershed), freshwater wetlands (11,034 ha, 1.9% of the watershed), native uplands (5,419 ha, 0.9% of the watershed), or tidal wetlands (624 ha, 0.1% of the watershed).
3.4. Establishment of targets and goals
Identifying short-term (2030) targets and long-term (2050) goals for the restoration extent of native habitats in Tampa Bay was informed by the assessment of current extents, past trends, and relative effort for past restoration and enhancement projects. These targets and goals do not consider an explicit projection of how habitats are expected to change as a result of climate change and anticipated development because no such estimates are available. However, the methods implicitly account for these anticipated changes by differentiating the watershed by strata and setting the targets and goals based on past trends that are affected both by climate change and development trajectories. The methods herein provide the best estimate of what restoration is likely to be achieved over the next few decades.
Table 5 shows the targets and goals identified through this analysis and the associated rationale. For example, the targets and goals are established based on the current extent and informed by the restoration potential. If restoration potential exists and coverage restored from past projects suggests a reasonable level of effort, the targets and goals reflect the current extent relative to the restoration opportunity, past trends, and anticipated effort. Conversely, other habitats with no identified restoration opportunity, or with sufficient current extents (e.g., mangrove forests), were assigned targets and goals similar to the current extent, i.e., these habitats should be protected and further restoration will only increase resilience. The proposed targets and goals do not represent the current extent plus restoration potential for these reasons. Implicit in the targets and the goals is recurring re-assessment over time to evaluate progress and adjust expectations as appropriate.
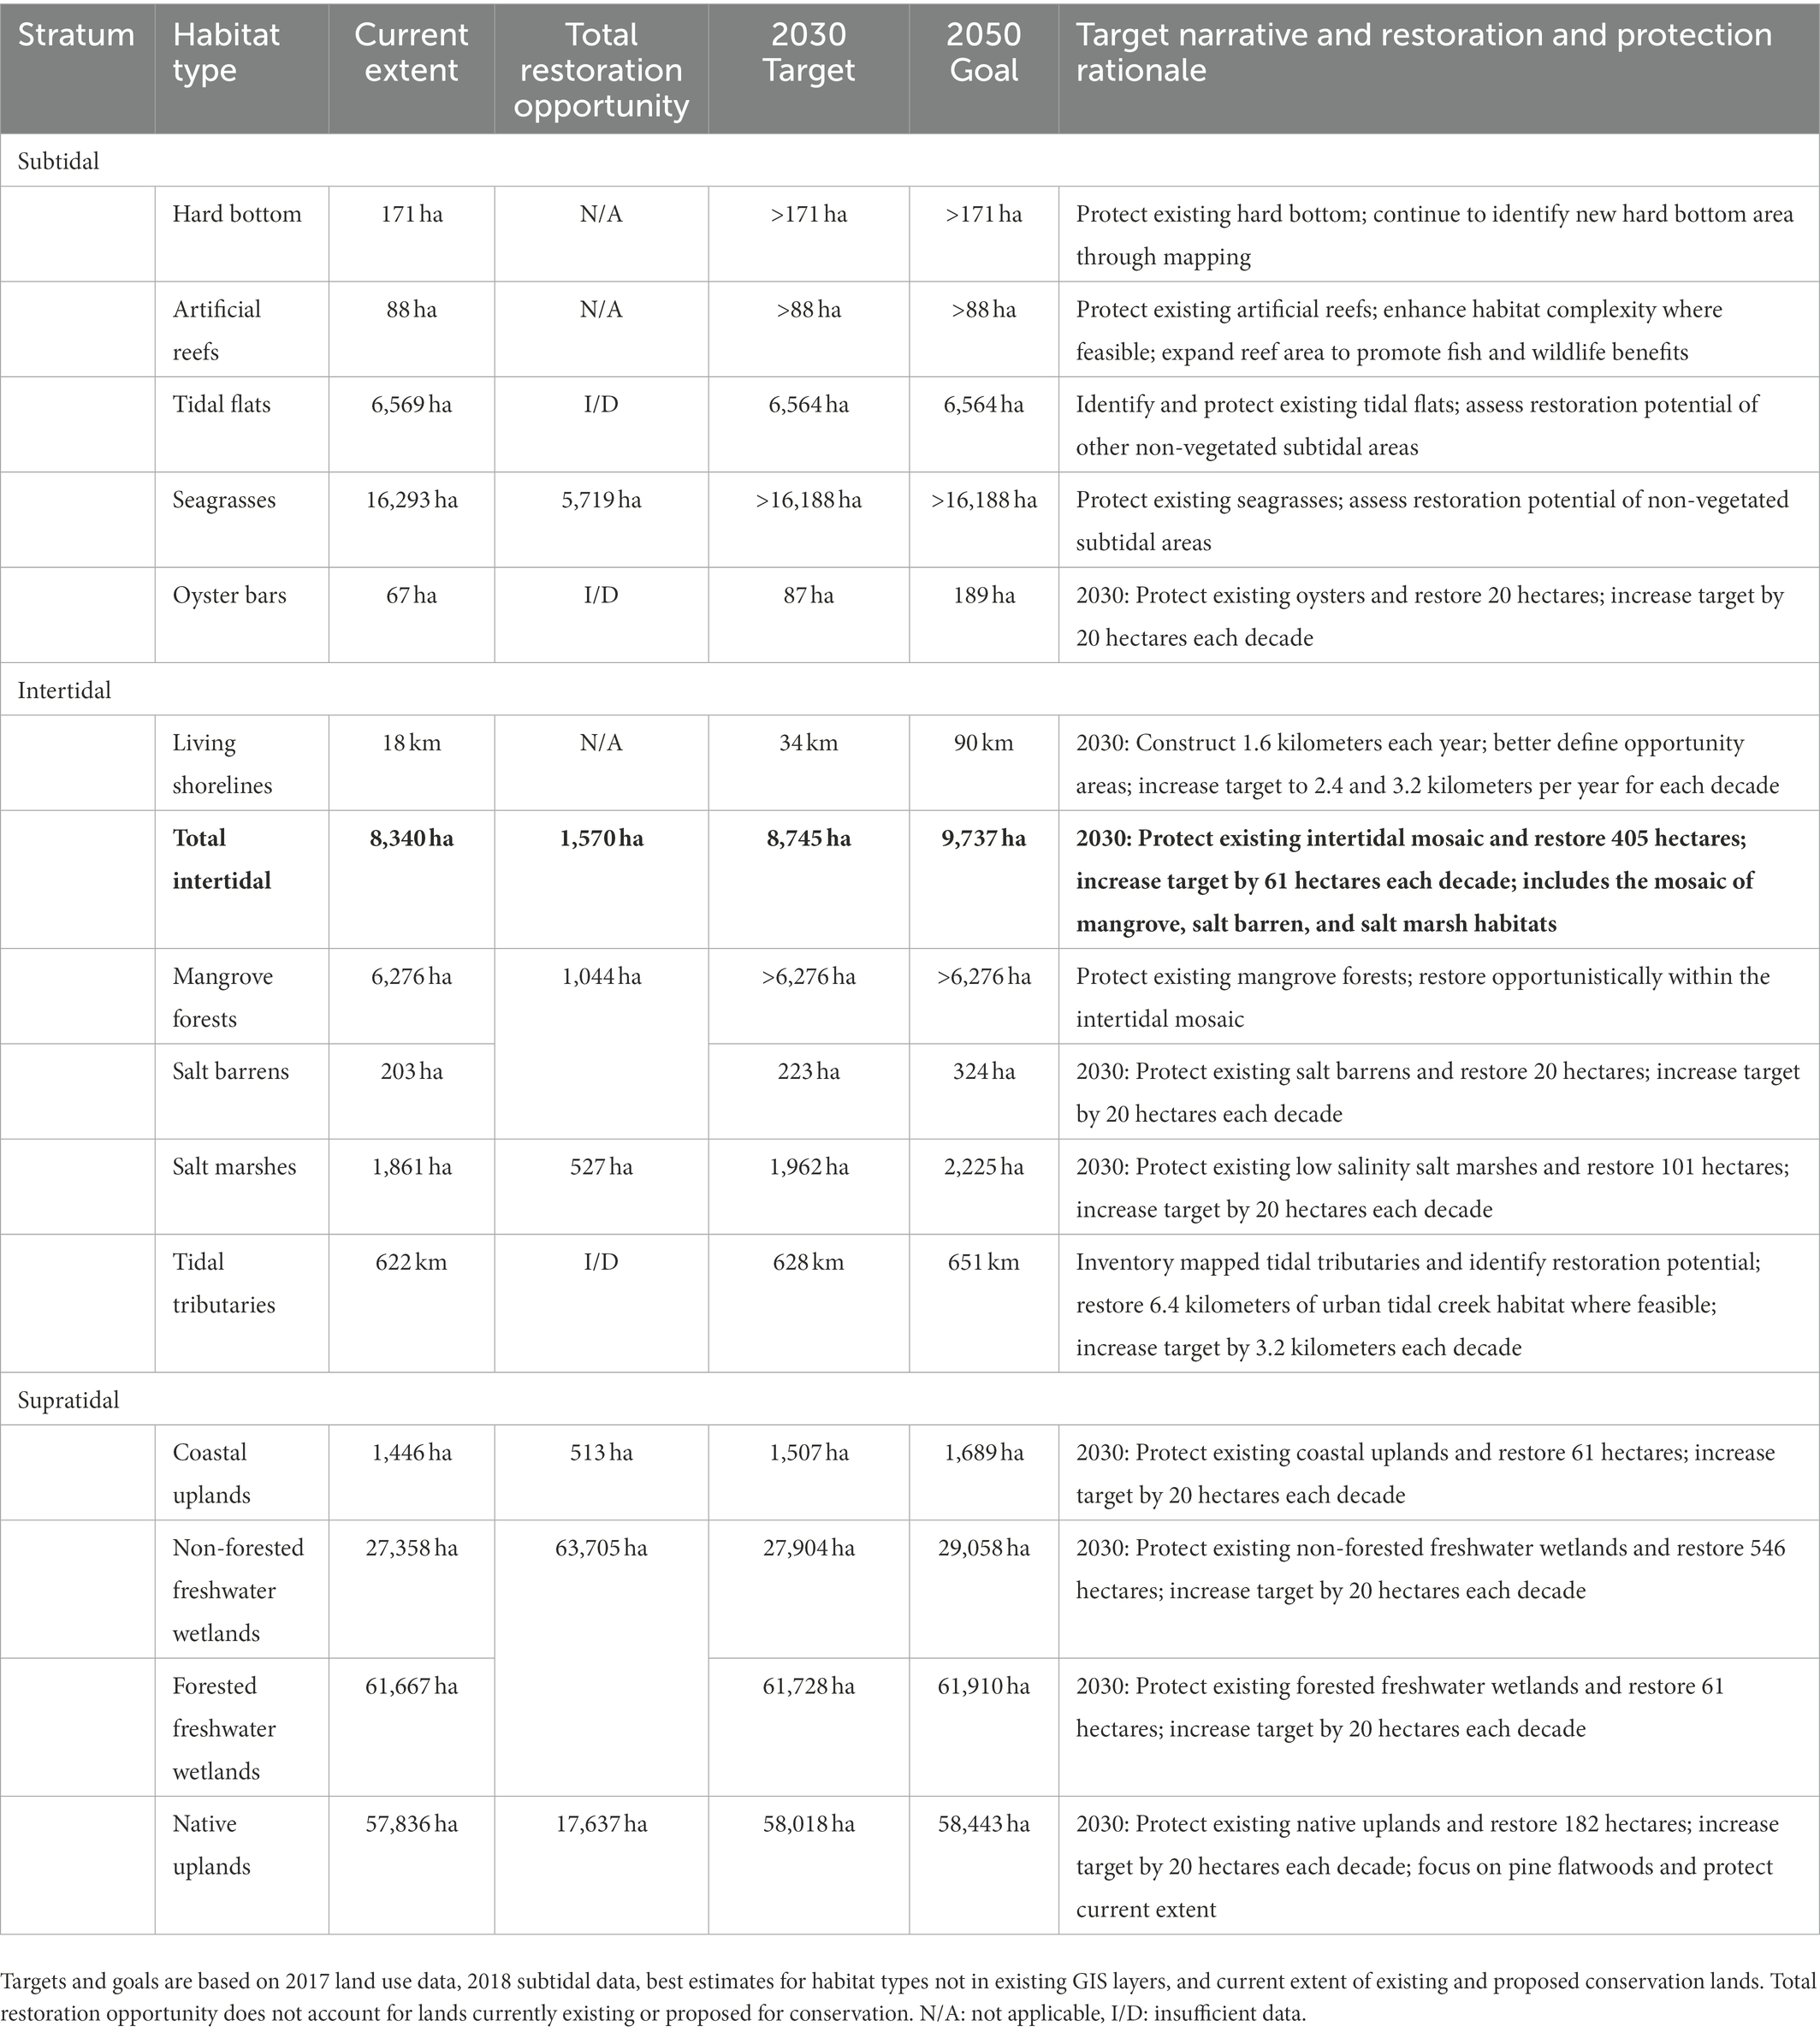
Table 5. Recommended 2030 targets and 2050 goals for habitat restoration and protection in the Tampa Bay watershed.
4. Discussion
Priorities for comprehensive, watershed-wide habitat restoration should be informed by current assessments and what is possible to achieve in the future. These priorities are necessary given anticipated impacts of land development and climate change, while also considering competing societal interests for use of the environment and limited resources for land acquisition and restoration. Our approach balances these tradeoffs by identifying targets and goals that are informed by current extent, past trends, and realistic effort from past projects. Further, spatially explicit locations are identified where these targets and goals could be achieved based on existing opportunities for restorable habitats, including areas anticipated to be impacted by coastal stressors (i.e., sea-level rise and land development). This approach departs from previous restoration paradigms by identifying what is possible rather than attempting to recreate an ideal historical baseline. Methods are also provided using open source tools (Beck et al., 2022) that (1) allow for the most current datasets to be synthesized to assess progress, and (2) can be used in other locations with similar needs for identifying restoration priorities.
4.1. Habitat trends
Identifying appropriate targets and goals would not have been possible without a detailed assessment of current extent and past trends over 30 years of native habitats in Tampa Bay and its watershed. The most notable trends included (1) an increase of seagrasses by 75%, (2) an increase of emergent tidal wetlands (12%) and freshwater wetlands (24%), and (3) a loss of native uplands (38%).
Seagrass recovery in Tampa Bay is a well-known success story that demonstrated how public-private partnerships can effectively reduce total nitrogen loads into Tampa Bay (Greening et al., 2014; Sherwood et al., 2017). The nutrient reductions, primarily from point-source controls and advanced wastewater treatment, contributed to improvements in water quality and light environments that were favorable for seagrass growth. Reducing nitrogen inputs into Tampa Bay remains the primary strategy for maintaining water quality conditions. However, the most recent (2020) coverage estimate showed a seagrass loss of 18% baywide since peak coverages in 2016, falling below the target defined herein. These data were unavailable at the time this habitat restoration workflow was initially developed and trends informed by the new restoration paradigm have prompted bay managers to assess barriers in achieving the seagrass restoration goal. In particular, much of the seagrass losses have occurred in Old Tampa Bay (northwest segment of Tampa Bay), where recurring algal blooms of Pyrodinium bahamense have contributed to water quality decline (Lopez et al., 2019). The greatest percent loss of seagrass in 2020 was observed in Hillsborough Bay (northeast segment of Tampa Bay), which does not experience P. bahamense blooms. Ongoing research to understand mechanisms for mitigating blooms that negatively affect water quality, in addition to identifying potential regional stressors, will be critical for restoring seagrass in Tampa Bay.
Emergent tidal and freshwater wetlands in Tampa Bay have also experienced dramatic changes over the last three decades. Dual pressures from sea-level rise and changes in the length of the freeze-free season have affected tidal wetlands, such that mangrove forests are outcompeting salt marshes and salt barrens for available niche space. Mangrove expansion as a result of climate change has been observed throughout the Gulf of Mexico (Comeaux et al., 2012; Osland et al., 2022). Anthropogenic water withdrawals have also reduced freshwater flows reaching tidal marshes, contributing to reductions in coverage of key species (e.g., Juncus roemerianus) that have favored mangroves (Raabe et al., 2012). As such, the identified targets and goals for mangroves indicate protection of these habitats, without the need for additional restoration. However, mangroves are expected to continue colonization of the intertidal zone, contributing to additional losses of salt marshes and salt barrens. The reservation areas identified in Figure 5 represent critical remaining areas in the intertidal zone that could be protected to prevent additional losses of tidal wetlands. Likewise, gains in non-forested freshwater wetlands are a reflection of (1) constructed stormwater ponds required by state and federal regulatory programs, and (2) the cumulative gains from publicly-funded habitat restoration projects. Creative restoration approaches (e.g., habitat acquisition and optimal management of freshwater flows) that address the likely expansion of mangroves at the expense of salt marshes and salt barrens will be required to meet the targets and goals for these habitats.
The decrease in native uplands is the result of continued development in the Tampa Bay watershed (Figure 4) and lack of regulatory protection of these habitats. Attaining the target and goal will require restoration of upland habitats on existing conservation lands (i.e., restoration potential in Figure 6) and new conservation lands to offset the continued loss of these habitats to development. The long-term conversion of restorable areas to developed lands (Figure 4) presents additional challenges for restoration of native uplands. Additional education about best practices in land development, market-based incentives, and amendments to existing planning, zoning, and land development regulations will be needed to address these issues. Although federal and state regulations for endangered species provide some protection to rare habitats, such as scrub jay (Aphelocoma coerulescens) habitat, common and historically abundant native habitats are largely unprotected (e.g., pine flatwoods). Voluntary approaches to low impact urban or suburban development may also gain traction among developers as more viable methods for land conversion that minimize impacts to natural resources while increasing quality of life (Jones et al., 2009). Education and outreach activities that target land developers to raise awareness of the benefits of alternative practices are critical in this effort. Market-based approaches to mitigating urban sprawl may also be practical (e.g., conservation subdivisions; Mohamed, 2006) given the estimated economic gains relative to conventional approaches. Regardless, reductions in native uplands will likely continue in the short-term unless local governments improve regulatory protections, such as strengthening language within comprehensive plans and development regulations to maintain a defined extent of these habitats within a rapidly urbanizing coastal watershed.
4.2. Achieving restoration targets and goals
Achieving the defined targets and goals will require diverse approaches for habitat restoration and management. Focusing efforts on publicly-owned conservation lands is expected to have long-term benefits and will be most cost-effective given the level of restoration effort compared to habitats that have already been impacted by anthropogenic activities. As such, public acquisition of remaining critical lands (e.g., coastal uplands) is a high priority given current development trends in the watershed. Other restoration targets (e.g., salt marshes) will not be obtained without additional public acquisition or initiating novel public-private partnerships as a mechanism for doing so (Holl and Howarth, 2001; Benson et al., 2018). Therefore, varied approaches to leverage resources for restoration are needed and could include pursuing traditional grants, matching funds from multiple partners, or voluntary initiatives that incentivize habitat restoration (e.g., Blue Carbon investments; Sheehan et al., 2019). Recent gains in tidal and freshwater wetlands are primarily due to publicly-funded habitat restoration projects, state and federal wetland regulatory programs, and to a lesser extent, regulatory mitigation. Restoration activities for habitats without similar regulatory frameworks should pursue the options above to achieve the defined targets and goals.
Other restoration activities could be pursued for the opportunity areas. Substantial opportunities exist for upland restoration on reclaimed mined lands within the watershed (Figures 1, 5). For estuarine habitats, opportunity areas could include dredged holes or spoil disposal areas, either for enhancing existing subtidal habitats or creating areas that could be colonized by seagrasses. Some opportunities also exist on developed lands primarily through enhancement projects, although these have not been explicitly identified in the products herein. Examples include the construction of living shorelines in place of hardened seawalls, placement of submerged habitat modules along urban shorelines (e.g., artificial oyster reefs), and creation of backyard habitats. Tidal tributary restoration could also include removal of salinity barriers and filling of dredged channel sections. Overall, restoration practitioners must consider several options and choose those that are most feasible given the available resources and likelihood of success. Further, finer-scale land cover classification datasets are currently being investigated to refine identification of opportunity areas within the urbanized, developed landscape of the watershed.
Creative approaches may be required in areas affected by sea-level rise if land acquisition is not possible. These approaches are necessary to accommodate future landward migration of tidal wetlands or the protection of coastal uplands, while also reducing risks to build infrastructure that, when inappropriately sited, can inhibit landward habitat shifts. Coastal setbacks, buffers, or public easements are traditionally used to restrict development within a given distance from the shoreline. However, rolling easements may be an alternative approach whereby protected areas are allowed to “roll” landward with expected changes in sea-level rise. Rolling easements could disincentivize more intense urban development of low-lying coastal uplands in less developed agricultural or recreational land uses. Landowners could maintain current economic uses with a rolling easement, while reserving such lands to accommodate future landward habitat migration. These approaches also offer risk-reduction to build infrastructure by offering increased protection from potential affects of sea-level rise and other coastal stressors (e.g., storm surge).
Finally, wetland impacts and associated compensatory mitigation projects authorized under wetland regulatory programs could serve as more directed restoration mechanisms to help achieve watershed-wide goals. Mitigation activities have historically been conducted independent of watershed-level planning and monitoring processes. This disconnect has contributed to fragmented implementation, marginal habitat function, and inconsistent compliance monitoring of mitigation projects, including historically poor documentation of wetland losses and gains in the Tampa Bay watershed. However, if properly focused and coordinated, compensatory mitigation activities could significantly contribute to the attainment of restoration targets and goals for the region.
4.3. Limitations of the approach
Identifying restoration priorities was data intensive and would not have been possible without the resources available for the region. The workflow for identifying priorities required detailed and spatially explicit datasets specific to the Tampa Bay watershed. Long-term datasets describing land use and cover and the extent of subtidal habitats were necessary to categorize current extent and past trends. Similarly, supporting datasets included those that described existing and proposed conservation areas, soils, past restoration activities, and relevant spatial boundaries (i.e., watershed and coastline). Many of these datasets are available outside of Tampa Bay, although temporal and spatial resolutions may limit application to other areas. Despite the region’s data richness, limitations still exist in classifying restoration opportunities based on the spatial-scale of the LULC datasets. Additional refinements within the classified developed lands and coastal reservation space are currently being explored with 1-m scale national land cover datasets, which could expose additional opportunities in urban or suburban areas (e.g., improving stormwater infrastructure) or differential changes within native habitat classes (e.g., interspecific differences in mangrove colonization). Additionally, considerable effort was made in working with regional partners to identify and fill knowledge gaps for relevant habitat types. For example, inventories of hard bottom habitats, living shorelines, tidal tributaries, and artificial reefs were created through special studies or were available only as current estimates from regional entities. Tracking progress towards these habitat targets and goals is heavily reliant on regular updates to these datasets, as well as routine land use and cover map updates.
An additional assumption of the workflow, particularly for tracking progress, is that implemented restoration projects reported by partners will ultimately manifest into a classification within the map products. Specifically, restoration effort by regional partners is cataloged in the available restoration database, which not only depends on voluntary reporting, but also represents a source of information on restoration extent that is separate from land cover maps. An expectation is that the reported coverage restored by a partner will ultimately be shown as a change in land use and cover on regional maps. The temporal lag between an actual project and how it may be reflected in a GIS product is unknown, which may create a disconnect between the updates in achieving targets and goals as new data layers are released and the effort reported by partners becomes represented within the data layers. The spatial resolution of mapping products may also be insufficient to detect habitat changes as reported in the restoration database. For these reasons, projects reported by partners are currently summarized separately from the assessments above that depend on GIS layers. Additional work is needed to reconcile these datasets for more streamlined reporting.
5. Conclusion
The establishment of targets and goals that account for climate change, development trajectories, land availability, and past restoration effort expands the restoration opportunities to a more comprehensive list of habitats for the entire watershed. Land acquisition is critical for attaining the defined targets and goals and will also provide new opportunities for outdoor access to the broader community. Successful restoration is also contingent on engaging multiple partners, non-governmental organizations, and private citizens. The products created herein will guide these efforts for the next 30 years by providing a continuously updated assessment of where the opportunities exist and if targets and goals are expected to be met. The Tampa Bay region is not unique in the challenges resource managers face to protect and restore native habitats, and the approach described herein is readily transferable to other locations where restoration priorities are needed in response to pervasive coastal stressors.
Data availability statement
The datasets presented in this study can be found in online repositories. The names of the repository/repositories and accession number(s) can be found at: https://github.com/tbep-tech/hmpu-workflow, https://github.com/tbep-tech/hmpu-manu.
Author contributions
DR, JS, and CS contributed to original conception and design of the study, with guidance from all authors. MWB and JS performed the analyses. MWB and GR wrote the first draft of the manuscript with contributions from ES, MCB, and DT. MWB created the open source content. All authors contributed to the article and approved the submitted version.
Acknowledgments
The Technical Advisory Committee of the Tampa Bay Estuary Program reviewed drafts of the original reports that are the basis of this paper and their comments are immensely appreciated. We also recognize the extensive efforts of regional partners, of which there are too many to mention, for past restoration efforts in the Tampa Bay region that have contributed to native habitats. These efforts will be critical for continued success of restoration in the future. Substantial efforts by partners in creating and curating routine datasets for the region, especially by the Southwest Florida Water Management District and the Florida Natural Areas Inventory, are also gratefully recognized.
Conflict of interest
The authors declare that the research was conducted in the absence of any commercial or financial relationships that could be construed as a potential conflict of interest.
Publisher’s note
All claims expressed in this article are solely those of the authors and do not necessarily represent those of their affiliated organizations, or those of the publisher, the editors and the reviewers. Any product that may be evaluated in this article, or claim that may be made by its manufacturer, is not guaranteed or endorsed by the publisher.
Supplementary material
The Supplementary material for this article can be found online at: https://www.frontiersin.org/articles/10.3389/fevo.2023.1070266/full#supplementary-material
Footnotes
1. ^https://www.tampabay.wateratlas.usf.edu/
References
Allaire, J. J., Gandrud, C., Russell, K., and Yetman, C. (2017). networkD3: D3 JavaScript network graphs from R. Available at: https://CRAN.R-project.org/package=networkD3.
Ash, T., and Runnels, R. (2005). Hard bottom habitats: an overview of mapping and monitoring needs on epibenthic communities in Tampa Bay, Florida. in Proceedings of the Tampa Bay Area Scientific Information Symposium (BASIS 4), ed. S. F. Treat (St. Petersburg, Florida: Tampa Bay Estuary Program), 179–182.
Ávila-García, D., Morató, J., Pérez-Maussán, A. I., Santillán-Carvantes, P., and Alvarado, J. (2020). Impacts of alternative land-use policies on water ecosystem services in the Rio Grande de Comitan-Lagos de Montebello watershed, Mexico. Ecosyst. Serv. 45:101179. doi: 10.1016/j.ecoser.2020.101179
Beck, M. W., Raulerson, G. E., and Sherwood, E. T. (2022). Tbep-tech/hmpu-workflow: v1.2.0. Zenodo. doi: 10.5281/zenodo.7032909
Benson, C. E., Carberry, B., and Langen, T. A. (2018). Public-private partnership wetland restoration programs benefit species of greatest conservation need and other wetland-associated wildlife. Wetl. Ecol. Manag. 26, 195–211. doi: 10.1007/s11273-017-9565-8
Bertness, M. D. (1985). Fiddler crab regulation of Spartina alterniflora production on a New England salt marsh. Ecology 66, 1042–1055. doi: 10.2307/1940564
Brinson, M. M., Christian, R. R., and Blum, L. K. (1995). Multiple states in the sea-level induced transition from terrestrial forest to estuary. Estuaries 18, 648–659. doi: 10.2307/1352383
Burke, M., Carnahan, L., Hammer-Levy, K., and Mitchum, G. (2019). Recommended projections of sea level rise for the Tampa Bay region (update). Tampa Bay Estuary Program: St. Petersburg, Florida.
Calil, J., Beck, M. W., Gleason, M., Merrifield, M., Klausmeyer, K., and Newkirk, S. (2015). Aligning natural resource conservation and flood hazard mitigation in California. PLoS One 10:e0132651. doi: 10.1371/journal.pone.0132651
Cavanaugh, K. C., Dangremond, E. M., Doughty, C. L., Williams, A. P., Parker, J. D., Hayes, M. A., et al. (2019). Climate-driven regime shifts in a mangrove-salt marsh ecotone over the past 250 years. Proceedings of the National Academy of Sciences 116, 21602–21608. doi: 10.1073/pnas.1902181116
Cavanaugh, K. C., Kellner, J. R., Forde, A. J., Gruner, D. S., Parker, J. D., Rodriguez, W., et al. (2014). Poleward expansion of mangroves is a threshold response to decreased frequency of extreme cold events. Proceedings of the National Academy of Sciences 111, 723–727. doi: 10.1073/pnas.1315800111
Chung, M. G., Dietz, T., and Liu, J. (2018). Global relationships between biodiversity and nature-based tourism in protected areas. Ecosyst. Serv. 34, 11–23. doi: 10.1016/j.ecoser.2018.09.004
Cicchetti, G., and Greening, H. (2011). Estuarine biotope mosaics and habitat management goals: an application in Tampa Bay, FL, USA. Estuar. Coasts 34, 1278–1292. doi: 10.1007/s12237-011-9408-4
Coen, L. D., Brumbaugh, R. D., Bushek, D., Grizzle, R., Luckenbach, M. W., Posey, M. H., et al. (2007). Ecosystem services related to oyster restoration. Mar. Ecol. Prog. Ser. 341, 303–307. doi: 10.3354/meps341303
Comeaux, R. S., Allison, M. A., and Bianchi, T. S. (2012). Mangrove expansion in the Gulf of Mexico with climate change: implications for wetland health and resistance to rising sea levels. Estuar. Coast. Shelf Sci. 96, 81–95. doi: 10.1016/j.ecss.2011.10.003
Conner, W. H., Doyle, T. W., and Krauss, K. W. (2007). Ecology of tidal freshwater forested wetlands of the southeastern United States. Dordrecht, Netherlands: Springer.
CSA Ocean Sciences. (2019). Tampa Bay hard bottom mapping project. Tampa Bay Estuary Program, St. Petersburg, Florida.
Dontis, E. E., Radabaugh, K. R., Chappel, A. R., Russo, C. E., and Moyer, R. P. (2020). Carbon storage increases with site age as created salt marshes transition to mangrove forests in Tampa Bay, Florida (USA). Estuar. Coasts 43, 1470–1488. doi: 10.1007/s12237-020-00733-0
Duarte, C. M., Conley, D. J., Carstensen, J., and Sánchez-Camacho, M. (2009). Return to Neverland: shifting baselines affect eutrophication restoration targets. Estuar. Coasts 32, 29–36. doi: 10.1007/s12237-008-9111-2
Dupont, J. M. (2008). Artificial reefs as restoration tools: a case study on the West Florida shelf. Coast. Manag. 36, 495–507. doi: 10.1080/08920750802395558
Eisma, D. (1998). Intertidal deposits: River mouths, tidal flats, and coastal lagoons. London: CRC Press.
Elliott, M., Burdon, D., Hemingway, K. L., and Apitz, S. E. (2007). Estuarine, coastal and marine ecosystem restoration: confusing management and science–a revision of concepts. Estuar. Coast. Shelf Sci. 74, 349–366. doi: 10.1016/j.ecss.2007.05.034
Ermgassen, P. S. E., Spalding, M. D., and Grizzle, R. E. (2013). Quantifying the loss of a marine ecosystem service: filtration by the eastern oyster in U.S. estuaries. Estuar. Coasts 36, 36–43. doi: 10.1007/s12237-012-9559-y
Florida Department of Transportation. (1999). Florida land use, cover and forms classification system. Third, Tallahassee, Florida: FDOT Surveying and Mapping Office Geographic Mapping Section.
Florida Natural Areas Inventory. (2020). Florida Conservation Lands (FLMA) GIS Dataset, March 2020. Available at: https://www.fnai.org/publications/gis-data.
Gann, G. D., McDonald, T., Walder, B., Aronson, J., Nelson, C. R., Jonson, J., et al. (2019). International principles and standards for the practice of ecological restoration, 2nd. Restor. Ecol. 27, S1–S46. doi: 10.1111/rec.13035
Greening, H., Janicki, A., Sherwood, E., Pribble, R., and Johansson, J. O. R. (2014). Ecosystem responses to long-term nutrient management in an urban estuary: Tampa Bay, Florida, USA. Estuar. Coast. Shelf Sci. 151, A1–A16. doi: 10.1016/j.ecss.2014.10.003
Gregory, R., Ohlson, D., and Arvai, J. (2006). Deconstructing adaptive management criteria for applications to environmental management. Ecol. Appl. 16, 2411–2425. doi: 10.1890/1051-0761(2006)016[2411:DAMCFA]2.0.CO;2
Heck, K., Hays, G., and Orth, R. (2003). Critical evaluation of the nursery role hypothesis for seagrass meadows. Mar. Ecol. Prog. Ser. 253, 123–136. doi: 10.3354/meps253123
Henningsen, B. (2005). The maturation and future of habitat restoration programs for the Tampa Bay estuarine ecosystem. In proceedings of the Tampa Bay Area scientific information symposium (BASIS 4), ed. S. F. Treat (St. Petersburg, FL: Tampa bay Estuary Program), 165–170.
Holl, K. D., and Howarth, R. B. (2001). Paying for restoration. Restor. Ecol. 8, 260–267. doi: 10.1046/j.1526-100x.2000.80037.x
Holling, C. S. (1978). Adaptive environmental assessment and management. Chichester, UK: John Wiley & Sons.
Houde, E. D., and Rutherford, E. S. (1993). Recent trends in estuarine fisheries: predictions of fish production and yield. Estuaries 16, 161–176. doi: 10.2307/1352488
Hsieh, Y. P. (2004). “Dynamics of tidal salt barren formation and the record of present-day sea level change” in The ecogeomorphology of tidal marshes. eds. S. Fagherazzi, M. Marani, and L. Blum (Washington: American Geophysical Union), 231–245.
Jaap, W. C., and Hallock, P. (1990). “Coral reefs” in Ecosystems of Florida. eds. R. L. Myers and J. J. Ewel (Orlando, Florida, USA: University of Central Florida Press), 574–618.
Jones, P. H., Larson, B. C., and Clark, M. W. (2009). Reduced impact development practices at “restoration.” in American Institute of Physics Conference Proceedings (American Institute of Physics), 151–161.
Kaufman, K. (2017). Tampa Bay environmental restoration fund final report: Hard bottom mapping and characterization for restoration planning in Tampa Bay. Tampa Bay Estuary Program, St. Petersburg, Florida.
Kawula, R., and Redner, J. (2018). “Florida land cover classification system,” in Center for Spatial Analysis, fish and Widlife research institute, Florida fish and wildlife conservation commission. (Tallahassee, Florida: Center for Spatial Analysis, Fish and Widlife Research Institute, Florida Fish and Wildlife Conservation).
Kushlan, J. A. (1990). “Freshwater marshes,” in Ecosystems of Florida. eds. R. L. Myers and J. J. Ewel (Orlando, Florida: University of Central Florida Press), 324–363.
Lewis, R. R., and Robison, D. E. (1996). Setting priorities for Tampa Bay habitat protection and restoration: Restoring the balance. Tampa Bay Estuary Program, St. Petersburg, Florida.
Lopez, C. B., Karim, A., Murasko, S., Marot, M., Smith, C. G., and Corcoran, A. A. (2019). Temperature mediates secondary dormancy in resting cysts of Pyrodinium bahamense (Dinophyceae). J. Phycol. 55, 924–935. doi: 10.1111/jpy.12883
Lowndes, J. S. S., Best, B. D., Scarborough, C., Afflerbach, J. C., Frazier, M. R., O’Hara, C. C., et al. (2017). Our path to better science in less time using open data science tools. Nature Ecol. Evol. 1, 1–7. doi: 10.1038/s41559-017-0160
Menéndez, P., Losada, I. J., Beck, M. W., Torres-Ortega, S., Espejo, A., Narayan, S., et al. (2018). Valuing the protection services of mangroves at national scale: the Philippines. Ecosyst. Serv. 34, 24–36. doi: 10.1016/j.ecoser.2018.09.005
Meyers, R. L., and Ewel, J. J. (1990). Ecosystems of Florida. Orlando, Florida: University of Central Florida Press.
Mohamed, R. (2006). The economics of conservation subdivisions: Price premiums, improvement costs, and absorption rates. Urban Aff. Rev. 41, 376–399. doi: 10.1177/1078087405282183
Moore, H. B., Davies, L. T., Fraser, T. H., Gore, R. H., and López, N. R. (1968). Some biomass figures from a tidal flat in Biscayne Bay, Florida. Bull. Mar. Sci. 18, 261–279.
National Oceanic and Atmospheric Administration. (2015). Guidance for considering the use of living shorelines, final guidance document prepared by the NOAA living shorelines workgroup. Silver Spring, Maryland: National Oceanic and Atmospheric Administration.
Odum, W. E., and McIvor, C. C. (1990). “Mangroves,” in Ecosystems of Florida. eds. R. L. Myers and J. J. Ewel (Orlando, Florida: University of Central Florida Press), 517–548.
Osland, M. J., Hughes, A. R., Armitage, A. R., Scyphers, S. B., Cebrian, J., Swinea, S. H., et al. (2022). The impacts of mangrove range expansion on wetland ecosystem services in the southeastern United States: current understanding, knowledge gaps, and emerging research needs. Glob. Chang. Biol. 28, 3163–3187. doi: 10.1111/gcb.16111
Osland, M. J., Spivak, A. C., Nestlerode, J. A., Lessmann, J. M., Almario, A. E., Heitmuller, P. T., et al. (2012). Ecosystem development after mangrove wetland creation: plant-soil change across a 20-year chronosequence. Ecosystems 15, 848–866. doi: 10.1007/s10021-012-9551-1
Palmer, M. A. (2009). Reforming watershed restoration: science in need of application and applications in need of science. Estuar. Coasts 32, 1–17. doi: 10.1007/s12237-008-9129-5
Pebesma, E. (2018). Simple features for R: standardized support for spatial vector data. R J. 10, 439–446. doi: 10.32614/RJ-2018-009
R Core Team. (2022). R: A language and environment for statistical computing. Vienna, Austria: R Foundation for Statistical Computing.
Raabe, E., Roy, L. C., and McIvor, C. (2012). Tampa Bay coastal wetlands: nineteenth to twentieth century tidal marsh-to-mangrove conversion. Estuar. Coasts 35, 1145–1162. doi: 10.1007/s12237-012-9503-1
Rayer, S., and Wang, Y. (2020). Projections of Florida population by county, 2020-2045, with estimates for 2019. Florida Population Stud. 53:186.
Restore America’s Estuaries. (2015). Living shorelines: From barriers to opportunities. Arlington, Virginia: Restore America’s Estuaries.
Ries, T., and Scheda, S. (2014). Master plan for the protection and restoration of freshwater wetlands in the Tampa Bay watershed, Florida. Tampa Bay Estuary Program, St. Petersburg, Florida.
Robison, D. E. (2010). Tampa bay Estuary Program habitat master plan update. Tampa Bay Estuary Program, Saint Petersburg, Florida.
Robison, D., Ries, T., Saarinen, J., Tomasko, D., and Sciarrino, C. (2020). Tampa bay estuary program: 2020 habitat master plan update. Tampa Bay Estuary Program, St. Petersburg, Florida.
Russell, M., and Greening, H. (2015). Estimating benefits in a recovering estuary: Tampa Bay, Florida. Estuar. Coasts 38, 9–18. doi: 10.1007/s12237-013-9662-8
Sheehan, L., Sherwood, E. T., Moyer, R. P., Radabaugh, K. R., and Simpson, S. (2019). Blue carbon: an additional driver for restoring and preserving ecological services of coastal wetlands in Tampa Bay (Florida, USA). Wetlands 39, 1317–1328. doi: 10.1007/s13157-019-01137-y
Sherwood, E. (2008). Tampa Bay tidal tributary habitat initiative: Integrated summary document, Tampa Bay Estuary Program tidal tributaries project team. Tampa Bay Estuary Program, St. Petersburg, Florida.
Sherwood, E., Greening, H., Johansson, J. O. R., Kaufman, K., and Raulerson, G. (2017). Tampa Bay (Florida, USA): documenting seagrass recovery since the 1980’s and reviewing the benefits. Southeast. Geogr. 57, 294–319. doi: 10.1353/sgo.2017.0026
Smith, C. S., Puckett, B., Gittman, R. K., and Peterson, C. H. (2018). Living shorelines enhanced the resilience of saltmarshes to hurricane Matthew (2016). Ecol. Appl. 28, 871–877. doi: 10.1002/eap.1722
Southwest Florida Water Management District. (2014). Photo interpretation key for land use classification. Available at: https://www31.swfwmd.state.fl.us/Documents/Photo_Interpretation_Key_2014.pdf.
Southwest Florida Water Management District. (2018). Land use land cover data. c1990-2017. Available at: https://data-swfwmd.opendata.arcgis.com/.
Southwest Florida Water Management District. (2019). Seagrass in 2018. Available at: https://data-swfwmd.opendata.arcgis.com/datasets/seagrass-in-2018.
Sprandel, J. A., Gore, D., and Cobb, T. (2000). Distribution of wintering shorebirds in coastal Florida. J. Field Ornithol. 71, 708–720. doi: 10.1648/0273-8570-71.4.708
Stockmann, U., Minasny, B., and McBratney, A. B. (2014). How fast does soil grow? Geoderma 216, 48–61. doi: 10.1016/j.geoderma.2013.10.007
Titus, J. G., Hudgens, D. E., Trescott, D. L., Craghan, M., Nuckols, W. H., Hershner, C. H., et al. (2009). State and local governments plan for development of most land vulnerable to rising sea level along the US Atlantic coast. Environ. Res. Lett. 4:044008. doi: 10.1088/1748-9326/4/4/044008
Tomasko, D., Alderson, M., Burnes, R., Hecker, J., Iadevaia, N., Leverone, J., et al. (2020). The effects of hurricane Irma on seagrass meadows in previously eutrophic estuaries in Southwest Florida (USA). Mar. Pollut. Bull. 156:111247. doi: 10.1016/j.marpolbul.2020.111247
Vogelmann, J. E., Xian, G., Homera, C., and Tolk, B. (2012). Monitoring gradual ecosystem change using Landsat time series analyses: case studies in selected forest and rangeland ecosystems. Remote Sens. Environ. 122, 92–105. doi: 10.1016/j.rse.2011.06.027
Wessel, M. R., Leverone, J. R., Beck, M. W., Sherwood, E. T., Hecker, J., West, S., et al. (2022). Developing a water quality assessment framework for Southwest Florida tidal creeks. Estuar. Coasts 45, 17–37. doi: 10.1007/s12237-021-00974-7
White, E., and Kaplan, D. (2017). Restore or retreat? Saltwater intrusion and water management in coastal wetlands. Ecosystem Health Sustain. 3:e01258. doi: 10.1002/ehs2.1258
Wickham, H., Averick, M., Bryan, J., Chang, W., McGowan, L. D., François, R., et al. (2019). Welcome to the tidyverse. J. Open Source Software 4:1686. doi: 10.21105/joss.01686
Keywords: Florida, land use change, sea-level rise, Tampa Bay, urbanization, habitat loss
Citation: Beck MW, Robison DE, Raulerson GE, Burke MC, Saarinen J, Sciarrino C, Sherwood ET and Tomasko DA (2023) Addressing climate change and development pressures in an urban estuary through habitat restoration planning. Front. Ecol. Evol. 11:1070266. doi: 10.3389/fevo.2023.1070266
Edited by:
Thomas George Bornman, South African Environmental Observation Network (SAEON), South AfricaReviewed by:
Tian Xie, Beijing Normal University, ChinaJacqueline Raw, Nelson Mandela University, South Africa
Copyright © 2023 Beck, Robison, Raulerson, Burke, Saarinen, Sciarrino, Sherwood and Tomasko. This is an open-access article distributed under the terms of the Creative Commons Attribution License (CC BY). The use, distribution or reproduction in other forums is permitted, provided the original author(s) and the copyright owner(s) are credited and that the original publication in this journal is cited, in accordance with accepted academic practice. No use, distribution or reproduction is permitted which does not comply with these terms.
*Correspondence: Marcus W. Beck, ✉ bWJlY2tAdGJlcC5vcmc=