 Peng Zang
 Hualong Qiu
 Haifan Zhang
 Kaihan Chen
 Fei Xian
 Jianghui Mi
 Hongxu Guo
 Yanan Qiu
 Kaihuai Liao
- Department of Architecture and Urban Planning, Guangdong University of Technology, Guangzhou, China
The increased ageing of the population is a vital and upcoming challenge for China. Walking is one of the easiest and most common forms of exercise for older people, and promoting walking among older people is important for reducing medical stress. Streetscape green visibility and the normalised difference vegetation index (NDVI) are perceptible architectural elements, both of which promote walking behaviour. Methodologically we used Baidu Street View images and extracted NDVI from streetscape green visibility and remote sensing to scrutinize the nonlinear effects of streetscape green visibility and NDVI on older people’s walking behaviour. The study adopted a random forest machine learning model. The findings indicate that the impact of streetscape green visibility on elderly walking is superior to NDVI, while both have a favourable influence on senior walking propensity within a particular range but a negative effect on elderly walking inside that range. Overall the built environment had a non-linear effect on the propensity to walk of older people. Therefore, this study allows the calculation of optimal thresholds for the physical environment, which can be used by governments and planners to formulate policies and select appropriate environmental thresholds as indicators to update or build a community walking environment that meets the needs of local older people, depending on their own economic situation.
1. Introduction
According to the results of China’s seventh national census compared to 2010, the population aged 60 and over rose by 5.44 percentage points (Statistics NBo, 2021). These figures indicate that the proportion of the population aged 60 and over is increasing and that more and more middle-aged people are entering old age with the expectation of a longer life expectancy. The ageing of the population is becoming a growing problem and there is an urgent need to increase the independence and self-care of older people, as otherwise, the burden on society and healthcare will continue to increase.
The World Health Organization recommends that older people get at least 150 min of appropriate physical activity per week; walking is the simplest form of low-intensity physical activity for humans, and increasing the amount of time older people spend walking is beneficial for improving their own health status (Nordbakke and Schwanen, 2014). Encouraging older people to be active in walking for travel is an important means of keeping them fit and ensuring a better quality of life (Moniruzzaman and Páez, 2016; Curl and Mason, 2019). Also walking is a common mode of travel. Walking can also help people access their destinations in some situations that are not accessible by cars and transit (Cheng et al., 2019; Chen et al., 2021; Yang et al., 2022a, 2023a,b). Walking can also increase older people’s sense of well-being and happiness by maintaining their independence through social participation (Nordbakke and Schwanen, 2014).
Research has shown that urban greenery plays a positive role in the walking time and propensity of elders (Lu et al., 2018). Assessing urban greening has been an important topic, and in the past urban greening assessments have tended to be flat, site surveys, aerial photography and satellite remote sensing images. These data images are often presented as bird’s eye views and top views; however, these methods are too traditional and are not perceived by the population, ignoring the perceptions of the people themselves (Kang et al., 2020). Image analysis of urban street scenes is rapidly developing rapidly in new research; street images have been rapidly developed in recent years in the field of public health care, with results indicating that street images are more easily perceived by the population and can provide a more objective image of the greenery of the street (Zang et al., 2020). However, in cases where there are missing data in the street view images, an objective and comprehensive assessment can be made together with the remote sensing images.
According to extant research on the effect of socioeconomic and demographic factors and built environment features on older adults’ walking behavior, environmental factors such as density, land use mix, and street connectivity are the most significant. Relatively few studies have explored the effect of greening on older adults’ walking behavior, and those that do exist have assumed a linear connection between walking behavior and other environmental parameters (Yang et al., 2019, 2022b; Zang et al., 2020). Nevertheless, it has been demonstrated that the link between the built environment and the walking behavior of older adults may also be nonlinear (Ding et al., 2019; Liu et al., 2021). Peer effects may be used to explain the link between nonlinearity and walking. The main focus in the most recent studies has been on nonlinearity, where the nonlinear association between the built environment and the walking behavior of older people is analyzed. Only one of these studies has been conducted on the nonlinearity of green views on walking behavior, however. With a proper understanding of the substantive implications of the nonlinear benefits, there is a need for a more in-depth study of the nonlinearity between the built environment and walking behavior.
To investigate the above issues in more depth, we used 597 valid data from our research group’s March 2021 survey of older people aged 65 and above in Guangzhou using the International Physical Ability Questionnaire (IPAQ), Baidu Street View (BSV) images and 2021 NDVI images to assess older people’s willingness to walk and the propensity to green their environment, respectively. A random forest model was used to evaluate the effect of urban greening and street greening on older people’s willingness to walk, while a binary logistic regression model was used and compared with the random forest model.
The main research objectives of this paper are as follows:
1. To fill the gap in the study of non-linear comparison between streetscape green visibility and NDVI.
2. To examine the nonlinear and threshold impacts of urban and streetscape vegetation on walking behavior.
3. To investigate the nonlinear and threshold impacts of internal environmental characteristics (e.g., Density, Design, Diversity etc. “3Ds”) on older adults’ walking behavior.
2. Literature review
Numerous experts have conducted studies on the built environment’s effect on older adults. A search of the relevant literature in the Web of Science to retrieve nearly 17 relevant articles from 2005 to 2022. The papers were first filtered by topic and then manually filtered by the relevance of the abstract content to this study. Table 1 summarizes the screened research on the association between the built environment and older adults’ walking behavior. The table does not present sociodemographic characteristics, but rather primarily reflects the built environment as the subject of subjective versus objective measures and as the variable that has received the most research attention to date.
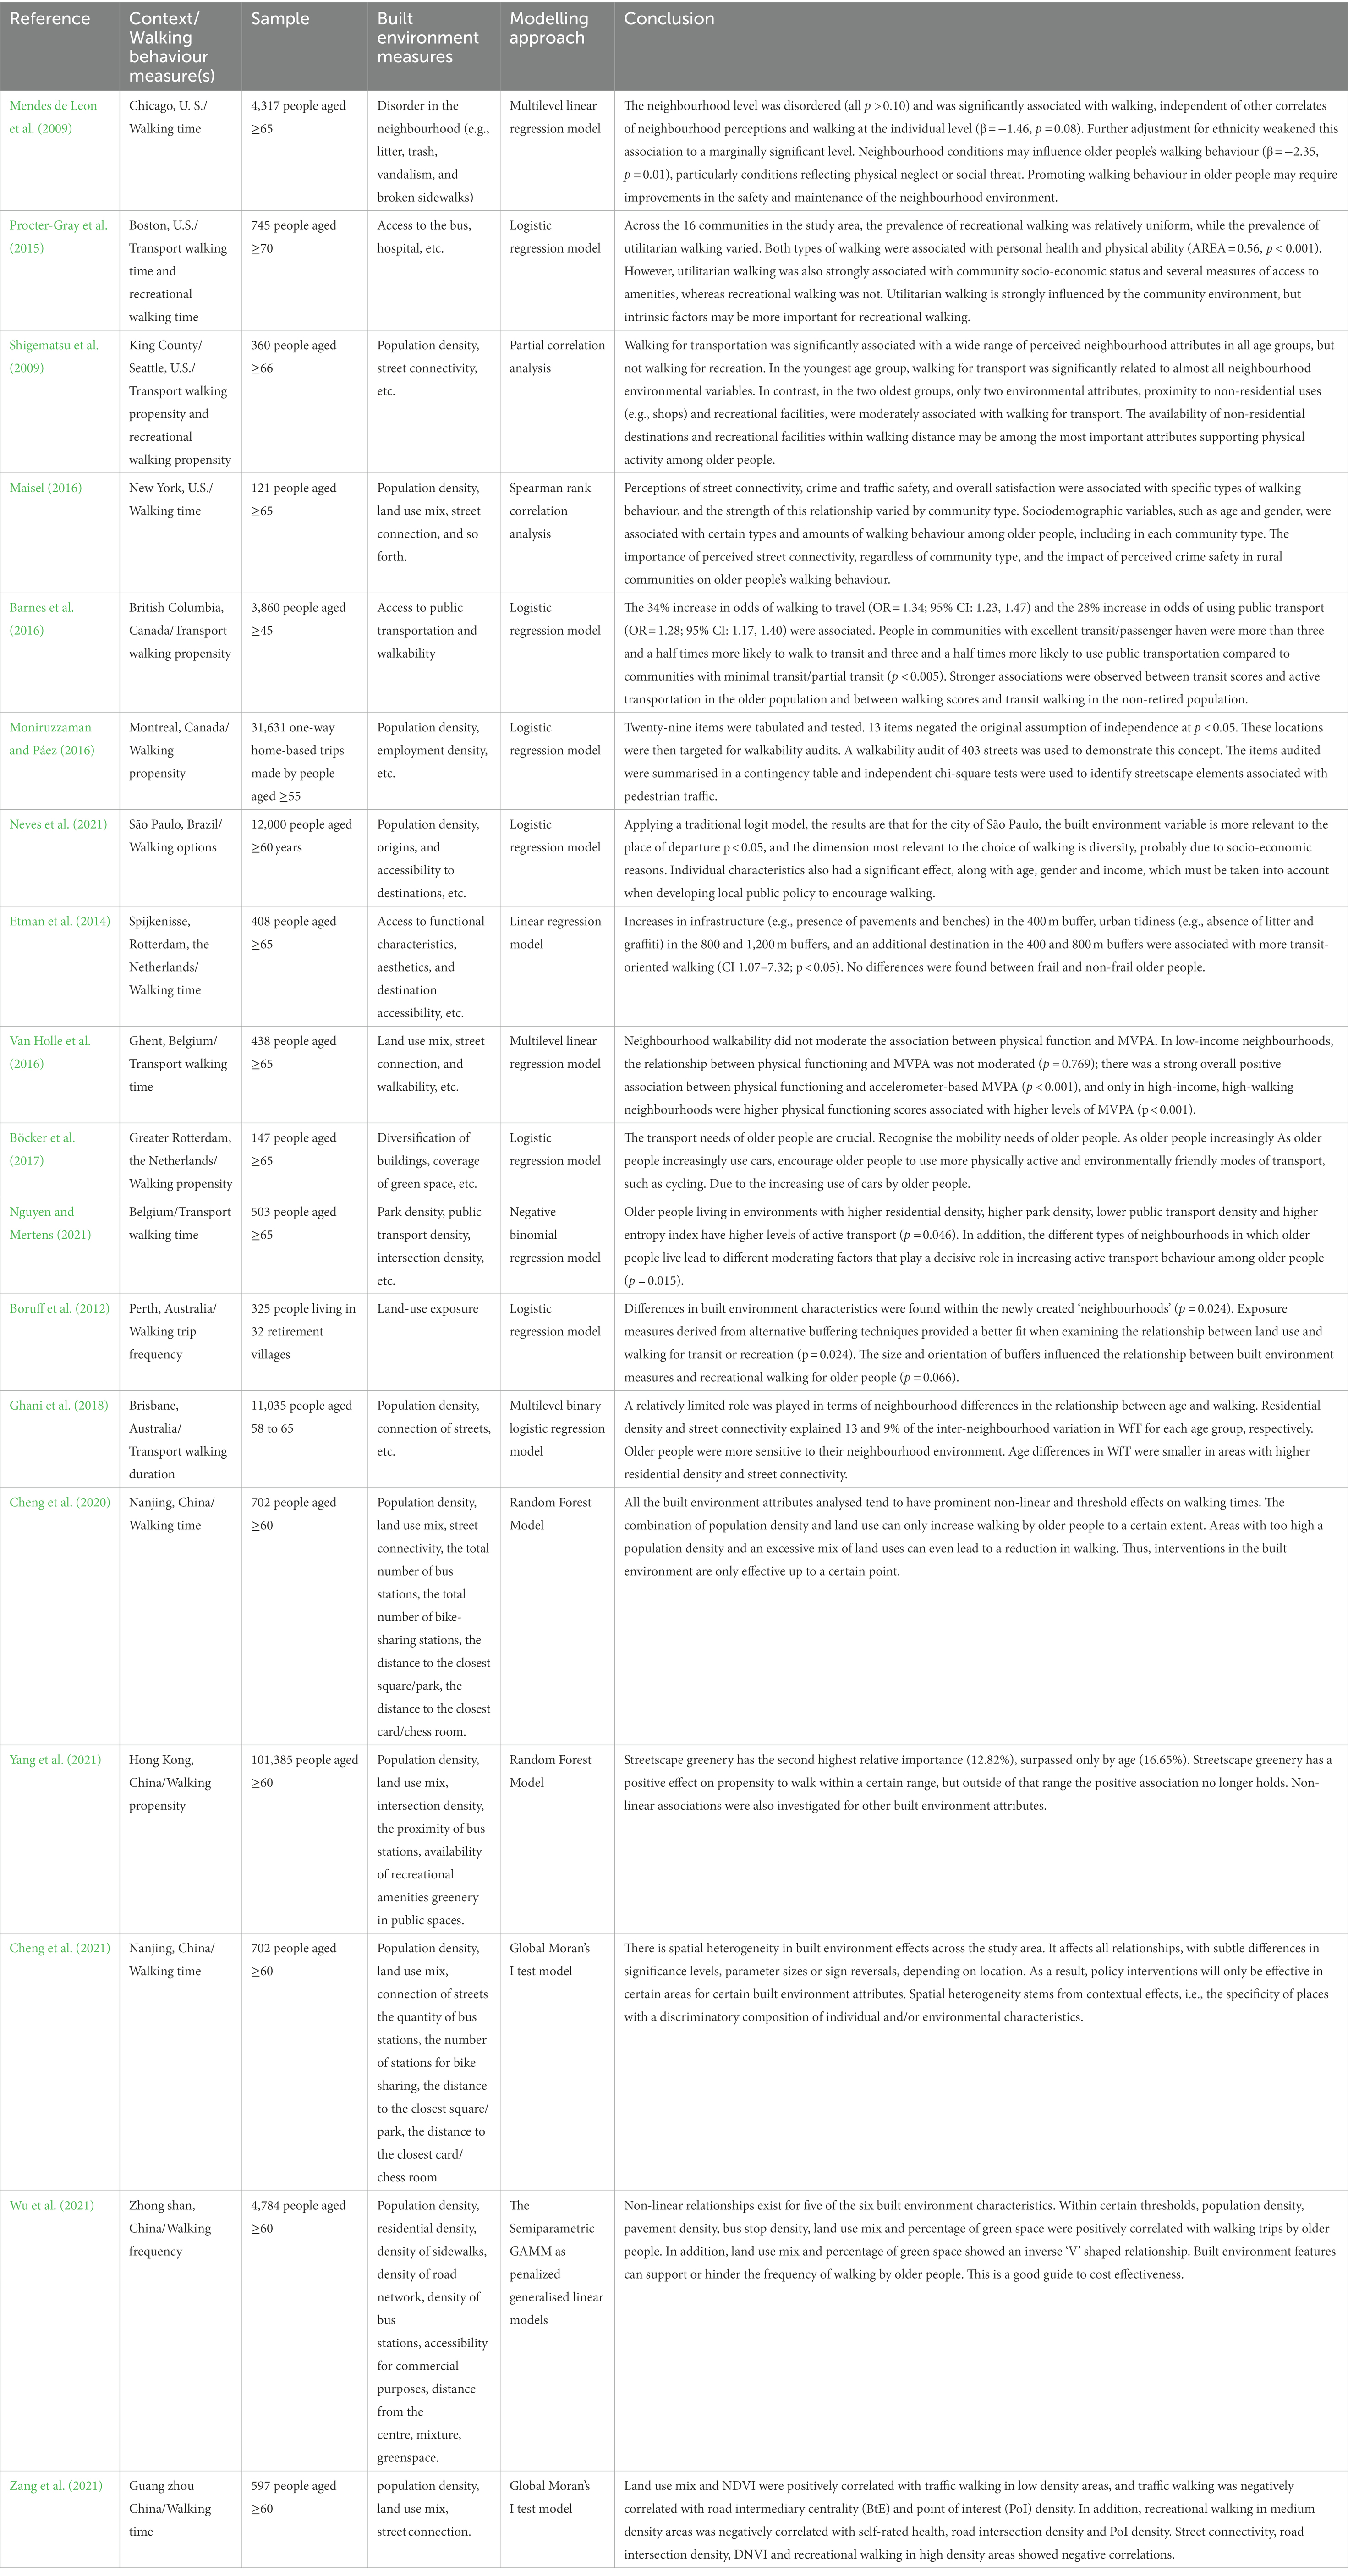
Table 1. Summary of studies on the built environment’s effect on walking for older adults.
Certain characteristics of the built environment (e.g., population density, land street connectivity, etc.) generally have consistent impacts. However, the results from practice (e.g., the effect of pedestrian facilities on walking) need more investigation due to disparities in prediction, control variables and study techniques.
Most of the research methods are geographically weighted regression models and are dominated by traditional linear regression and binary logistic regression, which have limitations. In a recent paper, Cheng et al. used a random forest model for modelling (Cheng et al., 2020). Compared to traditional geographically weighted regression models, this model is more accurate in predicting and confirming that the built environment influences older people to walk in a nonlinear way, but more research is needed to validate and add to the theory.
In the regions studied, North American cities have received more academic attention than South American cities, probably because the economies of North America are more developed. The European cities studied have been mainly in Belgium and the Netherlands, where ageing is relatively high, and to a lesser extent in Australia, probably because ageing is less of an issue in Australia. Over the recent decade, Asian cities (e.g., Harbin, Hong Kong, Nanjing, Zhongshan, and Guangzhou) have progressively migrated into the primary research area. The majority of Asian research was completed after 2010. Consequently, as a characteristic of the built environment, Zang et al. (2020) and have only recently focused on streetscape greenery. This is largely due to advances in greenery measurement techniques that enable accurate and efficient estimation of perceived greenery at eye height, as well as the provision of street view image data that is available for free from the map website. Most notably, such nonlinear impacts of the built environment on older adults’ walking behavior have received less attention. Additionally, Cheng et al. (2020) and Van Cauwenberg et al. (2011) conducted a comprehensive review of prior studies on the influence of the built environment on older adults’ walking behavior.
Through the above literature review and in the context of the medical pressures of ageing that China is facing, it is important to identify the nonlinear effect of greening on the propensity of older people in China to walk for 10 min, which will help to verify whether the findings of previous studies are applicable in China and to fill in the research gap on the correlation between greening and the propensity to walk.
3. Data and method
3.1. Research program
This research is based on a random intercept around the community that was chosen to reflect the various population density zonings of Guangzhou City Planning zones in the surrounding community. Density zones 1, 2, and 3 correspond to low-, medium-, and high-density regions in this article. According to the March 2021 price sample, there are six groups: low socioeconomic status (SES), high SES, low SES, >30,000 RMB/m2 and high SES. Ages 65–74, 74–84, and 85 and above were considered. To eliminate seasonal impacts, respondents were questioned in the spring. The survey took into account sociodemographic variables (e.g., employment, age, and level of education) as well as travel information (e.g., frequency of walking trips, broad questions related to walking time). We pooled the collected data of 600 older adults to increase the sample size, and after eliminating incomplete data records, we obtained a random group of 597 older adults in Guangzhou (see Figure 1).
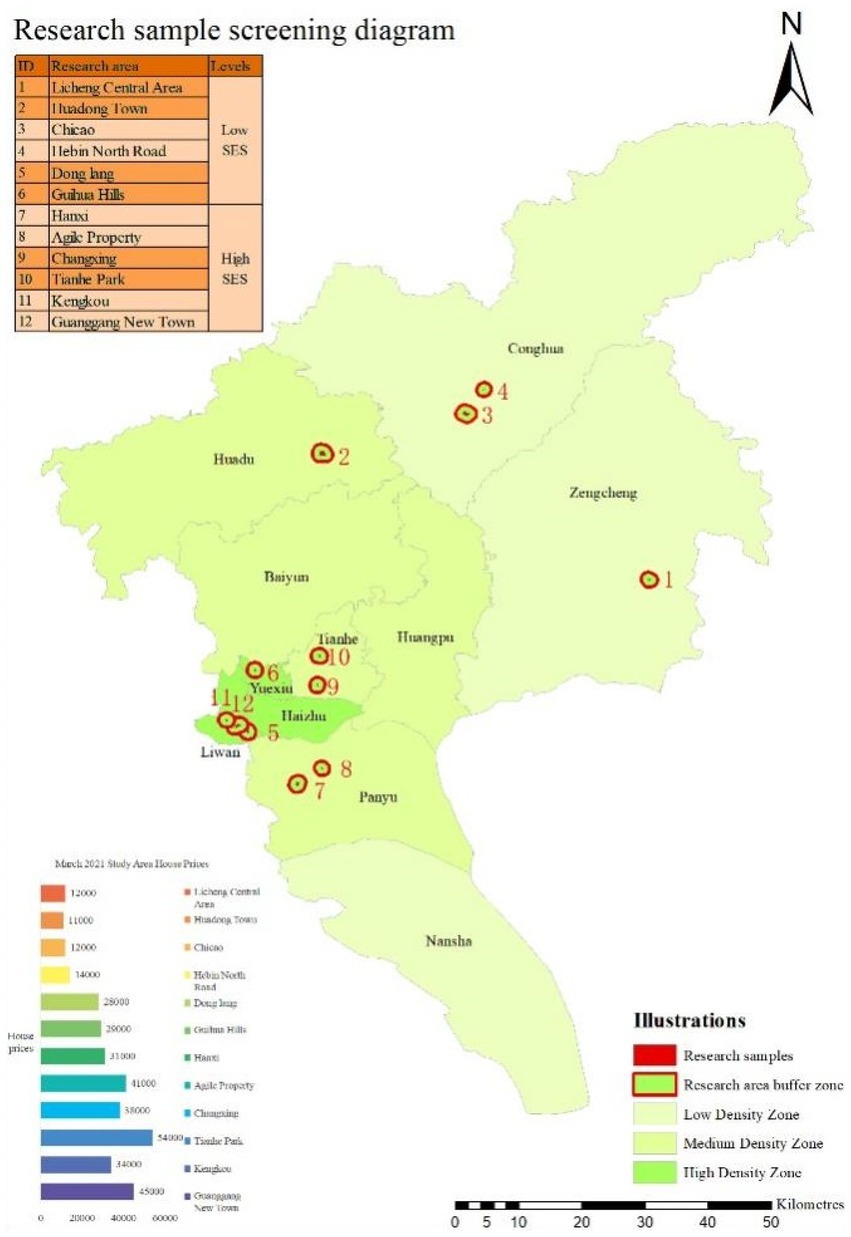
Figure 1. Research sample screening diagram.
The preliminary analysis of the 12 sample regions revealed considerable disparities in the built environment between low and high socioeconomic status districts in Guangzhou. To achieve appropriate impartiality and to avoid the model that ignores specific environmental factors from the computations, we simulated and computed the low- and high-SES regions evenly. The chosen sample locations are summarized in Figure 1.
The International Physical Activity Questionnaire-Long Version (IPAQ-LC) was used to categorize respondents’ desire to walk in the questionnaire according to the purpose of the interview. All respondents were divided into two groups: those who had some willingness to walk within 24 h (whether walking = 1) and those who did not (whether walking = 0), with the willingness to walk per person as the predictor variable. Additionally, areas beyond the residential context (greater than 1,000 m) were omitted.
3.2. Streetscape greenery and NDVI
The static 360° street-view picture covers a larger geographic area, has fewer data mistakes, is more cost- and time-efficient, and is sampled by humans more than standard data sources (Kang et al., 2020). In comparison to Google Street-view (GSV), Baidu Street-view (BSV) is more China-centric, with picture data spanning all major cities in the country and gathered by sensor automobiles equipped with GPS devices assuring both accuracy and timeliness.
Using BSV images, a streetscape greenery index with a highly similar perspective to the human eye was obtained, which reflects the degree of greenery directly acquired by the human eye. The method is as follows. First, the coordinates are geocoded into ArcGIS software based on the subdivisions of the sampled elderly sample areas. A 1,000 m buffer zone is drawn based on the boundaries of the sample, and all primary to tertiary streets within the 1,000 m range are sampled and recorded, after which a fixed 50 m spacing is taken to generate sampling points in all streets within the buffer zone. A total of 40,000 BSV images are downloaded from the Baidu Maps developer platform for static map API download. For each location point, four images were sampled at 90, 180, 270, and 360° each to represent the 360° panorama image (Long et al., 2015; Zang et al., 2020; see Figure 2). The BSV-generated streetscape greening was calculated as follows:
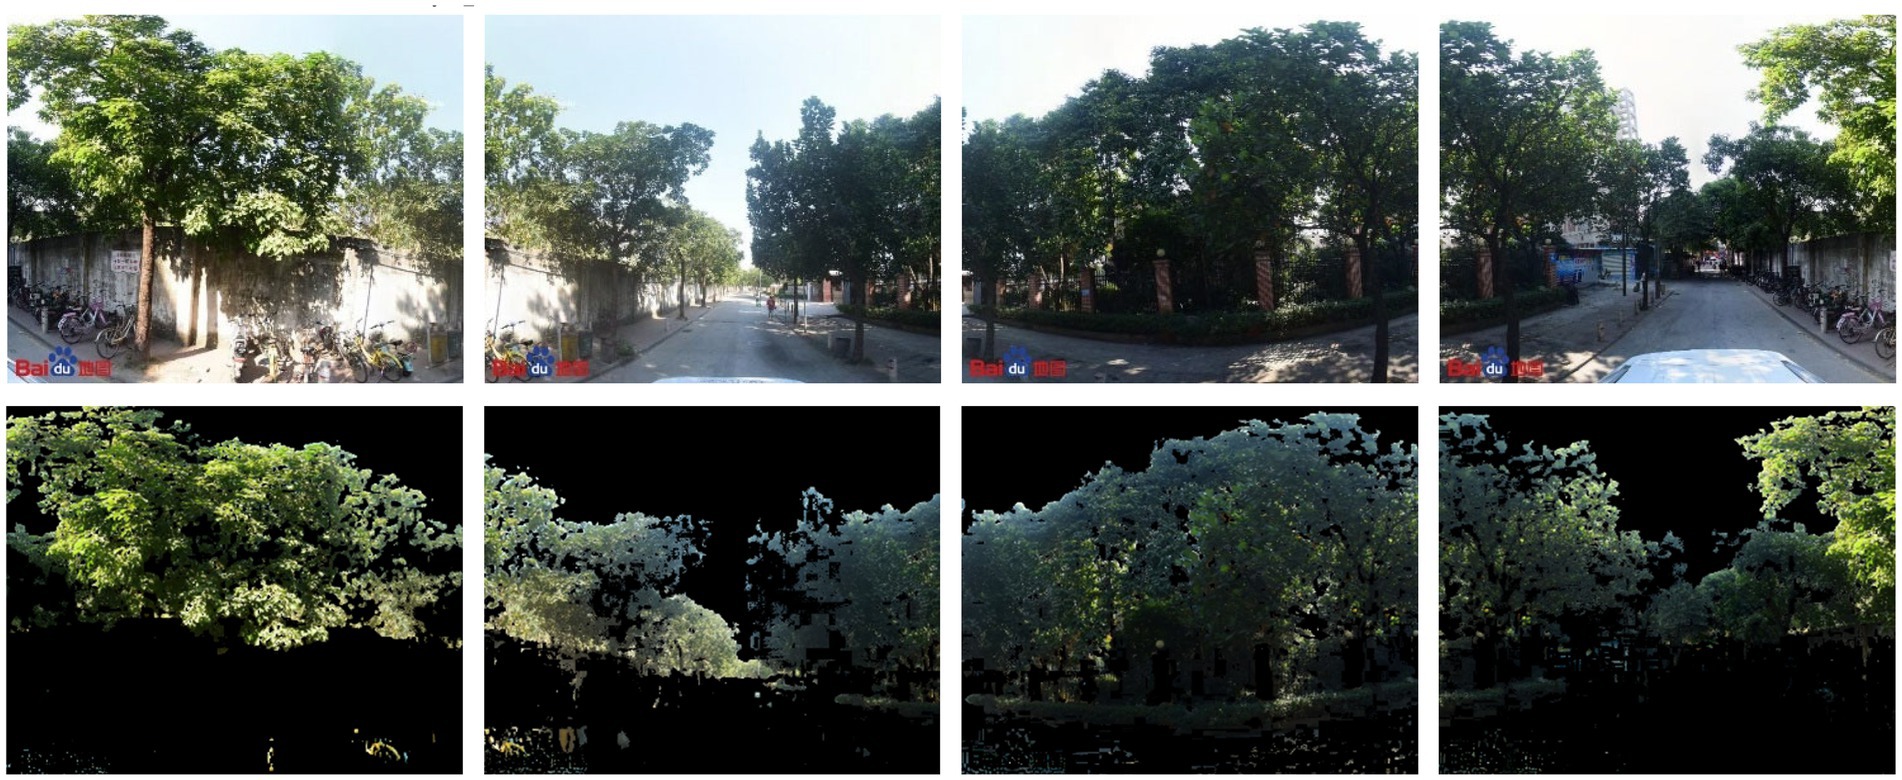
Figure 2. A random forest technique example.
The NDVI normalized difference vegetation index (Tucker, 1979) can be used as a complement to green plant visibility where streetscape map coverage is incomplete to represent the chlorophyll content of the area in which it is located (Helbich, 2019). In secondary and tertiary roads relatively far from the main urban area, streetscape data are missing; in green sight assessment, NDVI, although not the most direct reflection of human vision to the same extent as streetscape, is the best data supplement in the absence of data. To provide a more objective assessment of the environment in the sample area, we used a map of Guangzhou city with an accuracy of 10 m extracted from remote sensing in August 2021 as a base map and calculated the pigment absorption of chlorophyll in the red band and the high reflection of vegetation in the near-infrared (NIR) band (see Figure 3). The formula for calculating NDVI is as follows:
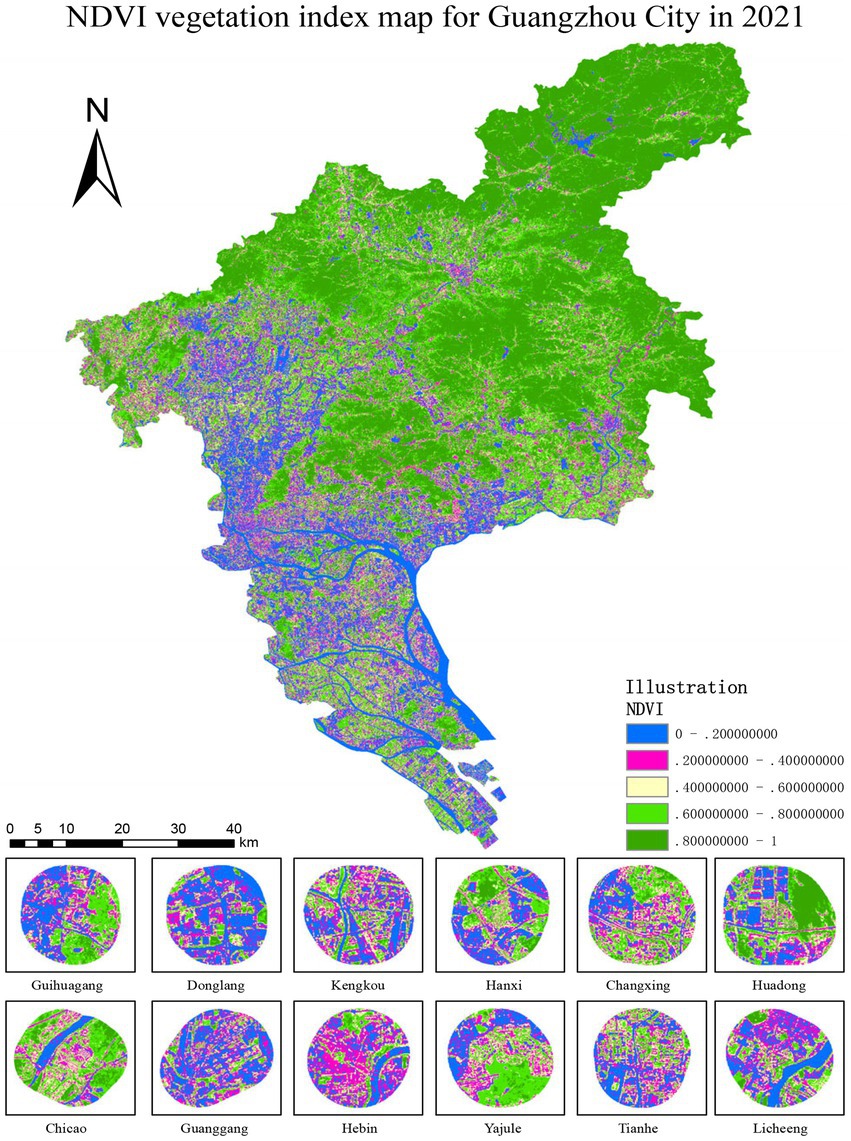
Figure 3. NDVI normalized difference vegetation index (NDVI) map for Guangzhou in 2021.
3.3. Variables
The prediction variables used were two minimal sociodemographic characteristics and nine variables relating to the built environment, with the exception of the streetscape and greenery variables, where we focused on seven environmental variables developed under the ‘3D’ built environment assessment framework (Zang et al., 2019). All environmental variables were measured within ArcGIS software using geographic data from the national geographic information service platform SkyMap.1
Table 2 presents descriptive statistics for the predictor and predictive variables, from which it can be seen that 75% of the older adults did at least some walking in the 24-h period. The other 25% of older people did not walk.
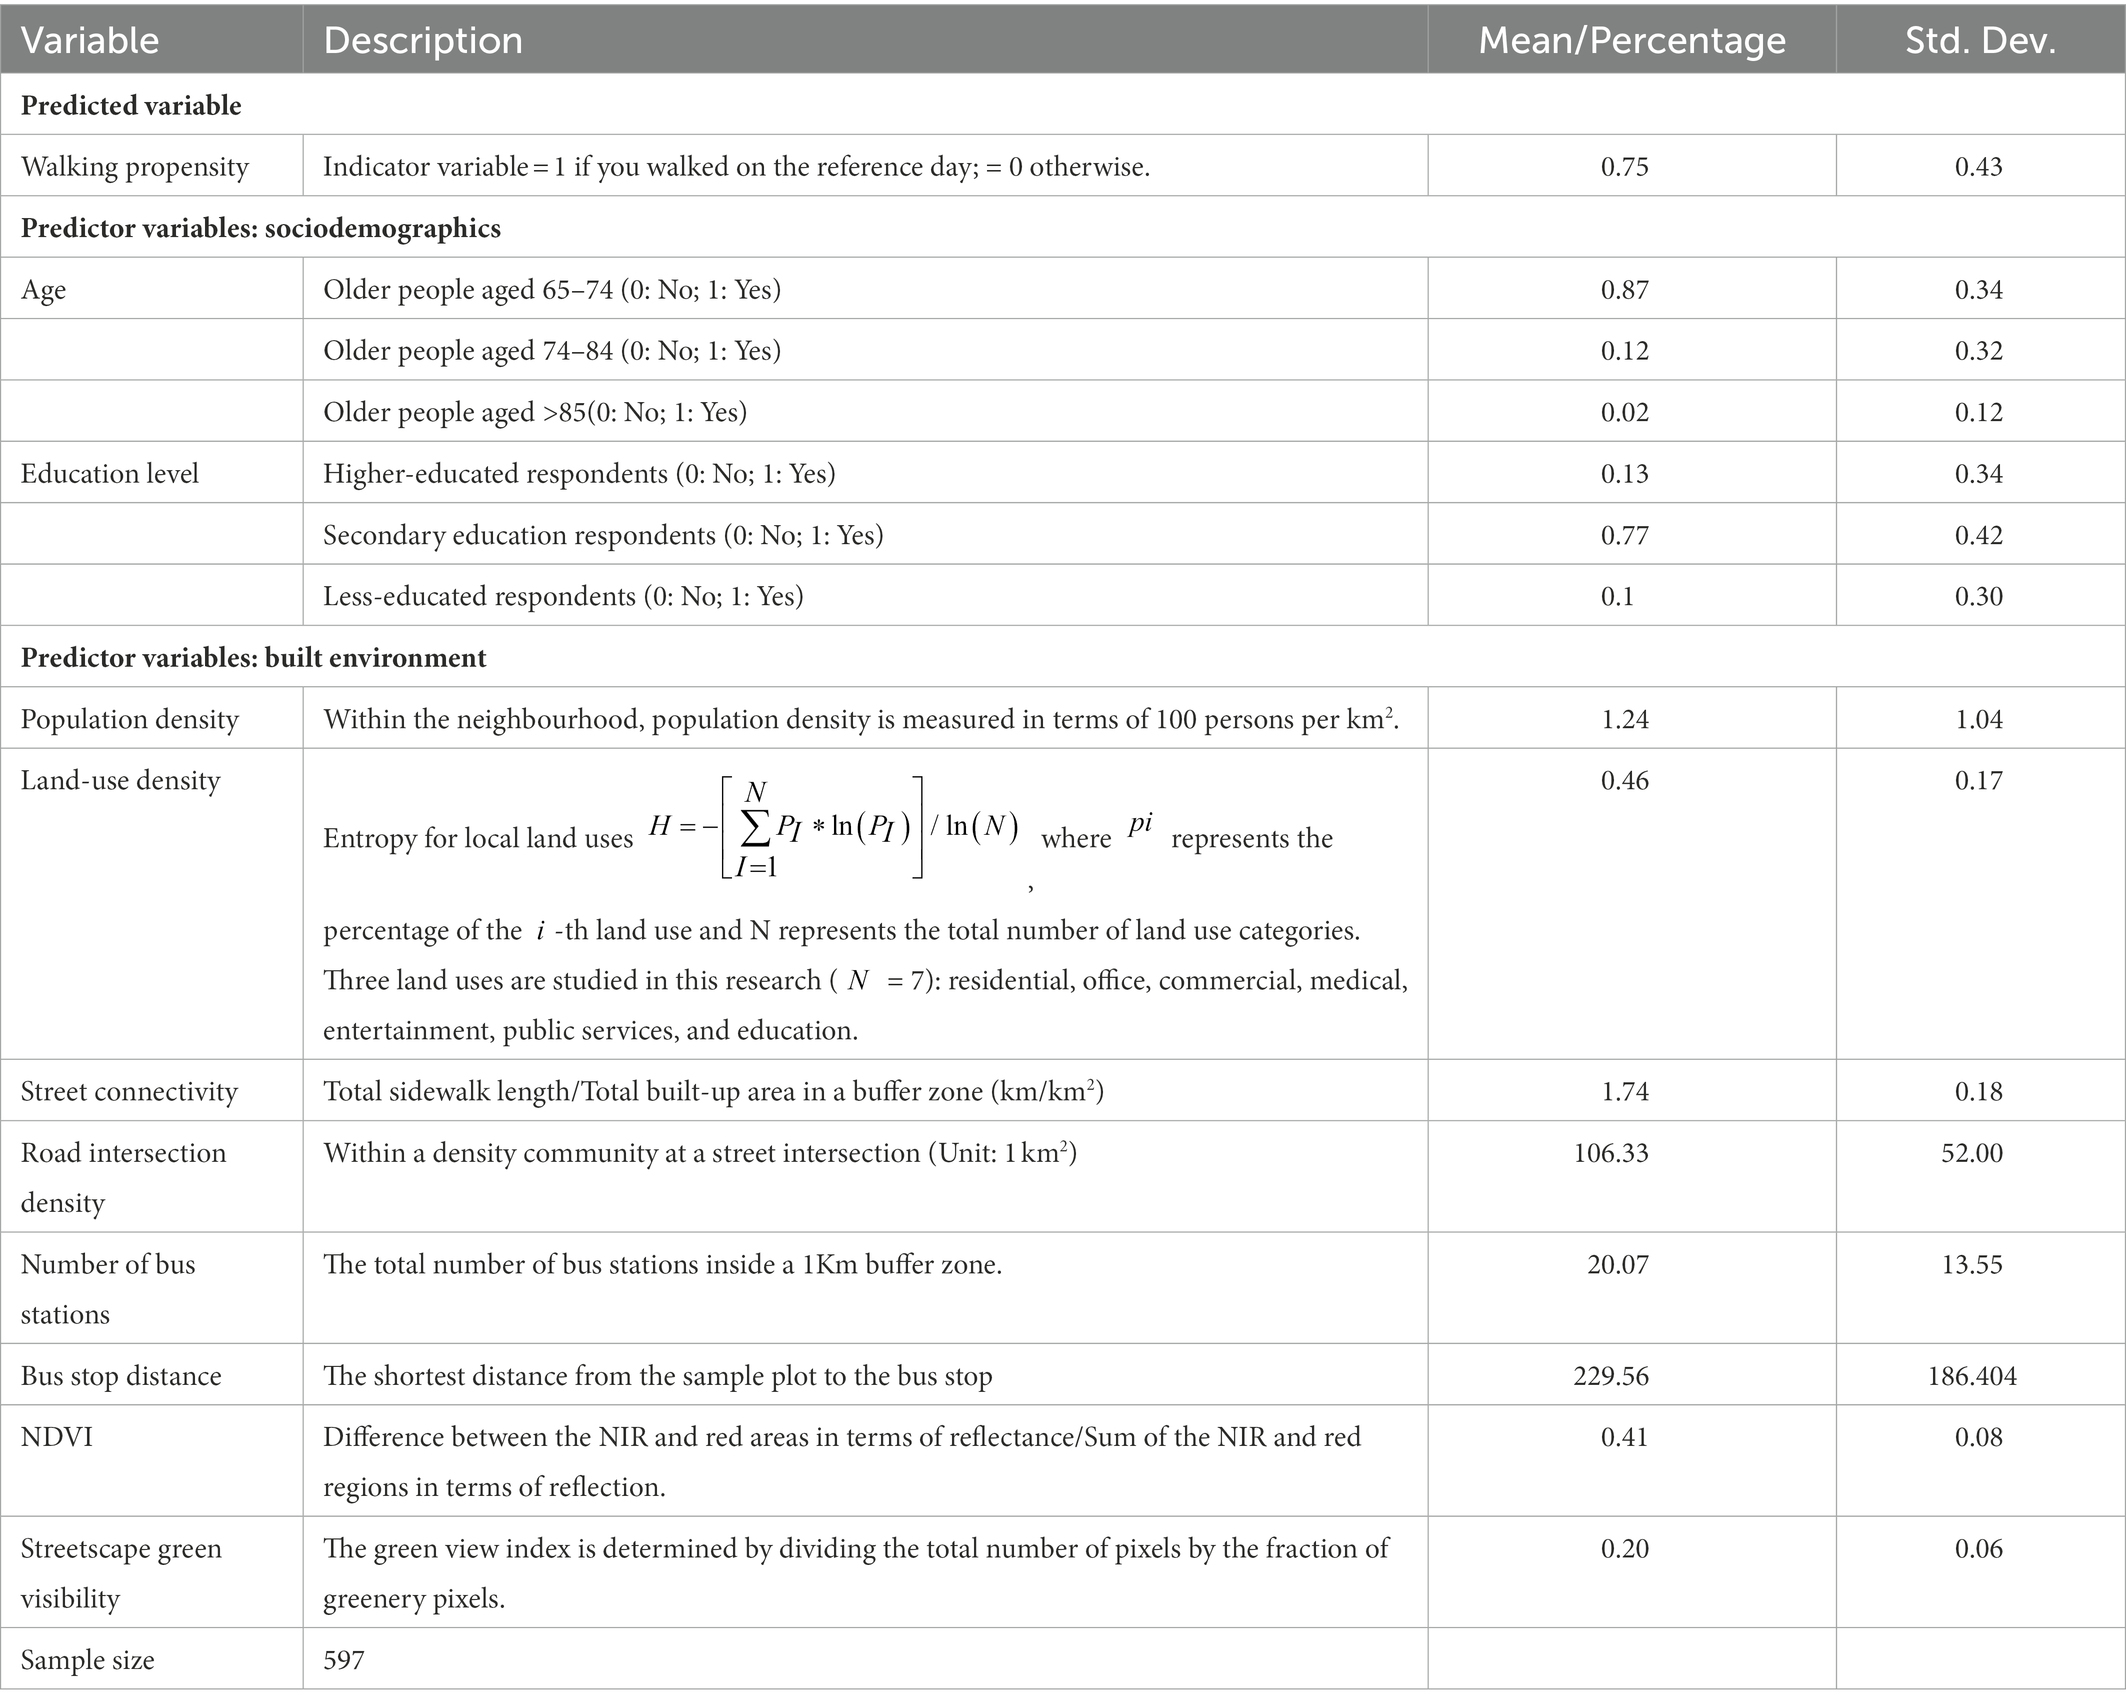
Table 2. Summary statistics and descriptions of the predicted and predictor factors.
3.4. Methodology
Random forests (a.k.a., random decision forests) are currently one of the most popular and effective computer learning algorithms in international competitions (Sagi and Rokach, 2020) and can perform data mining, classification and regression tasks and explain finer correlations between variables. This excellent machine learning algorithm was first proposed in 1995 by Tin (1995), and the “Stochastic Decision Forest” (Tin, 1998) constructed a forest comprised of several decision trees for classification and regression.
The random forest approach shown in Figure 4 combines the ease of a decision tree with the restriction to a subset of the sample’s test and predictor variables. Random forests algorithmically reduce the variance and coordinate multiple decision trees together to optimize the model (Breiman, 2001), thus solving the overfitting challenge. The objective is to minimize the loss function and verify the accuracy of the findings by iteratively assessing the test and prediction sets using their own method until the loss function achieves a minimal value or stays stable. The random forest is made up of an infinite number of decision trees and works, as shown in Figure 4. To ensure the variety of the decision trees, two randomness tree treatments are applied. First, the training data are structured in such a way that each tree develops with a unique subsample. Second, features are randomly chosen to produce distinct groups of explanatory variables from which to divide the tree’s nodes. Splitting continues in a single decision tree until the maximum tree depth is achieved. Based on the average answer of each location, a single forecast is created. By averaging the predictions of all individual decision trees, the ultimate result is achieved.
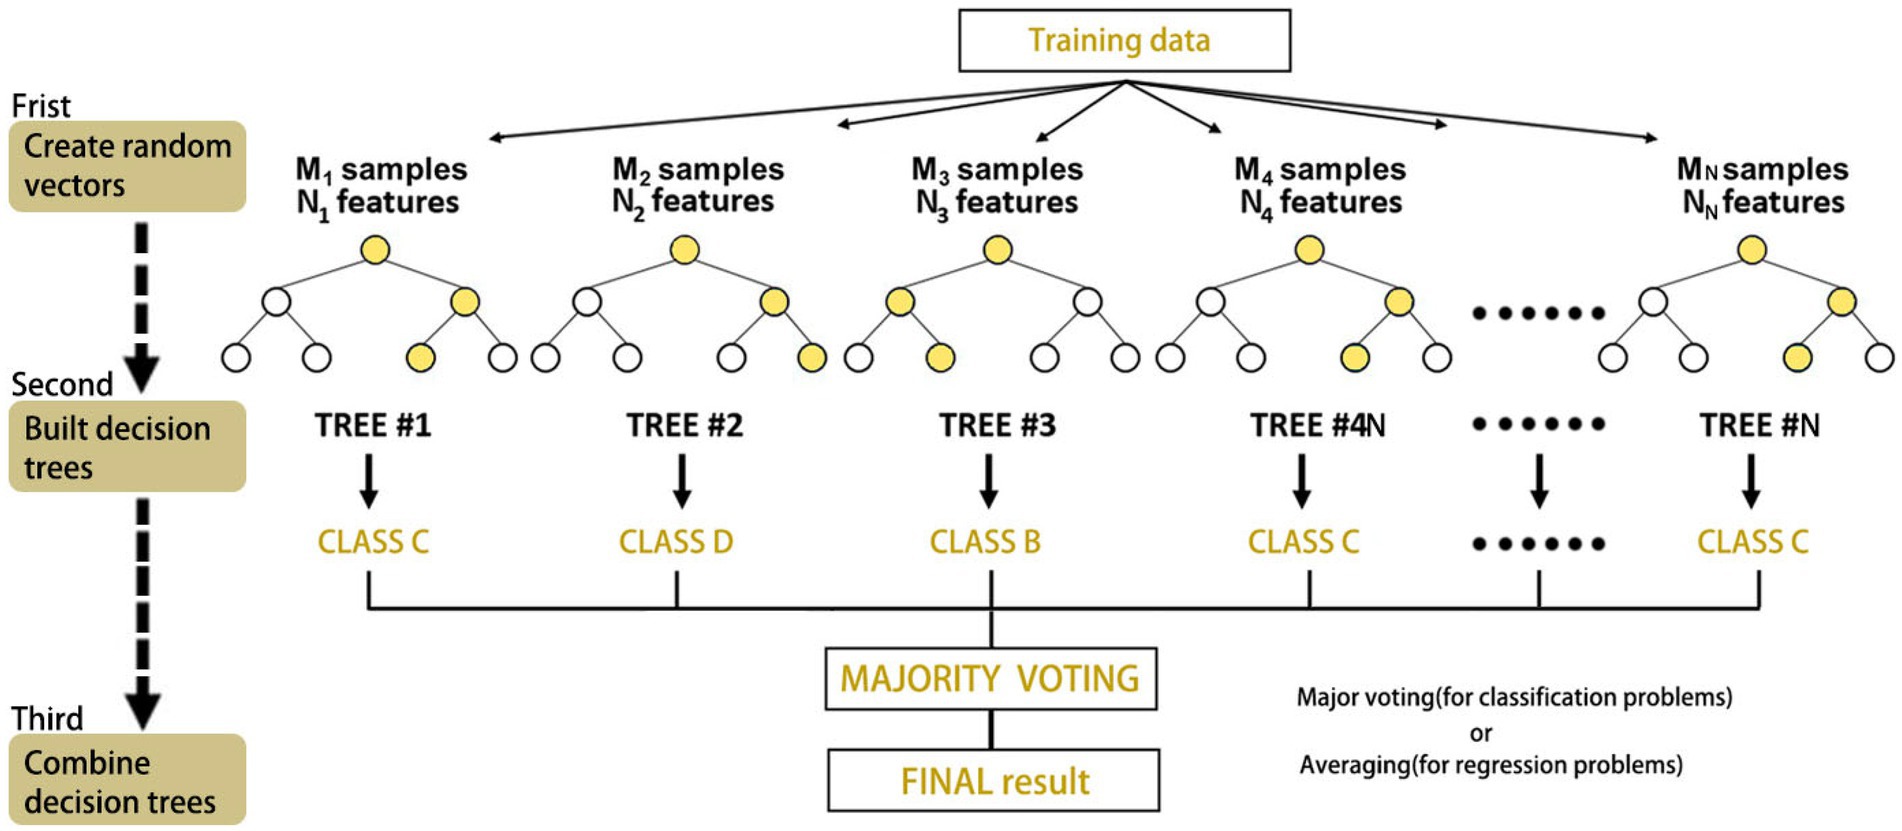
Figure 4. Depiction of the BSV-based method for estimating streetscape greenery at eye level.
Three factors significantly affect the forecasting effectiveness of random forest algorithms (Cheng et al., 2019); first, improving the accuracy of individual trees and second, reducing the similarity of each tree. Finally, we need to parameterize the whole model, most notably three parameters (Claesen and Moor, 2015): the tree’s greatest depth, its total number of trees, and the number of splits. Random forest parameters are manually and continually checked to determine the optimal values. Most other machine learning approaches, including random forests, do not yield t statistics, p values, or other markers of statistical significance. However, the random forest can calculate the relative importance of variables and then visualize it with the following formula for the importance of variable x.
where is the importance of the variable, the total number of decision trees in a random forest model is denoted by , denotes the mean squared error t before the variables are ranked in the decision tree, and , denotes the mean squared error after the variables are ranked (Breiman, 2001).
In contrast to standard regression-based statistical studies, which predetermine the (often linear) connections between predictor and predictor variables, random forest does not make these assumptions. Additionally, depending on the degree of the predictor variable, hypothetical random forest modelling generates partial dependency plots (PDPs) to illustrate the link between the test and predictor factors (Pedregosa et al., 2011). The equation for partial dependence is as follows:
where is the value of the variable for the modelled dataset and N denotes the number of occurrences. The graph demonstrates how the built environment’s influence on walking time is constant over a variety of nonlinear connections (Buitinck et al., 2013).
Prior to modelling, the independent variables were first checked for multicollinearity analysis, with all sociodemographic and environmental variables satisfying VIF < 5, ensuring that all variables were free of multicollinearity. For the purpose of random forest model pair optimization, a range of these three parameters was first determined (maximum tree depth is between 1 and 20, the number of features per tree is between 2 and 6, and between 10 and 1,000, and there is one interval per 10 trees). Second, we estimated a total of 8,000 (=20 × 4 × 100) potential combinations and used Area Under Curve (AUC) to evaluate model performance (Lee, 2019). After 900,000 tests, we discovered that the model stopped developing quarterly at a maximum tree depth of 8, a feature count of 4, and a tree count of 830, even though the root mean square deviation values were low and the model functioned well. Finally, the model was applied for further analysis.
3.5. Comparative analysis of random forest and binary logistic modelling
We evaluated the performance of random forest and binary logic modelling using tenfold cross-validation. Three common classification metrics were used, namely, model accuracy, mean squared error and mean squared error. These three metrics were calculated as follows:
where Accuracy denotes the ratio of properly predicted samples to total predicted samples, N is the number of samples in the validation set, TPi denotes the number of correctly predicted samples (predicted walking tendency is True and actual walking tendency is also True), TNi is interpreted as (predicted walking tendency is False and actual walking tendency is also False), FPi is interpreted as (predicted walking tendency is True but predicted walking tendency is False), and FNi is interpreted as (predicted walking tendency is True 1 but actual walking tendency is Ture).
In the MAE and RMSE equations, denotes the total number of respondents in the validation set, denotes the sample’s projected propensity to walk, and is the sample’s actual propensity to walk; the lower the values of these two equations are, the more evidence of a more accurate model. The results of 10 cross-validations of the two models are shown in Table 3. All three metrics demonstrate that the random forest model beats the classic binary logistic regression equation and is more adaptable in its nonlinear performance (Zang et al., 2022).
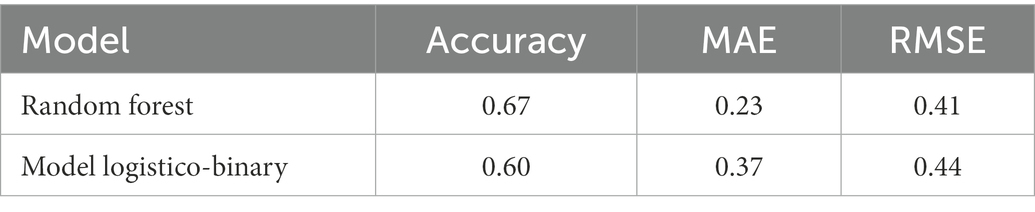
Table 3. Comparison of random forest versus binary logistic regression results.
4. Result
4.1. Predictor variables’ relative relevance
The relative relevance of the predictor factors is shown in Table 4, and their ordering is shown in Figure 5. The other ‘3DS’ environmental factors are similarly extremely highly placed in the top five in terms of overall relative significance, ranging from (9.80–12.65%); it is worth noting that NDVI is ranked relatively low at number seven, with a value of (8.83%), suggesting that streetscape greenery has more influence on the propensity to walk than NDVI.
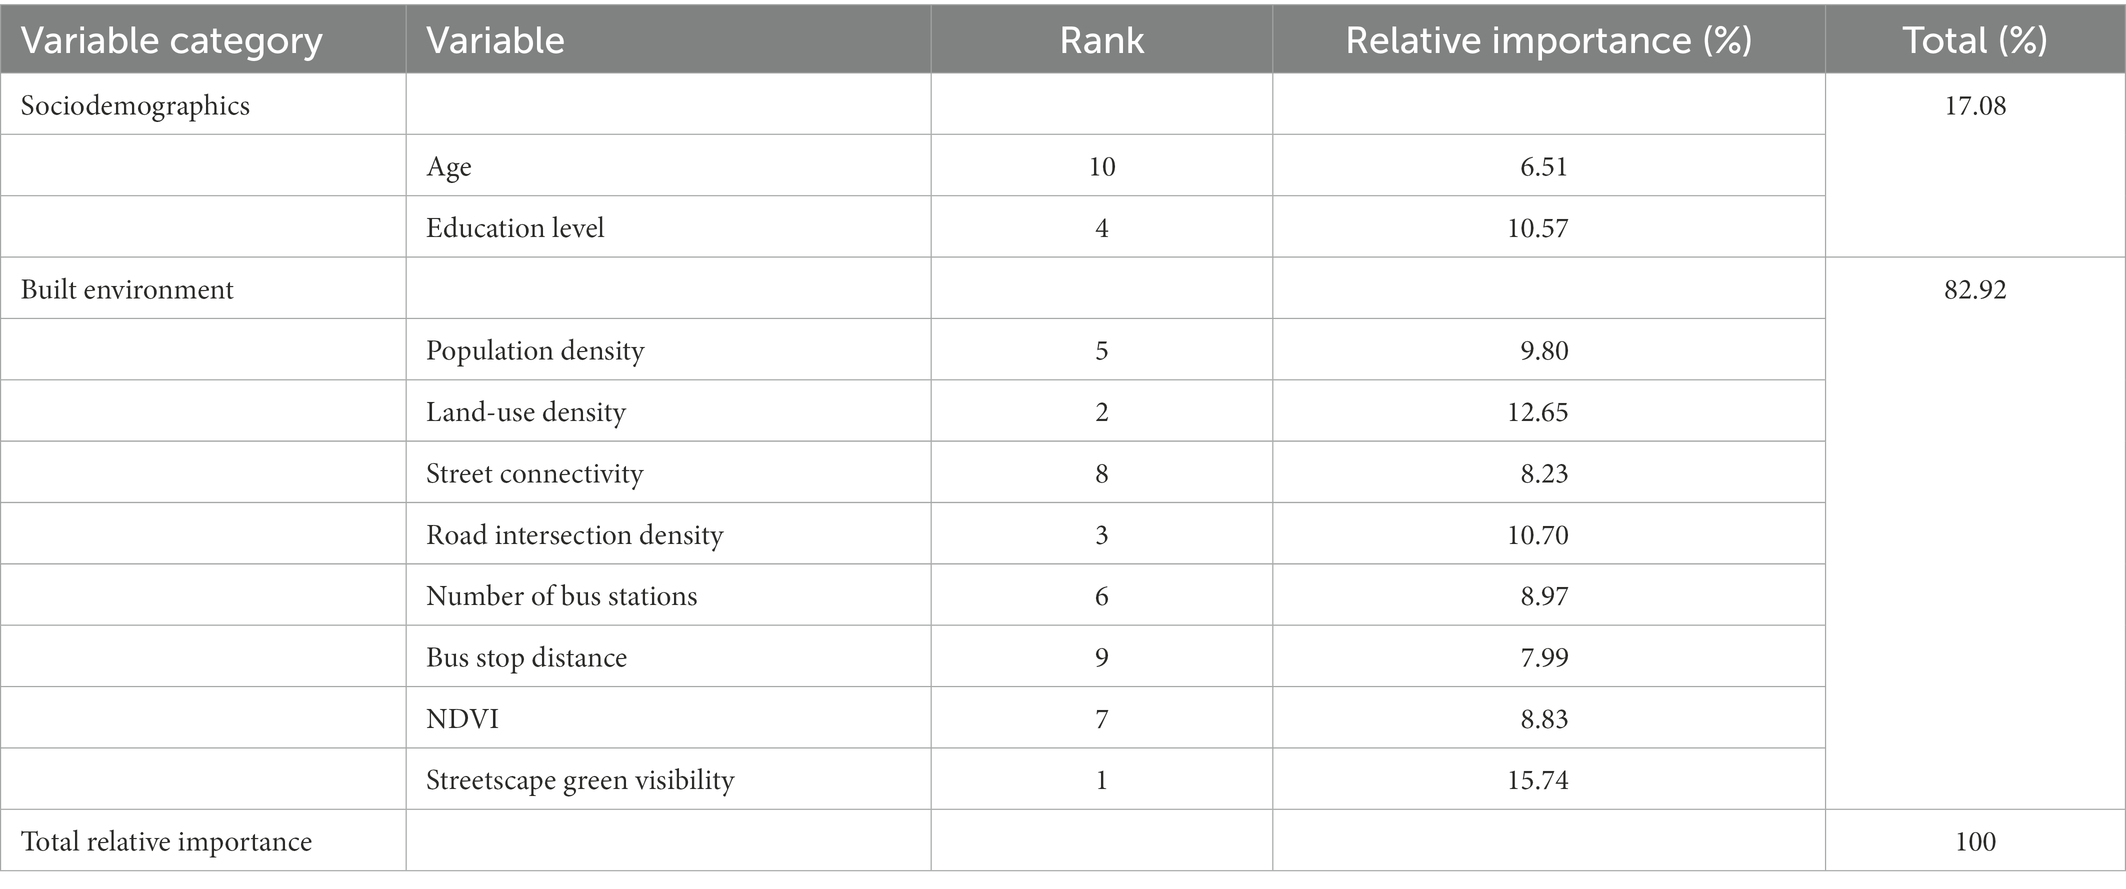
Table 4. The random forest algorithm calculates the relative relevance of predictor variables.
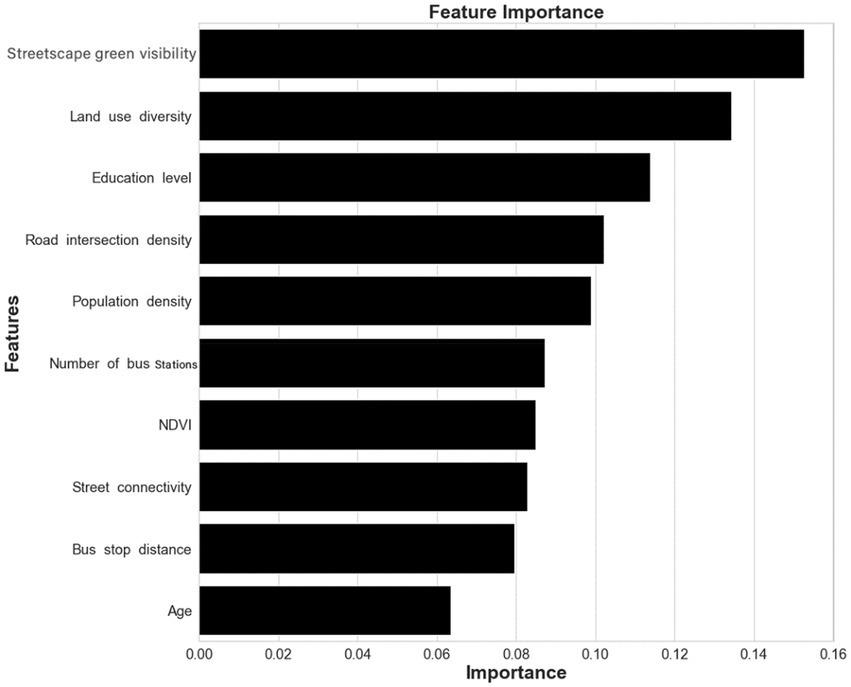
Figure 5. Predictor variables’ relative relevance.
Environmental variables accounted for 82.92% of the total importance, while sociodemographic variables accounted for only 17.08%. This indicates that built environment characteristics significantly influence older persons’ proclivity to walk, which is consistent with the results of Cheng et al. (2020) and Yang et al. (2021), who also studied the relationship between older adults and walking in Nanjing, China and Hong Kong, China, where built environment factors dominated in a nonlinear model. This result also complements the findings in the European and North American samples, where built environment variables had a greater impact on walking than sociodemographic variables (Gim, 2013; Wang and Ozbilen, 2020; Yu et al., 2021).
4.2. Nonlinear effect of streetscape green visibility and NDVI
As illustrated visually in Figures 6A,B, the random forest results for the predictor variables used to calculate PDPs illustrate the nonlinear relationship between streetscape greenness and propensity to walk, where the x-axis represents the distribution of the predictor variables, the y-axis represents propensity to walk, the black line represents the predicted outcome, and the red line represents the smoothed curve of the predicted outcome. The smoothed curve may be used to more intuitively represent the trend of the expected outcomes (Tao et al., 2020).

Figure 6. (A–H) The nonlinear effect of built-environment characteristics on walking proclivity.
The impact of streetscape green visibility on older adults’ proclivity to walk is seen in Figure 6A. As the first environmental factor to influence the propensity to walk, its predictive index peaks at less than 0.24 and is positively correlated with the propensity to walk, with a decreasing trend line when green visibility exceeds 0.24, a finding consistent with related research findings (Yang et al., 2021). The impact of the streetscape green visibility is relatively limited, and when it reaches 0.24, a further increase in the streetscape green visibility does not increase the propensity of older people to walk.
Figure 6B shows the effect of NDVI on the propensity to walk of older people, peaking at an NDVI of 0.45, which is positively correlated with propensity to walk when the predicted index is less than 0.45 and negatively correlated with propensity to walk when the predicted index is above 0.45. One interpretation is that vegetation cover is already high when the NDVI is 0.45, and when the vegetation index increases further, its walkability visibility and environmental confinement also increase, and walkability decreases. Although the NDVI is not as important as the streetscape green visibility, it is a good guide to the propensity to walk.
4.3. Nonlinear effects of other built-environment variables
Figures 6C–H represent PDPs for other built environment variables. 5c shows a negative correlation between the population density predictive index and propensity to walk at less than 3.6, with population density having a negative effect on the propensity to walk, possibly indicating that more developed places with higher population density in the sample area are becoming less attractive to older people. This result is not very consistent with existing studies (Cheng et al., 2020; Yang et al., 2021). The shaky curve decreases faster when the walking index is 2, which may be due to older people disliking densely populated areas and preferring to walk in sparsely populated, quiet places.
The impact of land use mix on the inclination to walk is seen in Figure 6D, with a positive effect when the projected index of land use mix is smaller than 0.45, a result that is consistent with some of the literature results (Cerin et al., 2017; Cheng et al., 2020; Yang et al., 2021), where an appropriate land use mix of 0.45 provides a richer functional need and a stimulus for walking. A predictive index greater than 0.45 is negatively correlated with the propensity to walk, i.e., a high land use mix does not create a positive environment for walking.
Figures 6E,F show the nonlinear effects of road intersection density as well as street connectivity on the propensity to walk. Figure 6E predicts a positive correlation with the propensity to walk from 0 km–200 km, consistent with existing studies (Cheng et al., 2020). 在 For the time being no adverse effects on walking were found within the study area, which may be related to the urban infrastructure development. The sample area does not have a higher denser road network to predict the effect of higher density road intersections on the propensity to walk, and it is not possible to confirm the research theory of Yang et al. (2021). The nonlinear effect of Figure 6F is more apparent when the predicted value of street connectivity is less than 0.15 and is positively correlated with propensity to walk and negatively correlated with propensity to walk in the range of 0.15–2.0. This may be because when connectivity is too high, it means that road junctions become complex and the elderly are less safe crossing the road, resulting in less walkability. Thus, while contemplating the addition of more road junctions, it is critical to examine the complexity of the intersections to create a more pleasant walking environment.
The nonlinear impacts of the number of bus stations and the shortest distance to the bus stop are shown in Figures 6G,H, as predicted from both the findings and Cheng and Yang’s research. All of the projected outcomes are positively associated with a proclivity to walk.
5. Discussion and conclusion
In the context of China’s growing ageing problem, it is important to build more walkable community environments. Walking allows older people to maintain their health status better, and it is necessary to promote walking frequency among older people through the environment. This study uses machine learning to calculate streetscape greenness and greenness indices through non-linear modelling to fill a gap in the non-linear influence of the Normalized Vegetation Variance Index (NDVI) on propensity to walk, complementing observations of the threshold influence of streetscape vegetation and internal features of the built environment on the propensity to walk of older people. Such comparisons have rarely been studied in the non-linear modelling literature. As a result (Statistics NBo, 2021), Streetscape Green Visibility is more perceived by older people than NDVI, and Streetscape Green Visibility is the most important (Nordbakke and Schwanen, 2014). Both Streetscape Green Visibility and NDVI have a nonlinear effect on walking propensity (Curl and Mason, 2019). When the predictive index of Green Streetscape Visibility is less than 0.24, it is favorably connected with walking propensity; however, when the predictive index is greater than 0.24, it has a negligible influence on walking propensity (Moniruzzaman and Páez, 2016). The built environment, such as 3Ds, also showed an effect on walking propensity in the nonlinear model.
In practice, it is more difficult to control the NDVI to a value of 0.45, as it is more macroscopic than the street-level green vision, whereas it is relatively easy to control the streetscape green visibility, with green pixels occupying 1/4 of the human eye’s visual range to maximize the propensity for older people to walk. While it is important to use the NDVI as a criterion for assessment, it is also important to assess the streetscape greenness and walkability of a community from the perspective of the people themselves by taking photographs of the actual environment in a sample of the planned area. This will enable poorer neighborhoods to be optimized and avoid the unnecessary waste of human and material resources by overinvesting in greenery in existing good environments.
This research adopts a more scientific approach and relevance, and its findings will provide a scientific basis for policy-makers. Researchers can quantify the space, and previous research illustrates the existence of nonlinear effects of the built environment on human behavior. Research should focus on both linear research and nonlinear research. The use of machine learning helps researchers construct more complex models of the link between the built environment and behavior and to dig deeper into the results and conclusions. Additionally, this study is also a practice of a new approach, as the traditional linear system can only prove the link between two variables, but it is not easy to reflect the true complexity of the impact of the environment on the walking behavior of older adults. This study uses a nonlinear model to provide an optimal index of the physical environment, which avoids wasting resources. The Government can use these environmental thresholds to develop policies to regulate the use of green infrastructure, especially in less economically developed cities where the environmental thresholds have been shown to be lower than in developed cities, and should choose the appropriate environmental thresholds as indicators to update or build a community walking environment that meets the needs of the local elderly according to their own economic situation. The construction of a nature-centric green city is currently a significant trend in international urban planning, but due to the limitations of each city’s position and its own economic development more research is urgently needed to help different cities tailor their own green-friendly city standards to maximize the efficiency of economic resource use, and this study provides a green construction indicator solution for other scholars to consider.
This study provides relatively new findings and proof of previous theories, offering new vivid ideas for future research. However, there are still limitations. First, Guangzhou is a first-tier city in China, a city with a relatively high mix of population and land use, and similar studies are currently available in Nanjing and Hong Kong; however, the nonlinear effects of the built environment on older people’s propensity to walk need to be studied in more regions to confirm the applicability of the generalizations and transferability of the findings. Second, the built environment (streetscape green views and NDVI) has a good synergistic effect on promoting walking propensity. Third, as a data-driven approach, the random forest method used in this study relies on the relative importance of orthogonal decision edges and predictor variables, which may not find optimal partitioning. Therefore, the choice of independent variables should be reversed in that all factors of the dependent variable cannot be controlled for in the decision tree; therefore, the results are still biased. Fourth, in the actual walk, the elderly are experiencing a richer experience through the greenery, based on the streetscape green visibility not capturing all the perceptions of the elderly, with the development of science and technology and the relative maturity of the Unreal 5 engine, a relatively realistic scenario can be built and combined with wearable devices to assess the environmental conditions more deeply. Fifth, the study’s nonlinearity and threshold effects provide critical insights for land use and transportation strategies aimed at encouraging older adults to walk.
Data availability statement
The original contributions presented in the study are included in the article/supplementary material, further inquiries can be directed to the corresponding author.
Ethics statement
Ethical approval was not required for the study involving human participants in accordance with the local legislation and institutional requirements.
Author contributions
PZ: conceptualization. HZ and FX: resources. KC and JM: supervision. HQ and YQ: validation. PZ and HQ: writing—original draft. KL and HG: writing—review and editing. All authors contributed to the article and approved the submitted version.
Funding
This work was supported by the National Natural Science Foundation of China (51908135 and 41971196) and the Natural Science Foundation of Guangdong Province (2021A1515012247).
Conflict of interest
The authors declare that the research was conducted in the absence of any commercial or financial relationships that could be construed as a potential conflict of interest.
Publisher’s note
All claims expressed in this article are solely those of the authors and do not necessarily represent those of their affiliated organizations, or those of the publisher, the editors and the reviewers. Any product that may be evaluated in this article, or claim that may be made by its manufacturer, is not guaranteed or endorsed by the publisher.
Footnotes
References
Barnes, R., Winters, M., Ste-Marie, N., McKay, H., and Ashe, M. C. (2016). Age and retirement status differences in associations between the built environment and active travel behaviour [article]. J. Transp. Health 3, 513–522. doi: 10.1016/j.jth.2016.03.003
Böcker, L., van Amen, P., and Helbich, M. (2017). Elderly travel frequencies and transport mode choices in greater Rotterdam, the Netherlands. Transportation 44, 831–852. doi: 10.1007/s11116-016-9680-z
Boruff, B. J., Nathan, A., and Nijenstein, S. (2012). Using GPS technology to (re)-examine operational definitions of 'neighbourhood' in place-based health research. Int. J. Health Geogr. 11:22. doi: 10.1186/1476-072x-11-22
Buitinck, L., Louppe, G., Blondel, M., Pedregosa, F., Mueller, A., Grisel, O., et al. (2013). API design for machine learning software: experiences from the scikit-learn project. Arxiv
Cerin, E., Nathan, A., van Cauwenberg, J., Barnett, D. W., and Barnett, A. (2017). Council Environm Phys a. the neighbourhood physical environment and active travel in older adults: a systematic review and meta-analysis. Int. J. Behav. Nutr. Phys. Act. 14:23. doi: 10.1186/s12966-017-0471-5
Chen, W., Cheng, L., Chen, X., Chen, J., and Cao, M. (2021). Measuring accessibility to health care services for older bus passengers: a finer spatial resolution. J. Transp. Geogr. 93:103068. doi: 10.1016/j.jtrangeo.2021.103068
Cheng, L., Chen, X., De Vos, J., Lai, X., and Witlox, F. (2019). Applying a random forest method approach to model travel mode choice behavior. Travel Behav. Soc. 14, 1–10. doi: 10.1016/j.tbs.2018.09.002
Cheng, L., De Vos, J., Zhao, P., Yang, M., and Witlox, F. (2020). Examining non-linear built environment effects on elderly’s walking: a random forest approach. Transp. Res. Part D: Transp. Environ. 88:102552. doi: 10.1016/j.trd.2020.102552
Cheng, L., Shi, K., Vos, J. D., Cao, M., and Witlox, F. (2021). Examining the spatially heterogeneous effects of the built environment on walking among older adults. Transp. Policy 100, 21–30. doi: 10.1016/j.tranpol.2020.10.004
Claesen, M., and Moor, B. D. (2015). Hyperparameter search in machine. Learning. doi: 10.48550/arXiv.1502.02127
Curl, A., and Mason, P. (2019). Neighbourhood perceptions and older adults’ wellbeing: does walking explain the relationship in deprived urban communities? Transp. Res. A Policy Pract. 123, 119–129. doi: 10.1016/j.tra.2018.11.008
Ding, C., Cao, X., and Liu, C. (2019). How does the station-area built environment influence Metrorail ridership? Using gradient boosting decision trees to identify non-linear thresholds. J. Transp. Geogr. 77, 70–78. doi: 10.1016/j.jtrangeo.2019.04.011
Etman, A., Kamphuis, C. B. M., Prins, R. G., Burdorf, A., Pierik, F. H., and van Lenthe, F. J. (2014). Characteristics of residential areas and transportational walking among frail and non-frail Dutch elderly: does the size of the area matter? Int. J. Health Geogr. 13:7. doi: 10.1186/1476-072x-13-7
Ghani, F., Rachele, J. N., Loh, V. H. Y., Washington, S., and Turrell, G. (2018). Do differences in built environments explain age differences in transport walking across neighbourhoods? J. Transp. Health 9, 83–95. doi: 10.1016/j.jth.2018.03.010
Gim, T. H. T. (2013). The relationships between land use measures and travel behavior: a meta-analytic approach. Transp. Plan. Technol. 36, 413–434. doi: 10.1080/03081060.2013.818272
Helbich, M. (2019). Dynamic urban environmental exposures on depression and suicide (NEEDS) in the Netherlands: a protocol for a cross-sectional smartphone tracking study and a longitudinal population register study. BMJ Open 9:10. doi: 10.1136/bmjopen-2019-030075
Kang, Y. H., Zhang, F., Gao, S., Lin, H., and Liu, Y. (2020). A review of urban physical environment sensing using street view imagery in public health studies. Ann. GIS 26, 261–275. doi: 10.1080/19475683.2020.1791954
Lee, J. S. (2019). AUC4.5: AUC-based C4.5 decision tree algorithm for imbalanced data classification. IEEE Access 7, 106034–106042. doi: 10.1109/ACCESS.2019.2931865
Liu, J., Wang, B., and Xiao, L. (2021). Non-linear associations between built environment and active travel for working and shopping: an extreme gradient boosting approach. J. Transp. Geogr. 92:103034. doi: 10.1016/j.jtrangeo.2021.103034
Long, J, Shelhamer, E, and Darrell, T. (2015). “Fully convolutional networks for semantic segmentation.” in 2015 IEEE Conference on Computer Vision and Pattern Recognition (CVPR). pp. 3431–3440
Lu, Y., Sarkar, C., and Xiao, Y. (2018). The effect of street-level greenery on walking behavior: evidence from Hong Kong. Soc. Sci. Med. 208, 41–49. doi: 10.1016/j.socscimed.2018.05.022
Maisel, J. L. (2016). Impact of older adults’ neighborhood perceptions on walking behavior. J. Aging Phys. Act. 24, 247–255. doi: 10.1123/japa.2014-0278
Mendes de Leon, C. F., Cagney, K. A., Bienias, J. L., Barnes, L. L., Skarupski, K. A., Scherr, P. A., et al. (2009). Neighborhood social cohesion and disorder in relation to walking in community-dwelling older adults: a multilevel analysis. J. Aging Health 21, 155–171. doi: 10.1177/0898264308328650
Moniruzzaman, M., and Páez, A. (2016). An investigation of the attributes of walkable environments from the perspective of seniors in Montreal. J. Transp. Geogr. 51, 85–96. doi: 10.1016/j.jtrangeo.2015.12.001
Neves, C. E. T., Da Silva, A. R., and Arruda, F. S. (2021). Exploring the link between built environment and walking choice in São Paulo city, Brazil. J. Transp. Geogr. 93:103064. doi: 10.1016/j.jtrangeo.2021.103064
Nguyen, L. M., and Mertens, L. (2021). Psychosocial and social environmental factors as moderators in the relation between the objective environment and older adults’ active transport. Int. J. Environ. Res. Public Health 18:2647. doi: 10.3390/ijerph18052647
Nordbakke, S., and Schwanen, T. (2014). Well-being and mobility: a theoretical framework and literature review focusing on older people. Mobilities 9, 104–129. doi: 10.1080/17450101.2013.784542
Pedregosa, F, Varoquaux, G, Gramfort, A, Michel, V, Thirion, B, Grisel, O, et al. (2011). Scikit-learn: machine learning in python. J. Mach. Learn. Res. 12, 2825–2830. doi: 10.5555/1953048.2078195
Procter-Gray, E., Leveille, S. G., Hannan, M. T., Cheng, J., Kane, K., and Li, W. (2015). Variations in community prevalence and determinants of recreational and utilitarian walking in older age. J. Aging Res. 2015:382703. doi: 10.1155/2015/382703
Sagi, O., and Rokach, L. (2020). Explainable decision forest: transforming a decision forest into an interpretable tree. Inf. Fusion 61, 124–138. doi: 10.1016/j.inffus.2020.03.013
Shigematsu, R., Sallis, J. F., Conway, T. L., Saelens, B. E., Frank, L. D., Cain, K. L., et al. (2009). Age differences in the relation of perceived neighborhood environment to walking. Med. Sci. Sports Exerc. 41, 314–321. doi: 10.1249/MSS.0b013e318185496c
Statistics NBo (2021). Seventh National Census. Available from: http://www.stats.gov.cn/tjsj/tjgb/rkpcgb/qgrkpcgb/ (Accessed January 20, 2022).
Tao, T., Wang, J., and Cao, X. (2020). Exploring the non-linear associations between spatial attributes and walking distance to transit. J. Transp. Geogr. 82:102560. doi: 10.1016/j.jtrangeo.2019.102560
Tin, Kam H. (1995). Random decision forests. Proceedings of 3rd International Conference on Document Analysis and Recognition. 278–282 vol. 1.
Tin, K. H. (1998). The random subspace method for constructing decision forests. IEEE Trans. Pattern Anal. Mach. Intell. 20, 832–844. doi: 10.1109/34.709601
Tucker, C. J. (1979). Red and photographic infrared linear combinations for monitoring vegetation. Remote Sens. Environ. 8, 127–150. doi: 10.1016/0034-4257(79)90013-0
Van Cauwenberg, J., De Bourdeaudhuij, I., De Meester, F., Van Dyck, D., Salmon, J., Clarys, P., et al. (2011). Relationship between the physical environment and physical activity in older adults: a systematic review. Health Place 17, 458–469. doi: 10.1016/j.healthplace.2010.11.010
Van Holle, V., Van Cauwenberg, J., Gheysen, F., Van Dyck, D., Deforche, B., Van de Weghe, N., et al. (2016). The association between Belgian older adults’ physical functioning and physical activity: what is the moderating role of the physical environment? PLoS One 11:e0148398. doi: 10.1371/journal.pone.0148398
Wang, K., and Ozbilen, B. (2020). Synergistic and threshold effects of telework and residential location choice on travel time allocation. Sustain. Cities Soc. 63:102468. doi: 10.1016/j.scs.2020.102468
Wu, J., Zhao, C., Li, C., Wang, T., Wang, L., and Zhang, Y. (2021). Non-linear relationships between the built environment and walking frequency among older adults in Zhongshan, China [original research]. Front. Public Health 9:686144. doi: 10.3389/fpubh.2021.686144
Yang, L., Ao, Y., Ke, J., Lu, Y., and Liang, Y. (2021). To walk or not to walk? Examining non-linear effects of streetscape greenery on walking propensity of older adults. J. Transp. Geogr. 94:103099. doi: 10.1016/j.jtrangeo.2021.103099
Yang, Y. Y., He, D. S., Gou, Z. H., Wang, R. Y., Liu, Y., and Lu, Y. (2019). Association between street greenery and walking behavior in older adults in Hong Kong. Sustain. Cities Soc. 51:8. doi: 10.1016/j.scs.2019.101747
Yang, L., Liang, Y., He, B., Lu, Y., and Gou, Z. (2022a). COVID-19 effects on property markets: the pandemic decreases the implicit price of metro accessibility. Tunn. Undergr. Space Technol. 125:104528. doi: 10.1016/j.tust.2022.104528
Yang, L., Liang, Y., He, B., Yang, H., and Lin, D. (2023a). COVID-19 moderates the association between to-metro and by-metro accessibility and house prices. Transp. Res. Part D: Transp. Environ. 114:103571. doi: 10.1016/j.trd.2022.103571
Yang, L., Tang, X., Yang, H., Meng, F., and Liu, J. (2022b). Using a system of equations to assess the determinants of the walking behavior of older adults. Trans. GIS 26, 1339–1354. doi: 10.1111/tgis.12916
Yang, L., Yu, B., Liang, Y., Lu, Y., and Li, W. (2023b). Time-varying and non-linear associations between metro ridership and the built environment. Tunn. Undergr. Space Technol. 132:104931. doi: 10.1016/j.tust.2022.104931
Yu, J., Yang, C., Zhao, X., Zhou, Z., Zhang, S., Zhai, D., et al. (2021). The associations of built environment with older people recreational walking and physical activity in a Chinese small-Scale City of Yiwu. Int. J. Environ. Res. Public Health 18:2699. doi: 10.3390/ijerph18052699
Zang, P., Liu, X. H., Zhao, Y. B., Guo, H. X., Lu, Y., and CQL, X. (2020). Eye-level street greenery and walking behaviors of older adults. Int. J. Environ. Res. Public Health 17:6130. doi: 10.3390/ijerph17176130
Zang, P., Qiu, H., Xian, F., Yang, L., Qiu, Y., and Guo, H. (2022). Nonlinear effects of the built environment on light physical activity among older adults: the case of Lanzhou, China. Int. J. Environ. Res. Public Health 19:8848. doi: 10.3390/ijerph19148848
Zang, P., Qiu, H., Xian, F., Zhou, X., Ma, S., and Zhao, Y. (2021). Research on the difference between recreational walking and transport walking among the elderly in mega cities with different density zones: the case of Guangzhou City. Front. Public Health 9:775103. doi: 10.3389/fpubh.2021.775103
Keywords: green visibility, built environment, walking, random forest, older people
Citation: Zang P, Qiu H, Zhang H, Chen K, Xian F, Mi J, Guo H, Qiu Y and Liao K (2023) The built environment’s nonlinear effects on the elderly’s propensity to walk. Front. Ecol. Evol. 11:1103140. doi: 10.3389/fevo.2023.1103140
Edited by:
Yibin Ao, Chengdu University of Technology, ChinaReviewed by:
Timothy Beatley, University of Virginia, United StatesPinyang Luo, Southwest Jiaotong University, China
Hao Zhu, Chengdu University of Technology, China
Copyright © 2023 Zang, Qiu, Zhang, Chen, Xian, Mi, Guo, Qiu and Liao. This is an open-access article distributed under the terms of the Creative Commons Attribution License (CC BY). The use, distribution or reproduction in other forums is permitted, provided the original author(s) and the copyright owner(s) are credited and that the original publication in this journal is cited, in accordance with accepted academic practice. No use, distribution or reproduction is permitted which does not comply with these terms.
*Correspondence: Kaihuai Liao, ✉ a2FpaHVhaTEyMUAxMjYuY29t
†These authors have contributed equally to this work and share first authorship