 Paula Plaza
 Robin Cristofari
 Nicolas Gouin3,5
 Mauricio Soto-Gamboa
 Guillermo Luna-Jorquera
- 1Center for Ecology and Sustainable Management of Oceanic Island (ESMOI), Departamento de Biología Marina, Facultad de Ciencias del Mar, Universidad Católica del Norte, Coquimbo, Chile
- 2Doctorado en Biología y Ecología Aplicada, Universidad Católica del Norte, Coquimbo, Chile
- 3Centro de Estudios Avanzados en Zonas Áridas (CEAZA), La Serena, Chile
- 4Department of Biology, University of Turku, Turku, Finland
- 5Instituto de Investigación Multidisciplinar en Ciencia y Tecnología, Universidad de La Serena, La Serena, Chile
- 6Instituto de Ciencias Ambientales y Evolutivas, Facultad de Ciencias, Universidad Austral de Chile, Valdivia, Chile
Speciation is thought to depend on general ecological segregation rather than on strict allopatry in species with planetary-scale foraging ranges, such as Pterodroma petrels. Separation in both breeding islands and foraging grounds are generally considered to be the conditions for prezygotic isolation. However, it is unclear how both can be maintained in a context of ongoing distributional range shifts due to global change, with range contractions and expansions caused by changing land use in breeding territories and oceanographic conditions impacting productivity areas. In this context, we expect that wherever the fragile balance of allopatric segregation breaks down, gene flow may be re-established across the borders of what is currently considered separated species. In these “melting pot” areas, fine-scale ecological differentiation is likely the only force opposing panmixia in otherwise highly similar organisms. In this study, we focus on six Polynesian Pterodroma species currently found on Motu Nui, a protected islet offshore of Rapa Nui (Easter Island), four of which have likely extended their breeding range to that island recently. To understand the fine-scale interaction between these closely-related species in their new contact zone, we used an integrative approach combining ecological and genetic methods, including morphometric, bioacoustics, stable isotope niche reconstruction, breeding site characterisation, phenology traits, and both nuclear and mitochondrial DNA markers. We found that significant amounts of gene flow occur across what is currently considered species boundaries, sometimes questioning the relevance of the accepted species classification. Interestingly, our results indicate that multivariate ecological distance between individuals in a group of closely related species (P. alba, P. atrata, P. heraldica, and P. neglecta) is a relevant predictor of gene flow intensity, while more distant species such as P. ultima and P. nigripennis seem to maintain reproductive isolation. Thus, the case of Pterodroma petrels supports the idea that incomplete allopatric speciation processes may be halted or even reversed on a secondary contact zone. Beyond their direct taxonomical relevance, our results underline the importance of considering fine ecological structures for biodiversity mapping and conservation policies.
Introduction
Seabirds live in highly dynamic environments, with decoupled breeding and foraging areas (Cristofari et al., 2018) and complex migratory patterns closely tied to atmospheric and oceanographic variables (Croxall et al., 2005; Weimerskirch et al., 2012; Bon et al., 2015). The complexity of their evolutionary and biogeographic patterns has been the subject of several studies (reviewed in Friesen et al., 2007a and Friesen, 2015). In seabirds, species are classically defined after Mayr’s biological species concept (Mayr, 1996), and the apparition, maintenance or disparition of reproductive isolation between groups is, therefore, a central point of focus, in particular in Procellariiformes (Friesen et al., 2007b; Navarro et al., 2013) for which the continuous movement of speciation has led to a wide array of patterns, ranging from clearly isolated species to intricate species complexes and polymorphic species (Onley and Scofield, 2016; Harrison et al., 2021).
The Pterodroma (or “gadfly-petrel”) genus has a long history of classification and reclassification, with species made and unmade nearly every decade (Murphy and Pennoyer, 1952; Imber, 1985; Brooke and Rowe, 1996; Zino et al., 2008; Wood et al., 2016). Their taxonomy is based on jizz, subtle feather patterns, observed breeding distribution, and osteological features (Murphy and Pennoyer, 1952; Imber, 1985). However, reliable molecular data do not support the currently accepted taxonomy and should therefore be taken cautiously. For example, in recent cases, genetic evidence has supported the separation of gadfly petrels of very similar appearance or jizz into distinct monophyletic groups (Zino et al., 2008; Wood et al., 2016) - but the majority of Pterodroma species delineation still relies only on phenotypic or biogeographic characters. Of the 34 currently recognised species within the Pterodroma genus (BirdLife International, 2021), 32 breeds on islands, islets, and atolls of the tropical and subtropical belts (Onley and Scofield, 2016; BirdLife International, 2021). Many have been driven to local extinction on the larger islands during the historical period (Steadman, 1995) and are only now starting to recover. Although many of the mechanisms underlying these recent range expansions are poorly understood, it is clear that secondary range contacts occur more and more frequently and may result in hybridisation between previously isolated groups, as in the well-documented case of the Pterodroma petrels nesting on Round Island, Mauritius (Brown et al., 2010; Brown et al., 2011; Booth Jones et al., 2017), where the Trindade petrel Pterodroma arminjoniana has been shown to hybridise extensively with the Kermadec petrel P. neglecta and Herald petrel P. heraldica. The low level of morphological differentiation between some of the extant Pterodroma species, together with the ongoing secondary contacts and possible hybridisation processes, makes a full assessment of the current status of Pterodroma species an important task both for the conservation of these taxa and for understanding the effects of human impact and environmental change on seabird evolution and biodiversity.
While the Indian Ocean Round Island afforded the first evidence for Pterodroma hybrid swarms, the Polynesian region, with its high number of Pterodroma species often nesting in multispecific colonies, is a promising place for understanding the speciation and hybridisation processes at work. The present-day species composition and abundance in the Polynesian islands are the results of a complex history involving volcanic events (Duncan and McDougall, 1976), local extinction and eradication under direct human pressure starting as early as the late Holocene (Steadman, 2006), and ongoing oceanographic changes (Signorini et al., 2015). Indeed, human settlement in Polynesia brought with its seabird hunting, the introduction of alien competitor and predator species, and habitat loss, leading in time to the extinction and extirpation of several seabird species (Olson and James, 1982; Steadman, 1989; Dye and Steadman, 1990). Those that survived have seen their breeding range restricted to refugial areas (Brace et al., 2014), and many of them are currently considered threatened species (Steadman, 2006; Croxall et al., 2012; BirdLife International, 2021). As a consequence of niche reopening and climate change (Polovina et al., 2008; Signorini et al., 2015), some Pterodroma species have started to re-expand their Polynesian range, colonising or re-colonising uninhabited islands and islets (Dunlop and Wooller, 1986; Hutton and Priddel, 2002; Plaza et al., 2021).
This is particularly the case of Rapa Nui, the south-easternmost island of Polynesia (27°07’S- 109°22’W), where human pressure has been especially intense in the historical period (Steadman, 2006). Previous studies have shown that the assemblage of seabird species in the historical record differed widely from the currently known state composition: of the 14 currently registered species, only nine are found in the historical records, while five seem to be newcomers (Plaza et al., 2021). Six Pterodroma species are currently breeding on the island, or more precisely on a small islet known locally as Motu Nui (3.8 Ha) located a few cables South-West of the main island: the Phoenix petrel P. alba, the Henderson petrel P. atrata, the Herald petrel P. heraldica, the Kermadec petrel P. neglecta, the Black-winged petrel P. nigripennis, and Murphy’s petrel P. ultima. Of these, P. heraldica and P. neglecta, as well as three pairs of P. atrata, were already documented in the 1980s. P. alba started breeding on the islet in the late 1990s, P. ultima around 2010, and P. nigripennis in very recent years (Peter Harrison, pers. comm. and Plaza et al., 2021).
This newly-established co-occurrence of several closely related species with similar morphology on a single, tiny islet gives us a rare insight into the structure and mechanisms of a species complex. Rather than investigating the question of species delineation in itself (which would require a minimum sampling from the core of each species’ range rather than a study at the range margins), we explored here the fate of recently-diverged species when they are brought into secondary contact by large scale changes in distribution. A central hypothesis is that speciation in such species complexes is mainly driven by allopatry - but allopatry as it can be achieved in species like Pterodroma petrels, which combine tiny and well-defined breeding areas with planetary-scale foraging ranges. We expect that relatively minor changes in breeding distribution may partly break down the fragile balance of allopatric speciation and easily give rise to “melting-pot” areas where, locally, species boundaries may fade away rapidly under the stochastic mating behaviours of highly similar individuals. To gain a better picture of this process, we explored the relationships between the 6 Pterodroma species of Motu Nui using a wide range of approaches, including (i) morphology, (ii) stable-isotope-based niche analysis, (iii) nesting behaviour and phenology, (iv) bioacoustics, and (v) genetic (both nuclear and mitochondrial) markers. Based on these different sources of information, we revisited the current species delineation in the Rapa Nui Pterodroma petrels to understand the fine-scale phenomena that occur at the margin of broader speciation processes.
Methods
Ethical statement and permits
All fieldwork was conducted according to permits N° 5343/2016, delivered by “Servicio Agrícola y Ganadero” (SAG). The handling of birds was kept to the shortest possible time, and a hood was systematically used to reduce stress.
Sampling
The samples used in this study were collected during two field campaigns (austral summer: January 2015 and Austral winter: July 2015). Work was conducted on Motu Nui, a small islet located 1.3 km off the Rano Kao crater in Rapa Nui, Chile (27° 20’S, 109° 45’W). Detailed sample sizes are given in Supplementary Material Table S1 and Supplementary Materials Figure 1.
Species identification
Assigning an individual bird to a particular species in the Pterodroma genus is not a trivial achievement (Brooke and Rowe, 1996; Brown et al., 2010; Brown et al., 2011). As a prior for species assignment, we used the taxonomic classification proposed by Onley and Scofield (2016). The criteria for species identification relied mostly on jizz and plumage colouration, principally the colour of primary and secondary feathers and underpart and upperpart coverts (Plaza et al., 2021). Several individuals with unclear phenotype or lacking sufficient photographic material for posterior confirmation were classified as “unknown Pterodroma species”. However, as opposed to what is observed in the Round Island hybrid swarm (Brown et al., 2010), we did not observe any individual with a clear hybrid phenotype. We retained only those individuals that could reliably be assigned to one species (N=81). For each individual, we collected photographic documentation, and identification was confirmed independently based on this material by seabird identification expert Peter Harrison (see in particular Harrison et al., 2021 for the identification criteria used). These identifications are referred to here as a-priori assignments, as they do not rely on the objective measurements performed in this study but rather on overall appearance and expert knowledge.
Morphology
For all individuals, we measured eight morphological traits (Table 1). Since our primary interest is interspecific discrimination, morphometry was transformed into a set of allometric traits: all measures except for body mass were log-transformed and scaled by log-transformed body mass. Body mass itself was log-transformed only. We verified the homogeneity of variance in the transformed traits between species using Levene’s test, accounting for multiple testing through the Benjamini-Yekutieli (BY) procedure (Benjamini and Yekutieli, 2001). We first performed an analysis of variance (ANOVA) to detect differences in size between the six a-priori species, including molecular sex and its interaction with the species, as additional categories and assessed pairwise species effects using Tukey’s test of honest significant differences. Next, we performed a multivariate analysis of variance (MANOVA) on the log-transformed measurements scaled to log-transformed body mass, including a priori species and sex as predictor variables, to detect allometric differences between species. In all tests, we revised the residual distributions to validate the models.
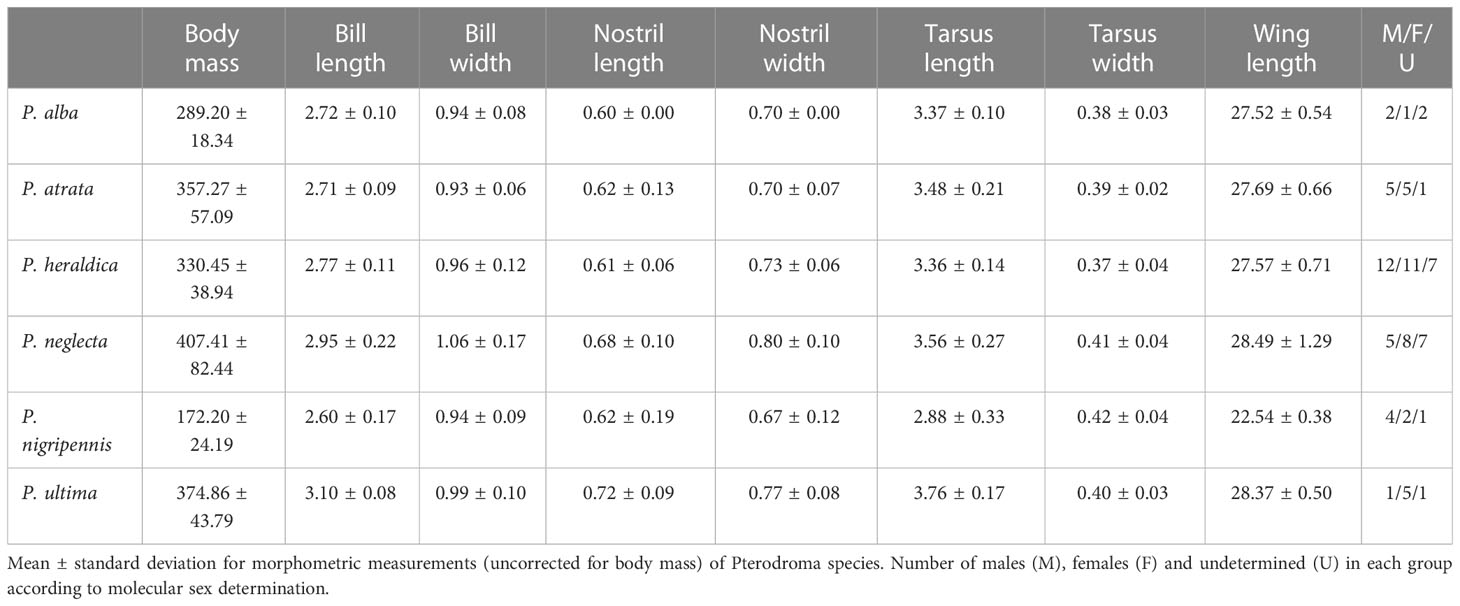
Table 1 Morphometry summary.
To get a clearer picture of species differences in multivariate morphospace, we performed a linear discriminant analysis (LDA) on the log-transformed measurements scaled to log-transformed body mass, together with the log-transformed body mass itself, using R v. 4.0.3 (R Core Team, 2020 - this version is used throughout) and R package MASS v. 7.3-53.1 (Venables and Ripley, 2002). We reduced the dimension to the first two axes of variance based on the high redundancy of morphometric variables (see Results) - while the choice of LDA (maximising separation between groups), as opposed to PCA (maximising total variance), was guided by the aim of this study. We computed the standard ellipse (SE) for each species in the plane defined by the first two discriminant functions using the Bayesian approach implemented in the R package SIBER v. 2.1.5 (Jackson et al., 2011). Note that although SIBER was initially designed to analyse isotopic data, our data’s multivariate normality respected all the SIBER model’s assumptions for SE estimation - and it offered a more robust approach to SE uncertainty with small sample sizes than analytical approaches. We used “uninformative” conjugate normal priors (µ=0, σ2 = 103) for the group means and Inverse-Wishart (2x2 scale matrix with 2 degrees of freedom) for the covariance matrix and ran two MCMC chains for 10,000,000 generations, with 1,000,000 generations burn-in and retaining every 100th sample. We computed the distribution of overlaps between SEs for each species pair as indicative of the objective morphometric similarity between species.
Isotopic niches
We used the ratio of nitrogen and carbon stable isotopes (δ15N and δ13C) as a proxy of trophic niche overlap between species. Analyses were conducted both with feathers and whole blood. Feathers are a slow-growing tissue, renewed only during the annual moult, and are expected to integrate stable isotope intake during their growth period, which mostly encompasses the non-breeding period. On the other hand, blood is a fast-turnover tissue that is expected to reflect stable isotope uptake in the weeks preceding the sampling (Quillfeldt et al., 2005; Cherel et al., 2008). Stable Isotope ratios were analysed as described in Zapata-Hernández et al. (2014): Briefly, samples were combusted in a continuous helium flow elemental analyser, and resulting gases were reduced and dried. Finally, the remaining N2 and CO2 gases were separated by gas chromatography and analysed by mass spectrometry (Delta Plus spectrometer, Thermo-Finnigan). We first checked the correlation between feather and blood isotopic ratios for individuals for which both samples were taken using ordinary least-square regression and f-test. We then compared δ13C and δ15N separately amongst species using ANOVA (treating feather and blood values separately). We included species, molecular sex (and their interaction), and collection season as categorical variables for feathers (all blood samples were collected in winter). Note that we could not obtain sufficient blood for isotopic analysis in P. nigripennis, so it was excluded from blood analyses. Further, we also compared the position of each species in the bivariate (C, N) plane using the Bayesian ellipse approach implemented in the SIBER package in R. Algorithm parameters were set as above.
Nest characteristics
In order to assess species-specific patterns in the spatial structure of nest distribution, we georeferenced all Pterodroma nests in both breeding seasons (austral winter or summer, i.e. June or January survey), and used K-means clustering based on pairwise Euclidean distances to define the optimal number of clusters in the nest distribution using the NbClust v. 3.0 package in R, computing all available indices and choosing based on consensus (Charrad et al., 2014). Finally, differences in species composition between clusters were investigated using the Cluster package v. 3.0.1 in R (Maechler et al., 2022). Then, to assess potential differences in nesting habitat between species, we used a nest classification scheme that considered both structure and materials (Supplementary Material Table S2). Six types of nests were observed: (i) exposed, i.e. laying directly on a flat, usually rock surface (ii) inside a rock crevice, (iii) protected by a rock (e.g. against a ledge), (iv) protected by vegetation, mostly long grass (typically grass of the species Paspalum forsterianum, DuBois et al., 2013), (v) protected by a combination of rock and grass, often against the edge of large rocks in the vegetation, and (vi) entirely underground burrow excavated in the dirt (see Plaza et al., 2021). Relative usage frequencies of each nest type by each species were used to calculate niche breadth using Levins’ standardised index (a value of 1 indicating generalist and 0 for complete specialisation). We also calculated niche overlap between all pairs of species Horn’s niche overlap index (with smaller values representing lower overlap). Both indexes (Levins and Horn) improved species’ niche measures and resource preferences (Krebs, 1998).
Acoustic analyses
In order to establish the in-flight vocal repertoires of each species, we recorded aerial calls during the evening hours as birds flew back to the colony. Calls were recorded using a TASCAM DR-07 MKII portable recorder (with a frequency range of 44-48,000 Hz) and a Sony ECM-672 microphone (frequency range of 50-16,000 Hz). Recordings were discarded when the vocalising individual could not be identified with high certainty or when calls had too much background noise. Calls were digitised with a sampling frequency of 24,000 Hz (16-bit resolution) using Raven Pro (Charif et al., 2010). In the spectrograms, we measured the first ten notes of calls based on two principal characters: 1) fundamental frequency or first harmonic and 2) entire note or bandwidth. Three frequency measures were included for each character: the low, high, and peak frequency (HZ). Temporal features were measured with note length (see Supplementary Materials Table S3 and Figure S2). Principal component analysis (PCA) was used to obtain a lower-dimensional representation of these bioacoustic variables using the dudi.pca implementation in R. We used PCA scores for linear Discriminant Analysis (LDA) to maximise group separation.
DNA isolation, amplification, and sequencing
We sampled blood from the brachial vein of breeding birds that we captured by hand directly in the nests. Blood samples were stored on FTA™ Classic Cards, and extracted using a standard NaCl protocol (Aljanabi and Martinez, 1997). We sequenced a 782-bp fragment of the mitochondrial Cytochrome-b gene (Cyt-b) using primers designed from Pterodroma sequences obtained in GenBank (P. nigripennis U74343.1, P. ultima HQ420379.1, and P. neglecta U74341.1): gadpe_1F: GTT CTA CTG GTT GGC TGC CTA C, gadpe_1R: ATG GCC CCA AAC CTT CGA AAR TC, and internal primer gadpe_C22: ATA CG ATA CCR AGA GGG TTG. PCR conditions consisted of 3 min initial denaturation at 95°C, followed by 35 cycles of 30-sec denaturation at 95 °C, 30-sec annealing at 58°C, and 1 min elongation at 72°C, followed by a final elongation step at 72° for 5 min. PCR product purification and bi-directional sequencing were performed by Macrogen (Seoul, South Korea) using the same PCR primers. We also used 45 primer pairs to amplify a panel of microsatellite loci: 9 designed explicitly for Pterodroma petrels (Brown and Jordan, 2009) and 36 universal primers for birds (Dawson et al., 2010). Each locus was tested for polymorphism and fluorescently-labeled using a forward primer modified with an M13 tail, as described in Schuelke (2000). We followed a touch-down PCR protocol, with an initial denaturation at 95°C for 1 min, followed by 27 “hot” cycles (94°C denaturation for 30 sec, 59°C annealing for 30 sec, and 72°C elongation for 30 sec), and 8 “cool” cycles (94°C denaturation for 30 sec, 53°C annealing for 30 sec, and 72°C elongation for 30 sec), and 7 min final elongation at 72°C. PCR products were checked on a 1% agarose gel with a ladder of 500 pb, and analysed on an ABI PRISM 3500 XL (Applied Biosystems) microcapillary electrophoresis analyser. Genotypes were scored using GeneMaker v1.85 (see Supplementary Material Table S4 for details).
mtDNA analyses
Sequences were processed, aligned, and trimmed using Geneious v. 2021.1 (© 2005-2021 Biomatters Ltd). We calculated haplotype (Nei and Tajima, 1981) and nucleotide (Nei and Li, 1979) diversity, as well as general statistics, using R packages ape v. 5.5 (Paradis and Schliep, 2019) and pegas v. 1.1 (Paradis et al., 2004; Paradis, 2010). In order to gain a clearer view of phylogenetic relationships in the context of Pterodroma diversity, we downloaded published sequences for 13 other Pterodroma species or subspecies (P. arminjoniana, P. deserta, P. feae, P. hasitata, P. incerta, P. macroptera macroptera, P. macroptera gouldi, P. madeira, P. magentae, P. mollis mollis, P. phaeopygia, P. sandwichensis, and P. solandri), previously published sequences for P. alba, P. heraldica, P. neglecta, P. nigripennis, and P. ultima, as well as an outgroup, Pelecanoides garnotii. We used all available sequences if less than six, and chose six random sequences if more, with a total of 183 sequences, including those in the present study. All Genbank accession numbers and references are provided in Supplementary Material Table S5. We then reconstructed the cytochrome-b gene tree using a Bayesian framework implemented in BEAST2 v. 2.6.4 (Bouckaert et al., 2014). Cyt-b sequences were partitioned into first and second codon positions on the one hand, and third codon positions on the other, specifying a separate (but identical) HKY substitution model for each partition, and estimating both the transition/transversion rate and the underlying nucleotide frequencies, with a gamma-distributed per-site mutation rate discretised into four classes. Considering we were working at an interspecific level, we set a Yule model as a prior on tree topology. MCMC was run for 10,000,000 generations, discarding the first 20% as burn-in and recording every 1,000th state, ensuring the collection of large effective sample sizes (ESS > 200 for all parameters) to estimate posterior parameter distributions. The reconstruction was repeated three times with identical parameterisation to assess convergence further. Although 15 individuals for which species could not be reliably assessed were removed from all other analyses, they were included here to completely inform the fine-scale tree topology (e.g., by providing intermediate sequence states). However, these sequences were never attributed to a particular species and remained in the tree as unspecified sequences.
Microsatellite analyses
We calculated expected and observed heterozygosity, and population-level summary statistics for each locus using the R packages adegenet v.2.1.3, pegas, and hierfstat v. 0.5-9. Pairwise Fst was calculated according to Weir and Cockerham (1984), and significance levels were assessed against 1,000 random permutations of individuals among the pairs and adjusted using the BY procedure. We performed admixture analysis using STRUCTURE 2.3.4 (Pritchard et al., 2000) without prior knowledge of species grouping. We used the admixture version of the model, assuming correlated allele frequencies. The MCMC was run with a burn-in of 10,000 steps, and 1,000,000 sampling steps, with many possible clusters (K) ranging from 1 to 10. Analyses were repeated ten times. We used Structure Harvester (Earl, 2012) and Evanno’s delta-K (Evanno et al., 2005) for model choice and summarised the results across the ten independent runs using CLUMPP v. 1.1.2 (Jakobsson and Rosenberg, 2007). In parallel, we used the discriminant analysis of principal components approach (DAPC, Jombart et al., 2010, which does not rely on the Hardy-Weinberg equilibrium assumption) using the adegenet R package (Jombart, 2008). We retained the first 25 principal components of the eigen-decomposed microsatellite variance-covariance matrix, effectively retaining > 99% of the total variance for the linear discriminant analysis. Linear discriminant functions were computed both (1) between K-means-clustered groups (with many groups ranging from 2 to 6), mirroring the Structure approach, and (2) using a priori species as a classification factor. Finally, we used the snapclust algorithm (Beugin et al., 2018) as a third, independent control, using AIC model choice to identify the optimal number of clusters.
Correspondence between genetic and ecological distance
We tested the association between genetic and ecological distances for all quantifiable axes of variation at the interindividual and interspecific levels. We used Procrust tests implemented in the vegan v. 2.5-7 package (Oksanen et al., 2020) to correlate distance matrices. At the individual level, we used (a) genetic distance based on microsatellites, (b) genetic distance based on mtDNA Cyt-b sequences, (c) distance in allometric morphospace, (d) distance in feather-based isotopic niche, and (e) distance in the blood-based isotopic niche. At the species level, we used (a) Fst based on microsatellite data, (b) standard ellipse overlap in principal LDA components in allometric morphospace, (c) standard ellipse overlap in feather isotopic niche, (d) standard ellipse overlap in blood isotopic niche, and (e) standard ellipse overlap in principal LDA components in acoustic space. We did not include mtDNA sequences at the species level since the haploid, non-recombining nature of these markers makes them less suitable than nuclear markers when comparing groups (Teske et al., 2018), and we considered microsatellite markers, in that case, adequately captured genetic distance. Acoustic recordings were not associated with particular individuals and could only be used at the interspecific level. Finally, for each pair of species, we scored the number of dimensions along which they could be distinguished, considering (a) phenology, (b) nest choice, (c) isotopic niche, (d) morphology, (d) acoustics, and (e) Cyt-b haplotype. This count was compared to pairwise microsatellite-based Fst between the two species. The correlation between ranks in the differentiation order and Fst values was assessed using Spearman’s rank test.
Results
Out of 96 birds captured for this study, 81 could be reliably assigned to a particular species based on phenotype, including both males and females in roughly equal proportion for each species. The most represented species were P. heraldica, and P. neglecta (30 and 20 individuals), and the least represented was P. alba (5 individuals) - see Supplementary Material Table S1 for per-species sample sizes.
Interspecific differences in morphology
Based on Levene’s test, log-transformed morphological measurements did not significantly deviate from the homoscedastic hypothesis (all p-values > 0.05). Log-transformed body mass differed significantly between species, but not between sexes, even taking into consideration the interaction of species and sex (ANOVA Dfs, F-values and p-values respectively: [5, 28.5, < 0.001], [1, 0.104, 0.748] and [5, 0.651, 0.662] - see Table 1). The differences between P. nigripennis and the other species accounted for most of this observation, as P. nigripennis was, by far, the smallest species (Tukey’s post-hoc test, all pairwise comparisons involving P. nigripennis p-values < 0.001). A significant ordering in body mass could be observed with P. neglecta > P. heraldica > P. nigripennis (all p-values < 0.05). Other pairwise tests were not significant (see Supplementary Information Table S6).
The MANOVA analysis showed that species determined a priori was a significant determinant of log-transformed morphological measurements (p-value < 0.001), indicating allometric differences between species (see Supplementary Information Table S6). Maximising variance between a priori-determined species in multivariate space through linear discriminant analysis yielded similar observations (Figure 1). The first two discriminant functions accounted for 88.5% of the total between-group variance (75.9% and 12.6%, respectively). The first function’s main loading was wing length (94.2%), and discriminated mainly P. nigripennis from the five other species. The second function’s main loadings were wing length and bill length (39.1% and 54.4%, respectively), allowing most to separate P. ultima from the five other species. The third function covaried with bill length, tarsus width, and wing length (56.0%, 20.4%, and 17.2%, respectively) but accounted for only 7.2% of the total variance. Standard ellipses fitted to species projections in LDA space were consistent with the other results (Supplementary Figure S3): P. nigripennis had no overlap with any other species, and the proportion of overlap was highest between P. alba, P. atrata, and P. heraldica. P. ultima showed low overlap with P. alba, P. atrata, and P. heraldica, but higher with P. neglecta.
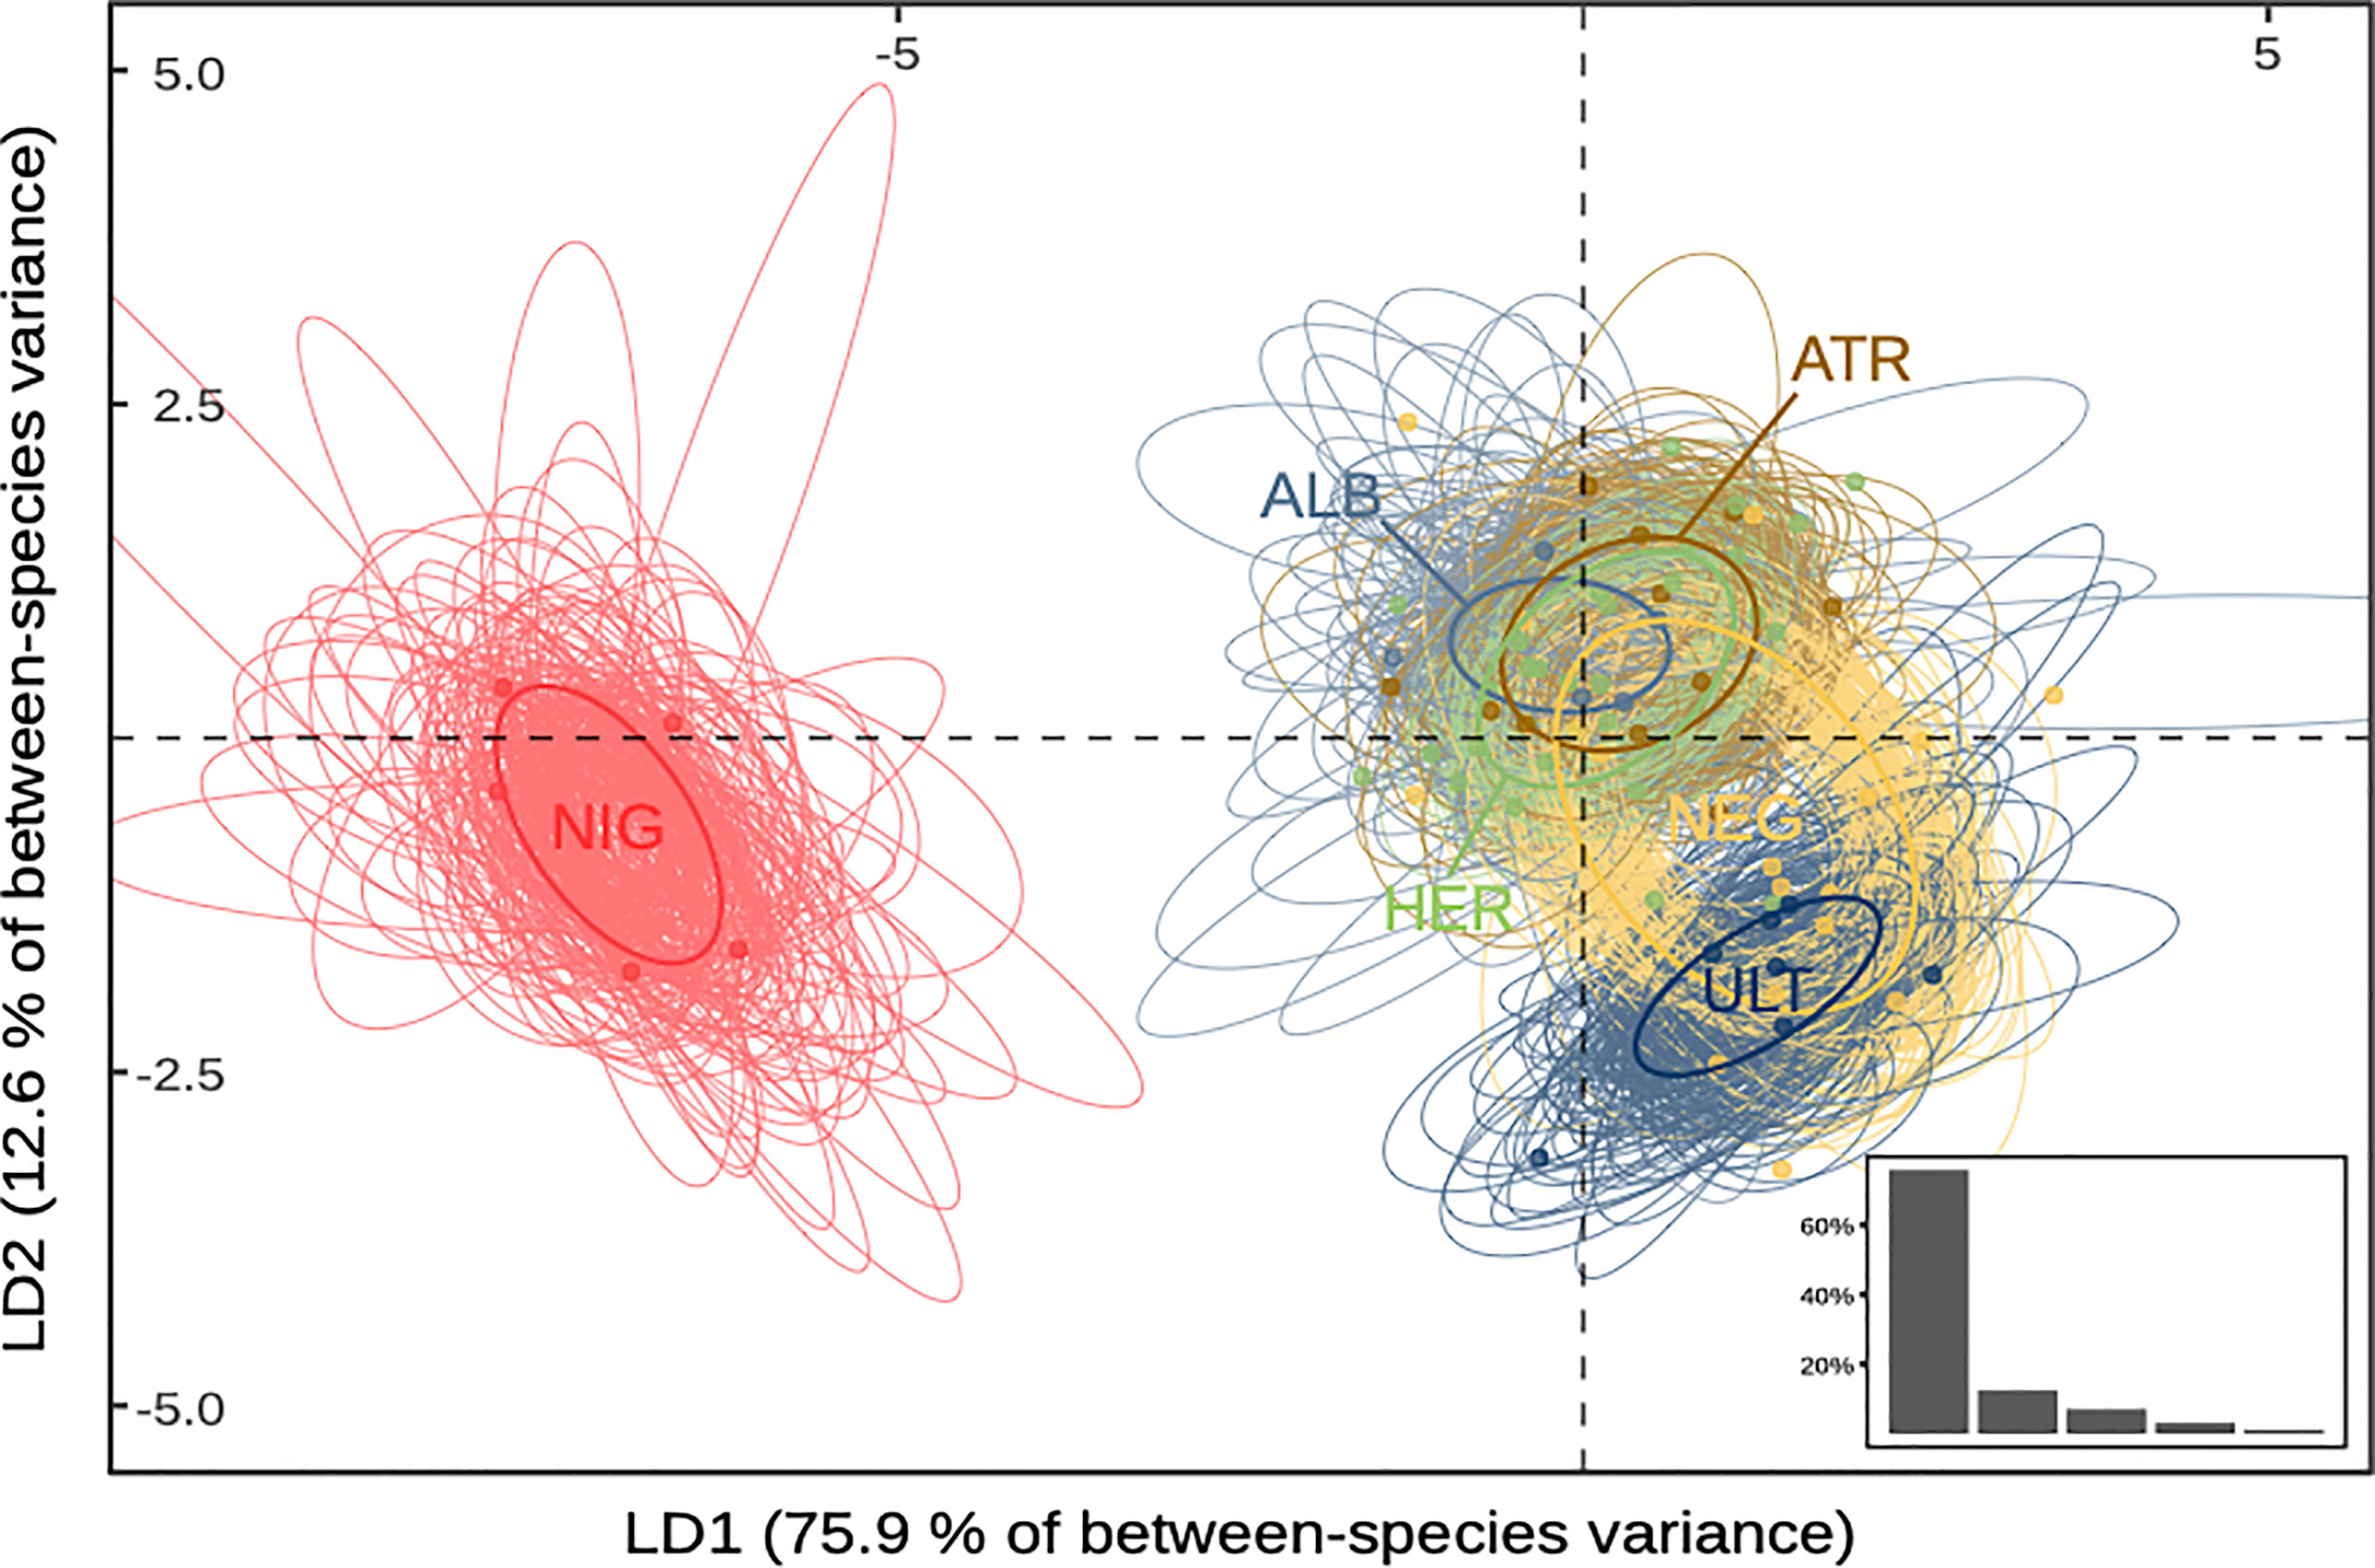
Figure 1 Species projections in reduced morphospace. Standard ellipses are computed on the first two axes of an LDA (88.5% of total variance). Bottom-right insert: Proportion of inter-group variance explained by each discriminant function. ALB, P. alba; ATR, P. atrata; HER, P. heraldica; NEG, P. neglecta; NIG, P. nigripennis; ULT, P. ultima.
Overall, we found that P. nigripennis was separated from all other species in the morphospace, primarily due to its smaller size and relatively longer wings. Based on bill length, P. ultima was distinguishable from all other species, except P. neglecta. The other species could be differentiated pairwise but presented a considerable overlap in their trait size distribution when considered collectively. P. heraldica, P. alba, and P. atrata were nearly indistinguishable based on morphometrics alone.
Stable isotope analysis
Stable isotope ratios (δ15N and δ13C) in blood and feathers were loosely correlated when all species were taken together (but significantly with f-test for linear regression at the α = 0.05 level: R2 = 0.10, p = 0.022 for δ15N and R2 = 0.26, p < 0.001 for δ13C - see Supplementary Figure S4). Interspecific differences mainly drove the stronger correlation for δ13C; consistently with this, analyses of variance revealed that species was the best explanatory variable for δ13C, considered a proxy for spatial distribution, and δ15N, a proxy for trophic level, both in blood and in feathers. Within species, no correlation between blood and feather values was observed for either element, and sex differences were never significant. Carbon signature segregated clearly P. ultima from all other species when analysed in feathers (P. ultima has a significantly lower δ13C); when analysed in blood, P. ultima had a significantly lower δ13C than all other species except for P. nigripennis, and a significantly ranking could be observed, with P. ultima < P. neglecta < P. heraldica (Figure 2). Note that in the Southern Pacific, lower δ13C values generally correspond to higher latitudes (Magozzi et al., 2017). Nitrogen signature segregated P. alba and P. heraldica from all other assessed species when measured in blood, and P. atrata had a lower signature than all other species except P. ultima. The results were similar when measured in feathers, although contrasts were less clear (P. heraldica had a higher ratio than all species except for P. alba, and the lowest-ratio species, P. nigripennis, had a significantly lower ratio than the two highest-ratio species P. alba and P. heraldica). The standard ellipse approach (Supplementary Material Figure S5) showed that isotopic niche width (as approximated by standard ellipse area) was usually higher in feathers than in blood - which may reflect wider-ranging and less specific foraging in the non-breeding period. As expected, the overlap was lowest between P. ultima and all other species.
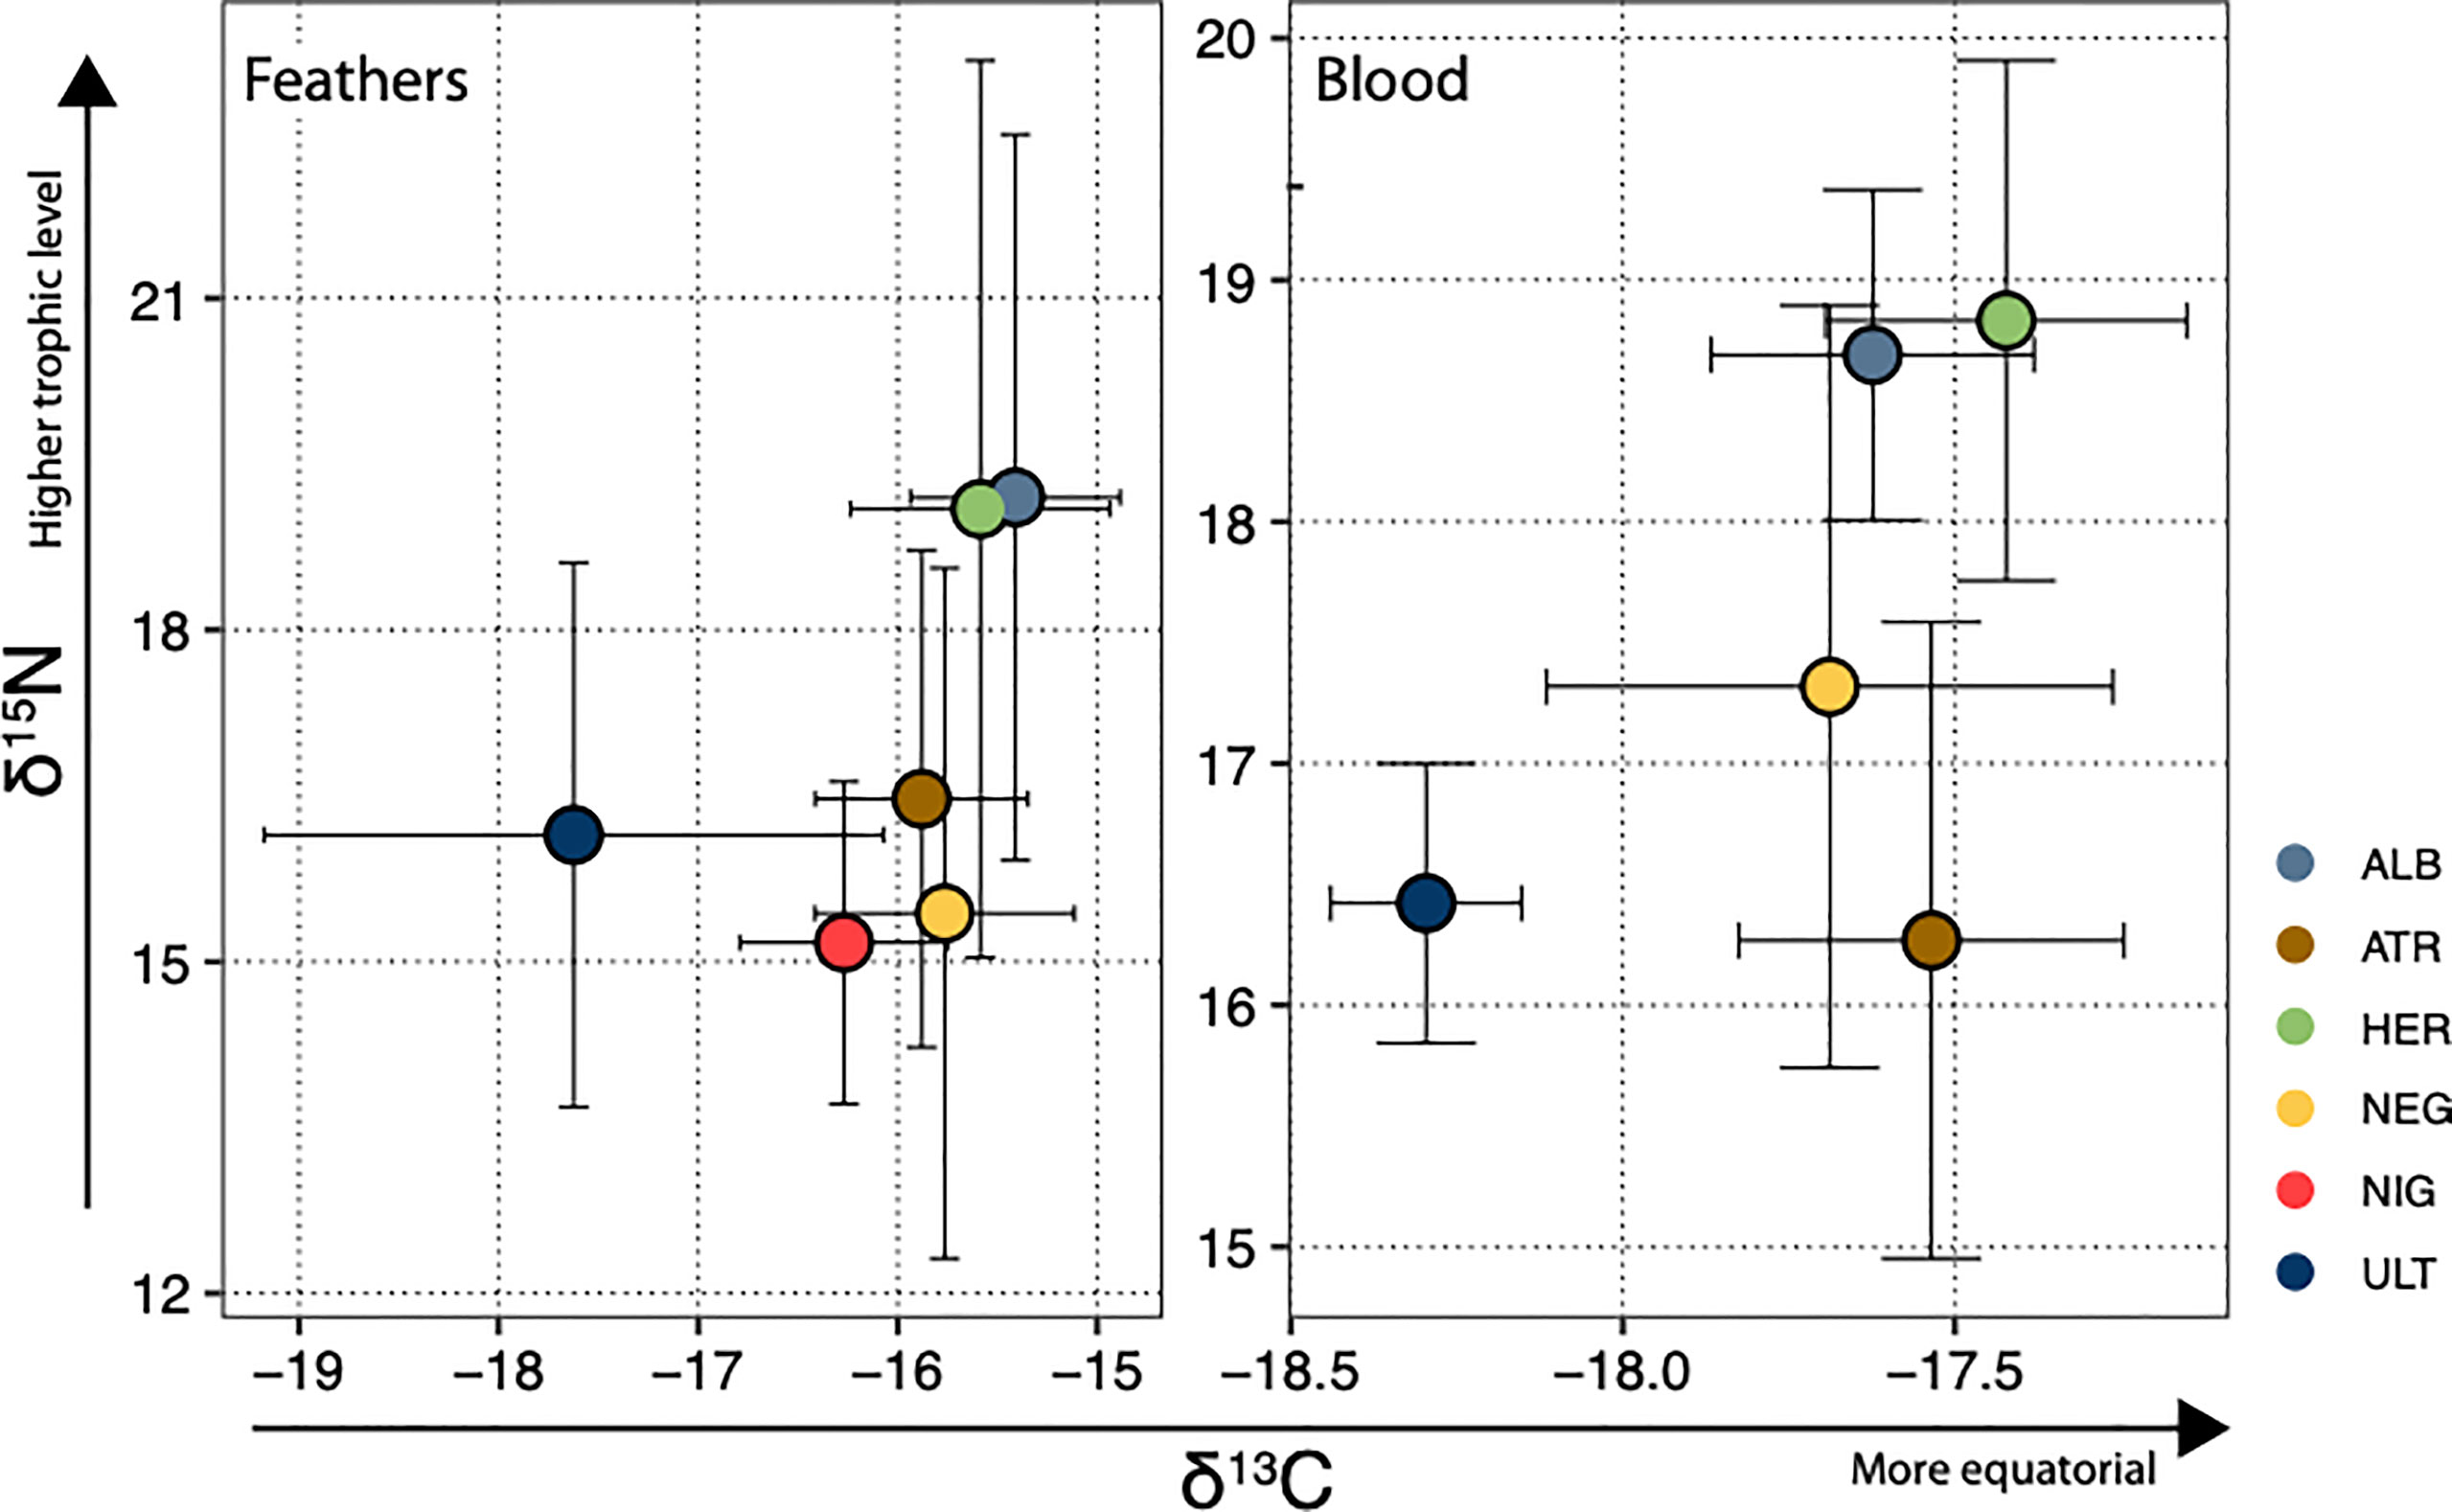
Figure 2 Species positions in δ13C, δ15N isoscape. Each species is represented by its mean and standard deviation in both dimensions. In the Pacific, δ13C values closer to zero generally indicate foraging areas closer to the equator, while increasing δ15N ratios are taken to reflect higher trophic position. ALB, P. alba; ATR, P. atrata; HER, P. heraldica; NEG, P. neglecta; NIG, P. nigripennis; ULT, P. ultima.
Phenology and nesting distribution
Pterodroma species on Motu Nui are partly segregated along the year: P. nigripennis was only found in summer (January), while P. alba, P. heraldica, and P. ultima were only observed in winter (June). P. atrata and P. neglecta were encountered throughout the year. Nests appeared grouped into 3 clusters of multispecific composition (Supplementary Material Figure S1), both in summer and in winter: in other words, Pterodroma petrels tended to cluster together with other Pterodroma petrels regardless of their species, as is usually observed for this group throughout their Pacific range (P. Harrison, pers. obs.). Each species preferentially used a different microhabitat in summer to build the nests (chi-square test, p-value = 0.001). P. nigripennis, in particular, was highly specialised in burrow nests, in keeping with observations throughout its range. Similarly, P. neglecta preferred rock crevices, as observed in several localities throughout its range (P. Harrison, pers. obs.). There was little overlap with other species (Tables 2, 3). In winter, no significant differences were found in substrate nest preference between species (p-value = 0.63). Nest use was less specific, and species overlapped broadly (Tables 2, 3). Rock-crevice and rock-protected nests were most frequent, and exposed nests were less used.
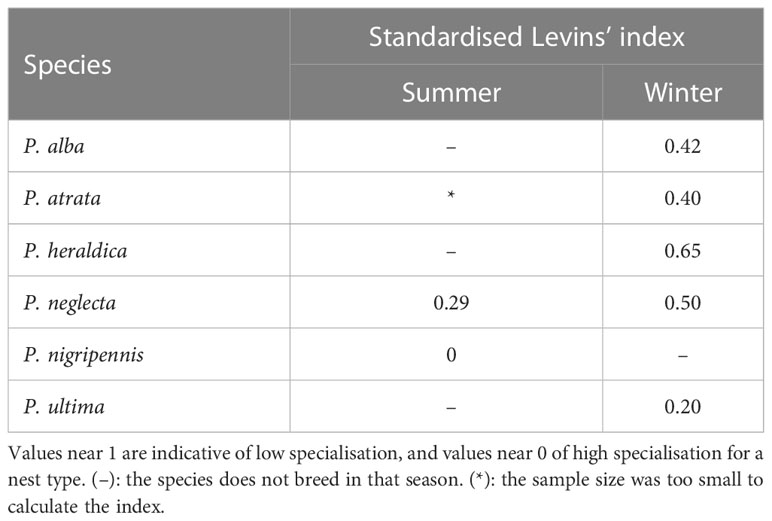
Table 2 Levins’ specialisation index for nest use in Pterodroma species.
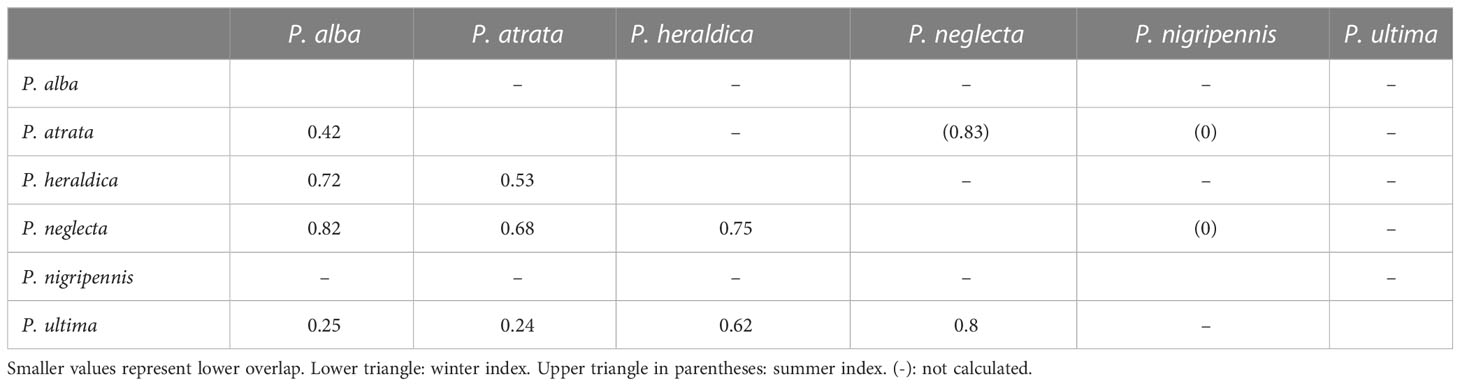
Table 3 Pairwise Horn index for overlap in nest type use in Pterodroma species.
Acoustic analyses
Aerial calls were recorded around sunset and tended to fade as night passed. P. ultima was never engaged in vocal activity during our fieldwork, and could not be recorded for this study. We recorded a succession of chattering “ti-ti-ti” calls for P. alba, P. atrata, P. heraldica, and P. nigripennis (see Supplementary Material Figure S2), with syllable duration that ranged from 0.03 s in P. atrata to 0.11 s in P. nigripennis (Supplementary Material Table S3). The highest fundamental frequency was observed in P. nigripennis at 2178 kHz (Supplementary Material Table S3). These four species seemed to diverge most on syllable duration and frequency of harmonics. On the other hand, P. neglecta used a “kuk-u-er” or “moaning call” type of call (Supplementary Material Figure S2). This call was characterised by a low number of elements, a long syllable duration (0.72 s), and a maximum fundamental frequency of 1.270 kHz (Supplementary Material Table S3), rising abruptly in pitch at the end of the call. In a linear discriminant analysis based on species assignment, P. neglecta and P. nigripennis were the most clearly separated groups on the first two discriminant functions (Figure 3).
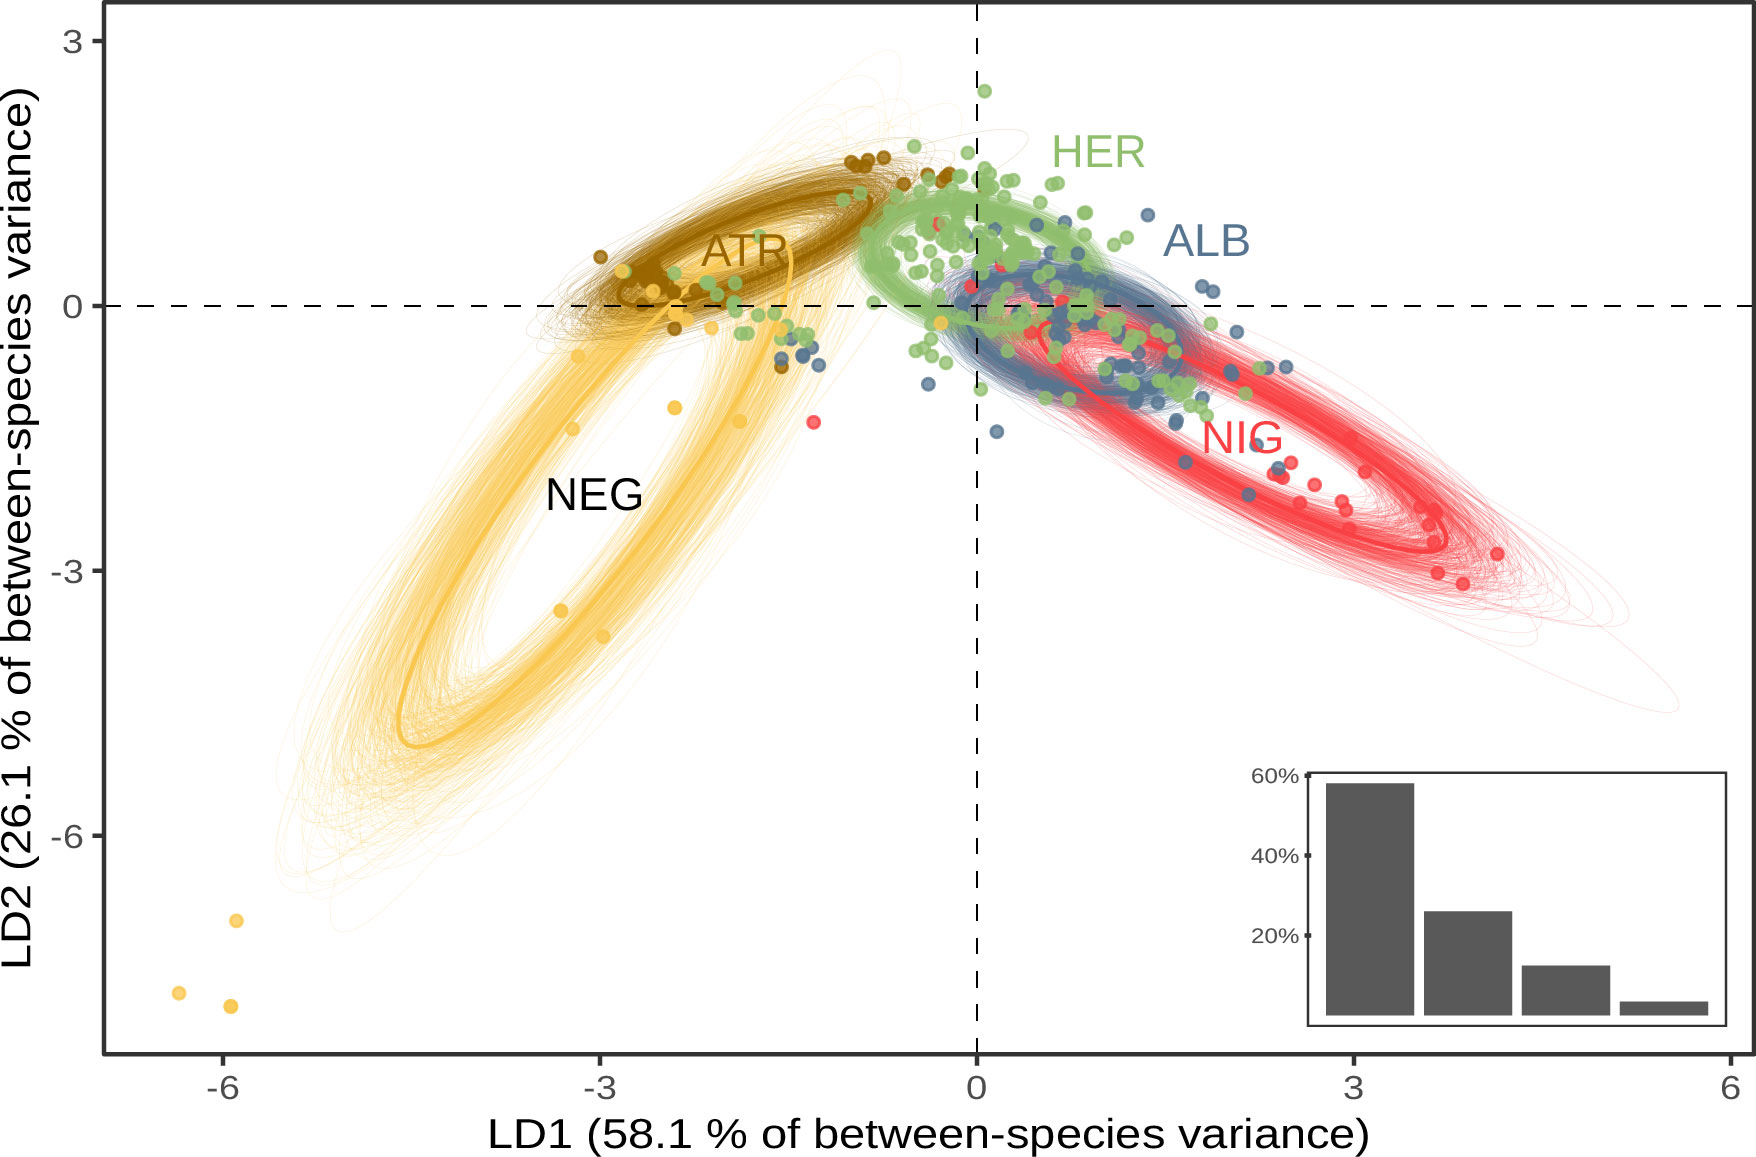
Figure 3 Linear discriminant analysis of aerial call characteristics. Standard ellipses are computed on the first two axes of an LDA (84.2% of total variance). Bottom-right insert: Proportion of inter-group variance explained by each discriminant function. ATR, P. atrata; HER, P. heraldica; NEG, P. neglecta; NIG, P. nigripennis; ALB, P. alba.
mtDNA analysis
We sequenced a total of 84 Cyt-b sequences, 782 bp-long, of which 67 were assigned to one of the six a priori species in the study, and 17 originated from individuals whose species could not be reliably determined. We found 17 haplotypes: P. nigripennis and P. ultima had only private haplotypes; P. atrata, P. alba, P. heraldica, and P. neglecta were mostly mixed (Supplementary Material Table S7). Across all sequences, haplotype and nucleotide diversity were high (H = 0.90 ± 0.015 and π = 0.019 ± 0.0093, respectively). Both parameters were of the same order of magnitude for all species, except for P. nigripennis (only one haplotype, see Supplementary Material Table S7). We found 77 variable sites: 29 segregates for P. nigripennis and 12 for P. ultima. None segregated in the other species, although P. atrata and P. neglecta had one private mutation (see Supplementary Material Table S7). Our cytochrome-b phylogenetic tree reconstruction, which included previously published data, supported the monophyly of most known Pterodroma species (Figure 4): P. arminjoniana, P. hasitata, P. incerta, P. macroptera macroptera, P. macroptera gouldi, P. madeira, P. magentae, P. mollis mollis, and P. solandri were all inferred to be monophyletic; and P. deserta, P. feae, P. phaeopygia, and P. sandwichensis mostly were, despite minor incongruencies. Consistently with other analyses, P. ultima and P. nigripennis were both inferred to be monophyletic too, and sequences produced in other studies clustered unambiguously with our sequences for both species. Additionally, both P. nigripennis (Figure 4, taxon 5) and P. ultima (Figure 4, taxon 4) were separated from other species in our study by several intermediate taxa. P. atrata (Figure 4, taxon 3) tended to group separately from P. heraldica, P. neglecta, and P. alba; however, that taxon also included 2 P. heraldica samples besides 9 of our 11 P. atrata samples; and 2 P. atrata samples grouped elsewhere in the tree. Finally, all P. alba, P. heraldica, and P. neglecta samples (both in our study and published sequences) grouped in several paraphyletic taxa (Figure 4, taxa 1 and 2), forming one larger monophyletic clade that also included all P. atrata samples. This paraphyletic group was composed of two sub-groups: the first contained all P. alba samples, together with mostly P. heraldica and P. neglecta, and the second was composed of P. heraldica and P. neglecta. No other systematic pattern emerged in the relationships of these species, as established through Cyt-b sequences. Interestingly, we also underline the fact that the Trindade petrel P. arminjoniana, which is central in the Round Island hybrid swarm where it is known to hybridise with P. neglecta and P. heraldica, is the closest taxon to P. neglecta, P. heraldica, P. alba and P. atrata in our mtDNA tree.
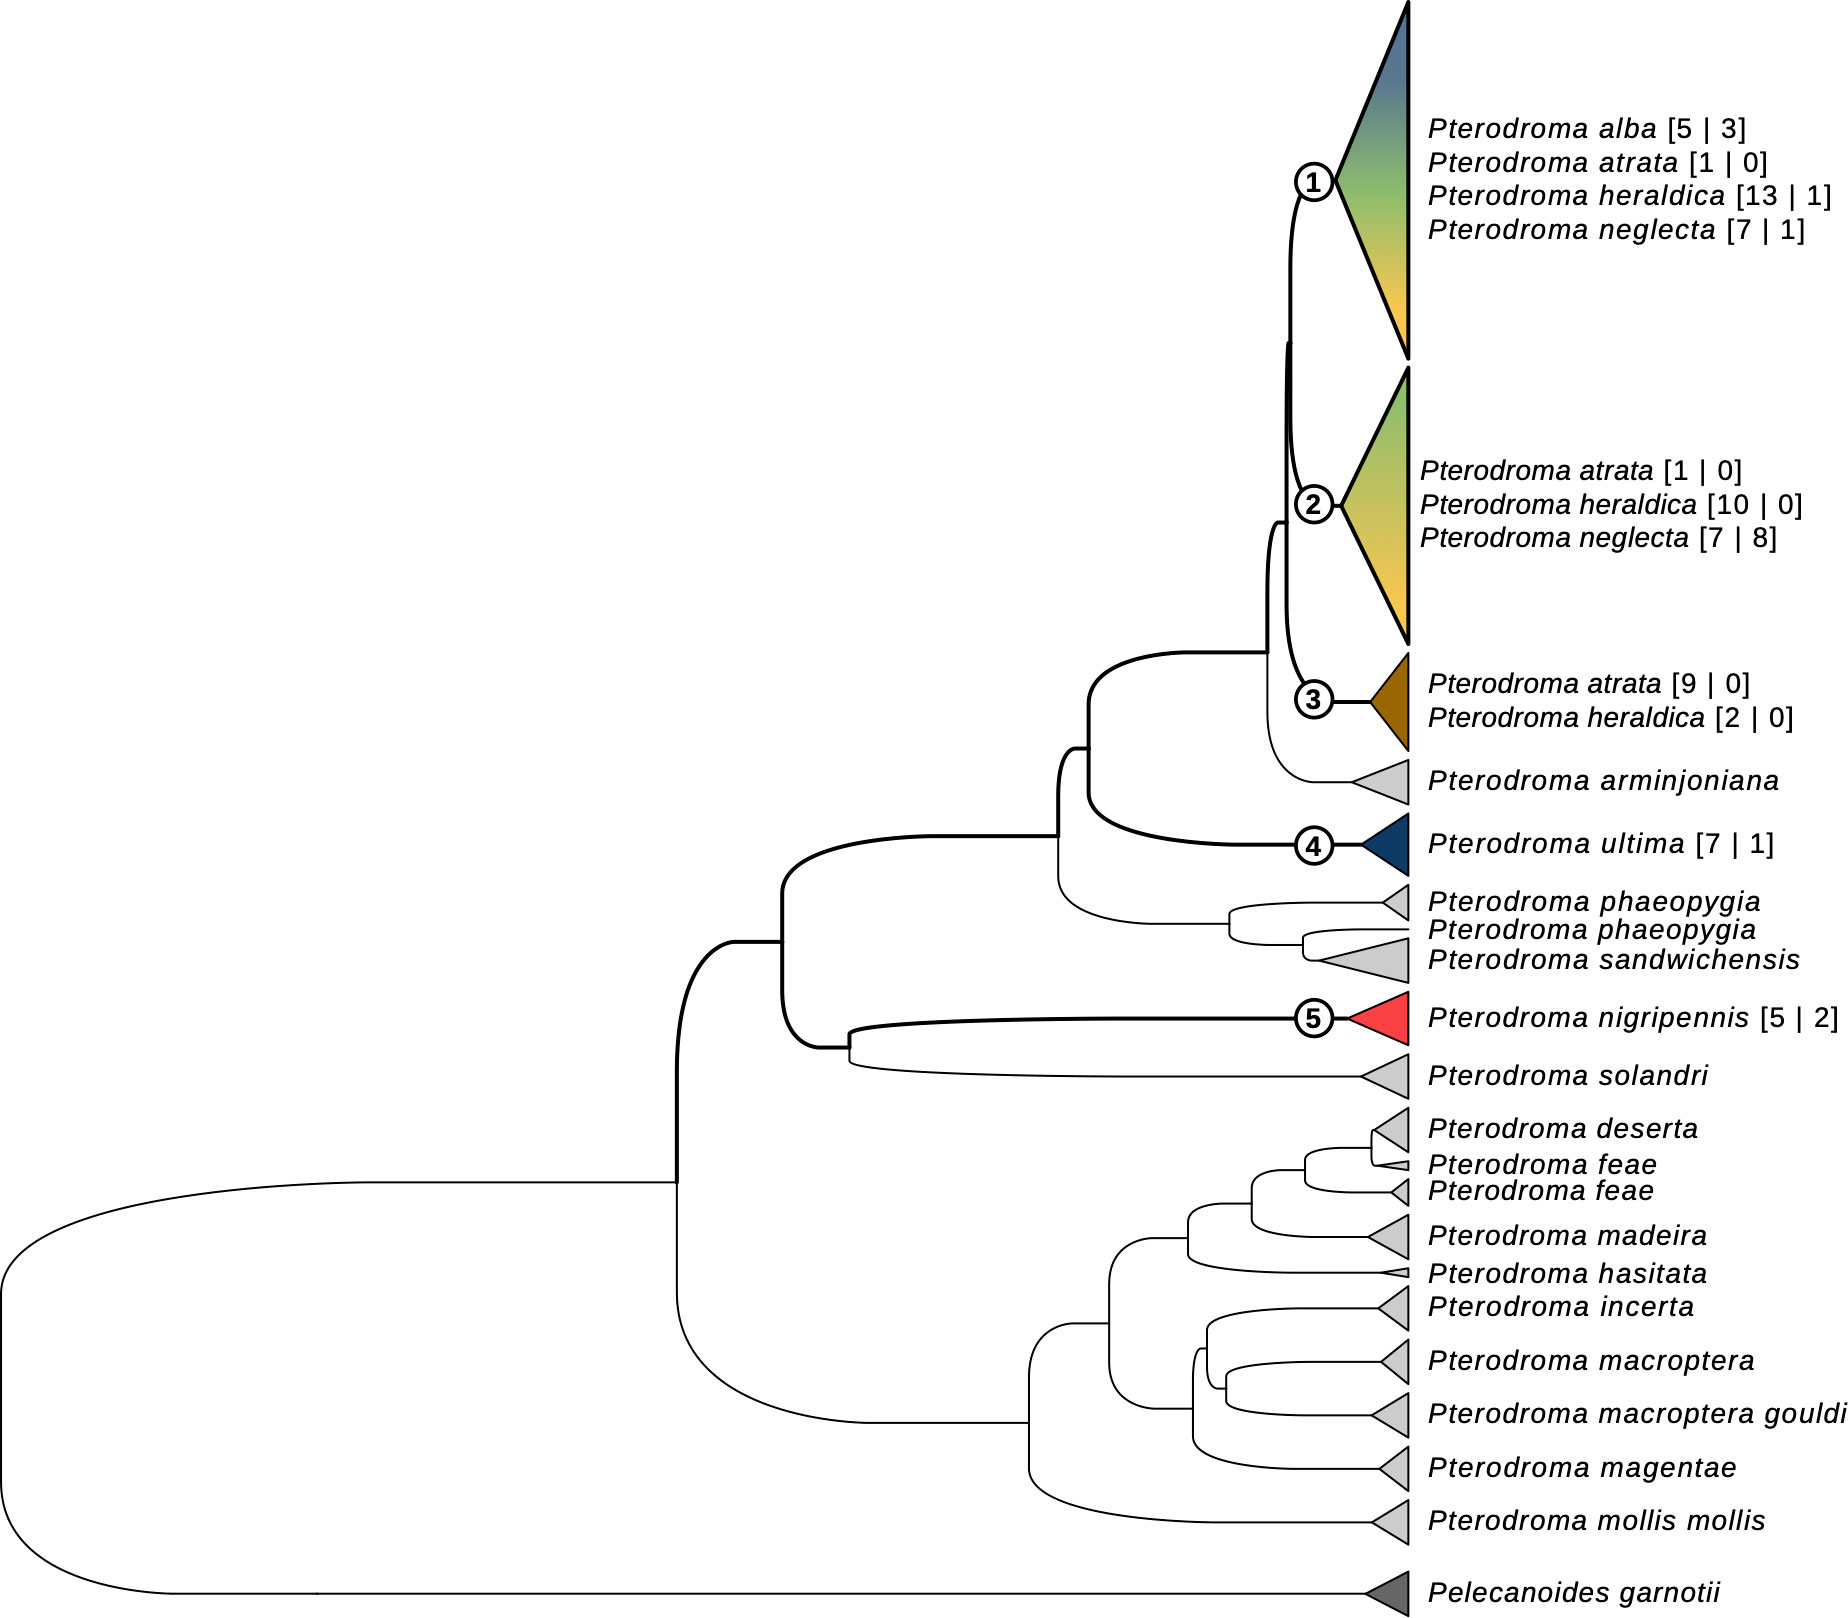
Figure 4 Cytochrome-b gene tree for the Pterodroma genus. The haplotype tree includes all sequences in this study, as well as sequences from independent previous studies. Tips are colored according to species (see Figures 1-3 for colour legend). For the species in this study, species names are followed by sample size, as “[sequences in this study | sequences from previous studies]”.
Microsatellite analysis
Nine polymorphic loci were retained out of the 45 tested primer pairs (locus characteristics are given in Supplementary Material Table S8), which amplified successfully for 96 individuals, among which 79 could reliably be assigned to one a priori species based on phenotype. All loci were found in Hardy-Weinberg equilibrium when species were taken separately, but only one locus (TG03002) when considering all individuals as one population (see Supplementary Material Table S8). As expected amongst species, most pairwise Fst was generally high and significant (Supplementary Material Figure S6): yet remarkably, the three comparisons involving P. alba on the one hand, and P. atrata, P. heraldica, and P. neglecta on the other were not significantly different from random, and Fst values between P. atrata, P. heraldica, and P. neglecta, although significant, were relatively low. Clustering approaches yielded similar results (Figure 5), whether they were based on Bayesian or Maximum-likelihood reconstruction of Hardy-Weinberg-equilibrium population-specific allele frequencies (Structure and snapclust), or on linear discriminant analysis (DAPC). In the latter case, the first linear discriminant function was driven by four main alleles at four different loci, making up 50% of allele contributions. No single locus was over-represented (maximum locus contribution: ~25%). The second linear discriminant was more locus-driven, with one microsatellite (TG04061) making up ~78% of total contributions with its five alleles, which were the five largest contributing alleles. All three approaches (Structure, DAPC and snapclust) converged to an optimal clustering in 5 groups. Overall, the Structure and snapclust approaches gave a more nuanced view, and the DAPC approach gave more clear-cut assignments. Both approaches concurred to make P. nigripennis and P. ultima well-defined groups, P. atrata a rather distinct group despite some inconsistencies, P. heraldica and P. alba a similarly composed entity, and P. neglecta a mixed group with its own component as well as a significant heraldica-alba component and some P. atrata admixture components. In some cases, individuals seemed more similar to another species than their phenotypic assignment: this is the case of one P. ultima (identified as P. atrata), three P. atrata (identified as P. heraldica-alba), and two P. heraldica (identified as P. atrata for one method, and P. neglecta for the other).
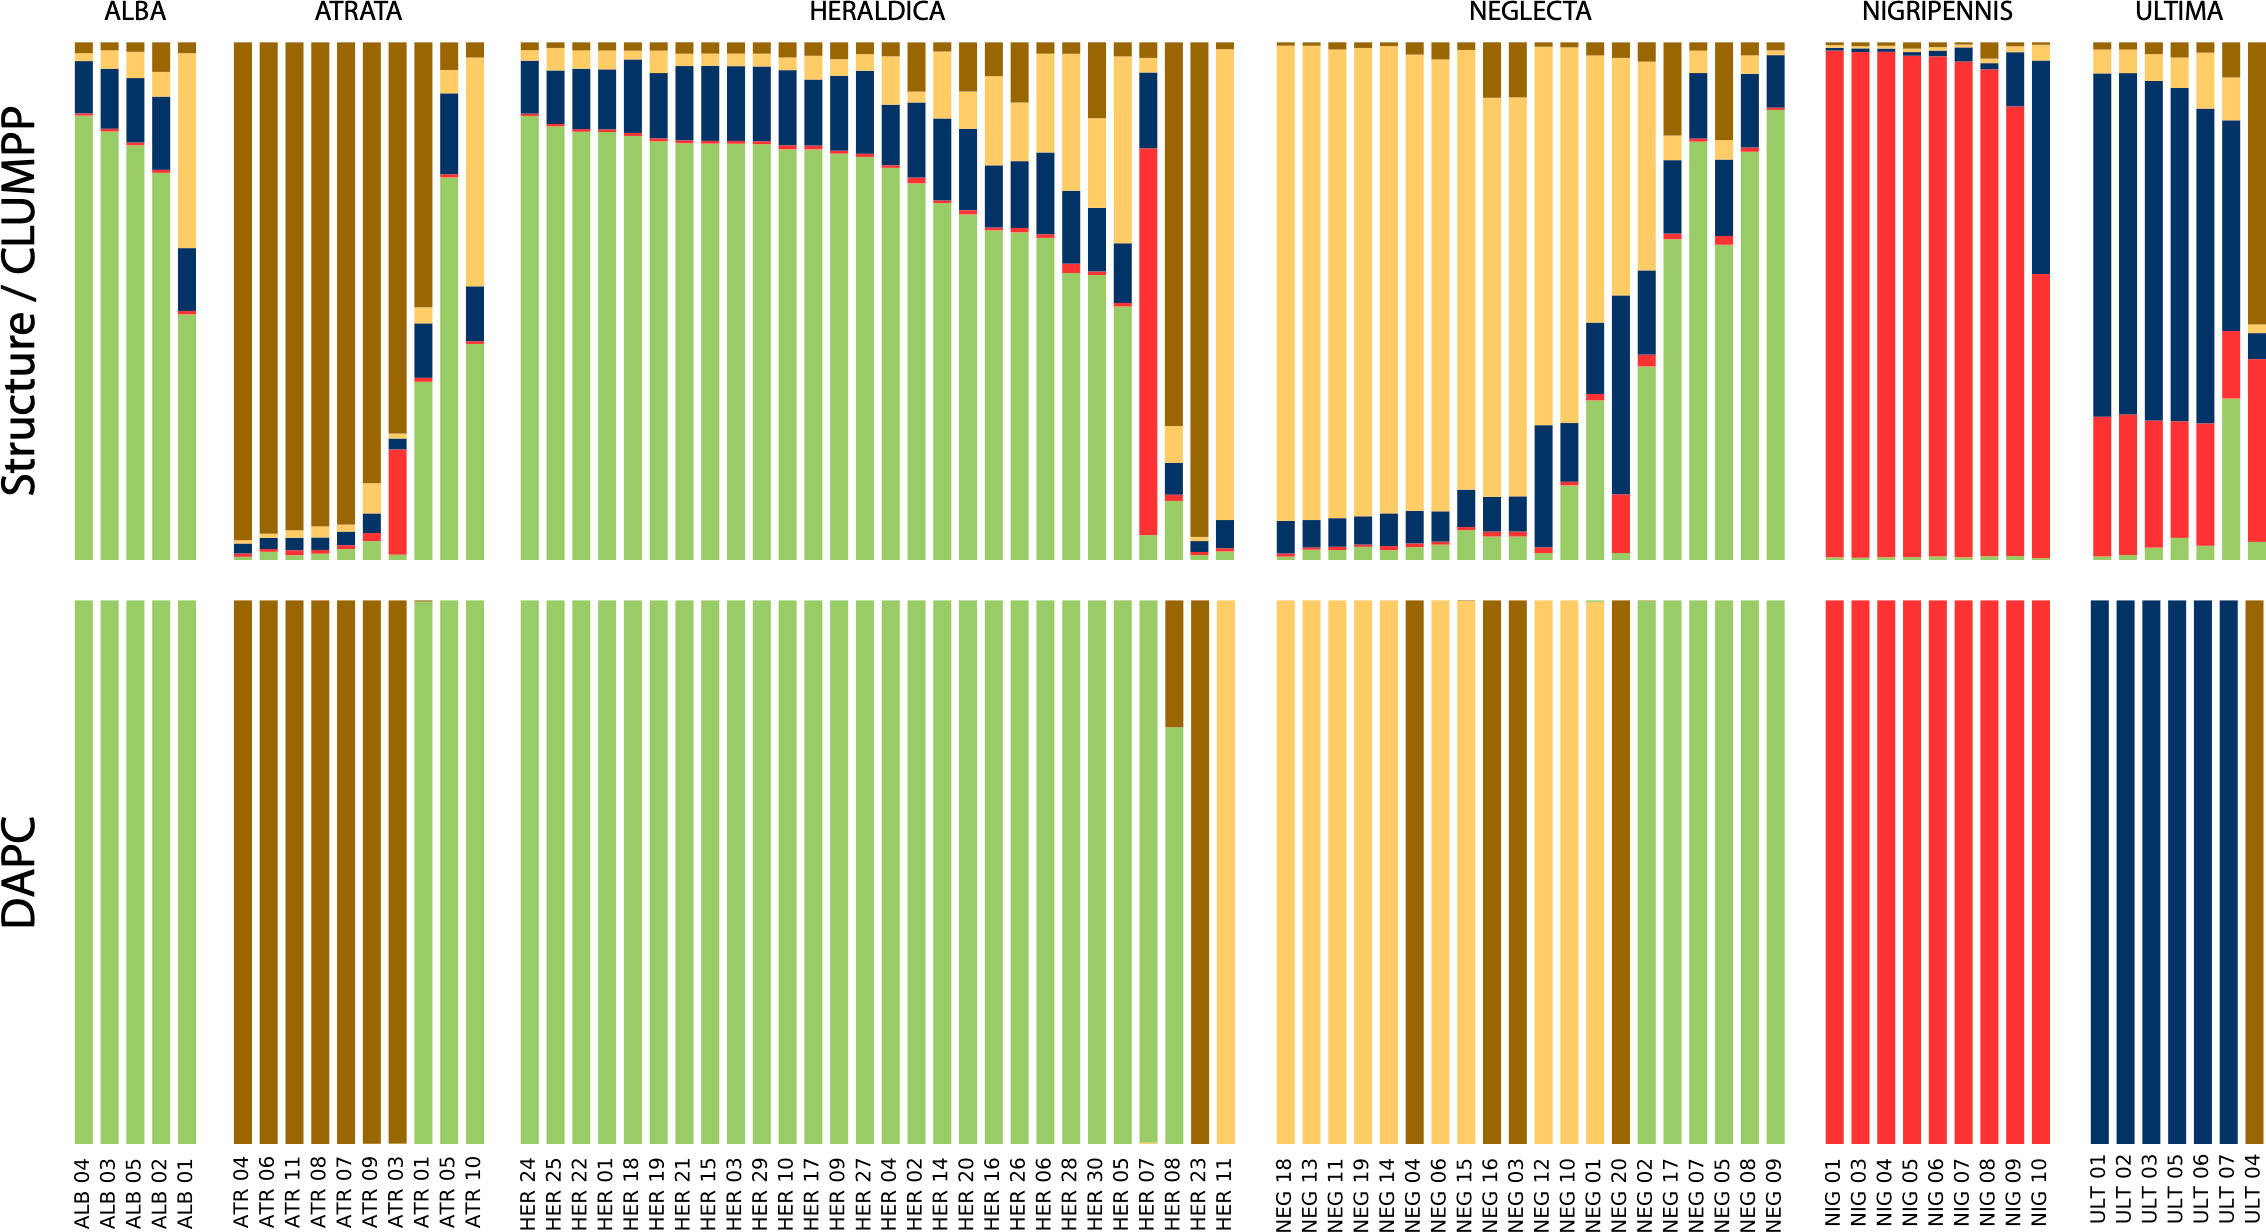
Figure 5 Population clustering by inferred ancestral allele frequencies. Top panel: Structure clustering, summarised in CLUMPP. Bottom panel: DAPC clustering. ALB, P. alba; ATR, P. atrata; HER, P. heraldica; NEG, P. neglecta; NIG, P. nigripennis; ULT, P. ultima.
Correspondence between genetic and ecological distance
We found a strong association between genetic distance and most other distance measures at the interindividual level. Microsatellite distance correlated strongly with allometric distances (p-value = 0.001), with feather-isotopes (p-value = 0.003) and with blood-isotopes (p-value = 0.001). Cytochrome-b distances correlated strongly with allometric distances (p-value = 0.003), and more weakly or not at all with blood and feather isotopes (p-values = 0.012 and 0.455, respectively). At the interspecific level, Fst values correlated with feather-based and blood-based isotopic niche overlap (p-value = 0.034 and 0.025, respectively) but not with morphology (p-value = 0.089) or acoustic overlap (p-value = 0.45). In other words, segregation in the foraging niche appeared to be the strongest and most consistent correlate to reproductive isolation in these six groups. Finally, the number of dimensions in which two species segregated was strongly associated with the Fst of that species pair (Spearman’s test: Rho = 0.76, p-value = 0.001), with, on the one hand, P. heraldica and P. alba virtually indistinguishable on both axes, and, on the other hand, P. nigripennis easily separated from all other species (Figure 6).
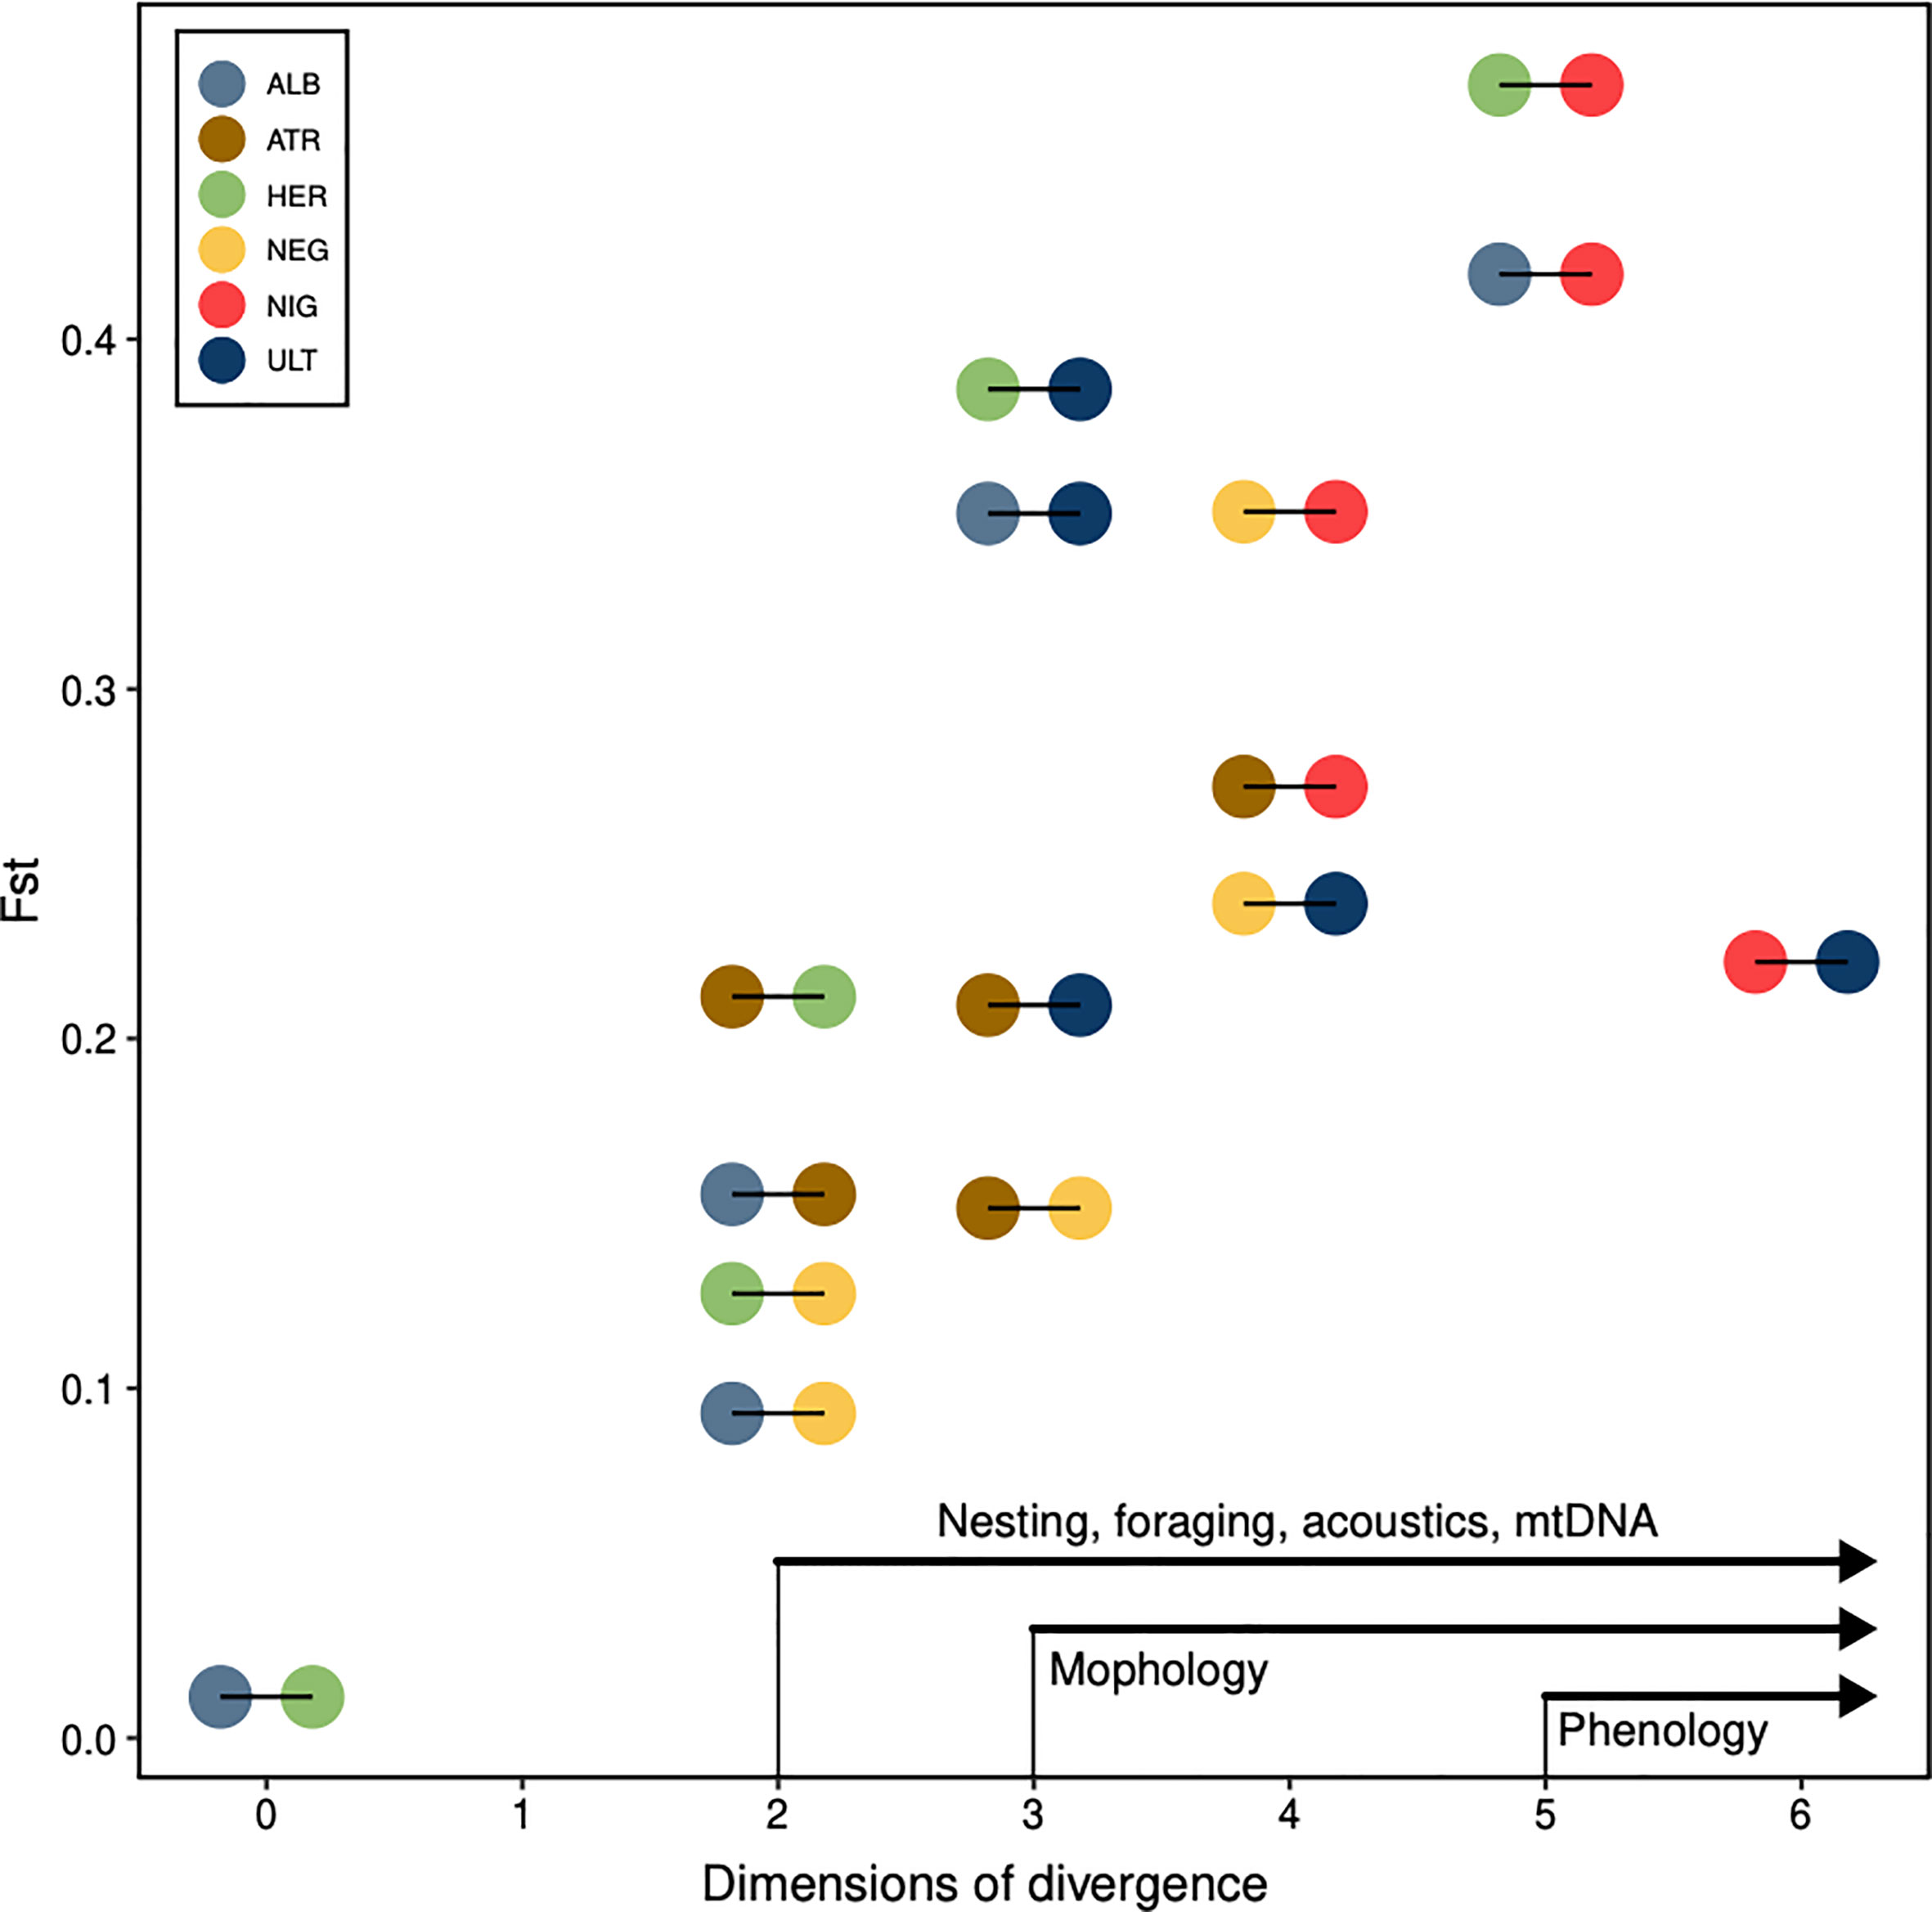
Figure 6 Ecological divergence and gene flow. Pairwise Fst values, against the number of dimensions in which the pair of species may be differentiated by an observer. Each pairwise comparison is coloured according to both species compared (e.g. in the bottom-left corner, P. alba and P. heraldica are distinguished on 0 phenotypic axes, and have a pairwise Fst of 0.012). We annotated the x-axis with the general order in which individual dimensions segregate species: species that are distinct on at least 5 axes are always different in phenology, the others never. Species distinct on at least 3 axes are almost always different in morphology, the others never. ALB, P. alba; ATR, P. atrata; HER, P. heraldica; NEG, P. neglecta; NIG, P. nigripennis; ULT, P. ultima.
Discussion
Our results offer a more nuanced picture than the current taxonomic classification of Pterodroma petrels in the Rapa Nui area. Of the six species distinguished by the current consensus (Imber, 1985; Onley and Scofield, 2016; BirdLife International, 2021), only two (P. nigripennis and P. ultima) find unambiguous support in our data - for these two, the clear convergence of phenotypic and genetic evidence strengthens the current state of knowledge. On the other hand, the four other species included in this study have such low levels of ecological and genetic differences that the relevance of species-level identification in this population may be questioned. This observation, however, needs to be put in balance with the clear sorting of individuals into six taxonomic units – a variety of phenotypic traits, including jizz and plumage details, nearly always allows identification by an experienced observer (Harrison et al., 2021), so that the issue at hand is less the existence of some level of taxonomic sorting than the qualification of this taxonomic sorting and its ecological implications.
P. nigripennis
In keeping with previous descriptions, we found the black-winged petrel (P. nigripennis) to be smaller, with a more slender bill than all other Pterodroma species in this study. Isotopic signals in feathers revealed a relatively lower trophic level, and the species is well identified by its call, breeding phenology, and choice of the burrow that matches earlier descriptions (West and Nilsson, 1994; Hutton and Priddel, 2002). Genetic evidence reveals a deeply monophyletic group within the Pterodroma genus without detectable gene flow with other taxa. Thus, our findings confirm previous phylogenies based on morphology (Imber, 1985) and genetic markers (Nunn and Stanley, 1998; Penhallurick and Wink, 2004).
P. ultima
Although of a less clearly divergent phenotype compared to P. nigripennis, Murphy’s petrel (P. ultima) is well identified by both ecological and genetic traits. It is unambiguously monophyletic in the mtDNA phylogeny, and well distinguished using microsatellite markers. While identified in morphospace, P. ultima is clearly set apart by its particular δ13C signature in blood and feathers. This is best explained by year-round spatial segregation at sea from all other Rapa Nui Pterodroma petrels, in keeping with direct evidence obtained on Pitcairn islands: P. ultima forages in oligotrophic oceanic provinces along the subtropical front and the Humboldt current during the breeding period, and as far as the North Pacific Gyre in the inter-breeding period (Clay et al., 2017). Foraging segregation is well known to be a primary barrier to gene flow in seabirds (Friesen et al., 2007a; Friesen, 2015), so the convergence of genetic isolation and marked foraging segregation between P. ultima and its congeners on Motu Nui is consistent with its status as a different species.
Other species
The relationships between the Phoenix petrel (P. alba), the Henderson petrel (P. atrata), the Herald petrel (P. heraldica), and the Kermadec petrel (P. neglecta) are all but clear-cut in our study system. These species overlap in nearly all measured parameters, whether genetic or phenotypic, and sorting is often inconsistent depending on the character considered - although we underline the fact that the relatively low sample size for P. alba (5 individuals) may limit our ability to detect finer interspecific differences. P. alba, P. atrata, and P. heraldica are virtually indistinguishable in morphospace, while P. neglecta is only marginally distinguishable as being slightly larger, with comparatively slightly shorter wings. Based on mtDNA Cyt-b sequences, P. alba, P. heraldica, and P. neglecta are indistinguishable, while P. atrata is fairly distinct. Based on microsatellite markers, P. alba and P. heraldica are indistinguishable, P. neglecta is highly variable and often indistinguishable, and P. atrata is generally distinct, although some individuals are similar to P. heraldica. P. neglecta tends to breed more in summer than in winter, and P. atrata more in winter than in summer, but not systematically. P. neglecta also tend to specialise in rock crevices for nesting more than the three other species. Moreover, while these four groups may usually be differentiated visually by an experienced observer, the traits used mainly rely on plumage colouration: P. atrata is unmistakably dark, while P. heraldica and P. neglecta can reliably be told apart only based on the colour of the primary, secondary and tail feather shaft (black in P. heraldica, light-coloured in P. neglecta). P. alba has overall more contrasted colouration patterns.
Inconsistent genetic sorting
For all species except P. nigripennis, microsatellite and mtDNA analyses revealed some inconsistencies between molecular and phenotypic assignment. In our sample, one P. ultima individual was consistently linked with P. atrata in microsatellite analyses but with the other P. ultima specimens in mtDNA analysis. Three P. atrata individuals appeared closer to P. heraldica in microsatellite analyses: one unambiguously grouped with other P. atrata sequences in the mtDNA tree, but the two others with the mixed P. heraldica - P. neglecta - P. alba complex. Conversely, two P. heraldica individuals grouped with P. atrata in mtDNA analyses: one also did in microsatellite analyses but not the other. In all these cases, photographic material confirmed the phenotypic identification without ambiguity, and in no case did we observe an individual with a clearly hybrid phenotype, as is the case in Round Island P. arminjoniana, P. neglecta, and P. heraldica (Brown et al., 2010; Brown et al., 2011). Trivial errors (e.g., in tube labelling), though a possible explanation in some cases, are a priori excluded since (1) species identification was the focus of this study, and utmost care was taken in that respect, and (2) the mismatch between mitochondrial and nuclear analysis from the same DNA extract in half of the cases cannot be accounted for in this way. On the other hand, a moderate level of gene flow between species, and a fair amount of phenotypic variation may well account for this observation. The recurrence of atypical colouration convergence between usually distinct groups has recently been conclusively documented in Eudyptes penguins (Frugone et al., 2018), supporting this hypothesis. It should be noted that overall, the Pterodroma species of Motu Nui are far more similar in genetic, isotopic, or morphometric traits than in general appearance or acoustic traits. Thus, a significant amount of gene flow between groups may occur without apparent effects on phenotypic segregation: we suggest that we may obtain similar results in other locations of the Pacific where these closely-related species co-exist.
P. heraldica - P. alba
Among the four less-clearly sorted species (i.e., P. alba, P. atrata, P. heraldica, and P. neglecta), P. alba and P. heraldica are the most similar by far: they were not segregated by any of the quantitative parameters surveyed in the present study (Figure 6). Both present a similar morphology, δ13C, and δ15N signatures, breeding and nesting habits, and were undistinguishable based on our genetic data. This finding converges with previous results based on morphology and juvenile plumage (Murphy and Pennoyer, 1952), mtDNA (Brooke and Rowe, 1996), and microsatellite data (Booth Jones et al., 2017) in other locations. These two groups remain distinguishable by an experienced observer, based on jizz and plumage colouration in particular (Harrison et al., 2021), and some genetic or epigenetic differentiation is undoubtedly involved in maintaining this contrast. However, we consider that there is now enough independent evidence to question the full species status of P. alba: and we suggest that the species may safely be redefined as a subspecies of P. heraldica, named P. heraldica alba.
P. neglecta - P. heraldica
Although bioacoustic evidence revealed a clear sorting, neither morphology, foraging behaviour, nor genetic evidence supported a binary separation between the two species. One possibility is that acoustic separation is insufficient to act as a leak-proof prezygotic barrier in sympatry, as is usually the case in birds (Bretagnolle, 1996), and the two species are undergoing active hybridisation after secondary contact on Motu Nui, blurring all genetic separation. We did not detect any hybrid phenotype; however, several birds with unclear phenotypes (classified here as Pterodroma sp. or “unknown”) fell within the haplogroups associated with these two species. These are not represented in our bioacoustic dataset since only birds clearly identifiable in flight were included: thus, sampling bias is likely to under-represent hybrids. These two species are also the most similar in morphology, as the primary, secondary and tail feather shaft is the only minimal diagnostic feature – although the typical P. neglecta’s heavier, “bull-necked” jizz distinguishes it from other groups to the experienced observer, and the species includes a characteristic white morph never found in P. heraldica (Harrison et al., 2021). Finally, microsatellite data show a continuous gradient of differentiation, rather than a clear-cut separation, between P. heraldica and P. neglecta. Overall, our results converge with observations made in another recently-colonised secondary contact zone, Round Island, in the tropical Indian Ocean, where admixture between P. heraldica and P. neglecta petrels has been documented by Brown et al. (2010); Brown et al. (2011) and more recently by Booth Jones et al. (2017) – although in Motu Nui, unlike in Round Island, we did not identify any hybrid individual. Thus, the two species do not appear to have strong pre- or post-zygotic isolation, and P. heraldica may be more appropriately described as a subspecies of P. neglecta named P. neglecta heraldica (in that case, we should also consider the current P. alba as P. neglecta alba).
P. atrata
The contrast between P. atrata and the P. heraldica - P. alba - P. neglecta group is easier to define. In the earlier classifications (e.g., Murphy and Pennoyer, 1952), P. heraldica was considered a subspecies of P. arminjoniana (as P. a. heraldica) and further divided into two morphs (“light” and “dark”, Murphy and Pennoyer, 1952), each restricted to specific islands of the Pacific. Imber (1985) first proposed to consider P. heraldica as a separate species from P. arminjoniana. Finally, Brooke and Rowe (1996) proposed considering the dark morph of the new P. heraldica as another species, P. atrata, based on mtDNA divergence between the morphs on Henderson Island, and the then-assumed endemism of the dark morph to that location. Generally, our results support the view that P. heraldica and P. atrata are somewhat distinct (Fst is moderately high, and the morphs are generally distinguishable both on the mtDNA tree and in the microsatellite, structure analyses). However, either ongoing gene flow, or incomplete lineage sorting as a result of very recent reproductive isolation, clearly blur that signal. While we do not see reasons to question the species status of P. atrata based on our data, we find grounds for a more in-depth revision of the phylogenetic relationships between the two species across their range.
Fine-scale sympatry
This study documents a particular case of sympatric breeding in closely-related Pterodroma species. Seabird species sharing the same reproductive habitat classically segregate in at least one dimension of their niche, such as their at-sea foraging behaviour (Cody, 1973; Young et al., 2010b; Navarro et al., 2015; Ravache et al., 2020). On the other hand, our results document a significant overlap between individuals assigned to different species by the current taxonomy. In particular, overlap in trophic position is striking, and in clear contrast with all other examples to our knowledge, as trophic segregation between sympatric seabird species appeared to be the rule in tropical and subtropical islands (Cherel et al., 2008; Young et al., 2010a; Ravache et al., 2020), and was so far only reported lacking in the subantarctic islands of Patagonia (where the overlap is explained by the high marine productivity and the overall abundance of prey, Forero et al., 2004). This surprisingly promiscuous nesting, however, is not restricted to Motu Nui but seems typical of Pterodroma petrels nesting sites in the South Pacific (Harrison et al., 2021). The extreme local conditions may be the primary driver of nest choice, as proposed by Schreiber (2002): the South Pacific islands share a particularly harsh tropical environment, with intense radiation all year round, high heat, high precipitation, and intense winds. In this context, nest selection may respond more to climatic constraints than to selection for coloniality with conspecifics, and high sympatry, even at very fine local scales, may be expected to arise as a result. We suggest that this immediate daily contact may challenge the weak prezygotic isolation in these closely-related species, and may lead to increased gene flow across species boundaries. Indeed, it may be that high philopatry (and usual allopatry between species) make accurate recognition of conspecifics rather superfluous in most cases for birds that breed in such a fragmented habitat: the recent recolonisation of Motu Nui may pose an unusual challenge to Pterodroma petrels. Such gene flow at secondary contact zones has been evidenced in Laridae (Sternkopf et al., 2010; Sonsthagen et al., 2016), and patterns compatible with hybridisation have been documented in P. arminjoniana, P. heraldica, and P. neglecta in their contact zone in the Indian Ocean (Brown et al., 2010; Brown et al., 2011).
The well-documented local extinction or extirpation events in prehistoric and historical times at the margins of Polynesia make it plausible that our observations are the result of recent secondary contact, and support the idea of Motu Nui as a “melting pot” where gene flow is enhanced between species that are re-extending their ranges. However, these patterns may instead be the result of interrupted ecological speciation (Nosil et al., 2009): indeed, the high overlap of Pterodroma petrels of the alba, atrata, heraldica, and neglecta types may suggest that speciation processes have not led to strong reproductive isolation at any point at all, and that our observations on Motu Nui are just the expected result of the encounter of groups that have never really developed into separate species at all (sensu Mayr, 1996). The positive association between phenotypic and niche divergence, and genetic differentiation, is classically described in that context (Langerhans et al., 2007; Nosil and Sandoval, 2008), and our results unambiguously fit with that model.
Overall, the multidisciplinary approach that we implemented in the present study proves to be a necessary framework to understand speciation processes in closely related species with long generation times, where genetic patterns may be hardly understandable on their own, and we advocate its use in a wider-scale re-evaluation of the taxonomy of the Pterodroma genus. However, the surprisingly high similarity between these currently recognised species would justify the use of higher-accuracy techniques in morphometry, bioacoustics, and in particular in genetics (e.g., genome-wide markers), which may help resolve the finer patterns of admixture in heraldica-alba petrels, or between heraldica and neglecta individuals. Finally, including other populations of Pterodroma species and long-term monitoring spanning several generations is likely to bring key information about the ongoing reversal of speciation – a process of high relevance in the context of massive biodiversity loss.
We underline that whether these patterns result from incomplete speciation or secondary hybridisation, the seabirds of Motu Nui and similar Pacific islets currently constitute an assemblage whose properties are poorly described by the number of species alone. Biodiversity is often summarised through beta-diversity (after the Whittaker framework, 1960) as the ratio of the regional and local species diversity: but we show here that species co-occurrence may involve the appearance of novel diversity. In other words, the true diversity in such areas may not be fully captured by the sum of co-occurring species alone.
Implications for conservation
Our results also acutely raise the question of the role of species in conservation. While most conservation plans are built on lower taxonomic levels, the treatment of communities with active hybridisation is unclear: these may either represent a threat to the genetic integrity of the species involved or rather a healthy expected aspect of evolution and adaptation. Gene flow across species or subspecies borders seems to be a typical aspect of the Pterodroma genus (Brown et al., 2010; Brown et al., 2011; Booth Jones et al., 2017), and may in itself promote local adaptation in these seabirds’ changing environment. In any case, only long-term monitoring of such communities would allow us to detect possibly positive or negative effects of this cross-species gene flow.
Thus, while questioning species boundaries on Motu Nui, we do not suggest revising the conservation status of the Pterodroma groups involved nor consider ongoing hybridisation as a negative phenomenon. Globally, the P. alba taxonomic unit is considered a species in danger of extinction (BirdLife International, 2021), and should remain so: whether as a subspecies of P. heraldica or as a full species, the threat remains. On the other hand, Pterodroma petrels are collectively defined as a priority action target in the Agreement for the Conservation of Albatrosses and Petrels (ACAP), based on the scarcity of available information about this genus (ACAP, 2017). We strongly recommend that newly arisen assemblages and hybrid groups such as the one on Motu Nui should be closely monitored to evaluate the need for a specific hybrid conservation unit (Piett et al., 2015).
Data availability statement
The original contributions presented in the study are publicly available. All mitochondrial sequences are available from NCBI GenBank, accession numbers OP058019–OP058102. All other data are available through Figshare, (https://doi.org/10.6084/m9.figshare.20347521.v2).
Ethics statement
The animal study was reviewed and approved by permits N° 5343/2016, delivered by “Servicio Agrícola y Ganadero” (SAG), Chilean Goverment.
Author contributions
PP and GL-J planned and designed the study. PP and RC analysed the data and wrote the manuscript. NG, MS-G and GL-J revised, discussed, and edited the manuscript. All authors contributed to the article and approved the submitted version.
Funding
The Millennium Nucleus for Ecology and Sustainable Management of Oceanic Island ESMOI, and ANID-ATE 22004 BioDUCCT supported this work. PP was supported by a doctoral ANID N° 21110914 and a doctoral grant from ESMOI. RC was supported by MSCA IF #794087 and Academy of Finland project #331320.
Acknowledgments
We are particularly thankful to seabird expert Peter Harrison for his assistance in confirming species identifications and reviewing the text. We are also very grateful to Pedro Lazo, Max Ika, Erick, and Tannia Ramírez for assistance in the field, and to Andrea Morales and Rasme Heremme for assistance in the laboratory.
Conflict of interest
The authors declare that the research was conducted in the absence of any commercial or financial relationships that could be construed as a potential conflict of interest.
Publisher’s note
All claims expressed in this article are solely those of the authors and do not necessarily represent those of their affiliated organizations, or those of the publisher, the editors and the reviewers. Any product that may be evaluated in this article, or claim that may be made by its manufacturer, is not guaranteed or endorsed by the publisher.
Supplementary material
The Supplementary Material for this article can be found online at: https://www.frontiersin.org/articles/10.3389/fevo.2023.1123288/full#supplementary-material
References
ACAP (2017). “Workshop on pterodroma and other small burrowing petrels,” in 10th Meeting of the Advisory Committee, AC10 Doc 14 Rev 1, Wellington, New Zealand.
Aljanabi S. M., Martinez I. (1997). Universal and rapid salt-extraction of high quality genomic DNA for PCR-based techniques. Nucleic Acids Res. 25, 4692–4693. doi: 10.1093/nar/25.22.4692
Benjamini Y., Yekutieli D. (2001). The control of false discovery rate in multiple testing under dependency. Ann. Stat 29, 1165–1188. doi: 10.1214/aos/1013699998
Beugin M.-P., Gayet T., Pontier D., Devillard S., Jombart T. (2018). A fast likelihood solution to the genetic clustering problem. Methods Ecol. Evol. 9, 1006–1016. doi: 10.1111/2041-210X.12968
BirdLife International (2021) IUCN red list for birds. Available at: http://www.birdlife.org.
Bon C., Della Penna A., d’Ovidio F., Arnould J. Y., Poupart T., Bost C. A. (2015). Influence of oceanographic structures on foraging strategies: macaroni penguins at crozet islands. Movement Ecol. 3, 1–11. doi: 10.1186/s40462-015-0057-2
Booth Jones K. A., Nicoll M. A., Raisin C., Dawson D. A., Hipperson H., Horsburgh G. J., et al. (2017). Widespread gene flow between oceans in a pelagic seabird species complex. Mol. Ecol. 26, 5716–5728. doi: 10.1111/mec.14330
Bouckaert R., Heled J., Kühnert D., Vaughan T., Wu C. H., Xie D., et al. (2014). BEAST 2: a software platform for Bayesian evolutionary analysis. PLoS Comput. Biol. 10, e1003537. doi: 10.1371/journal.pcbi.1003537
Brace S., Barnes I., Kitchener A. C., Serjeantson D., Turvey S. T. (2014). Late Holocene range collapse in a former British seabird species. J. Biogeogr. 41, 1583–1589. doi: 10.1111/jbi.12305
Bretagnolle V. (1996). “Acoustic communication in a group of non-passerine birds, the petrels,” in Ecology and evolution of acoustic communication in birds (Ithaca, NY: Cornell University Press), 160–177.
Brooke M. D. L., Rowe G. (1996). Behavioural and molecular evidence for specific status of light and dark morphs of the herald petrel pterodroma heraldica. Ibis 138, 420–432. doi: 10.1111/j.1474-919X.1996.tb08060.x
Brown R. M., Jordan W. C. (2009). Characterisation of polymorphic microsatellite loci from round island petrels (Pterodroma arminjoniana) and their utility in other seabird species. J. Ornithol. 150, 925–929. doi: 10.1007/s10336-009-0411-5
Brown R. M., Jordan W. C., Faulkes C. G., Jones C. G., Bugoni L., Tatayah V., et al. (2011). Phylogenetic relationships in pterodroma petrels are obscured by recent secondary contact and hybridisation. PLoS One 6, e20350. doi: 10.1371/journal.pone.0020350
Brown R. M., Nichols R. A., Faulkes C. G., Jones C. G., Bugoni L., Tatayah V., et al. (2010). Range expansion and hybridisation in round island petrels (Pterodroma spp.): evidence from microsatellite genotypes. Mol. Ecol. 19, 3157–3170. doi: 10.1111/j.1365-294X.2010.04719.x
Charif R. A., Waack A. M., Strickman L. M. (2010). Raven pro 1.4 (Ithaca, NY: Cornell Lab of Ornithology).
Charrad M., Ghazzali N., Boiteau V., Niknafs A. (2014). NbClust: an r package for determining the relevant number of clusters in a data set. J. Stat. software 61, 1–36. doi: 10.18637/jss.v061.i06
Cherel Y., Le Corre M., Jaquemet S., Menard F., Richard P., Weimerskirch H., et al. (2008). Resource partitioning within a tropical seabird community: new information from stable isotopes. Mar. Ecol. Prog. Ser. 366, 281–291. doi: 10.3354/meps07587
Clay T., Phillips R., Manica A., Jackson H., Brooke M. (2017). Escaping the oligotrophic gyre? the year-round movements, foraging behaviour and habitat preferences of murphy’s petrels. Mar. Ecol. Prog. Ser. 579, 139–155. doi: 10.3354/meps12244
Cody M. L. (1973). Coexistence, coevolution and convergent evolution in seabird communities. Ecology 54, 31–44. doi: 10.2307/1934372
Cristofari R., Liu X., Bonadonna F., Cherel Y., Pistorius P., Le Maho Y., et al. (2018). Climate-driven range shifts of the king penguin in a fragmented ecosystem. Nat. Climate Change 8, 245. doi: 10.1038/s41558-018-0084-2
Croxall J. P., Butchart S. H., Lascelles B. E. N., Stattersfield A. J., Sullivan B. E. N., Symes A., et al. (2012). Seabird conservation status, threats and priority actions: a global assessment. Bird Conserv. Int. 22, 1–34. doi: 10.1017/S0959270912000020
Croxall J. P., Silk J. R., Phillips R. A., Afanasyev V., Briggs D. R. (2005). Global circumnavigations: tracking year-round ranges of non-breeding albatrosses. Science 307, 249–250. doi: 10.1126/science.1106042
Dawson D. A., Horsburgh G. J., Küpper C., Stewart I. R., Ball A. D., Durrant K. L., et al. (2010). New methods to identify conserved microsatellite loci and develop primer sets of high cross-species utility–as demonstrated for birds. Mol. Ecol. Resour. 10, 475–494. doi: 10.1111/j.1755-0998.2009.02775.x
DuBois A., Lenne P., Nahoe E., Rauch M. (2013). Plantas de Rapa Nui. guía ilustrada de la flora de interés ecológico y patrimonial (Santiago: Umanga mo te Natura, CONAF, ONF International).
Duncan R. A., McDougall I. (1976). Linear volcanism in French Polynesia. J. volcanology Geothermal Res. 1, 197–227. doi: 10.1016/0377-0273(76)90008-1
Dunlop J. N., Wooller R. D. (1986). Range extensions and the breeding seasons of seabirds in South-Western Australia. Records Western Aust. Museum 12, 389–394.
Dye T., Steadman D. W. (1990). Polynesian ancestors and their animal world. Am. Scientist 78, 207–215.
Earl D. A. (2012). STRUCTURE HARVESTER: a website and program for visualising STRUCTURE output and implementing the evanno method. Conserv. Genet. Resour. 4, 359–361. doi: 10.1007/s12686-011-9548-7
Evanno G., Regnaut S., Goudet J. (2005). Detecting the number of clusters of individuals using the software STRUCTURE: a simulation study. Mol. Ecol. 14, 2611–2620. doi: 10.1111/j.1365-294X.2005.02553.x
Forero M. G., Bortolotti G. R., Hobson K. A., Donazar J. A., Bertelloti M., Blanco G. (2004). High trophic overlap within the seabird community of argentinean Patagonia: a multiscale approach. J. Anim. Ecol. 73, 789–801. doi: 10.1111/j.0021-8790.2004.00852.x
Friesen V. L. (2015). Speciation in seabirds: why are there so many species and why aren’t there more? J. Ornithol. 156, 27–39. doi: 10.1007/s10336-015-1235-0
Friesen V. L., Burg T. M., McCoy K. D. (2007a). Mechanisms of population differentiation in seabirds. Mol. Ecol. 16, 1765–1785. doi: 10.1111/j.1365-294X.2006.03197.x
Friesen V. L., Smith A. L., Gómez-Díaz E., Bolton M., Furness R. W., González-Solís J., et al. (2007b). Sympatric speciation by allochrony in a seabird. Proc. Natl. Acad. Sci. 104, 18589–18594. doi: 10.1073/pnas.0700446104
Frugone M. J., Lowther A., Noll D., Ramos B., Pistorius P., Dantas G. P. M., et al. (2018). Contrasting phylogeographic pattern among eudyptes penguins around the Southern Ocean. Sci. Rep. 8, 1–16. doi: 10.1038/s41598-018-35975-3
Harrison P., Perrow M., Larsson H. (2021). Seabirds: the new identification guide (Barcelona: Lynx Edicions).
Hutton I., Priddel D. (2002). Breeding biology of the black-winged petrel, Pterodroma nigripennis, on lord Howe island. Emu 102, 361–365. doi: 10.1071/MU01040
Imber M. J. (1985). Origins, phylogeny and taxonomy of the gadfly petrels pterodroma spp. Ibis 127, 197–229. doi: 10.1111/j.1474-919X.1985.tb05055.x
Jackson A. L., Inger R., Parnell A. C., Bearhop S. (2011). Comparing isotopic niche widths among and within communities: SIBER–stable isotope Bayesian ellipses in r. J. Anim. Ecol. 80, 595–602. doi: 10.1111/j.1365-2656.2011.01806.x
Jakobsson M., Rosenberg N. A. (2007). CLUMPP: a cluster matching and permutation program for dealing with label switching and multimodality in analysis of population structure. Bioinformatics 23, 1801–1806. doi: 10.1093/bioinformatics/btm233
Jombart T. (2008). Adegenet: a r package for the multivariate analysis of genetic markers. Bioinformatics 24, 1403–1405. doi: 10.1093/bioinformatics/btn129
Jombart T., Devillard S., Balloux F. (2010). Discriminant analysis of principal components: a new method for the analysis of genetically structured populations. BMC Genet. 11, 94. doi: 10.1186/1471-2156-11-94
Krebs C. J. (1998). Ecological methodology (Menlo Park, California: Addison Welsey Educational Publishers. Inc.).
Langerhans R. B., Gifford M. E., Joseph E. O. (2007). Ecological speciation in gambusia fishes. Evolution 61, 2056–2074. doi: 10.1111/j.1558-5646.2007.00171.x
Magozzi S., Yool A., Vander Zanden H. B., Wunder M. B., Trueman C. N. (2017). Using ocean models to predict spatial and temporal variation in marine carbon isotopes. Ecosphere 8(5), e01763. doi: 10.1002/ecs2.1763
Maechler M., Rousseeuw P., Struyf A., Hubert M., Hornik K. (2022). Cluster: cluster analysis basics and extensions. R package version 2.1.4. Available at: https://cran.rproject.org/web/packages/cluster/citation.html.
Mayr E. (1996). “What is a species, and what is not?” Philosophy Sci. 63, 262–277. doi: 10.1086/289912
Murphy R. C., Pennoyer J. M. (1952). Larger petrels of the genus pterodroma. Am. Museum Novitates, 1580 1–43.
Navarro J., Cardador L., Brown R., Phillips R. A. (2015). Spatial distribution and ecological niches of non-breeding planktivorous petrels. Sci. Rep. 5, 12164. doi: 10.1038/srep12164
Navarro J., Votier S. C., Aguzzi J., Chiesa J. J., Forero M. G., Phillips R. A. (2013). Ecological segregation in space, time and trophic niche of sympatric planktivorous petrels. PLoS One 8, e62897. doi: 10.1371/journal.pone.0062897
Nei M., Li W. H. (1979). Mathematical model for studying genetic variation in terms of restriction endonucleases. Proc. Natl. Acad. Sci. 76, 5269–5273. doi: 10.1073/pnas.76.10.5269
Nei M., Tajima F. (1981). DNA Polymorphism detectable by restriction endonucleases. Genetics 97, 145–163. doi: 10.1093/genetics/97.1.145
Nosil P., Harmon L. J., Seehausen O. (2009). Ecological explanations for (incomplete) speciation. Trends Ecol. Evol. 24, 145–156. doi: 10.1016/j.tree.2008.10.011
Nosil P., Sandoval C. P. (2008). Ecological niche dimensionality and the evolutionary diversification of stick insects. PloS One 3, e1907. doi: 10.1371/journal.pone.0001907
Nunn G. B., Stanley S. E. (1998). Body size effects and rates of cytochrome b evolution in tube-nosed seabirds. Mol. Biol. Evol. 15, 1360–1371. doi: 10.1093/oxfordjournals.molbev.a025864
Oksanen J., Blanchet F. G., Friendly M., Kindt R., Legendre P., McGlinn D., et al. (2020). Package ‘vegan’. community ecology package, version 2. 5–7. Available at: https://www.researchgate.net/publication/346579465_vegan_community_ecology_package_version_25-7_November_2020/link/5fc8798192851c00f8491eb9/download.
Olson S. L., James H. F. (1982). Fossil birds from the Hawaiian islands: evidence for wholesale extinction by man before western contact. Science 217, 633–635. doi: 10.1126/science.217.4560.633
Onley D., Scofield P. (2016). Albatrosses, petrels and shearwaters of the world (London: Bloomsbury Publishing PLC).
Paradis E. (2010). Pegas: an r package for population genetics with an integrated–modular approach. Bioinformatics 26, 419–420. doi: 10.1093/bioinformatics/btp696
Paradis E., Claude J., Strimmer K. (2004). APE: analyses of phylogenetics and evolution in r language. Bioinformatics 20, 289–290. doi: 10.1093/bioinformatics/btg412
Paradis E., Schliep K. (2019). Ape 5.0: an environment for modern phylogenetics and evolutionary analyses in r. Bioinformatics 35, 526–528. doi: 10.1093/bioinformatics/bty633
Penhallurick J., Wink M. (2004). Analysis of the taxonomy and nomenclature of the procellariiformes based on complete nucleotide sequences of the mitochondrial cytochrome b gene. Emu Austral Ornithol. 104, 125–147. doi: 10.1071/MU01060
Piett S., Hager H. A., Gerrard C. (2015). Characteristics for evaluating the conservation value of species hybrids. Biodiver. Conserv. 24, 1931–1955. doi: 10.1007/s10531-015-0919-3
Plaza P., Serratosa J., Gusmao J. B., Duffy D. C., Arce P., Luna-Jorquera G., et al. (2021). Temporal changes in seabird assemblage structure and trait diversity in the Rapa Nui (Easter Island) multiple-use marine protected area. Aquat. Conservation: Mar. Freshw. Ecosyst. 31, 378–388. doi: 10.1002/aqc.3501
Polovina J. J., Howell E. A., Abecassis M. (2008). Ocean's least productive waters are expanding. Geophysical Res. Lett. 35, L03618. doi: 10.1029/2007GL031745
Pritchard J. K., Stephens M., Donnelly P. (2000). Inference of population structure using multilocus genotype data. Genetics 155, 945–959. doi: 10.1093/genetics/155.2.945
Quillfeldt P., McGill R. A., Furness R. W. (2005). Diet and foraging areas of Southern Ocean seabirds and their prey inferred from stable isotopes: review and case study of wilson’s storm-petrel. Mar. Ecol. Prog. Ser. 295, 295–304. doi: 10.3354/meps295295
Ravache A., Bourgeois K., Weimerskirch H., Pagenaud A., De Grissac S., Miller M., et al. (2020). Behavioral and trophic segregations help the Tahiti petrel to cope with the abundance of wedge-tailed shearwater when foraging in oligotrophic tropical waters. Sci. Rep. 10, 1–18. doi: 10.1038/s41598-020-72206-0
R Core Team (2020). R: a language and environment for statistical computing (Vienna, Austria: R Foundation for Statistical Computing). Available at: https://www.r-project.org/.
Schreiber E. A. (2002). “Climate and weather effects on seabirds,” in Biology of marine birds. Eds. Schreiber E. A., Burger J. (Boca Raton, FL: CRC Press), 179–215.
Schuelke M. (2000). An economic method for the fluorescent labeling of PCR fragments. Nat. Biotechnol. 18, 233–234. doi: 10.1038/72708
Signorini S. R., Franz B. A., McClain C. R. (2015). Chlorophyll variability in the oligotrophic gyres: mechanisms, seasonality and trends. Front. Mar. Sci. 2, 1. doi: 10.3389/fmars.2015.00001
Sonsthagen S. A., Wilson R. E., Chesser R. T., Pons J. M., Crochet P. A., Driskell A., et al. (2016). Recurrent hybridisation and recent origin obscure phylogenetic relationships within the 'white-headed'gull (Larus sp.) complex. Mol. Phylogenet. Evol. 103, 41–54. doi: 10.1016/j.ympev.2016.06.008
Steadman D. W. (1989). Extinction of birds in eastern Polynesia: a review of the record, and comparisons with other Pacific Island groups. J. Archaeological Sci. 16, 177–205. doi: 10.1016/0305-4403(89)90065-4
Steadman D. W. (1995). Prehistoric extinctions of Pacific Island birds: biodiversity meets zooarchaeology. Science 267, 1123–1131. doi: 10.1126/science.267.5201.1123
Steadman D. W. (2006). Extinction and biogeography of tropical Pacific birds (University of Chicago Press, Chicago 60637).
Sternkopf V., Liebers-Helbig D., Ritz M. S., Zhang J., Helbig A. J., de Knijff P. (2010). Introgressive hybridisation and the evolutionary history of the herring gull complex revealed by mitochondrial and nuclear DNA. BMC Evolutionary Biol. 10, 1–18. doi: 10.1186/1471-2148-10-348
Teske P. R., Golla T. R., Sandoval-Castillo J., Emami-Khoyi1 A., van der Lingen C. D., von der Heyden S., et al. (2018). Mitochondrial DNA is unsuitable to test for isolation by distance. Sci. Rep. 8, 1–9. doi: 10.1038/s41598-018-25138-9
Venables W. N., Ripley B. D. (2002). Modern applied statistics with s. 4th ed. (New York: Springer), ISBN: ISBN 0-387-95457-0.
Weimerskirch H., Louzao M., De Grissac S., Delord K. (2012). Changes in wind pattern alter albatross distribution and life-history traits. Science 335, 211–214. doi: 10.1126/science.1210270
Weir B. S., Cockerham C. C. (1984). Estimating f-statistics for the analysis of population structure. Evolution 38, 1358–1370. doi: 10.2307/2408641
West J. A., Nilsson R. J. (1994). Habitat use and burrow densities of burrow nesting seabirds on South East island, chatham islands, New Zealand. Notornis 41, 27–37.
Whittaker R. H. (1960). Vegetation of the siskiyou mountains, Oregon and California. Ecol. Monographs. 30, 279–338. doi: 10.2307/1943563
Wood J. R., Lawrence H. A., Scofield R. P., Taylor G. A., Lyver P. O. B., Gleeson D. M. (2016). Morphological, behavioural, and genetic evidence supports reinstatement of full species status for the grey-faced petrel, Pterodroma macroptera gouldi (Procellariiformes: procellariidae). Zoological J. Linn. Soc. 179, 201–216. doi: 10.1111/zoj.12432
Young H. S., McCauley D. J., Dirzo R., Dunbar R. B., Shaffer S. A. (2010a). Niche partitioning among and within sympatric tropical seabirds revealed by stable isotope analysis. Mar. Ecol. Prog. Ser. 416, 285–294. doi: 10.3354/meps08756
Young H. S., Shaffer S. A., McCauley D. J., Foley D. G., Dirzo R., Block B. A. (2010b). Resource partitioning by species but not sex in sympatric boobies in the central Pacific Ocean. Mar. Ecol. Prog. Ser. 403, 291–301. doi: 10.3354/meps08478
Zapata-Hernández G., Sellanes J., Mayr C., Muñoz P. (2014). Benthic food web structure in the comau fjord, Chile (∼ 42° s): preliminary assessment including a site with chemosynthetic activity. Prog. Oceanogr. 129, 149–158. doi: 10.1016/j.pocean.2014.03.005
Keywords: taxonomy, hybridisation, seabirds, recolonisation, island speciation, reproductive isolation
Citation: Plaza P, Cristofari R, Gouin N, Soto-Gamboa M and Luna-Jorquera G (2023) A melting-pot for Pterodroma petrels on Rapa Nui: ecological divergence and reproductive isolation in a contact zone. Front. Ecol. Evol. 11:1123288. doi: 10.3389/fevo.2023.1123288
Received: 13 December 2022; Accepted: 28 June 2023;
Published: 27 July 2023.
Edited by:
Dennis Murray, Trent University, CanadaCopyright © 2023 Plaza, Cristofari, Gouin, Soto-Gamboa and Luna-Jorquera. This is an open-access article distributed under the terms of the Creative Commons Attribution License (CC BY). The use, distribution or reproduction in other forums is permitted, provided the original author(s) and the copyright owner(s) are credited and that the original publication in this journal is cited, in accordance with accepted academic practice. No use, distribution or reproduction is permitted which does not comply with these terms.
*Correspondence: Guillermo Luna-Jorquera, Z2x1bmFAdWNuLmNs
†These authors have contributed equally to this work