 Liang Liu
 Lili Yu
 Shaoyuan Wu
 Jonathan Arnold4
 Charles Davis
 Scott Edwards
- 1Department of Statistics and Institute of Bioinformatics, University of Georgia, Athens, GA, United States
- 2Department of Biostatistics, Georgia Southern University, Statesboro, GA, United States
- 3Jiangsu Key Laboratory of Phylogenomics and Comparative Genomics, Jiangsu International Joint Center of Genomics, School of Life Sciences, Jiangsu Normal University, Xuzhou, Jiangsu, China
- 4Department of Genetics, University of Georgia, Athens, GA, United States
- 5Department of Epidemiology and Biostatistics, College of Public Health, University of Georgia, Athens, GA, United States
- 6Department of Organismic and Evolutionary Biology, Harvard University, Cambridge, MA, United States
Accurate reconstruction of species trees often relies on the quality of input gene trees estimated from molecular sequences. Previous studies suggested that if the sequence length is fixed, the maximum likelihood may produce biased gene trees which subsequently mislead inference of species trees. Two key questions need to be answered in this context: what are the scenarios that may result in consistently biased gene trees? and for those scenarios, are there any remedies that may remove or at least reduce the misleading effects of consistently biased gene trees? In this article, we establish a theoretical framework to address these questions. Considering a scenario where the true gene tree is a 4-taxon star tree
1. Introduction
Coalescent-based approaches have been shown to be statistically consistent in estimating species trees as the number of loci and the sequence length increase to infinity (Felsenstein, 2006; Liu et al., 2010). However, short sequences are commonly observed in the coding and non-coding regions across species in the Tree of Life, necessitating an assessment of coalescent approaches in the context of finite sequence lengths. Previous studies (Roch and Warnow, 2015; Roch et al., 2019) showed that molecular sequences with a fixed length can mislead coalescent methods to estimate an incorrect species tree even if the number of loci increases to infinity. The failure of coalescent methods in this case is not caused by the deficiency of coalescent models (i.e., violation of the coalescent model assumptions) (Carvajal-Rodriguez et al., 2006; Adams et al., 2018; Jiang et al., 2020), but by the maximum likelihood (ML) gene trees consistently favor incorrect phylogenetic relationships of the species involved. Specifically, molecular sequences with a finite length may produce biased gene trees. These biased gene trees can subsequently mislead coalescent methods to estimate an incorrect species tree. It should be noted here that random bias in gene tree estimation does not have a major effect on species tree estimation. For instance, if some loci support incorrect relationships between two species S1 and S2, while others support incorrect relationships between other species Si and Sj, the misleading effects of biased gene trees are canceled out in estimating species trees. However, the greatest challenge in species tree inference arises if gene tree inference is consistently biased towards supporting the same or a similar set of incorrect relationships. Key questions that need to be addressed are what scenarios result in consistently biased gene trees and if any remedies can alleviate the misleading effects. These questions do not have straightforward solutions. Finding both necessary and sufficient conditions for biased gene trees is challenging, and while large gene tree estimation errors may mislead species tree estimation, coalescent methods are robust to a certain degree of gene tree errors and can still recover the true species tree (Liu et al., 2015). This article aims to establish a theoretical framework to address these questions, enabling the identification of problematic scenarios in real-world data analysis and providing potential solutions to these issues.
Genes with minimal phylogenetic information can substantially increase gene tree estimation error, which may reduce the accuracy of species tree inference (Xi et al., 2015). Similar consequences involving minimal phylogenetic information have been observed for another well-documented phenomena long branch attraction (LBA) (Felsenstein, 1978), which can mislead phylogenetic tree inference as well. LBA occurs when two long terminal branches are separated by a short internal branch in a phylogenetic tree, another example of lack of phylogenetic signals causing systematic errors in estimating phylogenetic trees. Long branch artefacts have historically been seen as a major problem for parsimony-based inference, but maximum likelihood and Bayesian approaches can also be susceptible to these issues (Martyn and Steel, 2012; Su and Townsend, 2015; Susko, 2015). Current theories on LBA have identified branch length conditions that lead to inconsistent inferences when using maximum parsimony (Hendy and Penny, 1989; Kim, 1996). Moreover, Townsend et al. (2012) proposed a “signal and noise” framework that uses substitution rates to estimate the ability of molecular sequences to resolve a four-taxon tree with equally-subtending branch lengths. This framework can be generalized to account for LBA bias resulting from asymmetric topologies or unequal evolution rates and can identify branch length conditions where phylogenetic inference is inconsistent for these types of phylogenies (Su and Townsend, 2015). Nevertheless, these theories originated within the framework of conventional phylogenetic models (Felsenstein, 1981). However, when it comes to the multispecies coalescent model (Rannala and Yang, 2003), there is a scarcity of theories addressing the specific conditions of branch lengths that can mislead species tree estimation. A review of the evidence on the impact of missing data on species tree estimation indicates that missing data can bias both gene tree and species tree estimation (Xi et al., 2016). The estimation problems induced by minimal phylogenetic signal can be alleviated by sampling more informative gene sequences. More severe challenges arise, however, when gene tree estimation is biased and cannot be remedied by increasing the sequence length or the number of loci (Xi et al., 2015).
Owing to its asymptotic properties (i.e., consistency, asymptotic unbiasedness, asymptotic efficiency, etc.), ML is among the most popular methods for building phylogenetic trees from molecular sequence data. It is well known that maximum likelihood estimates (MLE) are often biased if the sample size is finite (Mardia et al., 1999). Given a set of identically and independently distributed random variables generated from the normal distribution with mean and variance , the MLE of the variance is . As , the MLE underestimates the variance . Biasness is a good measure of an estimator’s performance in a finite sample size. A continuous estimator of the parameter is said to be unbiased if its expectation is equal to the parameter value, i.e., . Since the tree topology is a discrete random variable, the ML tree is defined as an unbiased estimator of the true tree if the most probably ML tree is the true tree , i.e., for any . In contrast to previous studies (Su and Townsend, 2015) that employed predicted utility to identify branch length conditions in which ML methods fail to recover the true phylogenetic tree, this study takes a different approach to investigate the statistical properties, specifically the bias, of ML phylogenetic trees. In this paper, we can show that under certain conditions ML trees are biased estimators of the underlying phylogenetic trees (i.e., gene trees and species trees) if the sequence length is finite. The proof begins with a scenario where the true gene tree is a 4-taxon star tree with two short branches leading to species S1 and S2. In this case, ML significantly favors the wrong bifurcating tree ((S1, S2), S3, S4) grouping the two species S1 and S2 with short branches, which is called short branch attraction (SBA). SBA may also occur in a 4-taxon bifurcating gene tree with a short internal branch. If no mutation occurs in the internal branch, which is quite likely if the internal branch is short, the 4-taxon bifurcating tree is equivalent to the 4-taxon star tree and thus it suffers the same misleading effect of short branch attraction. Similarly, if the true species tree is a 4-taxon star tree with two short branches leading to the species S1 and S2, most gene trees generated from this species tree are the 4-taxon bifurcating trees with a short internal branch. Due to SBA, the ML gene trees consistently favor the wrong tree [(S1, S2), S3, S4] across genes, which subsequently mislead the coalescent methods (Liu and Yu, 2011; Mirarab and Warnow, 2015) to estimate the wrong species tree ((S1, S2), S3, S4). Our findings indicate that a phylogenetic tree may exhibit the short branch artifact when a quartet within the tree consists of a short internal branch and four unequal external branches. As such, the phenomenon known as long branch attraction, which is characterized by a short internal branch and dissimilar external branches, represents a specific instance of the aforementioned artifact. This study presents a comprehensive analytical framework for examining the impact of branch length heterogeneity on the inference of gene and species trees using finite sequence lengths.
2. Results
2.1. Biased maximum likelihood estimates of phylogenetic trees
The MLEs of phylogenetic trees have been shown to be statistically consistent as the sequence length goes to infinity (Rogers, 1997), i.e., as , where is the MLE of the phylogenetic tree . If the sequence length is finite, ML methods may produce a biased estimate of the phylogenetic tree . Consider a 4-taxon tree with an internal branch of length and four terminal branches of lengths in mutation units (i.e., the branch length represents the number of mutations per site). Without loss of generality, we assume that . Let be the DNA alignment of length generated from the 4-taxon tree. In this paper, the Jukes-Cantor substitution model (Jukes and Cantor, 1969) is adopted for modeling the evolution of a single nucleotide. Under the Jukes-Cantor model, there are 15 site patterns with distinct probabilities – a pattern for 4 identical nucleotides, seven patterns , , , , , , for two different nucleotides, six patterns , , , , , for three different nucleotides, and a single pattern for four different nucleotides. Let be the frequencies of 15 site patterns in the sequence alignment . The frequencies follow the multinomial distribution with the probabilities of 15 site patterns, subject to a constraint , i.e.,
The probabilities of 15 site patterns are functions of the true 4-taxon tree and branch lengths . The probability of the alignment D is equal to the probability of frequencies , i.e., . If the sequence length is , the number of different alignments is . For simplicity, we assume that the MLE is unique. Then the ML tree can be obtained from each of the alignments. Let , , and be the three (unrooted) ML trees estimated from the sequence alignment D. The probability that the MLE is equal to the tree is given by
Here ’s are the alignments from which the MLE tree is . The MLE is said to be biased if the most probable ML tree is not the true tree , i.e., for some .
2.1.1. Short branch attraction In gene trees
In this section, we analyze three distinct scenarios (4-taxon star trees, 4-taxon bifurcating trees, and -taxon trees) for gene trees. We show that the SBA artifact can mislead the ML estimation of gene trees in these scenarios.
2.1.1.1. Scenario 1: 4-taxon star trees
We first consider a 4-taxon star tree where the four species diverged from the same ancestral node (Figure 1A). Let W, X, Y, Z be the nucleotides of the species in a single site of the DNA alignment . Let H be the nucleotide at the internal node of the star tree . Given the nucleotide H, the probability of nucleotides W, X, Y, Z is the multiplication of the probabilities of four terminal branches, i.e.,
In (3), is the probability that the nucleotide H changes to the nucleotide W after time . Because for , the probability of a single site for a star tree is given by
Additionally, there are 12 out of 15 nucleotide patterns that produce an unresolved ML tree (a star tree, i.e., ). The remaining three patterns ( lead to a bifurcating ML tree. If the sequence length , it follows from equation (2) that the probability that the MLE is a star tree is equal to the sum of the probabilities of the 12 site patterns, and the probability that the MLE is a bifurcating tree, which is the true tree , is given by . Because (Supplementary Appendix A1), the probability that the MLE is the true star tree is greater than the probability that the MLE is not the true star tree . Thus, the ML tree is an unbiased estimator of the 4-taxon star tree . In real data analysis, most phylogenetic programs, for example RAxML (Stamatakis et al., 2005) and PHYML (Guindon et al., 2010), are forced to produce bifurcating trees. Therefore, we here only consider the site patterns that can produce a bifurcating tree. The probability of is given by
The probability of is given by
Similarly, the probability of is given by
If , then . The ML tree is an unbiased estimator of the 4-taxon star tree if . If the sequence length , the probability is equal to the probability , and , and . Thus, the ML tree is an unbiased estimator if the 4-taxon star tree has equal branch lengths . If the branch lengths are not equal, for example, , then . It follows that and . Thus, the ML tree is a biased estimator of the 4-taxon star tree with unequal branch lengths. Moreover, the ML tree favors the tree which groups the lineages of S1 and S2 with short branches and . We call this phenomenon short branch attraction (SBA).
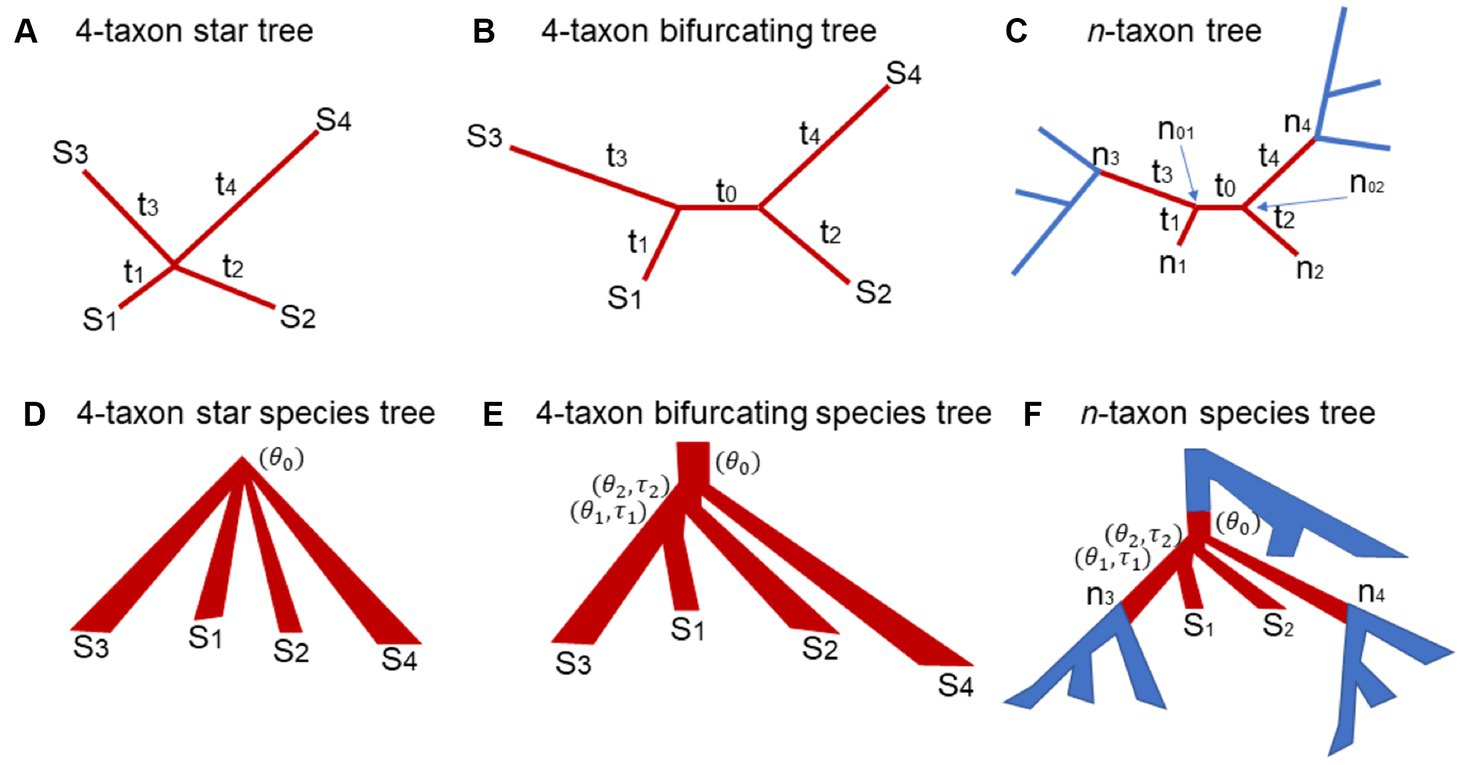
Figure 1. The 4-taxon gene trees and species trees used in the theoretical proof and simulation. (A) 4-taxon star tree: are the lengths of the four terminal branches leading to the species S1, S2, S3, and S4. (B) 4-taxon bifurcating tree: is the length of the internal branch and are the lengths of the four terminal branches leading to the species S1, S2, S3, and S4. (C) n-taxon bifurcating tree: the 4-taxon subtree is highlighted in red. The subtree has two internal nodes and and are the branch lengths of the subtree. (D) 4-taxon star species tree: is the population size parameter in the root population. (E) 4-taxon bifurcating species tree: is the population size parameter in the root population. and are the population size parameter and the branch length of the ancestral population of the species S1 and S2, while and are the population size parameter and the branch length of the ancestral population of the species S1, S2, and S3. (F) n-taxon species tree: the 4-taxon subtree is highlighted in red.
If the sequence length is large, there is at least one site with the pattern , , or in the sequence alignment D. As a result, ML methods would consistently produce a bifurcating tree as the estimate of the 4-taxon star tree . Let . The probability that the sequence alignment of length consists of at least one site with the patterns , , and is , which converges to 1.0 as goes to infinity. Note that the probability that the counts of three patterns are equal, the case that ML methods estimate a star tree, converges to 0 as . It indicates that the MLE converges to a bifurcating tree as the sequence length goes to infinity. Thus, is a biased estimator of the star tree if the sequence length is large. Moreover, ML methods favor the tree over the other two trees and if the count of the pattern outnumbers the counts of the patterns and , or equivalently, and . It can be shown that if , then and (Supplementary Appendix A2). This result indicates that the MLE of the 4-taxon star tree is biased toward the bifurcating tree which groups the lineages of S1 and S2 due to SBA. The probability , or equivalently the biasness of , increases as the branch lengths and decrease and/or and increase.
2.1.1.2. Scenario 2: 4-taxon bifurcating trees
In this section, the true tree is assumed to be a 4-taxon bifurcating tree with an internal branch (length = ) and four terminal branches (length = ) (Figure 1B). To calculate the probabilities of 15 site patterns, we consider two scenarios – the nucleotides and at two internal nodes and are identical or distinct. Under the Jukes-Cantor model, the probability of two identical nucleotides is , while the probability of two distinct nucleotides is . If the nucleotides and at two internal nodes are identical, the probability of a site pattern coincides with that for a star tree described in equation (3),
If two nucleotides and are distinct, the probability of the site pattern is given by
The probability of the site pattern is equal to the weighted sum of the two probabilities in equations (7) and (8), i.e.,
As , and . The probability of the site pattern converges to the probability derived from 4-taxon star trees. Thus, when the internal branch length is small, according to the theory derived for 4-taxon star trees in the previous section, the ML tree is a biased estimator of , favoring the wrong tree due to SBA. As , and , and the probability of the site pattern converges to the probability . Moreover, if the nucleotides at two internal nodes are distinct, the probability of the site pattern is great than the probability and the probability (Supplementary Appendix A3). It indicates that the site patterns generated from always support the true tree (Figure 1B). Thus, as the internal branch length , the MLE becomes an unbiased estimator of .
2.1.1.3. Scenario 3: generalization to the trees of more than 4 taxa
Let be an n-taxon (n > 4) bifurcating tree (Figure 1C). Let and be the two nodes at the two ends of an internal branch of . Because is a bifurcating tree, each of the two internal nodes and is also associated with two other nodes (Figure 1C). Let and be the two nodes associated with . Let and be the two nodes associated with (Figure 1C). The nodes and are terminal nodes, while the nodes and could be the terminal or internal nodes in the n-taxon tree . The six nodes along with the five branches connecting them form a 4-taxon subtree (i.e., the subtree in brown, Figure 1C), where is the “internal” branch of length and the remaining four are “terminal” branches of length . The theory derived for Scenario 1 and 2 indicates that there are 15 patterns with distinct probabilities for the nucleotides at the four “terminal” nodes . Here, we ask the same question: what are the probabilities of the 15 site patterns? Firstly, those probabilities do not depend on the other parts of the n-taxon tree (i.e., the blue subtrees in Figure 1C). Secondly, if the assumed substitution model is time reversible – in fact, most substitution models are time reversible, then the theory derived in Scenario 2 can be applied to computing the probabilities of 15 site patterns for this 4-taxon subtree . Specifically, the probability of the site pattern is equal to the sum of the probabilities of the site pattern when the nucleotides and at two internal nodes and are identical or distinct as described in equation (9). Finally, according to the theory derived for Scenario 2, if the internal branch length is small (i.e., ), the ML tree is a biased estimator of , favoring the wrong tree due to SBA. However, because the nucleotides at the nodes are not observable, it is difficult to formally prove that the ML tree is a biased estimator of when is small and the branch lengths and are much less than the branch lengths and . Instead, the biased MLE of the subtree will be illustrated by simulation.
2.1.2. Short branch attraction in species trees
In this section, we analyze three distinct scenarios (4-taxon star trees, 4-taxon bifurcating trees, and n-taxon trees) for species trees. We demonstrate that the short branch attraction artifact has the potential to lead to erroneous species tree estimation in these scenarios.
2.1.2.1. Scenario 1: 4-taxon star species trees
Let be a 4-taxon star species tree with unequal branch lengths (Figure 1D). Let be the population size parameter of the ancestral population at the root of the species tree . It is assumed that a single allele is sampled from each species. The gene tree generated from this star species tree under the multispecies coalescent model is a 4-taxon bifurcating tree with unequal branch lengths. Under the coalescent model, the three unrooted gene trees T1 = ((S1, S2), S3, S4), T2 = ((S1, S3), S2, S4), and T3 = ((S1, S4), S2, S3) have the same probability . Let be the length of the internal branch of . It follows from the coalescent theory that the internal branch length has the exponential distribution with mean . When is small (i.e., ), most gene trees generated from the star species tree have a short internal branch and four terminal branches whose lengths tend to be in the same order as those in the species tree . Due to SBA, the MLEs of such 4-taxon gene trees support the tree T1 = ((S1, S2), S3, S4) with a probability , which significantly deviates from the true probability distribution of the gene trees derived from the species tree under the multispecies coalescent model. As a result, the biased gene trees mislead the coalescent methods to consistently estimate the wrong species tree ((S1, S2), S3, S4) as the number of gene trees goes to infinity. Thus, SBA occurs in the 4-taxon star species trees.
2.1.2.2. Scenario 2: 4-taxon bifurcating species trees
Consider a 4-taxon bifurcating species tree (Figure 1E). Let and be the branch lengths and and be the population size parameters of two internal branches (Figure 1E). The probability that two alleles from species S1 and S2 do not coalesce in their most recent common ancestral population (MRCA) is . The probability that three alleles from species S1, S2, and S3 do not coalesce in their MRCA is . The probability that the four alleles coalesce in the root population is equal to the probability that two alleles from species S1 and S2 do not coalesce in their MRCA multiplied by the probability that three alleles from species S1, S2, and S3 do not coalesce in their MRCA, i.e., . If two ratios and are small (i.e., and are large, or and are small), the four alleles from species S1, S2, S3, and S4 have a high probability of coalescing in the root population, a case described in Scenario 1: 4-taxon star species trees for which the coalescent methods consistently estimate the wrong species tree ((S1, S2), S3, S4). Thus, SBA occurs in the 4-taxon bifurcating species trees if the population size parameters and of the two ancestral populations are large, or the branch length and are small.
2.1.2.3. Scenario 3: n-taxon bifurcating species trees
Let be the 4-taxon subtree (i.e., the subtree in red, Figure 1F) of an n-taxon (n > 4) bifurcating species tree . Let be the four terminal nodes of (Figure 1F). Note that the nodes and are internal nodes, while the nodes and are two terminal nodes in the n-taxon species tree . It is assumed that one allele is sampled from each species. If all genealogical lineages coalesce in the blue subtrees below the nodes (Figure 1F), then only one lineage enters each of the nodes . In this case, the coalescence process occurring in the subtree is the same process as that occurs in the 4-taxon species tree described in the previous section Scenario 2: 4-taxon bifurcating species trees. Thus, SBA may occur in the 4-taxon subtree of an n-taxon species tree if the population size parameter in the root population is small, and the population size parameters and of the two ancestral populations are large, or the branch length and are small. If multiple lineages enter the nodes , the gene tree lineages generated from the subtree involve more than 4 taxa. Although SBA may still occur in the n-taxon gene trees (see Scenario 3: Generalization to the trees of more than 4 taxa) which can subsequently mislead the coalescent methods to estimate the wrong species tree, it is difficult to formally prove that SBA can occur in the n-taxon species trees. Instead, we will use simulation to illustrate SBA in the species trees of more than 4 species.
2.2. Simulation study
2.2.1. The algorithmic bias of PhyML and RAxML
This section is to assess the algorithmic bias of two popular phylogenetic programs, PhyML and RAxML, in building the ML trees from sequence alignments. Later, when we use simulation to illustrate that ML trees are biased estimators, we need to show that the level of the biasness of ML trees exceeds what the algorithmic bias can explain, i.e., the biasness of ML trees is due to model or data deficiencies rather than some unnoticed “bugs” in the computational algorithms implemented in PhyML and RAxML.
2.2.1.1. Scenario 1: identical sequences
If DNA sequences are identical across four species , phylogenetic programs are expected to estimate three bifurcating trees ((S1, S2), S3, S4), ((S1, S3), S2, S4), and ((S1, S4), S2, S3) with equal probabilities . Deviation from this uniform probability distribution indicates an algorithmic bias in phylogenetic programs. Here, we consider two popular maximum likelihood (ML) phylogenetic programs PhyML and RAxML. Identical sequences of 1,000 base pairs (bps) were generated for species . Surprisingly, 100% of the ML trees estimated from identical sequences by PhyML are ((S1, S2), S3, S4) (Figure 2A), which is consistent with the previous results that PhyML tends to infer one particular bifurcating topology even though the true relationship is a polytomy (Xi et al., 2015). By contrast, the proportions of three ML trees reconstructed by RAxML are close to the expected probabilities . For the replicates of 100, 500, and 1,000 trees, the proportion of ((S1, S2), S3, S4) estimated by RAxML is 0.53, 0.48, 0.5, respectively (Figure 2A), which is significantly higher than the expected probability .
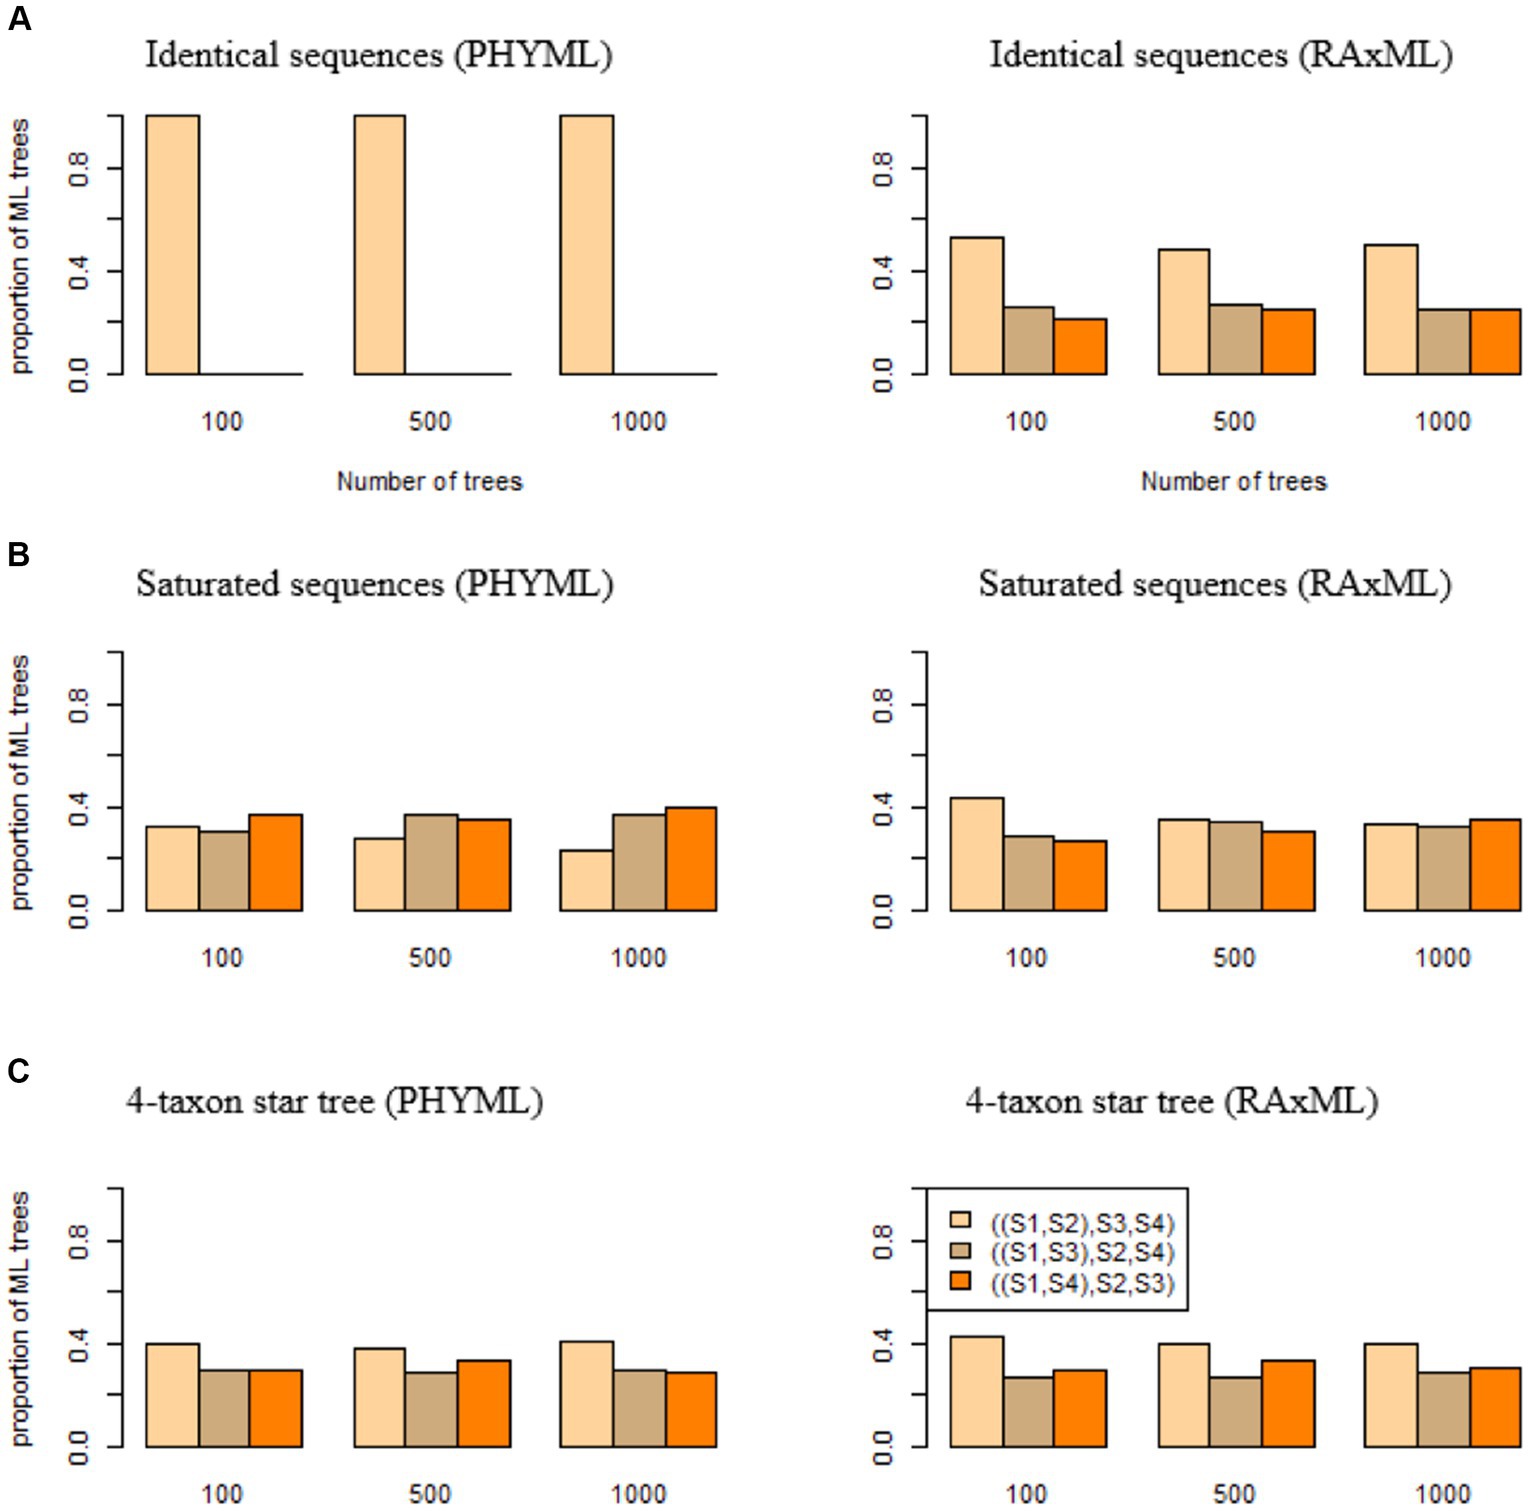
Figure 2. The algorithmic bias of PhyML and RAxML. ML trees were built by PhyML (left panel) and RAxML (right panel) for (A) identical sequences, (B) saturated sequences, and (C) sequences generated from a 4-taxon star tree (S1:0.01, S2:0.01, S3:0.01, S4:0.01). The proportions of three ML trees ((S1, S2), S3, S4), ((S1, S3), S2, S4), and ((S1, S4), S2, S3) were calculated and compared with the expected proportions (1/3, 1/3, 1/3) if two phylogenetic programs PhyML and RAxML do not have an algorithmic bias.
2.2.1.2. Scenario 2: saturated sequences
DNA sequences are saturated if the nucleotides in the sequences are identically and independently distributed among species with the limiting probability distribution derived from the substitution model. Saturated sequences may arise when a phylogenetic tree has long terminal branches. If sequences are saturated across species , phylogenetic programs are expected to produce three bifurcating trees ((S1, S2), S3, S4), ((S1, S3), S2, S4), and ((S1, S4), S2, S3) with equal probability . Saturated sequences of 1,000 bps were simulated for species and then used to build phylogenetic trees. The results indicate that an algorithmic bias of PhyML and RAxML for saturated sequences is less severe than that for identical sequences (Figure 2B). PhyML appears to favor the tree ((S1, S4), S2, S3), as 40% of the ML trees reconstructed by PhyML are ((S1, S4), S2, S3) (Figure 2B), which is significantly higher than the expected proportion 1/3. By contrast, RAxML appears to favor the tree ((S1, S2), S3, S4) when the number of trees is 100 or 500, but the proportion of ((S1, S2), S3, S4) is 0.33 when the number of trees is 1,000 (Figure 2B), which is not significantly different from the expected proportion 1/3.
2.2.1.3. Scenario 3: sequences from a 4-taxon star tree
Identical or saturated sequences are not frequently observed in real sequence data. Here, we consider a more realistic scenario where the true phylogenetic tree is a 4-taxon star tree. In this simulation, DNA sequences were generated from the tree (S1:0.01, S2:0.01, S3:0.01, S4:0.01) with equal branch lengths of 0.01. When the true tree is a polytomy tree, three ML trees ((S1, S2), S3, S4), ((S1, S3), S2, S4), and ((S1, S4), S2, S3) are expected to be uniformly distributed with equal probabilities (1/3, 1/3, 1/3). Deviation from this uniform distribution indicates an algorithmic bias of PhyML and RAxML. The simulation results suggest that both PhyML and RAxML favor the tree ((S1, S2), S3, S4). When the number of trees is 1,000, the proportion of the tree ((S1, S2), S3, S4) estimated by PhyML and RAxML is 0.41 and 0.4, respectively (Figure 2C), significantly higher than the expected proportion 1/3.
The three simulations (identical sequences, saturated sequences, and 4-taxon star tree) indicate that both programs (PHYML and RAxML) suffer an algorithmic bias, but the algorithmic bias of PHYML appears to be more severe than that of RAxML. Therefore, we will use RAxML to build ML trees in the subsequent analyses.
2.2.2. Short branch attraction in gene trees
2.2.2.1. Scenario 1: 4-taxon star trees with unequal branch lengths
According to the theory we developed above, the MLE of a 4-taxon star tree with unequal branch lengths favors a bifurcating tree in which two lineages with short branches are grouped together. Here, we use simulation to demonstrate the biasness of ML methods in estimating 4-taxon star trees with unequal branch lengths. In this simulation, the 4-taxon star tree (S1:0.0001, S2: 0.01, S3: 0.0001, S4: 0.01) has two short branches of length 0.0001 leading to species and . DNA sequences were simulated from this 4-taxon star tree and then used to build ML trees by RAxML. The simulation was repeated 100 times and we calculated the proportions of three ML trees ((S1, S2), S3, S4), ((S1, S3), S2, S4), and ((S1, S4), S2, S3). As expected, more than 90% of the ML trees are ((S1, S3), S2, S4) (Figure 3A). When the true species tree is (S1:0.1, S2: 0.01, S3: 0.1, S4: 0.01) in which the length of two short terminal branches increases from 0.0001 to 0.1, most of the ML trees are still ((S1, S3), S2, S4), but the probability of the most probable ML tree drops from 0.91 to 0.74 for sequence length = 100 bps (Figure 3B). As the sequence length increases, the probability drops from 0.75 to 0.45 (Figure 3B).
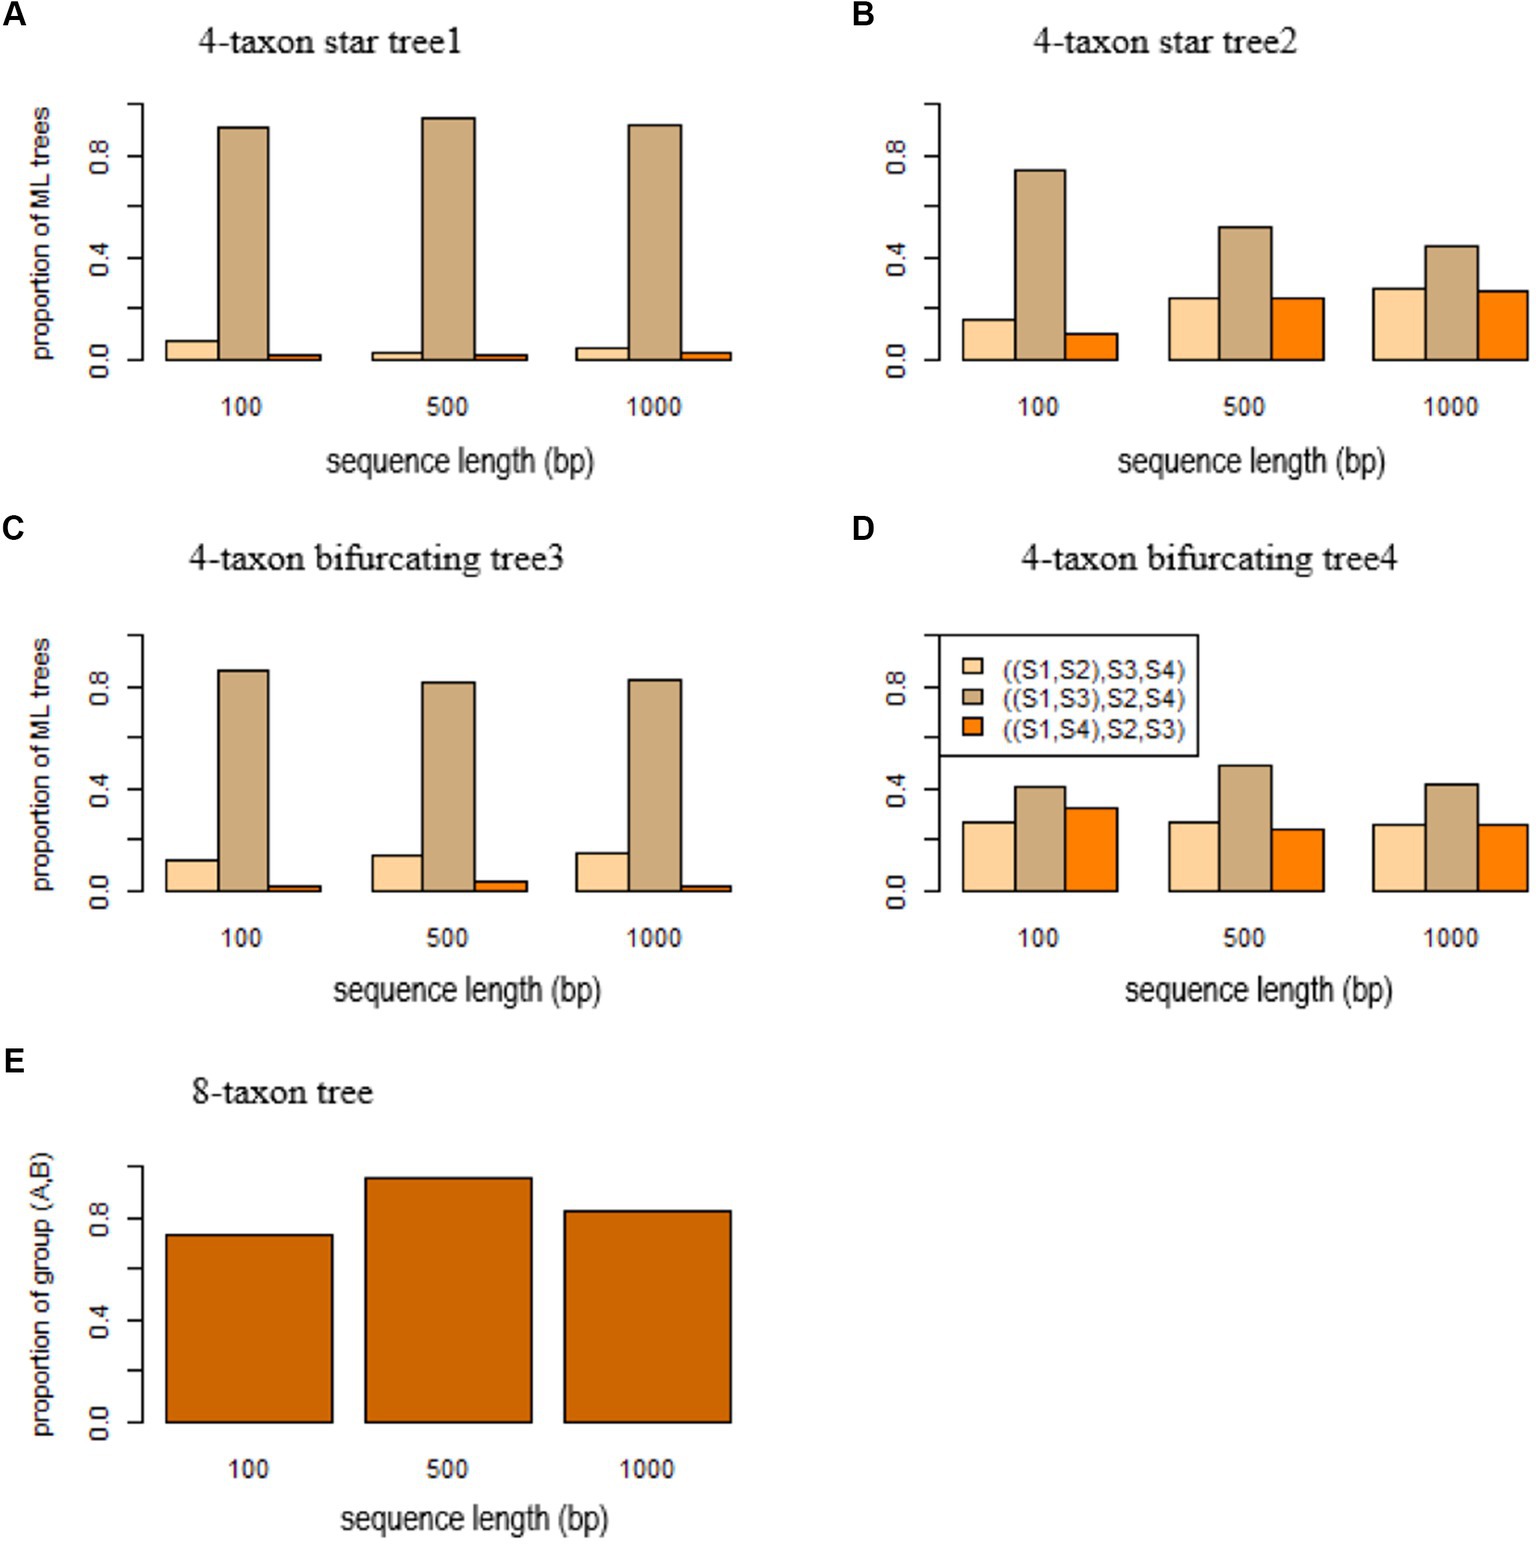
Figure 3. Short branch attraction in gene trees. ML trees were built by RAxML for the sequences simulated from (A) the 4-taxon star tree1 (S1:0.0001, S2:0.01, S3:0.0001, S4:0.01), (B) the 4-taxon tree2 (S1:0.1, S2:0.01, S3:0.1, S4:0.01), (C) the 4-taxon bifurcating tree3 ((S1:0.0001, S2:0.01):0.0001, S3:0.0001, S4:0.01), (D) the 4-taxon bifurcating tree4 ((S1:0.1, S2:0.01):0.0001, S3:0.1, S4:0.01), and (E) the 8-taxon tree (A: 0.0001, ((S1: 0.01, S2: 0.01): 0.01, S3: 0.01): 0.01: 0.0001, B: 0.0001, ((S4: 0.01, S5: 0.01): 0.01, S6: 0.01): 0.01) with two short branches (length = 0.0001) leading to the species A and B. The y-axis in (A–D) is the proportion of three ML trees ((S1, S2), S3, S4), ((S1, S3), S2, S4), and ((S1, S4), S2, S3), while the y-axis in (E) is the proportion of ML trees with the group (A,C). The x-axis is the sequence length 100, 500, and 1,000 bp.
2.2.2.2. Scenario 2: 4-taxon bifurcating trees with unequal branch lengths
Likewise, SBA occurs in the 4-taxon bifurcating trees, misleading ML methods to produce the wrong tree estimates. To assess the effects of SBA in gene trees, DNA sequences of 100, 500, and 1,000 bps were simulated from a 4-taxon bifurcating tree ((S1: 0.0001, S2: 0.01): 0.0001, S3: 0.0001, S4: 0.01). Because the terminal branches leading to the species and are short, the sequences of species and generated from this tree are almost identical to each other. As a result, the ML methods group the species S1 and S3 and estimate the wrong tree ((S1, S3), S2, S4) (Figure 3C). The simulation results suggest that 80% of the ML trees reconstructed by RAxML are the tree ((S1, S3), S2, S4) (Figure 3C). When the true species tree is ((S1: 0.1, S2: 0.01): 0.0001, S3: 0.1, S4: 0.01) in which the length of two short terminal branches increases from 0.0001 to 0.1, most of the ML trees are still ((S1, S3), S2, S4), but the probability of the most probable ML tree drops from 0.86 to 0.41 for sequence length = 100 bps (Figure 3D). As the sequence length increases, the probability increases from 0.41 for sequence length = 100 bps to 0.49 for 500 bps and 0.42 for 1,000 bps (Figure 3D).
2.2.2.3. Scenario 3: SBA in n-taxon trees
DNA sequences were simulated from the 8-taxon tree ((A: 0.0001, ((S1: 0.01, S2: 0.01): 0.01, S3: 0.01): 0.01): 0.0001, B: 0.0001, ((S4: 0.01, S5: 0.01): 0.01, S6: 0.01): 0.01) with two short branches (length = 0.0001) leading to the species A and B. The species A and B are placed in two monophyletic clades – (A, S1, S2, S3) and (B, S4, S5, S6) of the 8-taxon tree. However, when the sequence length is 100 bps, the species A and B are mistakenly grouped together in 73% of the ML trees reconstructed by RAxML (Figure 3E). The percentage increases to 96 and 83%, respectively, for the sequence length = 500 and 1,000 bps (Figure 3E).
2.2.3. Short branch attraction in species trees
To investigate the effect of SBA on species tree estimation, gene trees were simulated from three species trees: a 4-taxon star species tree (S1: 0.0001, S2: 0.01, S3: 0.0001, S4: 0.01), a 4-taxon bifurcating species tree (((S1: 0.0001, S2: 0.01): 0.0001, S3: 0.0001):0.0001, S4: 0.01), and an 8-taxon species tree (((A: 0.0001, ((S1: 0.01, S2: 0.01): 0.01, S3: 0.02): 0.01): 0.0001, B: 0.0001):0.0001, ((S4: 0.01, S5: 0.01): 0.01, S6: 0.02): 0.01). The 4-taxon species trees include two short branches leading to species S1 and S2, while species A and B have a short branch in the 8-taxon species tree. Under the coalescent model, three (unrooted) gene trees ((S1, S2), S3, S4), ((S1, S3), S2, S4), and ((S1, S4), S2, S3) can be generated from the 4-taxon species tree and they are expected to have equal probabilities when the species tree is a star tree. Accordingly, if the true gene trees are given, coalescent methods are expected to estimate three (unrooted) species trees with equal probabilities . However, due to the SBA, the ML gene trees estimated from DNA sequences tend to group the species S1 and S3 across genes, resulting in a high proportion ( , 94, 93% for the sequence length 100 bp, 500 bp, and 1,000 bp, respectively, Figure 4A) of the tree ((S1, S3), S2, S4). As a result, the coalescent methods estimated the wrong species tree ((S1, S3), S2, S4). For the 4-taxon bifurcating species tree, a high proportion of the ML gene trees support the tree ((S1, S3), S2, S4) (Figure 4B). Again, the coalescent methods, misled by the biased ML gene trees, estimated the wrong species tree ((S1, S3), S2, S4). Similarly, SBA significantly biased the gene tree distribution (i.e., > 70% of the ML gene trees comprise a group (A, B)) (Figure 4C) for the 8-taxon species tree, and the coalescent methods estimated the wrong species tree containing a monophyletic group (A, B) of the species A and B.
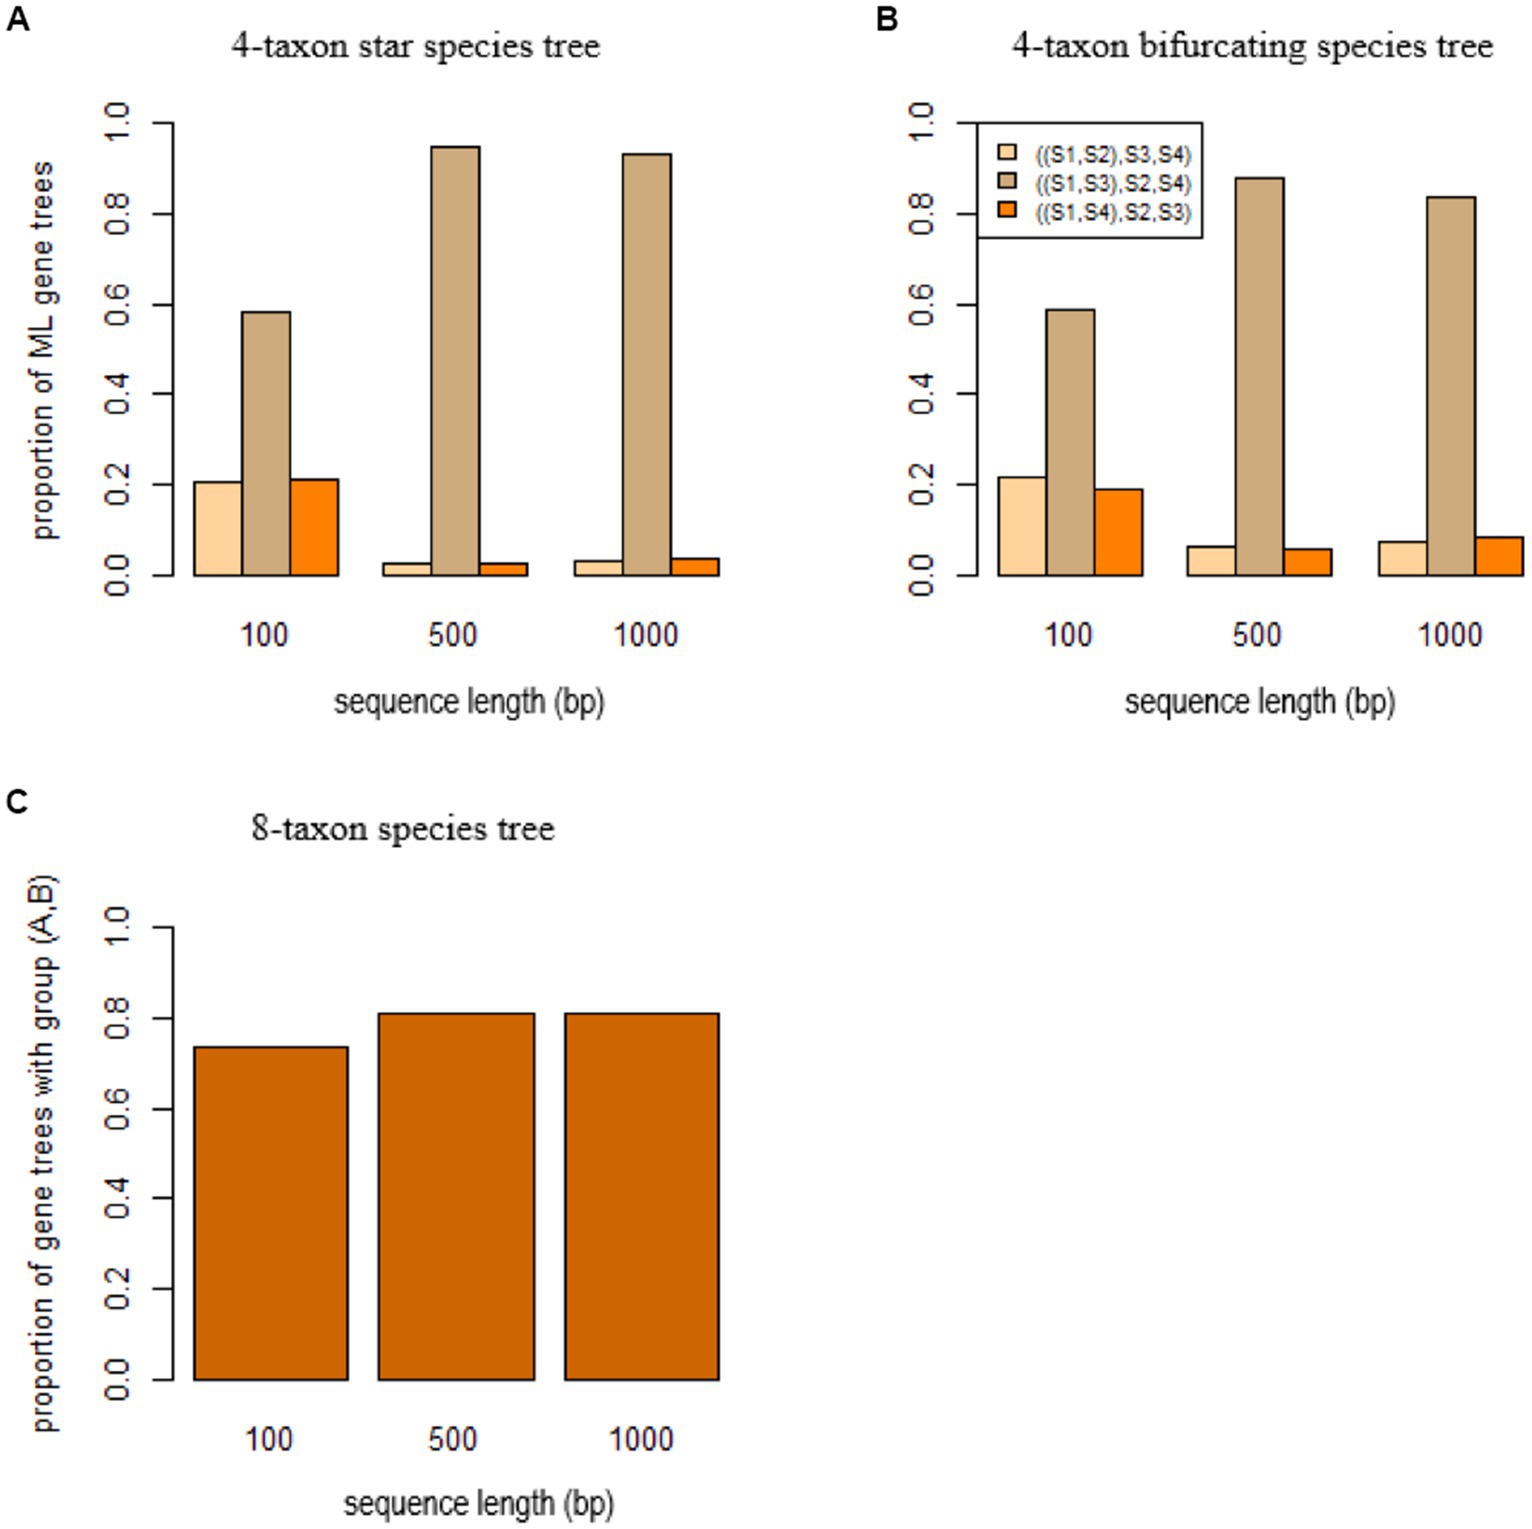
Figure 4. Short branch attraction in species trees. ML gene trees were built by RAxML for the sequences simulated from (A) the 4-taxon star species tree (S1: 0.0001, S2: 0.01, S3: 0.0001, S4: 0.01), (B) the 4-taxon bifurcating species tree (((S1: 0.0001, S2: 0.01): 0.0001, S3: 0.0001): 0.0001, S4: 0.01), and (C) the 8-taxon species tree ((A: 0.0001, ((S1: 0.01, S2: 0.01): 0.01, S3: 0.02): 0.01): 0.0001, B: 0.0001: 0.0001, ((S4: 0.01, S5: 0.01): 0.01, S6: 0.02): 0.01) with two short branches leading to the species A and B. The x-axis is the sequence length 100, 500, and 1,000 bp.
3. Materials and methods
3.1. The algorithmic bias of PhyML and RAxML
3.1.1. Scenario 1: identical sequences
A sequence of 100, 500, 1,000 nucleotides were randomly generated from the multinomial distribution with probabilities . Then, the sequence was replicated four times to generate identical sequences for species S1, S2, S3, and S4. Phylogenetic trees were estimated from four identical sequences using the phylogenetic programs PhyML and RAxML with the GTRGAMMA substitution model (Yang, 2006). Each simulation was repeated 100 times. The proportions of three bifurcating trees , , and were calculated and compared with the expected probabilities (1/3, 1/3, 1/3) using the multinomial test.
3.1.2. Scenario 2: saturated sequences
A sequence of 100, 500, 1,000 nucleotides were generated independently from the multinomial distribution with probabilities for species S1, S2, S3, and S4. Phylogenetic trees were estimated from the four saturated sequences using PhyML and RAxML with the GTRGAMMA substitution model. Each simulation was repeated 100 times. The proportions of three bifurcating trees , , and were calculated and compared with the expected probabilities (1/3, 1/3, 1/3) using the multinomial hypothesis test. To investigate the effects of missing characters on the algorithmic bias of PhyML and RAxML, 10% of the nucleotides were removed at random from the saturated sequences for species and . Then, phylogenetic trees were reconstructed and the proportions of three bifurcating trees were calculated and compared with the expected probabilities (1/3, 1/3, 1/3) using the multinomial hypothesis test.
3.1.3. Scenario 3: sequences generated from a 4-taxon star tree
DNA sequences of 100, 500, 1,000 bps were generated from a 4-taxon star tree (S1:0.01, S2: 0.01, S3: 0.01, S4: 0.01). The sequences were simulated using a phylogenetic program Seq-Gen (Rambaut and Grassly, 1997) with the substitution model GTR + GAMMA where the base frequencies were simulated from the Dirichlet distribution (1,1,1,1), and the rate parameters were simulated from the lognormal distribution (6,1,1), and the shape parameter was simulated from the normal distribution with mean 0.5 and variance 0.01. Phylogenetic trees were estimated by PhyML and RAxML with the GTRGAMMA substitution model. The PhyML command line for building ML phylogenetic trees is phyml -i input -ae -b0 -mGTR. The RAxML command line for building ML trees is raxml-HPC-SSE3 -s input -n output -mGTRGAMMA -p random_seed.
3.2. Short branch attraction in gene trees
3.2.1. Scenario 1: 4-taxon star trees with unequal branch lengths
DNA sequences of 100, 500, and 1,000 bps were generated from two 4-taxon star trees. The first star tree (S1:0.0001, S2: 0.01, S3: 0.0001, S4: 0.01) has two short branches of length 0.0001 leading to the species and . The second star tree is tree (S1:0.1, S2: 0.01, S3: 0.1, S4: 0.01) in which the length of two short branches in the first tree increases from 0.0001 to 0.1. To generate nucleotides under the GTR + GAMMA substitution model, the base frequencies were simulated from the Dirichlet distribution (1,1,1,1); the rate parameters were simulated from the lognormal distribution (6,1,1); the shape parameter was simulated from the normal distribution with mean 0.5 and variance 0.01. The ML phylogenetic trees were estimated by RAxML with the GTRGAMMA substitution model using the same command line in the previous section.
3.2.2. Scenario 2: 4-taxon bifurcating trees with unequal branch lengths
DNA sequences were generated from two 4-taxon bifurcating trees with unequal branch lengths. The first 4-taxon tree ((S1: 0.0001, S2: 0.01): 0.0001, S3: 0.0001, S4: 0.01) has a short internal branch and two short terminal branches leading to species and . The second 4-taxon bifurcating tree is ((S1: 0.1, S2: 0.01): 0.0001, S3: 0.1, S4: 0.01) in which the length of two short branches in the first 4-taxon tree increases from 0.0001 to 0.1. DNA sequences of 100, 500, and 1,000 bps were simulated under the substitution model GTR + GAMMA where the base frequencies were simulated from the Dirichlet distribution (1,1,1,1), and the rate parameters were simulated from the lognormal distribution (6,1,1), and the shape parameter was simulated from the normal distribution with mean 0.5 and variance 0.01. Phylogenetic trees were estimated by PhyML and RAxML with the substitution model GTRGAMMA substitution model.
3.2.3. Scenario 3: n-taxon trees
DNA sequences of 100, 500, and 1,000 bps were generated from an 8-taxon tree ((A: 0.0001, ((S1: 0.01, S2: 0.01): 0.01, S3: 0.01): 0.01): 0.0001, B: 0.0001, ((S4: 0.01, S5: 0.01): 0.01, S6: 0.01): 0.01). The ML trees were built by RAxML with the GTRGAMMA model. The simulation was repeated 100 times and we calculated the proportion of the ML trees containing the monophyletic group of the species A and B (the evidence for SBA in the 8-taxon tree).
3.3. Short branch attraction in species trees
DNA sequences were simulated from three non-clock species trees. The first species tree is a 4-taxon star tree (S1: 0.0001, S2: 0.01, S3: 0.0001, S4: 0.01) with two short branches (length = 0.0001) leading to the species S1 and S3. The population size parameter in the root population is set to . The second species tree is a 4-taxon bifurcating tree (((S1: 0.0001, S2: 0.01): 0.0001, S3: 0.0001):0.0001, S4: 0.01) with two short internal branches (length = 0.0001) and two short terminal branches (length = 0.0001) leading to the species and . The population size parameters for the root population and for the other two internal branches (i.e., ancestral populations). The third species tree is an 8-taxon tree (((A: 0.0001, ((S1: 0.01, S2: 0.01): 0.01, S3: 0.02): 0.01): 0.0001, B: 0.0001):0.0001, ((S4: 0.01, S5: 0.01): 0.01, S6: 0.02): 0.01) with two short branches leading to the species A and B. The population size parameters for the root population and for the other internal branches (i.e., ancestral populations) in the 8-taxon species tree. One thousand gene trees were generated from each of the three species trees under the multispecies coalescent model using an R package Phybase (Liu and Yu, 2010). Then, DNA sequences were simulated from the gene trees using the GTR + GAMMA substitution model where the base frequencies were simulated from the Dirichlet distribution (1,1,1,1), and the rate parameters were simulated from the lognormal distribution (6,1,1), and the shape parameter was simulated from the normal distribution with mean 0.5 and variance 0.01. The ML gene trees were built from the simulated DNA sequences by RAxML and then were compared with the true gene trees simulated from the three species trees. Finally, the species trees were estimated from the ML gene trees using a coalescent method NJst (Liu and Yu, 2011).
4. Discussion
Under regularity conditions (absolute continuity, identifiability, etc.), the MLEs are statistically consistent in estimating model parameters as the sample size goes to infinity. The estimator of the parameter is said to be a biased estimator if the expected value of is not equal to the true parameter value , i.e., . When the sample size is finite, it is frequently observed that the MLE is a biased estimator of the model parameter . Hence, it is important to investigate/explore the behavior of MLEs in the context of a finite sample size. The theory developed in this paper indicates that the presence of heterogeneous branch lengths (i.e., SBA) can introduce bias into the probability distribution of the ML gene trees, consequently leading to erroneous species tree inference. The findings align with a prior investigation (Dornburg et al., 2019) which demonstrated that the utility of a character depends on the relative rates and times of evolution of subtending lengths of the internode to be resolved and therefore heterogeneous branch lengths can introduce bias into phylogenetic inference. SBA may occur in the polytomy of trees and in bifurcating trees with two short terminal branches separated by a similarly short internal branch. Our theoretical and simulation analyses surprisingly demonstrate that short internal branches not only introduce a large amount of phylogenetic uncertainty but can also severely bias gene tree and species tree inference. The simulation for identical sequences, saturated sequences, and phylogenetic trees with polytomies suggests that widely applied phylogenetic programs PhyML and RAxML favor a particular bifurcating tree, rather than producing three equally likely bifurcating trees. PhyML appears to be more problematic than RAxML in estimating phylogenetic trees from noninformative sequences. The algorithmic artefact of PhyML and RAxML may further exacerbate the effect of SBA on gene tree and species tree estimation.
LBA is a phenomenon in molecular phylogenetics where rapidly evolving lineages tend to cluster together in a phylogenetic tree, even if they are not actually closely related. It can lead to erroneous inferences of evolutionary relationships if distantly related lineages share many rapidly evolving characters due to substitution saturation. Analytic tools have been developed to detect and avoid the LBA artifact (Su and Townsend, 2015). One way to address the problems of LBA is to use more slowly evolving characters or to use more complex models that can account for the different rates of evolution among different lineages. Another approach is to shorten long branches by increasing taxon sampling. In contrast, SBA artifacts can create an “artificial” branch length that connects distantly related taxa when their molecular sequences share numerous slowly evolving characters due to short branches. Presently, there are no effective techniques to counteract the adverse impacts of the SBA artifact on gene and species tree estimation.
We hypothesize that trees with short internal branches may lead to SBA, because the sequence data generated from such trees lack sufficient phylogenetic information to resolve the corresponding short internal branches. Likewise, there is a lack of phylogenetic information in the identical and saturated sequences, or the sequences generated from star trees, causing the algorithmic error of PhyML and RAxML. Thus, lack of phylogenetic signals is the primary cause of SBA and the algorithmic bias of phylogenetic programs PhyML and RAxML. We previously demonstrated similar pathological results involving gene tree estimation when short gene sequences with minimal phylogenetic data were involved (Xi et al., 2016). In particular, relationships were resolved artificially by taxon ordering in the data matrix leading to spurious species tree inference. Since SBA is caused by a lack of phylogenetic information, removing short loci from phylogenetic analysis can lower the bias in gene trees and species tree estimation, but a decline in the number of loci can increase the uncertainty of species tree estimation.
The multispecies coalescent model is a hierarchical model involving two stochastic processes: mutation process and coalescence. The mutation process describes how nucleotides evolve in gene trees, whereas the coalescence process describes how genealogical lineages evolve in the species tree. The algorithmic bias and systematic error due to SBA we uncovered here are rooted in the mutation process and only affect gene tree estimation. Because accurate estimation of species trees relies on accurate estimation of gene trees, biased gene trees can mislead species tree estimation. Moreover, LBA and SBA artifacts are the consequence of minimal phylogenetic signal in the sequence data, rather than deficiencies involving multispecies coalescent models. Our simulation indicates that 95% of the biased gene trees have an extremely short internal branch (length < 1e-5). This suggests that converting these short branches to a polytomy in the estimated gene trees can likely reduce the algorithmic bias and SBA artifacts. We have developed an algorithm in the latest version of MP-EST (Liu et al., 2010) to convert short branches to a polytomy in the ML gene trees with a plan to update the species tree estimation program MP-EST such that it can take polytomy gene trees to reconstruct species trees.
Data availability statement
The datasets presented in this study can be found in online repositories. The names of the repository/repositories and accession number(s) can be found at: https://doi.org/10.6084/m9.figshare.21793109.
Author contributions
LL and LY designed and performed the research, and simulated and analyzed the data. LL, SW, CW, JA, CD, and SE wrote the manuscript. All authors contributed to the article and approved the submitted version.
Funding
This work was supported by National Institute of Health (NIH/NIAID R01AI093856), National Science Foundation (NSF DBI-2029595), and by the National Natural Science Foundation of China (grant 31772441).
In memoriam
This article is dedicated to the memory of our dear colleague and friend Zhenxiang (Tallen) Xi.
Acknowledgments
We thank the Georgia Advanced Computing Resource Center for the computing resources.
Conflict of interest
The authors declare that the research was conducted in the absence of any commercial or financial relationships that could be construed as a potential conflict of interest.
Publisher’s note
All claims expressed in this article are solely those of the authors and do not necessarily represent those of their affiliated organizations, or those of the publisher, the editors and the reviewers. Any product that may be evaluated in this article, or claim that may be made by its manufacturer, is not guaranteed or endorsed by the publisher.
Supplementary material
The Supplementary material for this article can be found online at: https://www.frontiersin.org/articles/10.3389/fevo.2023.1134764/full#supplementary-material
References
Adams, R. H., Schield, D. R., Card, D. C., and Castoe, T. A. (2018). Assessing the impacts of positive selection on coalescent-based species tree estimation and species delimitation. Syst. Biol. 67, 1076–1090. doi: 10.1093/sysbio/syy034
Carvajal-Rodriguez, A., Crandall, K. A., and Posada, D. (2006). Recombination estimation under complex evolutionary models with the coalescent composite-likelihood method. Mol. Biol. Evol. 23, 817–827. doi: 10.1093/molbev/msj102
Dornburg, A., Su, Z., and Townsend, J. P. (2019). Optimal rates for phylogenetic inference and experimental Design in the era of genome-scale data sets. Syst. Biol. 68, 145–156. doi: 10.1093/sysbio/syy047
Felsenstein, J. (1978). Cases in which parsimony or compatibility methods will be positively misleading. Syst. Biol. 27, 401–410. doi: 10.1093/sysbio/27.4.401
Felsenstein, J. (1981). Evolutionary trees from DNA sequences: a maximum likelihood approach. J. Mol. Evol. 17, 368–376. doi: 10.1007/BF01734359
Felsenstein, J. (2006). Accuracy of coalescent likelihood estimates: do we need more sites, more sequences, or more loci? Mol. Biol. Evol. 23, 691–700. doi: 10.1093/molbev/msj079
Guindon, S., Dufayard, J. F., Lefort, V., Anisimova, M., Hordijk, W., and Gascuel, O. (2010). New algorithms and methods to estimate maximum-likelihood phylogenies: assessing the performance of phyml 3.0. Syst. Biol. 59, 307–321. doi: 10.1093/sysbio/syq010
Hendy, M. D., and Penny, D. (1989). A framework for the quantitative study of evolutionary trees. Syst. Zool. 38, 297–309. doi: 10.2307/2992396
Jiang, X., Edwards, S. V., and Liu, L. (2020). The multispecies coalescent model outperforms concatenation across diverse phylogenomic data sets. Syst. Biol. 69, 795–812. doi: 10.1093/sysbio/syaa008
Jukes, T. H., and Cantor, C. H. (1969). “Evolution of protein molecules” in Mammalian protein metabolism. ed. H. N. Munro (New York: Elsevier), 21–132.
Kim, J. H. (1996). General inconsistency conditions for maximum parsimony: effects of branch lengths and increasing numbers of taxa. Syst. Biol. 45, 363–374. doi: 10.1093/sysbio/45.3.363
Liu, L., Xi, Z., and Davis, C. C. (2015). Coalescent methods are robust to the simultaneous effects of long branches and incomplete lineage sorting. Mol. Biol. Evol. 32, 791–805. doi: 10.1093/molbev/msu331
Liu, L., and Yu, L. (2010). Phybase: an r package for species tree analysis. Bioinformatics 26, 962–963. doi: 10.1093/bioinformatics/btq062
Liu, L., and Yu, L. (2011). Estimating species trees from unrooted gene trees. Syst. Biol. 60, 661–667. doi: 10.1093/sysbio/syr027
Liu, L., Yu, L., and Edwards, S. V. (2010). A maximum pseudo-likelihood approach for estimating species trees under the coalescent model. BMC Evol. Biol. 10:302. doi: 10.1186/1471-2148-10-302
Mardia, K. V., Southworth, H. R., and Taylor, C. C. (1999). On bias in maximum likelihood estimators. J Stat Plan Inference 76, 31–39. doi: 10.1016/S0378-3758(98)00176-1
Martyn, I., and Steel, M. (2012). The impact and interplay of long and short branches on phylogenetic information content. J. Theor. Biol. 314, 157–163. doi: 10.1016/j.jtbi.2012.08.040
Mirarab, S., and Warnow, T. (2015). Astral-ii: coalescent-based species tree estimation with many hundreds of taxa and thousands of genes. Bioinformatics 31, i44–i52. doi: 10.1093/bioinformatics/btv234
Rambaut, A., and Grassly, N. C. (1997). Seq-gen: an application for the Monte Carlo simulation of DNA sequence evolution along phylogenetic trees. Comput. Appl. Biosci. 13, 235–238. doi: 10.1093/bioinformatics/13.3.235
Rannala, B., and Yang, Z. (2003). Bayes estimation of species divergence times and ancestral population sizes using DNA sequences from multiple loci. Genetics 164, 1645–1656. doi: 10.1093/genetics/164.4.1645
Roch, S., Nute, M., and Warnow, T. (2019). Long-branch attraction in species tree estimation: inconsistency of partitioned likelihood and topology-based summary methods. Syst. Biol. 68, 281–297. doi: 10.1093/sysbio/syy061
Roch, S., and Warnow, T. (2015). On the robustness to gene tree estimation error (or lack thereof) of coalescent-based species tree methods. Syst. Biol. 64, 663–676. doi: 10.1093/sysbio/syv016
Rogers, J. S. (1997). On the consistency of maximum likelihood estimation of phylogenetic trees from nucleotide sequences. Syst. Biol. 46, 354–357. doi: 10.1093/sysbio/46.2.354
Stamatakis, A., Ludwig, T., and Meier, H. (2005). Raxml-iii: a fast program for maximum likelihood-based inference of large phylogenetic trees. Bioinformatics 21, 456–463. doi: 10.1093/bioinformatics/bti191
Su, Z., and Townsend, J. P. (2015). Utility of characters evolving at diverse rates of evolution to resolve quartet trees with unequal branch lengths: analytical predictions of long-branch effects. BMC Evol. Biol. 15:86. doi: 10.1186/s12862-015-0364-7
Susko, E. (2015). Bayesian long branch attraction bias and corrections. Syst. Biol. 64, 243–255. doi: 10.1093/sysbio/syu099
Townsend, J. P., Su, Z., and Tekle, Y. I. (2012). Phylogenetic signal and noise: predicting the power of a data set to resolve phylogeny. Syst. Biol. 61, 835–849. doi: 10.1093/sysbio/sys036
Xi, Z., Liu, L., and Davis, C. C. (2015). Genes with minimal phylogenetic information are problematic for coalescent analyses when gene tree estimation is biased. Mol. Phylogenet. Evol. 92, 63–71. doi: 10.1016/j.ympev.2015.06.009
Xi, Z., Liu, L., and Davis, C. C. (2016). The impact of missing data on species tree estimation. Mol. Biol. Evol. 33, 838–860. doi: 10.1093/molbev/msv266
Keywords: coalescent methods, species trees, gene trees, multispecies coalescent model, long branch attraction, short branch attraction
Citation: Liu L, Yu L, Wu S, Arnold J, Whalen C, Davis C and Edwards S (2023) Short branch attraction in phylogenomic inference under the multispecies coalescent. Front. Ecol. Evol. 11:1134764. doi: 10.3389/fevo.2023.1134764
Edited by:
Jeffrey Peter Townsend, Yale University, United StatesReviewed by:
Yufeng Wu, University of Connecticut, United StatesZhuo Su, Yale University, United States
Copyright © 2023 Liu, Yu, Wu, Arnold, Whalen, Davis and Edwards. This is an open-access article distributed under the terms of the Creative Commons Attribution License (CC BY). The use, distribution or reproduction in other forums is permitted, provided the original author(s) and the copyright owner(s) are credited and that the original publication in this journal is cited, in accordance with accepted academic practice. No use, distribution or reproduction is permitted which does not comply with these terms.
*Correspondence: Liang Liu, bGxpdUB1Z2EuZWR1