 Susanne Lachmuth
 Thibaut Capblancq2,3†
 Stephen R. Keller
 Matthew C. Fitzpatrick
- 1Appalachian Laboratory, University of Maryland Center for Environmental Science, Frostburg, MD, United States
- 2Department of Plant Biology, University of Vermont, Burlington, VT, United States
- 3Laboratoire d’Écologie Alpine, Université Grenoble Alpes, CNRS, Grenoble, France
Introduction: Ecological genomic models are increasingly used to guide climate-conscious restoration and conservation practices in the light of accelerating environmental change. Genomic offsets that quantify the disruption of existing genotype–environment associations under environmental change are a promising model-based tool to inform such measures. With recent advances, potential applications of genomic offset predictions include but are not restricted to: (1) assessing in situ climate risks, (2) mapping future habitat suitability while accounting for local adaptations, or (3) selecting donor populations and recipient areas that maximize genomic diversity and minimize maladaptation to future environments in assisted migration planning. As for any model-based approach, it is crucial to understand how arbitrary decisions made during the modeling process affect predictions and induce uncertainty.
Methods: Here, we present a sensitivity analysis of how various modeling components influence forecasts of genomic offset-based metrics, using red spruce (Picea rubens), a cool-temperate tree species endemic to eastern North America, as a case study. We assess the effects of genomic marker set, climatic predictor set, climate change scenario, and “not-to-exceed” offset threshold and evaluate how uncertainty in predictions varies across space.
Results: Climate change scenario induced by far the largest uncertainty to our forecasts; however, the choice of predictor set was also important in regions of the Southern and Central Appalachians that are of high relevance for conservation and restoration efforts. While much effort is often expended in identifying candidate loci, we found that genomic marker set was of minor importance. The choice of a maximum offset threshold to limit transfers between potential donor and recipient locations in assisted migration programs has mostly affected the magnitude rather than geographic variation in our predictions.
Discussion: Overall, our model forecasts suggest high climate change risks across the entire distributional range of red spruce and strongly underscore the potential for assisted migration to help ameliorate these risks. In that regard, populations in the Southern and Central Appalachians as well as along the US and Canadian east coast seem the best candidates for both in situ conservation and relocation.
1. Introduction
Landscape and ecological genomic modeling is increasingly acknowledged as a valuable tool to guide the development of climate-conscious restoration and conservation measures in the face of accelerating climate change (Sork et al., 2013; Isabel et al., 2020; Waldvogel et al., 2020). Climatic change will likely disrupt local adaptation and exceed the natural capacity of species to respond through adaptation or migration (Kubisch et al., 2013), confronting managers with the prospect of severe impact on ecosystem functioning and services (Schröter et al., 2005; IPBES, 2019; Palik et al., 2022). Therefore, to proactively address the loss of adaptation expected under climate change, scientists and practitioners alike are discussing the preferential use of genetic material that has a high potential to be pre-adapted to future environmental conditions when conducting restoration and conservation measures (Aitken and Whitlock, 2013; O’Neill, 2017; Park et al., 2018; Isabel et al., 2020; Hoffmann et al., 2021; Benomar et al., 2022). This shift in focus to go beyond in situ conservation and the long-standing “local is best” paradigm in genotype sourcing (Aitken and Bemmels, 2016; Isabel et al., 2020) involves both established conservation and restoration practices, such as the reintroduction of species to restore degraded habitats (Hölzel et al., 2012; Höfner et al., 2022) or the genetic conservation of declining and genetically degraded populations (Hedrick et al., 2014; Frankham, 2015; Potter et al., 2017), and novel developments of stand-alone assisted migration schemes (Hoegh-Guldberg et al., 2008; Chen et al., 2021; Palik et al., 2022). Here, we follow definitions of Aitken and Bemmels (2016) as well as Aitken and Whitlock (2013), which combine both “assisted gene flow” within and “assisted colonization” beyond the current range of a species under the umbrella term “assisted migration”.
For the development of such climate-conscious conservation and restoration practices, predictive landscape genomic models increasingly complement common garden and genetic association studies to identify populations harboring genotypes that, if transferred to target locations, would minimize disruption of local adaptation to climate, thus maximizing fitness in changing environments (Aitken and Bemmels, 2016; Supple et al., 2018; Capblancq et al., 2020; Mahony et al., 2020). More recently, the concept of genomic offsets has gained attention in the context of these types of management applications (Capblancq et al., 2020; Dauphin et al., 2021; Gougherty et al., 2021; Rellstab et al., 2021; Feng and Du, 2022; Yuan et al., 2023). Genomic offset uses model predictions of genome-wide allele frequency variation along environmental gradients to quantify the disruption of current genotype–environment associations under expected environmental change (Fitzpatrick and Keller, 2015).
So-called Local Offset (sensu Gougherty et al., 2021) estimates the maladaptation a population is expected to experience in situ under a scenario of temporal environmental change and is increasingly being used in climate change risk assessment (Gugger et al., 2018; Nielsen et al., 2021; Tournebize et al., 2022; Varas-Myrik et al., 2022). If we additionally consider the possibility that genotypes can migrate either naturally or through assisted migration, the technique opens new and still untapped possibilities for further developments in predictive restoration and conservation planning. Using the same underlying modeling approach as for Local Offset, we recently developed two novel metrics of Donor and Recipient Importance (DI/RI hereafter) to quantify transferability between all potential donor and recipient locations for a species in a study area without exceeding a genomic offset threshold (Lachmuth et al., 2023; Figure 1). The DI/RI approach leverages ecological genomic models to integrate genomic variation into conservation and restoration practice. It can be used to forecast and map habitat suitability that accounts for adaptive differentiation, to evaluate the future representation of environments for a locally adapted donor population, and to guide the selection of populations and areas that maximize genomic diversity while minimizing maladaptation (Lachmuth et al., 2023). Combined with Local Offset, DI and RI metrics can facilitate decision making for local persistence, optimal migration corridors, or interventions through assisted migration.
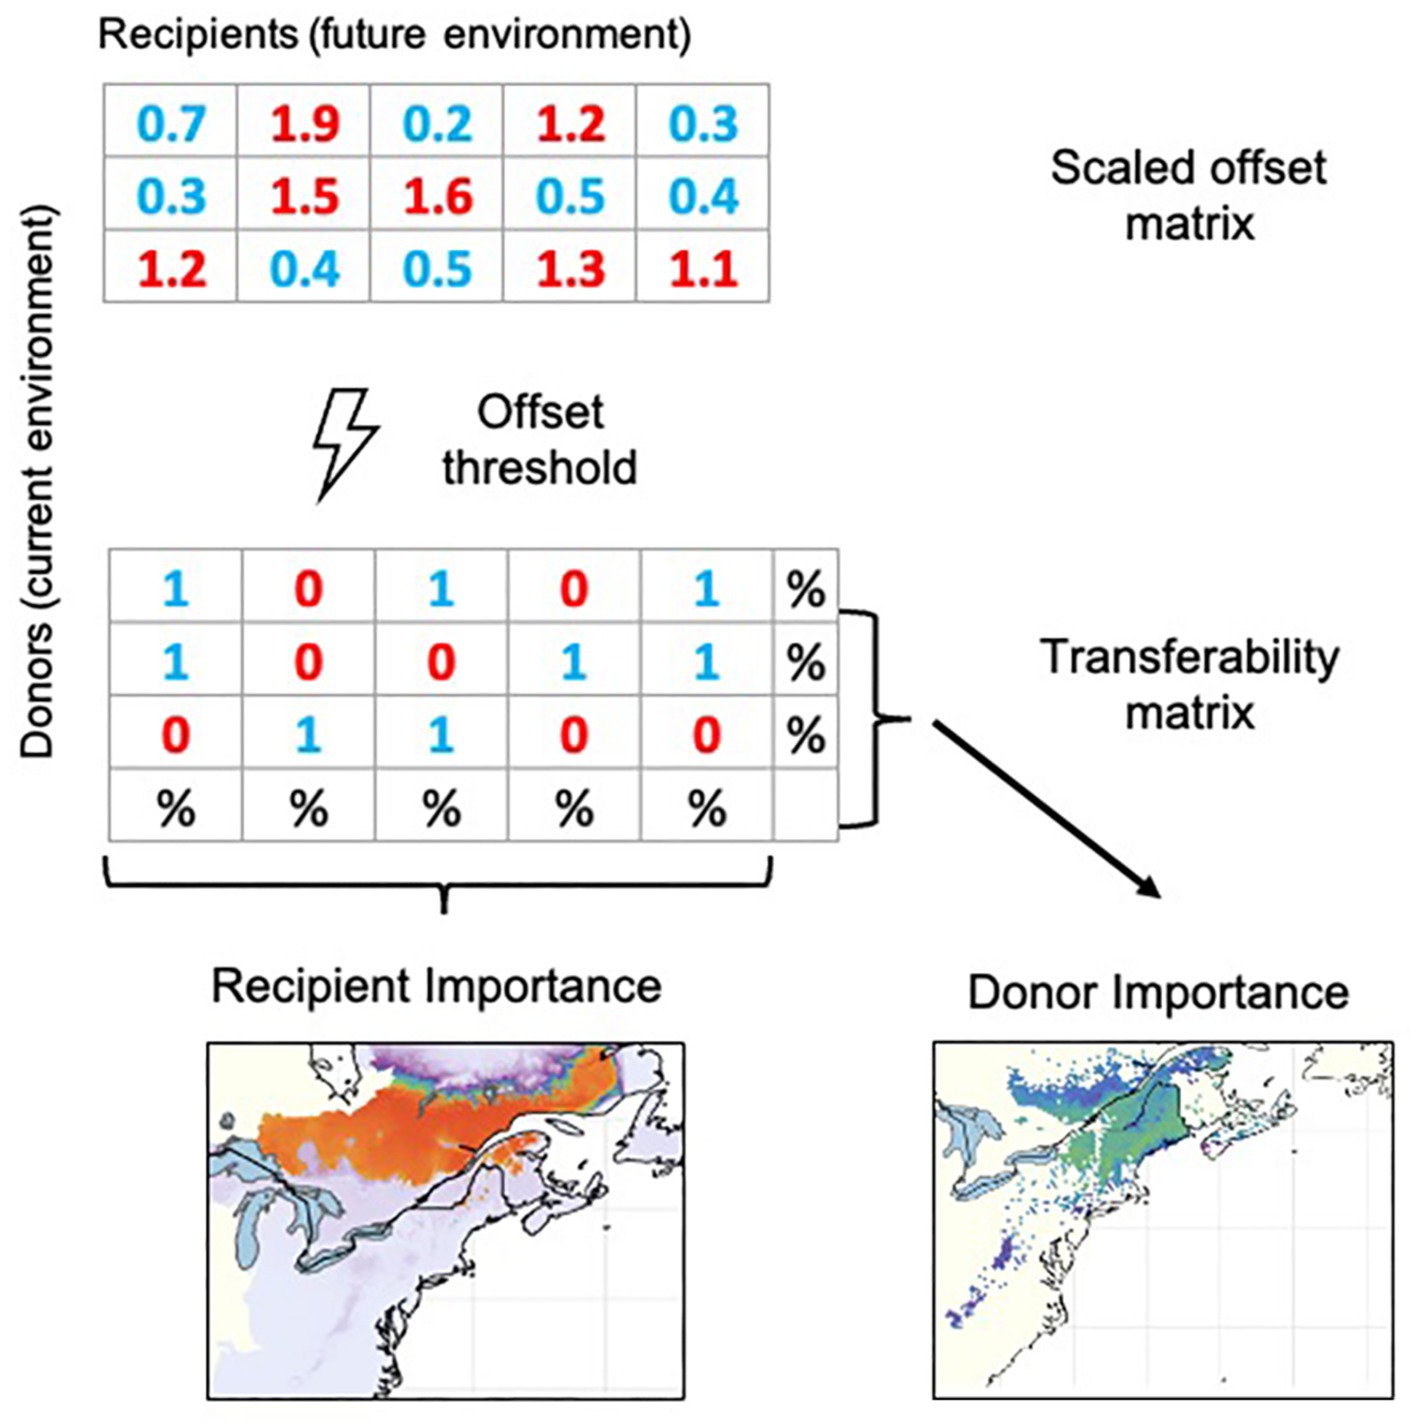
Figure 1. Schematic illustration of the calculation of the scaled genomic offset metrics Donor and Recipient Importance, which includes three main steps: First, scaled genomic offsets (Lachmuth et al., 2023) are calculated between all potential donor locations under current environmental conditions and all potential recipient locations under future environmental conditions. Second, we apply a “not-to-exceed” scaled offset threshold that categorizes all spatio-temporal offsets as either analogous to present-day genomic turnover (coded as 1) or non-analogous (coded as 0) in a “transferability matrix” comprising all potential donor and recipient cells. Recipient Importance (RI) of each potential recipient location is calculated as the percentage of donor cells from which immigration is possible without exceeding the scaled offset threshold. Donor Importance (DI) of a potential donor location is computed as the percentage of recipient cells to which emigration is possible without exceeding the scaled offset threshold.
However, to effectively support decision making, it is crucial to understand and quantify how uncertainty resulting from decisions made during the modeling process (Myers et al., 2021) impact genomic offset-based forecasts. Although uncertainty in modeling decisions cannot ultimately be eliminated, careful sensitivity analysis of which components have the greatest influence on the predictions together with examination of spatial patterns of uncertainty can help with management decisions (Hagerman et al., 2010; Langford et al., 2011; Ramalho et al., 2017). Since decision makers must carefully decide how to appropriately allocate the limited resources available for climate change mitigation efforts, it is essential to acknowledge and quantify this uncertainty so that models do not promote overly optimistic predictions or inaccurate outcomes (Langford et al., 2011; Conlisk et al., 2013). Furthermore, it is important to validate the predictive performance of genomic offsets by analyzing the effects of the estimated G-E disruption on fitness proxies, ideally in common environments (Capblancq et al., 2020; Fitzpatrick et al., 2021; Rellstab et al., 2021; Láruson et al., 2022; Lind et al., 2023). One species that makes a valuable case study for adopting predictive seed sourcing practices is red spruce (Picea rubens Sarg.), an ecologically and economically important forest tree species native to eastern North America that thrives in cool, moist climates. Red spruce is predicted to be severely impacted by climate change and to lose almost all of its current suitable habitat in the United States (Iverson et al., 2008; Beane and Rentch, 2015; Koo et al., 2015). The current distribution spans from southern Québec, eastern Ontario, and the Canadian maritime provinces in the northern part of the range down into fragmented mountain top “sky islands” in the Central and Southern Appalachians (Little, 1971). Previous studies found evidence of local adaptation to climate (Butnor et al., 2019; Prakash et al., 2022; Capblancq et al., 2023) and identified putatively adaptive, genomic candidate loci that display latitudinal, longitudinal and elevational differentiation along climatic gradients (Capblancq et al., 2023).
A previous study using the DI/RI approach in red spruce identified the southern range edge populations as promising candidates for in situ restoration and assisted gene flow (within the current range) supposedly due to local adaptations to warmer climates, but also advocated for the consideration of assisted colonization northward (beyond the current range) for populations across red spruce range (Lachmuth et al., 2023). In parallel, two red spruce reforestation projects led by the Central and Southern Appalachian Spruce Restoration Initiatives (CASRI and SASRI, respectively) are currently developing plans to incorporate (CASRI) or might benefit in the future (SASRI) from using genomic offset predictions to select seeds and planting sites in the Appalachians (The Nature Conservancy, 2022).
Here, we explore four elements of the DI/RI approach that induce potential uncertainty in the forecasts: (i) Genomic Marker Set, (ii) Climatic Predictor Set, (iii) Climate Change Scenario, and (iv) determination of the “not-to-exceed” Offset Threshold to limit transfers between potential donor and recipient locations. These elements are not exhaustive but correspond to four essential decisions of the modeling process. In this study, we present a sensitivity analysis of these four components and address the following questions: How strongly does the predictive performance of genomic offsets in common garden environments depend on the choice of genomic markers and environmental predictors? What is the order of magnitude of the uncertainty associated with predictions of Local Offset and DI/RI? Which of the four above-described components contributes most to this uncertainty? How does uncertainty vary geographically within the species current and potential future distribution range?
2. Materials and methods
2.1. Genomic marker sets
As response variables in our genomic offset models, we used a previously published population genomic dataset obtained using an exome-capture sequencing approach (Capblancq et al., 2020). The original dataset consisted of allele frequencies for 64 red spruce sampling sites genotyped at 917,234 Single Nucleotide Polymorphisms (SNPs) (see1 for our sampling design). When predicting genomic offset, it is often recommended to use only loci that have previously been identified as putatively involved in adaptation, for example through genotype–environment association (GEA) studies (Capblancq et al., 2020; Rellstab et al., 2021), though recent studies have shown that loci selected at random can perform similarly to candidate loci (Fitzpatrick et al., 2021; Láruson et al., 2022). Therefore, to evaluate the sensitivity of our predictions to marker selection, we used either all 335,588 loci that had a minor allele frequency above 10% (hereafter All Loci) or only the 240 loci identified in Capblancq et al. (2023) as putatively involved in adaptation to climate (hereafter Candidate Loci). It is important to note that the set of Candidate Loci is nested in the All Loci set.
2.2. Climatic predictor sets and climate change scenarios
We analyzed sensitivity to two climate data components: the choice of Climatic Predictors, which affects the projection of both current and future genomic composition across the landscape, and the choice of Climate Change Scenario (shared socio-economic pathways, SSPs), which only affects projections of future composition. To define potential donor populations, we used all geographic grid cells at a resolution of 2.5 arc-minutes (~ 5 × 5 km2 at the equator) with recorded red spruce occurrence as reported in Lachmuth et al. (2023). Hereafter, we refer to these grid cells as “extant red spruce populations” for simplicity. For potential recipient locations, we delineated our study area to all ecoregions in which red spruce has been recorded to occur as well as adjacent ecoregions (sensu Dinerstein et al., 2017)—an area that ranged from approximately −100°W to −48°W and 20°N to 60°N.
To approximate the historic climate conditions that likely shaped red spruce distribution and genomic differentiation, we used annual climate variables from climateNA (version 7.01; Wang et al., 2016) and annual potential evapotranspiration data (PET) from ENVIREM (Title and Bemmels, 2018) for the grid cells with potential donor populations. For all variables, we worked with means over the World Meteorological Organization’s (WMO) standard normal period 1961–1990 CE, which predates the significant warming of the last 25 years and covers a vast amount of weather station data (Wang et al., 2016).
For exploring the effects of predictor choice, we worked with two nested Climatic Predictor Sets that differed in the rigor with which the collinearity of the variables was minimized. The Broad Predictor Set was the one selected and used in previous studies (Prakash et al., 2022; Capblancq et al., 2023; Lachmuth et al., 2023). It comprised the following eleven variables: Climatic Moisture Deficit (CMD), Degree Days below 0°C (DD_0), Extreme Maximum Temperature (EXT), Mean Annual solar Radiation (MAR), May to September Precipitation (MSP), Precipitation as Snow (PAS), mean annual Relative Humidity (RH), Continentality (TD), Degree Days above 18°C (DD18), end of the Frost-Free Period (eFFP), and Potential Evapotranspiration (PET). This Broad Predictor Set was originally used for climate association with genomic variation and included some degree of collinearity between the predictors (see the cited studies for a detailed explanation of variable selection). Next, we further reduced the Broad Predictor Set to a subset of seven climate variables that do not exceed a Variance Inflation Factor (VIF) of 12 for grid cells currently occupied by red spruce. This Narrow Predictor Set was originally used for ecological niche modeling in red spruce (Lachmuth et al., 2023). Since RI is a metric comparable to ENM predicted habitat suitability, we here explore how the predictions of Gradient Forest models are affected by using this smaller and less collinear set of predictor variables. The Narrow Predictor Set only comprised seven variables: CMD, DD_0, EXT, MAR, MSP, PAS and RH.
The future climate normals for both Climatic Predictor Sets for the period of 2071–2100 CE came from three CMIP6 scenarios each averaged over 15 Global Circulation Models. Since future climate projections are not available from ENVIREM, we calculated potential evapotranspiration using monthly temperature projections from climateNA and scripts provided by ENVIREM.2 For the Sixth Assessment Report of the Intergovernmental Panel on Climate Change (IPCC, 2021) a new framework has been established for integrated analysis of future climate impacts, vulnerabilities, adaptation, and mitigation (Riahi et al., 2017). The new framework combines so-called Shared Socioeconomic Pathways (SSP) and the previously used Representative Concentration Pathways (RCP) incorporating socio-economic assumptions into greenhouse gas emission scenarios and assuming a lack of global concerted effort to address climate change. Here, to evaluate the impact of the choice of Climate Change Scenario, we used two different SSPs. The “middle of the road” SSP2-RCP45 (SSP2-45 hereafter) poses medium challenges to both mitigation and adaptation assuming a continuation of current social, economic, and technological trends. The “taking the highway” SSP5-RCP85 (SSP5-85) scenario assumes maximized global fossil fuel exploitation due to a global emphasis on growth and economic progress and poses high challenges to mitigation but involves low adaptation challenges.
2.3. Calculation of genomic offsets and donor and recipient importance
Our approach uses Gradient Forest (GF) modeling to estimate genomic offsets, and calculate Donor and Recipient Importance (Figure 1; see also Lachmuth et al., 2023). In brief, we employed Gradient Forest as implemented in the “gradientForest” package (Ellis et al., 2012) in the statistical software R (R Core Team, 2021). We parameterized the Gradient Forest models for our two Genomic Marker Sets (All and Candidate Loci) for our 64 sampling locations using the two different Climatic Predictor Sets described above (Broad and Narrow Predictors). We fitted 500 regression trees per SNP. The default value used for the number of predictors randomly sampled as candidates at each split was set to (number predictors) /3, and the variable correlation threshold to invoke conditional importance estimations was set to 0.5. See Supplementary Figures S1–S4 for variable importance plots for the different GF models.
We obtained Gradient Forest predictions that rescaled the climate variables (current and future) into common units of genomic turnover for each grid cell [hereafter referred to as “transformed climate (variables)”]. We then calculated three types of genomic offsets as Euclidean distances between grid cells in the multidimensional transformed climatic space: (a) contemporary spatial offsets among all geographic grid cells (2.5 arc minutes) currently occupied by red spruce using transformed current climate predictors; (b) temporal offsets between current and future climate (i.e., Local Offset) in each grid cell currently occupied by red spruce; (c) spatio-temporal offsets between currently occupied grid cells (potential donor populations) under current and all potential recipient grid cells under future transformed climate.
To increase the interpretability of the (spatio-)temporal offsets (b and c above), we scaled them using the approach presented by Lachmuth et al. (2023) by probabilistically re-expressing them as z-scores based on the empirical distribution of contemporary spatial offsets [(i) above]. This approach re-scales the (spatio-)temporal offsets relative to the present-day genetic differences between populations across the geographic distribution of the species while also removing confounding effects of dimensionality on Euclidean distance (Bellman, 1957). Importantly, both spatial and (spatio-)temporal offsets need to be calculated based on the same fitted Gradient Forest model.
We calculated DI and RI using the two scaled spatio-temporal offsets [(iii) above] as implemented in Lachmuth et al. (2023) (see also Figure 1). DI and RI first require the selection of a “not-to-exceed” scaled genomic offset threshold below which the disruption of genotype–environment associations is considered to remain within a biologically tolerable range. To evaluate the effects of Offset Threshold choice, we used five z-score thresholds [0.5, 0.75, 1, 1.25, 1.5 σ (sigma)] to categorize the scaled spatio-temporal offsets as analogous to the distribution of present-day spatial offsets across the geographic range of the species (i.e., below threshold, coded as 1) or non-analogous (i.e., above threshold, coded as 0). The resultant binary matrix represents the estimated genotype transferability between all potential donor and recipient cells. Donor Importance (DI) for each donor cell was calculated as the percentage of recipient cells in the study area with a scaled offset below the threshold z-score, whereas Recipient Importance (RI) of each potential recipient cell represents the percentage of donor cells with a scaled offset below the threshold z-score. We chose to work with a threshold-based approach since when working with mean (or even median) offsets, extreme offset values could have a substantial effect on DI and RI. It would, for example, be difficult to distinguish whether intermediate DI or RI values result from many intermediate offset matches or some with very low and some with very high offsets. However, we would like to point out that calculating a “threshold-free” continuous DI and RI is a viable alternative if for example no robust criteria can be derived to set a threshold for a particular study system. Moreover, DI and RI can be calculated for subsets of donor and/or recipient cells by sub-setting the transferability matrix before calculating the percentages [see Lachmuth et al. (2023) for examples].
2.4. Sensitivity analysis
We analyzed the effects of variation in four different scenario components feeding into the calculation of LO, DI, and RI to assess the sensitivity of these metrics to various sources of uncertainty: Genomic Marker Set (Candidate vs. All Loci), Climatic Predictor Set (Broad vs. Narrow Predictor Set), Climate Change Scenario (SSP2-45, vs. SSP5-85), and Offset Threshold (z-score categories: 0.5, 0.75, 1, 1.25, 1.5 σ). The sensitivity analysis thus comprised up to 40 different combinations of component specifications.
To partition the resulting variation in the models arising from the different component specifications, we followed an approach proposed by Diniz-Filho et al. (2009). For each of our metrics and for each grid cell for which they were calculated, we performed a multi-way analysis of variance (ANOVA) without replication in R (version 4.1.2, R Core Team, 2021). The ANOVAs included each of the scenario components as well as all possible interactions among these factors as fixed effects. We then extracted the sums of squares attributable to each of these main effect and interaction terms and calculated the percentage of variance explained by them for each grid cell as a simple proportion of the sum of squares attributable to each term. Note that the emphasis here was on variance partitioning, and not significance testing. Since there were no replicates, the models had no residual variance.
To illustrate the influence of modeling decisions on LO, RI and DI more comprehensively, we applied constrained correspondence analysis (CCA) using the R package vegan [version 2.6.4, Oksanen et al. (2022)]. We evaluated the similarity of the different scenarios using the scenario components and all possible interactions among them as explanatory variables and correlation matrix among the predictions as the response. Significance of the explanatory variables (constraints) was determined using permutation tests with 999 permutations, testing marginal effects.
2.5. Common garden analyses
Additionally, we used common garden data to compare the predictive power of genomic offsets based on All vs. Candidate Loci as well as Broad vs. Narrow Predictors. For assessing the extent to which our scaled genomic offsets predict declines in plant performance, we tested their effect on height growth of juvenile red spruce in three gardens. Details on the experimental design, cultivation and monitoring are described in Prakash et al. (2022). To summarize, the three gardens were established along a latitudinal gradient at the following locations: Asheville, NC (35.504°N, −82.6°W, 655 m a.s.l.), Frostburg, MD (39.642°N, −78.939°W, 588 m a.s.l.) and Burlington, VT (44.476°N, −73.212°W, 59 m a.s.l.). The seed families utilized here were identical to those used in the genomic analyses and GF model fitting (see3). We used population means of family-level BLUPs [best linear unbiased predictors, see Prakash et al. (2022)] of shoot height increment between the ends of the growing seasons of 2019 and 2020. Current climate (1961–1990 CE) for the source population locations and annual values averaged over 2019 and 2020 for the garden locations were derived from climateNA. Since 2019–2020 climate data were not available from ENVIREM, we used monthly temperatures from climateNA and ENVIREM scripts4 to calculate potential evapotranspiration. We used those same temperature data to calculate summer extreme temperature for 2019–2020. Moreover, 2019–2020 mean annual radiation was not yet available from climateNA and therefore we calculated this variable using radiation data from GRIDMET (Abatzoglou, 2013). Scaled genomic offsets between source population and garden locations were calculated as described above (see also Figure 1). We fitted linear models with population mean height growth as the response and scaled genomic offset as a fixed effect for each garden separately and used F-Tests to evaluate the significance of the offset main effect.
3. Results
3.1. Offset evaluation using common garden data
The statistical results for the evaluation are included in the tables shown in Figure 2. Across all scenarios, scaled offsets had a significant negative effect on the height growth performance of the red spruce seedlings (p < 0.001). Based on both R-squared and AIC (Akaike, 1974) values, we found slightly higher predictive power for the Candidate Loci offsets in the MD garden and slightly higher predictive power of the All Loci offsets in the NC and VT gardens for both Climatic Predictor Sets. Comparing Predictor Sets, we see very similar predictive performance of the two sets of predictors in the NC and VT gardens (all ΔAIC <2). In the MD garden, however, the Broad Predictors had distinctively higher R-squared and lower AIC values than the Narrow Predictors.
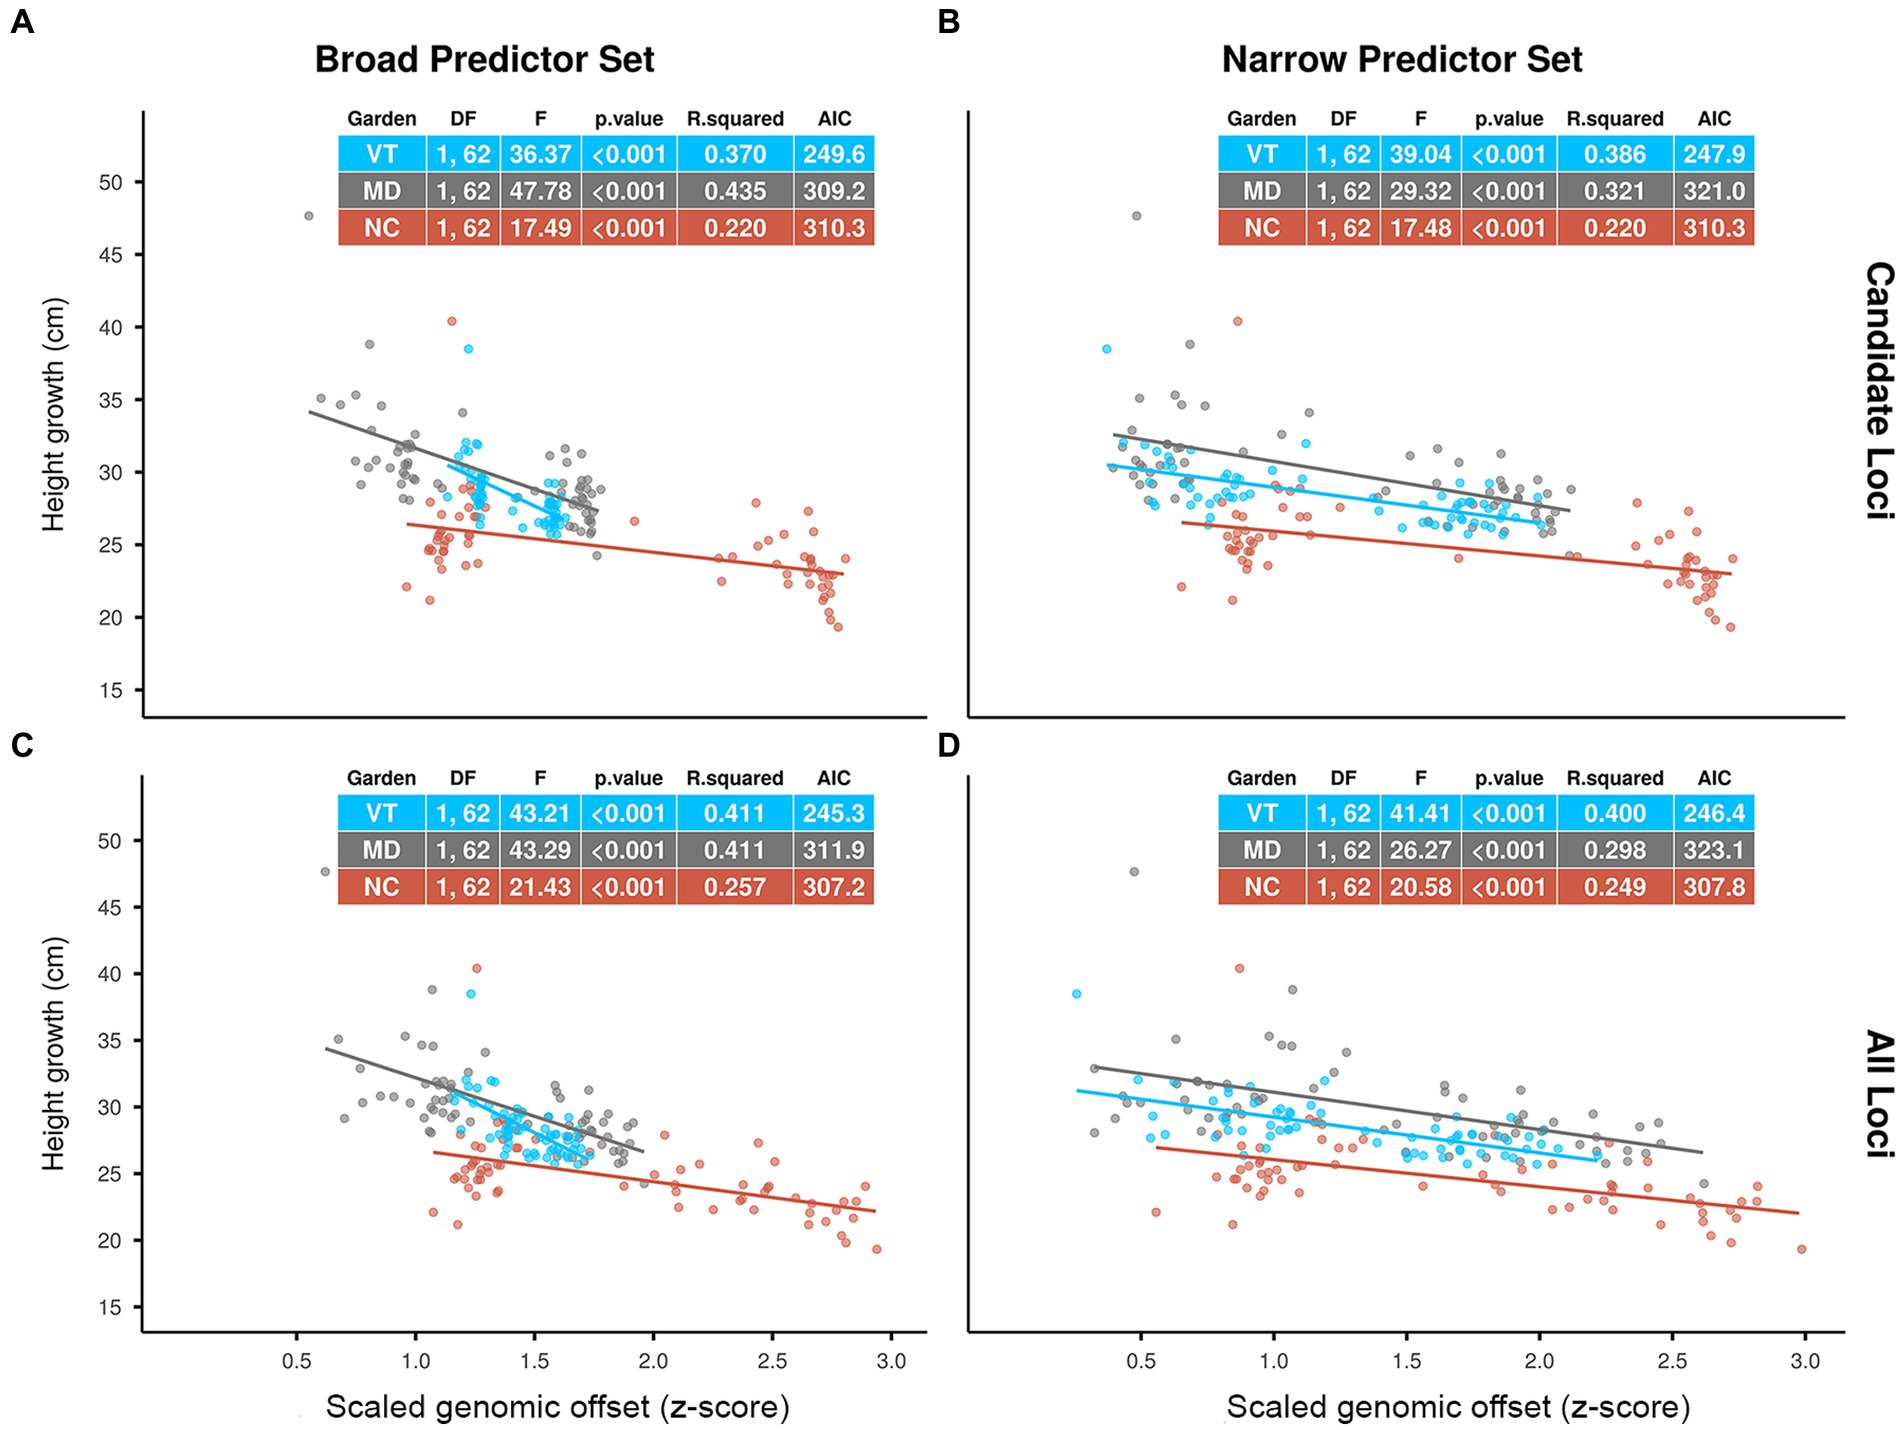
Figure 2. Effects of scaled genomic offset (z-score) predicted by Gradient Forest (GF) models on red spruce height growth performance (population means) in three common gardens in Vermont (VT), Maryland (MD) and North Carolina (NC) over a 1-year period (2019–2020). GF models using (A) Candidate Loci and Broad Predictors, (B) Candidate Loci and Narrow Predictors, (C) All Loci and Broad Predictors, (D) All Loci and Narrow Predictors. Genomic offsets were calculated as Euclidean distances using GF-transformed current climate normals (1961–1990 CE) for the source populations and 2019–2020 climate means for the gardens. Dots represent population means. F-statistics, R-squared values and Akaike’s “An Information Criterion” (AIC) (Akaike, 1974) for the separate regression analyses for each garden are given in the plots.
3.2. Local offset
Using the Candidate Loci, Broad Predictor Set and Climate Change Scenario SSP2-45 (Figure 3A), LO is predicted to be lowest at the southern, northern, and coastal range edges as well as at higher elevations within the core of the range. Under SSP5-85 (Figure 3B), predicted LO increases and becomes more homogenous across the range core. At the northern range edge, the increase is predicted to be most pronounced, rendering the most northern populations most vulnerable to climate change, whereas the southern range edge continues to show the lowest LO. Using the All Loci Set (Figures 3C,D), predicted LO is similar in magnitude to using the Candidate Loci but comprises less heterogeneity across the range. These differences between Candidate and All Loci are less pronounced with the Narrow Predictor Set (Figures 3E–H), which includes fewer and less intercorrelated climate variables. Here, for both Genomic Marker Sets, we find the lowest predicted LO at the southern, northern, and coastal range edges and higher elevations under SSP2-45, and most pronounced LO increase under SSP5-85 at the northern range edge. Overall, the coefficient of variation for LO ranges from 2 to 51 and is highest at the red spruce range edges (Supplementary Figure S13A).
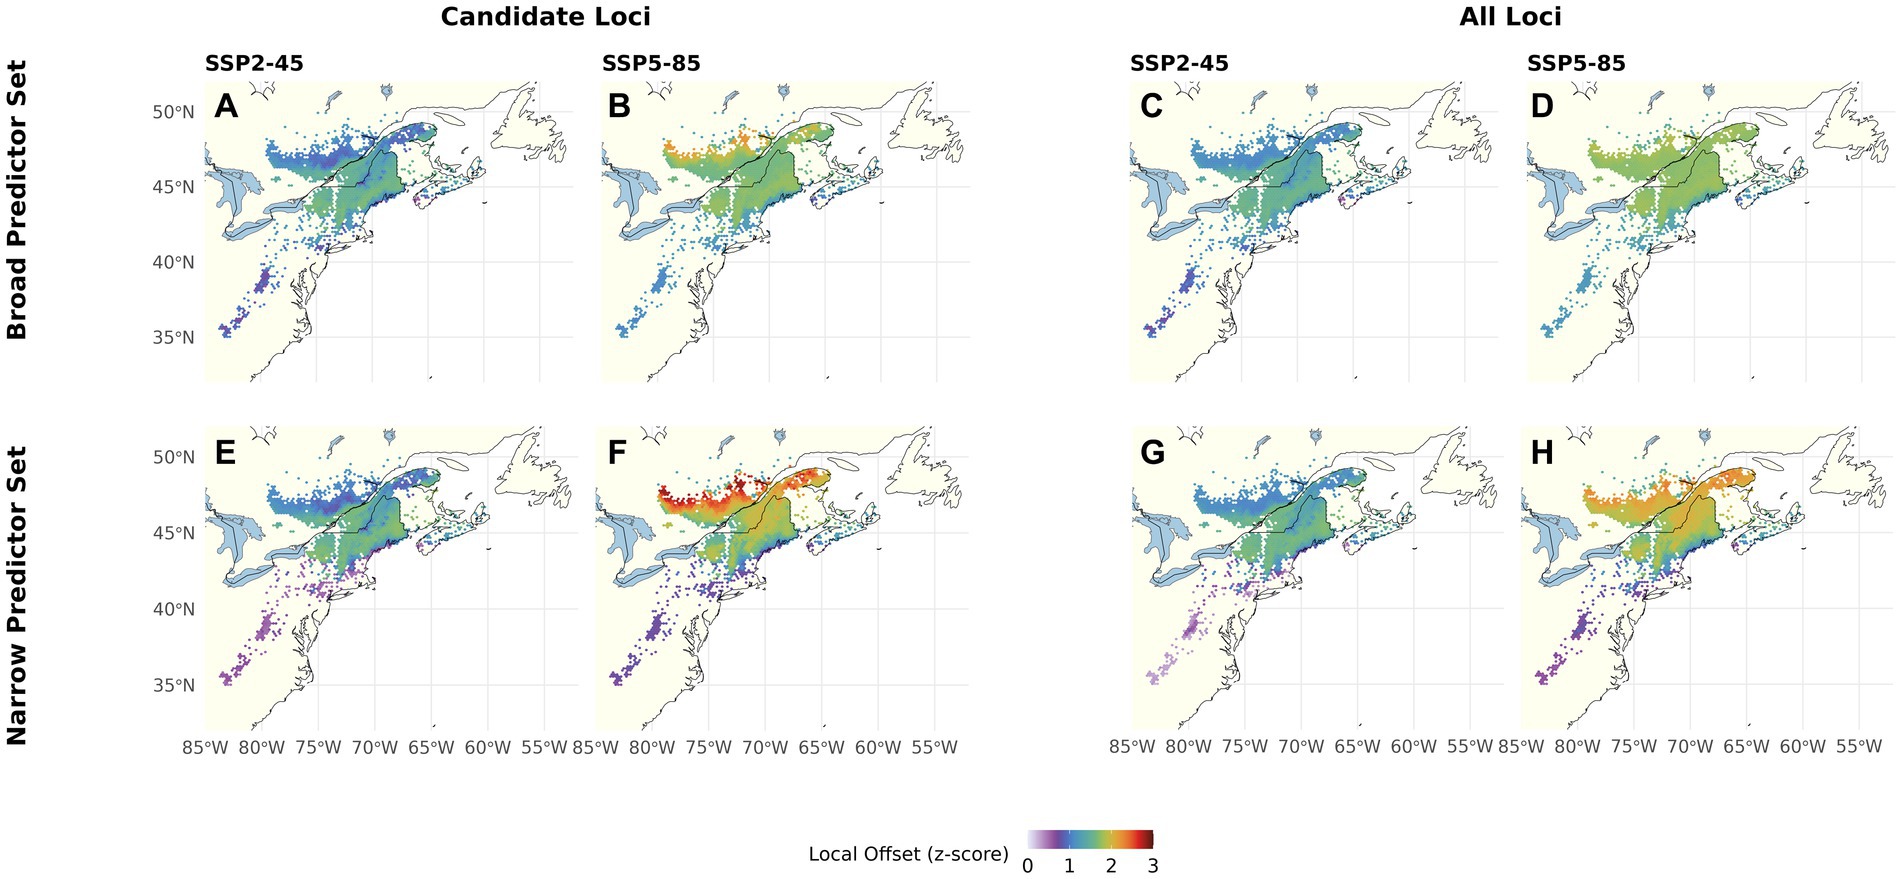
Figure 3. Local Offset for red spruce Picea rubens by the end of the 21st century assuming a moderate (SSP2-45) and a severe (SSP5-85) Climate Change Scenario. LO was calculated based on scaled Gradient Forest derived genomic offsets using a set of 240 Candidate (A,B,E,F) or All Loci (C,D,G,H) and eleven climate variables (Broad Predictors Set, A–D) or a subset of seven less correlated climate variables (Narrow Predictors, E–H). Note that this figure shows choropleth maps with each hexagonal bin presenting averages over grid cells occupied by red spruce within the binned area.
In the multiway ANOVA applied to partition variation among LO predictions (Figure 4; Table 1), Marker Set explained only a very small portion of the total sums of squares in most of the range, except for a narrow strip of lowland areas along the US coast. The analyses further revealed a south to north gradient in the contribution of Climatic Predictor Set, which explained most variation in an area stretching from the southern range edge along the US coast to New Brunswick, Canada. Climate Change Scenario was the most relevant component across large parts of the range core and northern range edge. The two-way interactions (Figures 4D–F) and the three-way interaction (Table 1) explained little variation among the different LO offset predictions.
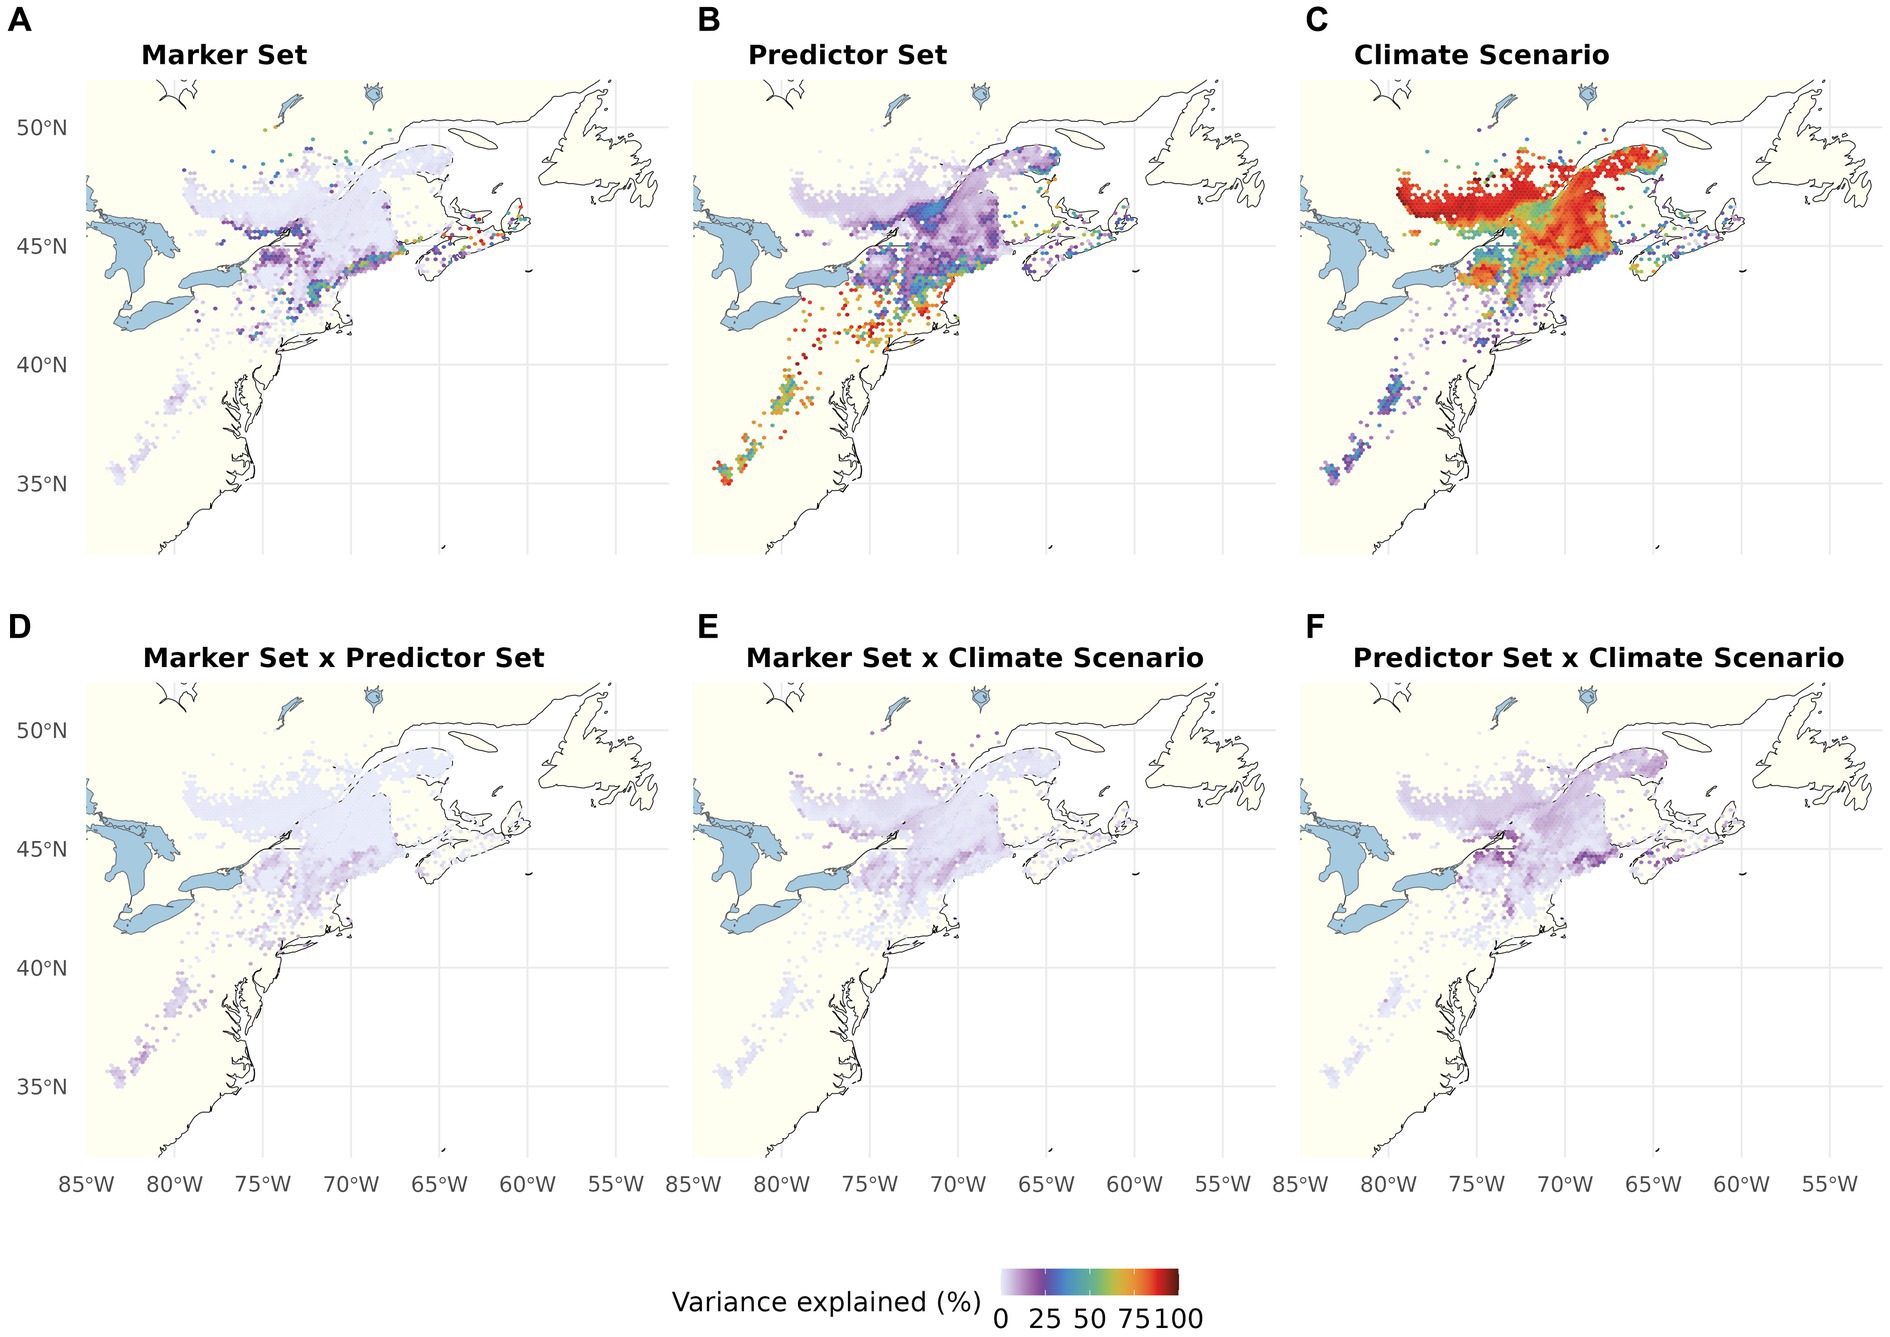
Figure 4. Proportion of the total variation (sum of squares) in Local Offset accounted for by Genomic Marker Set (A), Climatic Predictor Set (B), Climate Change Scenario (C), and their two-way interactions (D–F). The three-way interaction explained very little variation (see Table 1). Note that this figure shows choropleth maps with each hexagonal bin representing the average over spatial grid cells occupied by red spruce within the binned area.
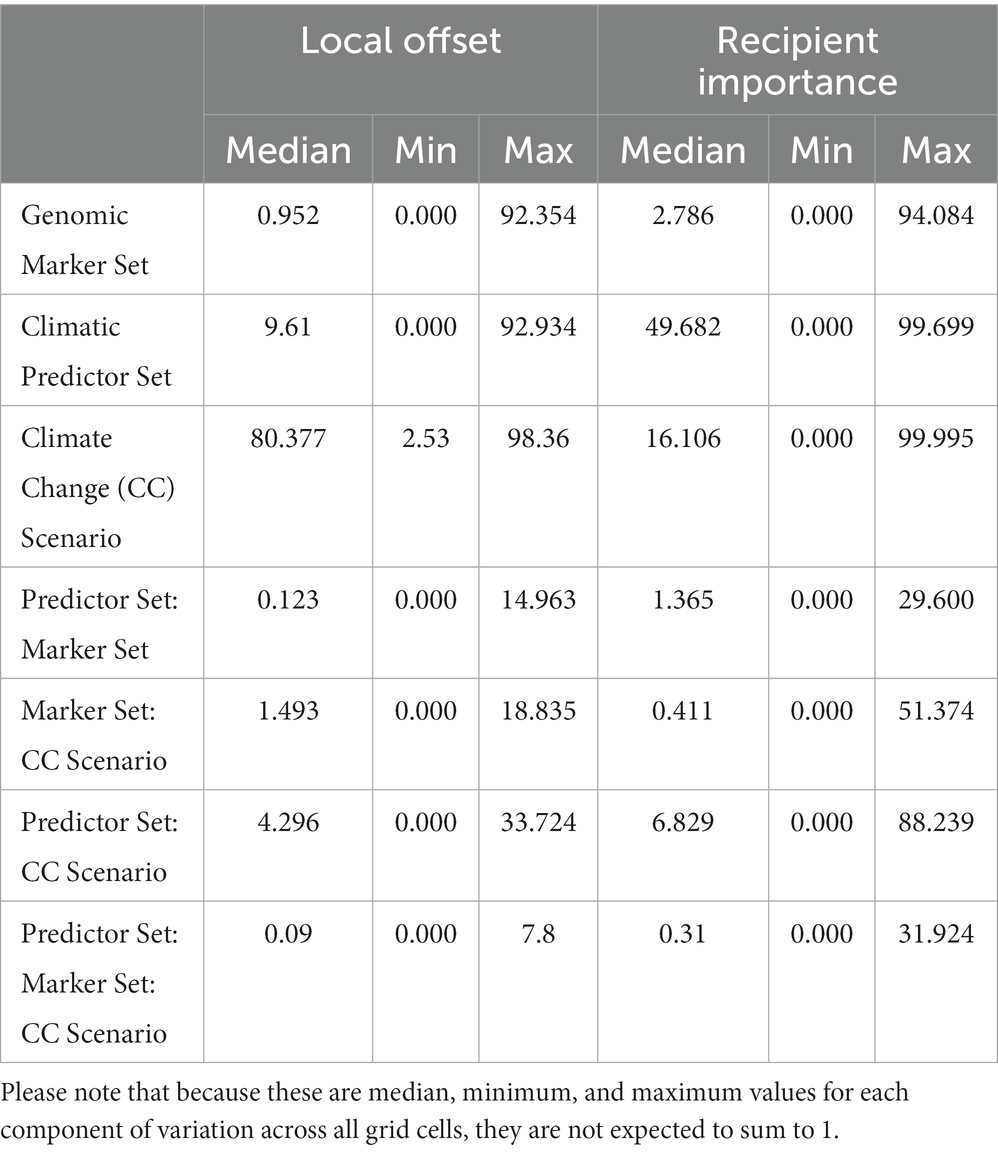
Table 1. Median (minimum, maximum) of proportions of the total sum of squares from the three-way ANOVAs performed for each grid cell currently occupied by red spruce (for Local Offset, see Figure 3) or the entire study area (for Recipient Importance using an Offset Threshold of 1 σ, see Figure 5) evaluating the relative contributions of Genomic Marker Set (Candidate vs. All Loci), Climatic Predictor Set (Broad vs. Narrow Predictor Set), Climate Change Scenario (SSP2-45, vs. SSP5-85), and their interactions.
The CCA for LO (Figure 5A) confirms the high relevance of Climate Change Scenario (p < 0.01), which clearly separates the SSP2-45 and SSP5-85 scenarios along the first axis (explaining 75% of overall variation). The second axis (explaining 22% of variation) mostly represents variation between the two Climatic Predictor Sets (p < 0.05) and no significant difference between the two Genomic Marker Sets (p = 0.367).
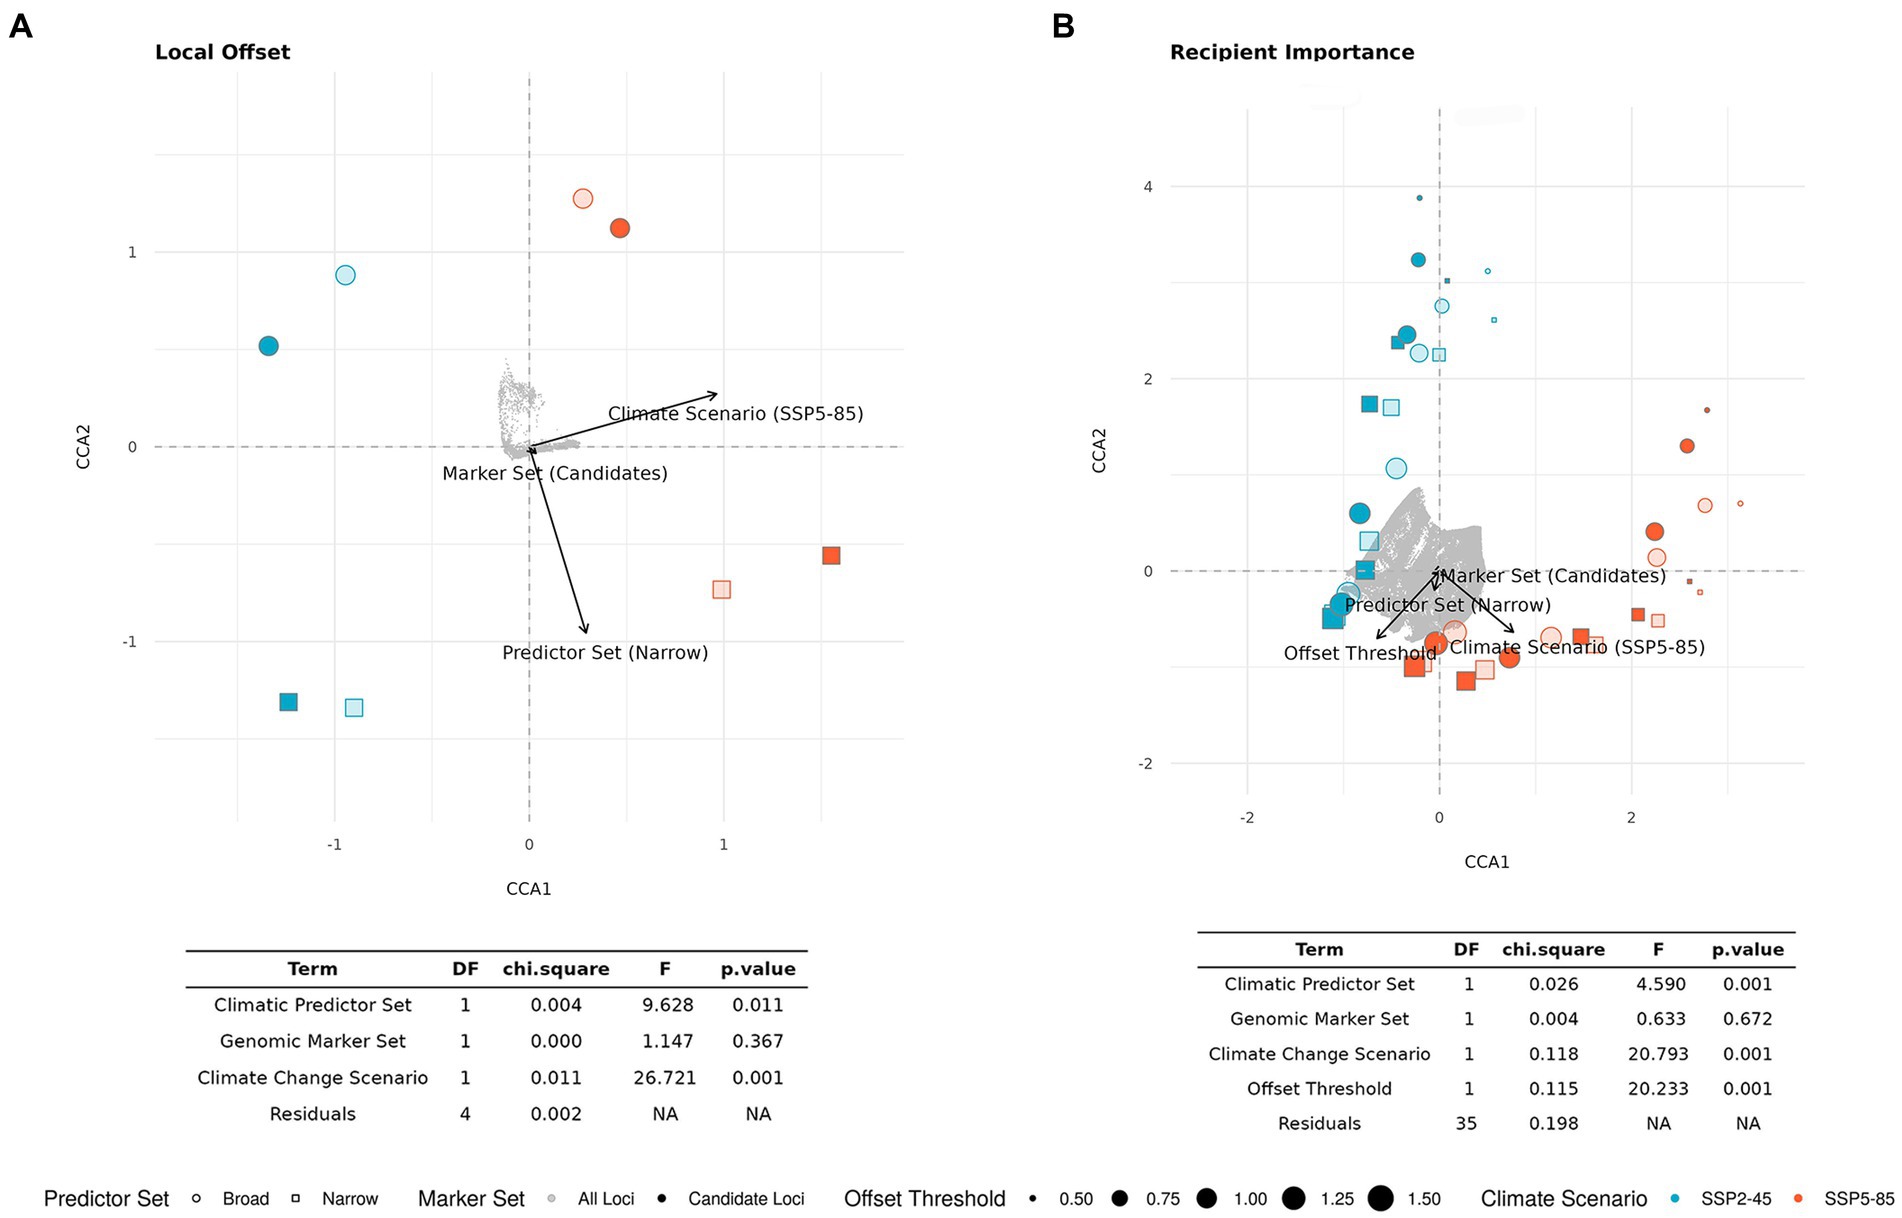
Figure 5. Ordination plot and statistical results of constrained correspondence analysis (CCA) for the relationships between scenario components [Genomic Marker Set, Climatic Predictor Set, Climate Change Scenario, and Offset Threshold (if applicable)] and estimates of (A) Local Offset in extant spruce populations and (B) Recipient Importance across the entire study area. Light gray dots represent grid cells. For the corresponding geographic maps see Figures 3, 6; Supplementary Figures S5–S8.
3.3. Recipient importance
RI predicts a drastic habitat loss in the United States and northward shift of suitable climate under all tested model component combinations (Figure 6). Under SSP2-45, Canadian areas with high RI span from Southern Labrador and Québec far into western Ontario. Under SSP5-85, suitability in these western regions notably decreases with high RI areas expanding further into northern Québec and Labrador. Compared with the Broad Predictor Set (Figures 6A–D), RI projections based on the Narrow Predictor Set (Figures 6E–H) indicate similar geographic areas to become suitable for the species under future climate conditions. However, the Narrow Predictor Set projects homogenously very high RI within these areas. RI predicted using All Loci is somewhat lower as compared to predictions using Candidate Loci. Maps with RI predictions based on the four other Offset Thresholds can be found in Supplementary Figures S5–S8. Overall, the coefficient of variation for RI, which can be interpreted as a habitat suitability metric that takes intra-specific differentiation into account, ranges from 0 to 243 and is highest in areas of near zero RI and lowest in the areas with highest predicted RI in Québec and Ontario (Supplementary Figure S13B).
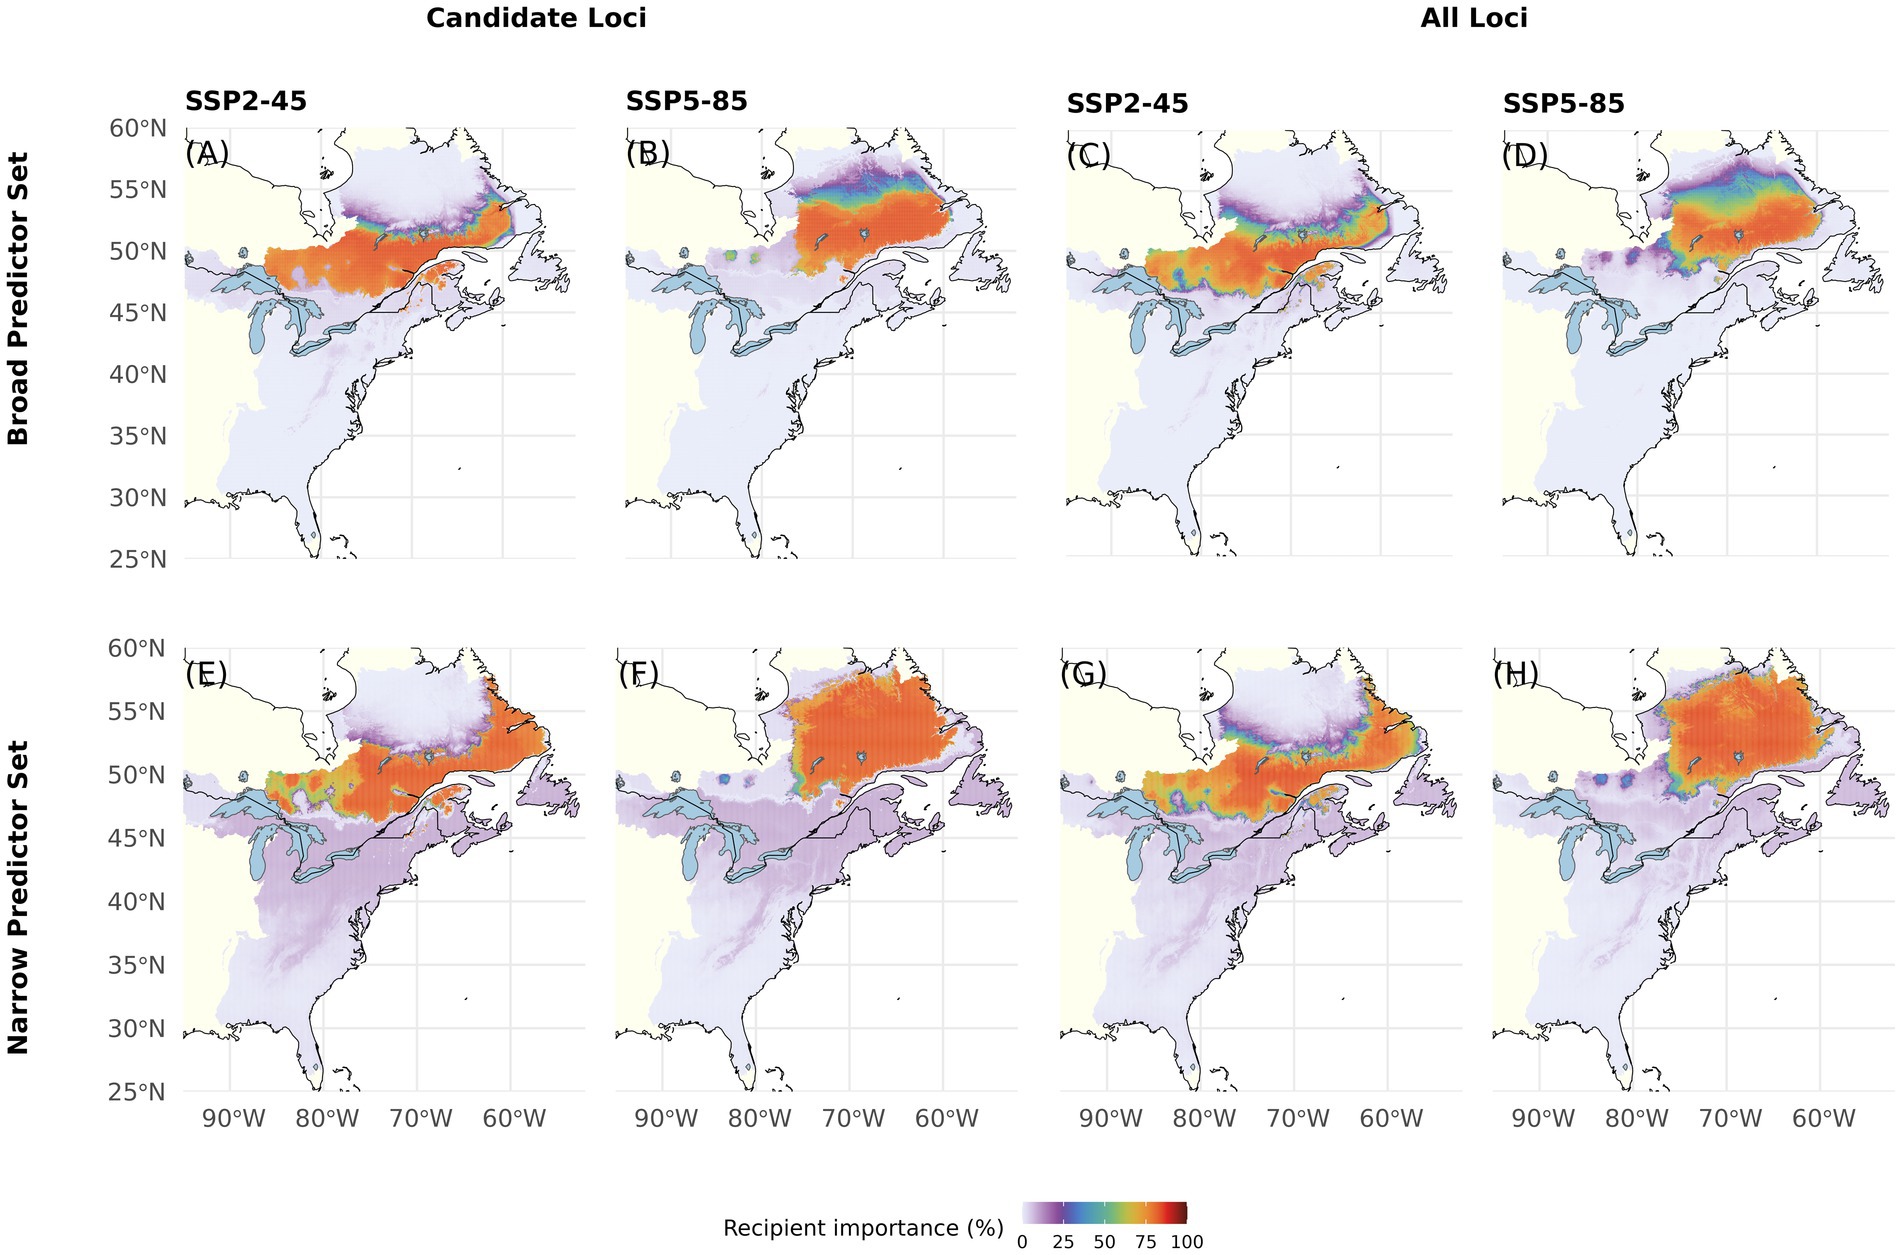
Figure 6. Recipient Importance (RI) for red spruce Picea rubens by the end of the 21st century assuming moderate (SSP2-45) and very high greenhouse gas emissions (SSP5-85). RI was calculated based on Gradient Forest derived genomic offsets using a set of 240 Candidate (A,B,E,F) or All Loci (C,D,G,H) and eleven climate variables (Broad Predictors, A–D) or a subset of seven less correlated climate variables (Narrow Predictors, E–H). Here, RI was calculated based on an Offset Threshold of 1σ. See Supplementary Figures S5–S8 for results based on different Offset Thresholds.
Partitioning of RI variation within our study area (multi-way ANOVA; Figure 7; Table 1) showed that Climatic Predictor Set had the greatest influence within the species’ US range, whereas the variation between RI predictions for the Canadian regions, which may become most suitable for red spruce in the future, is most strongly caused by Climate Change Scenario. Again, Genomic Marker Set and interactions among the different components are of minor importance, except for very confined geographic areas (Figures 7A, D–F; Table 1).
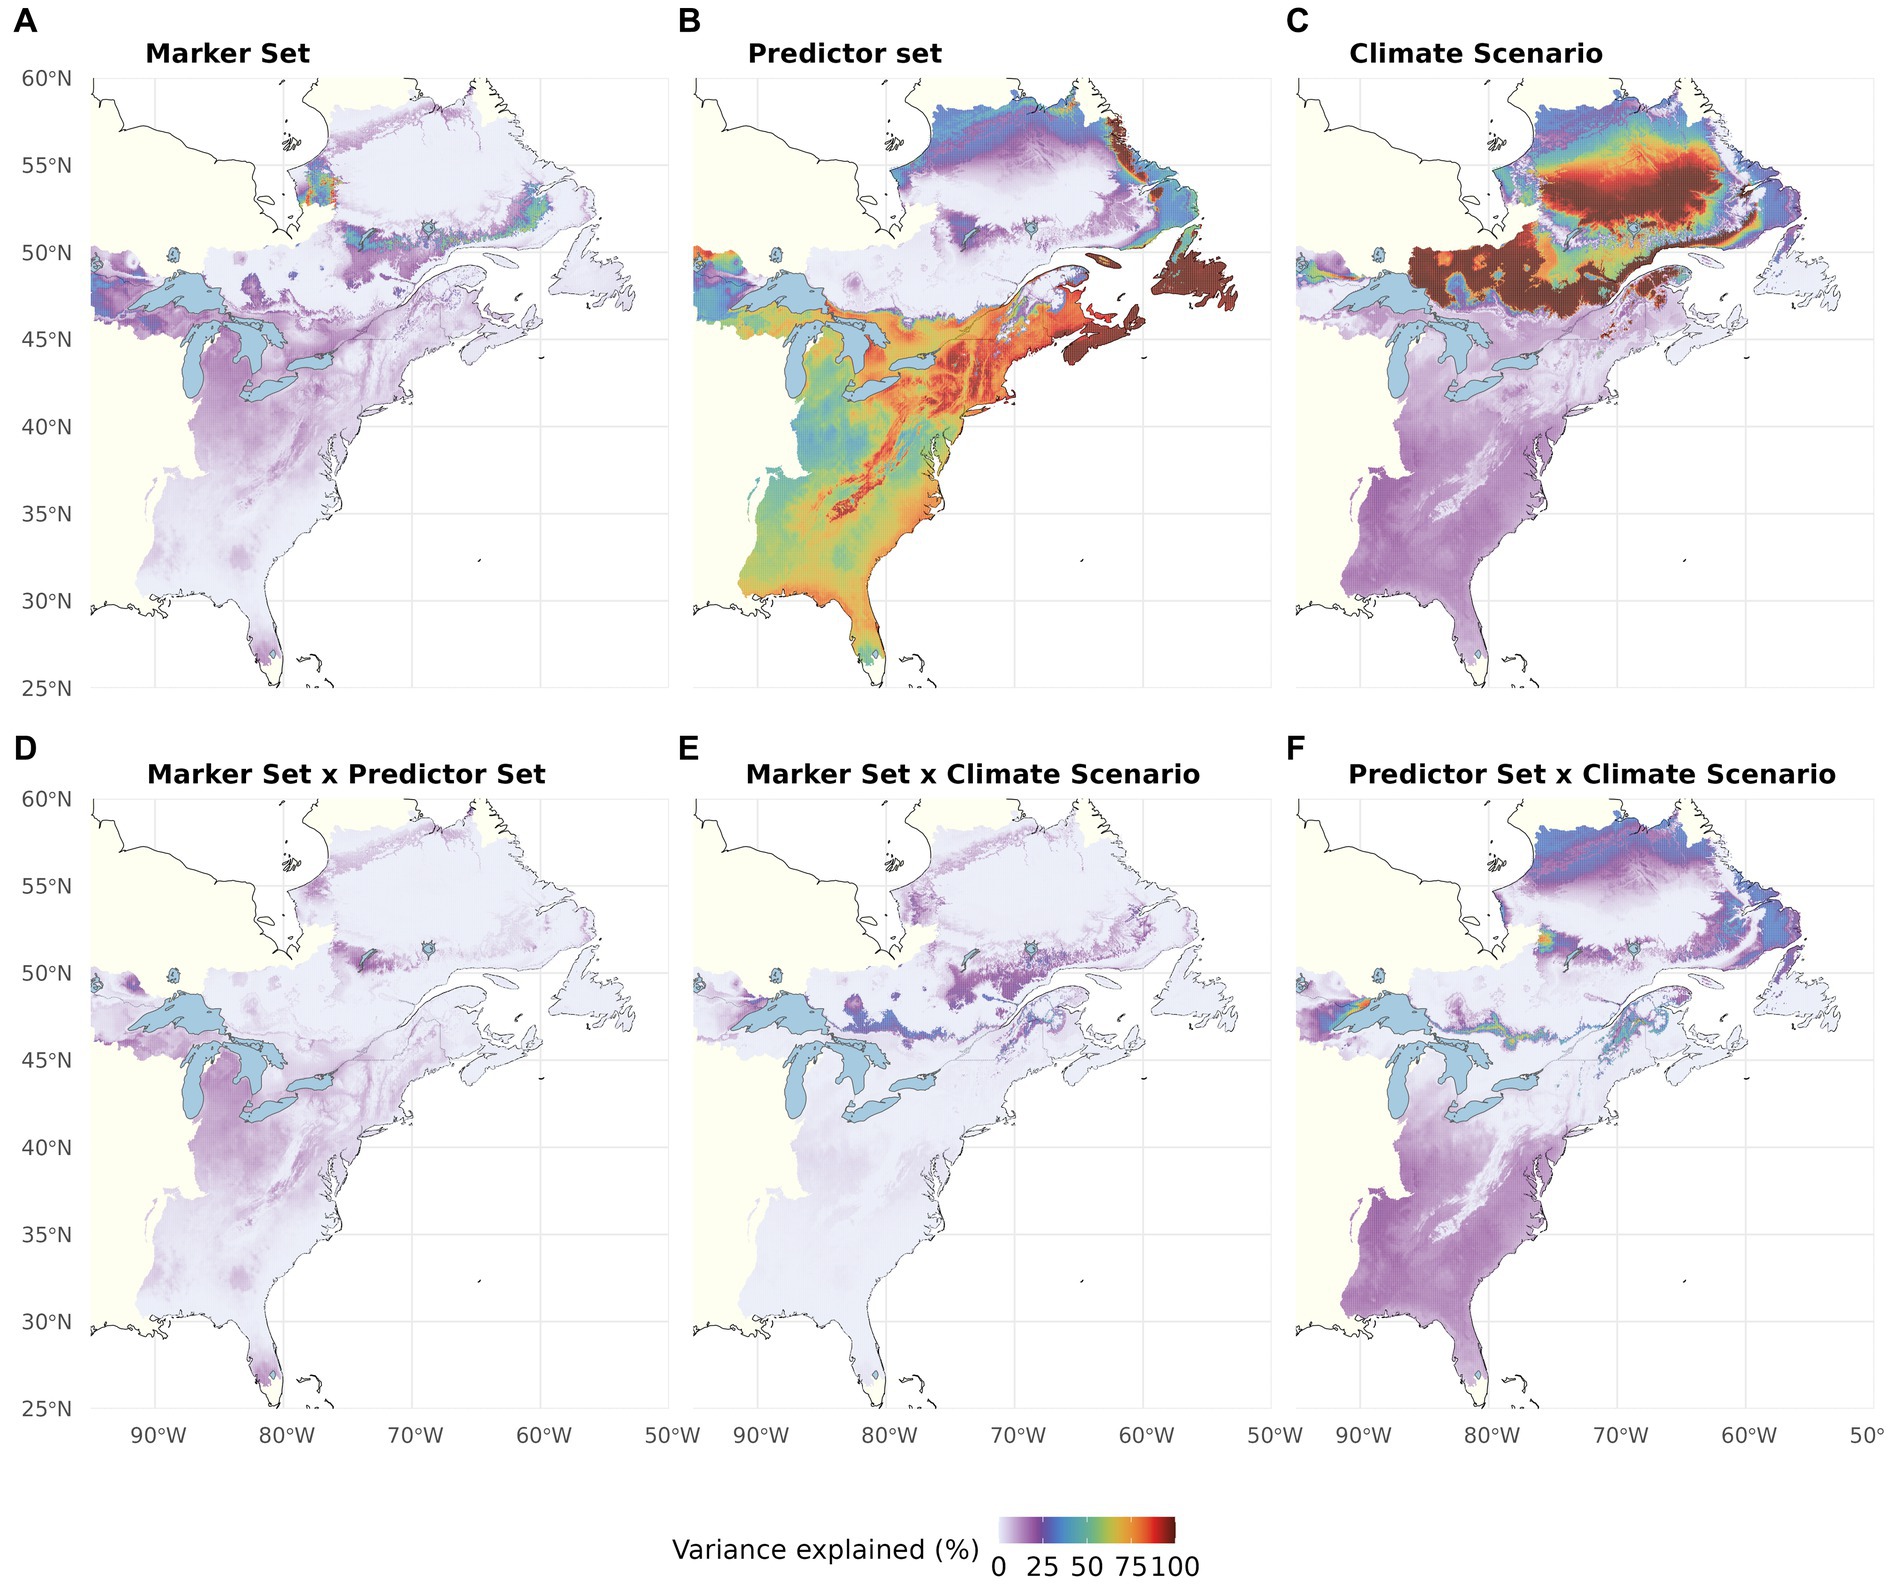
Figure 7. Proportion of the total variation (sum of squares) in Recipient Importance accounted for by Genomic Marker Set (A), Climatic Predictor Set (B), Climate Change Scenario (shared socio-economic pathway, SSP) (C) and their two-way interactions (D–F). The Offset Threshold was set to 1 σ. The three-way interaction explained very little variation (see Table 1).
In the CCA presented in Figure 5B, we included all scenarios across the five different Offset Thresholds and find a high influence of Climate Change Scenario (p < 0.001) separating scenarios along the first axis, which explains 46% of overall variation. The variation along the second axis, explaining another 46% of the variation, is largely determined by Offset Threshold (p < 0.001), apparently limiting the visible influence of Climatic Predictor Set (still p < 0.001) we found in the ANOVAs, which did not consider different Offset Thresholds. The strong, and non-surprising, influence of Offset Threshold choice is clearly apparent if comparing Figure 6 and Supplementary Figures S5–S8.
3.4. Donor importance
When discussing the results on Donor Importance it is important to keep in mind that this metric is expressed in percent and refers to different absolute numbers of recipients depending on the size of the recipient area under consideration. When only considering transplants between extant spruce populations and using the Broad Predictor Set and SSP2-45 (Figure 8A), DI is predicted to be lowest at the southern and northern range edges, intermediate through large parts of the range core and highest at mid latitudes. Under SSP5-85 (Figure 8B), predicted DI decreases to near zero in almost all populations except at mid latitudes. For the All Loci set (Figures 8C,D), the predictions are similar but more homogenous along the coast under SSP2-45. The most notable difference when using the Narrow instead of the Broad Predictor Set is higher DI predictions for the Southern and Central Appalachians as well as at mid latitudes of the range (Figures 8E–H). If we additionally consider potential transfer to currently unoccupied locations within the eco-regions currently inhabited by red spruce, DI increases through the range core and at the Northern edge for all scenarios and decreases at mid latitudes as well as in the Central and Southern Appalachians but is still higher in those latter areas when using the Narrow as compared to the Broad Predictors. Further extending the recipient area to adjacent eco-regions has a homogenizing effect on DI across all scenarios. The most notable difference between scenarios remains when using the Broad Predictors, in which we find a lower DI in the Southern and Central Appalachians as compared to the rest of the range, whereas the opposite is predicted using the Narrow Predictors. Maps with DI predictions based on the four other Offset Thresholds can be found in Supplementary Figures S9–S12.
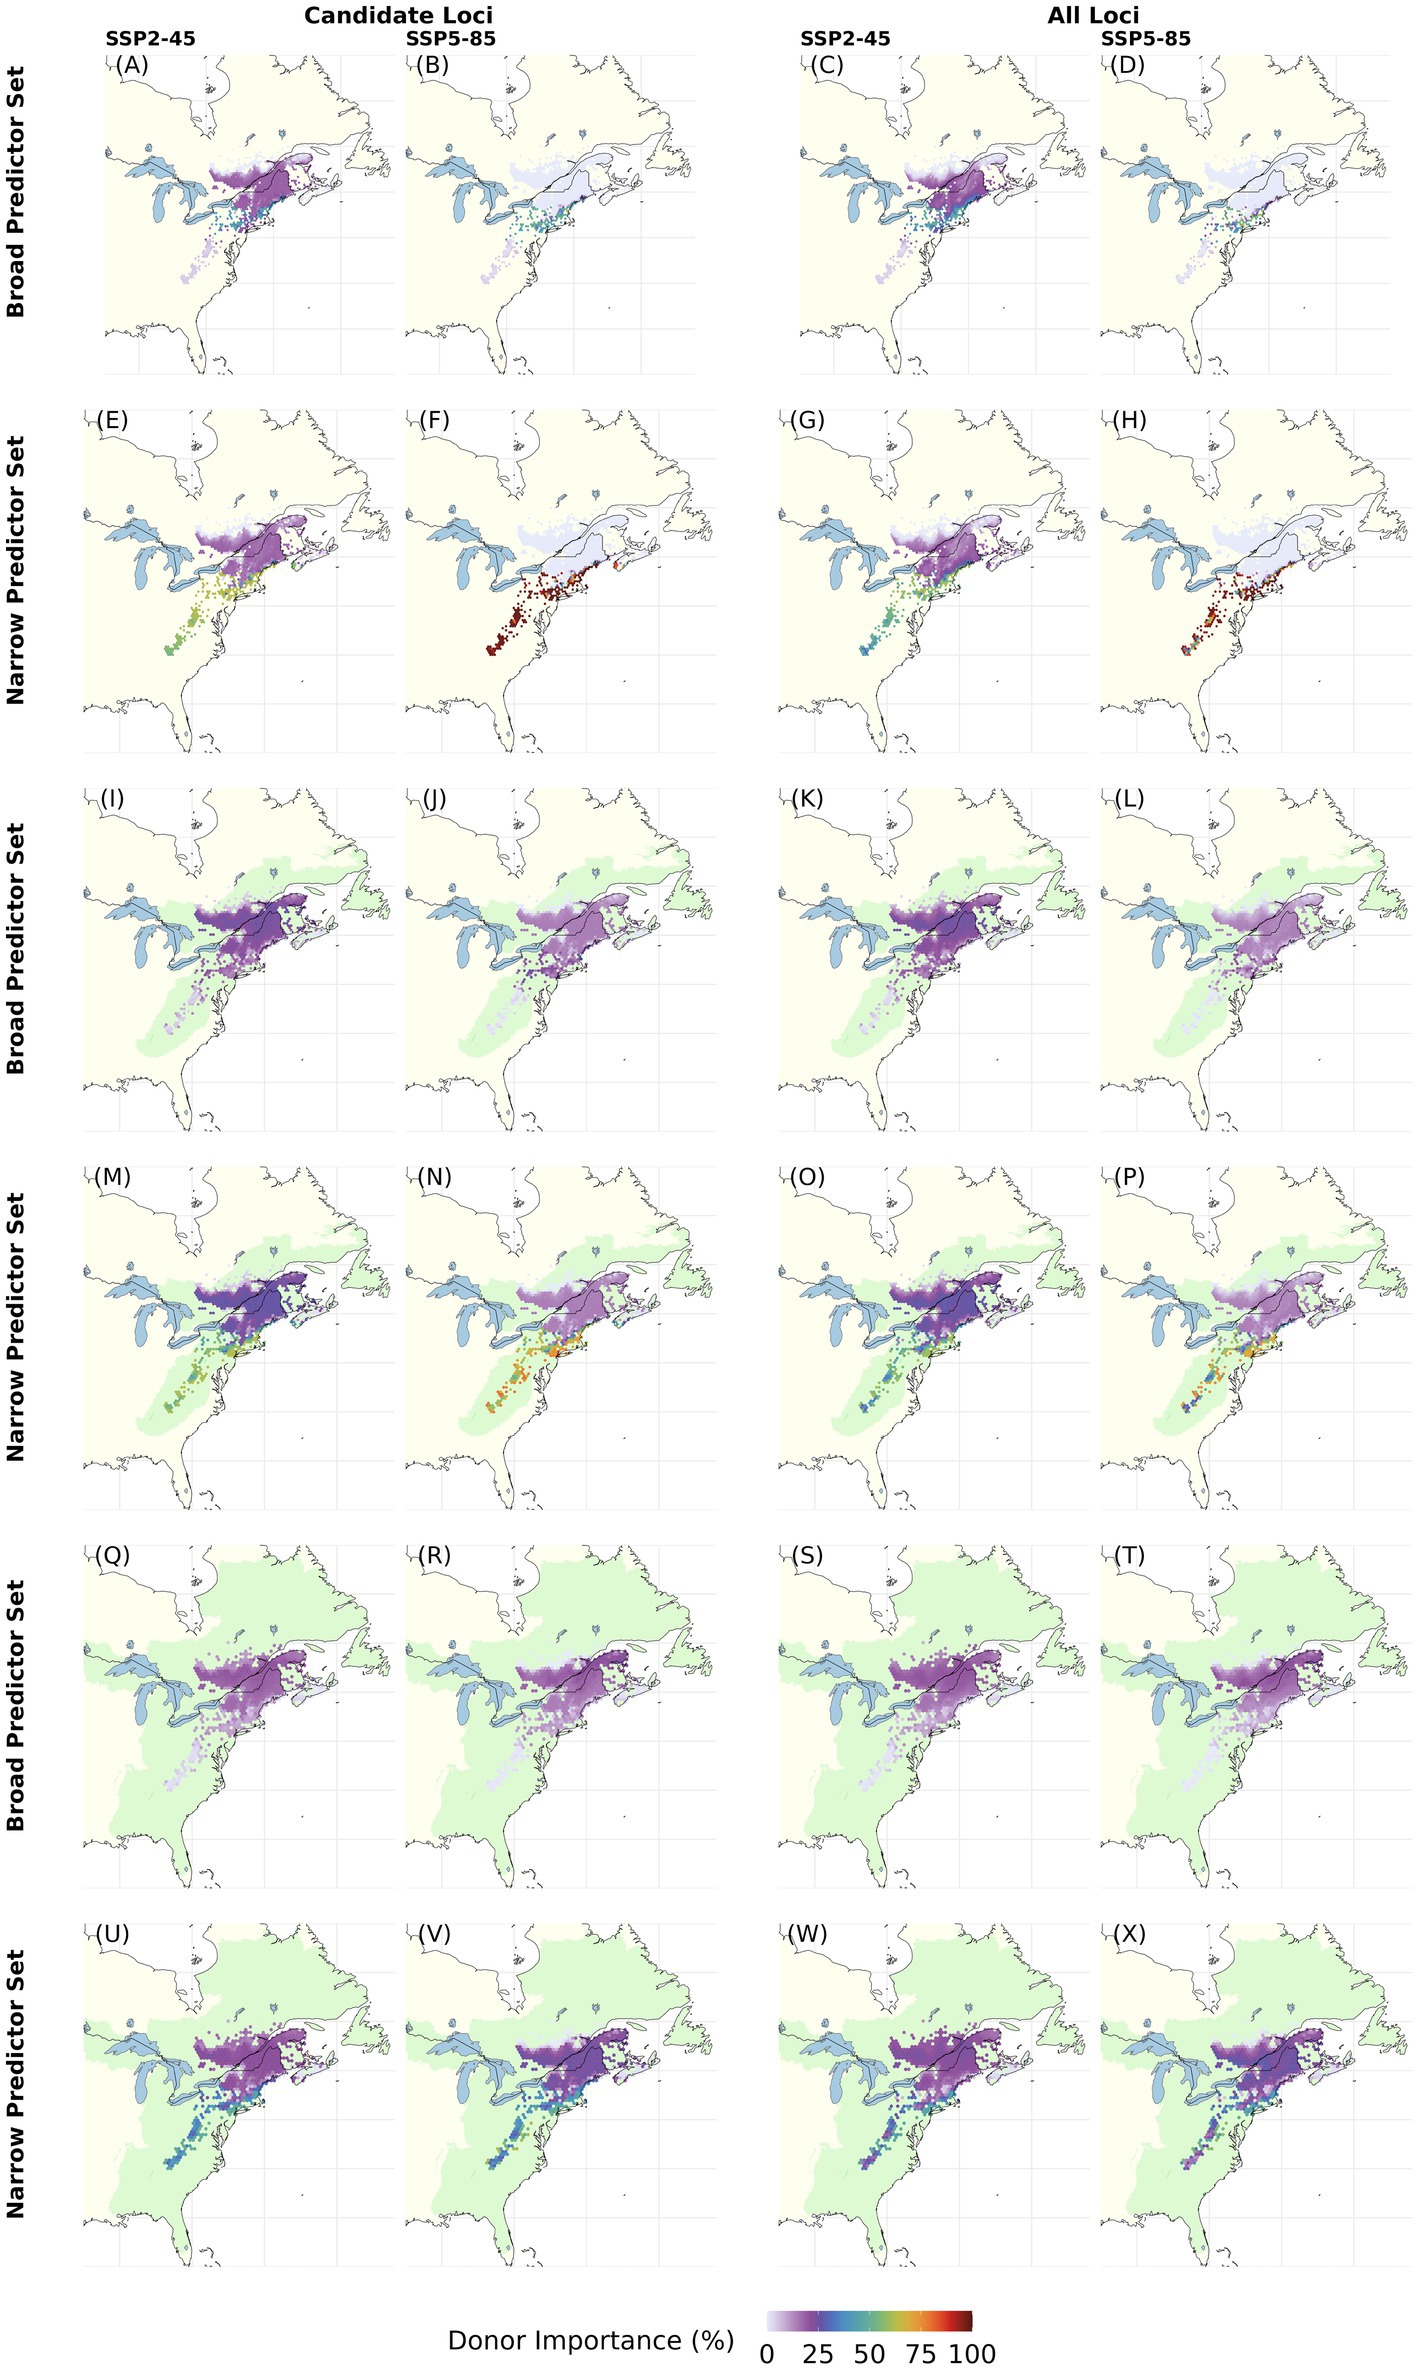
Figure 8. Maps of Donor Importance (DI) for each grid cell with current red spruce Picea rubens populations with increasing recipient area (light green) for end of 21st century climate assuming moderate (SSP2-45) and very high greenhouse gas emissions (SSP5-485). DI was calculated based on Gradient Forest derived genomic offsets using a set of 240 Candidate (left column) or All Loci (right column) and eleven climate variables (Broad Predictors) or a subset of seven less correlated climate variables (Narrow Predictors). The recipient area comprises (A–H) all cells with extant red spruce populations (i.e., same as donor populations), (I–P) ecoregions currently inhabited by red spruce, and (Q–X) including adjacent ecoregions [ecoregions sensu Dinerstein et al. (2017)]. As recipient area increases, percentage DI refers to an increasing numbers of recipient cells: A–H, 8825; I–P, 128250; Q–X, 283348 cells at a spatial resolution of 2.5°. Note that this figure shows choropleth maps with each hexagonal bin representing the average over spatial grid cells occupied by red spruce within the binned area. Here, DI was calculated based on an Offset Threshold of 1 σ. See Supplementary Figures S9–S12 for results based on different Offset Thresholds.
These findings are reflected in the variance partitioning among DI predictions (Table 2; Figure 9; Supplementary Figure S14). When considering only extant spruce populations and currently inhabited ecoregions, Climate Change Scenario has the greatest influence on offset uncertainty across large parts of the range (Figures 9A–F). Genomic Marker Set is of some influence at the northern range edge and along the coast (Figures 9A,D). Climatic Predictor Set reaches high importance in the Southern and Central Appalachians, at mid latitudes, along the coast (Figures 9B,E) and for existing spruce populations as recipients also along the northern range edge (Figure 9B). These geographic patterns in component influence shift considerably when we extend the recipient area to include adjacent eco-regions. Here, Climate Change Scenario only maintains high relevance at the northern range edge, whereas Genomic Marker Set slightly gains importance along all range edges and Climatic Predictor Set becomes the most important component nearly throughout the entire range except at the northern edge. With some very local exceptions, two-way interactions between the scenario components were of minor relevance (Supplementary Figure S14). Only when using all eco-regions as recipient area, the interaction of Genomic Marker Set and Climate Change Scenario gained moderate importance in larger parts of the range. Three-way interactions were of very low importance (Table 2).
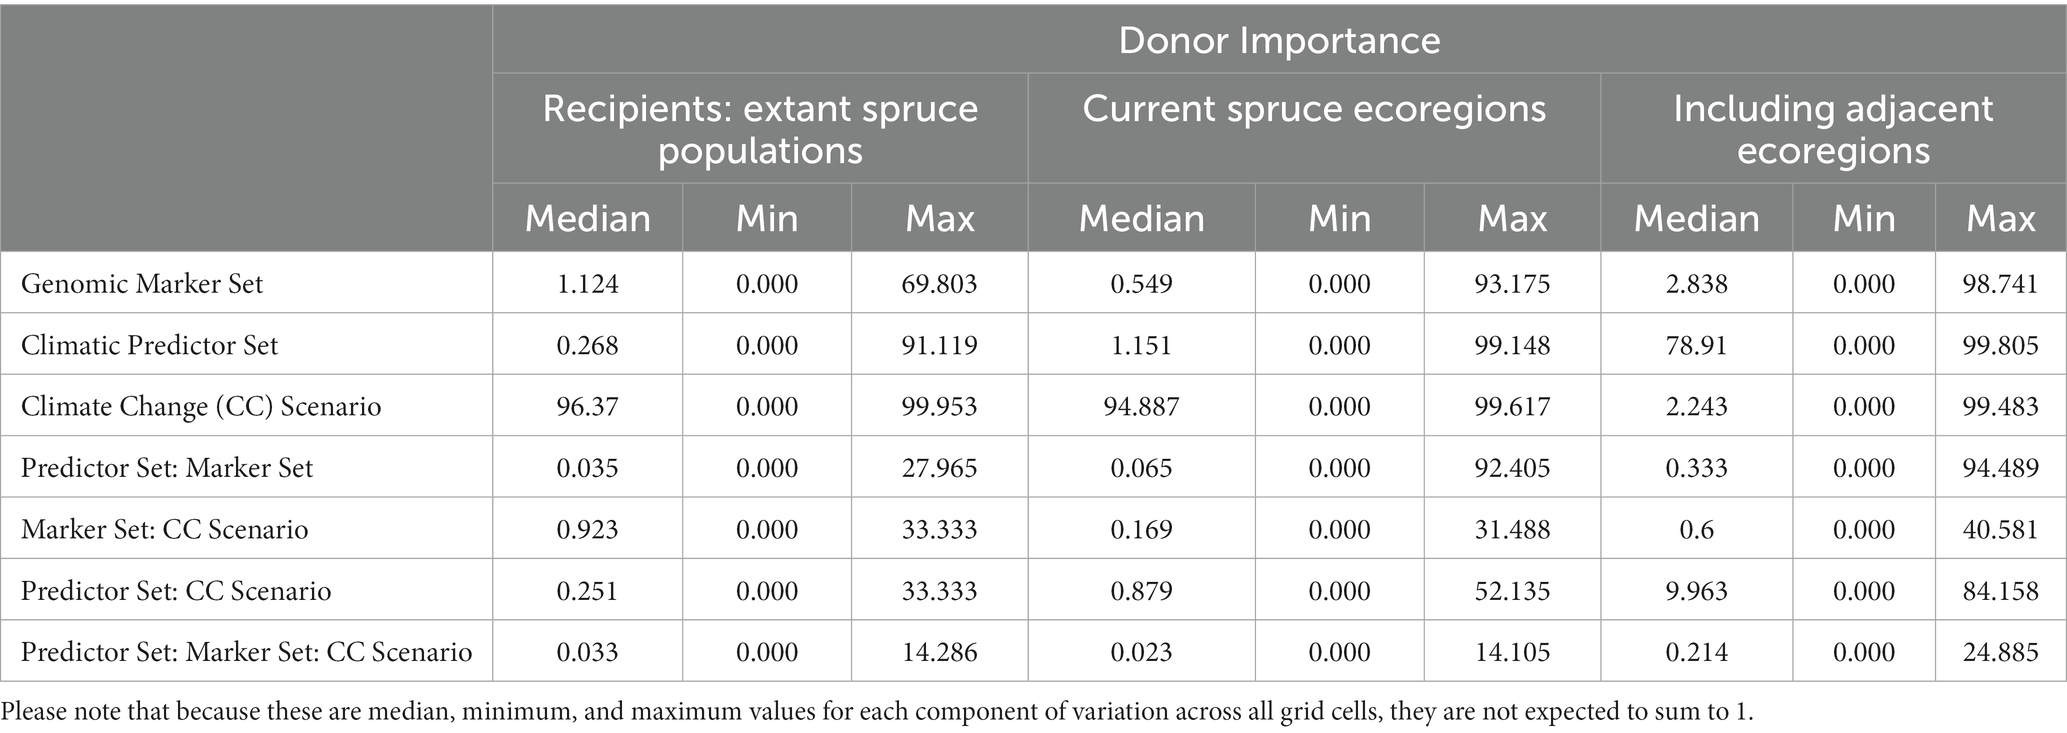
Table 2. Median (minimum, maximum) proportions of the total sum of squares from the three-way ANOVAs performed for each grid cell currently occupied by red spruce (see Figure 10) evaluating the relative contributions of Genomic Marker Set (Candidate vs. All Loci), Climatic Predictor Set (Broad vs. Narrow Predictor Set), Climate Change Scenario (SSP2-45, vs. SSP5-85), and their interactions to Donor Importance with recipient areas defined as all cells with extant red spruce populations (i.e., same as donor populations), ecoregions currently inhabited by red spruce, and inhabited and adjacent ecoregions (ecoregions sensuDinerstein et al., 2017).
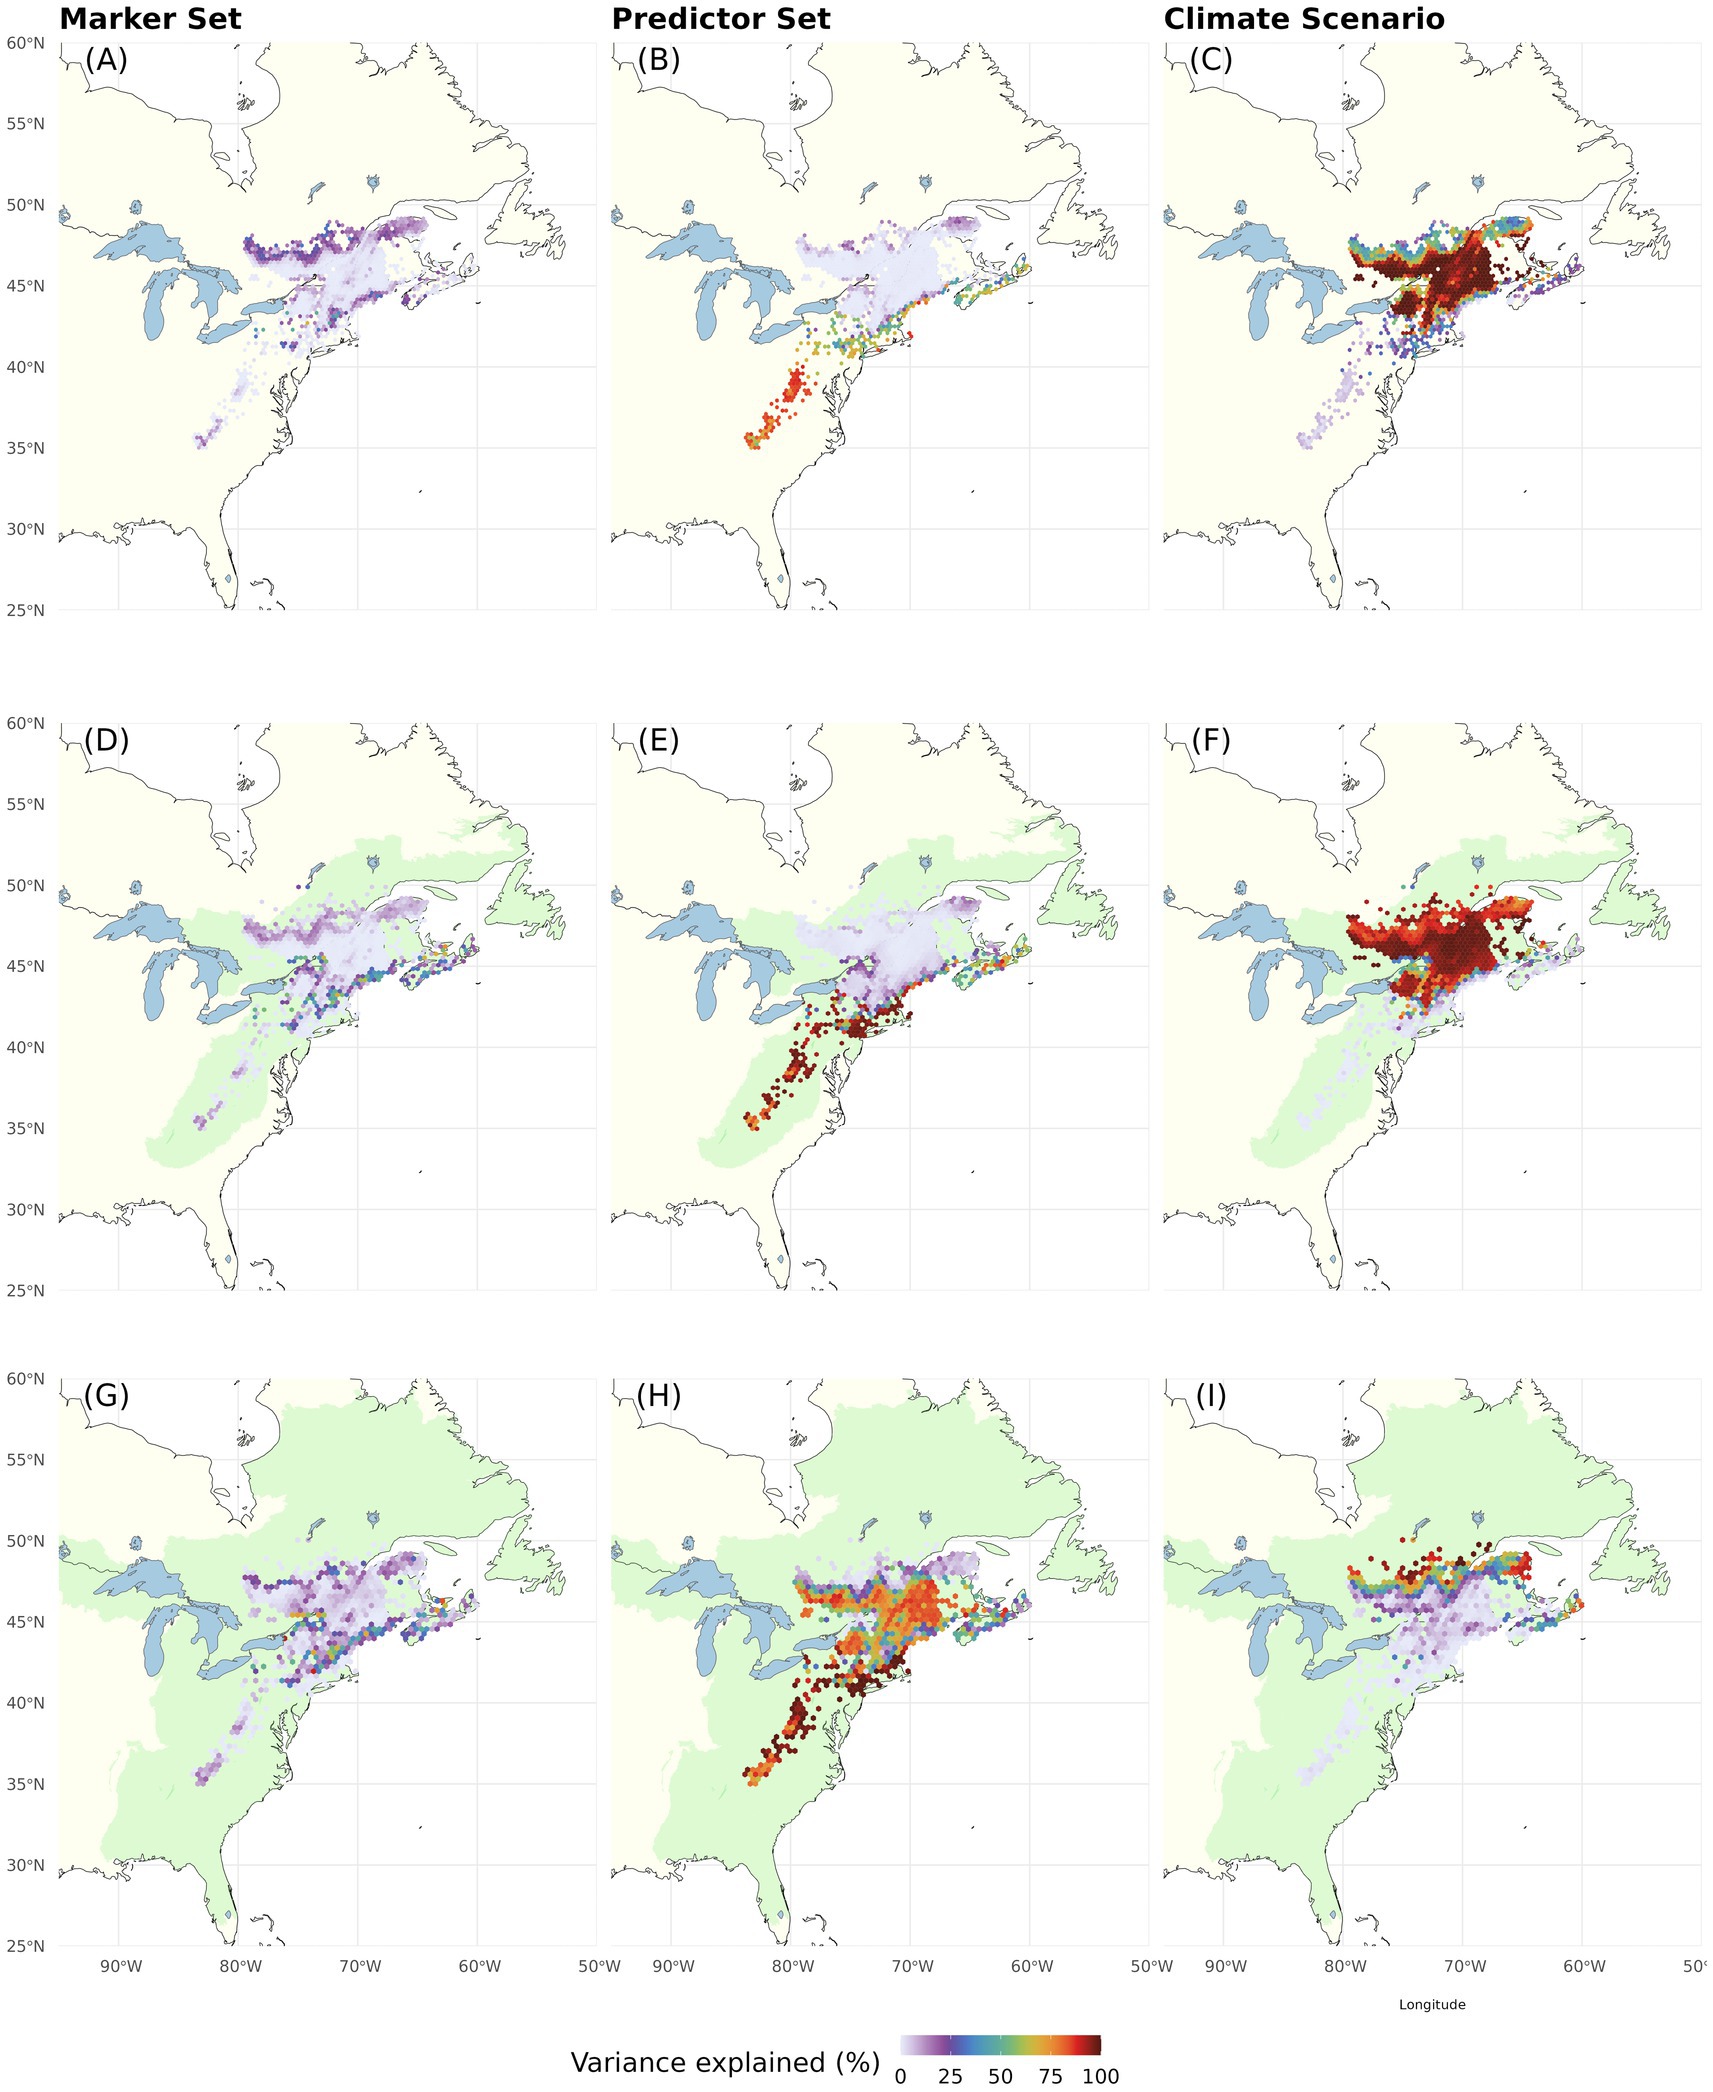
Figure 9. Proportion of the total variation (sum of squares) in Donor Importance accounted for by Genomic Marker Set (left), Climatic Predictor Set (center), and Climate Change Scenario (right). The recipient area comprises (A–C) all cells with extant red spruce populations (i.e., same as donor populations), (D–F) ecoregions currently inhabited by red spruce, and (G–I) including adjacent ecoregions [ecoregions sensu Dinerstein et al. (2017)]. The Offset Threshold was set to 1 σ. Two-way interactions are shown in Supplementary Figure S14. The three-way interaction explained very little variation (see Table 2).
The CCA for DI presented in Figure 10 included all scenarios across the five different Offset Thresholds (see Figure 8; Supplementary Figures S9–S12 for DI maps using different Offset Thresholds) and reflects the shifting relevance of scenario components for the metric as we consider an increasing number of potential recipient locations from Figures 10A–C. Using only current spruce populations as recipients, we find a high influence of Climate Change Scenario (p < 0.001) very clearly separating scenarios along the first axis, which explains 82% of overall variation. The variation along the second axis, explaining 15% of the variation, is largely determined by the chosen Offset Threshold (p < 0.001) with an additional minor influence of Climatic Predictor Set (p = 0.056). The strong relevance of Offset Threshold is much more pronounced for scenarios involving SPP5-85 than for those with SSP2-45. Genomic Marker Set is of minor importance in this analysis (p = 0.308). Figure 10B shows the CCA for scenarios including recipient locations from all eco-regions currently inhabited by red spruce. Along the first axis, which explains 79% of variation, we mostly find separation based on Offset Threshold (p < 0.001). The second axis explains 18% of variation attributable to Climate Change Scenario (p < 0.001) and Climatic Predictor Set (p < 0.001). A distinction in the relevance of Offset Threshold between the two Climate Change Scenarios is no longer apparent. Again, Genomic Marker Set has comparably little relevance (p = 0.248). Including recipients from the entire study area (Figure 10C) yields an overall similar picture with 79% of variance explained along the first axis mostly by Offset Threshold (p < 0.001) and Climate Change Scenario (p < 0.01), Climatic Predictor Set (p < 0.001) and Genomic Marker Set (p = 0.137) having a higher loading on the second axis, which explains 17% of variation.
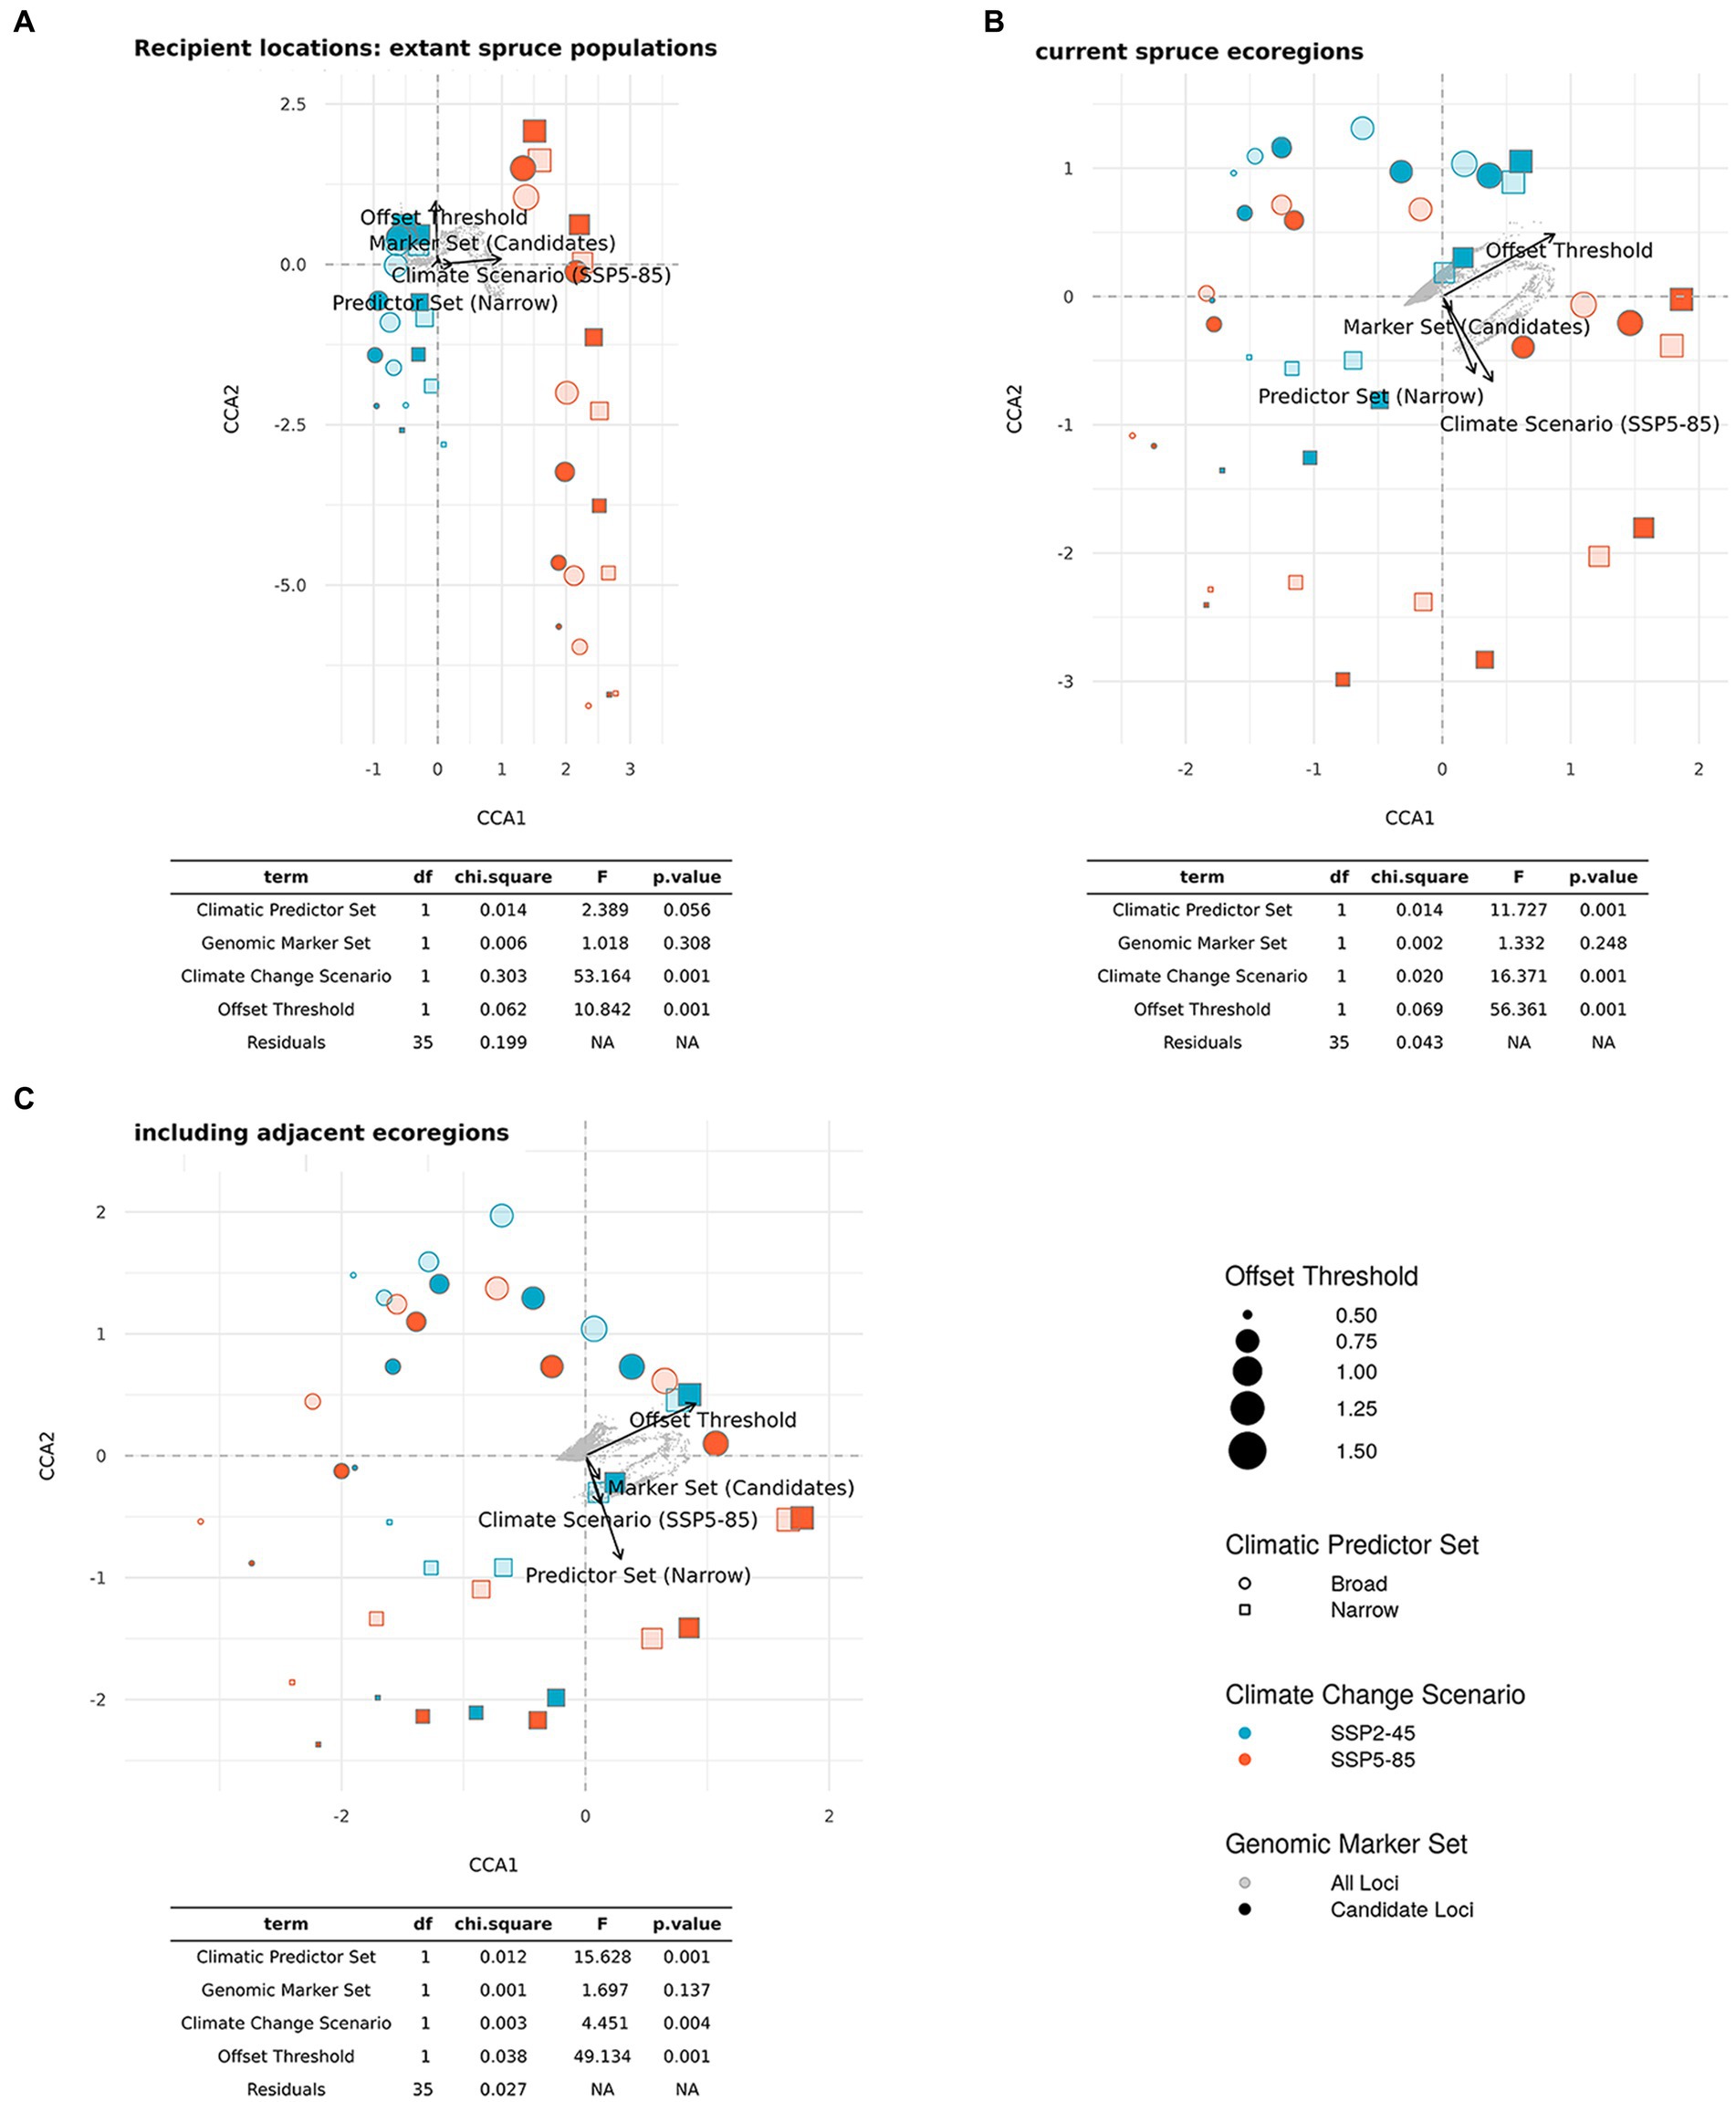
Figure 10. Ordination plots and statistical results of constraint correspondence analysis (CCA) for the relationships between scenario components (Genomic Marker Set, Climatic Predictor Set, and Climate Change Scenario (shared socio-economic pathway, SSP), and Offset Threshold) and estimates of Donor Importance (DI) of current red spruce populations. The potential recipient locations comprise all cells (A) with extant red spruce populations, (B) in ecoregions currently inhabited by red spruce, and (C) in inhabited and adjacent ecoregions (ecoregions sensu Dinerstein et al., 2017). Note that as recipient area increases from A to C, percentage DI refers to an increasing number of recipient cells.
4. Discussion
Spatial modeling of environmental risks is becoming increasingly common as practitioners seek information about how global change is likely to impact natural systems. Genome offset-based predictions integrate intra-specific genomic differentiation, addressing a knowledge gap regarding adaptations to local environmental conditions that is still prevalent in global change biogeography. However, for such forecasts to be used wisely, we need to better understand how uncertainty inherent to these approaches can affect conservation planning. Here, we highlight how different inputs and decisions made during the modeling process can introduce uncertainty into model projections and discuss the implications of such uncertainty for downstream conservation actions. Our sensitivity analyses showed that the three genomic offset-based metrics Local Offset (estimation of in situ maladaptation risk), Recipient Importance (prediction of habitat suitability for immigration while accounting for genomic differentiation), and Donor Importance (suitability of individual populations to future climates across the landscape) were all strongly influenced by the chosen Climate Change Scenario and the selection of an Offset Threshold for RI/DI. Most remarkably, the use of Candidate vs. All Genomic Markers in our dataset had little influence on all three types of offset predictions. In contrast, the choice of predictors was an influential decision that could lead to different management implications, especially for geographic areas within the current US range of red spruce. Donor Importance strongly depended on the recipient area considered. Assisted colonization beyond the northern range edge could not only help mitigate the risks of severe climate change to the survival of the species, but also preserve significant portions of its climatic adaptive capacity. In this scenario of assisted colonization, the choice of Climatic Predictor Set becomes critically important in the selection of donor populations. Below, we discuss the importance and implications of the four scenario components and how importance varies geographically. Finally, we synthesize the implications of our results for conservation and restoration planning.
4.1. Using a reduced set of candidate loci for climate adaptation provides similar predictions as when using all SNP loci
Using a set of thoroughly selected Candidate SNPs instead of fitting landscape genomic models to allele frequencies of All Loci had remarkably little impact on our offset predictions. This holds for all three metrics, with exceptions occurring mostly near the edges of either the current range (LO, DI) or of the geographical areas likely to be particularly suitable in the future (RI). These findings are in contrast with other studies that used various marker sets to predict Local Offsets (Nielsen et al., 2021; Archambeau, 2022) and may therefore be specific to the study species or genomic dataset and not represent a broad generality. Moreover, when we used common garden data to compare the predictive power of genomic offsets based on All vs. Candidate Loci, we found higher predictive power for the Candidate Loci offsets in one garden and slightly higher predictive power of the All Loci offsets in the other two gardens for both Climatic Predictor Sets (Figure 2).
To gain a better understanding of the underlying causes, in particular to examine as to how far the All Loci predictions are in fact driven by the Candidate Loci, we fitted Gradient Forest models and calculated Local Offsets and common garden offsets for six additional genomic marker sets. These sets included the All Loci set without the 240 Candidate Loci, 999 sets of each 240 random loci (combined into one Gradient Forest model), and each 671 candidates identified by our four different GEA approaches. We then correlated the Local Offsets among all pairs of marker sets and regressed growth performance of red spruce seedlings against the common garden offsets to evaluate their predictive power. These additional analyses confirmed the minor importance of marker choice, as LO calculated based on all eight different marker sets were highly correlated and offsets had comparable predictive power in the common gardens as those based on our original two Genomic Predictor Sets. See the Supplement (including Supplementary Figures S15–S21) for more details.
The common garden findings align with results from Fitzpatrick et al. (2021) or Capblancq and Forester (2021) who found that offsets calculated using outlier loci had the predicted negative association with tree growth in common gardens, but less expectedly, offsets based on randomly selected loci did too, and the latter even had slightly higher predictive power. Similarly, a recent sensitivity analysis by Lind et al. (2023) found that the predictive performance of GF-derived genomic offsets for growth and mortality of three conifer taxa in transplant experiments were surprisingly not improved by the use of GEA outliers as compared to equally sized sets of random loci. The underlying reasons are not yet known but might reflect effects of isolation by environment (IBE) on gene flow and population differentiation, and/or alignment of environmental gradients with expansion history (e.g., post glacial recolonization). In our case, the most likely explanation for this outcome lies in the demographic history of red spruce, which established genetic clines during post-glacial recolonization from a southern refugium (Capblancq et al., 2023) that are strongly correlated with climatic gradients involved in the evolution of local adaptation. This means that our All Loci set likely covaries along environmental gradients in much the same way as our Candidate Loci set. This problem of confounding between demographic history and the environmental gradients driving adaptation was extensively explored when identifying our Candidate Loci set (Capblancq et al., 2023) and represents an important challenge for landscape genomics studies seeking to capture the signal of adaptation along environmental gradients while also minimizing the influence of neutral demographic processes (Eckert and Neale, 2022). While the alignment between genome-wide diversity and environmental gradients is particularly strong in red spruce, this general phenomenon could also apply to many other temperate species with North–South recolonization histories that parallel climate gradients. Nevertheless, our common garden studies strongly suggest the existence of local adaptation in our sampled populations and confirm a higher predictive power of genomic offsets estimated using the Candidate Loci as compared to conventional climate transfer distances (Capblancq et al., 2023) and scaled climate transfer distances (Lachmuth et al., 2023).
4.2. Climatic predictor set has a larger and more spatially heterogenous effect on predictions than genomic marker set
For Local Offset and Donor Importance, uncertainty induced by predictor choice is highest in the Central and Southern Appalachians. For these regions where red spruce’s fragmented range poses a high conservation relevance (Rentch et al., 2007, 2016), populations generally exhibit rather low Local Offsets compared to the rest of the distribution area. Estimates of Local Offset were lower and DI estimates higher when using the Broad Predictors compared to the Narrow Predictors. This effect is particularly strong when just considering extant spruce populations as potential recipients and assuming the severe SSP5-85 Climate Change Scenario. Here, we see a range-wide DI of nearly zero using the Broad Predictors, meaning that there are virtually no opportunities for existing spruce populations, except for some coastal populations, to emigrate to other areas within the current range. The further we increase the potential recipient area, i.e., consider assisted migration beyond the extant populations or even currently inhabited eco-regions, the greater the influence of Climatic Predictor Set had on DI relative to the influence of Climate Change Scenario. These results underline that assisted migration could reduce the extirpation risks posed by extreme climate change. On the other hand, this prognosis requires the consideration of assisted colonization over very long, possibly unrealistic, spatial distances. The uncertainty induced by predictor choice then poses an additional challenge for the planning of such measures (see also Section 4.3).
Looking at RI, predictor choice is of highest importance in areas with low predicted suitability, which may have low relevance in areas of essentially zero RI but also was observed to affect large parts of the species’ current range. Again, the Narrow Predictors paint a slightly more positive picture for persistence within the current range of the species as compared to the Broad Predictors. The Broad Predictors include additional important variables such as potential evapotranspiration and continentality likely responsible for these effects (Lachmuth et al., 2023; Supplementary Figures S1–S2). Potential evapotranspiration and continentality as well as chilling degree days and precipitation as snow (the latter are included in both Predictor Sets) were the variables most strongly predictive of the genomic data, and were associated with steep sigmoidal genomic turnover curves (Lachmuth et al., 2023), which might lead to threshold behavior with large leaps in the magnitude of the calculated offsets that causes the strong divergence between the two climate forecast sets. The use of our Offset Threshold in the calculation of DI and RI might exacerbate this effect, since a small change in Offset Threshold can translate into large changes along the step part of the turnover curves. For users who do not feel comfortable setting a threshold for their study system or would like to avoid such threshold behavior, the use of mean or median offsets instead of the binary transferability matrix is an alternative. Simulations suggest that Gradient Forest models may have a bias toward fitting sigmoidal turnover curves even when the underlying allele frequency change is linear (Láruson et al., 2022). However, Capblancq et al. (2023) showed that red spruce candidate GEA outliers are well characterized by sigmoidal and threshold type allele frequency change along environmental gradients, so this may reflect actual non-linear patterns of adaptation on the landscape. The explanatory power of red spruce growth in the common gardens was similar for both Predictor Sets except in the Maryland garden where the Broad Predictors had significantly higher predictive power. Such incidence of comparably high predictive power but divergent projections was also observed in ecological niche models (Synes and Osborne, 2011). In summary, the choice of predictors introduces uncertainty when assessing risk to in situ conservation in the south, persistence of the species within its current range, and protection and selection of potential donor populations for assisted migration beyond its current range.
4.3. Climate forecasts induce high levels of uncertainty for red spruce conservation planning
Climate Change Scenario was of high importance for all three genomic offset-based metrics in our sensitivity analysis. The greatest uncertainty exists in the north of the current range and in the northern areas that are expected to become suitable in the future. However, LO and RI predictions indicate that the magnitude of climate change will also disrupt genotype–environment associations relative to contemporary differentiation in large parts of the species’ current range. These findings align with ENM studies. Here, forecasts based on the worst-case emission scenarios typically project near complete extirpation of red spruce habitat by the end of the 21st century either from the entire US American range (Peters et al., 2019; Lachmuth et al., 2023) or more specifically from the southern Appalachians (Iverson et al., 2008; Beane and Rentch, 2015; Walter et al., 2017; Yetter et al., 2021). ENMs also forecast overall declines in habitat suitability under best-case emission scenarios but the magnitude and extent of these declines tend to be less severe (e.g., Mosher, 2020).
The high risks predicted across ENM and offset based methods suggests that conservation and restoration efforts of extant red spruce populations will in any case be challenging under ongoing climate change. Uncertainty also complicates planning for more progressive interventions such as assisted migration because increasing severity of future climate is accompanied by farther distances north of the current range (or ecoregions) needed to reach suitable habitat according to RI. Planning for assisted colonization of these distant regions may be complicated not only by the general political and social obstacles that this practice still faces (Rivera et al., 2021), but also by the fact that climatic conditions are probably still too cold presently to enact assisted migration based on end of century predicted climate. Currently, growth of red spruce genotypes at the current northern range edge may actually be cold-limited, and provenance trials show increased growth with transplantation to warmer regions (Li et al., 2020). Far north of this range edge, this frost-susceptible species (Dumais and Prévost, 2007) would likely face severe cold injury and possibly mortality. The high uncertainty caused by Climate Change Scenario adds another layer of complexity because, unlike the other components included in our sensitivity analysis, it cannot be addressed and potentially reduced by further research but depends on broader political and societal developments beyond the control of conservation practice and scientific research.
4.4. “Not-to-exceed” offset threshold mainly affects magnitude rather than geographic patterns of recipient and donor importance
The Offset Threshold, which determines whether each donor–recipient match is recommended for potential propagule transfer, had a strong influence on the magnitude of DI and RI, as expected. Importantly, however, the general trends and geographic variations discussed in the previous sections remained stable across thresholds. For RI, there are notable constants across most scenarios and even threshold choices such as high RI in Québec and Ontario, but also non-zero RI in the US range down into the southern Appalachians, which suggests that successful restoration and conservation in this area is mostly a question of identifying the right donor populations. This consistency allows reliable derivation of general risk assessments and management recommendations, such as the prognosis of high vulnerability within the current range or the recommendation to consider assisted migration. When it comes to selecting donor and recipient locations for specific measures, however, threshold choice will become more critical. In Lachmuth et al. (2023), we used a “not-to-exceed” Offset Threshold of one standard deviation (1 σ) of contemporary spatial offsets beyond which we believe G-E disruption will exceed the current, presumably adaptive, differentiation common across the landscape. This threshold was chosen for demonstrative purposes. Given the strong negative effect of offset on growth performance in our comparably benign (except for climate) common garden environments (Figure 2) using a threshold larger than 1 σ will be unreasonable for most applications. Depending on the application, it might be preferable to place more emphasis on the degree and spatial pattern of adaptive differentiation and determine population-or region-specific thresholds. As such, one could imagine establishing more specific thresholds based on maps of genomic turnover or genomic cluster analyses (both ideally based on reliably identified adaptive loci) or experimental findings. Populations can exhibit differences in their capacity to tolerate environmental changes or cope with novel conditions, and setting thresholds at a regional level can help to capture this variability. Potential for choosing population-specific criteria include local inter-annual environmental variability (Mahony et al., 2017), among population variation in the sensitivity to disruption of local adaptation (Angert et al., 2020; Bontrager et al., 2021; Willi and Van Buskirk, 2022) or predicted reductions in performance (Wang et al., 2010). For the latter, offset effects on various fitness components or ideally population growth should be assessed.
4.5. Synthesis and management implications
Integrating landscape genomic modeling through the estimation of genomic offsets confirms the vulnerability of red spruce to climate change. However, it also demonstrates how climate-conscious management could help preserve this iconic native forest tree species. Across the range of scenarios presented here, genomic offset-based predictions suggest that red spruce faces high risks of climate change across its current range and that progressive methods such as assisted migration should be considered to help the long-lived tree species with long generation time and limited dispersal ability reach and establish in future suitable areas north of the range edge. Here, the focus should lie on areas that show high congruence among the different scenarios, in particular taking into account areas of congruence among different SSPs. Further empirical research is needed to develop recommendations for specific populations since Local Offset and Donor Importance were strongly dependent on the choice of climatic predictors and the latter also on offset threshold. Due to comparably low Local Offsets and high Donor Importance across scenarios, populations in the Southern and Central Appalachians as well as along the US and Canadian east coast seem the best candidates for both in situ conservation and relocation. This is recommendation has also been supported by our previous DI/RI analyses (Lachmuth et al., 2023) that worked with subsets of the transferability matrix to make separate predictions for specific groups of potential donor populations.
More generally, we second claims to combine genetic offset analyses with GEA and common garden studies to identify the best genetic markers and environmental predictors and thereby reduce uncertainty (Capblancq et al., 2020; Rellstab et al., 2021; Lind et al., 2023). In cases were uncertainty remains high, such as for climate change scenarios, mapping geographic variation in the degree of uncertainty can help prioritize specific populations or geographic regions for restoration. Whether the identification of selected loci is necessary will strongly depend on the species evolutionary and demographic history. If forecasts indicate future suitable habitats mostly far beyond a species current distribution it might be helpful to consider further time steps (e.g., mid 21st century) and design corridors or steppingstones for more gradual natural or assisted colonization of new geographic areas.
Data availability statement
Sequence data are available in the form of fastq files with the raw reads of each individual in the SRA NCBI database (https://www.ncbi.nlm.nih.gov/sra/), deposited as PRJNA625557 bioproject. Trait data and genotype dosages for the 917 234 SNPs and 332 individuals genotyped are available in the Dryad repository (https://doi.org/10.5061/dryad.z08kprrgm).
Author contributions
MF and SK developed the project and obtained funding, with additional funding acquired by TC and SK. SL, TC, SK, and MF participated in the collection of common garden data, which were managed by SK and members of his lab. TC conducted the genomic data analyses with advice from SK. SL and MF developed the scaled offsets and DI, RI metrics presented in the manuscript. SL acquired the species occurrence and climate data, performed the modeling and data analysis, and drafted the manuscript with advice from MF. All authors contributed to and approved the final manuscript.
Funding
This project was supported by awards from the National Science Foundation (1656099 and 1655344) and a USDA-HATCH award (1006810), and a Postdoctoral Associate Program fellowship awarded by the UVM Office of the Vice President for Research.
Acknowledgments
The authors appreciate the assistance of many individuals who contributed to the collecting of genetic samples and assisted with the establishment of and data collection at the common gardens, including Jacquelyne Adams, John Butnor, Sonia DeYoung, Erica Duda, Natalie Haydt, Kurt Johnsen, Matthew Lisk, Helena Munson, David Nelson, Robin Paulman, Anoob Prakash, Brittany Verrico, and Ethan Thibault.
Conflict of interest
The authors declare that the research was conducted in the absence of any commercial or financial relationships that could be construed as a potential conflict of interest.
Publisher’s note
All claims expressed in this article are solely those of the authors and do not necessarily represent those of their affiliated organizations, or those of the publisher, the editors and the reviewers. Any product that may be evaluated in this article, or claim that may be made by its manufacturer, is not guaranteed or endorsed by the publisher.
Supplementary material
The Supplementary material for this article can be found online at: https://www.frontiersin.org/articles/10.3389/fevo.2023.1155783/full#supplementary-material
Footnotes
1. ^https://anoobvinu07.github.io/NSF_RedSpruce_CG/
2. ^https://github.com/ptitle/envirem
References
Abatzoglou, J. T. (2013). Development of gridded surface meteorological data for ecological applications and modelling. Int. J. Climatol. 33, 121–131. doi: 10.1002/joc.3413
Aitken, S. N., and Bemmels, J. B. (2016). Time to get moving: assisted gene flow of forest trees. Evol. Appl. 9, 271–290. doi: 10.1111/eva.12293
Aitken, S. N., and Whitlock, M. C. (2013). Assisted gene flow to facilitate local adaptation to climate change. Annu. Rev. Ecol. Evol. Syst. 44, 367–388. doi: 10.1146/annurev-ecolsys-110512-135747
Akaike, H. (1974). A new look at the statistical model identification. IEEE Trans. Automat. Contr. 19, 716–723. doi: 10.1109/TAC.1974.1100705
Angert, A. L., Bontrager, M. G., and Ågren, J. (2020). What do we really know about adaptation at range edges? Annu. Rev. Ecol. Evol. Syst. 51, 341–361. doi: 10.1146/annurev-ecolsys-012120-091002
Archambeau, J. (2022). Understanding the origin and predicting adaptive genetic variation at large scale in the genomic era: A case study in maritime pine. France: Université de Bordeaux.
Beane, N. R., and Rentch, J. S. (2015). Using known occurrences to model suitable habitat for a rare forest type in West Virginia under select climate change scenarios. Ecol. Res. 33, 178–189. doi: 10.3368/er.33.2.178
Benomar, L., Elferjani, R., Hamilton, J., O’Neill, G. A., Echchakoui, S., Bergeron, Y., et al. (2022). Bibliometric analysis of the structure and evolution of research on assisted migration. Curr. Forest. Rep. 8, 199–213. doi: 10.1007/s40725-022-00165-y
Bontrager, M., Usui, T., Lee-Yaw, J. A., Anstett, D. N., Branch, H. A., Hargreaves, A. L., et al. (2021). Adaptation across geographic ranges is consistent with strong selection in marginal climates and legacies of range expansion. Evolution 75, 1316–1333. doi: 10.1111/evo.14231
Butnor, J. R., Verrico, B. M., Johnsen, K. H., Maier, C. A., Vankus, V., and Keller, S. R. (2019). Phenotypic variation in climate-associated traits of red spruce (Picea rubens Sarg.) along elevation gradients in the southern Appalachian Mountains. Castanea 84, 128–143. doi: 10.2179/0008-7475.84.2.128
Capblancq, T., Fitzpatrick, M. C., Bay, R. A., Exposito-Alonso, M., and Keller, S. R. (2020). Genomic prediction of (mal) adaptation across current and future climatic landscapes. Annu. Rev. Ecol. Evol. Syst. 51, 245–269. doi: 10.1146/annurev-ecolsys-020720-042553
Capblancq, T., and Forester, B. R. (2021). Redundancy analysis: a Swiss Army knife for landscape genomics. Methods Ecol. Evol. 12, 2298–2309. doi: 10.1111/2041-210X.13722
Capblancq, T., Lachmuth, S., Fitzpatrick, M. C., and Keller, S. R. (2023). From common gardens to candidate genes: exploring local adaptation to climate in red spruce. New Phytol. 237, 1590–1605. doi: 10.1111/nph.18465
Chen, Z., Grossfurthner, L., Loxterman, J. L., Masingale, J., Richardson, B. A., Seaborn, T., et al. (2021). Applying genomics in assisted migration under climate change: framework, empirical applications, and case studies. Evol. Appl. 15, 3–21. doi: 10.1111/eva.13335
Conlisk, E., Syphard, A. D., Franklin, J., Flint, L., Flint, A., and Regan, H. (2013). Uncertainty in assessing the impacts of global change with coupled dynamic species distribution and population models. Glob. Change Biol. 19, 858–869. doi: 10.1111/gcb.12090
Dauphin, B., Rellstab, C., Schmid, M., Zoller, S., Karger, D. N., Brodbeck, S., et al. (2021). Genomic vulnerability to rapid climate warming in a tree species with a long generation time. Glob. Change Biol. 27, 1181–1195. doi: 10.1111/gcb.15469
Dinerstein, E., Olson, D., Joshi, A., Vynne, C., Burgess, N. D., Wikramanayake, E., et al. (2017). An ecoregion-based approach to protecting half the terrestrial realm. Bioscience 67, 534–545. doi: 10.1093/biosci/bix014
Diniz-Filho, J. A. F., Mauricio Bini, L., Fernando Rangel, T., Loyola, R. D., Hof, C., and Araújo, D. N. (2009). Partitioning and mapping uncertainties in ensembles of forecasts of species turnover under climate change. Ecography 32, 897–906. doi: 10.1111/j.1600-0587.2009.06196.x
Dumais, D., and Prévost, M. (2007). Management for red spruce conservation in Québec: the importance of some physiological and ecological characteristics–a review. For. Chron. 83, 378–391. doi: 10.5558/tfc83378-3
Eckert, A. J., and Neale, D. B. (2022). Probing the dark matter of environmental associations yields novel insights into the architecture of adaptation. New Phytol. 237, 1479–1482. doi: 10.1111/nph.18639
Ellis, N., Smith, S. J., and Pitcher, C. R. (2012). Gradient forests: calculating importance gradients on physical predictors. Ecology 93, 156–168. doi: 10.1890/11-0252.1
Feng, L., and Du, F. K. (2022). Landscape genomics in tree conservation under a changing environment. Front. Plant Sci. 13:822217. doi: 10.3389/fpls.2022.822217
Fitzpatrick, M. C., Chhatre, V. E., Soolanayakanahally, R. Y., and Keller, S. R. (2021). Experimental support for genomic prediction of climate maladaptation using the machine learning approach gradient forests. Mol. Ecol. Resour. 21, 2749–2765. doi: 10.1111/1755-0998.13374
Fitzpatrick, M. C., and Keller, S. R. (2015). Ecological genomics meets community-level modelling of biodiversity: mapping the genomic landscape of current and future environmental adaptation. Ecol. Lett. 18, 1–16. doi: 10.1111/ele.12376
Frankham, R. (2015). Genetic rescue of small inbred populations: meta-analysis reveals large and consistent benefits of gene flow. Mol. Ecol. 24, 2610–2618. doi: 10.1111/mec.13139
Gougherty, A. V., Keller, S. R., and Fitzpatrick, M. C. (2021). Maladaptation, migration and extirpation fuel climate change risk in a forest tree species. Nat. Clim. Chang. 11, 166–171. doi: 10.1038/s41558-020-00968-6
Gugger, P. F., Liang, C. T., Sork, V. L., Hodgskiss, P., and Wright, J. W. (2018). Applying landscape genomic tools to forest management and restoration of Hawaiian koa (Acacia koa) in a changing environment. Evol. Appl. 11, 231–242. doi: 10.1111/eva.12534
Hagerman, S., Dowlatabadi, H., Satterfield, T., and McDaniels, T. (2010). Expert views on biodiversity conservation in an era of climate change. Glob. Environ. Chang. 20, 192–207. doi: 10.1016/j.gloenvcha.2009.10.005
Hedrick, P. W., Peterson, R. O., Vucetich, L. M., Adams, J. R., and Vucetich, J. A. (2014). Genetic rescue in isle Royale wolves: genetic analysis and the collapse of the population. Conserv. Genet. 15, 1111–1121. doi: 10.1007/s10592-014-0604-1
Hoegh-Guldberg, O., Hughes, L., McIntyre, S., Lindenmayer, D. B., Parmesan, C., Possingham, H. P., et al. (2008). Assisted colonization and rapid climate change. Science 321, 345–346. doi: 10.1126/science.1157897
Hoffmann, A. A., Miller, A. D., and Weeks, A. R. (2021). Genetic mixing for population management: from genetic rescue to provenancing. Evol. Appl. 14, 634–652. doi: 10.1111/eva.13154
Höfner, J., Klein-Raufhake, T., Lampei, C., Mudrak, O., Bucharova, A., and Durka, W. (2022). Populations restored using regional seed are genetically diverse and similar to natural populations in the region. J. Appl. Ecol. 59, 2234–2244. doi: 10.1111/1365-2664.14067
Hölzel, N., Buisson, E., and Dutoit, T. (2012). Species introduction – a major topic in vegetation restoration. Appl. Veg. Sci. 15, 161–165. doi: 10.1111/j.1654-109X.2012.01189.x
IPBES . (2019). The global assessment report on biodiversity and ecosystem services. Bonn, Germany: IPBES Secretariat.
IPCC . (2021). Climate change 2021- the physical science basis, contribution of working group I to the sixth assessment report of the intergovernmental panel on climate change. Cambridge, United Kingdom: Cambridge University Press.
Isabel, N., Holliday, J. A., and Aitken, S. N. (2020). Forest genomics: advancing climate adaptation, forest health, productivity, and conservation. Evol. Appl. 13, 3–10. doi: 10.1111/eva.12902
Iverson, L. R., Prasad, A. M., Matthews, S. N., and Peters, M. (2008). Estimating potential habitat for 134 eastern US tree species under six climate scenarios. Forest Ecol. Manage. 254, 390–406. doi: 10.1016/j.foreco.2007.07.023
Koo, K. A., Patten, B., and Madden, M. (2015). Predicting effects of climate change on habitat suitability of red spruce (Picea rubens Sarg.) in the southern Appalachian Mountains of the USA: understanding complex systems mechanisms through modeling. Forests 6, 1208–1226. doi: 10.3390/f6041208
Kubisch, A., Degen, T., Hovestadt, T., and Poethke, H. J. (2013). Predicting range shifts under global change: the balance between local adaptation and dispersal. Ecography 36, 873–882. doi: 10.1111/j.1600-0587.2012.00062.x
Lachmuth, S., Capblancq, T., Prakash, A., Keller, S. R., and Fitzpatrick, M. C. (2023). Novel genomic offset metrics integrate local adaptation into habitat suitability forecasts and inform assisted migration. (Preprint). bioRxiv Ecology. doi: 10.1101/2023.06.05.541958
Langford, W. T., Gordon, A., Bastin, L., Bekessy, S. A., White, M. D., and Newell, G. (2011). Raising the bar for systematic conservation planning. Trends Ecol. Evol. 26, 634–640. doi: 10.1016/j.tree.2011.08.001
Láruson, Á. J., Fitzpatrick, M. C., Keller, S. R., Haller, B. C., and Lotterhos, K. E. (2022). Seeing the forest for the trees: assessing genetic offset predictions from gradient forest. Evol. Appl. 15, 403–416. doi: 10.1111/eva.13354
Li, W., Kershaw, J. A., Costanza, K. K. L., and Taylor, A. R. (2020). Evaluating the potential of red spruce (Picea rubens Sarg.) to persist under climate change using historic provenance trials in eastern Canada. For. Ecol. Manag. 466:118139. doi: 10.1016/j.foreco.2020.118139
Lind, B. M., Candido-Ribeiro, R., Singh, P., Lu, M., Obreht Vidakovic, D., Booker, T. R., et al. (2023). How useful is genomic data for predicting maladaptation to future climate? (preprint). Evol. Biol. 2023:528022. doi: 10.1101/2023.02.10.528022
Little, E. L. (1971). Atlas of United States trees. US Department of Agriculture, Forest Service. Washington DC, USA.
Mahony, C. R., Cannon, A. J., Wang, T., and Aitken, S. N. (2017). A closer look at novel climates: new methods and insights at continental to landscape scales. Glob. Chang. Biol. 23, 3934–3955. doi: 10.1111/gcb.13645
Mahony, C. R., MacLachlan, I. R., Lind, B. M., Yoder, J. B., Wang, T., and Aitken, S. N. (2020). Evaluating genomic data for management of local adaptation in a changing climate: a lodgepole pine case study. Evol. Appl. 13, 116–131. doi: 10.1111/eva.12871
Mosher, D. (2020). Past, current, and future potential distributions of red spruce and Fraser fir forests in the southern Appalachians: Interpreting possible impacts of climate change. Electronic Theses and Dissertations.
Myers, B. J. E., Weiskopf, S. R., Shiklomanov, A. N., Ferrier, S., Weng, E., Casey, K. A., et al. (2021). A new approach to evaluate and reduce uncertainty of model-based biodiversity projections for conservation policy formulation. Bio Science 71, 1261–1273. doi: 10.1093/biosci/biab094
Nielsen, E. S., Henriques, R., Beger, M., and Heyden, S. (2021). Distinct interspecific and intraspecific vulnerability of coastal species to global change. Glob. Change Biol. 27, 3415–3431. doi: 10.1111/gcb.15651
O’Neill, G. (2017). Proposed climate-based seed transfer system for British Columbia. Technical report (British Columbia. Forest science program), No. 099.
Oksanen, J., Blanchet, F. G., Kindt, R., Legendre, P., Minchin, P. R., O’Hara, R. B., et al. (2022). Vegan: Community ecology package version 2.9. R Package Version.
Palik, B. J., Clark, P. W., D’Amato, A. W., Swanston, C., and Nagel, L. (2022). Operationalizing forest-assisted migration in the context of climate change adaptation: examples from the eastern USA. Ecosphere 13:4260. doi: 10.1002/ecs2.4260
Park, A., Talbot, C., and Smith, R. (2018). Trees for tomorrow: an evaluation framework to assess potential candidates for assisted migration to Manitoba’s forests. Clim. Chang. 148, 591–606. doi: 10.1007/s10584-018-2201-7
Peters, M. P., Iverson, L. R., Prasad, A. M., and Matthews, S. N. (2019). Utilizing the density of inventory samples to define a hybrid lattice for species distribution models: DISTRIB-II for 135 eastern U.S. trees. Ecol. Evol. 9, 8876–8899. doi: 10.1002/ece3.5445
Potter, K. M., Jetton, R. M., Bower, A., Jacobs, D. F., Man, G., Hipkins, V. D., et al. (2017). Banking on the future: progress, challenges and opportunities for the genetic conservation of forest trees. New For. 48, 153–180. doi: 10.1007/s11056-017-9582-8
Prakash, A., DeYoung, S., Lachmuth, S., Adams, J. L., Johnsen, K. H., Butnor, J. R., et al. (2022). Genotypic variation and plasticity in climate-adaptive traits after range expansion and fragmentation of red spruce (Picea rubens Sarg.). Philos. Trans. R. Soc. B Biol. Sci. 377:8. doi: 10.1098/rstb.2021.0008
R Core Team . (2021). R: A language and environment for statistical computing. Vienna, Austria: R Core Team.
Ramalho, C. E., Byrne, M., and Yates, C. J. (2017). A climate-oriented approach to support decision-making for seed provenance in ecological restoration. Front. Ecol. Evol. 5:95. doi: 10.3389/fevo.2017.00095
Rellstab, C., Dauphin, B., and Exposito-Alonso, M. (2021). Prospects and limitations of genomic offset in conservation management. Evol. Appl. 14, 1202–1212. doi: 10.1111/eva.13205
Rentch, J. S., Ford, W. M., Schuler, T. S., Palmer, J., and Diggins, C. A. (2016). Release of suppressed red spruce using canopy gap creation–ecological restoration in the central appalachians. Nat. Areas J. 36, 29–37. doi: 10.3375/043.036.0108
Rentch, J. S., Schuler, T. M., Ford, W. M., and Nowacki, G. J. (2007). Red spruce stand dynamics, simulations, and restoration opportunities in the Central Appalachians. Restor. Ecol. 15, 440–452. doi: 10.1111/j.1526-100X.2007.00240.x
Riahi, K., van Vuuren, D. P., Kriegler, E., Edmonds, J., O’Neill, B. C., Fujimori, S., et al. (2017). The shared socioeconomic pathways and their energy, land use, and greenhouse gas emissions implications: An overview. Glob. Environ. Chang. 42, 153–168. doi: 10.1016/j.gloenvcha.2016.05.009
Rivera, S. N., Fortini, L. B., Plentovich, S., and Price, M. R. (2021). Perceived barriers to the use of assisted colonization for climate sensitive species in the Hawaiian islands. Environ. Manag. 68, 329–339. doi: 10.1007/s00267-021-01491-w
Schröter, D., Cramer, W., Leemans, R., Prentice, I. C., Araújo, M. B., Arnell, N. W., et al. (2005). Ecosystem service supply and vulnerability to global change in Europe. Science 310, 1333–1337. doi: 10.1126/science.1115233
Sork, V. L., Aitken, S. N., Dyer, R. J., Eckert, A. J., Legendre, P., and Neale, D. B. (2013). Putting the landscape into the genomics of trees: approaches for understanding local adaptation and population responses to changing climate. Tree Genet. Genomes 9, 901–911. doi: 10.1007/s11295-013-0596-x
Supple, M. A., Bragg, J. G., Broadhurst, L. M., Nicotra, A. B., Byrne, M., Andrew, R. L., et al. (2018). Landscape genomic prediction for restoration of a Eucalyptus foundation species under climate change. Elife 7:e31835. doi: 10.7554/eLife.31835
Synes, N. W., and Osborne, P. E. (2011). Choice of predictor variables as a source of uncertainty in continental-scale species distribution modelling under climate change: predictor uncertainty in species distribution models. Glob. Ecol. Biogeogr. 20, 904–914. doi: 10.1111/j.1466-8238.2010.00635.x
The Nature Conservancy . (2022). Restoring red spruce forests-new science is boosting TNC’s 20-year effort to restore iconic red spruce forests in the Central Appalachians. Available at: https://www.nature.org/en-us/about-us/where-we-work/priority-landscapes/appalachians/stories/red-spruce-forest-restoration/.
Title, P. O., and Bemmels, J. B. (2018). ENVIREM: an expanded set of bioclimatic and topographic variables increases flexibility and improves performance of ecological niche modeling. Ecography 41, 291–307. doi: 10.1111/ecog.02880
Tournebize, R., Borner, L., Manel, S., Meynard, C. N., Vigouroux, Y., Crouzillat, D., et al. (2022). Ecological and genomic vulnerability to climate change across native populations of Robusta coffee (Coffea canephora). Glob. Chang. Biol. 28, 4124–4142. doi: 10.1111/gcb.16191
Varas-Myrik, A., Sepúlveda-Espinoza, F., Fajardo, A., Alarcón, D., Toro-Núñez, Ó., Castro-Nallar, E., et al. (2022). Predicting climate change-related genetic offset for the endangered southern south American conifer Araucaria araucana. For. Ecol. Manag. 504:119856. doi: 10.1016/j.foreco.2021.119856
Waldvogel, A., Feldmeyer, B., Rolshausen, G., Exposito-Alonso, M., Rellstab, C., Kofler, R., et al. (2020). Evolutionary genomics can improve prediction of species’ responses to climate change. Evol. Lett. 4, 4–18. doi: 10.1002/evl3.154
Walter, J. A., Neblett, J. C., Atkins, J. W., and Epstein, H. E. (2017). Regional-and watershed-scale analysis of red spruce habitat in the southeastern United States: implications for future restoration efforts. Plant Ecol. 218, 305–316. doi: 10.1007/s11258-016-0687-5
Wang, T., Hamann, A., Spittlehouse, D., and Carroll, C. (2016). Locally downscaled and spatially customizable climate data for historical and future periods for North America. PLoS One 11:e0156720. doi: 10.1371/journal.pone.0156720
Wang, T., O’Neill, G. A., and Aitken, S. N. (2010). Integrating environmental and genetic effects to predict responses of tree populations to climate. Ecol. Appl. 20, 153–163. doi: 10.1890/08-2257.1
Willi, Y., and Van Buskirk, J. (2022). A review on trade-offs at the warm and cold ends of geographical distributions. Phil. Trans. R. Soc. B 377:20210022. doi: 10.1098/rstb.2021.0022
Yetter, E., Chhin, S., and Brown, J. P. (2021). Sustainable Management of Central Appalachian red Spruce. Sustainability 13:10871. doi: 10.3390/su131910871
Keywords: climate change, donor and recipient importance, forest management, conservation genomics, predictive ecological genomics, gradient forest, Picea rubens, sensitivity analysis
Citation: Lachmuth S, Capblancq T, Keller SR and Fitzpatrick MC (2023) Assessing uncertainty in genomic offset forecasts from landscape genomic models (and implications for restoration and assisted migration). Front. Ecol. Evol. 11:1155783. doi: 10.3389/fevo.2023.1155783
Edited by:
Jason Doll, Francis Marion University, United StatesReviewed by:
Guinevere O. U. Wogan, Oklahoma State University, United StatesAmy L. Angert, University of British Columbia, Canada
Copyright © 2023 Lachmuth, Capblancq, Keller and Fitzpatrick. This is an open-access article distributed under the terms of the Creative Commons Attribution License (CC BY). The use, distribution or reproduction in other forums is permitted, provided the original author(s) and the copyright owner(s) are credited and that the original publication in this journal is cited, in accordance with accepted academic practice. No use, distribution or reproduction is permitted which does not comply with these terms.
*Correspondence: Susanne Lachmuth, U3VzYW5uZS5sYWNobXV0aEB1bWNlcy5lZHU=
†ORCID: Susanne Lachmuth https://orcid.org/0000-0002-4027-7632
Thibaut Capblancq https://orcid.org/0000-0001-5024-1302
Stephen R. Keller https://orcid.org/0000-0001-8887-9213
Matthew C. Fitzpatrick https://orcid.org/0000-0003-1911-8407