 Joost F. de Jong1*
 Menno J. de Jong2
 Hendrik-Jan Megens3
 Pim van Hooft1
 Richard P. M. A. Crooijmans3G. Arjen de Groot4
 Herbert H. T. Prins5
- 1Wildlife Ecology & Conservation Group, Wageningen University, Wageningen, Netherlands
- 2Biodiversity and Climate Research Centre, Senckenberg Institute, Frankfurt am Main, Germany
- 3Animal Breeding and Genomics, Wageningen University, Wageningen, Netherlands
- 4Wageningen Environmental Research, Wageningen University & Research, Wageningen, Netherlands
- 5Animal Sciences Group, Wageningen University, Wageningen, Netherlands
Pervasive inbreeding is a major genetic threat of population fragmentation and can undermine the efficacy of population connectivity measures. Nevertheless, few studies have evaluated whether wildlife crossings can alleviate the frequency and length of genomic autozygous segments. Here, we provided a genomic inbreeding perspective on the potential effectiveness of mammal population defragmentation measures. We applied a SNP-genotyping case study on the ~2500 wild boar Sus scrofa population of Veluwe, The Netherlands, a 1000-km2 Natura 2000 protected area with many fences and roads but also, increasingly, fence openings and wildlife crossings. We combined a 20K genotyping assessment of genetic status and migration rate with a simulation that examined the potential for alleviation of isolation and inbreeding. We found that Veluwe wild boar subpopulations are significantly differentiated (FST-values of 0.02-0.13) and have low levels of gene flow. One noteworthy exception was the Central and Southeastern subpopulation, which were nearly panmictic and appeared to be effectively connected through a highway wildlife overpass. Estimated effective population sizes were at least 85 for the meta-population and ranged from 31 to 52 for the subpopulations. All subpopulations, including the two connected subpopulations, experienced substantial inbreeding, as evidenced through the occurrence of many long homozygous segments. Simulation output indicated that whereas one or few migrants per generation could undo genetic differentiation and boost effective population sizes rapidly, genomic inbreeding was only marginally reduced. The implication is that ostensibly successful connectivity restoration projects may fail to alleviate genomic inbreeding of fragmented mammal populations. We put forward that defragmentation projects should allow for (i) monitoring of levels of differentiation, migration and genomic inbreeding, (ii) anticipation of the inbreeding status of the meta-population, and, if inbreeding levels are high and/or haplotypes have become fixed, (iii) consideration of enhancing migration and gene flow among meta-populations, possibly through translocation.
Introduction
To combat the adverse effects of fragmentation, mammal conservation increasingly includes defragmentation measures such as establishment of corridors and construction of highway wildlife crossings or ecopassages (Pimm et al., 2021). The genetic effectiveness of these measures, and in particular the contextual factors leading to success or failure, remain however open to discussion (Lesbarrères and Fahrig, 2012). Although evidence is growing that defragmentation measures can enhance migration (Beckmann, 2010; Denneboom et al., 2021), there are still few studies showing actual enhancement of gene flow and reduction of genetic isolation (e.g., Sawaya et al., 2014; Soanes et al., 2018). In particular, little documentation of alleviation is known of the actual main genetic concern of population fragmentation, i.e., genomic inbreeding.
Genomic inbreeding, the accumulation of homozygous segments stemming from recent common ancestors, is pervasive in wild mammals inhabiting human-modified landscapes (Ralls et al., 2018). In the past decade, high-throughput sequence technology has documented increasing occurrence of long autozygous genomic segments (also called: Regions or Runs of Homyzygosity) in many wild mammal populations, including tigers (Khan et al., 2021), mountain gorilla (Xue et al., 2015), island fox (Robinson et al., 2016), Arctic fox (Cockerill et al., 2022), grey wolves (Hagenblad et al., 2009; Gómez-Sánchez et al., 2018; Kardos et al., 2018), red deer (de Jong et al., 2020), plains zebra (Larison et al., 2020), Alpine ibex (Grossen et al., 2018) and Eurasian lynx (Mueller et al., 2022). Likely, many other populations of large, terrestrial large-bodied mammalian species – in particular those species reliant on remnant patches in increasingly urbanized landscapes – are presently undergoing considerable genomic inbreeding. Although offering the potential for purging of deleterious alleles (Hedrick and Garcia-Dorado, 2016; Khan et al., 2021; Stoffel et al., 2021), long homozygous segments are also associated with the accumulation of mildly deleterious alleles (Grossen et al., 2020) and inbreeding depression (Stoffel et al., 2021) in wild mammal populations. Prevention and reduction of genomic inbreeding is therefore argued to warrant high priority by mammal conservationists (Frankham et al., 2017; Ralls et al., 2018).
Eminent examples of genetic rescue (Vilà et al., 2003; Miller et al., 2012; Gustafson et al., 2017) show the potential of (assisted) gene flow from unrelated immigrants to substantially alleviate inbreeding (Hedrick and Garcia-Dorado, 2016). However, we are unaware of examples of inbreeding alleviation within actual defragmentation projects – that is, as a direct consequence of gene flow arisen through corridors and highway crossings. The pervasive one-migrant-per-generation rule (OMPG) sketches a too simple picture – given the specific demographic and genetic context, a target number of 10 migrants per generation has been suggested (Mills and Allendorf, 1996; Nathan et al., 2017).
Alleviation of inbreeding in the context of defragmentation is challenging because gene flow levels may be only marginally enhanced and, most importantly, the whole meta-population may appear to be inbred because of fragmentation or (unknown) historic bottlenecks. Depending on whether subpopulations have become inbred in full or partial isolation, enhancement offers much potential (Wahlund effect) or little potential for inbreeding alleviation (Wang and Caballero, 1999). At the same time, pleas are being made to perceive defragmentation measures from a meta-population perspective, at which genetic diversity may decrease through enhanced gene flow at subpopulation-level (Fernández et al., 2008; Kolodny et al., 2019).
Examination of potential and actual effects of defragmentation projects is poor, both at subpopulation and meta-population scale. Frequently, defragmentation projects are embarked and executed without proper baseline and follow-up assessments of gene flow, leave alone inbreeding levels (Beier and Gregory, 2012; Hohenlohe et al., 2021). Nonetheless, nowadays high-throughput sequencing enables direct and accurate estimation of gene flow as well detection of autozygous segments. In addition, simulations to examine potential for alleviation of differentiation and genomic inbreeding are rare. Within genetic research projects on fragmentation, simulations are often applied to grasp spatial complexity, specifically drivers of ongoing gene flow patterns (i.e., landscape genetics) (Cushman et al., 2006; Zeller et al., 2012). There are only few examples of modelling potential gene flow patterns, typically taking a spatial (Thatte et al., 2018) or theoretical perspective (Nathan et al., 2017; Thatte et al., 2018; Kolodny et al., 2019). There is little attempt to simulate the effects of defragmentation measures on the ‘genomic landscape’, that integrates recombination rates and deleterious mutations. Kenney et al. (2014) simulated the effect of corridors on inbreeding depression in tigers, through incorporating mutation load and lethal equivalents. In line with the poor attention for genomic inbreeding within defragmentation projects, we could not find a simulation attempt on alleviation effects of enhanced gene flow on long genomic homozygous segments.
To illustrate a inbreeding perspective on the genetic assessment of effectiveness of defragmentation measures, we combined a SNP-genotyping case-study on a fragmented mammal meta-population with a simulation study. We focused on a wild boar population of Veluwe, The Netherlands, a 1000km2 protected area that is heavily bisected by roads and fences but also is subject to defragmentation measures including fence openings and wildlife crossings. Comparing findings to reference wild boar populations of Northwestern Europe, we assessed the impact of fragmentation on the levels of genetic differentiation, gene flow and inbreeding. We placed these empirical findings in the context of a simulation study to examine the potential of defragmentation measures to alleviate inbreeding. We expected to find that (i) due to fragmentation, the wild boar population of Veluwe has become fragmented and inbred, (ii) defragmentation measures are – to a lower or higher extent – boosting contemporary migration rates and gene flow levels, and lowering genetic structuring, yet that (iii) due to still conservative migration rates and/or a shared history of inbreeding among subpopulations, genomic inbreeding remains persistent.
Study area and species: the wild boar population of Veluwe, The Netherlands
To investigate effects of fine-scale fragmentation and defragmentation on genomic variation of large terrestrial mammals, we chose to focus on wild boar Sus scrofa of Veluwe, The Netherlands. Although wild boar as a species has an IUCN status of least concern, we consider factors affecting wild boar of Veluwe to be exemplary for challenges and opportunities faced in conservation of threatened mammals worldwide. Wildlife of Veluwe is much affected by both negative (human-caused fragmentation, bottleneck and founder events) and positive human influences (protection and defragmentation measures). Veluwe is the largest terrestrial protected area (1000 km2) of the densely human populated landscape of Northwestern Europe. Whereas the Dutch so called ‘zero-tolerance policy’ is applied to any wild boar entering the surrounding urban and agricultural matrix, within Veluwe there is much effort to mitigate barriers and facilitate animal movement. Next to fence openings and small corridors, in recent decades nine highway overpasses were constructed, causing Veluwe to have the largest density of such wildlife crossings worldwide. At the same time however, human pressure is intensifying, as road traffic volume and recreation pressures continue to rise, and the discrepancy between protected area and surrounding matrix sharpens.
In Veluwe, before the buildup of habitat fragmentation during the 20th century, wild boar suffered persecution, such that the wild boar was (nearly) extinct in Veluwe in the 19th century (Pelzers, 1990; van Wieren and Groot-Bruinderink, 2010). At the beginning of the 20th century, the wild boar population was bolstered by reintroductions to and subsequent escapes from fenced wildlife estates, possibly supplemented by natural immigration from western Germany (Pelzers, 1990; van Wieren and Groot-Bruinderink, 2010). The spring population size (i.e., after the hunting season and before reproduction) is estimated to be approximately 2200 individuals (van Wieren and Groot-Bruinderink, 2010). In summer, population size may swell to 6000 animals (Spek, 2016).
To what extent human influences had impacted the genetic status of Veluwe wild boar was unknown at the start of the defragmentation project, because defragmentation measures in Veluwe were not preceded by baseline genetic monitoring. Wild boar are known to have considerable movement propensity that is little affected by human urbanization (Morelle et al., 2014). Although wild boar of both sexes typically remain within a few kilometers of their native area, most males, and sometimes also females, leave the home range of the maternal sounder (see Morelle et al., (2014) for a review on wild boar movement). Long-distance dispersal over several tens of kilometers, particularly by males, have been observed (Briedermann, 1990; Lemel et al., 2003; Goedbloed et al., 2013; Prévot and Licoppe, 2013). Wild boar do not shy away from using the anthropogenic matrix (Thurfjell et al., 2009; Morelle et al., 2014). Moreover, wild boar have been shown to overtake high traffic volume roads (Frantz et al., 2012). In the study area Veluwe, wild boar are often found on agricultural fields, roads and in or close to villages and holiday resorts (Spek, 2014).
Upon construction of wildlife crossings, sand bed and (later) camera trap monitoring showed that large mammals including wild boar frequently use wildlife crossings (sometimes up to hundreds of crossings per week), although strong differences exist in intensity between sites (Emond et al., 2016). Also, in 2016 a first assessment of the genetic structure and variation of Veluwe wild boar was obtained with microsatellite markers (de Groot et al., 2016). Findings indicated that, despite the dispersal propensity of wild boar, the Veluwe wild boar population is genetically subdivided. The strength of differentiation of the different subpopulations was weak to moderate (FST between 0.05 – 0.15). However, the limited number of markers (<20) did not allow for discrimination at the individual level, so that contemporary migration rates could not be estimated and full understanding of barriers to gene flow could not be obtained. With respect to genetic variation, de Groot et al., (2016) found that both allelic richness and heterozygosity were low compared to other wild boar populations of Northwestern Europe. However, little is yet known about the levels of inbreeding.
Methods
Sample collection, SNP genotyping and data management
We used 92 wild boar samples (blood or tissue) that were collected across Veluwe in the period 2006 to 2015. All samples (blood or tissue) of wild boar used in this study were culled as part of population management and disease monitoring programs or killed in traffic collisions. In addition, we were able to include 15 samples that were collected opportunistically in the period 1990 to 1995 in two areas of Veluwe (de Groot et al., 2016). These samples allowed for examination of the stability of genetic structure over time. We refer to these samples as historical samples.
For reference purposes, next to wild boar of Veluwe we incorporated nearby wild boar populations of Northwestern Europe (Figure 1A). These references populations included the inbred populations of Meinweg (Netherlands) and Kirchheller Heide (Germany), and outbred populations Haute-Marne (Luxemburg and France), Bavarian NP and Mecklenburg-Vorpommern (both in Germany) (de Jong et al., 2023). Due to historical translocations, the latter population is a likely founder source population of Veluwe wild boar (see above). SNP genotypes of these reference populations were obtained from Goedbloed et al. (2012) and de Jong et al. (2023).
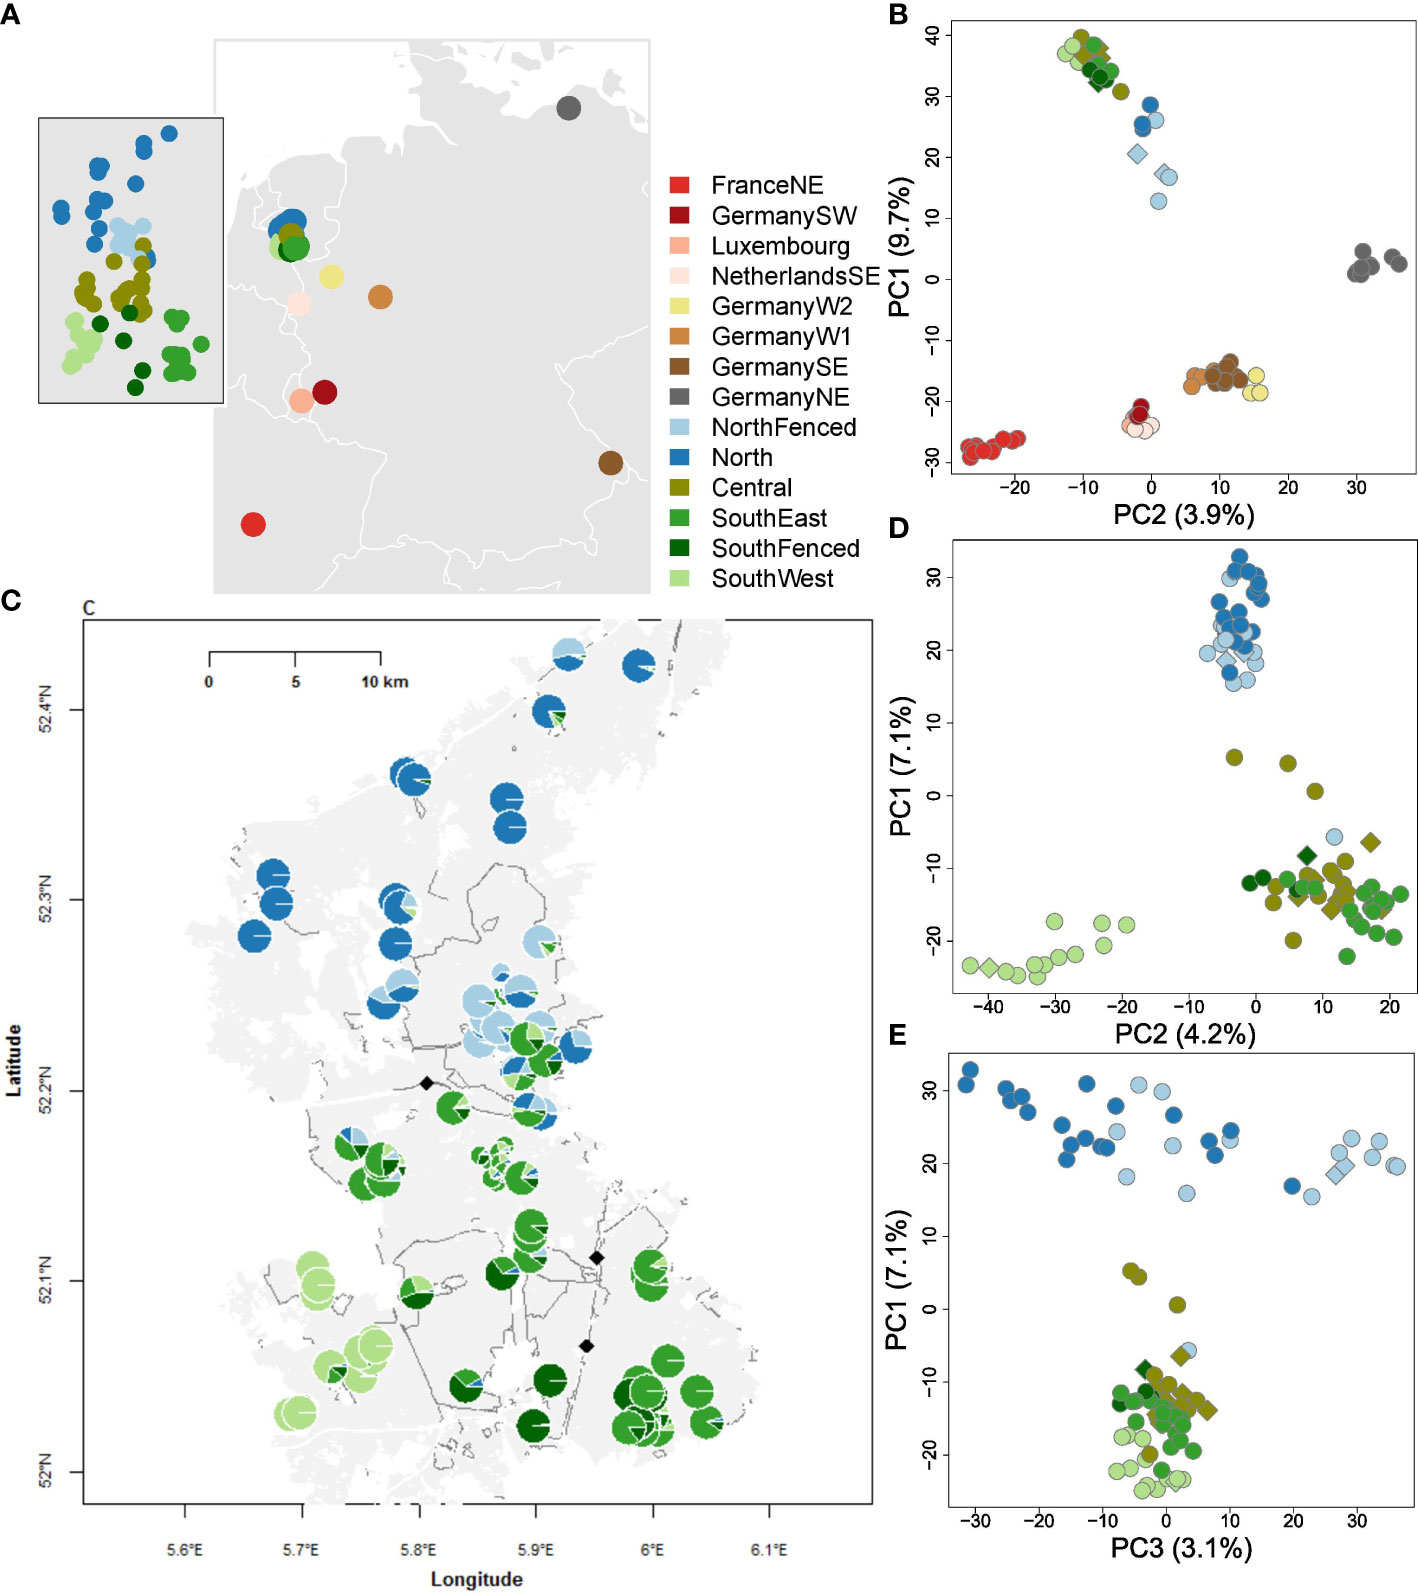
Figure 1 Geography and genetic structure of wild boar of the Veluwe, The Netherlands, and reference populations of Northwestern Europe. Abbreviations are: FranceNE = Haute-Marne; GermanySW = Rhineland-Palatinate; Germany; NetherlandsSE = Meinweg; GermanyW2 = Kirchheller Heide; GermanyW1 = North Rhine-Westphalia; GermanySE = Bavarian Forest, GermanyNE = Mecklenburg-Vorpommern. Within Veluwe: NorthFenced = Kroondomein; Central = Midden-Veluwe, SouthEast = Veluwezoom, SouthFenced = Hoge Veluwe; SouthWest = Planken Wambuis. (A) Geographic origin of the Veluwe and reference wild boar populations. Grey areas represent terrestrial area, white lines country borders. Inset: geographic origin of samples within Veluwe. (B) PCoA plot of wild boar of Veluwe and reference populations. The PCoA is based on Nei distances of SNP genotypes. To avoid bias due to uneven sampling size, a random sample of maximum ten individuals are used per population. Relatives are excluded. Circles represent recent samples, diamonds historical samples (<1995). Note that the first PCoA-dimension is shown on the y-axis. (C) Individual Admixture assignment scores of historical and recent wild boar of Veluwe. Each circle is an individual. Large circles are recent samples (>2004), small circles are historical samples (<1995). Assignment is shown for clusters 2-5, as follows: K2 = blue vs. green. From K3-5, extra distinctions are: K3 = light vs. regular green; K4 = light vs. dark blue; K5 = dark green. The light grey area is the extent of the Veluwe forest. White areas represent the anthropogenic matrix (urbanization or agriculture). White lines represent infrastructure. Dark grey lines are fences. The black diamonds are highway wildlife overpasses that are constructed before 2000. (D) PCoA plot of wild boar of Veluwe, first and second axis. Same symbology as (B). (E) PCoA plot of wild boar of Veluwe, first and third axis. Same symbology as (B).
We genotyped the samples with two different beadchips: 84 of the samples were genotyped using the Illumina porcine SNP60 beadchip, the remainder using the Illumina SNP80 beadchip (de Jong et al. 2023). We verified congruence of the two beadchips used (Supplementary Figure S1).
To exclude sampling bias due to relatives, we restricted analysis to non-related individuals. Relatedness between individuals was evaluated using the king-robust kinship coefficient, calculated using the ‘calckin’ function implemented in SambaR (Supplementary Figure S2). Following Manichaikul et al. (2010) and Anderson et al. (2010), we assumed that individuals with a kinship-coefficient above 0.177 were first degree relatives. For each such pair, a randomly chosen individual was removed.
To detect hybridization with domestic pigs, we used PCA (or PCoA) projection (McVean, 2009). In this method, wild boar are projected on an axis that is determined by simulated wild boar and pigs. To obtain estimates of allele frequencies typical for pigs, we used genotypes of pigs of four modern domestic breeds (Large white, Landrace, Angler Sattle and Pietrain; derived from Herrero-Medrano et al., 2013). Of the Veluwe samples, none had PCoA axis scores above 0.125 (Supplementary Figure S3) which would be indicative of potential pig introgression. Hence, we did not exclude individuals due to potential pig introgression. For the wild boar from outside Veluwe, we used the PCoA projection scores of a preceding study (de Jong et al., 2023).
For SNP data management, we used R-4.2.1 (R Core Team, 2017) and the wrapper package SambaR (de Jong et al., 2021) (github page: https://github.com/mennodejong1986/SambaR). The data was filtered using the SambaR-function ‘filterdata’, with the following parameter settings: individual missingness = 0.35, SNP missingness = 0.05, minimum allelic count = 1, dohefilter = TRUE and minimum spacing = 500 Kb. The individual missingness of 0.35 appears high, but is the mere consequence of the beadchips being partially overlapping.
Of the 35800 autosomal SNPs (which were sequenced on both chips), after LD pruning 18438 SNPs were retained. After further filtering on Hardy-Weinberg equilibrium, missingness and minimum minor allele count (using Sambar’s filterdata function), the dataset was further reduced to 18330 SNPs. All analyses were performed on this dataset of 18330 SNPs. After filtering individuals on missing data (max 35% missing data), relatedness (selecting one individual per pair of first degree relatives) and on ‘pureness’ (removal of individuals with introgressed pig DNA), we retained a dataset of 180 wild boar individuals. Of those 180 individuals, 80 individuals belonged to the focal subpopulations within the Veluwe (here denoted as “Central”, “North”, “NorthFenced”, “SouthEast”, “SouthFenced”, “SouthWest”), and 12 to historical Veluwe subpopulations. Furthermore, 9 individuals remained of the putative source population of Veluwe (here denoted as “GermanyNE”), and 79 to the remaining populations in Germany, Luxembourg and France. For comparison to neighboring populations, certain analyses (such as genetic diversity analyses) were performed on the total dataset of 180 individuals. Yet, most analyses were performed on the subset of 101 (80 + 12 + 9) individuals belonging to the focal (recent and historical) and source populations.
Genetic data analysis
To examine genetic structure, we applied Principal Coordinate Analysis (PCoA, package ape, (Paradis et al., 2004)) on the individual pairwise Nei genetic distances. In addition, we run admixture analyses with the package LEA (Frichot and François, 2015), using default settings, to determine the most likely number of hierarchical levels and to obtain estimates of to which genetic clusters individuals belong. We performed these PCoA and LEA Admixture analyses for Veluwe and reference populations together, and for Veluwe subpopulations specifically. A population-level neighbour-joining network was constructed using the NeighborNet function of the R package phangorn (Schliep, 2011), with default settings, using as input a distance matrix with Dxy-value (i.e., mean absolute distance between individuals) generated by the function ‘calcpi’ of the R package SambaR. During plotting, external branches were artificially shortened by 70%, in order to zoom in on the reticulations. ABBA-BABA calculations were performed using the software Dsuite, with default settings. Plink was used to convert the data into the required input format (vcf) (Purcell et al., 2017). The reference phylogeny was inferred by applying the NJ algorithm to a population-level distance matrix (Dxy-estimates), using the function NJ of the phangorn package.
To calculate genetic differentiation FST at population level, we applied the method of Weir and Cockerman (Weir and Cockerham, 1984), as integrated in the R package StAMPP (Pembleton et al., 2013). In addition, we calculated Nei genetic distances between populations with the Nei function of StAMPP. We performed hierarchical clustering through the NJ function of poppr package (Kamvar et al. 2014), using as input Nei genetic distances between populations. We plotted a dendrogram with the plot.phylo function of the ape package.
To study genetic genomic inbreeding, we estimated effective population size Ne, Multilocus Heterozygosity (MLH) and the fraction of the genome containing Runs of Homozygosity (FROH). Estimates of effective population size Ne through time were obtained with the software SNeP (Barbato and Orozco-terWengel, 2015), which is based on the amount of Linkage Disequilibrium. For each individual, we estimated Multilocus Heterozygosity as the fraction of heterozygous loci divided by the fraction of successfully genotyped loci. We detected ROHs using the R base function RLE, which divides sequence strings in blocks of adjacent similar characters/values. For this purpose, homozygous genotypes (0 and 2) were both set equal to 0. ROHs were defined as strings of at minimum 30 adjacent, uninterrupted 0-values, spanning genomic regions of at least 5 Mb. Missing genotypes were considered to be homozygous (i.e., 0). To examine the accuracy of the ROH-calls, we used glPlot of the R package Adegenet (Jombart and Ahmed, 2011) to visualise genotypes, and added lines to denote ROH-calls (Supplementary Figures S4, S5). To test for differences in heterozygosity and FROH between (sub)populations, we used the Kruskal Wallis test (base R function) and Dunn's multiple comparison test, such as implemented in the package FSA (Ogle et al., 2022).
For gene flow analyses, we calculated f3-scores with the admixr package (Petr et al., 2019). Negative f3-scores are indicative for admixture (Patterson et al., 2012). As an additional gene flow analyses, we generated a Treemix phylogeny using the software Treemix (Pickrell and Precedings, 2012) (default settings). Treemix is a maximum likelihood phylogeny that is based on genetic drift models and infers gene flow events from the discrepancy between the observed (true) genetic distances and the genetic distances suggested by the most likely phylogeny. Lastly, we used the LEA Admixture scores to detect migrants and the offspring thereof. Migration rates where determined as the number of migrants divided by the total population size. We used the Exact binomial test, such as applied in the R base package, to estimate confidence intervals around migration rates.
Simulation of potential inbreeding alleviation
To simulate the effects of enhanced gene flow on genomic inbreeding, we simulated phases of fragmentation and defragmentation of individuals of subpopulations with varying migration rates. To allow for examination of accumulation of homozygous segments, we included linkage disequilibrium. Because inbreeding depression was out of the scope of this study, we did not opt to simulate genomic load (deleterious alleles). To run the simulation we used the program Easypop2.0.1 (Balloux, 2001), which simulates migration, mating and recombination events over generations, and allows users to download and analyze resultant genotype and haplotype data. While running Easypop2.0.1 we used the following settings: diploid genomes, two sexes, equal subpopulation sizes of 20 females and 20 males, and random mating. Although wild boar do not have a random mating system (Briedermann, 1990), we accounted for this through relatively small population sizes, that matches observed effective population sizes (see Results). Regarding genetic settings, we simulated 1500 loci per individual, with a recombination rate of 0.005. As such, adjacent SNPs were 0.5 cM apart, or roughly 0.5 Mb, and the total simulated individual length was 750 cM, or roughly 750 Mb (corresponding with three fairly long chromosomes). For simplicity, we assumed homogeneous recombination rates across the genome. We chose for a mutation rate of 0, and ran five replicates for each simulation. Easypop generates general population genetic estimators at meta-population level (output files with extension 'equ') for every 10 generations. We used R-base functions to analyze the simulated haplotypes, so as to detect and quantify the length and frequency of homozygous segments. The rate of observed loss of heterozygosity over time, such as reported by Easypop, were used to estimate effective population sizes, given Ht/H0 = (1 - 1/(2Ne))t, and hence: Ne = 0.5/(1-(Ht/H0)1/t) ≈ -t/(2ln(Ht/H0)).
Results
Fragmentation among and within the Veluwe wild boar meta-population
Genetic structure analysis showed that the meta-population of Veluwe wild boar represented a unique genetic cluster that is distinct from other populations of Northwestern Europe (Figures 1B, 2). On the first axis of the PCoA (Figure 1B), wild boar of Veluwe were opposed to the nearby wild boar population of Southeastern Netherlands, and were positioned nearest to the putative source population (see study area description) of wild boar of Northeastern Germany. Congruently, an unrooted phylogenetic tree (Figure 2B) of pairwise Nei genetic distance (Figure 2C) indicated that of the investigated reference populations, Veluwe wild boar are genetically most similar to wild boar of Northeastern Germany.
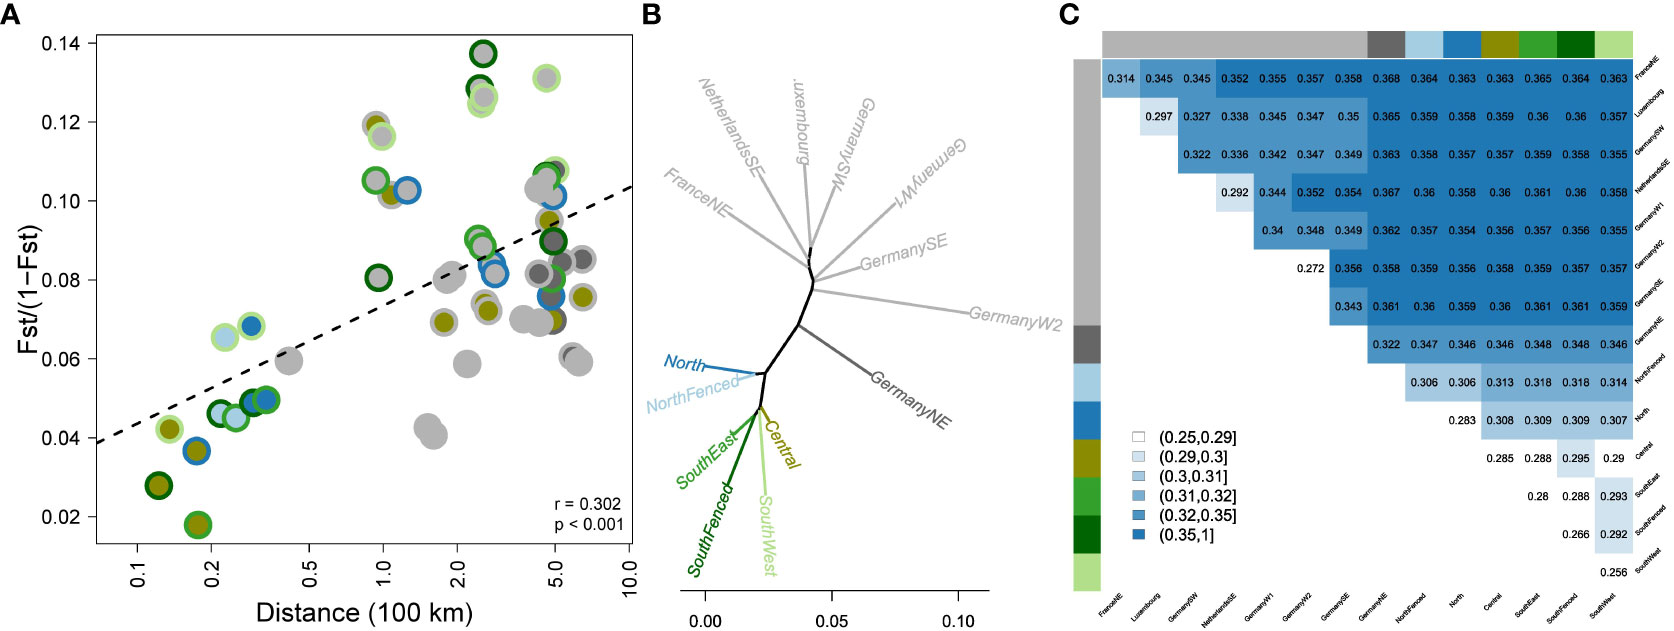
Figure 2 Genetic differentiation of wild boar populations of Veluwe and Northwestern Europe. (A) Genetic differentiation vs. geographic distance. The two-layered circles indicate the population pair, with colors as in Figure 1A. (B) Unrooted population-level NJ phylogeny, based on population-level Nei’s genetic distances (colors as in Figure 1A). (C) Distance matrix depicting genetic distances between populations, measured as Dxy-values (absolute genetic distances between individuals belonging to different populations).
There was a significant relationship between geographic distance and genetic differentiation (FST/(1 – FST); rmantel = 0.302, P < 0.001, Figure 2A). Residual variation could partly be contributed to inbreeding status (pairs involving one or two inbred populations tended to have high FST-values). Furthermore, despite the overall isolation by distance pattern, genetic differentiation among Veluwe subpopulations (max. distance: 50 km) reached same values as genetic differentiation among reference populations 500 km apart. Genetic differentiation amongst Veluwe subpopulations was significant (P<0.001) and ranged from 0.02 up to 0.13 (or, ignoring subpopulation pairs involving SouthWest, up to 0.09) (Figure 2A).
Within the Veluwe meta-population, Admixture (Figures 1C, 2A) and PCoA (Figures 1D, E) showed clustering at several hierarchical levels. The most likely number of K clusters was K=4 (Supplementary Figure S6). At K=3, Admixture set Veluwe apart from wild boar of Germany Northeast, included because of it being the putative source population. At PCoA axis 1 and Admixture K=2 output separated wild boar samples on either side of highway A1, namely North and NorthFenced vs. Central, SouthEast, SouthFenced and SouthWest. PCoA axis 2 and Admixture K=4, the SouthWest subpopulation was distinguished. At the next hierarchical levels, wild boar from the fenced private estates were set apart (PCoA axis 3 and Admixture K=5: NorthFenced; and at Admixture K=6: SouthFenced). At these highest observed hierarchical levels of genetic structure, there was no difference between samples of recent and historical origin. As such, we did not analyze genetic variation (section below) separately for historical and recent samples. Notably, wild boar of the Central and SouthEast subpopulation, which are bisected by a fenced highway (A50) but connected through a highway wildlife overpass, could not be genetically discriminated.
Inbreeding in the Veluwe wild boar meta-population
SNeP estimated recent Ne to be 31 to 52 for all Veluwe subpopulations. For the Veluwe meta-population, Ne was estimated to be at least 85 (Supplementary Figure S7). Historical Ne of the Veluwe metapopulation (~100 generations ago) ranged from 145 to 302. Although SNeP does not provide confidence intervals, the Ne estimates of Veluwe subpopulations appeared to be comparable to, or lower than, those of the inbred reference populations Kircheller Heide and Meinweg.
Observed levels of MLH of Veluwe wild boar (Figure 3A) were comparable to inbred reference populations (Meinweg and Kirchheller Heide) yet lower than outbred reference populations (Kruskal-Wallis X2 = 82.1, df = 8, P < 0.001). There were significant differences in multilocus heterozygosity (MLH) among Veluwe subpopulations (Kruskal-Wallis X2 = 33.2, df = 5, P < 0.001). MLH was lower in the SouthWest subpopulation than in other Veluwe subpopulations (multiple comparison Dunn's Test, all P < 0.015).
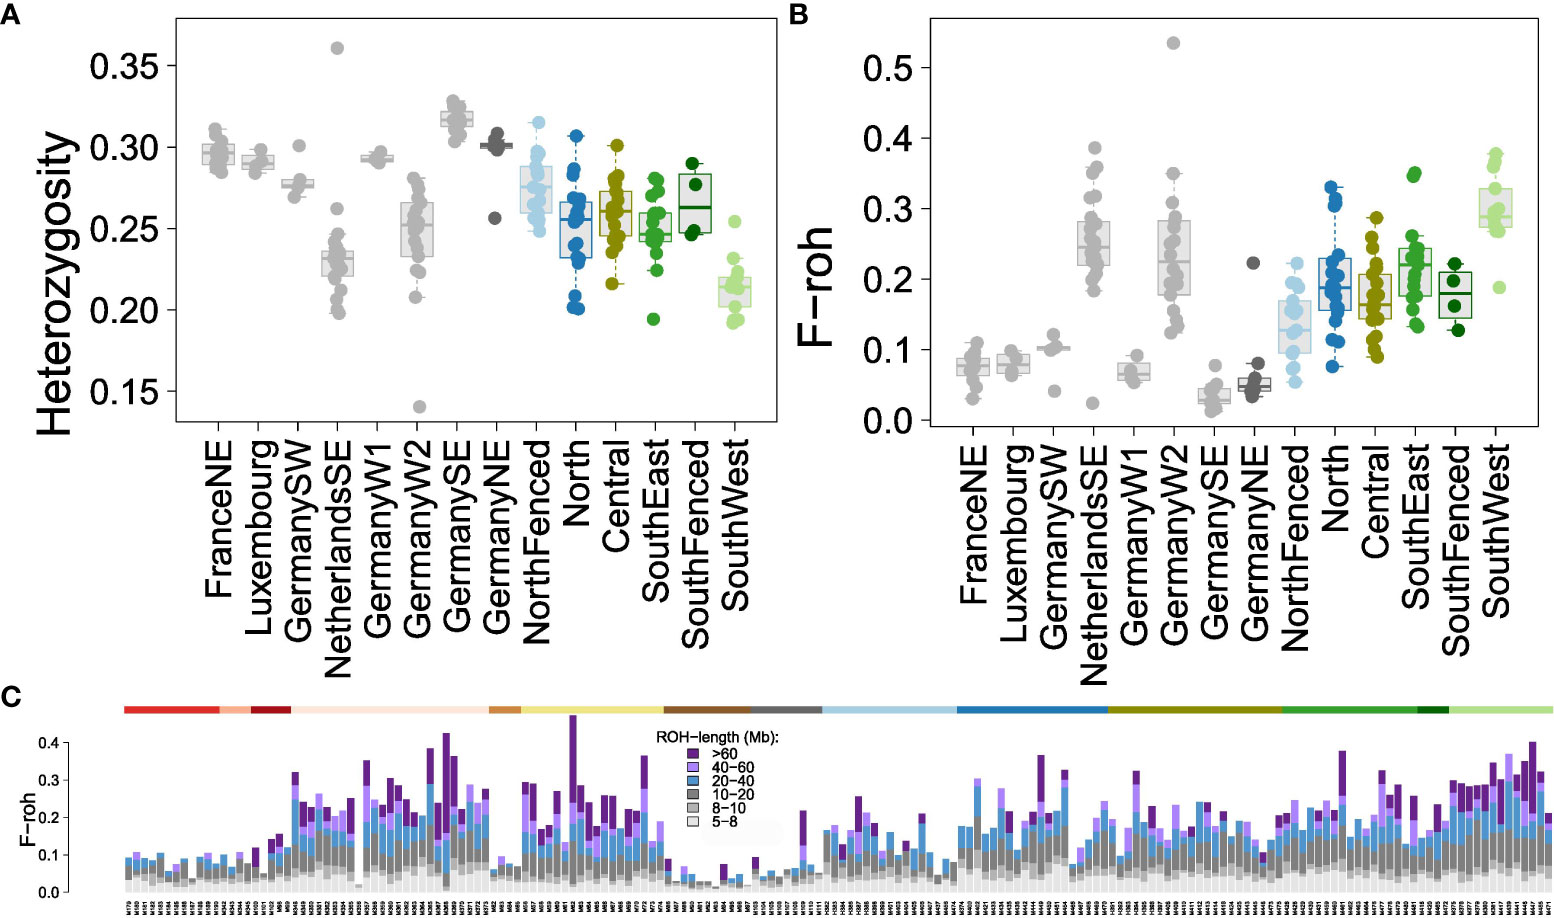
Figure 3 Estimators of genomic inbreeding in Veluwe wild boar subpopulations. Colors of Veluwe subpopulations as in Figure 1A; reference populations in grey. (A) Boxplots of multi-locus heterozygosity (MLH). (B) Boxplots of genomic fraction of homozygous segments, FROH, defined as regions uninterrupted regions of 30 homozygous adjacent SNPs spanning at least 5 Mb. The reference populations of NetherlandsSE (Meinweg) and GermanyW2 (Kirchheller Heide) are known to be inbred (de Jong et al., 2023). (C) Individual stacked bar charts of the contribution of FROH values in ROH-segments of various lengths to total FROH. The color of the top horizontal bar indicates the corresponding wild boar population (colors as in Figure 1A). A magnification of this bar chart is shown in Figure S8.
Similarly, wild boar of Veluwe had lower FROH-values (Figure 3B) than outbred wild boar reference populations of Mecklenburg-Vorpommern, Bavarian NP and Haute-Marne, but not lower than the inbred reference populations Meinweg and Kirchheller Heide (Kruskal-Wallis X2 = 93.2, df = 8, P < 0.001; multiple comparison Dunn's Test, P < 0.05). In Veluwe, Meinweg and Kirchheller Heide, median FROH>5Mb was 0.20, 0.25 and 0.23, respectively. Within Veluwe, there were significant differences in FROH>5Mb (Kruskal-Wallis X2 = 12.6, df = 5, P < 0.001), although for all subpopulations wild boar were detected that had high values of FROH>5Mb (>0.10). The median ROH>5Mb of the subpopulations ranged from 0.13-0.17 in SouthFenced and NorthFenced, to 0.18-0.21 in North, Central and SouthEast, to 0.30 in the SouthWest subpopulation. SouthWest had a significantly higher FROH>5Mb than all other subpopulations (multiple comparison Dunn's Test, P < 0.02).
Focusing on ROH segment length (Figures 3C; Supplementary Figure S7), it appeared that the difference between inbred and outbred populations was the presence of long ROHs (in particular, ROHs longer than 20 Mb). Unlike other Veluwe subpopulations, a large proportion of FROH of wild boar of the subpopulation SouthWest could be allocated to ROHs longer than 60 Mb.
Contemporary gene flow between subpopulations
Individual Admixture assignment scores showed the presence of individuals in the Central subpopulation that are offspring from one parent stemming from the North cluster, and the other from Southeast/Central (Figure 4A). These individuals were observed in a specific region on the border of Veluwe, near and in (formerly) zero-tolerance area (Figure 1C). Concomitantly, f3-analysis showed gene flow between the Central and surrounding subpopulations (Figure 4B). F3-analyses suggested that subpopulation Central is admixed, and contains a mixture of genetic material from northern subpopulations and of southern subpopulations (Figures 4B, C). Similarly, Treemix maximum likelihood phylogeny indicated subpopulation Central as admixed (Figure 4D). ABBA-BABA analyses suggested that gene flow between northern and southern subpopulations mainly involved subpopulation North, and not, or at least to a much lesser extent, the population NorthFenced (Figure 4C). This finding is consistent with the difference in absolute genetic distance between populations North and NorthFenced relative to the southern populations (including Central) (Figure 2C). It is also consistent with neighbor-joining network analyses, which reveals that part of the data supports a clustering of the population North with southern populations (Figure 4E).
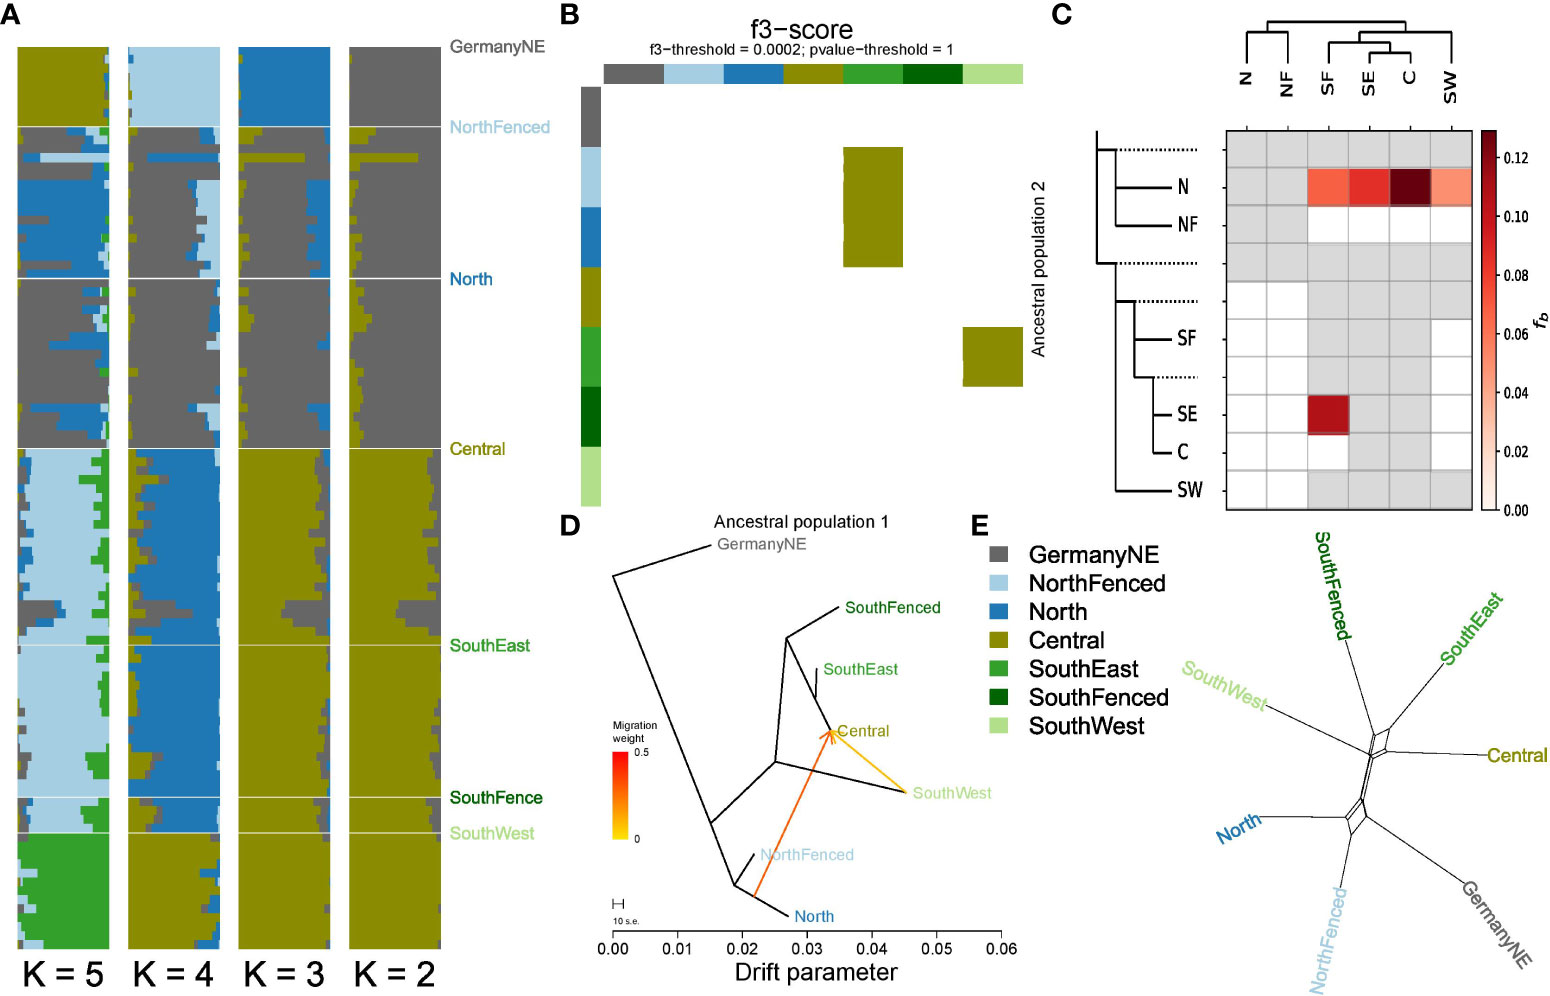
Figure 4 Gene flow among Veluwe wild boar subpopulations. (A) Individual Admixture assignment scores, for K=2 to K=6 (most likely K=3). (B) f3-heatmap, highlighting Central as admixed between northern and southern populations. (C) Heatmap summarising the f-branch statistics estimated by the software Dsuite, based on an input dataset of 18330 biallelic SNPs. Darker colors depict increasing evidence for gene flow between lineages. The dotted lines in the phylogeny (left-hand side of the heatmap) represent ancestral lineages. Consistent with the observed discrepancy in absolute genetic distances of southern subpopulations subpopulations North and NorthFenced, the ABBA-BABA analyses suggest gene flow between the southern subpopulations (especially Central) and subpopulation North. (D) Treemix maximum likelihood phylogeny with two migration edges. (E) Phylogenetic network constructed with the Neighbor-Net algorithm, based on absolute genetic distances between populations (DXY). In order to zoom in on the reticulations, external branches lengths have been reduced by 70%. The largest reticulations, indicating conflict in the data, suggest that subpopulation North clusters either with subpopulation NorthFenced or instead with southern subpopulations, and that subpopulation SouthEast clusters either with population Central or instead with population SouthFenced.
Using Admixture assignment scores, we inferred zero migrants yet five individuals that are offspring of a migrant. These five migrant offspring had a genetic signature that partly (approx. 50%) resembled another subpopulation than the one in which they were sampled (see Supplementary Table S1; Supplementary Figure S9). Four events occurred between the North/NorthFenced vs. Central/SouthEast, one event between SouthWest vs. Central/SouthEast. Based on these migrant and migrant offspring detections, we estimated migration rates between neighboring clusters from 0 to 0.039 (see Supplementary Table S1 for specific migration rates and confidence intervals). We did not detect migration events (full migrants nor 1st generation offspring of migrants) between non-neighboring regions.
Simulation of the potential for alleviation of genomic inbreeding
To examine the potential alleviation effect of enhanced gene flow on genomic inbreeding of Veluwe wild boar, we simulated a fragmentation and defragmentation phase. Following above-described observed estimations, we used an effective subpopulation size Ne-sub of 40. Given absence of migration between non-neighboring subpopulations, we assumed the meta-population to be best represented by a two-dimensional stepping stone model (as visualized at the top of Figure 5). For the fragmentation phase, we simulated 40 generations, a Ne of 40, and a migration rate of 0.005, which equals 40 * 0.005 = 0.2 effective migrants, i.e., 1 migrant per 5 generations). At the end of the fragmentation phase, median FST values were 0.15 or higher. Although these levels are above those observed in wild boar in Veluwe (see above), these values enabled us to make the point that even when FST-values drop, FROH does not necessarily (see below). For the defragmentation phase, we simulated migration rates of m=0.025, m=0.05, m=0.10, equaling 1, 2 and 4 effective migrants per generation. For reference purposes, we also included the scenario of panmixia (m=0.5), in both the fragmentation and defragmentation phase.
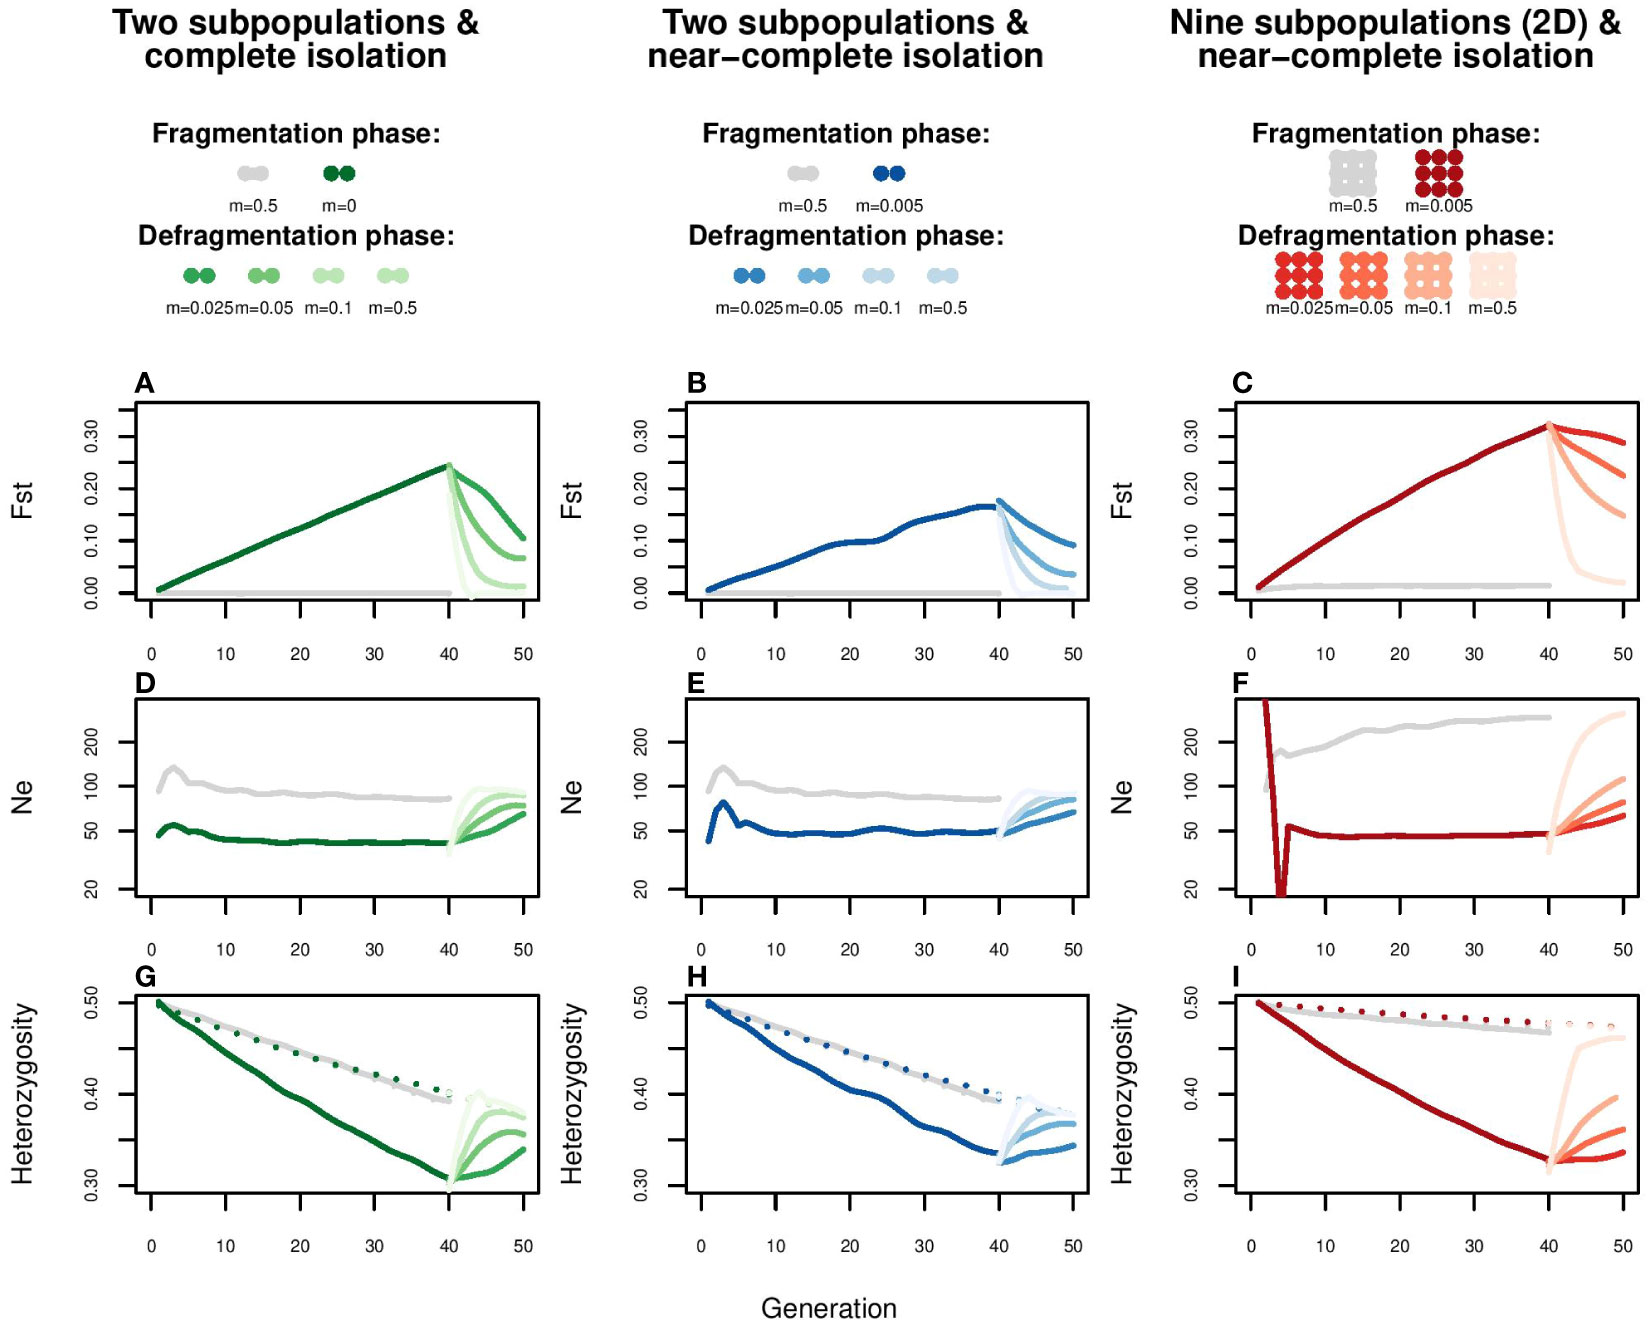
Figure 5 Simulation of the effect of enhanced gene flow on FST, Ne, Observed and Expected heterozygosity. Each of the modelled subpopulations consists of a randomly mating pool of twenty females and twenty males, for which a defragmentation phase (40 generations) and a subsequent fragmentation phase (10 generations) is simulated. The left column represents a spatial configuration of two subpopulations with a fragmentation phase of complete isolation (m=0); the central column two subpopulations with a fragmentation phase of near complete isolation (m=0.005, i.e., one migrant per generation); the right column a two dimensional stepping stone meta-population with a fragmentation phase of near complete isolation (m=0.005). The defragmentation phase is simulated through one migrant per generation (m=0.025), two migrants per generation (m=0.05), four migrants per generation (m=0.1) and panmixia (m=0.5). The grey lines represent the control scenario of panmixia (m=0.5). For each scenario, effects are shown on (A–C) FST, (D–F), Ne, such as estimated from the loss of heterozygosity, and (G–I) heterozygosity. Heterozygosity is either the expected heterozygosity for the whole meta-population (dotted lines) or the mean observed heterozygosity at subpopulation level (continuous lines). To account for stochasticity, each line is the average of five replications.
At the end of the fragmentation phase, single-locus based estimates of observed heterozygosity had dropped with approximately 30% in all spatial configurations (Figures 5G, H, I; continuous lines). Total expected heterozygosity (a proxy for allelic fixation; Figures 5G, H, I, dotted lines) decreased with approximately 5% in the two-dimensional stepping stone scenario and more than 20% in the scenarios of two-subpopulations (whether completely or near completely isolated). Matching population genetic theory (Wang and Caballero, 1999), these rates of allelic fixation were slightly above those observed in the control scenario of panmixia (grey lines). Regarding inbreeding, at the end of fragmentation phase, Multilocus Homozygosity, FROH>5cM and FROH>10cM had substantially increased in all scenarios (Figure 6; boxplots with darkest colors). Even in the control scenario of panmixia (grey boxplots), there was a marked increase in these genomic inbreeding estimators in the two subpopulation setup, but less so in the two-dimensional stepping stone setup.
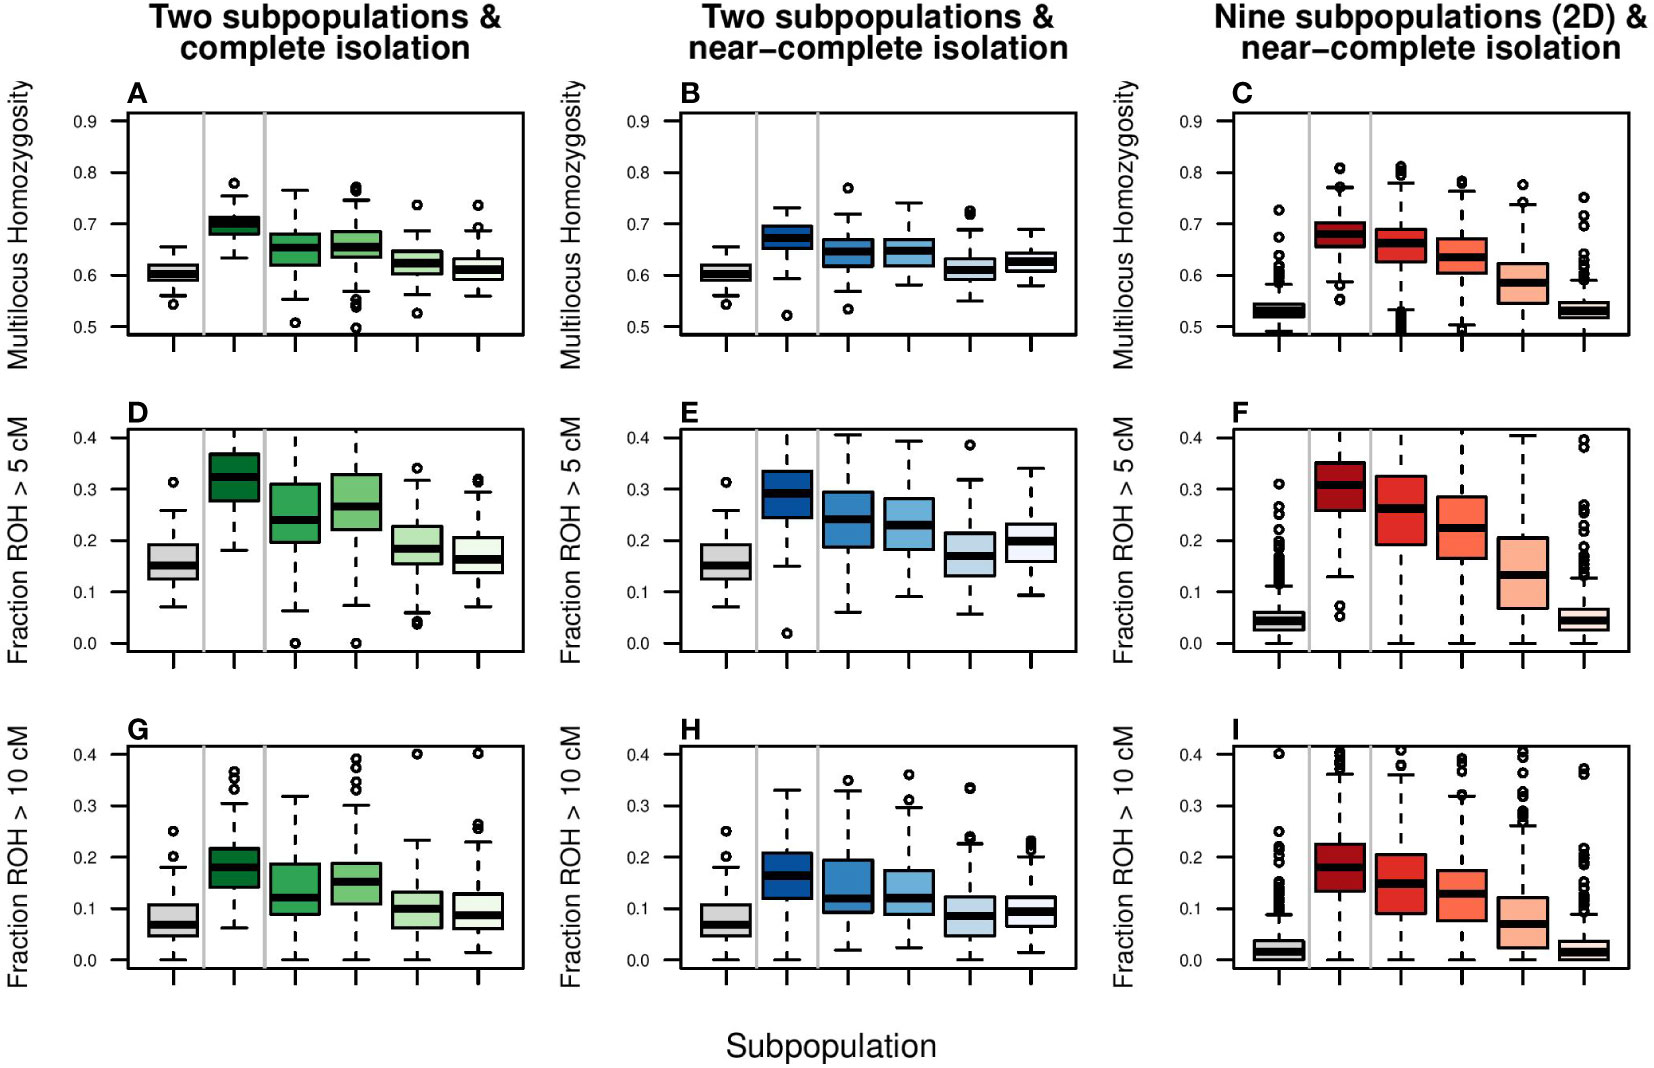
Figure 6 Simulation of the effect of enhanced gene flow on genomic inbreeding. Columns represent scenarios and color coding as in Figure 5. The response variables are: (A–C) Multilocus Heterozygosity, (D–F) Fraction of genome consisting of Runs of Homozygosity (ROH) larger than 5 cM, and (G–I) Fraction of genome consisting of Runs of Homozygosity (ROH) larger than 10 cM. ROHs of 5 and 10 cM are indicative of a shared common ancestor of 10 and 5 generations ago, respectively and roughly. Boxplots show the simulation output lumped per scenario. For boxplots per subpopulation, please see Supplementary Figure S10.
Following population genetic theory, the simulation indicated that even a minor increase in gene flow can quickly and substantially lower differentiation (FST), increase locus-based estimations of observed heterozygosity (Heobs) and reduce the speed of genetic erosion (increase Ne) (Figure 5). In line with theoretical expectations (Wang and Caballero, 1999), these beneficial effects of enhanced gene flow on genetic variation were slightly more pronounced in formerly completely isolated than near completely isolated subpopulations (Figures 5A, D, G). In the two-dimensional meta-population the reduction of genetic differentiation FST was limited by isolation by distance (Figure 5C). The potential for recovery was constrained by the remaining total variation (He expected meta, Figures 5G–I, dotted line), particularly so in the scenarios involving two subpopulations.
Despite fast and strong responses in FST, Ne and locus-based estimated of heterozygosity, alleviation of genomic inbreeding (Multilocus Homozygosity and fraction of ROH) was poor (Figure 6; Supplementary Figure S10). In the setup of two subpopulations, only migration rates of 0.10 and higher could reduce genomic inbreeding estimators to panmixia levels (grey boxplot) within 10 generations. Even then, due to fixation of haplotypes, FROH values could not return to, and remained far from, zero. In contrast, for the two-dimensional stepping stone population genomic inbreeding was potentially possible (FROH values for panmixia were close to zero), but due to isolation-by-distance recovery was slow (after 10 generations FROH was halved only when migration rate was 0.10 or higher). These patterns were not affected by length of ROH segments (>5cM vs. >10cM).
Discussion
To explore the consequences of neglecting genomic inbreeding in defragmentation projects by nature conservation authorities and organizations, we applied a SNP genotyping and simulation case study on the wild boar meta-population of Veluwe, The Netherlands. We demonstrated how much inbred isolated wildlife populations may be at the initiation of defragmentation, and how difficult it can be to undo inbreeding through defragmentation measures. Because we discovered this in a mobile species, namely, the wild boar, our results may be of general validity for many nature restoration projects aimed at large mammals. SNP genotyping showed (i) significant genetic differentiation within and among the Veluwe wild boar meta-population, except for two subpopulations connected by a highway wildlife overpass, (ii) migration rates that were low to moderate, and suggestive of a two-dimensional stepping-stone model, and (iii) considerable levels of inbreeding across the whole meta-population and particularly high in subpopulation Veluwe SouthWest. Simulations indicated that whilst FST and Ne may quickly revert to non-fragmentation levels through enhanced migration rates, accumulation of long autozygous segments decays much more slowly and, depending on the level of fixation of haplotypes across the meta-population, only partially.
Although wild boar are listed as IUCN least-concern, we consider our findings on the Veluwe wild boar meta-population to be insightful for understanding success and failure factors of mammal defragmentation conservation projects worldwide, including those targeting the few remaining population fragments of endangered species. First, present-day demography is a poor indicator for genetic status. In line with our findings on Veluwe red deer (de Jong et al., 2020), observed levels of inbreeding were higher in nowadays large subpopulations, possibly due to historic bottlenecks (van Wieren and Groot-Bruinderink, 2010). As is typical for European wild mammals (Apollonio et al., 2010), Veluwe wild boar went through a severe bottleneck during the 18th and 19th century (van Wieren and Groot-Bruinderink, 2010). Possibly, some subpopulations were therefore predisposed to inbreeding, and inbreeding was subsequently magnified during the fragmentation phase experienced during the population recovery. Second, even when considering the historical context, historic events may be forgotten or different than assumed. Despite being based on few founders and being confined for most of the previous decade, introduced estate populations had a relatively high level of genetic variation (in apparent contrast with inter alia Alpine ibex (Grossen et al., 2018) and Eurasian lynx (Mueller et al., 2022)). Furthermore, defragmentation projects typically fail to monitor, leave alone integrate genomic inbreeding. Like the situation in Veluwe, genetic monitoring in other mammal conservation projects may be lacking upfront or all together (precluding rigorous Before-After-Control-Impact assessment). In addition, genomic inbreeding may not be explicitly assessed, such as for example in de Groot et al. (2016). Because of the poor capacity of few genetic markers to estimate inbreeding (Heuertz et al., 2023), the latter investigation could not detect the intensity of ongoing genomic inbreeding. Fourth, despite extensive measures aimed at defragmentation, realizing enhanced gene flow may be difficult (wildlife crossings only hardly facilitate movement through dense human infrastructure) or at least time-consuming (animals need time to restore movement paths). We argue that the striking finding of near-panmixia of the Central and SouthEast subpopulation shows when defragmentation is most effective: when applied at the moment of barrier construction, and at existing movement paths. Amongst Veluwe wildlife managers, a jocose observation is that “when the concrete of the highway overpass was still being poured, mammals were already standing in line”. Lastly, when gene flow is enhanced, the potential for alleviation of inbreeding may be limited when the meta-population has a shared history of inbreeding.
How much priority should conservationists give to reducing genomic inbreeding in fragmented populations? Although for an increasing number of wild mammal populations habitat fragmentation has been shown to cause accumulation of autozygous segments (Larison et al., 2020; Khan et al., 2021; Cockerill et al., 2022), there are still few documentations of such effects at small spatial scale (de Jong et al., 2020). The inbreeding levels found in our study are especially striking, because they are observed within a setting of defragmentation efforts that ran already for decennia. Regarding phenotypic impacts, for Veluwe wild boar, other than a correlation between multilocus heterozygosity and disease prevalence (Goedbloed et al., 2014), little to nothing is known about inbreeding effects on animal performance. The evidence of inbreeding effects in wild mammal populations, in particular associations between accumulation of homozygous segments and performance, is still meagre (yet see below). Theoretically, the occurrence and intensity of inbreeding depression depends on mutation load (Hoffmann et al., 2021; Robinson et al., 2022), which through inbreeding may actually be reduced when deleterious alleles are purged (Hedrick and Garcia-Dorado, 2016; Grossen et al., 2020; Khan et al., 2021). Even assuming inbreeding depression, recently the practice of enhancing gene flow among population fragments has been questioned, because it may compromise the total level of genetic variation at meta-population level (Fernández et al., 2008; Kolodny et al., 2019). On the other hand, in the few cases that phenotypic performance of wild mammal populations are investigated thoroughly, clear negative associations with inbreeding have been reported (Walling et al., 2011; Stoffel et al., 2021). For example, focussing at Soay sheep, Stoffel et al. (2021) estimated that a 10% increase in individual inbreeding FROH reduces the odds of lamb survival with 60%. Based on these emperical findings, and while acknowledging that there is no full consensus yet, we assume that reduction of accumulation of genomic inbreeding should be given high priority in defragmentation projects.
While underlining the need for enhancing gene flow, our findings raise questions on the potential effectiveness of defragmentation measures. Although the observed low gene flow rates explained, at least partially, why genomic inbreeding was still rather high in Veluwe wild boar despite ongoing defragmentation, it begged the question to what extent gene flow should be enhanced. To our knowledge, we are the first to corroborate a SNP-genotyping study with a simulation of the potential alleviation effect of wildlife crossings on genomic inbreeding. While Figure 5 mostly restates generally known population genetic processes (including the potential for one migrant to constrain FST and enhance Ne), Figure 6 adds that ROHs break down slowly or, in the case of haplotype fixation, not at all. The cause of the slow decay of homozygous segments is likely the lag effect created by linkage disequilibrium. Discussions on the effects of gene flow typically centre around the one-migrant-per-generation rule, and deviations from the underlying demographic assumptions (Mills and Allendorf, 1996; Gustafson et al., 2017; Nathan et al., 2017). Our findings suggest that genomic architecture is an important component of understanding the impact of defragmentation, of which we only scratched the surface. More advanced simulations could better incorporate the genomic landscape, include hot- and coldspots of both recombination rates (Bosse et al., 2012) and deleterious mutations (Robinson et al., 2022).
Following inter alia (Ralls et al., 2018; Frankham et al., 2019; Hoban et al., 2022; Heuertz et al., 2023), we posit that advances in genomic understanding and resources are insufficiently integrated in mammal defragmentation projects and present-day wildlife conservation in general. Above, we argued that the actual genetic status of wild mammal populations, and therewith the need for, potential effectiveness of and optimal setup of defragmentation measures cannot be known without genetic monitoring. Without knowing and appreciating the baseline genomic status, defragmentation measures may boost gene flow insufficiently (too few migrants and too little gene flow) or connect subpopulations that have a shared history of inbreeding (lack of new alleles/haplotypes). As technology develops, the lack of integration of genomics in monitoring is only partially a consequence of resource availability (Heuertz et al., 2023). Regarding monitoring and designing, we posit that Runs of Homozygosity offer great potential to be applied by researchers and conservationists alike, because they are tangible and intuitive (see Figures 3, S4), and effective estimators of levels of inbreeding and inbreeding depression (Brüniche-Olsen et al., 2018; Supple and Shapiro, 2018; Kardos et al., 2021). Consequently, ROHs have been suggested as an Essential Biodiversity Variable (Hoban et al., 2022). Regarding management interventions, our findings suggest that when genetic erosion has occurred across the meta-population, assisted immigration should be considered. This may be less relevant when subpopulations are inbred for different haplotypes (gene flow among subpopulations has much potential for alleviation) (Wang and Caballero, 1999), yet urgent in subpopulations that have become inbred for the same haplotypes. The latter may be caused by a fragmentation phase of two very small subpopulations with low migration rates, or by shared founders. Whereas not intuitive within a connectivity restoration perspective, gene flow through supplementation may be a strong genetic reinforcement tool (Frankham, 2015; Hoffmann et al., 2021). Translocation is already common practice in, for example, management of lions of isolated, fenced Southern African game reserves (Trinkel et al., 2008).
To effectively address genomic inbreeding, we propose a defragmentation conservation action plan that is built on three principles. First, decision-making should be guided by genetic monitoring, both baseline and follow-up, that, amongst others, explicitly assesses the extent of genomic inbreeding through quantification of homozygous genomic segments. Second, defragmentation measures should be designed such that gene flow may optimally alleviate genomic inbreeding. This entails consideration of required levels and routes of gene flow. Thirdly, when enhanced gene flow among subpopulations offers little potential for genomic inbreeding alleviation, conservationists should consider the option of assisted gene flow from other meta-populations. If the 30×30 biodiversity target of the Kunming-Montreal Global Biodiversity Framework is to be achieved, mammal populations will increase in human-modified landscapes in the near future. Carefully planned and monitored defragmentation projects will have to be installed, for otherwise mammals may expand in numbers and distribution yet still impoverish genetically.
Data availability statement
The data presented in the study are deposited in the Dryad repository. The link to the dataset is: https://doi.org/10.5061/dryad.vmcvdnd0p.
Ethics statement
Ethical approval was not required for the study involving animals in accordance with the local legislation and institutional requirements, because samples were used of dead animals, shot as part of population management programs. No animals were killed and handled for the interest of this research.
Author contributions
JJ wrote the first draft of the manuscript. JJ and MJ executed the data analysis. HJM, PH and HP initiated the research. JJ, HJM, PH and HP designed the study. JJ and GG coordinated sample collection. RC oversaw DNA extraction and genotyping procedures. All authors contributed to interpretation of data analysis and text revision. All authors contributed to the article and approved the submitted version.
Funding
The author(s) declare financial support was received for the research, authorship, and/or publication of this article. We acknowledge the financial contributions of Stichting De Eijk, Koninklijke Nederlandse Jagersvereniging and BIJ12 - Unit Faunafonds.
Acknowledgments
We are thankful to all hunters who provisioned samples. Bert Dibbits and Kimberley Laport where responsible for sample storage and DNA extraction.
Conflict of interest
The authors declare that the research was conducted in the absence of any commercial or financial relationships that could be construed as a potential conflict of interest.
Publisher’s note
All claims expressed in this article are solely those of the authors and do not necessarily represent those of their affiliated organizations, or those of the publisher, the editors and the reviewers. Any product that may be evaluated in this article, or claim that may be made by its manufacturer, is not guaranteed or endorsed by the publisher.
Supplementary material
The Supplementary Material for this article can be found online at: https://www.frontiersin.org/articles/10.3389/fevo.2023.1158494/full#supplementary-material
References
Apollonio M., Andersen R., Putman R. (2010). European ungulates and their management in the 21st century (Cambridge: Cambridge University Press). Available at: https://library.wur.nl/WebQuery/wurpubs/390672.
Balloux F. (2001). EASYPOP (Version 1.7): A computer program for population genetics simulations. J. Hered. 92 (3), 301–302. doi: 10.1093/JHERED/92.3.301
Barbato M., Orozco-terWengel P., Tapio M., Bruford M. W. (2015). SNeP: a tool to estimate trends in recent effective population size trajectories using genome-wide SNP data. Front. Genet. 6. doi: 10.3389/fgene.2015.00109
Beckmann J. P. (2010). Safe passages : highways, wildlife, and habitat connectivity (Washington, DC: Island Press).
Beier P., Gregory A. J. (2012). Desperately seeking stable 50-year-old landscapes with patches and long, wide corridors. PloS Biol. 10 (1), e1001253. doi: 10.1371/journal.pbio.1001253
Bosse M., Megens H.-J., Madsen O., Paudel Y., Frantz L. A. F., Schook L. B., et al. (2012). Regions of homozygosity in the porcine genome: consequence of demography and the recombination landscape. PloS Genet. 8 (11), e1003100. doi: 10.1371/journal.pgen.1003100
Brüniche-Olsen A., Kellner K. F., Anderson C. J., DeWoody J. A. (2018). Runs of homozygosity have utility in mammalian conservation and evolutionary studies. Conserv. Genet. 19 (6), 1295–1307. doi: 10.1007/S10592-018-1099-Y/TABLES/2
Cockerill C., Hasselgren M., Dussex N., Genes L., Von Seth J., Angerbjörn A., et al (2022). Genomic consequences of fragmentation in the endangered fennoscandian arctic fox (Vulpes lagopus). Genes 13, 2124. doi: 10.3390/genes13112124
Cushman S. A., McKelvey K. S., Hayden J., Schwartz M. K. (2006). Gene flow in complex landscapes: Testing multiple hypotheses with causal modeling. Am. Nat. 168 (4), 486–499. doi: 10.1086/506976/ASSET/IMAGES/LARGE/FG6.JPEG
de Groot G. A., Spek G.-J., Bovenschen J., Laros I., van Meel T., de Jong J. F., et al. (2016). Herkomst en migratie van Nederlandse edelherten en wilde zwijnen: een basiskaart van de genetische patronen in Nederland en omgeving. Wageningen: Alterra. doi: 10.18174/383057
de Jong J. F., Iacolina L., Prins H. H. T., van Hooft P., Crooijmans R. P. M. A., van Wieren S. E., et al. (2023). Spatial genetic structure of European wild boar, with inferences on late-Pleistocene and Holocene demographic history. Heredity 12, 1–10. doi: 10.1038/s41437-022-00587-1
de Jong J. F., van Hooft P., Megens H. J., Crooijmans R. P. M. A., de Groot G. A., Pemberton J. M., et al. (2020). Fragmentation and translocation distort the genetic landscape of ungulates: red deer in the Netherlands. Front. Ecol. Evol. 8. doi: 10.3389/FEVO.2020.535715/FULL
de Jong M. J., de Jong J. F., Rus Hoelzel A., Janke A., Menno de Jong C. J. (2021). SambaR: An R package for fast, easy and reproducible population-genetic analyses of biallelic SNP data sets. Wiley Online Library 21 (4), 1369–1379. doi: 10.1111/1755-0998.13339
Denneboom D., Bar-Massada A., Shwartz A. (2021). Factors affecting usage of crossing structures by wildlife – A systematic review and meta-analysis. Sci. Total Environ. 777, 146061. doi: 10.1016/J.SCITOTENV.2021.146061
Emond D., van Gogh I., Driessen F. M. F., Brandjes G. J. (2016). Het gebruik van ecoducten op de Veluwe. Monitoring, onderzoeken en interviews uit de periode 1989 - 2016 (Bureau Waardenburg, Culemborg: Bureau Waardenburg Rapportnr), 16–117. Available at: https://edepot.wur.nl/391416.
Fernández J., Toro M. A., Caballero A. (2008). Management of subdivided populations in conservation programs: development of a novel dynamic system. Genetics 179 (1), 683–692. doi: 10.1534/GENETICS.107.083816
Frankham R. (2015). Genetic rescue of small inbred populations: meta-analysis reveals large and consistent benefits of gene flow. Mol. Ecol. 24 (11), 2610–2618. doi: 10.1111/MEC.13139
Frankham R., Ballou J., Ralls K., Eldridge M. D. B., Dudash M. R., Fenster C. B., et al (2017). Genetic management of fragmented animal and plant populations. Oxford: Oxford University Press.
Frankham R., Ballou J., Ralls K., Eldridge M. (2019). A practical guide for genetic management of fragmented animal and plant populations (Oxford: Oxford University Press).
Frantz A. C., Bertouille S., Eloy M. C., Licoppe A., Chaumont F., Flamand M. C. (2012). Comparative landscape genetic analyses show a Belgian motorway to be a gene flow barrier for red deer (Cervus elaphus), but not wild boars (Sus scrofa). Mol. Ecol. 21, 3445–3457. doi: 10.1111/j.1365-294X.2012.05623.x
Frichot E., François O. (2015). LEA: An R package for landscape and ecological association studies. Methods Ecol. Evol. 6 (8), 925–929. doi: 10.1111/2041-210X.12382
Goedbloed D. J., Megens H. J., van Hooft P., Herrero-Medrano J. M., Lutz W., Alexandri P., et al. (2012). Genome-wide single nucleotide polymorphism analysis reveals recent genetic introgression from domestic pigs into Northwest European wild boar populations. Mol. Ecol. 22, 856–866. doi: 10.1111/j.1365-294X.2012.05670.x
Goedbloed D. J., van Hooft P., Megens H. J., Bosch T., Lutz W., van Wieren S. E., et al. (2014). Host genetic heterozygosity and age are important determinants of porcine circovirus type 2 disease prevalence in European wild boar. Eur. J. Wildl. Res. 60 (5), 803–810. doi: 10.1007/S10344-014-0850-Z/TABLES/5
Goedbloed D. J., van Hooft P., Megens H. J., Langenbeck K., Lutz W., Crooijmans R., et al. (2013). Reintroductions and genetic introgression from domestic pigs have shaped the genetic population structure of Northwest European wild boar. BMC Genet. 14 (1), 43. doi: 10.1186/1471-2156-14-43
Gómez-Sánchez D., Olalde I., Sastre N., Enseñat C., Carrasco R., Marques-Bonet T., et al. (2018). On the path to extinction: inbreeding and admixture in a declining grey wolf population. Wiley Online Library 27 (18), 3599–3612. doi: 10.1111/mec.14824
Grossen C., Biebach I., Angelone-Alasaad S., Keller L. F., Croll D. (2018). Population genomics analyses of European ibex species show lower diversity and higher inbreeding in reintroduced populations. Evolution. Appl. 11 (2), 123–139. doi: 10.1111/eva.12490
Grossen C., Guillaume F., Keller L. F., Croll D. (2020). Purging of highly deleterious mutations through severe bottlenecks in Alpine ibex. Nat. Commun. 11 (1), 1–12. doi: 10.1038/s41467-020-14803-1
Gustafson K. D., Vickers T. W., Boyce W. M., Ernest H. B. (2017). A single migrant enhances the genetic diversity of an inbred puma population. R. Soc. Open Sci. 4 (5), 170115. doi: 10.1098/RSOS.170115
Hagenblad J., Olsson M., Parker H. G., Ostrander E. A., Ellegren H. (2009). Population genomics of the inbred Scandinavian wolf. Mol. Ecol. 18 (7), 1341–1351. doi: 10.1111/j.1365-294X.2009.04120.x
Hedrick P. W., Garcia-Dorado A. (2016). Understanding inbreeding depression, purging, and genetic rescue. Trends Ecol. Evol. 31 (12), 940–952. doi: 10.1016/J.TREE.2016.09.005
Herrero-Medrano J., Megens H.-J., Groenen M. A., Ramis G., Bosse M., Pérez-Enciso M., et al. (2013). Conservation genomic analysis of domestic and wild pig populations from the Iberian Peninsula. BMC Genet. 14 (1), e106. doi: 10.1186/1471-2156-14-106
Heuertz M., Carvalho S. B., Galindo J., Rinkevich B., Robakowski P., Aavik T., et al. (2023). The application gap: Genomics for biodiversity and ecosystem service management. Biol. Conserv. 278, 109883. doi: 10.1016/J.BIOCON.2022.109883
Hoban S., Archer F. I., Bertola L. D., Bragg J. G., Breed M. F., Bruford M. W., et al. (2022). Global genetic diversity status and trends: towards a suite of Essential Biodiversity Variables (EBVs) for genetic composition. Biol. Rev. 97 (4), 1511–1538. doi: 10.1111/BRV.12852
Hofmann A. A., Miller A. D., Weeks A. R. (2021). Genetic mixing for population management: from genetic rescue to provenancing. Evol. Appl. 14, 634–652. doi: 10.1111/eva.13154
Hohenlohe P. A., Funk W. C., Rajora O. P. (2021). Population genomics for wildlife conservation and management. Mol. Ecol. 30 (1), 62–82. doi: 10.1111/MEC.15720
Jombart T., Ahmed I. (2011). adegenet 1.3-1: new tools for the analysis of genome-wide SNP data. Bioinf. (Oxford England) 27 (21), 3070–3071. doi: 10.1093/bioinformatics/btr521
Kamvar Z. N., Tabima J. F., Grünwald N. J. (2014). Poppr: an R package for genetic analysis of populations with clonal, partially clonal, and/or sexual reproduction. PeerJ, 2, e281. doi: 10.7717/peerj.281
Kardos M., Åkesson M., Fountain T., Flagstad Ø., Liberg O., Olason P., et al. (2018). Genomic consequences of intensive inbreeding in an isolated wolf population. Nat. Ecol. Evol. 2 (1), 124–131. doi: 10.1038/s41559-017-0375-4
Kardos M., Armstrong E. E., Fitzpatrick S. W., Hauser S., Hedrick P. W., Miller J. M., et al. (2021). The crucial role of genome-wide genetic variation in conservation. Proc. Natl. Acad. Sci. U. S. A. 118 (48), e2104642118. doi: 10.1073/PNAS.2104642118
Kenney J., Allendorf F. W., McDougal C., Smith J. L. D. (2014). How much gene flow is needed to avoid inbreeding depression in wild tiger populations? Proc. R. Soc. B: Biol. Sci. 281 (1789), 20133337. doi: 10.1098/RSPB.2013.3337
Khan A., Patel K., Shukla H., Viswanathan A., van der Valk T., Borthakur U., et al (2021). Genomic evidence for inbreeding depression and purging of deleterious genetic variation in Indian tigers. Proc. Natl. Acad. Sci. 118 (49), e2023018118. doi: 10.1073/pnas.2023018118
Kolodny O., McLaren M. R., Greenbaum G., Ramakrishnan U., Feldman M. W., Petrov D., et al. (2019). Reconsidering the management paradigm of fragmented populations. BioRxiv, 649129. doi: 10.1101/649129
Larison B., Kaelin C., Harrigan R. (2020). Population structure, inbreeding and stripe pattern abnormalities in plains zebras. Wiley Online Library 30 (2), 379–390. doi: 10.1111/mec.15728
Lemel J., Truvé J., Soderberg B., Lemel J. (2003). Timing and distance of natal dispersal for wild boar Sus scrofa in Sweden. Wildl. Biol. 9 (Suppl. 1), 51–57.
Lesbarrères D., Fahrig L. (2012). Measures to reduce population fragmentation by roads: what has worked and how do we know? Trends Ecol. Evol. 27 (7), 374–380. doi: 10.1016/J.TREE.2012.01.015
Manichaikul A., Mychaleckyj J. C., Rich S. S., Daly K., Sale M., Chen W. M. (2010). Robust relationship inference in genome-wide association studies. Bioinform 26 (22), 2867–2873. doi: 10.1093/bioinformatics/btq559
McVean G. (2009). A genealogical interpretation of principal components analysis. PloS Genet. 5 (10), e1000686. doi: 10.1371/journal.pgen.1000686
Miller J. M., Poissant J., Hogg J. T., Coltman D. W. (2012). Genomic consequences of genetic rescue in an insular population of bighorn sheep (Ovis canadensis). Mol. Ecol. 21 (7), 1583–1596. doi: 10.1111/j.1365-294X.2011.05427.x
Mills L., Allendorf F. (1996). The one-migrant-per-generation rule in conservation and management. Conserv. Biol. 10, 1509–1518. doi: 10.1046/j.1523-1739.1996.10061509.x
Morelle K., Podgórski T., Prévot C., Keuling O., Lehaire F., Lejeune P. (2014). Towards understanding wild boar Sus scrofa movement: a synthetic movement ecology approach. Mammal Rev. 45, 15–29. doi: 10.1111/mam.12028
Mueller S. A., Prost S., Anders O., Breitenmoser-Würsten C., Kleven O., Klinga P., et al. (2022). Genome-wide diversity loss in reintroduced Eurasian lynx populations urges immediate conservation management. Biol. Conserv. 266, 109442. doi: 10.1016/J.BIOCON.2021.109442
Nathan L. R., Kanno Y., Vokoun J. C. (2017). Population demographics influence genetic responses to fragmentation: A demogenetic assessment of the ‘one migrant per generation’ rule of thumb. Biol. Conserv. 210, 261–272. doi: 10.1016/J.BIOCON.2017.02.043
Ogle D. H., Doll J. C., Wheeler P., Dinno A. (2022). FSA: Fisheries stock analysis. R package version 0.9.3. Available at: https://github.com/fishR-Core-Team/FSA.
Paradis E., Claude J., Strimmer K. (2004). APE: analyses of phylogenetics and evolution in r language. Bioinform 20 (2), 289–290. doi: 10.1093/bioinformatics/btg412
Patterson N., Moorjani P., Luo Y., Mallick S., Rohland N., Zhan Y., et al. (2012). Ancient admixture in human history. Genetics 192 (3), 1065–1093. doi: 10.1534/GENETICS.112.145037/-/DC1
Pembleton L. W., Cogan N. O., Forster J. W. (2013). StAMPP: An r package for calculation of genetic differentiation and structure of mixed-ploidy level populations. Mol. Ecol. Resour. 13 (5), 946–952. doi: 10.1111/1755-0998.12129
Petr M., Vernot B., Kelso J. (2019). admixr—R package for reproducible analyses using ADMIXTOOLS. Bioinformatics 35 (17), 3194–3195. doi: 10.1093/BIOINFORMATICS/BTZ030
Pickrell J., Precedings J. P.-N. (2012). Inference of population splits and mixtures from genome-wide allele frequency data. PLoS Genet 8, e1002967. doi: 10.1371/journal.pgen.1002967
Pimm S. L., Willigan E., Kolarova A., Huang R. (2021). Reconnecting nature. Curr. Biol. 31 (19), R1159–R1164. doi: 10.1016/J.CUB.2021.07.040
Prévot C., Licoppe A. (2013). Comparing red deer (Cervus elaphus L.) and wild boar (Sus scrofa L.) dispersal patterns in southern Belgium. Eur. J. Wildl. Res. 59 (6), 795–803. doi: 10.1007/s10344-013-0732-9
Purcell S., Neale B., Todd-Brown K., Thomas L., Ferreira M. A. R., Bender D., et al. (2007). PLINK: a tool set for whole-genome association and population-based linkage analyses. Am. J. Hum. Genet. 81 (3), 559–575. doi: 10.1086/519795
Ralls K., Ballou J. D., Dudash M. R., Eldridge M. D. B., Fenster C. B., Lacy R. C., et al. (2018). Call for a paradigm shift in the genetic management of fragmented populations. Conserv. Lett. 11 (2), e12412. doi: 10.1111/conl.12412
R Core Team. (2017). R: a language and environment for statistical computing (3.4.2) (Vienna: R Foundation for Statistical Computing). Available at: http://www.r-project.org.
Robinson J., Kyriazis C. C., Yuan S. C., Lohmueller K. E. (2023). Deleterious variation in natural populations and implications for conservation genetics. Annu. Rev. Anim. Biosci. 11, 93–114. doi: 10.1146/ANNUREV-ANIMAL-080522-093311
Robinson J. A., Ortega-Del Vecchyo D., Fan Z., Kim B. Y., vonHoldt B. M., Marsden C. D., et al. (2016). Genomic flatlining in the endangered island fox. Curr. Biol. 26 (9), 1183–1189. doi: 10.1016/j.cub.2016.02.062
Sawaya M. A., Kalinowski S. T., Clevenger A. P. (2014). Genetic connectivity for two bear species at wildlife crossing structures in Banff National Park. Proc. R. Soc. B: Biol. Sci. 281 (1780), 20131705. doi: 10.1098/RSPB.2013.1705
Schliep K. (2011). phangorn: phylogenetic analysis in R. Bioinform 27 (4), 592–593. doi: 10.1093/bioinformatics/btq706
Soanes K., Taylor A. C., Sunnucks P., Vesk P. A., Cesarini S., van der Ree R. (2018). Evaluating the success of wildlife crossing structures using genetic approaches and an experimental design: Lessons from a gliding mammal. J. Appl. Ecol. 55 (1), 129–138. doi: 10.1111/1365-2664.12966
Spek G. J. (2014). Faunabeheerplan grofwild FBE gelderland 2014-2019. Deventer: Faunabeheereenheid Gelderland.
Spek G. J. (2016). Jaarrapportage Grofwild 2016-2017 - Werkplannen 2017-2018. Deventer: Faunabeheereenheid Gelderland.
Stoffel M. A., Johnston S. E., Pilkington J. G., Pemberton J. M. (2021). Genetic architecture and lifetime dynamics of inbreeding depression in a wild mammal. Nat. Commun. 12 (1), 1–10. doi: 10.1038/s41467-021-23222-9
Supple M. A., Shapiro B. (2018). Conservation of biodiversity in the genomics era. Genome Biol. 19 (1), 1–12. doi: 10.1186/S13059-018-1520-3
Thatte P., Joshi A., Vaidyanathan S., Landguth E., Ramakrishnan U. (2018). Maintaining tiger connectivity and minimizing extinction into the next century: Insights from landscape genetics and spatially-explicit simulations. Biol. Conserv. 218, 181–191. doi: 10.1016/J.BIOCON.2017.12.022
Thurfjell H., Ball J., Åhlén P.-A., Kornacher P., Dettki H., Sjöberg K. (2009). Habitat use and spatial patterns of wild boar (Sus scrofa L.) agricultural fields and edges. Eur. J. Wildl. Res. 55 (5), 517–523. doi: 10.1007/s10344-009-0268-1
Trinkel M., Ferguson N., Reid A., Reid C., Somers M., Turelli L., et al. (2008). Translocating lions into an inbred lion population in the Hluhluwe-iMfolozi Park, South Africa. Anim. Conserv. 11 (2), 138–143. doi: 10.1111/J.1469-1795.2008.00163.X
van Wieren S. E., Groot-Bruinderink G. W. T. A. (2010). “Ungulates and their management in the Netherlands,” in European Ungulates and their Management in the 21st Century. Eds. Apollonio M., Andersen R., Putman R. (Cambridge: Cambridge University Press), 165–183.
Vilà C., Sundqvist A., Flagstad Ø., Seddon J., Björnerfeldt S. B., Kojola I., et al. (2003). Rescue of a severely bottlenecked wolf (Canis lupus) population by a single immigrant. Proc. R. Soc. London. Ser. B: Biol. Sci. 270 (1510), 91–97. doi: 10.1098/rspb.2002.2184
Walling C., Nussey D., Morris A., Clutton-Brock T., Kruuk L., Pemberton J. (2011). Inbreeding depression in red deer calves. BMC Evolution. Biol. 11 (1), e318. doi: 10.1186/1471-2148-11-318
Wang J., Caballero A. (1999). Developments in predicting the effective size of subdivided populations. Heredity 82 (2), 212–226. doi: 10.1046/J.1365-2540.1999.00467.X
Weir B. S., Cockerham C. C. (1984). Estimating f-statistics for the analysis of population structure. Evolution 38 (6), 1358–1370. doi: 10.2307/2408641
Xue Y., Prado-Martinez J., Sudmant P. H., Narasimhan V., Ayub Q., Szpak M., et al. (2015). Mountain gorilla genomes reveal the impact of long-term population decline and inbreeding. Science 348 (6231), 242–245. doi: 10.1126/science.aaa3952
Keywords: fragmentation, SNP, genomic inbreeding, run of homozygosity, defragmentation, wildlife crossing, effectiveness
Citation: de Jong JF, de Jong MJ, Megens HJ, van Hooft P, Crooijmans RPMA, de Groot GA and Prins HHT (2024) An inbreeding perspective on the effectiveness of wildlife population defragmentation measures – a case study on wild boar (Sus scrofa) of Veluwe, The Netherlands. Front. Ecol. Evol. 11:1158494. doi: 10.3389/fevo.2023.1158494
Received: 04 February 2023; Accepted: 15 December 2023;
Published: 26 January 2024.
Edited by:
David Jack Coates, Conservation and Attractions (DBCA), AustraliaReviewed by:
Sibelle Torres Vilaça, University of Ferrara, ItalyGeorge P. Laliotis, Agriculture University of Athens, Greece
Copyright © 2024 de Jong, de Jong, Megens, van Hooft, Crooijmans, de Groot and Prins. This is an open-access article distributed under the terms of the Creative Commons Attribution License (CC BY). The use, distribution or reproduction in other forums is permitted, provided the original author(s) and the copyright owner(s) are credited and that the original publication in this journal is cited, in accordance with accepted academic practice. No use, distribution or reproduction is permitted which does not comply with these terms.
*Correspondence: Joost F. de Jong, am9vc3QuZGVqb25nQHd1ci5ubA==