 Laramy Enders
 Trevor Hefley
- 1Department of Entomology, Purdue University, West Lafayette, IN, United States
- 2Department of Statistics, Kansas State University, Manhattan, KS, United States
Insect transmission of plant pathogens involves multi-layered interactions between vectors, viruses, host plants and environmental factors. Adding to the complexity of vector–virus relationships are diverse microbial communities, which are hypothesized to influence pathogen transmission. Although vector–virus interaction research has flourished, the role played by microbes in vector competence and disease epidemiology remains unclear in many pathosystems. We therefore aimed to develop a novel ecological modeling approach to identify environmental drivers of complex vector–virus–microbiome interactions, particularly differences in the abundance of microbial symbionts within vector microbiomes and relationships between symbionts and the probability of virus acquisition. Our approach combines established molecular tools for profiling microbial communities with underutilized Bayesian hierarchical modeling and data integration techniques. We used a globally relevant aphid–virus pathosystem to develop custom vector–microbiome models that incorporate environmental covariates (e.g., temperature, landcover) and applied them to individual vector symbionts to identify the extent to which environmental factors drive changes in microbial communities that then influence virus acquisition by the host aphid. Specifically, we focus on the aphid obligate symbiont (Buchnera) and a wide-spread facultative symbiont (Serratia) as proof of concept to develop models for two major vector species that include a single environmental covariate (i.e., temperature). Overall, we demonstrate how community-level modeling and microbiome profiling can identify candidate microbes and environmental variables associated with vector competence. Our modeling framework can accommodate a range of microbial symbionts with different abundances, overcome spatial misalignment of data streams, and is robust to varying levels of disease incidence. Results show Buchnera relative abundance is strongly negatively associated with virus acquisition by the vector S.avenae, but not R. padi. Although Serratia was not associated with R. padi vector competence, relative abundance was influenced by differences in spring temperatures. This work lays the foundation for developing a broader modeling framework for predicting disease dynamics in agroecosystems and deploying microbiome-targeted pest management tactics.
1 Introduction
Interactions among plants, insects, and their associated microbial communities are complex. Plants and insects engage in relationships with both beneficial and pathogenic microbes that inhabit diverse communities associated with host tissues and the external environment (Casteel and Hansen, 2014; Cordovez et al., 2019; Coolen et al., 2022). Added to this complexity is the potential for insects to vector plant pathogens that cause disease outbreaks, which can be further affected by microbial symbionts (Weiss and Aksoy, 2011; Crotti et al., 2012; Angelella et al., 2018). Mounting evidence suggests a microbial hand in transmission of insect vectored plant pathogens (reviewed by Wu et al., 2022). Some of the best studied examples exist in sap-feeding insects such as aphids and whiteflies, where both obligate and facultative symbionts are predicted to be involved in various aspects of pathogen transmission (e.g., Gottlieb et al., 2010; Cilia et al., 2011; Bello et al., 2019). Disentangling these multi-trophic interactions within agroecosystems is therefore key to developing effective disease management strategies (Jones et al., 2010; Chuche et al., 2017; Mendiola et al., 2020).
Currently, it is unclear how environmental factors, such as temperature and landscape, impact vector microbiome dynamics and whether there are cascading effects on the spread of plant pathogens (Jones et al., 2010; Vayssier-Taussat et al., 2014; Eigenbrode et al., 2018). Factors that are beneficial for insect host survival and reproduction could also induce changes in the microbiome that facilitate virus transmission to new host plants. Changing environmental conditions are also predicted to influence viral populations by influencing competition between viral species or impacting which strains are vectored efficiently (Parry et al., 2012). However, traditional research approaches have focused on direct symbiont–virus interactions under controlled laboratory conditions. Controlled laboratory or greenhouse studies are limited to manipulation of relatively few environmental variables and may produce results that are not transferable to field settings due to well established effects of lab rearing on insect microbial diversity (e.g., Bansal et al., 2014). Alternatively, combining field-based studies with statistical modeling is a natural complement to well-designed laboratory experiments, that together better capture the complexity of microbe–virus–environment interactions and thus have the potential to contribute to a mechanistic understanding of disease dynamics (Eigenbrode et al., 2018).
Despite advances in community-level modeling that incorporate environmental predictors with changes in abundance of multiple taxa (Warton et al., 2015), ecological models that can be applied to insect symbiont–plant pathogen dynamics are underdeveloped (Vayssier-Taussat et al., 2014; Eigenbrode et al., 2018). In nature, a consortium of microbes may be responsible for variability in virus transmission and vector competence. Community-level approaches, such as those employed using spatial–temporal modeling, incorporate the complexity of host–microbe–environment interactions and can be used to identify guilds of microbes that together influence host traits (Johnson and Sinclair, 2017). Modeling approaches aimed at identifying the ecological mechanisms shaping insect microbial communities are therefore needed to develop microbiome based control strategies for combating disease epidemics in crops.
Advancing available ecological modeling tools will ultimately enable researchers to disentangle the mechanistic basis of complex vector–microbiome–plant pathogen interactions. As a foundational step forward, we propose development of a broadly applicable framework for modeling the distribution of individual microbes (i.e., symbionts) to identify environmental covariates (e.g., weather, landcover) that predict differences in abundance within vector microbiomes, that are then linked back to vector competence. Several approaches can be used for these joint vector–microbiome models, including selection of 1) known symbionts (e.g., obligate or facultative symbionts) and 2) candidate taxa linked to pathogen acquisition or transmission (e.g., positively or negatively associated with vector competence). In addition, establishing a framework that is compatible with a range of data types used for estimating abundances of insect microbial symbionts, including quantitative PCR (qPCR) and whole microbiome amplicon sequencing (i.e., metabarcoding), will facilitate broader exploration across pathosystems.
The overarching goal of this work is to build ecological modeling tools that enable researchers working in diverse systems to disentangle the mechanistic basis of insect vector–microbiome–plant pathogen interactions. To do so, we apply Bayesian hierarchical models to investigate Luteovirus–aphid–microbe interactions, first using the aphid–Buchnera symbiosis as proof of concept and then expanding to additional facultative symbionts. Barley yellow dwarf (BYD) is a globally destructive disease of cereal crops caused by a group of aphid-vectored viruses belonging to the Luteoviridae family, including Barely yellow dwarf virus (BYDV). Previous work by Enders et al. (2018) demonstrated the statistical framework for developing spatial–temporal models linking environmental factors, vector microbial communities and BYDV incidence. These spatio-temporal models were developed to capture dynamics in abundance and probability of BYDV infection in two dominant aphid vector species (Rhopalosiphum padi and Sitobion avenae) and included environmental factors such as weather (e.g., temperature, precipitation) or land cover (e.g., grassland vs. cropland) as covariates. Here we further develop this modeling framework by incorporating vector symbionts and two common types of microbiome data used for estimating microbial relative abundance – qPCR and metabarcoding. Specifically, we used Bayesian hierarchical techniques to develop joint vector–microbiome models for two data sets collected in different North American wheat growing regions that illustrate the applicability of our approach to a range of data types, microbial symbionts and disease levels. First, we developed a modular Bayesian model to predict changes in abundance of the aphid vector (S. avenae) and its obligate endosymbiont (Buchnera aphidicola) associated with temperature using qPCR data from individuals collected in Kansas. Second, we applied our modeling framework to both the obligate symbiont (Buchnera) and a known facultative aphid symbiont (Serratia sp.) of a second vector species (R. padi) using metabarcoding data from individuals collected across Indiana. These models identify relationships between vector and symbiont abundances, virus acquisition and spring temperatures.
2 Methods and materials
2.1 Background on BYD pathosystem
The epidemiology of BYDV is complex, involving both cultivated and non-cultivated grasses and multiple aphid vector species. In North American cereal agroecosystems, the cycle of disease begins when aphids colonize newly emerged winter wheat seedlings in the fall. Both viruses and vectors overwinter in wheat fields, but disease symptoms do not manifest until spring. Vector populations generally increase throughout the spring and then migrate to alternate grass hosts following wheat harvest. Summer cereals (e.g., corn and sorghum) and native perennial grass species are therefore an important “green bridge” maintaining the stability of the BYDV–wheat pathosystem (Brown, 1984; Clement et al., 1986; Ingwell and Bosque-Pérez, 2015). A suite of at least 25 aphid species transmit BYD Luteoviruses (Miller and Rasochová, 1997), with the predominant North American vectors being R. padi, S. avenae, and Schizaphis graminum (Gray et al., 1998; Hesler et al., 2005; Power et al., 2011). Transmission efficiency among vector species varies between BYDV strains and can be highly vector specific (Lucio-Zavaleta et al., 2001; Papura et al., 2002; Power et al., 2011). In general, transmission of Luteoviruses by aphids from plant to plant occurs via a persistent circulative process, whereby virus particles ingested during phloem feeding circulate through the aphid body prior to inoculation of a new host plant (Gray and Gildow, 2003; Ali et al., 2014).
2.2 Aphid collection and sample processing
We used a subset of English grain aphid (S. avenae) samples originally collected by Enders et al. (2018) across Kansas from winter wheat fields in 2015. All samples were originally stored at −80C directly after field collection and species identification. We selected samples collected from 6 wheat fields where BYDV had previously been detected and there were at least 10 individual aphids remaining in storage. Groups of 5 adult S. avenae were tested by Enders et al. (2018), thus we did not have an initial estimate of virus incidence (i.e., % viruliferous aphids) in these vector populations to aide in sample selection, only whether BYDV was detected. We extracted DNA and RNA from individual aphids using the AllPrep DNA/RNA Mini Kit (Qiagen) following manufacturer protocols, except that final elution volumes were 20 μl for DNA and 10ul for RNA. This dual DNA/RNA extraction allows for downstream DNA-based microbiome profiling (e.g., qPCR or metabarcoding) and screening for BYDV (RNA virus).
A second data set of Bird cherry-oat aphids (R. padi) was collected from winter wheat fields from 5 locations at Purdue Agricultural Centers across Indiana in 2018 and 2019. Weekly collections of aphids were performed using a standardized number of sweeps per field (100 sweeps/field) and timed with aphid population peaks (May–June), similar to methods used in Enders et al. (2018). Aphid samples were sorted, separated and identified to species, and then stored at −80C until further processing. We selected samples from collection dates that had at least 10 individual wingless adult R.padi for further testing. Similar to the samples from Kansas, DNA and RNA were extracted from individual aphids (10 individuals/field site/year) using the AllPrep DNA/RNA Mini Kit and stored at −80°C until further processing.
2.3 Screening aphids for BYDV and measuring bacterial symbiont abundance
We generated two unique data sets for developing our applied ecological modeling framework. Both data sets use field caught aphid vectors (S. avenae and R. padi) and combine virus screening with commonly used approaches for characterizing relative abundances of microbial taxa/symbionts from insect hosts. The two microbiome data types used are DNA sequenced based but estimate symbiont abundances differently, either focusing on 1) individual taxa (qPCR data set) or 2) selected taxa identified from within a broader microbial community (metabarcoding data set).
2.3.1 qPCR data set from Kansas
In total, sixty individual aphids (10/field site) were 1) screened for BYDV and 2) profiled for abundance of the obligate symbiont (Buchnera). We used the quantitative reverse transcription PCR (qRT-PCR) method developed by Enders et al. (2018) to screen for BYDV-PAV, which is the most widespread strain found infecting wheat fields worldwide (Parry et al., 2012; Jarošová et al., 2013) including the U.S. Great Plains (Rotenberg et al., 2016). This method detects presence or absence of BYDV but does not quantify viral titer levels or absolute abundances.
Buchnera abundance was quantified using quantitative PCR (qPCR) methods developed by Enders and Miller (2016). Relative abundances were measured using qPCR with single copy genes from the symbiont (Buchnera chaperonin – GroEL) and aphid host (elongation factor 1α – Ef1α). The following primer pairs were used for 1) GroEL: For-ACTATTATTGGTGGCATCGGAG; Rev- CTTCTGTCGCAGCTCCTACT and 2) Ef1α: For-TGGACTCAACTGAACCACCA; ATGGGAACGAAAGCAACAGC. All qPCR reactions were performed in 10 μl volumes on the BIO-RAD (Hercules, CA) CFX Connect™ Real-Time System using iTaq™ Universal SYBR® Green Supermix, with 300 nmol/L of each primer and 2–15 ng input DNA. The following PCR cycling conditions were used for all primer pairs: 95°C for 3 min; 40 cycles of 95°C for 20 sec; 56°C for 30 sec; and 72°C for 30 sec; followed by a 0.5°C increment melt curve from 65 to 95°C. All primers produced a single melt peak. Individual samples were run in duplicate and a negative control with no DNA template was included on each plate. The negative controls did not show amplification for any of the genes tested from symbionts or aphid host. Buchnera relative symbiont abundance (RA) was estimated as 2−ΔCq; where ΔCq = Cq (GroEL) − Cq (Ef1α). Similar to Enders and Miller (2016), Buchnera abundances were calibrated to reflect differences in individual extraction efficiency by multiplying each sample RA by a correction factor (CF = maximum Ef1α Cq/sample Ef1α Cq).
2.3.2 Metabarcoding data set from Indiana
In total, 70 individual aphids (10/field site/year) were 1) screened for BYDV and 2) profiled for bacterial microbiomes using metabarcoding. We use a similar qRT-PCR based method for BYDV screening, but with general primers that amplify multiple virus strains. This assay involved cDNA synthesis of RNA extracted from aphids and reverse transcriptase PCR (RT-PCR) performed with generic primers developed by Ingwell et al. (2017) (For:5′-CGGACARTGGTTRTGG-3′ & Rev:5′-TGGTAGGACTTRAGTAYTCC-3′). These primers amplify a 224–227 bp region of the viral coat protein and detect the following strains: BYDV-SGV, -RMV, -PAV, -MAV and CYDV-RPV (Ingwell et al., 2017). This method detects presence or absence of BYDV but does not quantify viral titer levels within individual aphids.
A standard metabarcoding approach using targeted amplicon sequencing of a 300 bp section of the V3–V4 region of the prokaryotic 16s rRNA (515F GTGCCAGCMGCCGCGGTAA and 806R GGACTACHVGGGTWTCTAAT, Caporaso et al., 2011) was used to characterize bacterial communities of viruliferous (+BYDV) and nonviruliferous (-BYDV) R. padi. Metabarcode sequencing was performed at the University of Minnesota Genomics Facility on an Illumina MiSeq instrument using V3 chemistry. Sequences were processed using a customized bioinformatics pipeline, which includes sequence quality filtering, identification of amplified sequence variants (ASVs) and phylogenetic assignment. From this data set two ASVs identified as Buchnera and Serratia were used for further modeling.
2.4 Modeling methods
2.4.1 Overview of modeling framework
The Bayesian hierarchical modeling framework is a commonly used approach in ecology that enables the use of customizable bespoke statistical models (e.g., Royle and Dorazio, 2008; Kéry and Royle, 2015; Hooten and Hefley, 2019). Briefly, the Bayesian hierarchical modeling framework uses a conditional multi-level (hierarchical) constructive approach to connect data to an underlying ecological process and ultimately to model parameters (e.g., slope parameters). In addition to enabling the construction of bespoke statistical models that are tailored to answer scientific questions, the Bayesian hierarchical modeling framework also enables the use of multiple data sets, which is more commonly known as data fusion or integrated data models (see Ch. 25 in Hooten and Hefley, 2019; Schaub and Kéry, 2021).
In what follows we use the bracket notation commonly used for Bayesian models (Hobbs and Hooten, 2015). Using standard notation from Bayesian statistics, the square bracket represents a probability distribution (e.g., [a] where a is the random variable). The presence of a vertical bar inside of the bracket, means that the probability distribution is conditional (e.g., [a|b]) where a is the random variable conditional on b).
The first component of our Bayesian hierarchical model are the probability distributions that describe the collected data. In our specific case, we include three components (i) aphid count data (vector relative abundance), (ii) virus presence–absence data (virus prevalence), and (iii) microbial symbiont relative abundance data measured using qPCR RA or raw sequence counts (see Figure 1 for graphical depiction).
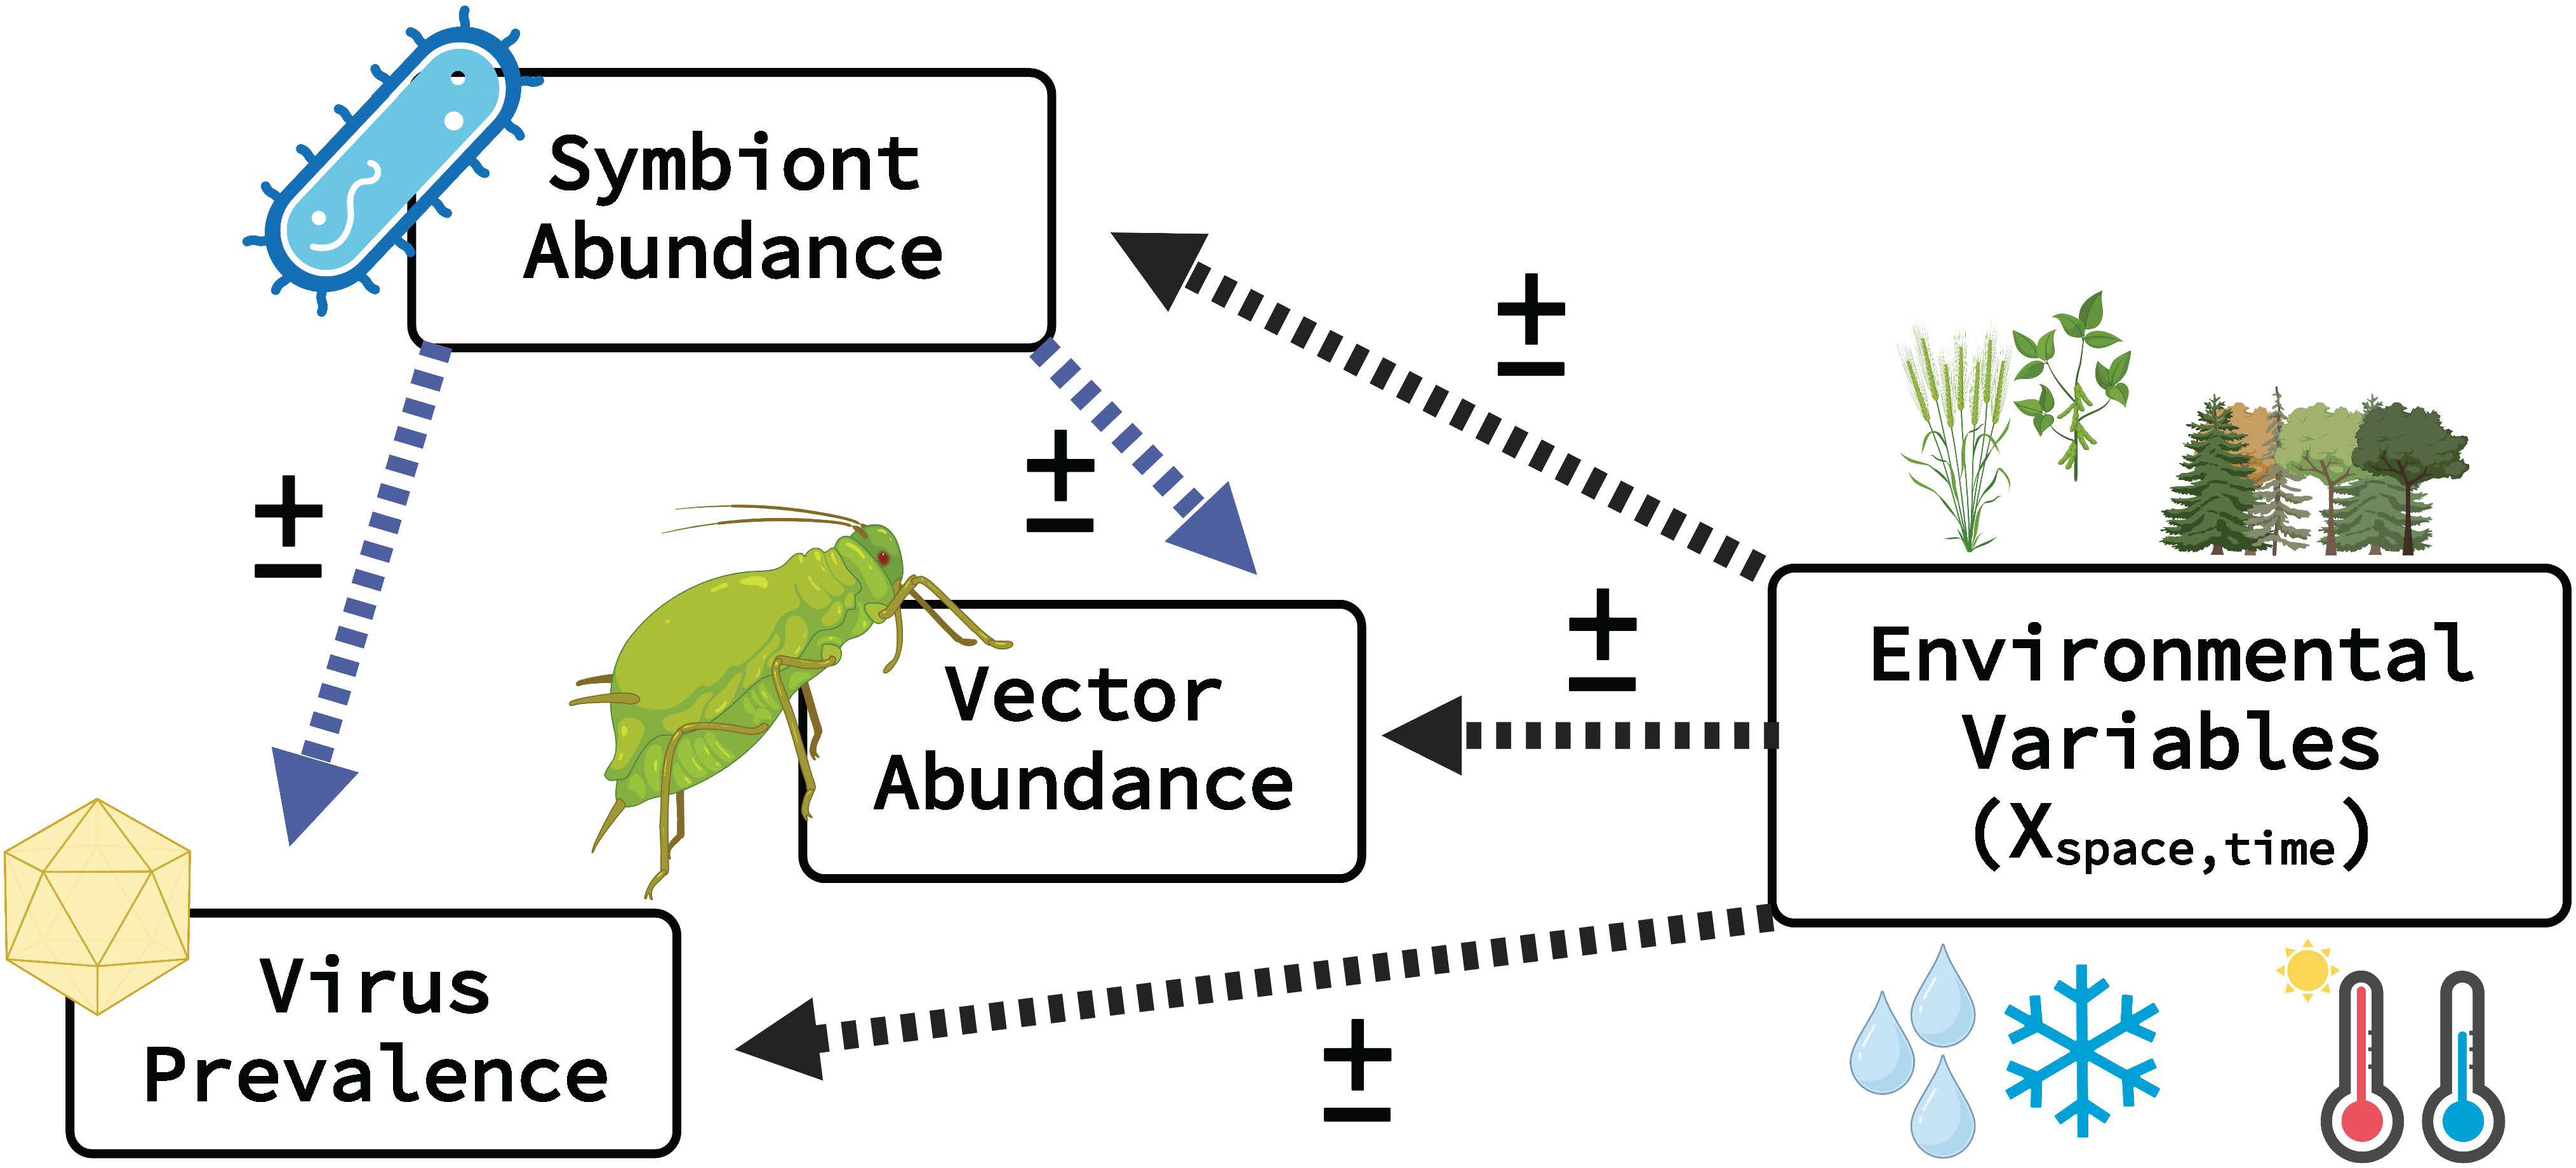
Figure 1 Overview of ecological modeling framework linking vector, microbiome (virus & symbiont), and environmental predictor variables. Dashed arrows represent predicted relationships between environmental factors (e.g., landcover, temperature, precipitation), vector abundance, symbiont abundance and virus acquisition (i.e., prevalence in vector population). Highlighted with blue arrows are relationships with vector symbionts, a novel component of this modeling approach. The symbol represents estimated model parameters (i.e., intercept and slopes), where magnitude and direction can vary. This modeling framework is highly flexible (i.e., modular) and enables disentangling of major and minor environmental drivers of response variables. Several data types can be used for both vector and virus (e.g., presence–absence, relative abundance, gene copy numbers). Created with BioRender.com.
More specifically our model is specified using:
where is a scalar (single number) that is the recorded abundance of the vector species (Figure 1). The subscript i indicates the observation number and j indicates the data set (i.e., j enables the use of multiple data sets). In Equation 1, the wij is a vector of the symbiont relative abundances, which may be recorded, missing (latent), or partially recorded (i.e., some missing and some recorded). The parameter is the dispersion parameter (similar to the variance). Finally, in Equation 1, the is a vector that contains parameters (e.g., intercept and slopes) specific to the model for recorded abundance. The estimated parameters can be visualized in Figure 1 as the “” symbol that connects the environmental variables and symbiont abundance to the relative abundance of the vector.
Next, we add a probability distribution to model virus data:
where is the presence or absence of the virus and is a vector that contains parameters (e.g., intercept and slopes) specific to the model for virus presence–absence. Similar to , the estimated parameters can be visualized in Figure 1 as the that connects the environmental variables and symbiont abundance to virus prevalence.
The third component is
where, as in Equation 1 and Equation 2, is the vector that contains elements which correspond to symbiont relative abundance (e.g., where the additional subscript 1, 2…,k indicate the symbiont type). The is the dispersion parameter (similar to the variance), and is a vector that contains parameters (e.g., intercept and slopes). The estimated parameters can be visualized in Figure 1 as the that connects the environmental variables to symbiont relative abundance.
Each model component in Equations 1–3 requires the specification of a probability density or mass function. For Equation 1 we assume a negative-binomial distribution because our abundance data are counts (e.g., see Enders et al., 2018). For Equation 2 we assume a Bernoulli distribution because the presence–absence virus data results in a binary outcome. Finally, for Equation 3 we assume a gamma distribution because the symbiont relative abundance data is continuous real numbers that are always positive (although sometimes contain zero as described below).
In addition to the assumed probability distributions, each model component in Equations 1–3 requires a regression-style linear model for the expected value (mean) of each distribution. This enables the inclusion of predictor variables that vary over space and time such as temperature and landcover and to link the symbiont relative abundance to the other sources of data (e.g., presence–absence of virus; see Figure 1 for visual representation). More specifically, for Equation 1 we specify the expected value as
where is the expected value, is the intercept parameter, is the slope parameter for the effect of temperature , and is the slope parameter for the effect of the natural log of symbiont relative abundance log. Note that is the natural log, however, any other reasonable transformation could be used. For all examples in Equations 4 and 5, we use only a single symbiont type, however, adding more symbiont types is straightforward by the inclusion of an additional and slope parameter. Similarly for Equation 2, we specify the expected value as
where is the inverse logit function commonly used in binary regression. The is the intercept parameter, is the slope parameter for the effect of temperature , and is the slope parameter for the effect of the natural log of symbiont relative abundance log. Lastly, for Equation 3, we specify the expected value as
where is the intercept parameter and is the slope parameter for the effect of temperature .
Similar to Equations 4–5, the modeling of addition symbiont types can be facilitated by modifying Equation 6. The regression-style model in Equations 4–6 are flexible in the sense that additional environmental variables could be added by simply including an additional slope and variable. Finally, all Bayesian models required the specification of models for the parameters known as priors. We address the priors in the section specific to each data example.
We fit our Bayesian hierarchical model using a standard Bayesian model fitting algorithm known Markov chain Monte Carlo (Hooten and Hefley, 2019) with a user-friendly software JAGS which can be accessed and implemented from the statistical programing language R (Plummer, 2003). This model fitting algorithm requires some user input and supervision. All statistical analyses related to the Bayesian model were preformed using the statistical programing language R (R Core Team, 2023). In Supplemental Files 1–4 we provide the R code and data needed to reproduce our analyses including reproduction of results in Figures 2, 3.
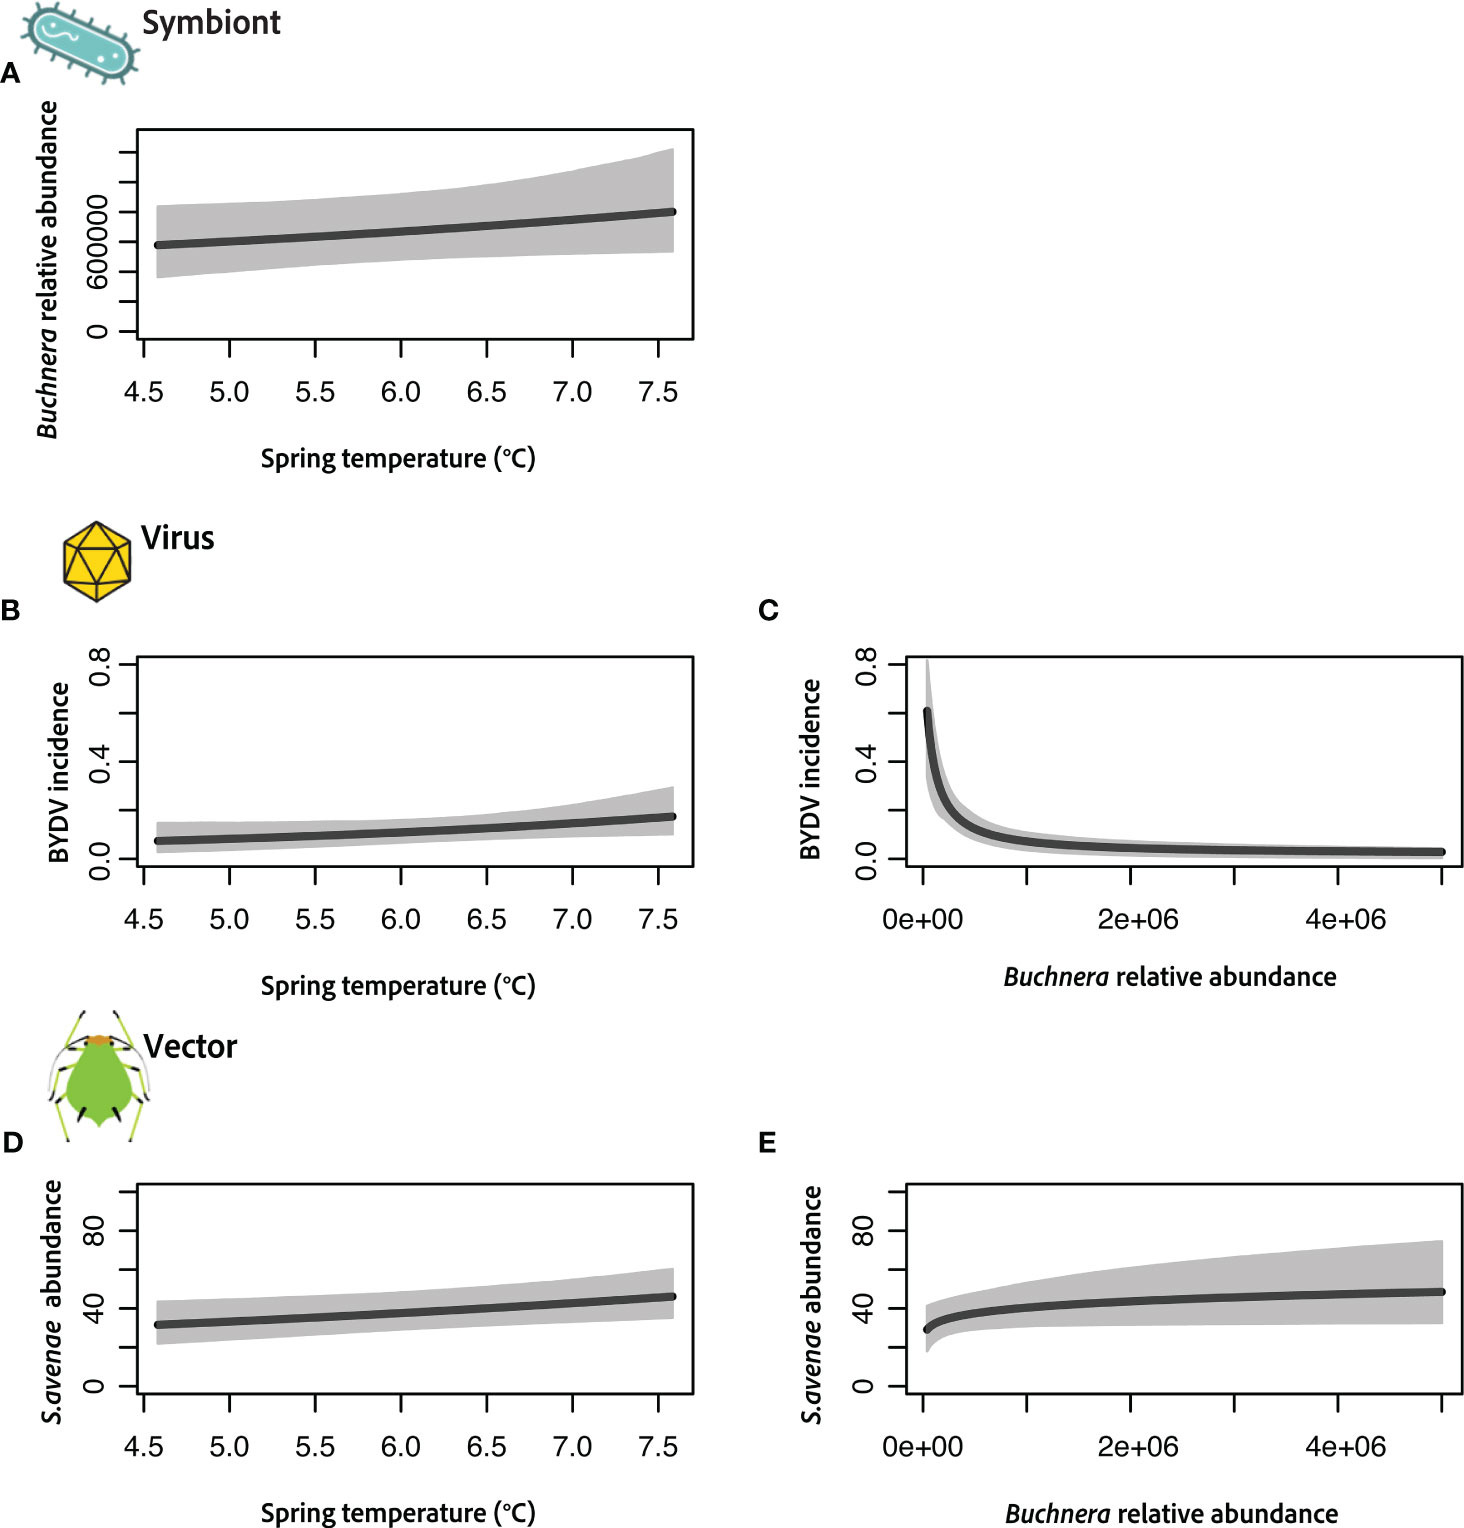
Figure 2 Results of joint vector–microbiome model integrating the obligate symbiont Buchnera (A), virus acquisition (B, C) and S. avenae vector (D, E) with a single environmental covariate (average spring temperature). Each panel shows the predicted relationship with credible intervals (CIs) indicated in grey. Buchnera relative abundance was measured using qPCR, virus incidence is measured as the probability an individual aphid is viruliferous (+BYDV) and vector abundance is measured as the expected number of individuals per 100 sweeps of a winter wheat field.
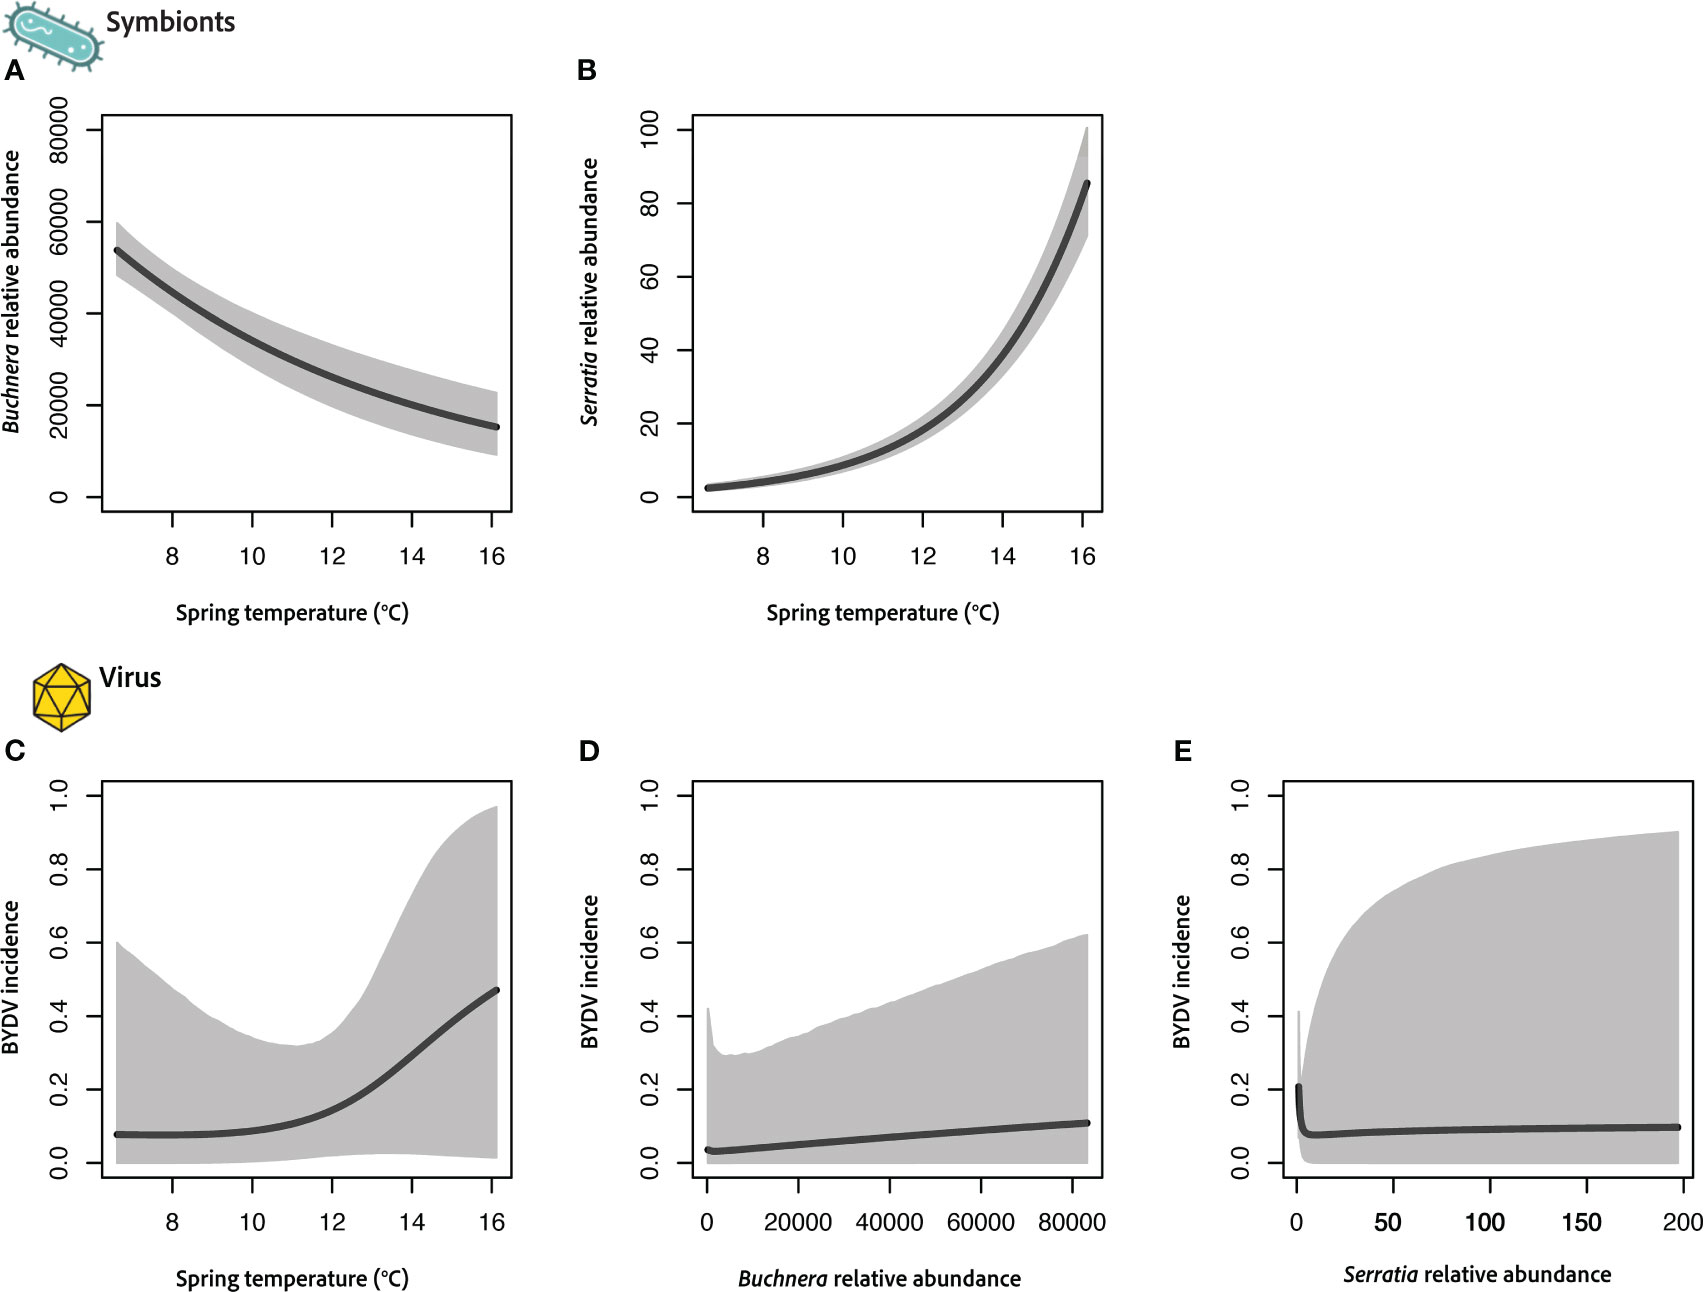
Figure 3 Results of joint vector–microbiome model integrating the obligate symbiont Buchnera (A), facultative symbiont Serratia (B), and virus acquisition (C–E) with a single environmental covariate (average spring temperature) for the vector R. padi. Each panel shows the predicted relationship with credible intervals (CIs) indicated in grey. Buchnera and Serratia relative abundance was measured as raw sequence counts and virus incidence is measured as the probability an individual aphid is viruliferous (+BYDV).
Our results will be presented by summarizing the posterior distribution obtained from our Bayesian models. To summarize the posterior, we will show expected values (e.g., represented by black lines in Figures 2, 3) and 95% credible intervals (represented by gray shading in Figures 2, 3). Our interpretation of results requires an understanding of Bayesian statistics, at the level introductory level of, for example, Hobbs and Hooten (2015). For readers unfamiliar with Bayesian statistics, heuristically, the black lines show the impact of the slope estimates whereas the gray areas show how certain we are of these effects.
2.4.2 Selection of environmental variables
One of the biggest challenges for developing ecological models is selection of predictor variables and establishing model assumptions. There are multiple approaches for identifying major and minor environmental drivers of response variables of interest (e.g., vector and symbiont abundances, virus incidence), which ultimately depends on existing biological knowledge of the system (i.e., informative priors). Environmental covariates (i.e., predictor variables) can be selected based on previous experimental or modeling work, or are those predicted to be biologically relevant (i.e., directly impact vector and/or symbiont). For modeling virus–microbe–vector interactions it is particularly important to consider key components of the pathosystem, such as mode of transmission and seasonal dynamics. In our case, two seasonal periods (fall and spring) are influential for BYD dynamics in cereal agroecosystems. Fall conditions are considered important drivers of BYD (Harrington et al., 1999; Fabre et al., 2003), particularly because the incidence of viruliferous vectors (+BYDV) is predictive of disease severity and yield loss (Kendall and Chinn, 1990; Quillec et al., 1995; Fabre et al., 2003). Spring conditions have received less attention, but are critical for determining vector populations sizes and influencing migration to alternative grass hosts that serve as virus reservoirs and maintain the disease cycle (Enders et al., 2018; Rashidi et al., 2021).
Here we focus on environmental conditions in spring when aphids were sampled from field populations on winter wheat. We selected a single environmental covariate as proof of concept that is predicted to directly affect aphid vectors and their associated symbiont communities – temperature. However, multiple additional predictor variables or covariates (e.g., precipitation, landcover, management approaches) can easily be incorporated within the Bayesian framework. Temperature is likely a dominant factor because it can directly influence insect vector biology, microbial symbiont populations and multi-trophic interactions. For aphid vectors, temperature is a well-established driver of population growth, migration, and virus transmission (Dixon, 1977; Lowles et al., 1996; Power et al., 2011; Crossley et al., 2022) and is widely recognized as influencing the colonization and overwintering success of populations in cultivated and uncultivated grasses (Fabre et al., 2006; Thackray et al., 2009). Recent work also shows enhanced heat tolerance of BYDV-infected aphids (Porras et al., 2020). For insect microbiomes, temperature has important impacts on symbionts and interactions with their host (e.g., thermal protection) (Corbin et al., 2017). For example, the prevalence of S. symbiotica in aphid populations has been shown to influenced by seasonal temperatures (Pons et al., 2022). However, temperature stress can also reduce the abundance of key aphid symbionts within the host (e.g., Buchnera, Wolbachia) (Enders and Miller, 2016).
2.4.3 Selection of microbial symbionts
Several approaches can be used to select focal symbionts that are predicted to influence vector competence. For example, previous studies can be used to identify vector symbionts predicted to be involved in transmission of plant pathogens (e.g., aphids – Buchnera, whiteflies – Hamiltonella). Additional obligate and facultative symbionts known to mediate vector biology and ecology (e.g., nutritional or defensive symbionts) are also potential candidates. However, careful consideration should be taken to select candidate microbial taxa with an established biological or hypothesized basis for involvement in pathogen transmission. Using additional statistical approaches to pre-select focal symbionts, like those for identifying differentially abundant taxa from metabarcoding data sets (e.g., ANCOM, DESeq), is not recommended because this inflates type I error.
Aphids have relatively well described microbial partners, most notably the obligate nutritional symbiont Buchnera, which has been implicated in BYDV transmission (Cilia et al., 2011). In addition, there are a range of facultative bacterial symbionts with well-established roles in aphid physiology and ecology (Hansen and Moran, 2014; Zytynska and Weisser, 2016). For example, Serratia symbiotica is one of the most common symbionts of aphids, exhibits a range of effects on aphid physiology, and can be transferred between aphids and their host plants (Pons et al., 2022). We therefore chose to focus our models on the obligate symbiont Buchnera and the facultative symbiont Serratia. Both symbionts are excellent candidates based on the wealth of research showing effects on aphid biology and potential to mediate vector competence.
2.4.4 Model 1: qPCR data set from Kansas
In Section 2.4.1, we described a Bayesian hierarchical model that may be broadly applicable, however, each collection of data sets will have unique quirks and features that require modification to the Bayesian hierarchical model in Equations 1–6. More specifically, for the Kansas data set, we have one data set on the vector abundance, two data sets for the virus presence–absence, and one data set for the symbiont relative abundance. It is one of the two data sets for virus presence–absence that requires modification of our Bayesian hierarchical model. As described in Enders et al. (2018), the virus presence–absence data was collected by pooling multiple aphids and obtaining a single test result. Following Vansteelandt et al. (2000) and as described in the supporting material of Enders et al. (2018; see Appendix S1), Equations 2 and 5 can be modified by assuming a Bernoulli distribution with
where is the number of individual aphids in each pool.
In addition, the data set for vector abundance and one data set for virus presence–absence is missing the collocated data set on relative symbiont abundance. The result is that (relative symbiont abundance) in Equations 4 and 5 is latent (missing) and as a result is imputed (predicted) using standard Bayesian techniques. This requires no modification to our model described in Section 2.4.1 but is a strength and perhaps unknown feature of Bayesian hierarchical models for some readers.
Finally, our Bayesian hierarchical model in Equations 1–6 requires the specification priors. We use , , , , , , , , , and . These priors, with the exception or the prior for , and are not particularly noteworthy in the sense that they should have minimal influence on the estimated parameters or, in the case of and they may result in a regularizing (shrinkage) effect. The prior for , and are informative in the sense that it requires the slope for the effect of spring temperature to be positive (but with an unknown magnitude). Within the field of Bayesian statistics, this type of prior is known as an informative prior (Hobbs and Hooten, 2015). In formative priors can be incredibly useful in situations that some expert information about the system is available.
2.4.5 Model 2: metabarcoding data set from Indiana
Similar to Section 2.4.4, we make modifications to the Bayesian hierarchical model to tailor it to the Indiana data set. In the Indiana data set we expand Equations 4–5 to include two symbiont types. This requires an additional slope parameter to be added to Equation 5. Similarly, Equation 6 is a regression-style model for a single symbiont. Effectively, adding another Equation 6 with a unique intercept and slope enables us to model the second symbiont. Our Indiana data set does not contain data on the vector abundance. As a result, we remove Equation 1 and Equation 4 from our mode. Lastly, we use the priors , , and , which are the same as the Kansas data example. For the model for symbiont relative abundance, we use the priors for each type of symbiont. These priors, unlike the priors used in the Kansas data example, do not pre-determine the slope of the relationship.
3 Results
3.1 Model 1 results: English grain aphid (S. avenae) qPCR data set
Using a hierarchical Bayesian framework we developed a model linking virus acquisition, aphid vector and microbial symbiont abundances, and average spring temperatures. Figure 2 shows results from each focal component of our model (i.e., symbiont, virus, vector), but also refer to Figure 1 for graphical overview of our approach. Specifically, our response variables include vector abundance, virus acquisition and Buchnera relative abundance and predictor variables include spring temperature and Buchnera relative abundance. A unique feature of our models is that each microbial symbiont can be either included as a response variable (Figure 2A) or predictor variable (Figures 2C, E). Each horizontal set of panels thus demonstrates the modularity of this approach and usefulness for teasing apart complex multi-tropic relationships and the role of environmental covariates. Main outputs from these models are the coefficient estimates (e.g., slopes), which provide information on magnitude and direction of effect sizes for relationships between response and predictor variables, and 95% credible intervals (CIs) that indicate level of certainty of these effects. For relationships depicted in Figures 2A, D, E we used informative priors (i.e., assumed a positive slope) based on well established relationships between temperature, Buchnera abundance and insect development.
First, Buchnera relative abundance, measured using qPCR, shows a positive association with increased average spring temperatures (Figure 2A) across our Kansas field locations. There is an overall medium positive effect size, but the large credible intervals (CIs) suggest a moderate level of uncertainty. This positive relationship is not unexpected given the assumptions of the model and small range of average temperatures during the sampling period. Next, we evaluated relationships between virus acquisition (i.e., probability of a vector being viruliferous, tested positive for BYDV), spring temperatures (Figure 2B) and Buchnera relative abundances (Figure 2C). Here we find large effects of both predictor variables with high levels of certainty based on CIs. Interestingly, mean spring temperature had a positive coefficient estimate, while Buchnera relative abundance had a coefficient estimate that was negative. These results predict that increases in temperature during the sampling period increase the likelihood S. avenae is viruliferous, while vectors with higher Buchnera titers may be less likely to have acquired the virus. Finally, results indicate that vector abundance during the sampling spring period increases with temperature (Figure 2D) and Buchnera relative abundance (Figure 2E). Coefficient estimates are both positive, but in the case of Buchnera relative abundance there is less certainty given the large CIs. However, there was a medium to large effect of temperature, which suggests that even slight increases in early spring temperatures may increase the number of S.avenae (i.e., ~40–50% higher vector abundance with 3°C increase).
3.2 Model 2 results: bird-cherry oat aphid (R. padi) metabarcoding data set
We adapted our Bayesian modeling framework (see Sections 2.4.1 and 2.4.5) for a second data set where symbiont relative abundances were estimated using standard community-level metabarcoding techniques (i.e., raw sequence counts per ASV). We expanded our approach to include two bacterial symbionts (Buchnera and Serratia) using a second aphid vector species (R. padi). Relative abundances of these symbionts varied considerably, with Buchnera being ~1000-fold higher than Serratia based on read counts. This data set differs from the one collected in KS in that there is no misalignment of data (i.e., measures of symbiont abundance and virus incidence are collocated), thus we did not utilize data fusion techniques. However, in this case we do not have information on vector abundances. Figure 3 shows results from each focal component of our model (i.e., symbiont, virus), which links virus acquisition, microbial symbiont abundances, and average spring temperatures.
Interestingly, the two vector-associated symbionts show opposite relationships with temperature during the sampling period (Figures 3A, B). Buchnera relative abundance shows a strong negative association with increased average spring temperatures (Figure 3A) across our IN field locations. In contrast, Serratia abundances are strongly positively associated with increasing temperature (Figure 3B). In both cases these are large effects sizes with moderate to high levels of certainty based on CIs. However, neither symbiont (Figures 3C, D) nor temperature (Figure 3E) was found to drive differences in the probability that R. padi was viruliferous.
4 Discussion
Increased accessibility of techniques for studying microbes associated with plants and insects has generated need for community-level approaches that can uncover the underlying processes shaping microbiome structure and holobiont properties. As a result, interest in microbiome modeling approaches is steadily on the rise, particularly with regard to functional predictions and understanding microbe–microbe and host–microbe interactions (Gibson and Gerber, 2018; Lugo-Martinez et al., 2019; Coyte et al., 2021). However, current modeling approaches are heavily focused on omics data sets and community assembly dynamics, particularly in humans (Baldini et al., 2019; Kumar et al., 2019; Coyte et al., 2021), while broader ecological approaches that disentangle complex relationships between diverse hosts, microbes and key environmental factors are lacking.
We utilized established Bayesian hierarchical modeling techniques to develop an approach that can be widely applied to understanding environmental drivers of plant–insect–microbe interactions. Specifically, we created a customized modeling framework that teases apart the role of temperature in relationships between aphid symbionts, virus acquisition and vector abundance within the BYD pathosystem. We demonstrate the strengths of our modeling approach, including applicability to a range of microbiome data types and microbial taxa (e.g., virus, fungi, bacteria), levels of disease prevalence and symbiotic relationships. A further advantage of our modeling framework is application of underutilized data integration techniques, which enables researchers to overcome information deficient data sets by combining data streams to address broader ecological questions (Schaub and Kéry, 2021; Frost et al., 2023). Overall, our results using two example data sets establish the foundation for building custom ecological models for a range of pathosystems that will reveal linkages between vector symbionts, environmental variables and disease dynamics.
4.1 Guidelines for using microbiome modeling to improve mechanistic understanding of insect vectored plant pathogens
How can researchers apply our modeling approach to understand microbiome mediated spread of insect-borne plant pathogens? One strength of our approach is the ability to use existing data sets that may be spatially and/or temporally disconnected. Specifically, data integration or fusion techniques allow data sets collected at different times, locations and sources (i.e., plant, insect and microbe metrics) to be combined into a single model and thus avoids the need for additional, potentially cost-prohibitive, data collection (Schaub and Kéry, 2021; Cook et al., 2023; Frost et al., 2023). Researchers can therefore take advantage of previously collected data sets that are not spatially or temporally aligned, or may be partially incomplete, to generate a system-level understanding by sharing information across data sets. In addition to using existing data, our modeling approach is informative for experimental design and directing additional data collection. This opens exiting new avenues for incorporating multiple types of microbiome data, such as gene copy numbers or absolute abundances, rapid sensor based identification (i.e., presence/absence) and even microbial metabolite or other omics data sources. The modeling tools we develop here also easily facilitate interdisciplinary research approaches by melding organisms across kingdoms with a wealth of environmental variables of interest within agroecosystems. For example, models could also begin to tease apart interactions between different insects (e.g., presence of natural enemies or competitor species) associated with the same host plant, which could in turn influence vector–microbe–plant interactions and disease dynamics.
We created a broadly applicable framework for modeling the distribution of individual microbes to identify environmental covariates (e.g., weather, landcover) that predict differences in abundance within vector microbiomes, that are then linked back to aspects of vector competence (e.g., acquisition, transmission). There are several key considerations we suggest are important for researchers when building joint vector–microbiome models using the Bayesian techniques and data integration illustrated in this study. First, identifying relevant components of vector competence specific to the focal pathosystem is necessary, particularly where there is potential for involvement of microbial symbionts (e.g., host plant preference, vector fitness). Importantly, model assumptions or inclusion of informative priors and selection of environmental covariates will depend on existing biological knowledge within each system. Bayesian modeling approaches are also able to include multiple environmental predictor variables (i.e., major and minor drivers), but researchers should be aware of potential issues with collinearity of covariates. Second, researchers should consider the level of detail or type of information provided by available data sets and when designing experiments. Our modeling approach can accommodate a range of data types that provide varying levels of detail or information about the system. For example, finer scale measurement of viral titer levels or amplicon sequencing can provide additional information beyond what is possible with dichotomous (i.e., presence/absence) viral data, such as patterns in abundances of specific viral sequence variants and titer levels within vectors. However, when addressing data deficient scenarios there are several options available, including model based solutions such as data fusion and use of informative priors based on expert knowledge or the potential need for additional data collection. For example, variation in disease incidence across growing regions and abundance of symbionts are important factors to consider for model building. In this study we demonstrate the usefulness of Bayesian techniques for modeling data sets that are relatively information rich (high disease – Great Plains region) or information deficient (low disease – Midwest region; some very low abundance symbionts, no vector data).
Here we use the aphid-BYD system as an example for developing joint vector–microbiome modeling approaches that can be customized to different pathosystems of interest. For example, a wealth of information exists on the microbial symbionts and plant pathogens vectored by whiteflies that could be used for developing Bayesian hierarchical models to investigate linkages between symbionts, environmental variables and disease dynamics (Andreason et al., 2020; Wu et al., 2022). Researchers could develop ecological models that incorporate candidate symbionts (i.e., response variable = symbiont abundance) predicted to be involved in pathogen transmission (e.g., Hamiltonella, Rickettsia) or that influence vector biology more generally (e.g., obligate symbiont Portiera). Models could be developed to compare virus and symbiont abundances across whitefly biotypes or populations with varying vector competence and could include environmental predictor variables (e.g., temperature, host plant species) that may impact virus transmission and/or acquisition. Interestingly, Rickettsia has been shown to influence whitefly thermal tolerance via increased expression of stress responsive genes (Brumin et al., 2011), making this facultative symbiont an interesting target for modeling interactions with begomoviruses. Documented variation in location of facultative symbionts within whiteflies also offers opportunities to model microbe–microbe interactions, as some symbionts are co-localized with the obligate symbiont inside bacteriocytes whiles others infect multiple organs (e.g., gut, salivary glands) and can circulate in the hemolymph (Andreason et al., 2020).
4.2 Implications for disentangling BYDV–symbiont–vector interactions
Despite extensive research on Luteovirus–aphid interactions, it remains unknown to what extent symbiotic microbes impact BYDV transmission. Early work in R. padi and S. avenae found a molecular chaperone (GroEL) produced by the primary symbiont Buchnera with high binding affinity for BYDV particles in vitro (Filichkin et al., 1997). Thus, it was proposed GroEL protects BYDV from aphid immune defenses during circulative transport through the hemolymph. However, the role of GroEL in BYDV transmission has been questioned. Bouvaine et al. (2011) demonstrated GroEL protein is restricted to specialized cells called bacteriocytes and not present in aphid hemolymph, suggesting GroEL–BYDV interactions are unlikely. More recently, studies have found Buchnera titers are lower in viruliferous aphids involved in transmission of Potato leafroll virus (Patton et al., 2021) and in aphids feeding on virus-infected soybean tissues (Cassone et al., 2015). General disruption of aphid symbiont communities using antibiotics is also linked to reduced transmission efficiency of BYDV (Yu et al., 2022). However, the role of symbionts in transmission of aphid-borne pathogens has primarily focused on Buchnera, while additional facultative symbionts have largely been ignored (Angelella et al., 2018).
Our modeling framework adds layers of mechanistic understanding to BYDV pathosystem dynamics, specifically by investigating environmental mediators of vector symbiont abundances and links to virus acquisition (Figures 2, 3). Results from our previous spatio-temporal modeling work indicated the probability an S. avenae was viruliferous (+BYDV) was unaffected by precipitation but was positively correlated with fall temperatures and distance to forest or shrubland (Enders et al., 2018). Here we further add a layer of mechanistic understanding by showing that titer levels of the obligate symbiont Buchnera are strongly negatively associated with virus acquisition (Figure 2C), and that spring temperatures may also affect Buchnera within the S. avenae aphid vector (Figure 2A) as well as probability of virus acquisition (Figure 2B). Taken together these results suggest that temperature could influence S. avenae vector competence via effects on the obligate symbiont. In contrast, R. padi virus acquisition was not linked to temperature or symbiont abundances (Figures 3C–E), suggesting the role of microbes and environmental factors are likely vector species specific. However, further in-depth laboratory studies are needed to identify exact molecular or physiological mechanisms underlying potential virus–symbiont interactions or that could explain observed reductions in Buchnera titer with S. avenae virus acquisition. Finer scale measurement of viral and symbiont titers using qPCR and investigation of variation across viral strains using amplicon sequencing could also generate additional insights from ecological models.
Our results also highlight the complexity of interactions between temperature and insect symbionts. Associations between relative abundance and temperature varied across Buchnera and Serratia (Figures 2A, 3A, B), suggesting increasing temperature may be stressful for some symbionts but not for others. Alternatively, in the case of free-living symbionts like Serratia, warmer temperatures may increase overall abundances in the environment, which could lead to higher exposure and acquisition by aphid hosts. In line with our results, a recent survey across aphid species found Serratia symbiotica prevalence was significantly greater when temperatures were higher at time of sampling (Pons et al., 2022).
Natural next steps towards a systems-level approach are to incorporate measures of plant health (e.g., disease severity, yield) and management practices (e.g., insecticides, resistant crop cultivars) into our models that are relevant for cereal agroecosystems. To develop a more complete understanding of microbial-mediated vector competence, models will also need to include BYDV transmission to new host plants in addition to vector acquisition. Fine tuning model assumptions and environmental variable selection will continue to advance our understanding of vector–BYDV–symbiont interactions. The Bayesian modeling framework applied here is flexible and can easily accommodate additional environmental covariates. For example, precipitation levels and landcover estimates (e.g., proximity to natural vs. cultivated landcover) can be easily added to existing single covariate models. Precipitation is associated with increased early season activities of some aphid vectors (Crossley et al., 2022) and is predicted to indirectly benefit vector populations by generally supporting host plant health, including growth of both cereal crops and additional grass hosts that provide a “green bridge” for vector survival between growing seasons (Thackray et al., 2009; Rashidi et al., 2021). Relatedly, exposure to a greater diversity of host plants in a given landscape could in turn contribute to increases in symbiont diversity within vectors populations (Hansen and Moran, 2014; Blankenchip et al., 2018; Enders et al., 2022). Presence of additional grass hosts are also problematic because they can contribute to viral reservoirs in the landscape that then facilitate transfer to cereal crops (Rashidi et al., 2021). Landcover (e.g., % cropland vs. non-cropland) is therefore another important candidate environmental covariate linked to the potential for aphids to acquire symbionts from alternative grass hosts that could influence vector competency and the spread of BYDV.
5 Conclusion
Joint vector–microbiome modeling is an underutilized tool researchers can leverage to uncover multi-trophic relationships and environmental drivers of agroecosystem disease dynamics. Bayesian approaches are powerful for informing in-depth mechanistic laboratory experiments and overall study design, as we all as predicting and mediating future disease outbreaks. The ecological modeling framework we present here includes several key aspects: (i) data fusion – multiple data sets can be combined, including those with spatio-temporal misalignment and (ii) customizability – Bayesian hierarchical models are modular and thus widely applicable across systems by layering specific components of interest (e.g., environmental variables, microbes, vector and plant measures) (Hooten and Hefley, 2019; Schaub and Kéry, 2021; Cook et al., 2023). A final strength is the flexibility of our modeling approach to accommodate a diversity of data sets, including a range of high to low disease incidence and microbial symbionts with different functional roles or abundances within the vector microbiome. This work therefore lays the foundation for uncovering microbial targets for improved pest control and algins with long-term development of precision microbiome management approaches (French et al., 2021). Ultimately we envision the modeling tools developed here to spur further interdisciplinary and systems-level approaches for predicting and controlling insect-borne plant pathogens.
Data availability statement
The original contributions presented in the study are included in the article/Supplementary Files. Further inquiries can be directed to the corresponding author.
Ethics statement
The manuscript presents research on animals that do not require ethical approval for their study.
Author contributions
LE and TH designed the study, co-wrote all drafts of the manuscript and approved the final submitted draft. LE conducted aphid molecular work for virus screen and oversaw data collection for measuring symbiont abundance levels. TH performed all modeling and statistical analyses. Both authors contributed to the article and approved the submitted version.
Funding
This research was funded by a Purdue University AgSeed grant and Purdue Startup Funds awarded to LE.
Acknowledgments
The authors would like to thank C.M. Smith for providing Kansas aphid samples, Thorsten Hansen and Colleen Couch for assistance with Indiana aphid field collections, Drs. Elizabeth French and MacKenzie Kjeldgaard for assistance with processing the Indiana metabarcoding data set, and Dr. Subbu Sankaranarayanan for contributions to virus screening of Indiana aphid samples.
Conflict of interest
The authors declare that the research was conducted in the absence of any commercial or financial relationships that could be construed as a potential conflict of interest.
Publisher’s note
All claims expressed in this article are solely those of the authors and do not necessarily represent those of their affiliated organizations, or those of the publisher, the editors and the reviewers. Any product that may be evaluated in this article, or claim that may be made by its manufacturer, is not guaranteed or endorsed by the publisher.
Supplementary material
The Supplementary Material for this article can be found online at: https://www.frontiersin.org/articles/10.3389/fevo.2023.1251165/full#supplementary-material
References
Ali M., Hameed S., Tahir M. (2014). Luteovirus: insights into pathogenicity. Arch. Virol. 159, 2853–2860. doi: 10.1007/s00705-014-2172-6
Andreason S. A., Shelby E. A., Moss J. B., Moore P. J., Moore A. J., Simmons A. M. (2020). Whitefly endosymbionts: biology, evolution, and plant virus interactions. Insects 11, 775. doi: 10.3390/insects11110775
Angelella G., Nalam V., Nachappa P., White J., Kaplan I. (2018). Endosymbionts differentially alter exploratory probing behavior of a nonpersistent plant virus vector. Microb. Ecol. 76, 453–458. doi: 10.1007/s00248-017-1133-5
Baldini F., Heinken A., Heirendt L., Magnusdottir S., Fleming R. M. T., Thiele I. (2019). The Microbiome Modeling Toolbox: from microbial interactions to personalized microbial communities. Bioinformatics 35, 2332–2334. doi: 10.1093/bioinformatics/bty941
Bansal R., Mian M. A. R., Michel A. P. (2014). Microbiome diversity of Aphis glycines with extensive superinfection in native and invasive populations. Environ. Microbiol. Rep. 6, 57–69. doi: 10.1111/1758-2229.12108
Bello V. H., Watanabe L. F. M., Santos B. R., MArubayashi J. M., Yuki V. A., De Marchi B. R., et al. (2019). Evidence for increased efficiency of virus transmission by populations of Mediterranean species of Bemisia tabaci with high Hamiltonella prevalence. Phytoparasitica 47, 293–300. doi: 10.1007/s12600-019-00729-y
Blankenchip C. L., Michels D. E., Braker H. E., Goffredi S. K. (2018). Diet breadth and exploitation of exotic plants shift the core microbiome of tropical herbivorous beetles. PeerJ Preprints 6, e26692v1. doi: 10.7717/peerj.4793
Bouvaine S., Boonham N., Douglas A. E. (2011). Interactions between a luteovirus and the GroEL chaperonin protein of the symbiotic bacterium Buchnera aphidicola of aphids. J. Gen. Virol. 92 (6), 1467-1474.
Brown J. K. (1984). Irrigated corn as a source of barley yellow dwarf virus and vector in eastern washington. Phytopathology 74, 46. doi: 10.1094/Phyto-74-46
Brumin M., Kontsedalov S., Ghanim M. (2011). Rickettsia influences thermotolerance in the whitefly Bemisia tabaci B biotype. Insect Sci. 18, 57–66. doi: 10.1111/j.1744-7917.2010.01396.x
Caporaso J. G., Lauber C. L., Walters W. A., Berg-Lyons D., Lozupone C. A., Turnbaugh P. J., et al. (2011). Global patterns of 16S rRNA diversity at a depth of millions of sequences per sample. Proc. Natl. Acad. Sci. U.S.A. 108, 4516–4522. doi: 10.1073/pnas.1000080107
Cassone B. J., Redinbaugh M. G., Dorrance A. E., Michel A. P. (2015). Shifts in Buchnera aphidicola density in soybean aphids (Aphis glycines) feeding on virus-infected soybean. Insect Mol. Biol. 24, 422–431. doi: 10.1111/imb.12170
Casteel C. L., Hansen A. K. (2014). Evaluating insect-microbiomes at the plant-insect interface. J. Chem. Ecol. 40, 836–847. doi: 10.1007/s10886-014-0475-4
Chuche J., Auricau-Bouvery N., Danet J.-L., Thiéry D. (2017). Use the insiders: could insect facultative symbionts control vector-borne plant diseases? J. Pest Sci. 90, 51–68. doi: 10.1007/s10340-016-0782-3
Cilia M., Tamborindeguy C., Fish T., Howe K., Thannhauser T. W., Gray S. (2011). Genetics coupled to quantitative intact proteomics links heritable aphid and endosymbiont protein expression to circulative polerovirus transmission. J. Virol. 85, 2148–2166. doi: 10.1128/jvi.01504-10
Clement D. L., Lister R. M., Foster J. E. (1986). ELISA-based studies on the ecology and epidemiology of barley yellow dwarf virus in Indiana. Phytopathology. 76, 86–92. doi: 10.1094/Phyto-76-86
Cook J. D., Williams D. M., Walsh D. P., Hefley T. J. (2023). Bayesian forecasting of disease spread with little or no local data. Sci. Rep. 13, 8137. doi: 10.1038/s41598-023-35177-6
Coolen S., Rogowska-van der Molen M., Welte C. U. (2022). The secret life of insect-associated microbes and how they shape insect–plant interactions. FEMS Microbiol. Ecol. 98, fiac083. doi: 10.1093/femsec/fiac083
Corbin C., Heyworth E. R., Ferrari J., Hurst G. D. D. (2017). Heritable symbionts in a world of varying temperature. Heredity 118, 10–20. doi: 10.1038/hdy.2016.71
Cordovez V., Dini-Andreote F., Carrión V. J., Raaijmakers J. M. (2019). Ecology and evolution of plant microbiomes. Annu. Rev. Microbiol. 73, 69–88. doi: 10.1146/annurev-micro-090817-062524
Coyte K. Z., Rao C., Rakoff-Nahoum S., Foster K. R. (2021). Ecological rules for the assembly of microbiome communities. PloS Biol. 19, e3001116. doi: 10.1371/journal.pbio.3001116
Crossley M. S., Lagos-Kutz D., Davis T. S., Eigenbrode S. D., Hartman G. L., Voegtlin D. J., et al. (2022). Precipitation change accentuates or reverses temperature effects on aphid dispersal. Ecol. Appl. 32, e2593. doi: 10.1002/eap.2593
Crotti E., Balloi A., Hamdi C., Sansonno L., Marzorati M., Gonella E., et al. (2012). Microbial symbionts: a resource for the management of insect-related problems. Microbial Biotechnol. 5, 307–317. doi: 10.1111/j.1751-7915.2011.00312.x
Dixon A. F. (1977). Aphid ecology: life cycles, polymorphism, and population regulation. Annu. Rev. Ecol. Syst. 8, 329–353. doi: 10.1146/annurev.es.08.110177.001553
Eigenbrode S. D., Bosque-Pérez N. A., Davis T. S. (2018). Insect-borne plant pathogens and their vectors: ecology, evolution, and complex interactions. Annu. Rev. Entomol. 63, 169–191. doi: 10.1146/annurev-ento-020117-043119
Enders L., Hansen T., Brichler K., Couture J., French E. (2022). Aphid species specializing on milkweed harbor taxonomically similar bacterial communities that differ in richness and relative abundance of core symbionts. Sci. Rep. 12, 21127. doi: 10.1038/s41598-022-25554-y
Enders L. S., Hefley T. J., Girvin J. J., Whitworth R. J., Smith C. M. (2018). Spatiotemporal Distribution and Environmental Drivers of Barley yellow dwarf virus and Vector Abundance in Kansas. Phytopathology® 108, 1196–1205. doi: 10.1094/PHYTO-10-17-0340-R
Enders L. S., Miller N. J. (2016). Stress-induced changes in abundance differ among obligate and facultative endosymbionts of the soybean aphid. Ecol. Evol. 6, 818–829. doi: 10.1002/ece3.1908
Fabre F., Dedryver C.-A., Leterrier J. L., Plantegenest M. (2003). Aphid abundance on cereals in autumn predicts yield losses caused by Barley yellow dwarf virus. Phytopathology 93, 1217–1222. doi: 10.1094/PHYTO.2003.93.10.1217
Fabre F., Pierre J. S., Dedryver C.-A., Plantegenest M. (2006). Barley yellow dwarf disease risk assessment based on Bayesian modelling of aphid population dynamics. Ecol. Model. 193, 457–466. doi: 10.1016/j.ecolmodel.2005.08.021
Filichkin S. A., Brumfield S., Filichkin T. P., Young M. J. (1997). In vitro interactions of the aphid endosymbiotic SymL chaperonin with barley yellow dwarf virus. J. Virol. 71 (1), 569-577.
French E., Kaplan I., Iyer-Pascuzzi A., Nakatsu C. H., Enders L. (2021). Emerging strategies for precision microbiome management in diverse agroecosystems. Nat. Plants 7, 256–267. doi: 10.1038/s41477-020-00830-9
Frost F., McCrea R., King R., Gimenez O., Zipkin E. (2023). Integrated population models: Achieving their potential. J. Stat. Theory Pract. 17, 6. doi: 10.1007/s42519-022-00302-7
Gibson T., Gerber G. (2018). Robust and scalable models of microbiome dynamics. Proc. 35th Int. Conf. Mach. Learn. (PMLR), 1763–1772.
Gottlieb Y., Zchori-Fein E., Mozes-Daube N., Kontsedalov S., Skaljac M., Brumin M., et al. (2010). The transmission efficiency of tomato yellow leaf curl virus by the whitefly bemisia tabaci is correlated with the presence of a specific symbiotic bacterium species. J. Virol. 84, 9310–9317. doi: 10.1128/jvi.00423-10
Gray S. M., Chapin J. W., Smith D. M., Banerjee N., Thomas J. S. (1998). Barley yellow dwarf luteoviruses and their predominant aphid vectors in winter wheat grown in South Carolina. Plant Dis. 82, 1328–1333. doi: 10.1094/PDIS.1998.82.12.1328
Gray S., Gildow F. E. (2003). Luteovirus-aphid interactions. Annu. Rev. Phytopathol. 41, 539–566. doi: 10.1146/annurev.phyto.41.012203.105815
Hansen A. K., Moran N. A. (2014). The impact of microbial symbionts on host plant utilization by herbivorous insects. Mol. Ecol. 23, 1473–1496. doi: 10.1111/mec.12421
Harrington R., Mann J., Burgess A., Tones S., Rogers R., Blake S., et al. (1999). Development and Validation of Decision Support Methodology for Control of Barley Yellow Dwarf Virus. London, UK: Home Grown Cereals Authority. Project Report no. 205.
Hesler L. S., Riedell W. E., Langham M. A., Osborne S. L. (2005). Insect infestations, incidence of viral plant diseases, and yield of winter wheat in relation to planting date in the northern Great Plains. J. Econ. Entomol. 98, 2020–2027. doi: 10.1093/jee/98.6.2020
Hobbs N. T., Hooten M. B. (2015). Bayesian Models: A statistical Primer for Ecologists (Princeton: Princeton University Press). doi: 10.1515/9781400866557
Hooten M. B., Hefley T. J. (2019). Bringing Bayesian models to life. (Boca Raton, Florida, USA: CRC Press).
Ingwell L. L., Bosque-Pérez N. A. (2015). New experimental hosts of Barley yellow dwarf virus among wild grasses, with implications for grassland habitats. Plant Pathol. 64, 1300–1307. doi: 10.1111/ppa.12387
Ingwell L. L., Lacroix C., Rhoades P. R., Karasev A. V., Bosque-Pérez N. A. (2017). Agroecological and environmental factors influence Barley yellow dwarf viruses in grasslands in the US Pacific Northwest. Virus Res. 241, 185–195. doi: 10.1016/j.virusres.2017.04.010
Jarošová J., Chrpová J., Šíp V., Kundu J. K. (2013). A comparative study of the Barley yellow dwarf virus species PAV and PAS: distribution, accumulation and host resistance. Plant Pathol. 62, 436–443. doi: 10.1111/j.1365-3059.2012.02644.x
Johnson D. S., Sinclair E. H. (2017). Modeling joint abundance of multiple species using Dirichlet process mixtures. Environmetrics 28, e2440. doi: 10.1002/env.2440
Jones R. A., Salam M. U., Maling T. J., Diggle A. J., Thackray D. J. (2010). Principles of predicting plant virus disease epidemics. Annu. Rev. Phytopathol. 48, 179–203. doi: 10.1146/annurev-phyto-073009-114444
Kendall D. A., Chinn N. E. (1990). A comparison of vector population indices for forecasting barley yellow dwarf virus in autumn sown cereal crops. Ann. Appl. Biol. 116, 87–102. doi: 10.1111/j.1744-7348.1990.tb06588.x
Kéry M., Royle J. A. (2015). Applied Hierarchical Modeling in Ecology: Analysis of Distribution, Abundance and Species Richness in R and BUGS. (Academic Press)
Kumar M., Ji B., Zengler K., Nielsen J. (2019). Modelling approaches for studying the microbiome. Nat. Microbiol. 4, 1253–1267. doi: 10.1038/s41564-019-0491-9
Lowles A. J., Tatchell G. M., Harrington R., Clark S. J. (1996). The effect of temperature and inoculation access period on the transmission of barley yellow dwarf virus byRhopalosiphum padi (L.) and Sitobion avenae (F.). Ann. Appl. Biol. 128, 45–53. doi: 10.1111/j.1744-7348.1996.tb07088.x
Lucio-Zavaleta E., Smith D. M., Gray S. M. (2001). Variation in transmission efficiency among Barley yellow dwarf virus-RMV isolates and clones of the normally inefficient aphid vector, Rhopalosiphum padi. Phytopathology 91, 792–796. doi: 10.1094/PHYTO.2001.91.8.792
Lugo-Martinez J., Ruiz-Perez D., Narasimhan G., Bar-Joseph Z. (2019). Dynamic interaction network inference from longitudinal microbiome data. Microbiome 7, 54. doi: 10.1186/s40168-019-0660-3
Mendiola S. Y., Civitello D. J., Gerardo N. M. (2020). An integrative approach to symbiont-mediated vector control for agricultural pathogens. Curr. Opin. Insect Sci. 39, 57–62. doi: 10.1016/j.cois.2020.02.007
Miller and W. A., Rasochová L. (1997). Barley yellow dwarf viruses. Annu. Rev. Phytopathol. 35, 167–190. doi: 10.1146/annurev.phyto.35.1.167
Papura D., Jacquot E., Dedryver C. A., Luche S., Riault G., Bossis M., et al. (2002). Two-dimensional electrophoresis of proteins discriminates aphid clones of Sitobion avenae differing in BYDV-PAV transmission. Arch. Virol. 147, 1881–1898. doi: 10.1007/s00705-002-0859-6
Parry H. R., Macfadyen S., Kriticos D. J. (2012). The geographical distribution of Yellow dwarf viruses and their aphid vectors in Australian grasslands and wheat. Australas. Plant Pathol. 41, 375–387. doi: 10.1007/s13313-012-0133-7
Patton M. F., Hansen A. K., Casteel C. L. (2021). Potato leafroll virus reduces Buchnera aphidocola titer and alters vector transcriptome responses. Sci. Rep. 11, 23931. doi: 10.1038/s41598-021-02673-6
Plummer M. (2003). JAGS: A Program for analysis of bayesian graphical models using gibbs sampling. 124, 1–10.
Pons I., Scieur N., Dhondt L., Renard M.-E., Renoz F., Hance T. (2022). Pervasiveness of the symbiont Serratia symbiotica in the aphid natural environment: distribution, diversity and evolution at a multitrophic level. FEMS Microbiol. Ecol. 98, fiac012. doi: 10.1093/femsec/fiac012
Porras M. F., Navas C. A., Marden J. H., Mescher M. C., De Moraes C. M., Pincebourde S., et al. (2020). Enhanced heat tolerance of viral-infected aphids leads to niche expansion and reduced interspecific competition. Nat. Commun. 11,1184. doi: 10.1038/s41467-020-14953-2
Power A. G., Borer E. T., Hosseini P., Mitchell C. E., Seabloom E. W. (2011). The community ecology of barley/cereal yellow dwarf viruses in Western US grasslands. Virus Res. 159, 95–100. doi: 10.1016/j.virusres.2011.05.016
Quillec F. L.-L., Tanguy S., Dedryver C. A. (1995). Aerial flow of barley yellow dwarf viruses and of their vectors in western France. Ann. Appl. Biol. 126, 75–90. doi: 10.1111/j.1744-7348.1995.tb05004.x
Rashidi M., Cruzado R. K., Hutchinson P. J. S., Bosque-Pérez N. A., Marshall J. M., Rashed A. (2021). Grassy Weeds and Corn as Potential Sources of Barley yellow dwarf virus Spread Into Winter Wheat. Plant Dis. 105, 444–449. doi: 10.1094/PDIS-05-20-1004-RE
R Core Team. (2023). R: A language and Environment for Statistical Computing (Vienna, Austria: R Foundation for Statistical Computing). Available at: https://www.R-project.org/.
Rotenberg D., Bockus W. W., Whitfield A. E., Hervey K., Baker K. D., Ou Z., et al. (2016). Occurrence of viruses and associated grain yields of paired symptomatic and nonsymptomatic tillers in kansas winter wheat fields. Phytopathology 106, 202–210. doi: 10.1094/PHYTO-04-15-0089-R
Royle J. A., Dorazio R. M. (2008). Hierarchical Modeling and Inference in Ecology: the Analysis of Data from Populations, Metapopulations and Communities (Academic Press).
Schaub M., Kéry M. (2021). Integrated Population Models: Theory and Ecological Applications with R and JAGS. (Academic Press).
Thackray D. J., Diggle A. J., Jones R. A. C. (2009). BYDV PREDICTOR: a simulation model to predict aphid arrival, epidemics of Barley yellow dwarf virus and yield losses in wheat crops in a Mediterranean-type environment. Plant Pathol. 58, 186–202. doi: 10.1111/j.1365-3059.2008.01950.x
Vansteelandt S., Goetghebeur E., Verstraeten T. (2000). Regression models for disease prevalence with diagnostic tests on pools of serum samples. Biometrics 56, 1126–1133. doi: 10.1111/j.0006-341X.2000.01126.x
Vayssier-Taussat M., Albina E., Citti C., Cosson J. F., Jacques M.-A., LEBRUN M.-H., et al. (2014). Shifting the paradigm from pathogens to pathobiome: new concepts in the light of meta-omics. Front. Cell. Infect. Microbiol. 4. doi: 10.3389/fcimb.2014.00029
Warton D. I., Blanchet F. G., O’Hara R. B., Ovaskainen O., Taskinen S., Walker S. C., et al. (2015). So many variables: joint modeling in community ecology. Trends Ecol. Evol. 30, 766–779. doi: 10.1016/j.tree.2015.09.007
Weiss B., Aksoy S. (2011). Microbiome influences on insect host vector competence. Trends Parasitol. 27, 514–522. doi: 10.1016/j.pt.2011.05.001
Wu W., Shan H.-W., Li J.-M., Zhang C.-X., Chen J.-P., Mao Q. (2022). Roles of bacterial symbionts in transmission of plant virus by hemipteran vectors. Front. Microbiol. 13. doi: 10.3389/fmicb.2022.805352
Yu W., Bosquée E., Fan J., Liu Y., Bragard C., Francis F., et al. (2022). Proteomic and transcriptomic analysis for identification of endosymbiotic bacteria associated with BYDV transmission efficiency by sitobion miscanthi. Plants 113352. doi: 10.3390/plants11233352
Keywords: vector, aphid, symbiont, ecological modeling, microbiome, pest management
Citation: Enders L and Hefley T (2023) Modeling host–microbiome interactions to improve mechanistic understanding of aphid vectored plant pathogens. Front. Ecol. Evol. 11:1251165. doi: 10.3389/fevo.2023.1251165
Received: 01 July 2023; Accepted: 06 September 2023;
Published: 27 September 2023.
Edited by:
Sayanta Bera, University of Maryland, United StatesReviewed by:
Shirin Parizad, Virginia Tech, United StatesSaptarshi Ghosh, University of Florida, United States
Copyright © 2023 Enders and Hefley. This is an open-access article distributed under the terms of the Creative Commons Attribution License (CC BY). The use, distribution or reproduction in other forums is permitted, provided the original author(s) and the copyright owner(s) are credited and that the original publication in this journal is cited, in accordance with accepted academic practice. No use, distribution or reproduction is permitted which does not comply with these terms.
*Correspondence: Laramy Enders, bGVuZGVyc0BwdXJkdWUuZWR1