 Yi Luo1,2†
 Tingfang Jia1,3*
 Anlin Li1†Kun Yang1,2*Xingfang Pei1Changqing Peng1Rixiang Chen1Dingpu Li1Qingqing Wang1
- 1Faculty of Geography, Yunnan Normal University, Kunming, China
- 2Geographic Information System (GIS) Technology Research Center of Resource and Environment in Western China, Ministry of Education, Yunnan Normal University, Kunming, China
- 3School of Information Science and Technology, Yunnan Normal University, Kunming, China
Introduction: Sustainable Development Goals (SDGs) is another binding target indicator system proposed by the United Nations after the Millennium Development Goals (MDGs). Scientific monitoring of the state of sustainable development of cities can provide a reference for the progress of the implementation of the SDGs, and also provide research support for the successful achievement of the sustainable development of cities around the world.
Methods: Although the indicator system proposed by the United Nations has drawn a vision of global sustainable development and given an evaluation framework and methodology, it fails to and is unlikely to encompass the rich connotations of China's new development philosophy. Therefore, this study takes the new development philosophy as the fundamental guideline, refers to the SDGs assessment system, and constructs a theoretical and methodological framework for assessing the sustainable development of plateau lakeside cities from the five dimensions of "innovation, coordination, greenness, openness, and sharing", and carries out empirical investigation in the research area of Kunming City, a typical plateau lakeside city.
Methods: It is found that the sustainable development level of Kunming is at a medium level, with a relatively fast development speed, but the growth momentum has slowed down; the development level of each dimension is relatively low, with a slow development speed, showing a fluctuating upward trend; the change in the level of coordinated development shows two states of low and medium coordination, showing a steady increase; the contribution of the five philosophies of relevance is sorted as: "Openness>Sharing>Green>Coordination>Innovation", and openness is the most important factor affecting the sustainable development level of plateau lakeside cities.
Discussion: This study demonstrates the need to enhance the level of sustainable development of cities by exploring their internal trade-offs and potential internal contributions.
1 Introduction
Cities are the symbol of human civilization, social progress and the spatial carrier of productivity, and the rapid development of their cities plays an important role in promoting the economic development of national regions (Estoque and Murayama, 2016; Zhou et al., 2018). In recent years, the level of global urbanization rate has shown a trend of rapid growth, and its growth rate has steadily increased (Gao and O’Neill, 2020). As the first country in the world in terms of urbanization scale, China’s urbanization rate has increased by 14.21% in the last decade, which is located in the middle to upper level of the world. The rapid level of urbanization plays an important role in promoting economic growth and accelerating the mobility of labor, capital and technology, thus increasing productivity (Bai et al., 2014; Hong et al., 2021). However, rapid development also brings a series of problems such as environmental pollution, heat island effect, greenhouse effect and so on (Jedwab and Vollratb, 2015; Chen et al., 2020). Therefore, how to promote the sustainable development of urban areas has become an urgent problem for the coordinated development of today’s society (McDonald et al., 2020).
Sustainable development has become an important topic in current research (Shaker and Sirodoev, 2016; Han et al., 2023; Kim, 2023). A variety of comprehensive urban sustainable development indicator systems have been proposed (Sun et al., 2022; Yin et al., 2023). These indicator systems are mostly based on the theory of sustainable urban development, using analytical hierarchy process to construct urban indicator systems from different dimensions, and have not formed a norm and a fixed framework. Although they can reflect the actual problems that cities are currently facing and are simple, easy to understand and operational, most of the indicators are fragmented, and it is not possible to identify their intrinsic linkages, logic, and achieve a dynamic assessment of urban development (Michael et al., 2014). In order to address the challenges of global sustainable development, the Sustainable Development Goals (SDGs) were unanimously adopted by the United Nations Member States in 2015. Its 17 world-changing goals as part of the 2030 Agenda for Sustainable Development (hereinafter referred to as the 2030 Agenda) call for global action to eradicate poverty, protect the planet, and improve lives and futures, providing direction for the world’s nations to achieve the goals within 15 years, and providing a more integrated and inclusive solution to sustainable development, a conceptual agenda to a measurable standards and actionable change in a paradigm shift (Sachs et al., 2019).However, the framework is proposed from a global scale, and the uneven development of different countries leads to differences in the problems and difficulties faced by each country or region in promoting and implementing the SDGs, which makes it difficult to apply directly to member countries at different stages of development, much less to a specific city, and therefore must be localized according to the specific study area (Meuleman and Niestroy, 2015; Horn and Grugel, 2017).
As the world’s largest developing country, China adheres to development as its first priority and has fully launched the implementation of the sustainable development agenda. At the Fifth Plenary Session of the 18th CPC(Communist Party of China) Central Committee, General Secretary Xi Jinping for the first time put forward the new development philosophies of innovation, coordination, greenness, openness and sharing, in which adherence to “innovative” development is the first impetus for leading development, “coordinated” development is the necessary guarantee of sustained and healthy development, “green” development is the sine qua non of sustainable development, “openness” development expands the space for win-win cooperation, and “sharing” development promotes social justice. This is compatible with the five philosophies of People, Planet, Prosperity, Peace and Partnership put forward in the 2030 Agenda, which are considered to be the key to promoting China’s high-quality economic development. This is because only on the basis of achieving sustainable development can cities realize high-quality development and the coordination and unity of the economy, society and the environment, and in turn high-quality development is the basis and guarantee of sustainable urban development, and only through improving the quality and level of urban development can the goal of sustainable development be better realized. On September 19, 2016, at the symposium on “Sustainable Development Goals: Working Together to Transform Our World - China’s Advocacy”, it was announced that China’s Country Program for the Implementation of the 2030 Agenda for Sustainable Development (hereinafter referred to as the Country Program) was released. It consists of five parts, including China’s development achievements and experience, opportunities and challenges for China to implement the 2030 Agenda for Sustainable Development, guiding ideology and general principles, general path of implementation, and implementation plan for the 17 sustainable development goals, which not only serves as a guide for China’s implementation, but also provides reference for other countries, especially developing countries, to promote the implementation of the goals.
As the capital of Yunnan Province, Kunming is the center of the city cluster in central Yunnan Province and one of the important central cities in western China as approved by the State Council. Surrounded by mountains on three sides and bordered by Dianchi Pond on the south, it belongs to the low-latitude plateau mountain monsoon climate and is a typical low-latitude plateau lakeside city. Lake water ecosystems in cities not only determine the environmental quality of lake watersheds, but also the sustainable development of the cities in which the watersheds are located (i.e., lakeside cities) (Dokulil, 2014; Huang et al., 2017), which is important for promoting coordinated sustainable development in the region (Reynaud and Lanzanova, 2017; Veldkamp et al., 2017; Chung et al., 2021). Due to the characteristics of lakeside cities, living around lakes for a long time, most of human production and life occurs within the lake watershed. While it promotes urban population agglomeration, urban expansion, and promotes economic development in the watershed, global lake problems such as depletion of lake water resources, water quality pollution, eutrophication, and changes in food web topology have been caused by the transitional development and use of lake water resources, such as rapid urbanization, industrial and agricultural water use and wastewater, aquaculture, land-use intensification, invasion of exotic species, and recreational activities (Arthington et al., 2016; Edeline et al., 2016; Yang et al., 2019; Yang et al., 2020). Especially in recent years, with the continuous threat of human activities, the number of emerging pollutants has been increasing, such as microplastics and antimicrobial resistance in lakes, which pose a serious threat to aquatic ecosystems and human health, and have become a global problem affecting the quality of lake ecosystems and sustainable development of lakeside cities (Xu et al., 2016; Mannina et al., 2017).
Scholars have mostly conducted research from the perspective of sustainable development of lakes or lake basins, mainly involving the sustainable development of water resources, the study of the interdependence of water-related SDGs indicators with other indicators, or the localization of SDGs from the perspective of conventional cities at the city level. Hu (2010) explored the evaluation model of sustainable development in highland lake basins from three aspects: coordinated development degree, equity degree, and sustainability degree. Wang (2015) constructed an ecological sensitivity evaluation system from five aspects of topography, natural conditions, ground cover conditions, human interference, policies and regulations to comprehensively evaluate the ecological sensitivity model of the habitat environment in the Yilong Lake Basin. Sun M. et al. (2022) constructed an index system from four aspects of ecological environment, economic development, social development and social security for the ecologically fragile Dongchuan District of Kunming City and used the entropy value method to evaluate the sustainable development of its rural tourism. UN Water (2016) describes the linkages and interdependencies between SDG6 (clean water and sanitation) and other targets; and Keesstra et al. (2018) point out that there may be increased pressure on freshwater resources due to the implementation of SDGs focusing on the economic and social dimensions, such as those related to food, health, land and climate; Ho and Goethals (2019) examined the interconnections and roles of sustainable development of lakes and reservoirs around the world with the 17 SDGs, noting that it has both mutually reinforcing and potentially conflicting relationships with nine SDGs. Liu et al. (2023) used open-source big data to assess the progress of the SDGs in 254 Chinese cities, distinguishing between size and region. Su et al. (2023) combined PBs with the SJOS framework to assess changes in environmental and socio-economic dimensions in the Chaohu Lake Basin in China, with recommendations for decision-making.
There are many lakeside cities in China, and 961 lakes larger than 10 km2 were analyzed, involving 188 lakeside cities with a total lake area of 74,000 km2, and 261 lakes larger than 50 km2, involving 67 lakeside cities with a total lake area of 58,000 km2. However, there is a lack of research on the localization of the UN SDGs on the sustainable development of lakeside cities, and the sustainable development of highland lakeside cities, in addition to the sustainable development of lake water resources, also needs to pay attention to the unique natural ecological environment protection and restoration, the rational development and utilization of rich natural resources, the protection of ethnic minority cultures, the education and development of inheritance, and the play of the advantages of the location towards South and Southeast Asia, as well as the development and management of the health tourism industry, and so on.
Based on the above discussion, scholars have made some achievements in the construction of urban sustainable development indicator system, but the research on the localization of the construction of sustainable development indicator system for highland lakeside cities has not been carried out systematically, and most of the existing indicator system research evaluates the sustainable development of the city in terms of social, economic and resource environment (Stauropoulou et al., 2023), and does not construct sustainable development indicator system from the perspective of the new development concept, thus failing to effectively evaluate and analyze the effect of the implementation of the new development concept on the region or city.; Huang, 2023), and have not constructed a sustainable development indicator system from the perspective of the new development philosophy, thus failing to effectively evaluate and analyze the effect of implementing the new development philosophy in the region or city. How to localize the SDGs according to the basic situation of the city is the main problem and challenge of sustainable development (Hu et al., 2023). For plateau lakeside cities, there are general laws and characteristics of general urban development, but also special laws and characteristics of plateau lakeside cities development, and in the context of the implementation of the “One Belt, One Road” initiative, the construction of South Asia Southeast Asia Radiation Center and other major strategic implementation, how to build the SDGs indicator system based on the new development concept in line with China’s national conditions is the main issue and challenge of sustainable development. It is a scientific problem that needs to be solved in the construction of China’s sustainable development evaluation index system. Therefore, with the help of the indicators of the 2030 Agenda and the Country Programs, the article refines the objectives of the five dimensions of China’s New Development Philosophy (NDP), namely, innovation, coordination, greenness, openness and sharing, and builds a framework for assessing the sustainable development of Kunming City on the basis of the key year of the NDP in 2015. Finally, through the quantification of indicators and the allocation of weights, the overall development level of Kunming’s sustainable development, the degree of coordination and the degree of correlation among the dimensions are explored.
2 Study cases
2.1 Current development situation in Kunming
Kunming City is located in the central region of Yunnan Province, with the unique location advantage of “connecting Guizhou and Guizhou to the east and the coast, Sichuan and Chongqing to the north and the Central Plains to the north, Vietnam and Laos to the south, Thailand and Cambodia to the south, and Myanmar and India and Pakistan to the west” (Figure 1). As an important engine of economic development in Yunnan Province, Kunming’s GDP has always been in the first place in Yunnan Province. 2021, its economic and social development has achieved new results, the quality and efficiency of industrial development has been significantly improved, the urban and rural areas have been greatly improved, the vitality of the development has been continuously enhanced, the overall situation of the society has remained harmonious and stable, and the high-quality development has achieved new breakthroughs. According to the Kunming Statistical Yearbook, the resident population in 2021 will be 8.520 million, with an urbanization rate of 80.5%. The annual GDP is 722,250.1 million yuan, and the industrial structure is diversified, showing a “three-two-one” development pattern with the service industry as the main focus, with the proportion of the three industries being 63.7%, 31.7% and 4.6% respectively. In addition, Kunming has become a transportation hub in Southwest China, with the rapid development of a well-developed logistics industry, tourism, and electronic information industry, as well as the gradual rise of specialty agricultural products and the flower industry. With its unique natural environment, rich history and culture, booming economy, advanced science and technology education and quality living environment, it has become the most influential megacity in Southwest China.
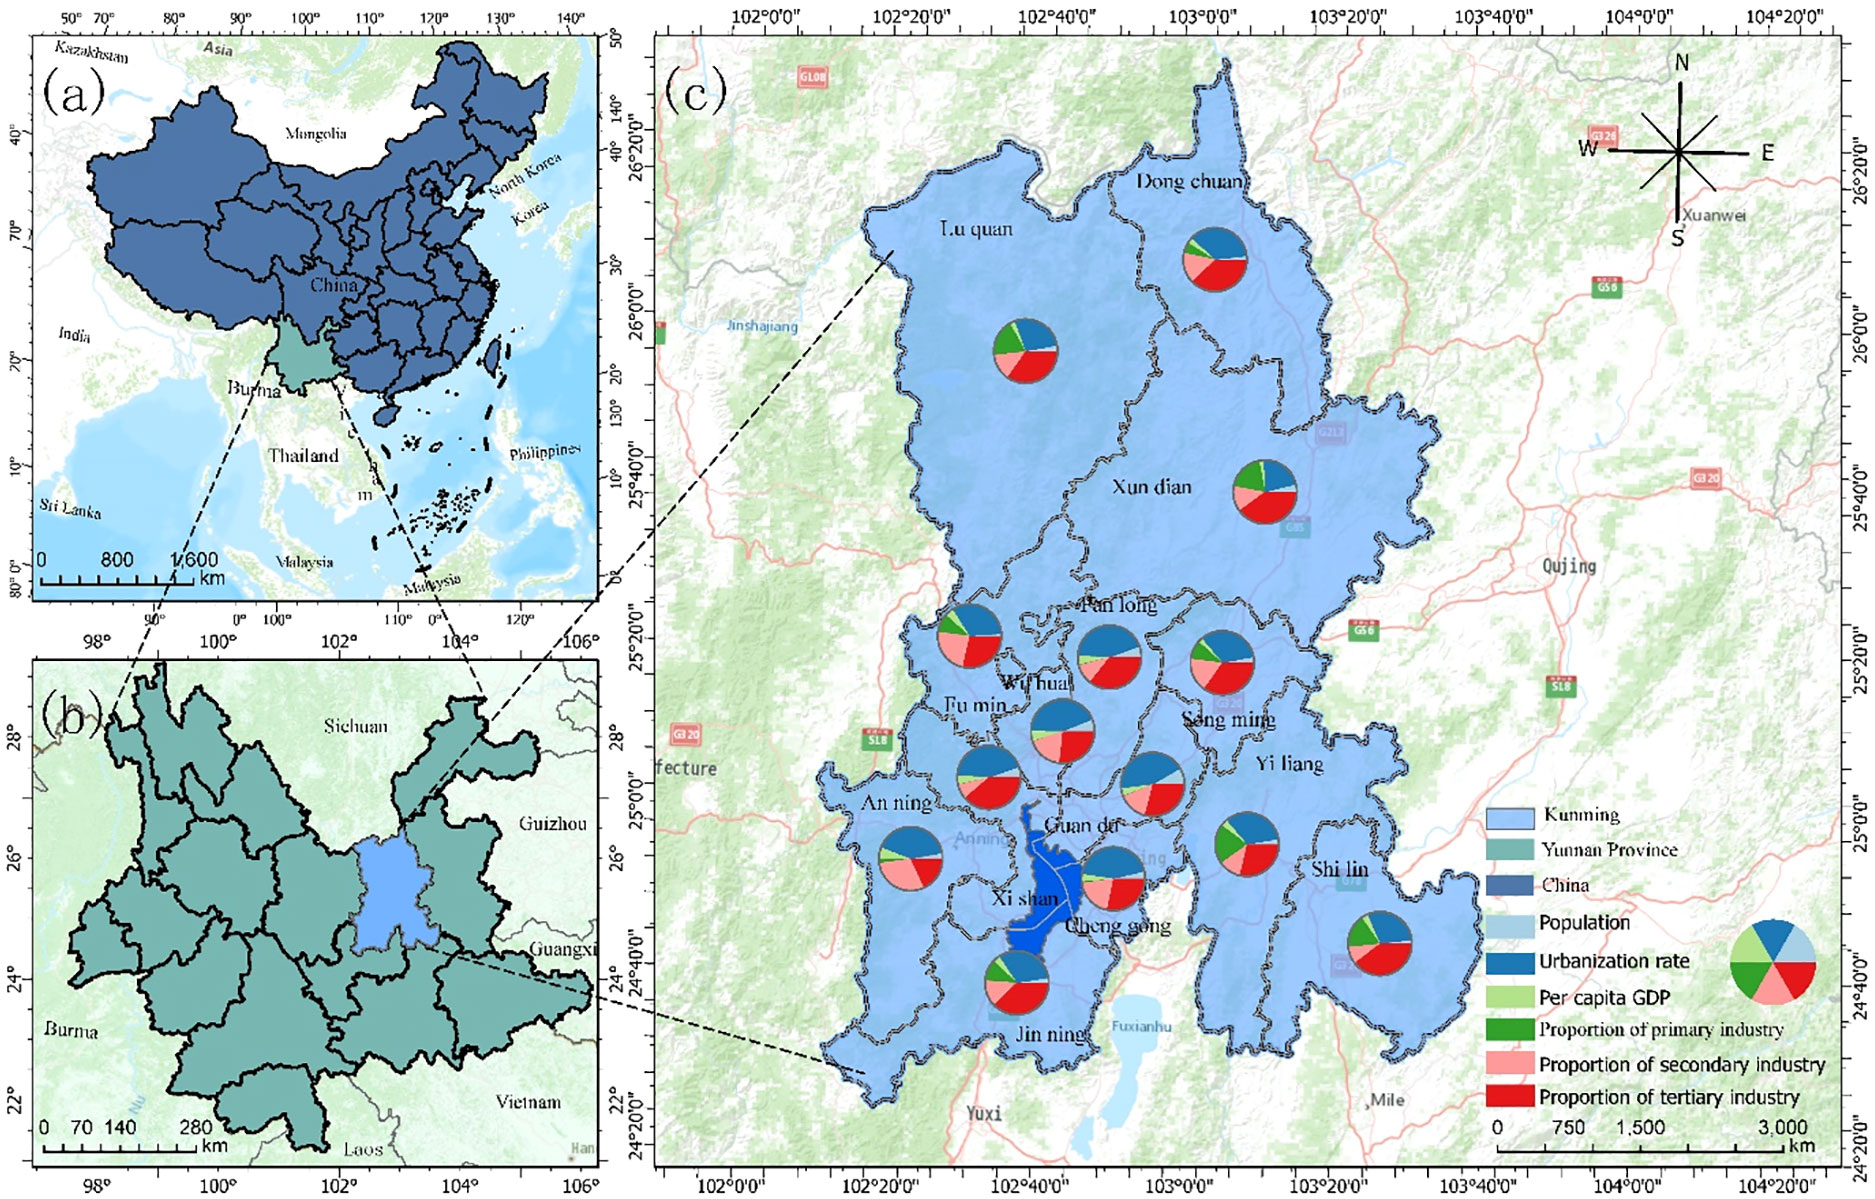
Figure 1 Overview map of the study area. (A) Administrative boundaries of China; (B) Administrative boundaries of Yunnan Province; (C) Administrative boundaries of Kunming City.
2.2 Development strategy of Kunming
As China’s gateway to Southeast Asia, Yunnan Province plays an important role in China’s economic and trade cooperation and humanistic exchanges with neighboring countries in East, Southeast and South Asia. Its strategic position and location advantages have become more and more prominent, and it has become the economic main body opening up to Southeast Asia and South Asia as well as an important part of the Southwest China Economic Circle. Kunming City is the center of political, economic, cultural and social development of Yunnan Province, the forefront of the construction of the “Belt and Road” and the “central processor” of the Dianzhong City Economic Circle, and occupies a central position in the strategic development of the province. It has a strong economic foundation, rich in mineral and agricultural resources, and is an important economic center in southwest China; it is rich in population and cultural resources, and has unique minority cultures and historical sites. Strengthening cooperation in ecological protection and pollution control of plateau lakes and giving full play to the radiation-driven role of the province will help promote the province’s economic development in a high-quality and leapfrog manner.
2.3 Demand for development strategies in Kunming
In 2015, General Secretary Xi Jinping emphasized during his visit to Yunnan that “Yunnan should take the initiative to serve and integrate into the national development strategy, break a path of leapfrog development, and strive to become a model area for national unity and progress, a leader in ecological civilization construction, and a radiation center facing South Asia and Southeast Asia”. With reference to the development layout of “Yunnan Provincial Spatial Planning and Territorial Planning (2016-2035)”, it will enhance the radiation capacity of the city cluster in central Yunnan, build efficient transportation corridors, improve the level of development and opening up of the border areas, and form a spatial pattern of development and opening up with “a group of cities, a belt, ten corridors and multiple points” as the main framework. With the Kunming Metropolitan Area as the core, the city cluster in central Yunnan formed around the neighboring cities of Kunming City can quickly form and accelerate the building of the regional central city of Kunming City, and play a role in radiating and driving the rapid development of large, medium and small cities in the province. It will promote the sustainable development of the Kunming region by focusing on the strategic needs of strengthening ecological protection, deepening tourism development, improving infrastructure construction, promoting industrial transformation and upgrading, and enhancing the city’s vitality and innovativeness.
2.4 Special mission for the development of Kunming
During the “13th Five-Year Plan” period, Kunming City has implemented the new development concept, actively promoted the high-quality development of the economy, the economic strength has greatly jumped, the economic structure continues to optimize, the quality and efficiency has improved significantly, the people’s sense of access, happiness and security continue to increase, and the construction of the regional international central city has made a solid step forward. During the 14th Five Year Plan period, Kunming shoulders a special mission in the economic and social development of Yunnan, firmly pursuing development based on one positioning, and making the Kunming area of the China Pilot Free Trade Zone a leading area for Yunnan to build a radiating center towards South Asia and Southeast Asia, as well as for Kunming to build a regional international center city; 5 benchmarks for development, setting a benchmark for reform and innovation in the province, setting a benchmark for modern industrial development in the province, setting a benchmark for opening up to the outside world, integrating industry and city in the province, and setting a benchmark for the business environment in the province; Seven key tasks for development include expanding new advantages of reform and opening up, creating a new environment for innovation and entrepreneurship, building a new modern industrial system, promoting new development of industry city integration, creating new models of green parks, improving new levels of public services, and building a new pattern of social governance.
3 Construction of the indicator system and quantification methodology
3.1 Logical construction of indicator level
From the perspective of the new development philosophy, this paper constructs the evaluation index system for sustainable development of Yunnan plateau lakeside cities, and the overall research program is shown in Figure 2, which is mainly divided into four parts: Construct the sustainable development index system of Yunnan plateau lakeside cities; Acquire and quantify the sustainable development index data of typical Yunnan plateau lakeside cities; Construct an evaluable sustainable development index system by assigning values to the indexes; Evaluate the sustainable development of Kunming City in the demonstration area and analyze the time-sequence of changes in the level, and use this as the basis for decision-making support.
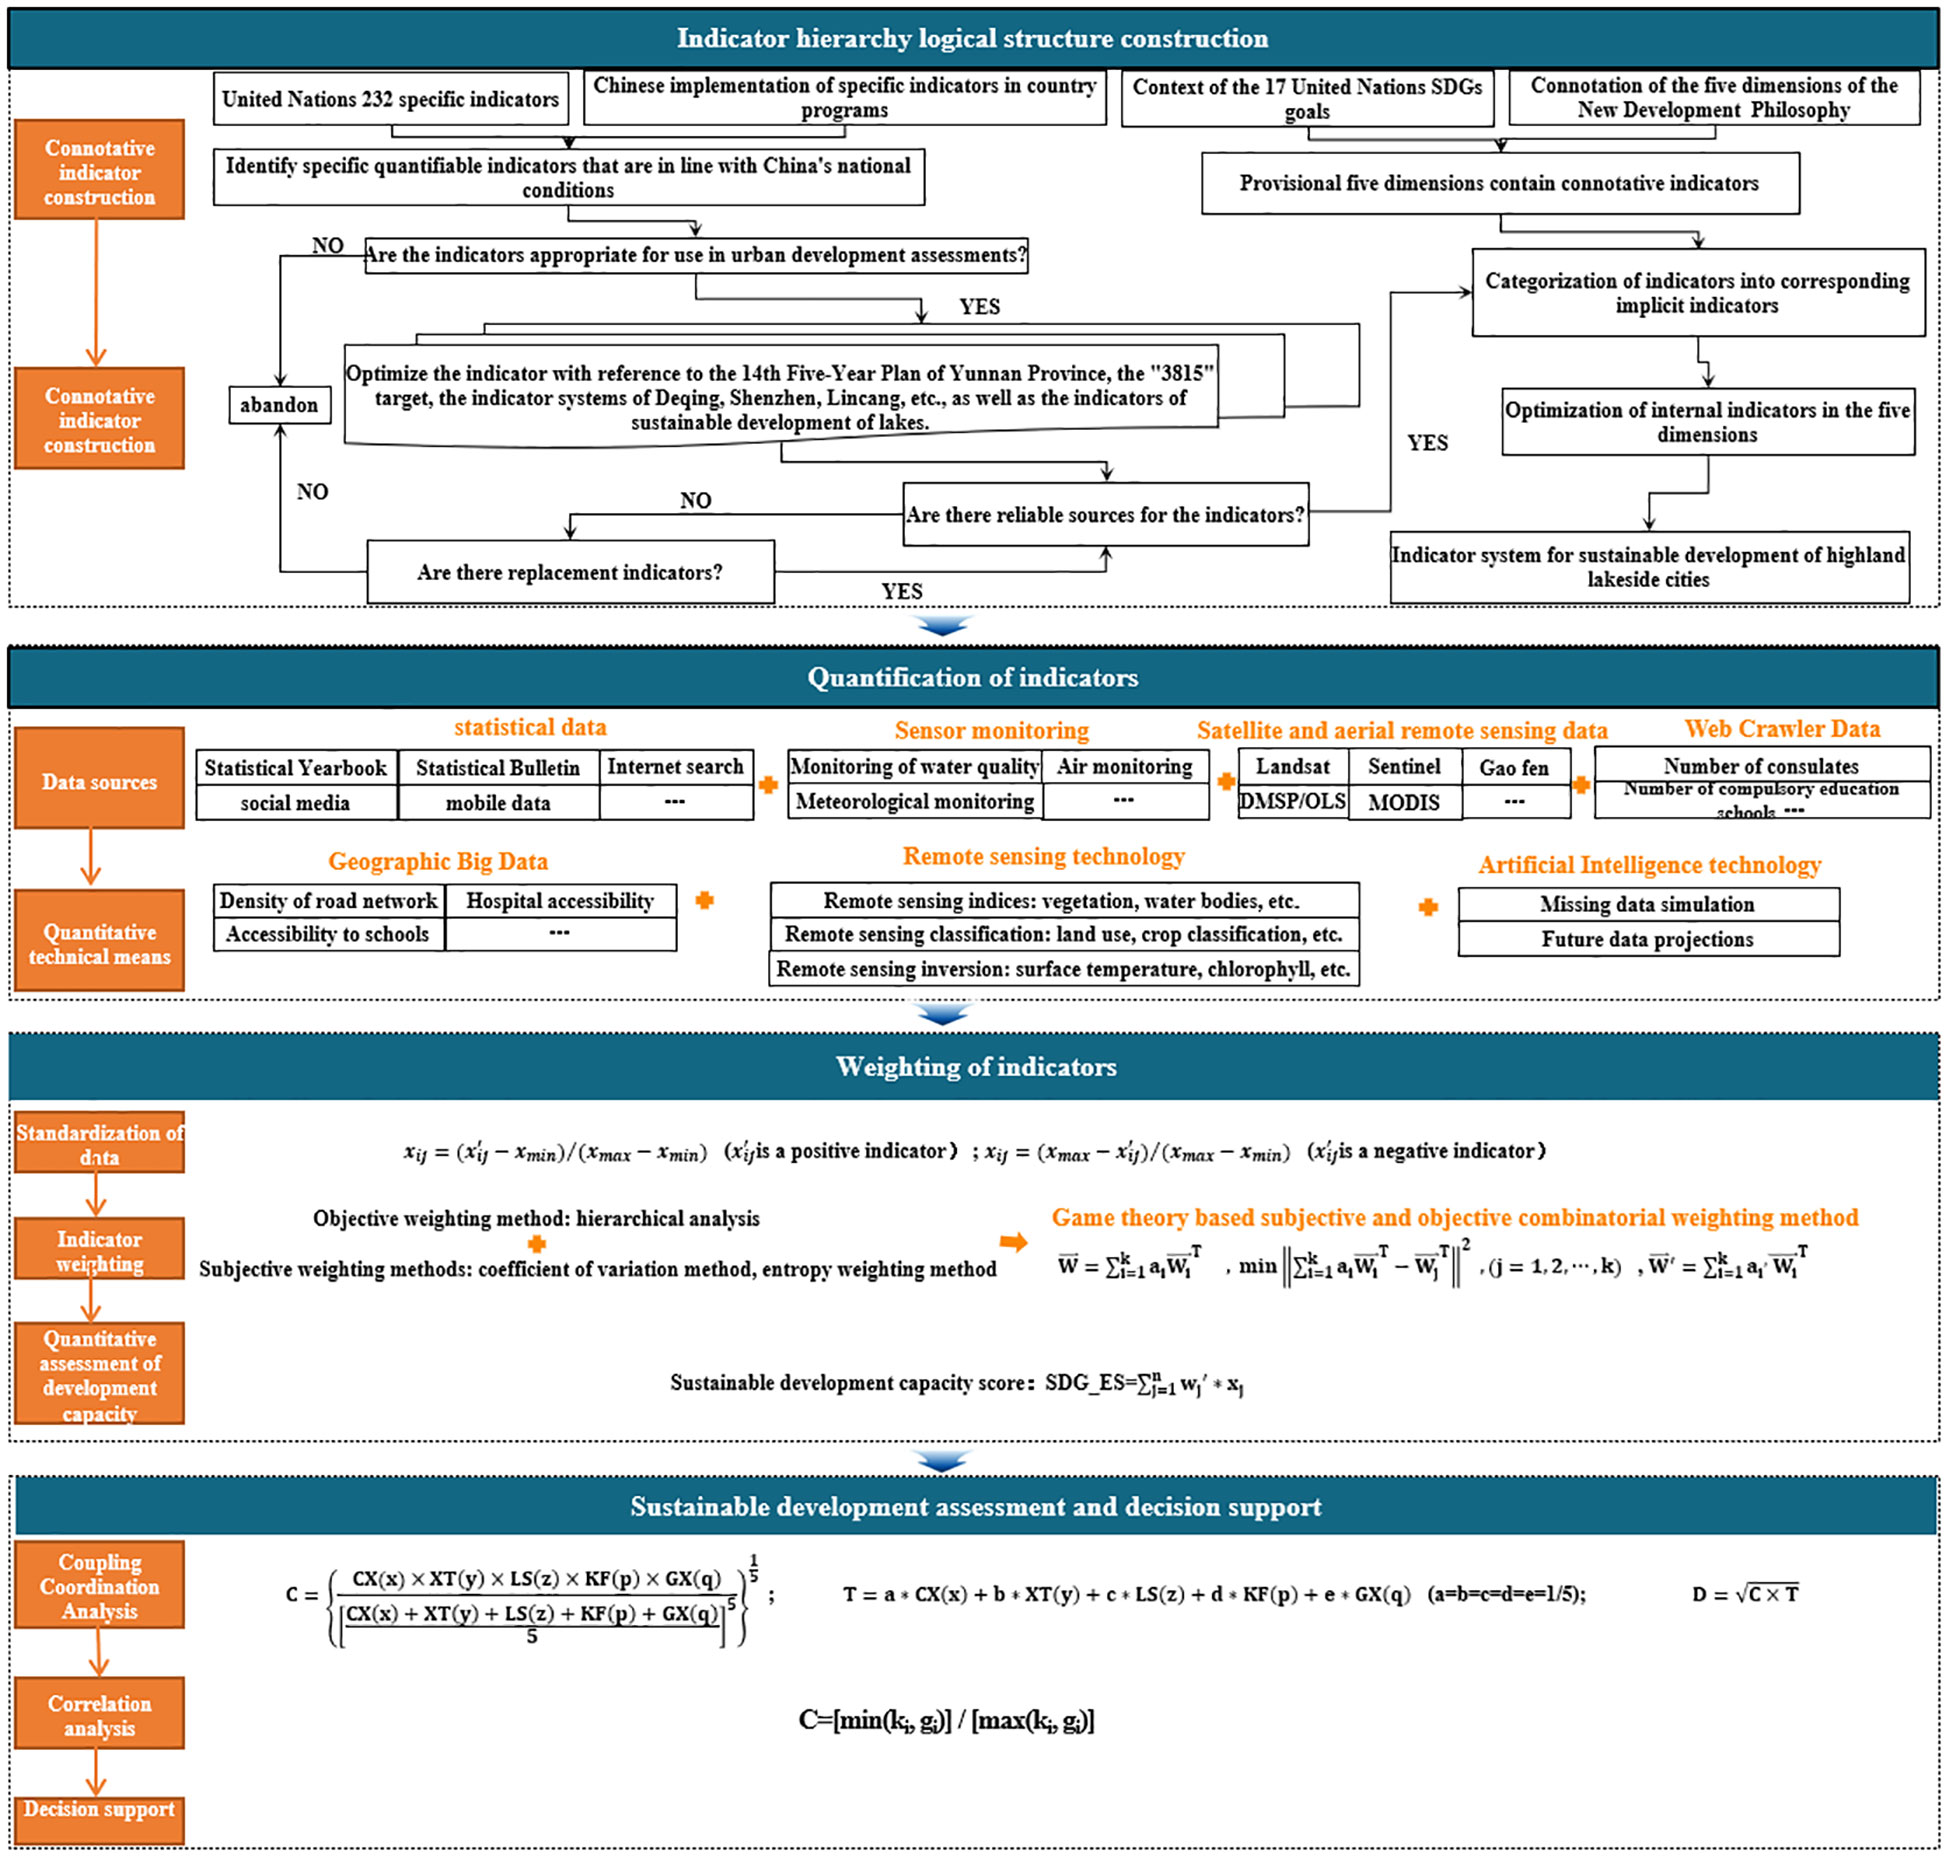
Figure 2 Logical hierarchy diagram of the construction of sustainable development indicator system for plateau lakeside cities.
3.1.1 Localization of SDGs at the national level in China
By combing the 17 SDGs, 169 specific goals and 231 specific indicators in the 2030 Agenda and the corresponding safeguard measures in the Country Programs, the objectives of the five dimensions of China’s new development philosophy, namely “Innovation, Coordination, Green, Openness and Sharing”, have been refined.
“Innovation” is the first driving force for development, including theoretical, institutional, scientific and technological, and cultural innovation. Specifically, indicators such as scientific and technological research and development expenditure, the number of patent applications, the number of high-tech enterprises, the value added of emerging industries, higher education and the number of talents can be considered; “Coordination” mainly addresses the problem of unbalanced development, which is a necessary safeguard and intrinsic requirement for sustained and healthy development, and should focus on promoting the coordinated development of urban and rural areas, the coordinated development of the economy and society, and the coordinated development of the “Five Harmonizations”. Specifically, consideration could be given to indicators measuring the gap in economic development between different regions, the harmonization of industrial structures, and the balance between environmental protection and economic development; “Green” focuses on the harmony between human beings and nature, which is a necessary condition for sustainable development, and should include the construction of a resource-saving and environmentally friendly society and the formation of a new pattern of modernization and construction in which human beings and nature develop in harmony, with consideration given to the measurement of such indicators as air quality, water quality, energy consumption, carbon emissions, and the treatment of three types of waste; “Sharing” mainly addresses the issue of social fairness and justice, which is the essential requirement of socialism with Chinese characteristics, and should include such aspects as social equity, social welfare and social security, and can be considered as a measure of income distribution, education level, medical security and other indicators; “Openness” is to solve the problem of internal and external linkage of development, and is a necessary way to enhance international competitiveness and influence in the context of globalization, including opening up to the outside world, international cooperation, international influence, which can be considered to measure indicators such as the volume of exports, foreign investment, and the number of international cooperation projects.
3.1.2 Localization of SDGs in Kunming
After the “Twentieth Congress”, Yunnan held the Third Plenary Session of the Eleventh Provincial Party Committee to consider the adoption of the “CPC Yunnan Provincial Committee on the in-depth study and implementation of the spirit of the twentieth CPC Central Committee striving to open up a new era of socialist modernization and construction of a new situation in Yunnan,” the scientific planning for the development of the overall thinking, distinctly put forward the implementation of the Yunnan “3815” strategic development goals and objectives of the plan, and to ensure that with the country’s synchronization with the realization of the socialist modernization of the basic. The “3815” strategic goal is to promote the high-quality development of Yunnan Province “timetable” and “roadmap”, is an important stage in the realization of high-quality leapfrog development in Yunnan, the key lies in the “five focuses, five efforts”. The localization of SDGs for plateau lakeside cities should be guided by the five focuses of the “3815”. At the same time, special attention should be paid to indicators of sustainable development characteristics of plateau lakeside cities, such as complex topography and climate diversity. In addition, it is necessary to consider the evaluation of the capacity of flood control and drainage systems, the ability to cope with natural disasters such as mudslides, and the protection and restoration of natural ecological environment.
The United Nations SDGs global indicator system contains 169 subgoals and 231 targets, however, the Inter-Agency and Expert Group on Sustainable Development Goal Indicators (IAEG-SDGs) has pointed out that about 83 targets lack recognized quantitative methods and data sources. However, the Inter Agency and Expert Group on Sustainable Development Goal Indicators (IAEG-SDGs) pointed out that about 83 specific indicators lacked recognized quantitative methods and data sources, such as indicators related to subjective feelings, values and ethical standards, and complex ecological processes that are difficult to quantify, as well as indicators for which data are missing or may be classified and difficult to obtain. Therefore, this study refers to the indicator construction method of Chen et al. (2019) when carrying out regional localization, and first considers the applicability of the indicators and the reliability and accessibility of the indicator data, and adopts four ways of directly selecting, optimizing, replacing, or abandoning the three-level indicators. Among them: the adaptability analysis is whether the specific indicators of the United Nations’ SDGs are of practical significance or value to the region under study; reliability of indicator data means whether the selected indicators have authoritative, reliable and accessible data, including statistical data, monitoring data, remote sensing data and other types of data; accessibility of indicator data means whether the indicators can be quantified and whether they can satisfy the time series and spatial coverage required for the study; direct selection means that the names, definitions, interpretations and computation methods of the original indicators will not be changed; optimization means that the original indicators cannot be directly applied to the study area, and need to be combined with the original indicators; optimization means that the original indicators cannot be directly applied to the study area, but need to be adjusted in the light of the actual situation of the study area, including the name, connotation or improvement of the calculation method; replacement means that the original indicators of the United Nations SDGs are not applicable or cannot be reliably obtained, and then look for similar or comparable indicators; abandoning refers to the selection of the indicators that have no practical significance in the assessment of sustainable development in the study area, and when the quantification of the indicators cannot be reliably obtained and no alternative indicators can be found. For example, for Kunming City, where there is no sea area, the relevant indicators of SDG14 (ocean) have no practical significance or value, so they cannot be used directly, but considering that the sustainable development of oceans is similar to that of lakes to a certain extent, “SDG14.1.1 (a) Coastal Eutrophication Index” is replaced by “lake eutrophication index”. For example, “SDG15.5.1 Red List Index”, although there is an authoritative “Red List of Biological Species in Yunnan Province (2017 Edition)”, its time series (only 2017) and spatial coverage (the scope of Yunnan Province could not be specified to a city) could not meet the requirements of the study, so it was abandoned.
In summary, based on the perspective of the new development philosophy, taking the five dimensions of “innovation, coordination, greenness, development and sharing” as the first-level objectives, and with the help of the United Nations SDGs system and the interpretation of the 17 major objectives in the Country Programs, the objectives of the five dimensions have been refined, and the internal indicators have been constructed to reflect the common characteristics of sustainable urban development and the special characteristics of sustainable development of plateau lakeside cities. At the same time, with the help of Yunnan Province’s “14th Five-Year Plan” and “3815” goals, and with reference to the sustainable development index system of Deqing (http://www.deqing-sdgs.cn/), Shenzhen (Shenzhen Sustainable Development Assessment Report 2016-2021, 2022), Lincang (Lincang city sustainable development plan (2018-2030), 2019) and other cities (Cao et al., 2023; Ndeketeya and Dundu, 2023), the connotative indexes were refined, and localized specific indexes were constructed on the basis of quantifiable and accessible data, and the index system shown in Table 1 was finally obtained, which includes 26 connotative indexes and 84 specific indexes.
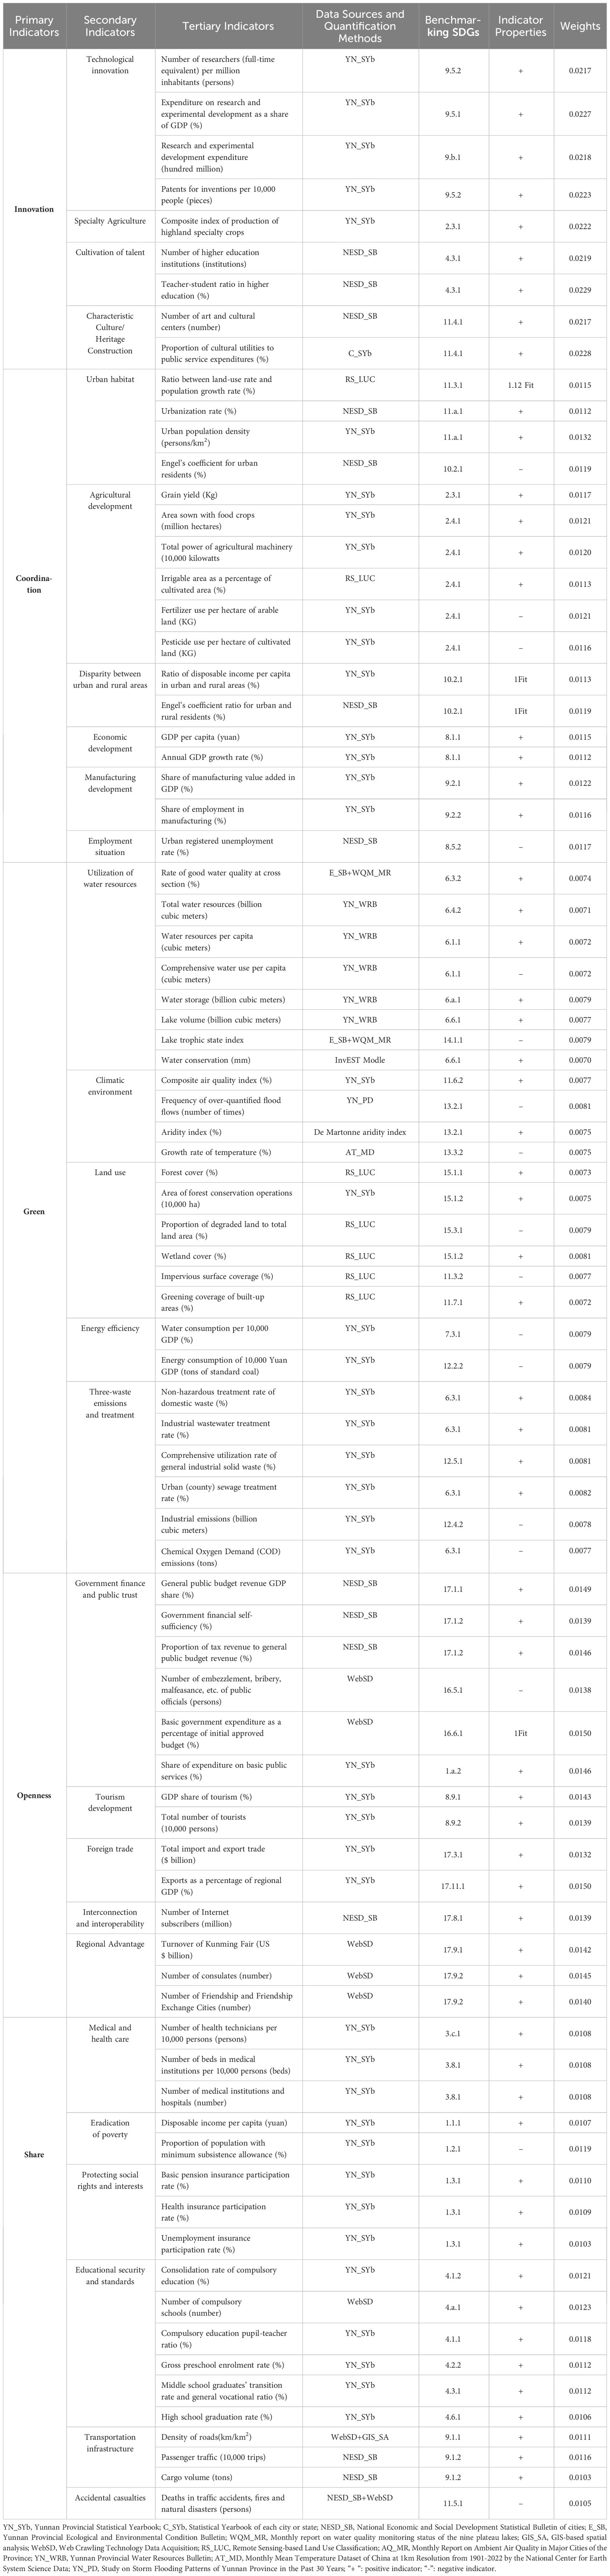
Table 1 Evaluation Indicator System of Sustainable Development in Kunming City.
The correspondence between the five first-level dimensions of the new development philosophy in this indicator system and the 17 United Nations SDGs is shown in Figure 3. The five development philosophies are intrinsically linked and interact with each other in urban development: Through innovation, industrial upgrading, technological progress and economic growth can be promoted, giving cities the competitiveness for sustainable development. Its development needs to rely on coordinated development, and the harmonization of development in various fields can provide a good environment and support, as well as a foundation and impetus for innovation. Green development requires cities to adopt a sustainable approach to resource utilization and environmental protection, which is important for promoting innovation and achieving coordinated development. At the same time, innovation and coordinated development provide technical and policy support for green development. Sharing, as an essential requirement for urban development, can only benefit more residents by realizing the sharing of resources, services and opportunities. Innovation can provide new modes and means for sharing, coordinated development can guarantee the balance and fairness of sharing, and green development can provide a sustainable basis for sharing. Opening up can bring in foreign resources, talents and capital, providing impetus and opportunities for urban innovation and development. It can also promote coordinated and green development and realize the goal of sharing through exchanges and cooperation with the outside world. In short, “innovation, coordination, greenness, sharing and openness” are mutually reinforcing and supportive of each other to build a sustainable city. In addition, based on the understanding of China’s national conditions and Yunnan Province’s provincial conditions, the construction of the Yunnan Plateau Lakeside Cities Sustainable Development Indicator System will also help to support the evaluation of sustainable development at a larger level (provincial and national).
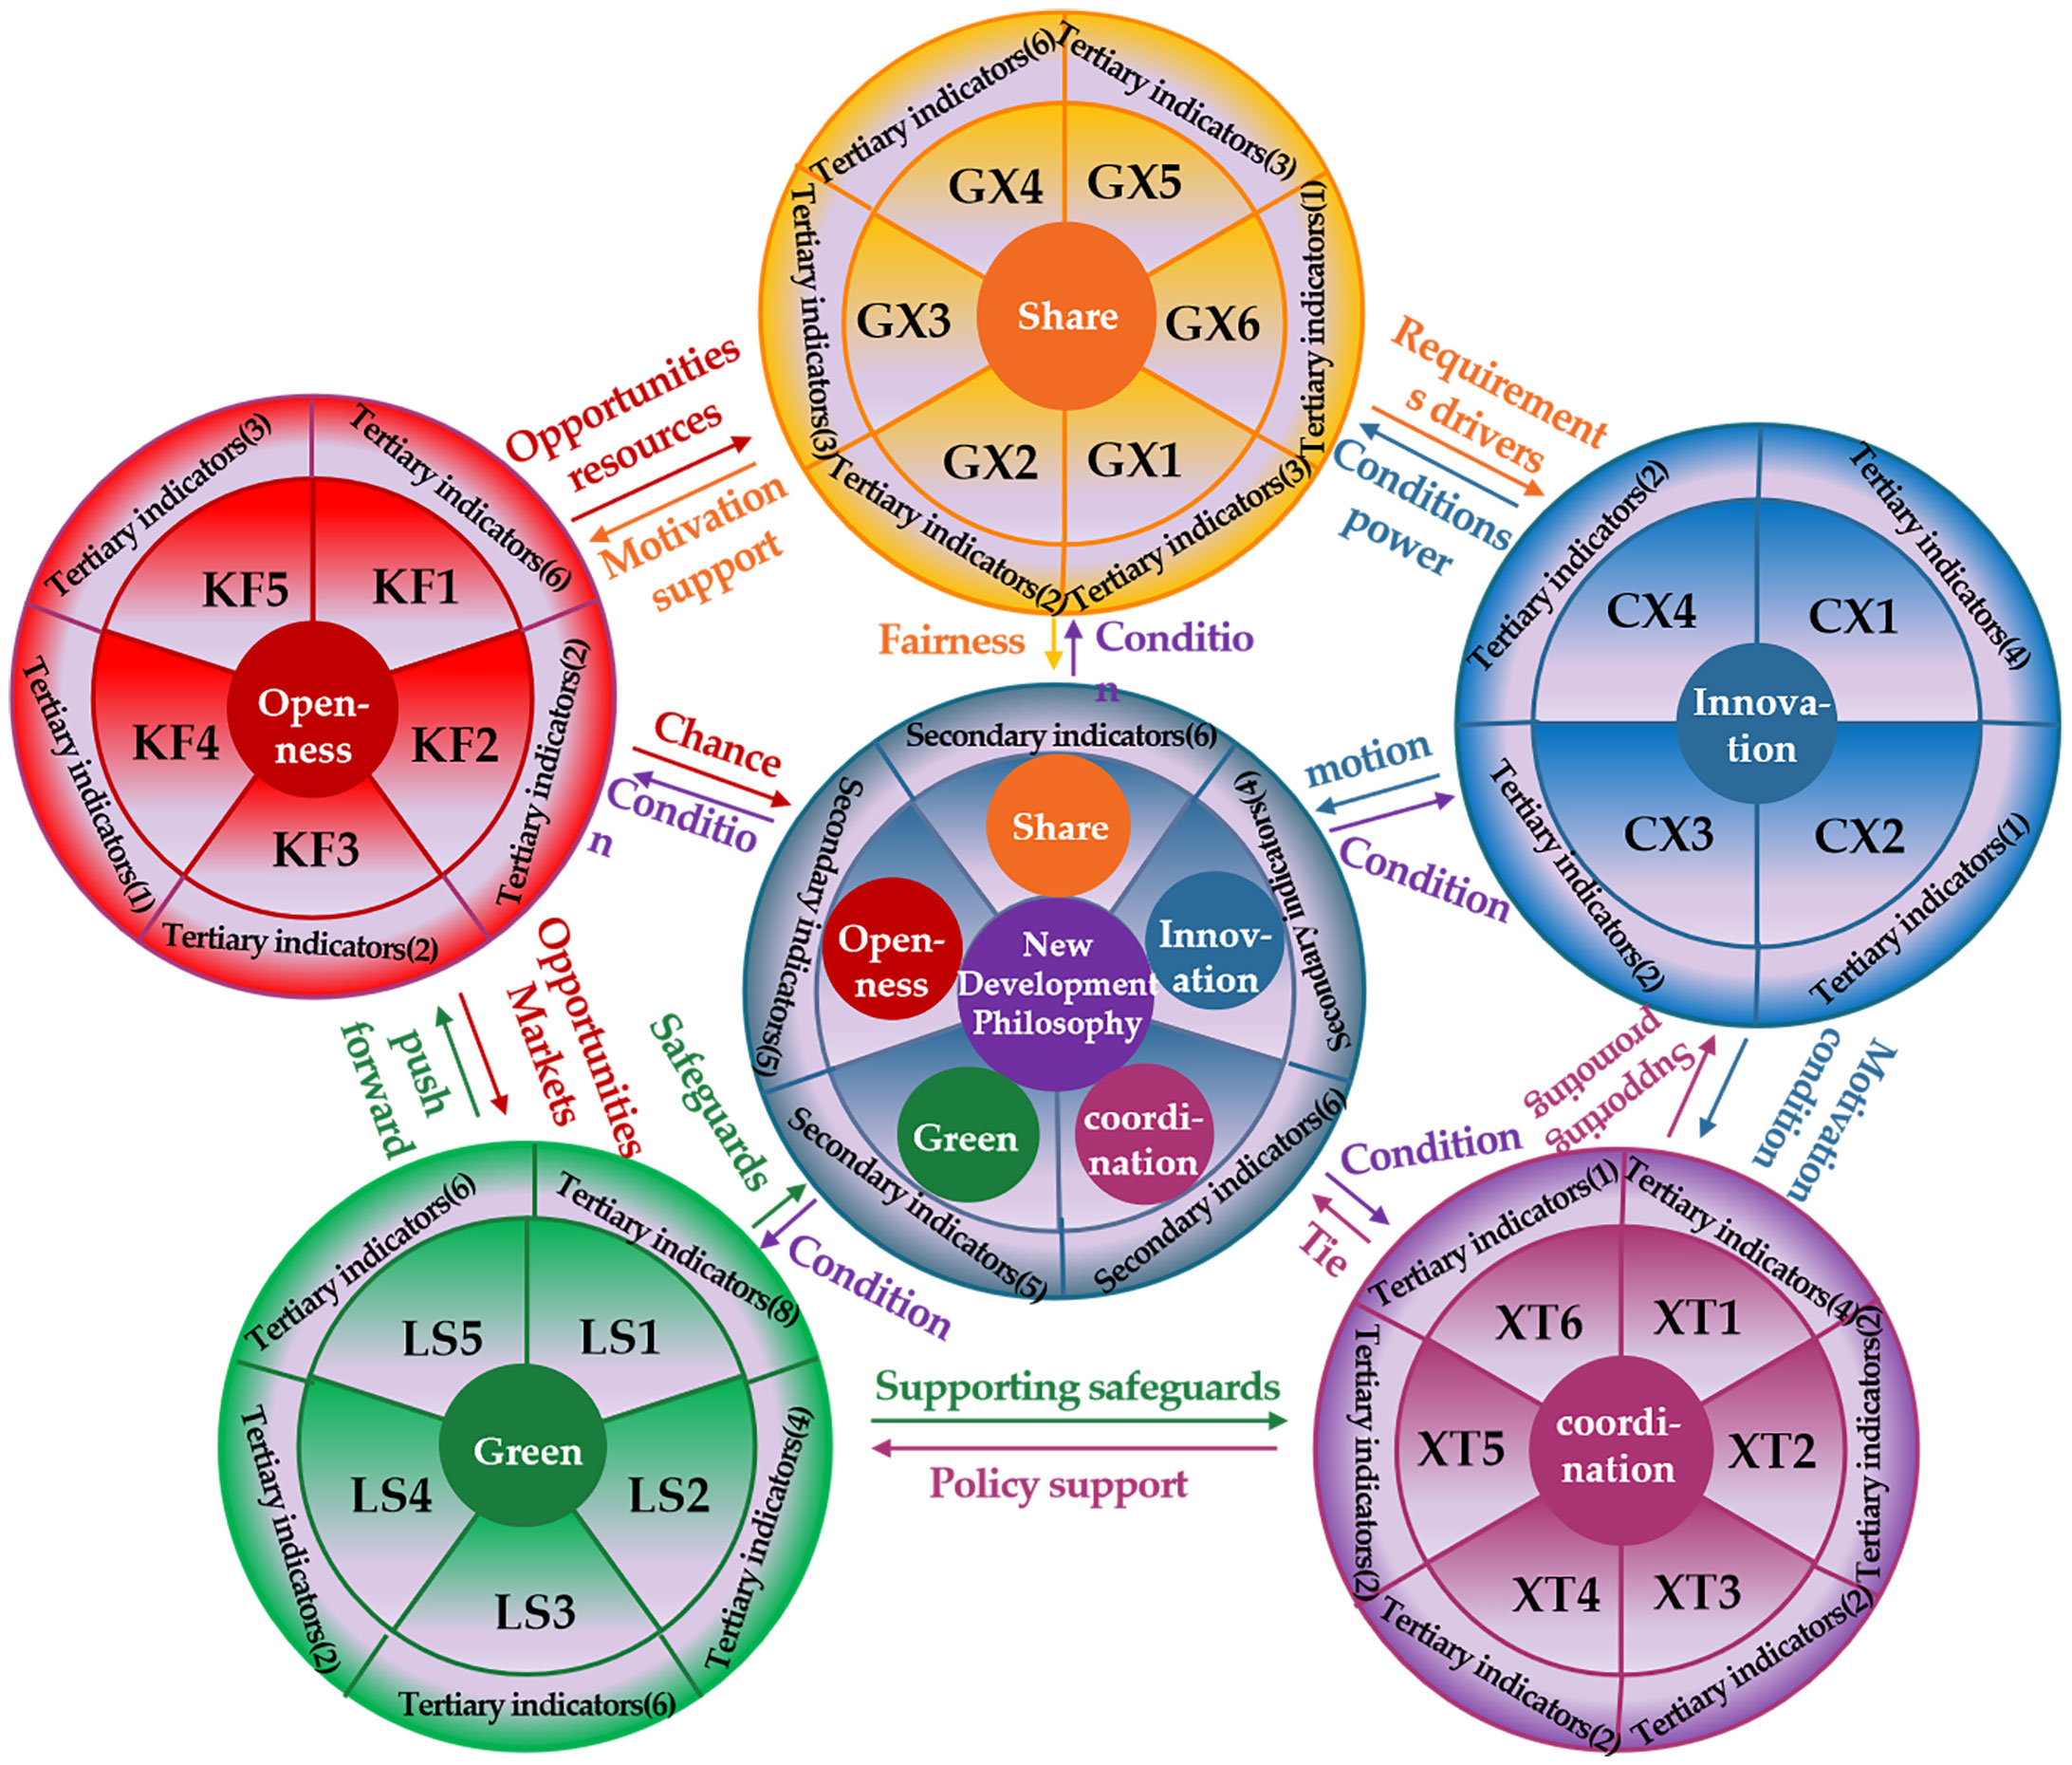
Figure 3 Schematic diagram of the relationship between the indicator systems for sustainable development of plateau lakeside cities. CX1, CX2, CX3, CX4 in the text represent science and technology innovation, special agriculture, talent cultivation and construction of special culture and cultural relics respectively; XT1, XT2, XT3, XT4, XT5 represent urban habitat, agricultural development, urban-rural disparity, economic development, manufacturing industry development and employment respectively; LS1, LS2, LS3, LS4 represent water resources exploitation and utilization, climate environment, land use, energy efficiency and three-waste emissions and treatment respectively; KF1, KF2, KF3, KF4, KF5 represent government financial credibility, tourism development, foreign trade, connectivity and interconnection;GX1, GX2, GX3, GX4, GX5 and GX6 represent healthcare, poverty eradication, social rights and interest protection, education security level, and transportation infrastructure, respectively.
3.2 Data sources and quantification of indicators
The quantification of the indicators in the indicator system is the prerequisite and basis for realizing the dynamic monitoring and assessment of sustainable urban development. Specific monitoring and measurement of each indicator facilitates comparison and comprehensive analysis between indicators. At present, the means of obtaining indicator data include historical statistical data, in-situ monitoring data, remote sensing observation data and web crawler data.
3.2.1 Historical statistics
Historical statistics are usually derived from data surveys and statistics from government agencies, survey agencies and related organizations, and are published in the form of data tables, charts and reports. The statistical data in this study were obtained from Yunnan Provincial Statistical Yearbook 2012-2022, Kunming Statistical Yearbook 2012-2022, Kunming National Economic and Social Development Statistical Bulletin, Yunnan Provincial Ecological and Environmental Status Bulletin, Monthly Report on the Water Quality Monitoring Status of Nine Plateau Lakes, and Monthly Report on Ambient Air Quality in Major Cities of the Province.
3.2.2 In-situ observation data
In-situ observation data come from various sensors deployed in the cities and can be accessed by the user through data interfaces or data portals, such as the rate of change of temperature, the number of occurrences of heavy rainfall or exceptionally heavy rainfall, and the relevant water quality parameters in the calculation of the lake basin’s water conservation and the lake’s water environmental capacity indicators. In this indicator system, the data on the frequency of super-quantitative flood flows, the aridity index and the growth rate of air temperature are derived from in situ observations.
3.2.3 Remote sensing observation data
Remote sensing observation data are obtained through artificial satellites and aircraft observation and measurement techniques on the surface of the earth to obtain remote sensing images within the urban area, such as Landsat, Modis, Gaofen, Sentinel and other remote sensing image data, which are used to quantitatively extract and invert the data on surface cover, land use, vegetation cover, land change and water resources; The nighttime light images provided by DMSP series satellites and NPP satellites can be used as a characterization of human activities and become a good data source for human activities monitoring and research. With the arrival of the era of geographic big data, as well as the development and combination of remote sensing and artificial intelligence technologies, not only can the monitoring of SDGs be carried out from different spatial scales and time scales (Giuliani et al., 2020), but also can make the acquired and quantified indicator data more accurate. In this study, indicators involving remotely sensed observation data include: ratio between land use rate and population growth rate, irrigable area as a percentage of cropland area, water conservation, forest cover, degraded land as a percentage of total land area, wetland coverage, impervious surface coverage, and built-up area greening coverage.
3.2.4 Web-crawler data
Web crawler technology can quickly obtain data from multiple websites, and filter the required data based on keywords, classification and automation, etc. It obtains data with high speed, high precision and a wide range of data. After preliminary inquiry, the following indicators were obtained: the number of public officials’ corruption, bribery, malfeasance, etc., the ratio of basic government expenditures to the initial approved budget, the turnover of the Kunming Fair, the number of consulates, the number of friendly and friendship exchange cities, the number of compulsory education schools, the density of roads and the number of deaths from traffic accidents, fires and natural disasters.
3.2.5 Quantification of special indicators
The “comprehensive index of production of plateau specialty crops” among the innovative indicators is calculated using the average growth index of plateau specialty crops: the number of cut flowers, edible fungi production and medicinal herbs production;
The calculation of water production in lake basins is based on the annual water production model of InVEST (Sun M. et al., 2022). The model is mainly based on the Budyko theory and water balance principle, and its water production Yx is determined for the image element x:
Where: Eax is the actual annual evapotranspiration in mm and Px is the annual precipitation in mm.
For the image element of vegetation type, in Eq (1) can be expressed as follows according to the Budyko curve and Foubauld’s formula:
Where: Ep,x is the potential evapotranspiration in mm;Er,x is the reference evapotranspiration in mm; is the evapotranspiration coefficient of land use lx; Wx is a nonphysical parameter characterizing natural climate-soil properties; Zc is the Zhang coefficient, also known as the seasonal constant; θx is the water content of the plant per unit volume of the plant that can be utilized water content in mm; droot,x is the plant root depth in mm; dlayer,x is the plant rhizosphere limiting depth in mm; and θplant,x is the plant available water capacity.
For non-vegetated types of image elements, the actual evapotranspiration Ea,x in Eq. (4) is considered to be limited by the magnitude of its water volume and evapotranspiration capacity, which can be expressed as
Where: is the evapotranspiration coefficient of land use lx; Er,x is the reference evapotranspiration in mm; and Px is the annual precipitation in mm.
Due to the influence of the subsurface, it is necessary to combine the topographic index, soil saturated hydraulic conductivity, and flow coefficient to correct the water yield calculated by the InVEST model in order to obtain the amount of water culmination. The correction method is as follows:
Where: Cx is the water-holding capacity in mm; Yx is the water yield in mm calculated by the InVEST model; is the flow rate coefficient for the land use lx; Ksat,x is the saturated hydraulic conductivity of the soil(mm·d-1); Tx is the topographic index; Agrainage,x is the regional catchment; dsoil,x is the thickness of the soil in mm; and Spercent,x is the percent slope.
A full convolutional neural network is constructed for lake water body extraction modeling, in which an ordinary three-layer convolutional block is used as in Eq. (9):
Where: I is the input image, σ is the activation function, Cn is the weights of the convolutional layers, g is the group normalization, and f is the computational function of the three-layer convolutional block.
The convolutional layer can be followed by classifying the input data according to the activation function. The Adam optimizer is added to the model, which is simple and easy to use, computationally efficient, has low memory requirements, has no effect on the diagonal reconstruction of the gradient, solves the problems of data and parameters, non-stationary targets and very noisy or sparse gradients, and the hyper-parameters are intuitively interpreted and usually do not need to be tuned (Kingma and Ba, 2014).
Where: α is the learning rate, β1 and β2 are the decay factors used to compute the first- and second-order distance estimates, mt and vt are the variables for the first- and second-order moment estimates, respectively, ϵ is a small constant added for numerical stability, θ is the model parameter to be updated, and gt is the gradient calculated at time step t.
A binary cross-entropy loss function is added to the model for water body boundary extraction, which converts the difference between the model predicted values and the true labeled values into a scalar loss value that is used to measure the accuracy of the model predictions as in Eq. (14):
Where: N denotes the number of samples used for network training, Yt denotes the probability of labeling, and yp denotes the probability after network prediction.
Figure 4 shows the statistics of the data sources required for the quantification of the indicator data in Kunming, of which 57 (67%) indicators were quantified using historical statistical data, 8 (9.5%) were obtained through web crawler technology, 8 indicators used in-situ and remote sensing data, and 3 (4%) required both remote sensing and in-situ observation data, namely Water conservation, Aridity index and Growth rate of temperature. There are 3 indicators (4%) that require both remote sensing and in situ observation data, which are Water conservation, Aridity index and Growth rate of temperature.
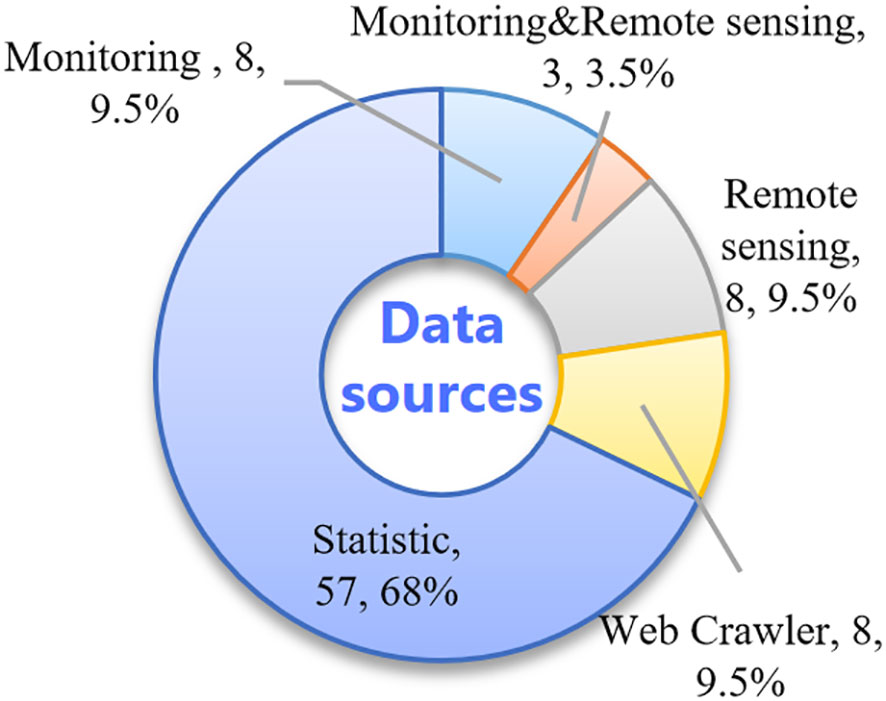
Figure 4 Statistical map of indicators data sources in Kunming.
3.3 Weighting of indicators
Determining the weights is the key to achieving reliable evaluation results. Currently, there is no consensus on the setting of weights for SDGs, and a particular method has not been proven to be the optimal solution (Sachs et al., 2019). The internationally recognized equal weight arithmetic average method helps to compare the overall SDGs performance of different countries and provinces (SDSN, 2018). However, some scholars have found that the SDGs indicator system is so large that the optimization of one objective leads to the weakening of another, and there is a contradictory relationship (Nilsson et al., 2016; Mollier et al., 2017). Simply summing up the objectives does not represent the progress in the direction of sustainable development, and this evaluation may make it easier to achieve the economic objectives while the environmental objectives cannot be reached, and does not present the characteristics of urban development in the assessment of the indicators. Therefore, based on the quantitative results of the development indicators, this paper adopts the subjective and objective combination of the game theory’s assigned value method for the five dimensions of the new development philosophy, calculates the comprehensive weights of the indicators, and constructs an evaluable indicator system, so as to assess the comprehensive ability of the city’s sustainable development.
3.3.1 Data standardization
Raw data have different orders of magnitude and scales and need to be standardized in order to facilitate statistical analysis of the indicators:
Where: xij is the standardized value; is the measured value of the j indicator in the i year of the urban development evaluation; xmax is the maximum value in the time series of the indicator; xmin is the minimum value in the time series of the indicator.
If a fixed value is appropriate in the nature of the indicator, if a is moderate, then the measured value should be calculated first by using the formula: , then the new indicator value should be normalized as the measured value by using the inverse indicator formula.
3.3.2 Evaluation of integrated capacity for sustainable development based on game theory combination weight method
Analytical hierarchy process (Marzouk et al., 2022; Zhong et al., 2023) is able to hierarchize complex issues and quantify qualitative issues, and can be used to determine the weights according to experience and actual situation, reflecting the intention of decision makers. Considering that each indicator is equally important in the SDGs. Therefore, the subjective weighting method in this paper adopts the analytical hierarchy process method based on equal weights.
The coefficient of variation method (Wu and Huang, 2023) calculates the weights of the indicators through the information implied by each indicator; the greater the difference in the values of the indicators, the more they reflect the gaps in the system, and the greater the value of the scores assigned. On the contrary, a smaller value is assigned. As the number of third-level indicators contained in the five first-level dimensions is inconsistent, in order to emphasize that each dimension is important for sustainable urban development, it is necessary to calculate coefficients of variation and weights for each of the five dimensions separately.
Information entropy is the value used to describe the uncertainty in information. The lower the entropy, the lower the uncertainty, and the easier it is to obtain certain information.
The game theory based combinatorial approach is to strike an equilibrium between the various weights by minimizing the deviation between the weights determined by combining the various methods, the main steps of which are described below (Liu T. et al., 2018):
There are n indicators in the urban sustainable development indicator system, and there are k (k =3 in this paper) methods for weight assignment, and the weight vector obtained from each analysis method is (j=1,2,…,k), then there are:
Where: is the set of all possible weight vectors; ai is the combination coefficient.
Determine the combination weights to get the response model, the formula is as follows.
Solving the above equation yields the optimal , and the combined weight vector is given in the following equation.
Comprehensive ability rating for sustainable development.
In the assessment of sustainable development, there is the introduction of policies or unexpected events, so that some indicators show a non-stationary time series, such as the 2019 new crown epidemic caused by the GDP and other indicators will be mutated in 2020. Using Pettitt and Mann-Kendall mutation test method (Ren et al., 2022) to identify the mutation of sustainable development indicators and calculate the degree of significance, if the results of the two mutation test methods are more consistent and significant mutation points are detected, then it is judged as a mutation point, and the time of mutation is obtained. Then, Mann-Kendall trend test method was used to analyze the trend of the five dimensions indicators, and the obtained mutation point was used as a split point to calculate the trend of the indicators before and after the split point, and at the same time to calculate whether the change trend was statistically significant or not.
3.4 Degree of coupling coordination
In the process of urban sustainable development, the coupling coordination degree is explored through the five first-level indexes of “innovation, coordination, greenness, openness and sharing” (Abu-Rayash and Dincer, 2023), to assess whether there is coordination between the first-level indexes, and to identify the bottlenecks and problems in the sustainable development of the city. In the model, CX stands for “innovation”, XT for “coordination”, LS for “ Green”, KF for “openness” and GX for “Sharing”, “GX denotes “sharing”, and the composite index of the five dimensions can be expressed as follows: CX(x), XT(y), LZ(z), KF(p)and GX(q), which have n1, n2, n3, n4 and n5 indicators, respectively, and the formulas are shown below:
Where: w1i、w2i、w3i、w4i、w5i are the weights of the five dimensions represented by the indicators; xi、yi、zi、pi、qi represent the standardized indicator values of the five dimensions; C is the coupling degree of the five dimensions, the value of C ranges from 0 to 1, the closer the value of C is to 1, indicating that the greater the coupling degree among the various systems; the closer C is to 0, the smaller the coupling between the systems, and the less the sequence of parameters is in the state of irrelevance and non-development; T is the degree of development of the five dimensions, the comprehensive coordination index, and a, b, c, d, e are the weights of the dimensions to meet the requirement that a+b+c+d+e=1; In this paper, “innovation, coordination, green, openness and sharing” are equally important for high-quality development, and a=b=c=d=e=1/5; D is the degree of coupled coordination, reflecting the coordinated development of the five dimensions.
3.5 Gray correlation
Using gray correlation (Alshuwaikhat et al., 2023) to analyze the correlation and importance of each indicator in the five dimensions of sustainable development in order to identify the key indicators that affect the development of their dimensions, the specific steps are as follows:
1. Determine the reference series reflecting the behavioral characteristics of the system and the comparative series affecting the behavior of the system.
2. Data normalization: normalize the data of the reference series and the comparative series so that their values are between 0 and 1.
3. Find the gray correlation coefficient between the reference and comparison series.
4. Determine the formula for correlation: there are various formulas for calculating the gray correlation, and the commonly used formula is:
5. Where: G is the degree of association and ki and gi are the normalized values of the reference and comparison series at time period i, respectively.
6. Calculate the correlation: Based on the above formula, the correlation between the reference series and the comparison series for each time period is calculated.
7. Ranking correlation order: the degree of correlation between the factors, mainly with the correlation of the size of the order of description, not only the size of the correlation. For this reason, according to the comprehensive evaluation value of each comparative series, to determine the influence of each factor on the reference series of the order of magnitude.
4 Result
4.1 Analysis of time-series changes in the level of sustainable development in Kunming City
Based on the constructed index system of sustainable development of plateau lakeside cities, the subjective and objective combination of game theory’s assigned value method is used to calculate the changes of the indexes in five dimensions of Kunming City in the past 10 years, as well as the overall scores of the implementation of the new development philosophy based on the calculation of the five dimensions, and the results are shown in Figure 5 and Table 2.
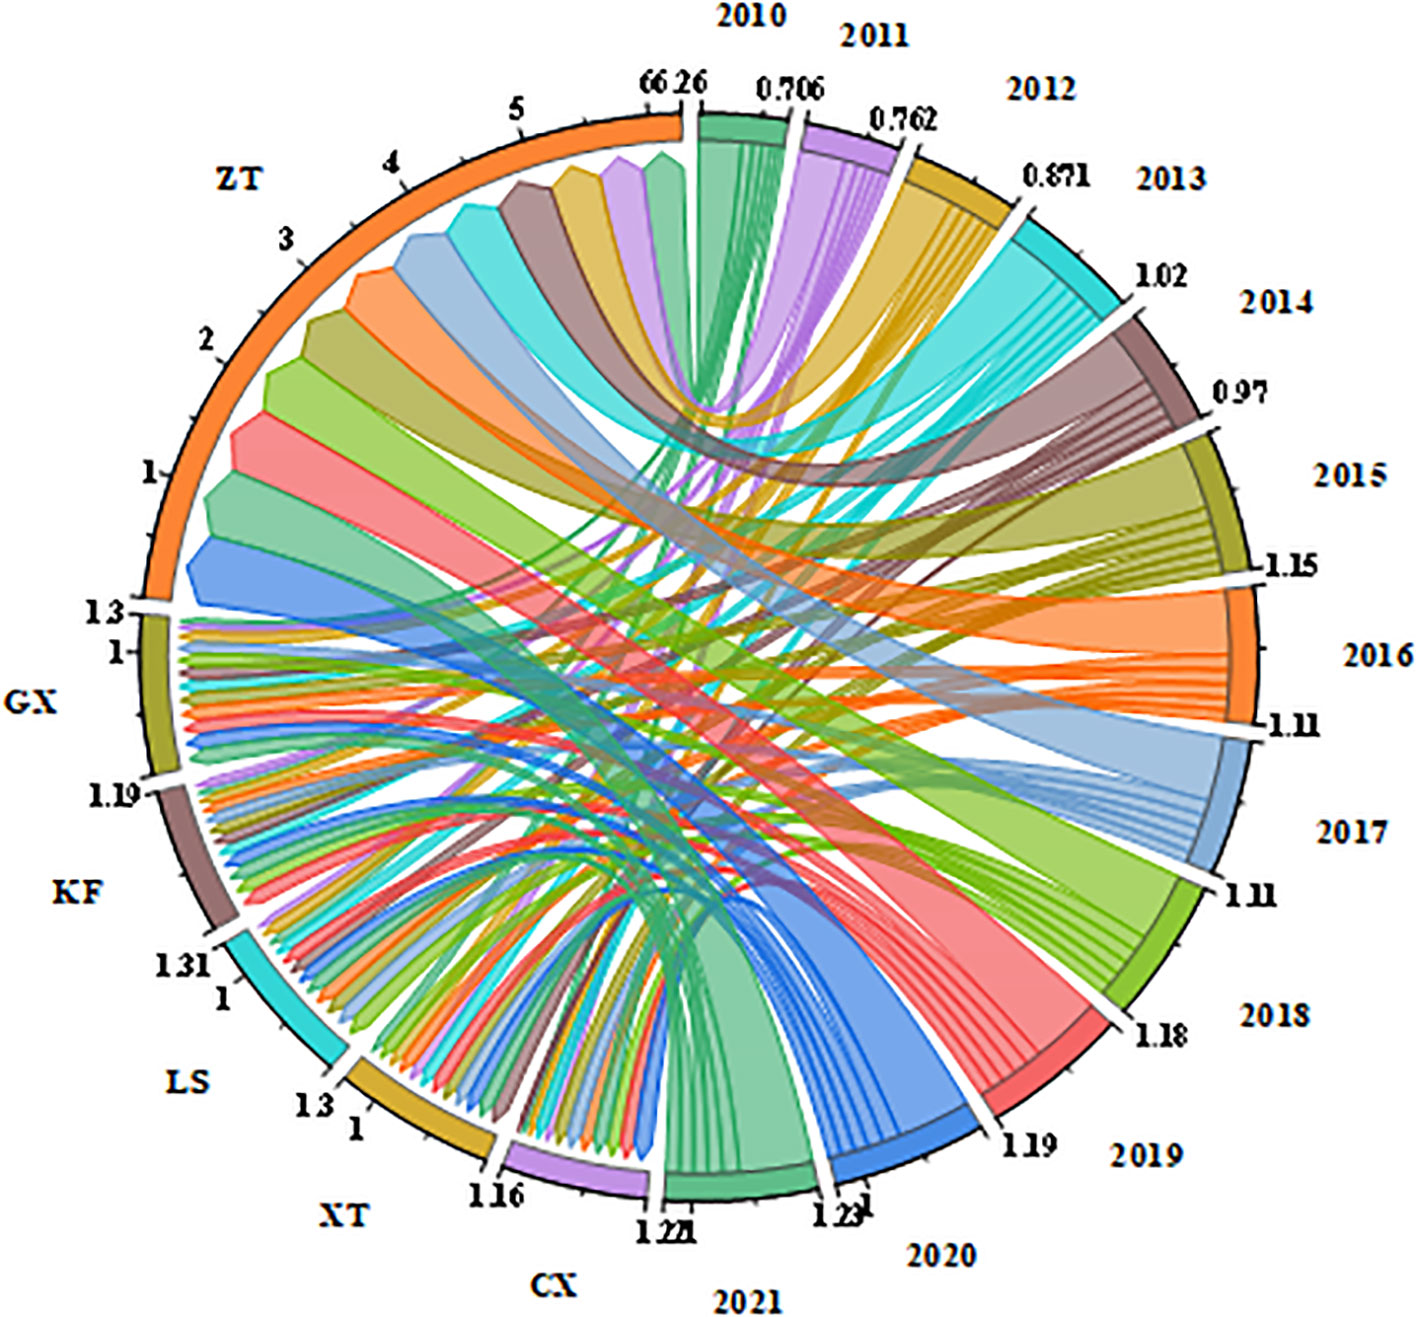
Figure 5 Sustainable development level in Kunming, 2010-2021. In the figure, CX, XT, LS, KF, GX and ZT stand for innovation, coordination, greening, openness, sharing and overall, respectively, and 2010-2021.
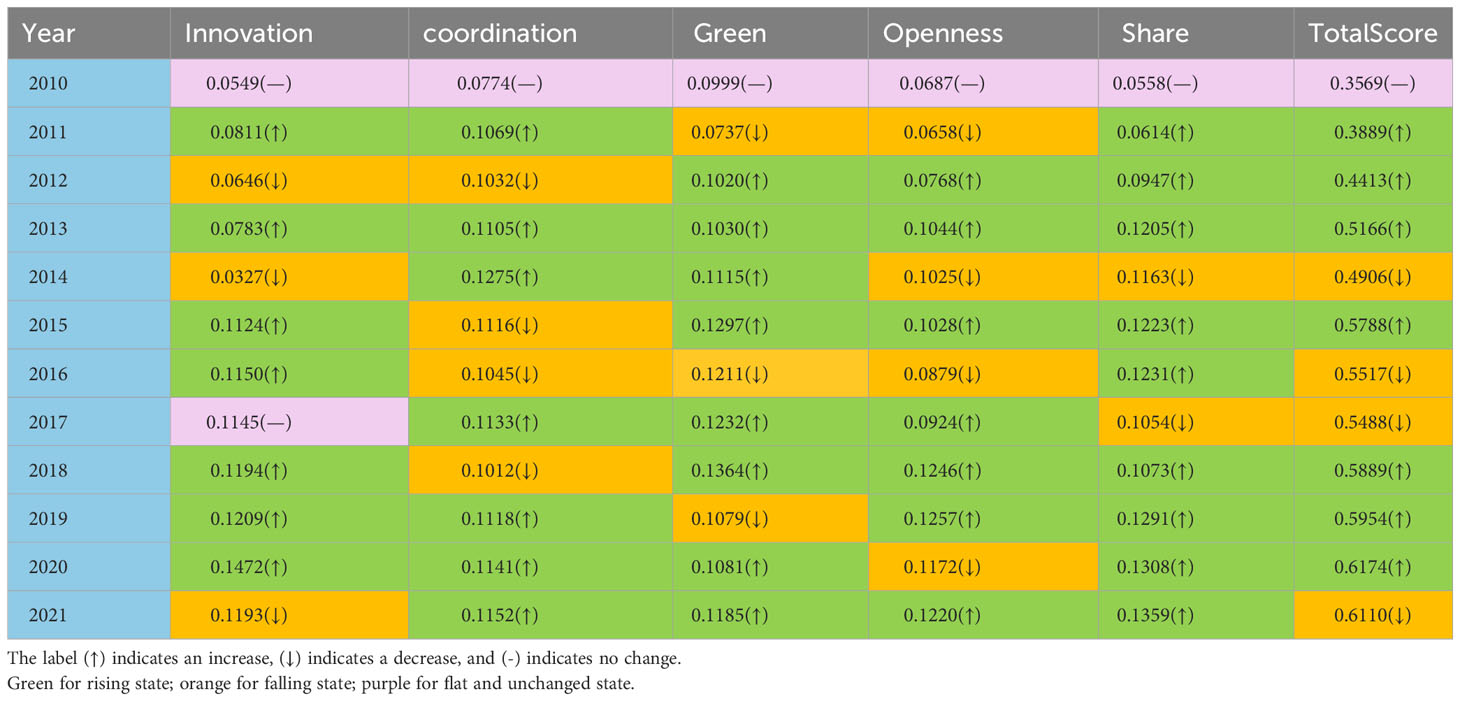
Table 2 Time-ordered changes in the level of sustainable development in Kunming, 2010-2021.
In terms of the dimensions of change of the five concepts, their development shows a fluctuating upward trend. The dimension of “innovation” was 0.0549 in 2010, the lowest value of all dimensions in the same year, and grew to 0.1193 in 2021, an increase of 0.064, a growth rate of 117.2%, an average annual growth rate of 9.7%; the dimension of “coordination” was 0.0774 in 2010, and grew to 0.1152 in 2021, an increase of 0.038, a growth rate of 9.7%; “coordination” dimension was 0.0774 in 2010, increasing to 0.1152 in 2021, with an increase of 0.038, a growth rate of 48.8%, and an average annual growth rate of 10.8%; the “green” dimension was 0.0999 in 2010, the highest of the five dimensions in that year, and in 2021 it increased to The “green” dimension was 0.1185 in 2010, the highest of the five dimensions in that year, and will grow to 0.1185 in 2021, with a growth rate of 18.6% and only 0.0186, the lowest among the five dimensions; the “openness” dimension was 0.069 in 2010, and will grow to 0.122 in 2021, with an increase of 0.053, a growth rate of 77.4%, and an average annual growth rate of 9.9%; The “sharing” dimension was 0.056 in 2010, growing to 0.136 in 2021, an increase of 0.08, for a total growth rate of 143.4%, or 10.9% per year.
In terms of the overall level of development, it was 0.3569 in 2010 and grew to 0.611 in 2021, an increase of 0.254, a growth rate of 71.2%, showing a rapid development of the level of sustainable development in Kunming, with an overall fluctuating upward trend.
4.2 Analysis of the coupled harmonization of sustainable development levels in Kunming City
In this study, based on the coupling coordination degree model, by calculating the coupling degree (C) and the comprehensive coordination index (T) in each year, we finally obtain the coordinated development state (D) in five dimensions from 2010 to 2021, and classify them into four types, including D∈(0,0.3] for low coordination, D∈(0.3,0.5] for medium coordination, D∈(0.5,0.8] for high coordination, and D ∈(0.8,1] for extreme coordination (Liu C. Y. et al., 2018; Qin et al., 2020), and the results are shown in Figure 6. From the figure, it can be seen that the level of coupled and coordinated development in Kunming City was 0.263 in 2010, and grew to 0.349 in 2021, with an increase of 0.086 and a growth rate of 32.7%, which generally shows a shift from a low degree of coordination (2010 to 2014) to a moderate degree of coordination (2015 to 2021), but the degree of coordination of development is still low, with a large potential for development. As the capital city of the province, Kunming still suffers from the problems of weak regional comprehensive strength, unbalanced development of urban and rural areas, low level of urban construction planning and management, and a single mode of economic development, which has led to a low degree of harmonization in the level of sustainable development in Kunming.
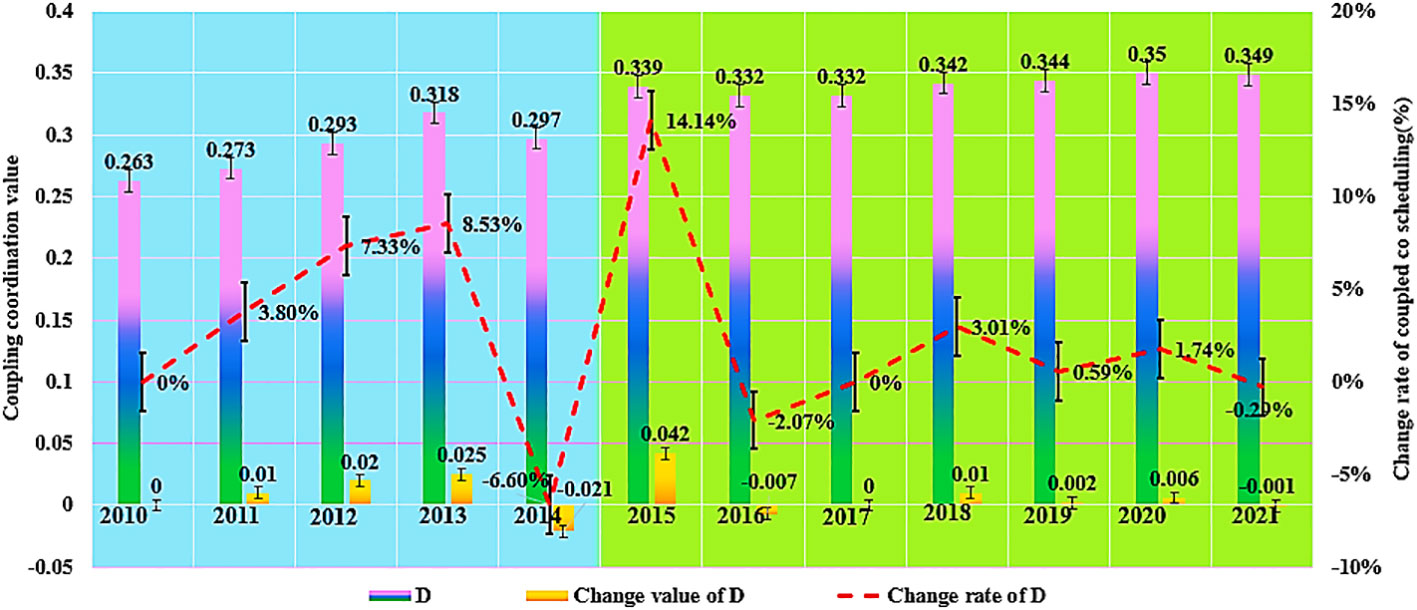
Figure 6 Numerical map of coupled harmonization degree of sustainable development in Kunming City.
4.3 Correlation analysis of sustainable development in Kunming City
Based on the gray correlation model, the correlation coefficient and correlation degree of the sustainable development level of Kunming were calculated. The results are shown in Figure 7.
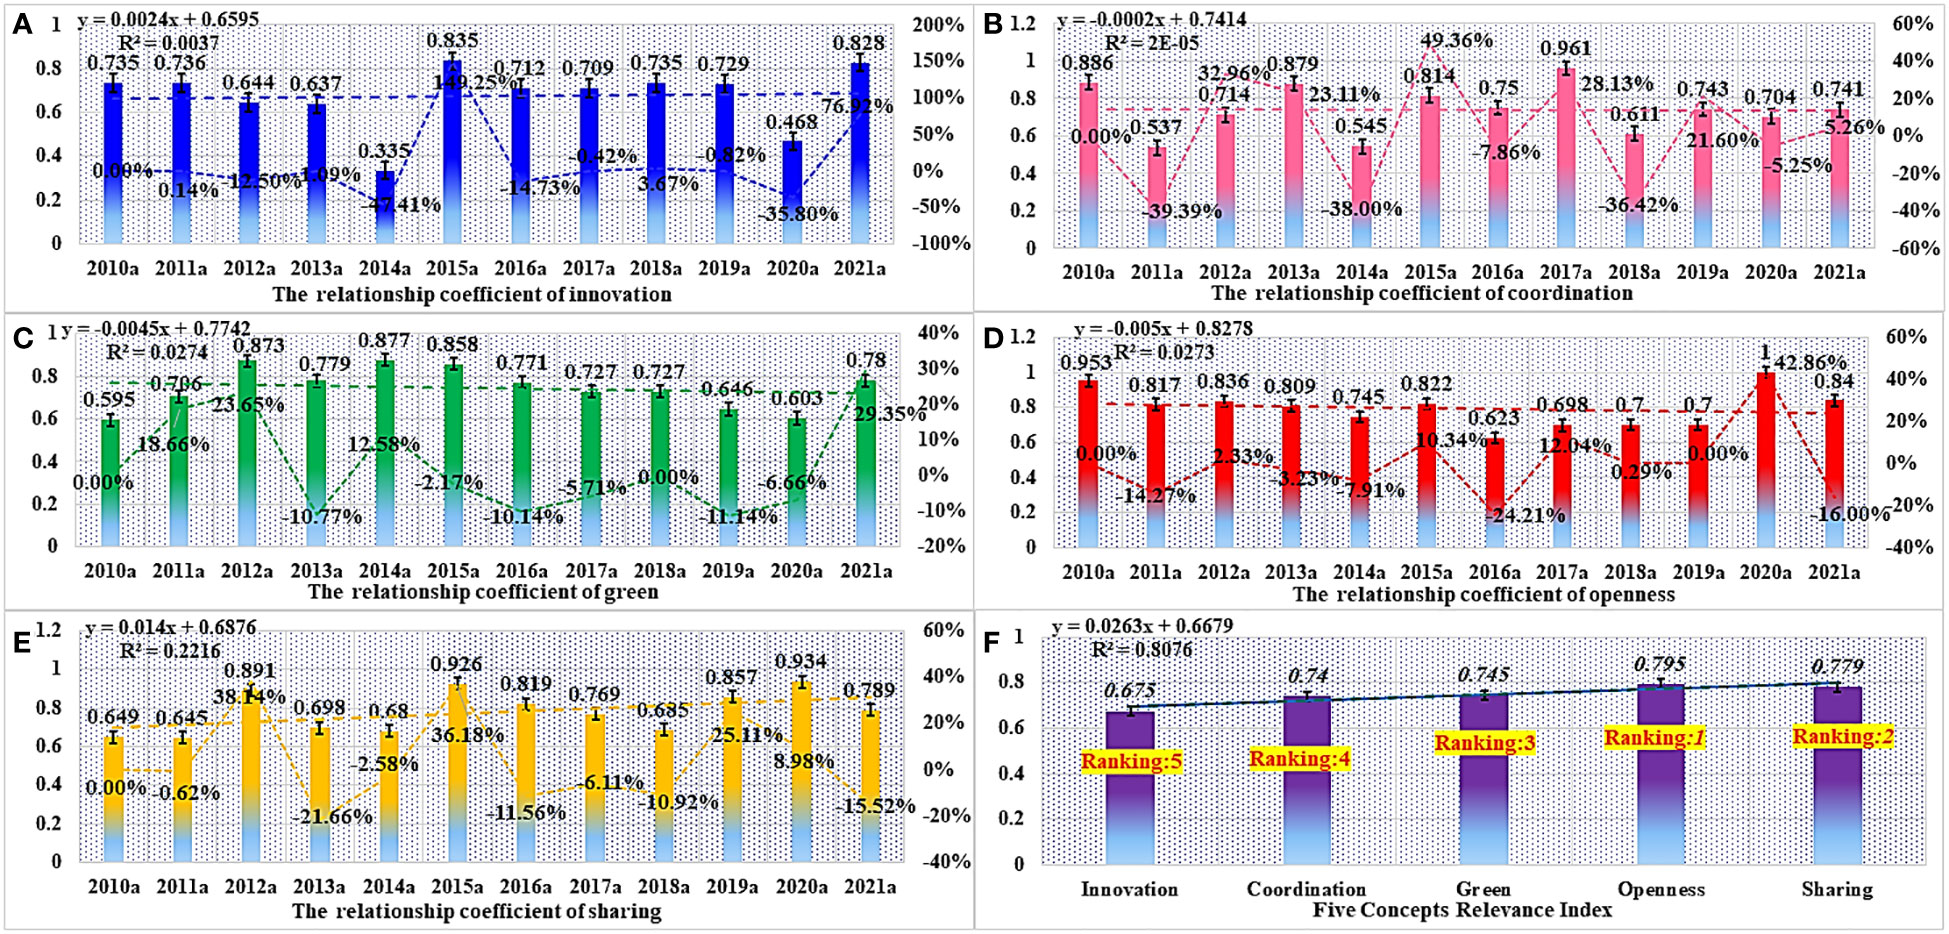
Figure 7 Correlation coefficient and correlation degree of sustainable development in Kunming City. (A) Relevance index of innovation and sustainable development; (B) Relevance index of coordination and sustainable development; (C) Relevance index of green and sustainable development; (D) Relevance index of openness and sustainable development; (E) Relevance index of sharing and sustainable development; and (F) Degree of relevance of the five concepts.
In terms of the correlation coefficient and the degree of correlation of the five development philosophies, they all show a high level. Among them, the correlation degree ranges from 0.675 to 0.795, which indicates that the five philosophies can play an important role in promoting the sustainable development of Kunming. The trend of the correlation coefficient of “innovation” dimension shows a “V” shape, with a comprehensive correlation coefficient of 0.675, ranking fifth among the five development philosophies, which indicates that the correlation coefficient of “innovation” dimension is relatively low compared with other dimensions, but still has an important correlation;The correlation coefficient of the “coordination” dimension is similar to that of the “innovation” dimension, with a low correlation coefficient (0.54) in 2014, and its correlation coefficient for 2010-2021 is 0.74, only 0.065 for the “innovation” dimension, ranking fourth among the five development philosophies;The correlation coefficient of the “green” dimension shows a trend of “rising - then falling - then rising”, with relatively ups and downs in its development, with a peak of 0.877 in 2014, and the correlation coefficient calculated by synthesizing the coefficients is 0.745, higher than that of the “innovation” and “coordination” dimensions at 0.07 and 0.005, ranking third among the five development philosophies; The correlation coefficient of the “openness” dimension from 200 to 2021 shows a stable trend, with the highest and lowest correlation coefficients of 1 and 0.623, respectively, and a relatively high value for the total system, and the correlation coefficient of 2010-2021 is 0.795, which is ranked the first among the five development philosophies, and is the strongest dimension of relevance among the five development philosophies; The correlation coefficient value of the “sharing” dimension is more similar to that of the “openness” dimension, which also shows a stable and high correlation coefficient, with the highest and lowest values of 0.926 in 2015 and 0.645 in 2011, respectively, and a correlation coefficient of 0.779 for the period 2010-2021, which ranks second among the five development philosophies.
In terms of the total correlation development level, the correlation of the five development philosophies contributes to “openness (0.795), sharing (0.779), greenness (0.745), coordination (0.74), and innovation (0.675)” in descending order, and their correlations are relatively close to each other. This shows that the five development philosophies are equally important to the level of sustainable development in Kunming, demonstrating that the new development philosophy play an important role in promoting the improvement of the level of sustainable development.
5 Discussion
5.1 Accelerated development of indicators in each of the five dimensions
Under the goal orientation of the new development philosophy, sustainable urban development should focus on both “quality” and “quantity”, and on both overall and individual improvement. Although the overall sustainable development level of Kunming increases by 0.258 from 2010 to 2021, the rate of increase is 73.09%. However, the level and speed of development of the five dimensions and indicators remain low, with an average annual growth rate of only 7.42%, which is far from the overall level of development. This shows that the dimensions of Kunming City are in a state of slow improvement, and there is a big difference between the overall and individual development. This shows that the overall sustainable development of Kunming City and the development of each dimension have failed to achieve the same level and speed of development, and that the individual development of the five dimensions has been neglected while the overall development has been improved. In the future development approach, we should not only focus on “quality” and “quantity”, but also on the differences between the overall and individual development, implement integrated development policies, and jointly improve the development level and speed of the dimensions of “innovation, coordination, greenness, openness and sharing”.
5.2 Strengthening capacity for coordinated development among the five dimensions
The new development philosophy requires that attention be paid not only to the overall level of sustainable development, but also to the coordinated development between dimensions. Although the overall sustainable development level of Kunming is fair (0.611), the level of coordinated development between dimensions is not satisfactory, and is still at a medium coordinated level (0.349) by 2021. This reveals that the current development of Kunming is not in a healthy state of development, and has not yet achieved coordinated development from the inside out, focusing only on the improvement of the overall level of sustainable development and neglecting the integrated development from the five dimensions. In promoting the coordinated development of all dimensions in the future, Kunming needs to promote the coordinated development of the region in an integrated manner, improve the relevant policy system, strengthen the innovation capacity of the mechanism and system, and take the “type of district policy” featuring more refinement and differentiation as the direction of the development of the regional policy. This will strengthen the capacity for coordinated development between the dimensions of “innovation, coordination, greening, openness and sharing” and realize the coordinated and sustainable development of Kunming.
5.3 Attention to the potential threat to sustainable urban development posed by “negative growth” indicators
Influences on sustainable urban development include both “positive growth” and “negative growth” indicators. In order to promote the sustainable development level of the city, it is necessary to pay attention to the “positive growth” indicators that drive the sustainable development level of the region, and at the same time pay more attention to the potential threats posed by the “negative growth” indicators. Although the overall sustainable development level of Kunming shows a stable trend (0.353-0.611) from 2010 to 2021, the potential threat of “negative growth” indicators in regional development should not be ignored. In the evaluation index system of sustainable development in Kunming (Table 1), there are a number of “negative growth” indicators in the dimensions of “coordination”, “green” and “sharing”. and their weights are relatively high, for example, the weight of the number of public officials in corruption, bribery and malfeasance is 0.0138, the weight of the proportion of people enjoying minimum living standards and the Engel’s coefficient of urban residents is 0.0119, and the weight of the registered unemployment rate in urban areas is 0.0117, which suggests that there are large hidden threats to the level of sustainable development of Kunming City, and that there are strong hidden dangers, which will directly affect the development of Kunming City. Stronger hidden threat, which will directly affect the sustainable development level of the city. In the future, in order to improve the level of sustainable development of the city, we should pay attention to the current “negative growth” indicators in the sustainable development of the city, formulate and implement relevant policies to reduce its percentage, lower the development speed, and avoid the potential threats it brings.
5.4 Further implementation of the new development philosophy to realize high-quality leapfrog development
Development is the “master key” to solving all problems. Looking around the world, the cause of global sustainable development is facing unprecedented challenges. According to statistics, for the first time in 32 years, the Human Development Index has declined for two consecutive years to the 2016 level. Poverty and hunger are worsening, development inequality continues to widen, and upgrading the level of sustainable development is increasingly becoming a top priority for regional development nowadays. As the center of political, economic, cultural, and social development in Yunnan Province, Kunming occupies a central position in the province’s strategic development. However, regional development still shows a weak foundation for innovation, unbalanced and insufficient coordination, grim situation of green development, weak capacity for openness, synergy and linkage, and uneven sharing, which indicates that there are still various problems and obstacles to sustainable development in Kunming. In order to further implement the new development philosophy and realize high-quality leapfrog development, Kunming should firstly implement the innovation-driven development strategy, strengthen science and technology open cooperation, actively participate in the global and national innovation network, focus on the short boards of innovation, broaden the channels and modes of cooperation, and integrate the innovation resources in a wider scope, so as to inject new kinetic energy for the high-quality leapfrog development; Secondly, we will focus on solving the problem of unbalanced and insufficient development, enhancing the overall coordination of development, consolidating and expanding the results of poverty alleviation, and comprehensively promoting the strategy of rural revitalization; furthermore, we will insist on taking the road of ecological priority and green development, improve the quality of the ecological environment, push forward the protection and restoration of the ecosystem and ecological environmental governance, achieve the goal of “double carbon”, and build a beautiful Kunming where human beings and nature can live in harmony; in addition, continue to promote a higher level of opening up to the outside world, accelerate the construction of infrastructure “hard connectivity” and institutional “soft connectivity”, break down the barriers between the various elements in the international circulation system, and promote the construction of radiation centers facing South Asia and Southeast Asia to make new progress; Finally, practicing the people-centered development ideology, we will promote quality sharing of public service resources in key livelihood areas such as education and medical care, so that the fruits of reform and development will benefit all people in a greater and more equitable manner.
6 Conclusion
Based on the new development philosophy and the SDGs, this study constructs an urban sustainable development assessment system, and takes Kunming, a plateau lakeside city, as the study area, to assess the level of sustainable development, the degree of coupling and coordination, and the degree of relevance of Kunming, and to illustrate the process of localization and application of the constructed urban sustainable development assessment system. It is found that the overall level of sustainable development in Kunming City is at a medium level and shows a fluctuating upward trend; the development level of all dimensions is relatively low, and although all dimensions show an upward trend, the development speed is slow; The coupling coordination among the dimensions of sustainable development in Kunming has experienced a transition from low coordination to medium coordination and has shown a steady improvement, but the coordination degree is still at a low level. The degree of contribution of the five dimensions to the overall level of sustainable development in Kunming City is, in descending order, openness, sharing (0.779), greenness (0.745), coordination (0.740) and innovation (0.675), and the five dimensions have comparable contributions to the sustainable development of Kunming City. This study constructs a sustainable development index assessment system for highland lakeside cities, scientifically and accurately quantitatively evaluates the level of regional sustainable development based on the proposed game-theoretic subjective and objective combination of empowerment methods, and explores the degree of coordination and the degree of association of various dimensions through the coupled coordination and gray correlation models. The research results provide theoretical support and methodological paths for how to scientifically and accurately quantitatively evaluate the effectiveness of promoting the new development concept in the region, enriching and expanding the theoretical system of sustainable development, which is of certain reference significance for promoting the coordinated sustainable development of the region.
Data availability statement
The original contributions presented in the study are included in the article/supplementary material. Further inquiries can be directed to the corresponding authors.
Author contributions
YL: Conceptualization, Funding acquisition, Project administration, Writing – original draft, Writing – review & editing. TJ: Data curation, Funding acquisition, Methodology, Supervision, Writing – original draft, Writing – review & editing. AL: Data curation, Methodology, Writing – original draft. KY: Conceptualization, Supervision, Writing – review & editing. XP: Data curation, Visualization, Writing – original draft. CP: Data curation, Writing – original draft. RC: Data curation, Writing – original draft. DL: Data curation, Writing – original draft. QW: Data curation, Writing – original draft.
Funding
The author(s) declare financial support was received for the research, authorship, and/or publication of this article. This work was supported by the Yunnan Province Innovation Team Project (202305AS350003); National Natural Science Foundation of China (42271441); 2023 Graduate Research Innovation Fund, Yunnan Normal University(YJSJJ23-A23).
Conflict of interest
The authors declare that the research was conducted in the absence of any commercial or financial relationships that could be construed as a potential conflict of interest.
Publisher’s note
All claims expressed in this article are solely those of the authors and do not necessarily represent those of their affiliated organizations, or those of the publisher, the editors and the reviewers. Any product that may be evaluated in this article, or claim that may be made by its manufacturer, is not guaranteed or endorsed by the publisher.
Supplementary material
The Supplementary Material for this article can be found online at: https://www.frontiersin.org/articles/10.3389/fevo.2023.1291462/full#supplementary-material
References
Abu-Rayash A., Dincer I. (2023). Development of an integrated sustainability model for resilient cities featuring energy, environmental, social, governance and pandemic domains. Sustain. Cities Soc. 92, 104439. doi: 10.1016/j.scs.2023.104439
Alshuwaikhat H. M., Adenle Y. A., Alotaishan T. N. (2023). The development of a grey relational analysis-based composite index for environmental sustainability assessment: Towards a net-zero emissions strategy in Saudi Arabia. Heliyon 9 (7), e18192. doi: 10.1016/j.heliyon.2023.e18192
Arthington A. H., Dulvy N. K., Gladstone W., Winfield I. J. (2016). Fish conservation in freshwater and marine realms: Status, threats and management. Aquat. Conserv. Marine Freshw. Ecosyst. 26 (5), 838–857. doi: 10.1002/aqc.2712
Bai X. M., Shi P. J., Liu Y. S. (2014). Realizing China’s urban dream. Nature 509 (1799), 158–160. doi: 10.1038/509158a
Cao M., Chen M., Zhang J., Pradhan P, Guo H, Fu B, et al. (2023). Spatio-temporal changes in the causal interactions among Sustainable Development Goals in China. Humanit. Soc. Sci. Commun. 10, 450. doi: 10.1057/s41599-023-01952-z
Chen J., Peng S., Zhao X., Yuejing G. E, Zhilin L. I. (2019). Measuring regional progress towards SDGs by combining geospatial and statistical information. Acta Geodaetica Cartographica Simica 48 (4), 473–479. doi: 10.11947/j.AGCS.2019.20180563
Chen J., Wang L. J., Li Y. Y. (2020). Research on the impact of multi-dimensional urbanization on China’s carbon emissions under the background of COP21. J. Environ. Manage. 273 (11), 111123. doi: 10.1016/j.jenvman.2020.111123
Chung M. G., Frank K. A., Pokhrel Y., Dietz T., Liu J. G. (2021). Natural infrastructure in sustaining global urban freshwater ecosystem services. Nat. Sustain. 4 (12), 1068. doi: 10.1038/s41893-021-00786-4
CPC Lincang Municipal Committee, Lincang Municipal People’s Government. (2019). Lincang city sustainable development plan, (2018-2030). Lincang.
Dokulil M. (2014). Predicting summer surface water temperatures for large Austrian lakes in 2050 under climate change scenarios. Hydrobiologia 731 (1), 19–29. doi: 10.1007/s10750-013-1550-5
Edeline E., Groth A., Cazelles B., Claessen D., Winfield I. J., Ohlberger J., et al. (2016). Pathogens trigger top-down climate forcing on ecosystem dynamics. Oecologia 181 (2), 519–532. doi: 10.1007/s00442-016-3575-8
Estoque R. C., Murayama Y. (2016). Quantifying landscape pattern and ecosystem service value changes in four rapidly urbanizing hill stations of Southeast Asia. Landscape Ecol. 31 (7), 1481–1507. doi: 10.1007/s10980-016-0341-6
Gao J., O’Neill B. C. (2020). Mapping global urban land for the 21st century with data-driven simulations and Shared Socioeconomic Pathways. Nat. Commun. 11 (1), 2302. doi: 10.1038/s41467-020-15788-7
Giuliani G., Mazzetti P., Santoro M., Nativi S., Van Bemmelen J., Colangeli G., et al (2020). Knowledge generation using satellite earth observations to support sustainable development goals (SDG): A use case on Land degradation. Int. J. Appl. Earth Obs. Geoinf. 88, 102068. doi:10.1016/j.jag.2020.102068
Han D. N., Yu D. Y., Qiu J. X. (2023). Assessing coupling interactions in a safe and just operating space for regional sustainability. Nat. Commun. 14 (1), 1369. doi: 10.1038/s41467-023-37073-z
Ho L. T., Goethals P. L. M. (2019). Opportunities and challenges for the sustainability of lakes and reservoirs in relation to the sustainable development goals (SDGs). Water 11 (7), 1462. doi: 10.3390/w13223207
Hong T., Yu N. N., Mao Z. G., Zhang S. H. (2021). Government-driven urbanization and its impact on regional economic growth in China. Cities 117 (6), 103299. doi: 10.1016/j.cities.2021.103299
Horn P., Grugel J. (2017). The SDGs in middle-income countries: setting or serving domestic development agendas? Evid. Ecuador World Dev. 109, 73–84. doi: 10.1016/j.worlddev.2018.04.005
Hu Y. (2010). Research on the theory and evaluation model of sustainable development of highland lake basin (Kunming: Kunming University of Science and Technology).
Hu Z. G., Wu Q., Li J. (2023). The localization of SDGs in China: System construction, status assessment and development reflection. Ecol. Indic. 154, 110514. doi: 10.1016/j.ecolind.2023.110514
Huang R. (2023). SDG-oriented sustainability assessment for Central and Eastern European countries. Environ. Sustain. Indic. 19, 100268. doi: 10.1016/j.indic.2023.100268
Huang Y., Liu H. X., Hinkel K., Yu B. L., Beck R., Wu J. P. (2017). Analysis of thermal structure of arctic lakes at local and regional scales using in situ and multidate Landsat-8 data. Water Resour. Res. 53 (11), 9642–9658. doi: 10.1002/2017WR021335
Jedwab R., Vollratb D. (2015). Urbanization without growth in historical perspective. Explor. Econ. History 58 (10), 1–21. doi: 10.1016/j.eeh.2015.09.002
Keesstra S., Mol G., de Leeuw J., Okx J., Molenaar C., de Cleen M., et al. (2018). Soil-related sustainable development goals: Four concepts to make land degradation neutrality and restoration work. Land 7 (4), 133. doi: 10.3390/land7040133
Kim R. E. (2023). Augment the SDG indicator framework. Environ. Sci. Policy 142, 62–67. doi: 10.1016/j.envsci.2023.02.004
Kingma D. P., Ba J. (2014). Adam: A method for stochastic optimization. Comput. Sci. 1–15. doi: 10.48550/arXiv.1412.6980
Liu T., Deng Y., Chan F. (2018). Evidential supplier selection based on DEMATEL and game theory. Int. J. Fuzzy Syst. 20 (4), 1321–1333. doi: 10.1007/s40815-017-0400-4
Liu Y., Huang B., Guo H., et al. (2023). A big data approach to assess progress towards Sustainable Development Goals for cities of varying sizes. Commun. Earth Environ. 4, 66. doi: 10.1038/s43247-023-00730-8
Liu C. Y., Liu Y. Y., Ding R. G. (2018). Coupling analysis between new-type urbanization and ecological environment in Fujian Province, China. Chin. J. Appl. Ecol. 29 (9), 3043–3050. doi: 10.13287/j.1001-9332.201809.017
Mannina G., Cosenza A., Viviani G. (2017). Micropollutants throughout an integrated urban drainage model: Sensitivity and uncertainty analysis. J. Of Hydrol. 554, 397–405. doi: 10.1016/j.jhydrol.2017.09.026
Marzouk M., Elshaboury N., Azab S., Megahed A., Metawie M. (2022). Assessment of COVID-19 impact on sustainable development goals indicators in Egypt using fuzzy analytic hierarchy process. Int. J. Disaster Risk Reduct. 82, 103319. doi: 10.1016/j.ijdrr.2022.103319
McDonald R. I., Mansur A. V., Ascensão F., Colbert M., Crossman K., Elmqvist T., et al. (2020). Research gaps in knowledge of the impact of urban growth on biodiversity. Nat. Sustain. 3 (1), 16–24. doi: 10.1038/s41893-019-0436-6
Meuleman L., Niestroy I. (2015). Common but differentiated governance: a meta-governance approach to make the SDGs work. Sustainability 7 (9), 12295–12321. doi: 10.3390/su70912295
Michael F. L., Noor Z. Z., Figueroa M. J. (2014). Review of urban sustainability indicators assessment-Case study between Asian countries. Habitat Int. 44, 491–500. doi: 10.1016/j.habitatint.2014.09.006
Mollier L., Seyler F., Chotte J. L., Ringler C. (2017). A guide to SDG interactions: from science to implementation (Paris: International Council for Science). Available at: https://horizon.documentation.ird.fr/exl-doc/pleins_textes/divers17-10/010070607.pdf.
National Key Research and Development Program of China. (2022). “Dynamic cognition and assessment technology of urban development state supported by big data,” in Group. Shenzhen Sustainable Development Assessment Report 2016-2021. Shenzhen University.
Ndeketeya A., Dundu M. (2023). Urban rainwater harvesting adoption potential in a socio-economically diverse city using a GIS-based multi-criteria decision method. Water Resour. Manage 37, 835–850. doi: 10.1007/s11269-022-03407-7
Nilsson M., Griggs D., Visbeck M. (2016). Map the interactions between sustainable development goals. Nature 534 (7607), 320–322. doi: 10.1038/534320a
Qin Q., Hu Z. L., Liu A. L. (2020). Temporal and spatial variation of permeability coefficient of seasonal frozen soil in Western Sichuan. World Reg. Stud. 29 (6), 1272–1283.
Ren L., Wang Y. Q., Zhang W. Y., Yang H. K., Wang H. X., Wei J., et al. (2022). Characterizing wind fields at multiple temporal scales: A case study of the adjacent sea area of Guangdong-Hong Kong-Macao Greater Bay Area. Energy Rep. 8 (14), 212–223. doi: 10.1016/j.egyr.2022.11.005
Reynaud A., Lanzanova D. (2017). A global meta-analysis of the value of ecosystem services provided by lakes. Ecol. Econ. 137, 184–194. doi: 10.1016/j.ecolecon.2017.03.001
Sachs J. D., Schmidt-Traub G., Mazzucato M., Messner D., Nakicenovic N., Rockstrom J. (2019). Six transformations to achieve the sustainable development goals. Nat. Sustain. 2 (9), 805–814. doi: 10.1038/s41893-019-0352-9
SDSN. (2018). 2018 SDG index and dashboards report (Paris: Sustainable Development Solutions Network), 103. Available at: http://www.Indiaenvironmentportal.org.in/content/457355/the-2018-sdg-index-and-dashboards-report/.
Shaker R. R., Sirodoev I. G. (2016). Assessing sustainable development across Moldova using household and property composition indicators. Habitat Int. 55, 192–204. doi: 10.1016/j.habitatint.2016.03.005
Stauropoulou A., Sardianou E., Malindretos G., Evangelinos K., Nikolaou I. (2023). The effects of economic, environmentally and socially related SDGs strategies of banking institutions on their customers’ behavior. World Dev. Sustain. 2, 100051. doi: 10.1016/j.wds.2023.100051
Su Y., Dong X., Li Y., Hong Q., Flower R. (2023). Optimizing safe and just operating spaces at sub-watershed scales to guide local environmental management. J. Clean. Prod. 398, 136530. doi: 10.1016/j.jclepro.2023.136530
Sun M., Hu J., Chen X., Lü Y., Yang L. (2022). Comparison of five models for estimating the water retention service of a typical alpine wetland region in the Qinghai–Tibetan Plateau. Remote Sens. 14, 6306. doi: 10.3390/rs14246306
Sun Z. C., Jiang H. P., Guo H. D., Xing Q., Zhang H. S., Ma Y. X., et al. (2022). Projections of urban built-up area expansion and urbanization sustainability in China’s cities through 2030. J. Clean. Prod. 367, 133086. doi: 10.1016/j.jclepro.2022.133086
Sun Z., Zhao B., Qin A., Zhu K. (2022). Evaluation of sustainable development of rural tourism in ecologically fragile as an example. Ecol. Econ. 38, 3.
UN Water. (2016). Water and Sanitation Interlinkages across the 2030 Agenda for Sustainable Development (Geneva Switzerland: UN Water). Available at: http://www.Indiaenvironmentportal.org.in/content/434924/water-and-sanitation-interlinkages-across-the-2030-agenda-for-sustainable-development/.
Veldkamp T. I. E., Wada Y., Aerts J. C. J. H., Doell P., Gosling S. N., Liu J., et al. (2017). Water scarcity hotspots travel downstream due to human interventions in the 20th and 21st century. Nat. Commun. 8, 15697. doi: 10.1038/ncomms15697
Wang J. (2015). Study on the living environment of ecological sensitivity evaluation and space optimization in plateau lake basins-The YiLong lake as an example (Kunming: Yunnan University).
Wu X. F., Huang X. (2023). Screening of urban environmental vulnerability indicators based on coefficient of variation and anti-image correlation matrix method. Ecol. Indic. 150, 110196. doi: 10.1016/j.ecolind.2023.110196
Xu L. K., Ouyang W. Y., Qian Y. Y., Su C., Su J. Q., Chen H. (2016). High-throughput profiling of antibiotic resistance genes in drinking water treatment plants and distribution systems. Environ. pollut. 213, 119–126. doi: 10.1016/j.envpol.2016.02.013
Yang K., Luo Y., Chen K. X., Yang Y., Shang C. X., Yu Z. Y., et al. (2020). Spatial–temporal variations in urbanization in Kunming and their impact on urban lake water quality. Land Degrad. Dev. 31 (11), 1392–1407. doi: 10.1002/ldr.3543
Yang K., Yu Z. Y., Luo Y., Zhou X. L., Shang C. X. (2019). Spatial-temporal variation of lake surface water temperature and its driving factors in Yunnan-Guizhou Plateau. Water Resour. Res. 55 (6), 4688–4703. doi: 10.1029/2019WR025316
Yin H. Y., Xiao R., Fei X. F., Zhang Z. H., Gao Z., Wan Y., et al. (2023). Analyzing “economy-society-environment” sustainability from the perspective of urban spatial structure: A case study of the Yangtze River delta urban agglomeration. Sustain. Cities Soc. 96, 104691. doi: 10.1016/j.scs.2023.104691
Zhong C., Guo H. J., Swan I., Gao P., Yao Q. X., Li H. (2023). Evaluating trends, profits, and risks of global cities in recent urban expansion for advancing sustainable development. Habitat Int. 138, 102869. doi: 10.1016/j.habitatint.2023.102869
Keywords: new development philosophy, plateau lakeside city, sustainable urban development, Kunming City, game theory
Citation: Luo Y, Jia T, Li A, Yang K, Pei X, Peng C, Chen R, Li D and Wang Q (2023) Evaluation method of sustainable development of plateau lakeside cities under the perspective of new development philosophy and its empirical research. Front. Ecol. Evol. 11:1291462. doi: 10.3389/fevo.2023.1291462
Received: 09 September 2023; Accepted: 30 October 2023;
Published: 05 December 2023.
Edited by:
Changchun Huang, Nanjing Normal University, ChinaReviewed by:
Hanxi Wang, Harbin Normal University, ChinaJun Yang, Liaoning Normal University, China
Bao-Jie He, Chongqing University, China
Copyright © 2023 Luo, Jia, Li, Yang, Pei, Peng, Chen, Li and Wang. This is an open-access article distributed under the terms of the Creative Commons Attribution License (CC BY). The use, distribution or reproduction in other forums is permitted, provided the original author(s) and the copyright owner(s) are credited and that the original publication in this journal is cited, in accordance with accepted academic practice. No use, distribution or reproduction is permitted which does not comply with these terms.
*Correspondence: Tingfang Jia, amlhdGluZ2ZhbmdAeW5udS5lZHUuY24=; Kun Yang, a21kY3ludUAxNjMuY29t
†These authors have contributed equally to this work and share first authorship