 Hiu Yan Yu
 Ka Hou Chu
 Ling Ming Tsang
 Ka Yan Ma
- 1Simon F. S. Li Marine Science Laboratory, School of Life Sciences, The Chinese University of Hong Kong, Hong Kong, Hong Kong SAR, China
- 2Southern Marine Science and Engineering Guangdong Laboratory (Guangzhou), Guangzhou, China
- 3Southern Marine Science and Engineering Guangdong Laboratory (Zhuhai), State Key Laboratory of Biocontrol, School of Ecology, Shenzhen Campus of Sun Yat-sen University, Shenzhen, China
Introduction: The phylogenetic relationships within Pancrustacea (including Crustacea and Hexapoda) remain elusive despite analyses using various molecular data sets and analytical approaches over the past decade. The relationship between the major lineages of Allotriocarida, which includes Hexapoda, the most species-rich animal taxon, is particularly recalcitrant.
Methods: To investigate and resolve the root of phylogenetic ambiguity in Pancrustacea, we re-evaluated the evolutionary relationships of major pancrustacean clades using a phylogenetically informed orthology approach and assessed the effect of systematic errors, with a major focus on long branch attraction (LBA) and incomplete lineage sorting (ILS). A data set comprising 1086 orthologs from 106 species representing all major extant classes of pancrustaceans was assembled and used in gene tree and species tree construction after various filtering processes.
Results and discussion: Regardless of the filtering criteria and phylogenetic analyses, the resulting trees consistently supported (1) a sister relationship of Remipedia and Hexapoda (hence rejecting the monophyly of Xenocarida, i.e. Remipedia + Cephalocarida), and (2) refuted the monophyly of Multicrustacea, as Copepoda is either sister to or nested within Allotriocarida. Examination of gene trees reveals that the grouping of Multicrustacea and Xenocarida in previous phylogenetic studies may represent LBA artefacts. Phylogenetic signal analyses suggest a low resolution and an incidence of strong conflicting signals at the deep splits. Further analyses indicate a partial contribution of incomplete lineage sorting (ILS) to the contradictory signal in the allotriocaridan phylogeny, leading to limited support for any potential relationships between Branchiopoda, Cephalocarida and Copepoda. This study suggests the need for further examination of other potential sources of signal discordance, such as introgression and gene tree estimation error to fully understand the evolutionary history of Pancrustacea.
1 Introduction
Pancrustacea, which comprises Hexapoda nested within Crustacea, is the most diverse group of organisms on earth, found in most terrestrial and aquatic environments. Over 1,236,000 pancrustacean species from 55 orders of Crustacea and 31 orders of Hexapoda have been recorded (Bracken-Grissom and Wolfe, 2020). They exhibit remarkable diversity in morphology and size, from microscopic copepods to spider crabs, the largest arthropod. Due to their ecological and economic significance, many attempts have been made to resolve the evolutionary relationship of Pancrustacea, especially regarding the origin of the terrestrial clade Hexapoda (Regier et al., 2008; Regier et al., 2010; Oakley et al., 2013; von Reumont et al., 2014; Schwentner et al., 2017; Schwentner et al., 2018).
With the advent of DNA sequencing technology, molecular phylogenetics has dramatically improved the resolution of the relationship between and within Hexapoda + Crustacea. The nesting of Hexapoda within Crustacea is commonly revealed by recent molecular and morphological analyses (Meusemann et al., 2010; Andrew, 2011; Rota-Stabelli et al., 2011; Borner et al., 2014; Dell’Ampio et al., 2014; Lozano-Fernandez et al., 2016; Bernot et al., 2023). Within Pancrustacea, most phylogenomic and morphological analyses supported three major lineages: Oligostraca as the earliest diverging clade (including classes Branchiura, Mystacocarida, Ostracoda and Pentastomida), and two sister clades (Regier et al., 2010; Von Reumont et al., 2012; Oakley et al., 2013; Schwentner et al., 2017; Schwentner et al., 2018; Lozano-Fernandez et al., 2019), namely Allotriocarida (including classes Branchiopoda, Cephalocarida, Remipedia, and subphylum Hexapoda) (Lee et al., 2013; Lozano-Fernandez et al., 2016; Schwentner et al., 2017) and Multicrustacea (including classes Malacostraca, Copepoda and Thecostraca) (Meusemann et al., 2010; Andrew, 2011; Lee et al., 2013; Oakley et al., 2013; Eyun, 2017; Schwentner et al., 2017).
Nonetheless, some phylogenetic conflicts remain difficult to resolve. For instance, a few molecular studies challenged the monophyly of Allotriocarida. Four studies using protein-coding genes inferred a paraphyletic Multicrustacea with Copepoda sister to or nested within Allotriocarida using site-heterogeneous models (Rota-Stabelli et al., 2013; Schwentner et al., 2017; Schwentner et al., 2018; Lozano-Fernandez et al., 2019), and two studies recovered Branchiopoda or Cephalocarida grouping with Multicrustacea using smaller gene sets (with 62 protein-coding genes) (Regier et al., 2010; Rota-Stabelli et al., 2013). Notably, at the time of our study, Bernot et al. (2023) reported a phylogenomic study on Pancrustacea, which presented Copepoda + Allotriocarida as the primary hypothesis as this relationship was recovered in most of the inferred trees, not just when employing site-heterogenous models. Furthermore, despite the current employment of genome-scale matrices of 244 to 2,718 loci, the particularly contentious deep-level phylogeny within Allotriocarida remains elusive. Various competing hypotheses have been proposed regarding the position of every class in Allotriocarida. The long-debated sister taxon of hexapods has been revealed to be different allotriocaridan members in different analyses, including Remipedia (Von Reumont et al., 2012; Oakley et al., 2013; Schwentner et al., 2017; Schwentner et al., 2018), Branchiopoda (Glenner et al., 2006; Meusemann et al., 2010; Andrew, 2011; Rota-Stabelli et al., 2011; Borner et al., 2014; Dell’Ampio et al., 2014; Lozano-Fernandez et al., 2016), Branchiopoda + Copepoda (Rota-Stabelli et al., 2013) and Xenocarida (Cephalocarida + Remipedia) (Regier et al., 2010; Schwentner et al., 2017). On the other hand, a multispecies coalescent (MSC) study discovered a rare grouping of Remipedia clustering within paraphyletic Hexapoda (Freitas et al., 2018).
These conflicts may be due to systematic errors. Although genome-scale analyses minimise stochastic errors stemming from small samples, the growth in phylogenetic data sizes aggravates non-random systematic errors and the associated phylogenetic noises (Jeffroy et al., 2006), often resulting in spurious and contradictory phylogenies with high statistical support (Delsuc et al., 2005; Kumar et al., 2012; Brown and Thomson, 2016). Two main factors can cause systematic errors in phylogenetic reconstruction: biological factors such as incomplete lineage sorting (ILS) and horizontal gene transfer, and methodological factors like paralogy, incomplete taxon sampling (such as a limited number of genes) long branch attraction (LBA), and model misspecification. It is noteworthy that the impact of incomplete taxon sampling can be considered to be both methodological (e.g., limited genetic material leading to biased and inaccurate phylogenetic inference) and biological factors (e.g. increased variation in single gene history) (Hedtke et al., 2006; Townsend and Lopez-Giraldez, 2010; Townsend and Leuenberger, 2011, Nabhan and Sarkar, 2012).
These errors can occur due to model misspecification when the framework used to infer evolutionary relationships (phylogenetic trees) does not accurately reflect the true evolutionary process. The signals that stem from systematic errors are non-phylogenetic signals (Baurain et al., 2007; Philippe et al., 2011). To achieve a correct phylogenetic tree, it is necessary to increase the ratio of phylogenetic to non-phylogenetic signals (by reducing non-phylogenetic signals) in data sets. In pancrustaceans, the phylogenetic position of Allotriocarida was found to be sensitive to various strategies alleviating systematic errors in different genome-scale analyses, often with a specific focus on LBA, including taxon deletion experiments, different orthology approaches and choosing realistic substitution models, but how various systematic errors affect the inference of pancrustacean phylogeny have not been fully explored. In the latest phylogenomic analysis by Bernot et al. (2023), the primary focus is on the impact of taxon sampling on phylogenetic relationships. Their study suggests incomplete taxon sampling can induce spurious and unusual relationships in Pancrustacea. For example, their matrices of reduced taxon sampling (Data set 1, Figure 3) recovered Xenocarida and Copepoda + Hexapoda. However, the impact of taxa/clades in Pancrustacea with exceptionally long branch on phylogenetic inference still remains a long-standing question.
Of particular concern is LBA, which is a systematic error that can cause erroneously grouping of distantly related lineages. The incidence of multiple fast-evolving lineages typically engenders this phenomenon (Lartillot et al., 2007). Phylogenies have been identified to be distorted by the accelerated rates of evolution in sites, genes and clades (Felsenstein, 1978; Philippe, 2000; Bapteste et al., 2008). In Pancrustacea, LBA was found to result in the controversial grouping of Xenocarida (Remipedia and Cephalocarida) in Allotriocarida in some phylogenetic analyses (Schwentner et al., 2017; Schwentner et al., 2018; Lozano-Fernandez et al., 2019). However, no further investigation of LBA-induced erroneous groupings has been conducted. To elucidate the impact of LBA on conflicting pancrustacean phylogenies, an in-depth examination of the scale of fast-evolving lineages, followed by the employment of practices to avoid LBA errors, is needed.
The recognition of Xenocarida as an LBA artefact is far from reconciling the above-described topological incongruence in Allotriocarida. The ongoing recovery of contradictory hypotheses resulting from understudied systematic errors remains a main predicament in resolving internal patterns of Allotriocarida. Most of the proposed topologies were well-supported by bootstrap values. Still, it is insufficient to evaluate the source of topological discordance and to compare the underlying phylogenetic support between competing hypotheses. Nonetheless, no extra measure of examining the underlying disagreement among loci (i.e., quantify support from the phylogenetic signals) and topologies have been performed in pancrustacean phylogenetics, thus limiting further discussion and understanding of the true evolutionary history of this group. To resolve and investigate the controversial branches like deep divergences of Allotriocarida and the impact of systematic errors like LBA on topological incongruence, two approaches have been proposed, including dissecting the distribution of phylogenetic signals (gene-wise log-likelihood scores) and quantifying genealogical concordance (gene and site concordance factors; gCF and sCF) (Shen et al., 2017; Sayyari et al., 2018; Minh et al., 2020).
Past pancrustacean phylotranscriptomic and phylogenomic analyses capitalised on high-throughput sequencing technologies to increase the number of phylogenetic markers employed in species tree constructions. However, boosting the number of molecular markers is not likely to improve species tree reconstruction without accurate ortholog identification. Most of the phylogenomic studies of this group were restricted to distance-based orthology inference (Oakley et al., 2013; Schwentner et al., 2017; Schwentner et al., 2018; Lozano-Fernandez et al., 2019), which is prone to paralog inclusion (i.e., low specificity) (Altenhoff et al., 2012; Tekaia, 2016). With erroneously assigned paralog sequences in putative orthogroups, the data set incorrectly includes phylogenetic information about gene family history informed by paralogs (Struck, 2013). Consequently, the signal of speciation history from orthologs is confounded, leading to inaccurate tree topologies (Kocot et al., 2013). By leveraging on the phylogenetic information from the putative orthogroups, the graph-based (graph clustering algorithm is used to identify clusters of orthologs by using pairwise similarities between sequences) + tree-based (utilises phylogenetic trees constructed from gene or protein sequences to identify monophyletic groups, i.e., putative orthologs) approach shows a much higher specificity in ortholog identification, lowering the chance of paralog inclusion and biased phylogenetic tree construction (Chen et al., 2007; Gabaldón, 2008; Altenhoff and Dessimoz, 2009). A tree-based orthology approach is therefore required to unravel the phylogenetic relationship of Pancrustacea accurately.
Before a credible Pancrustacea phylogeny can be achieved, it is necessary to understand the processes that cause topological incongruence across phylogenomic studies, particularly regarding the relationships between major lineages of Allotriocarida. In this study, we examined the effect of various systematic errors on phylogenetic analyses of Pancrustacea, with emphasis on Allotriocarida. A phylogenomic data set with 106 taxa representing major lineages of all described living Pancrustaceans was assembled in the present study. Concatenation and coalescent-based species tree analyses were employed to recover a well-supported Pancrustacea phylogeny. Various measures were taken to identify and mitigate the effects of systematic errors (e.g. ortholog identification, missing data, LBA, ILS, model selection) to infer the most robust backbone phylogeny for Pancrustacea classes to date.
2 Materials and methods
2.1 Taxon sampling and data acquisition
We collected 37 well-assembled genomes, 27 transcriptomes and 42 sets of RNA-seq raw read data from 101 pancrustaceans with five outgroups, representing all major extant classes in the group. These included 11 species of Branchiopoda, two of Cephalocarida, 12 of Copepoda, 21 of Hexapoda, two of Hoplocarida, 17 of Malacostraca, 11 of Oligostraca, 13 of Peracarida, one of Phyllocarida, four of Remipedia and seven of Thecostraca, plus outgroups comprising two chelicerates and three myriapods. The species accounted for > 50% of the orders within Pancrustacea. Genomes and RNA sequence reads were accessed from the NCBI genome (whole genome sequence projects) and NCBI SRA archives (Raw RNA-seq reads), respectively. Twenty-seven transcriptomes were downloaded from de novo transcriptomic assembles in CrusTF (Qin et al., 2017). Taxonomic and accession numbers are listed in Supplementary Tables S1 and S2.
2.2 Orthology inferences
2.2.1 Seed orthologs
We used a graph and tree-based approach for orthogroup identification. We first identified seed orthogroups from six high-quality genomes with contig N50 > 100,000bp using OrthoFinder v.2.5.4 (Emms and Kelly, 2019), which employs a graph-based approach (all-by-all BLASTp and MCL). The resulting homolog groups were categorised into two types: those with more than 100 sequences (Type A) and less than 100 sequences (Type B). We performed an orthogroup search again in each homolog group of Type A again to further partition large homolog groups and repeated the procedure until the number of sequences in each group was < 100 or up to three times. The refined Type A groups and Type B groups were then subjected to subsequent filtering using a tree-based approach. Each homolog group was aligned and trimmed by MAFFT v7.2 (–genafpair –maxiterate 3000) (Katoh and Standley, 2013)and trimAl v1.2 (-gappyout) (Capella-Gutiérrez et al., 2009). The resulting multiple sequence alignments (MSA) were used to infer gene trees using IQ-TREE v1.62 (Nguyen et al., 2015) with a fixed model (LG + I + G). Long branches in the inferred trees were detected and trimmed off by TreeShrink with default parameters (Mai and Mirarab, 2018). Non-homologous genes or out-paralogs were assessed and removed by using Python scripts (mask_tips_by_taxonID_transcripts.py, cut_long_internal_branches.py: internal_branch_length_cutoff – 1.0 and write_fasta_files_from_trees.py) from Yang and Smith (2014). The trimmed homolog groups were subjected to alignment quality assessment by GUIDANCE2 (Sela et al., 2015). Poorly aligned sequences were excluded from the homolog groups. The processed MSA were realigned, trimmed and used for tree inference with the same condition described above. Then, phylopypruner v 1.2.3 (Thalén, 2018) was used to identify putative one-to-one orthologs from the inferred gene trees (–trim-divergent 1.20 –mask pdist –prune MI –min-len 50 –outgroup Rsan –root midpoint –min-support 0.8 –min-gene-occupancy 0.1 –min-taxa 12 –trim-freq-paralogs 3.5 –trim-lb 5 –jackknife –min-pdist 1e-8). The identified orthogroups are the seed orthogroups.
2.2.2 Orthologs from other genomes and transcriptomes
We then identified orthologs of the seed orthogroups from eight fair-quality genomes (contig N50 > 50,000 bp) and 23 well-assembled transcriptomes (BUSCO complete scores > 80%). Isoforms in the assembled transcriptomes were identified using CD-HIT (cut-off 0.9) (Fu et al., 2012) and the longest was retained for subsequent analysis. HMM profiles were constructed for each seed orthogroup using HMMER v3.2.2 (Eddy, 2011). We then used hmmsearch in HMMER v3.2.2 to identify orthologous sequences in the genomes and transcriptomes. The HMM-identified orthologs and the seed orthogroups were subjected to the tree-based filtering mentioned above. The refined orthogroups (denoted as orthogroup-2) were then used as references for the next part of ortholog identification.
2.2.3 Orthologs from transcriptomic raw reads
We used HybPiper v2.0.2 (Johnson et al., 2016) to identify and assemble orthologs from 42 sets of transcriptomic raw reads with sequences in orthogroup-2 as reference. The aforementioned tree-based filtering pipeline was then used to screen the recovered orthologs. Here, DISCO (Willson et al., 2022) was used instead of phylopypruner to identify putative one-to-one orthologs from the inferred gene trees, considering the presence of multi-copy gene-family trees, which is common in orthology inference. This approach identified 1183 orthogroups. To quantify the phylogenetic usefulness of the orthogroups, genesortR (Mongiardino Koch, 2021) was used, and outlier loci with low phylogenetic usefulness were excluded from the putative orthogroups, leaving 1175 orthogroups for subsequent analysis. These orthogroups were then filtered based on taxon decisiveness; loci with at least one representative of each main clade in question were retained (i.e., decisive orthogroups). Here, the main clades were defined as Branchiopoda, Cephalocarida, Hexapoda, Remipedia and Copepoda. 1086 decisive orthogroups were isolated by applying this criterion.
2.3 Phylogenetic analyses
Numerous approaches were used to conduct phylogenetic analyses and assess their credibility to identify and address the potential systematic errors related to methodological and biological factors.
2.3.1 Effect of missing data
First of all, to assess the impact of taxon occupancy on the phylogenomic relationships of allotriocaridans and copepods, two matrices were assembled with taxon occupancy thresholds of 50% (total of 1086 loci each with > 53 taxa, termed M0-50) and a 70% (totally 731 loci each with >74 taxa, termed M0-70). Genes trees of each matrix were inferred in IQ-TREE v.1.6.12, with the substitution model selected by ModelFinder (Kalyaanamoorthy et al., 2017) and ultrafast bootstrap frequency (Hoang et al., 2018) as nodal support assessment (-m MFP -bb 2000). Using the best-fitted substitution models estimated in gene tree construction, partition-based maximum likelihood (ML) species tree construction was inferred from the supermatrix of each matrix constructed in this study (-bb 2000). Using the IQ-TREE-constructed gene trees as input, coalescent-based species trees were computed in ASTRAL v.5.14.2 (Zhang et al., 2018). Nodes with < 30% BS (ultrafast bootstrap frequency) in gene trees were collapsed before analyses.
2.3.2 Effect of long-branch attraction
To examine and alleviate the effect of LBA, three approaches were taken in phylogenetic analyses: 1) long-branch taxa exclusion, 2) matrices of slow-evolving loci, and 3) site-heterogeneous model.
2.3.2.1 Long-branch taxa exclusion
Long branch (LB) scores of every taxon were calculated to detect potential long branch terminals using individual gene trees in M0-50 (see boxplot in Figure 1). The LB score calculation was performed using PhyKIT v.1.11.0 (Steenwyk et al., 2021). Fast-evolving taxa were characterised by inspecting the median and third-quartile values of LB scores of each clade within each major clade (i.e., in comparison with other taxa within the monophyletic group which have diverged most recently from their shared ancestor) using the LB scores boxplot (Figure 1, right) (Struck, 2014; Whelan et al., 2015). In total, 13 taxa exhibited accelerated rates of evolution, consisting of six hexapods, three copepods, one oligostracan, one branchiopod and two of the three myriapods (the identified LB taxa in this study are indicated by asterisks in the phylogenetic tree and red boxes in the boxplot in Figure 1). To mitigate the effect of LBA, and to address the effect of missing data, these long-branch (LB) taxa were removed from the M0-50 and M0-70 matrices, resulting in M3-50 and M3-70, respectively. Gene-partitioned concatenated phylogenetic analyses and coalescence species tree analyses were conducted using IQ-TREE and ASTRAL, as aforementioned.
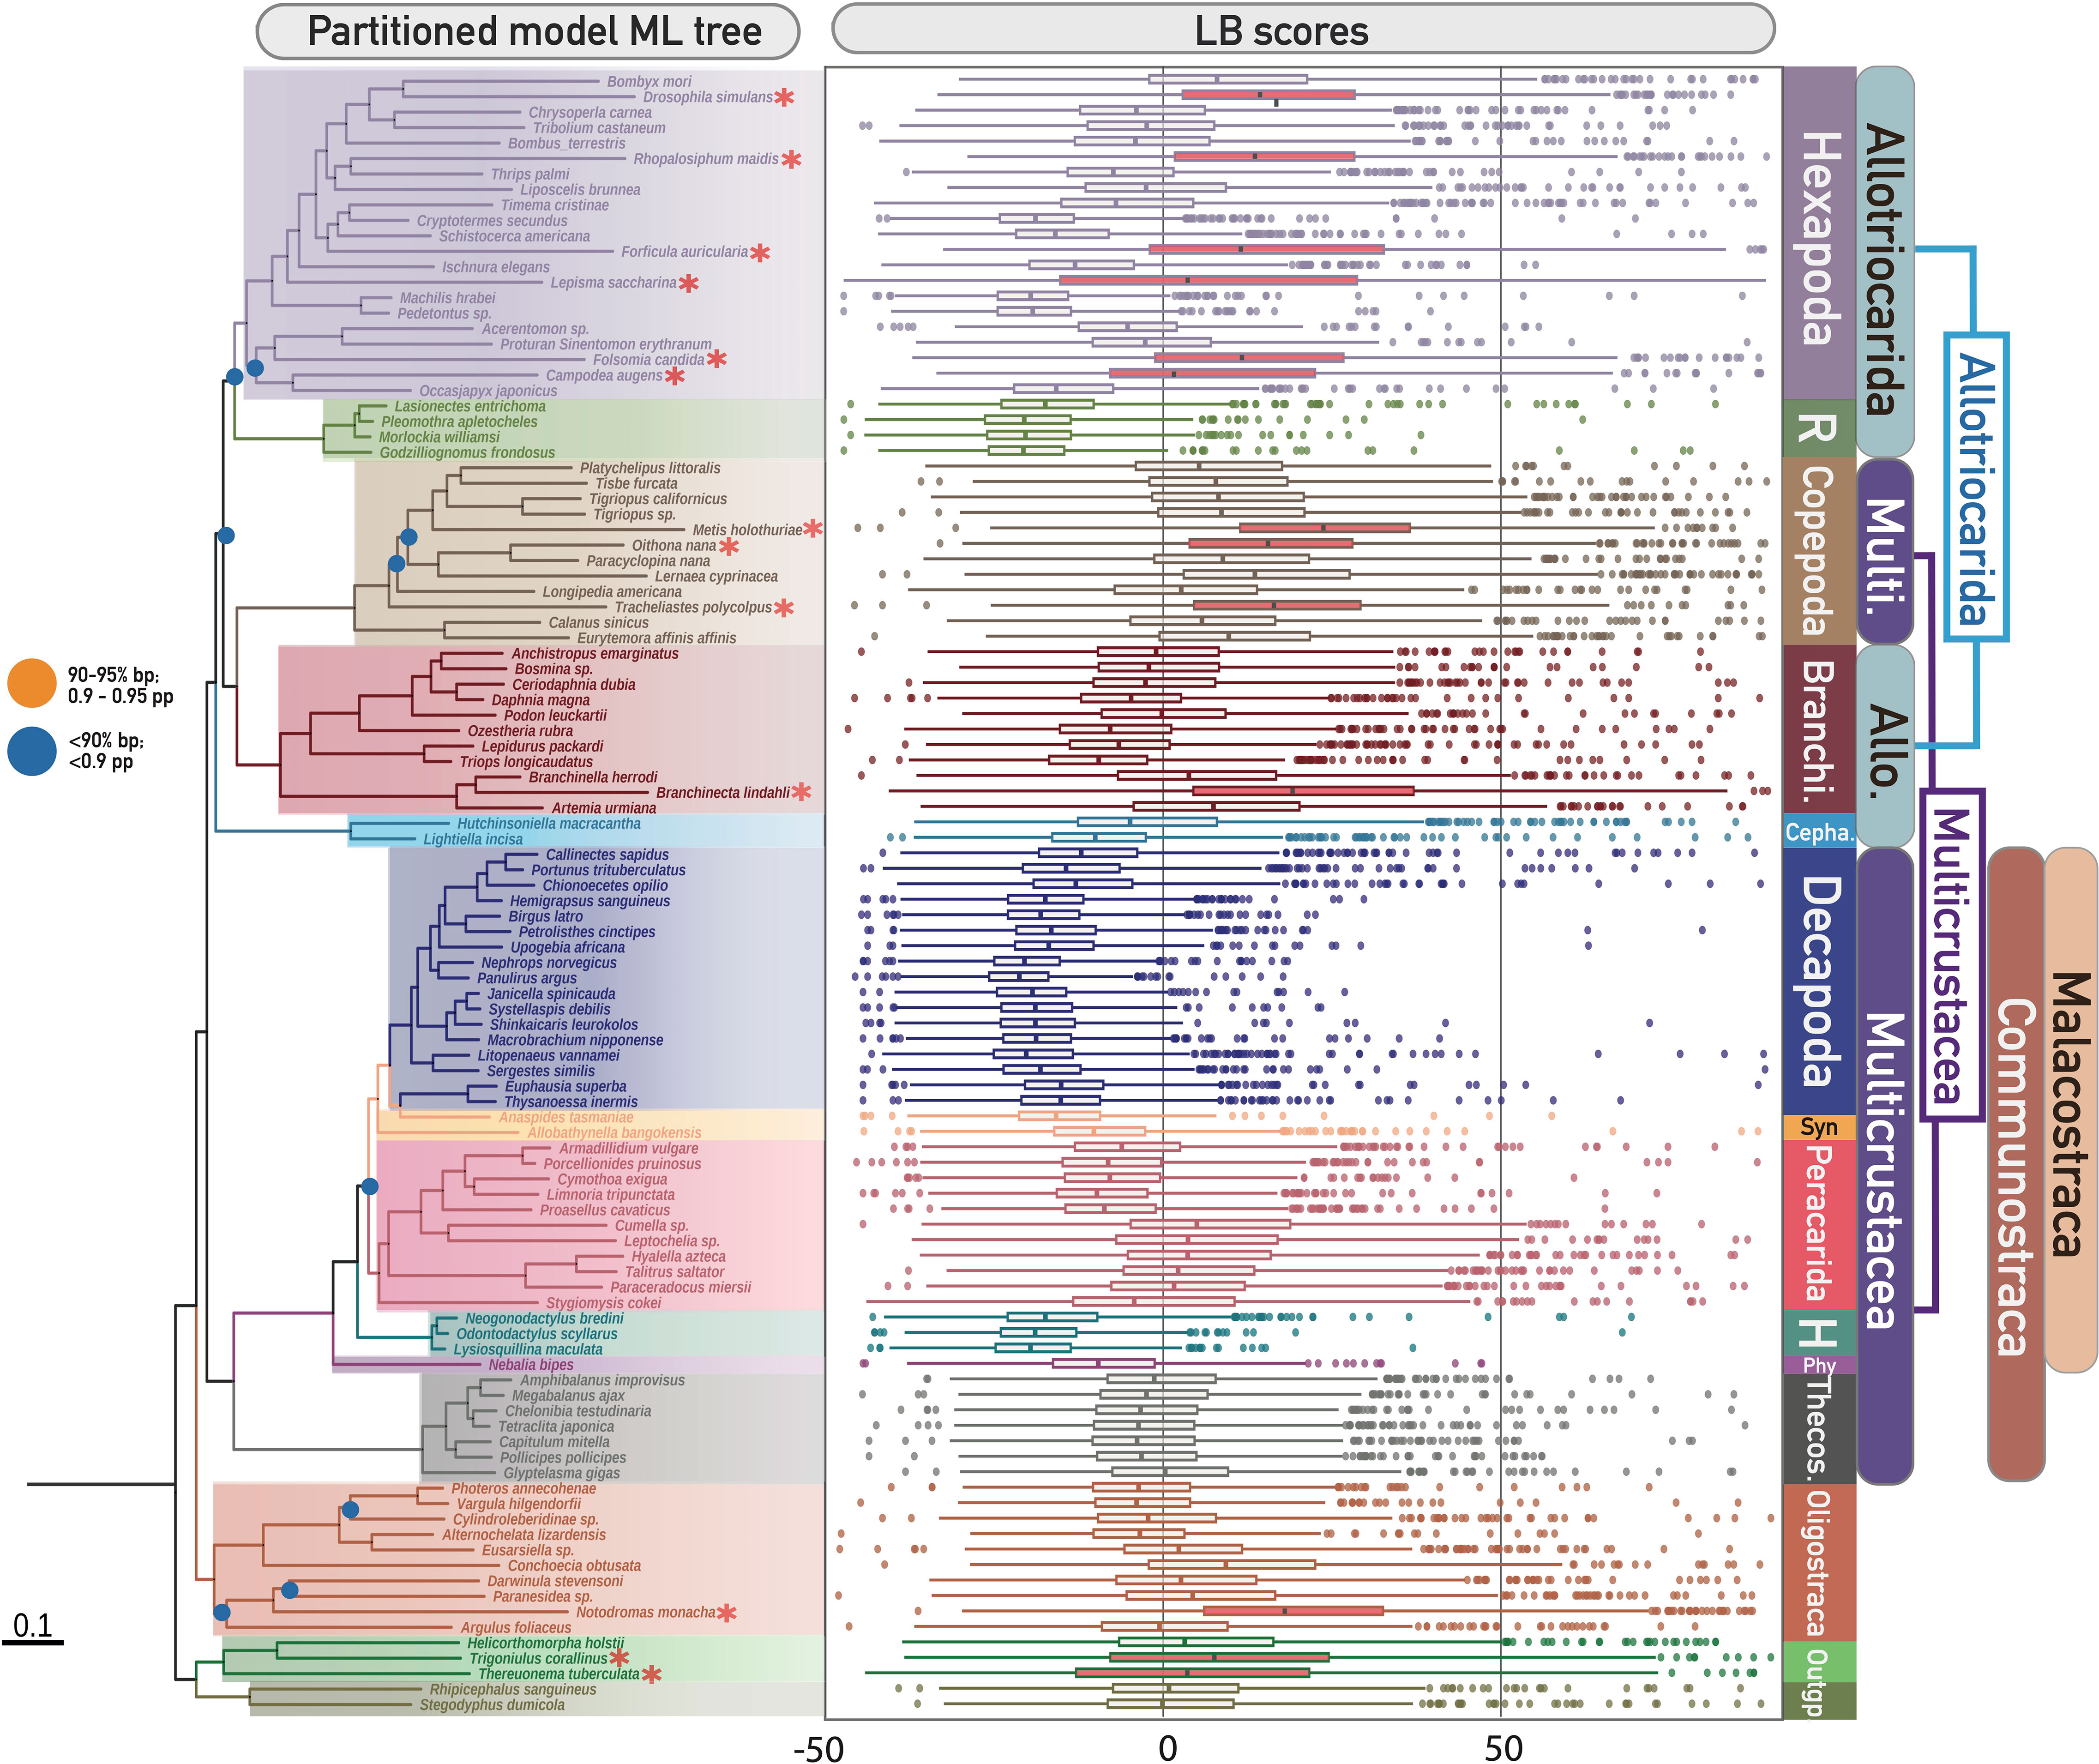
Figure 1 (Left) Phylogenetic tree of Pancrustacea based on ML partitioned model analysis of the unfiltered matrix M0-70 (1086 decisive genes), representing Topo1. Denoted and coloured bipartitions indicate the major clades within Pancrustacea. All unlabelled nodes indicate high support (> 95% ultrafast bootstrap – bp). Dots on nodes indicate medium support (90–95% ultrafast bootstrap; orange colour), or low support (< 90% ultrafast bootstrap; blue colour). Red asterisks indicate the identified ling-branch taxa in this study (refer to the right figure). (Right) Distribution of long branch (LB) scores of all sampled taxa in this study. The boxes of identified fast-evolving taxa are highlighted in red. Abbreviations (from top to bottom of Figure): R, Remipedia; Branchi, Branchiopoda; Cepha, Cephalocarida; Syn, Syncarida; H, Hoplocarida; Phy, Phyllocarida; Theco, Thecostraca; Allo, Allotriocarida; Multi, Multicrustacea.
LBA can be aggravated by incomplete taxon sampling (Delsuc et al., 2005; Bapteste et al., 2008; Pick et al., 2010). Our LB score analyses revealed a discrepancy in the evolutionary rate among different hexapod lineages and taxa (LB scores: -20 to 30), suggesting that biased taxonomic sampling in hexapods could exacerbate LBA in pancrustacean phylogenetics. Selective pruning of hexapod lineages was conducted to evaluate the impact of incomplete taxonomic sampling of Hexapoda on the inferred tree topology. Four new matrices (T4: M3-50-T4 and M3-70-T4; T5: M3-50-T5 and M3-70-T5) were created by excluding two sets of hexapod branches from the M3-50 and M3-70 matrices. T4 was designed to investigate the effect of retaining recently diverged hexapod lineages (i.e., Holometabola), while T5 aimed to test the impact of only preserving early diverging hexapod lineages (i.e., Archaeognatha, Diplura, Palaeoptera, and Polyneoptera, excluding Holometabola, Neuropterida, Paraneoptera, Pscocodea). IQ-TREE and ASTRAL were used for phylogenetic reconstruction for each of these matrices, as described above.
To further investigate the impact of LBA on the inferred position of Hexapoda, we tested the effect of further removing LB clades from the M3-70 matrix. (1) We identified Copepoda as a fast-evolving clade, as all members generally showed a higher median LB score (median = 9.9001) than other clades (median of all taxa = -5.9285). To examine the effect of this LB clade on the inferred position of Hexapoda, we removed all copepods from the M3-70 matrix and created the M3-70-C1 matrix. (2) Similarly, we created the M3-70-O1 matrix by discarding the outgroups Chelicerata and Myriapoda (as outgroups are typically longer branches) from the M3-70 matrix.
Multiple studies have evaluated and affirmed the negative impact of incomplete taxon sampling on the accuracy of phylogenetic inference under different tree construction approaches and data types, concluding that denser taxon sampling is effective in improving phylogenetic inference (Hillis, 1998; Rannala et al., 1998; Pollock et al., 2002; Zwickl and Hillis, 2002; Baurain et al., 2007; Townsend and Naylor, 2007; Agnarsson and May-Collado, 2008; Heath et al., 2008; Martín-Durán et al., 2017; Prasanna et al., 2020). Incomplete taxon sampling was proposed to be responsible for questionable phylogenetic groupings, for instance, Branchiopoda + Hexapoda was inferred when Remipedia was missing in previous works (Schwentner et al., 2017; Schwentner et al., 2018; Lozano-Fernandez et al., 2019). As most previous prior phylogenetic studies recovered Hexapoda as the sister to Remipedia or Xenocarida (Remipedia + Cephalocarida) (Regier et al., 2010; Von Reumont et al., 2012; Lee et al., 2013; Oakley et al., 2013; Misof et al., 2014; Schwentner et al., 2017; Schwentner et al., 2018), to examine whether Hexapoda was attracted to cluster with Remipedia by these two clades, Cephalocarida and Remipedia were excluded from M3-70 separately and together (i.e., Xenocarida) to form three new matrices (M3-70-Ce1, M3-70-R1, and M3-70-CeR1). Gene-partitioned concatenated analyses were conducted in IQ-TREE as described above to examine if removing these clades resulted in drastic changes in the affinity of Hexapoda.
2.3.2.2 Matrices of slow evolving loci
Phylogenetic analyses using fast-evolving loci are expected to be more prone to LBA errors. Here, the effect of evolutionary rates on LBA and topological instability were tested in the full 70% taxa occupancy matrix (M0-70), in LB taxa removed matrices (M3-70), and in selective hexapod pruning matrices (M3-70-T4, M3-70-T5). We ranked the loci by mean pairwise identities (as proxies for the evolutionary rate, see Steenwyk et al., 2021) and divided the matrices into three partitions with equal size, termed fast, intermediate, and slow evolutionary rates. 12 new matrices were constructed (M0-70-slow, M0-70-intermediate, M0-70-fast, M3-70-slow, M3-70-intermediate, M3-70-fast, M3-70-slow-T4, M3-70-intermediate-T4, M3-70-fast-T4, M3-70-slow-T5, M3-70-intermediate-T5, M3-70-fast-T5). IQ-TREE and ASTRAL analyses were conducted. Here, we expect the effect of LBA would manifest the most in matrices of fast-evolving loci without removing LB taxa. The effect of evolutionary rates in LB clade removal matrices (Copepoda, M3-70-C1) was also examined using IQ-TREE. A new matrix M3-70-slow-C1 was constructed to investigate the slow-evolving loci.
2.3.2.3 Site-heterogeneous model
Using site heterogeneous models in phylogenetic analyses can alleviate the effect of LBA (Lartillot et al., 2007). To determine if some topologies were caused by LBA, we compared the results of ML trees generated from site-homogeneous and site-heterogeneous models. We tested the effect of employing site-heterogeneous model in combination with controlling missing data (M0-50 and M0-70), removing LB taxa (M3-70), slow-evolving loci (M3-70-slow), and incomplete hexapod sampling (M3-70-T4 and M3-70-T5). The ML analyses with site-heterogeneous models (the posterior mean site frequency model) (Wang et al., 2018) were conducted using IQ-TREE v.1.6.12. The starting trees for each selected matrix were first estimated through basic ML tree searches (-m LG+I+G -bb 2000), and then, analyses on site-heterogeneous models were then conducted using LG+C20+F+Γ and the estimated starting trees.
2.4 Effect of incomplete lineage sorting
To test the various phylogenetic hypotheses in subsequent analyses, at least six constrained tree searches were conducted for the constructed matrices with constraints on the relationships between Branchiopoda, Cephalocarida, Copepoda, Hexapoda and Remipedia, according to Topo1-7. The tested hypotheses include six conflicting topologies found in this study (Topo1-3,5-7) and one proposed in previous studies (Topo4) (Figure 2B) (Meusemann et al., 2010; Regier et al., 2010; Von Reumont et al., 2012; Lee et al., 2013; Oakley et al., 2013; Lozano-Fernandez et al., 2016; Schwentner et al., 2017; Schwentner et al., 2018; Lozano-Fernandez et al., 2019). The phylogenetic relationships of taxa within these clades were not constrained during the tree searches.
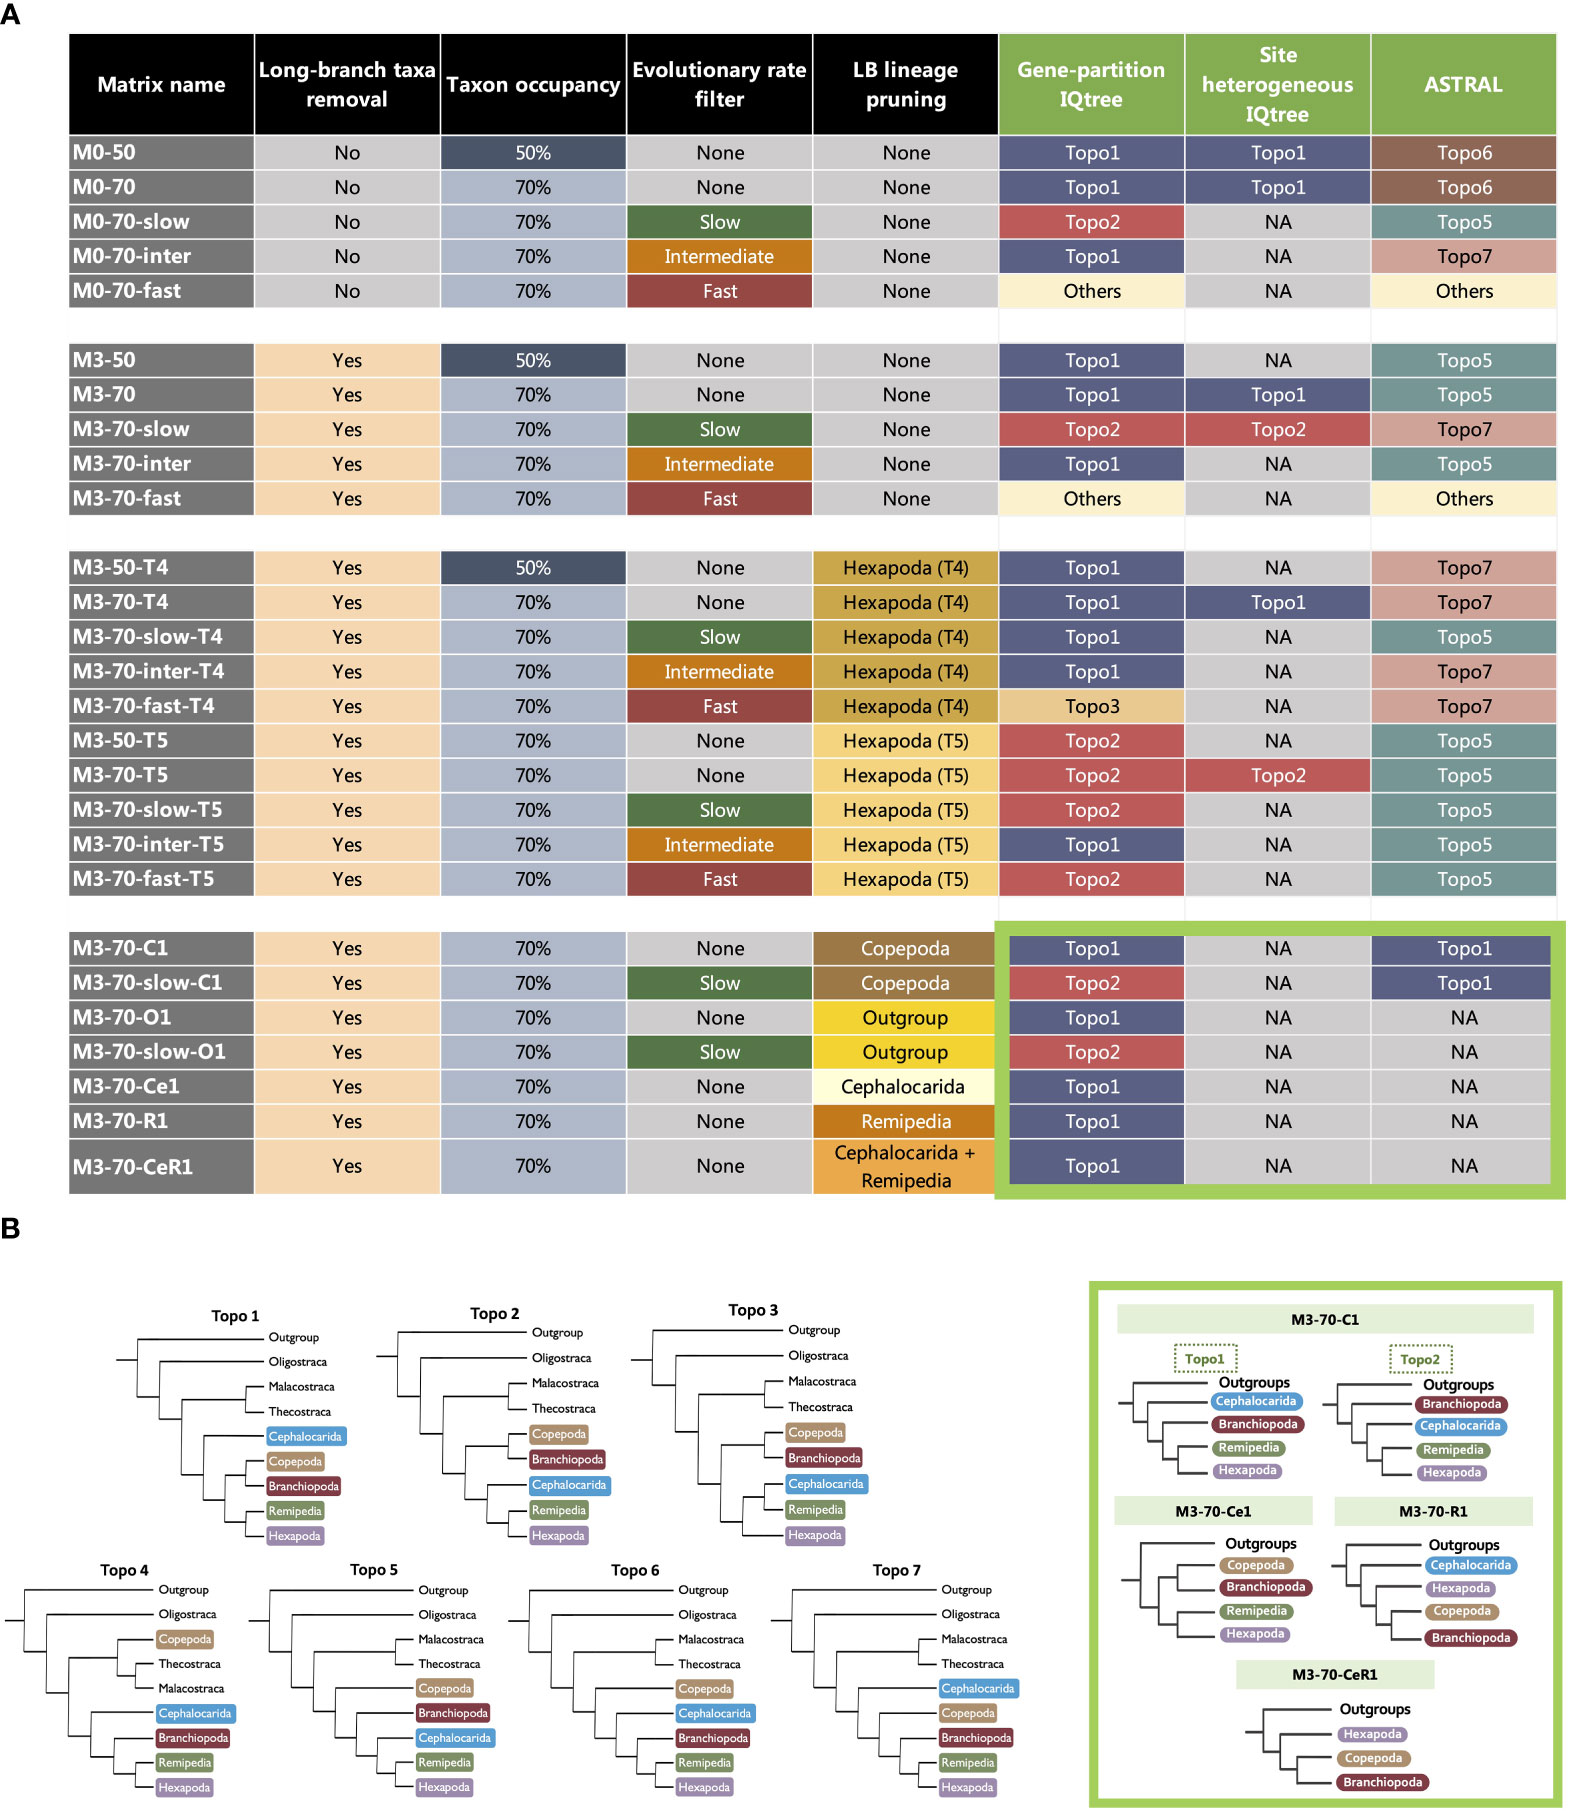
Figure 2 (A) The composition of 30 matrices used in this study and topological discordance observed in the matrices with varied taxon occupancy, taxon sampling and evolutionary rates analysed in three different analytical frameworks, ML with partitioned models, ML with site-heterogeneous models (IQ-TREE) and coalescent-based approach (ASTRAL). The colours of squares in the last three columns correspond to a competing hypothesis (Topo1-7) inferred (see Key). The thick light green square highlights the recovered topologies of clade-removed matrices (C1, Ce1, O1, R1 and CeR1), inside the thick light green square indicates which “Topo” (Topo1-7) that the recovered topology of clade-removed matrices is equivalent to. In detail: (1) for C1, Topo1 = Topo6 & Topo7, Topo2 = Topo5; (2) for Ce1, Topo1 = Topo2 & Topo3; (3) for O1 and R1, Topo1 = Topo1 only; (4) for CeR1, Topo1 = Topo2 & Topo3. (B) (Left) Competing topologies for the position of Branchiopoda, Cephalocarida, Copepoda, Hexapoda and Remipedia. Topo1-3 & 5-7 are recovered in different tree estimations in this study. Topo4 is traditional Allotriocarida phylogeny that has been repeatedly recovered in previous works. (Right) The thick light green square highlights the topologies inferred from clade-removed matrices.
Incomplete lineage sorting can cause discordance in gene trees. To assess the underlying disagreement and proportion of gene support at interested bipartitions of all competing hypotheses, gCF (gene concordance factors) and sCF (site concordance factors) calculations were implemented in IQ-TREE v.2.02 (Minh et al., 2020). The factors were calculated in 10 matrices: M0-70, M3-70, M3-70-slow, M3-70-inter, M3-70-T4, M3-70-inter-T4, M3-70-T5, M3-70-slow-T5, M3-70-inter-T5, and M3-70-C1. These matrices were selected to determine the impact of taxon occupancy, removal of LB taxa, slow evolutionary rate, and incomplete hexapod sampling on the confidence level of resulting topologies in this study. Unconstrained topologies inferred by ML with partitioned models and all other inferred constrained topologies (Topo1-7) of every selected matrix were subjected to the assessment.
In addition, discordance analyses of gene trees (Sayyari et al., 2018) were also used to examine the support from the gene tree for uncovered hypotheses and every possible relationship for Allotriocarida + Copepoda, as a complement to gene concordance analysis in IQ-TREE. This analysis utilised gene trees of the selected matrices and was performed in DiscoVista v.1.0.
To investigate the connection between ILS and gene tree discordance in the deep-level phylogeny of Allotriocarida + Copepoda, a chi-square test was conducted. This test determined the likelihood of ILS being present in the datasets, as outlined in http://www.robertlanfear.com/blog/files/concordance_factors.html. The assumption is that when there are equal frequencies of genes that support discordant topologies at a specific branch, ILS is likely to be present.
To further explore the incidence of ILS in Pancrustacea, relative frequency analyses in six selected matrices (M0-70, M3-70, M3-70-slow, M3-50-T4, M3-50-T5 and M3-50-C1) were conducted in ASTRAL v.514.2. The matrices were chosen to investigate the effect of ILS in inferring the phylogeny of Allotriocarida + Copepoda and to examine the combined effect of ILS and other systemic errors, including LBA and incomplete taxon sampling. ASTRAL trees were inferred from matrices with the most orthogroups in each filter category to increase the accuracy of species-tree construction. The quartet support proportion for all branches was measured by analysing the ASTRAL results of each selected data set and visualising them in DiscoVista. When there is ILS, comparable support proportion can be found in both alternative topologies in a node.
2.5 Phylogenetic signal analyses
We used gene-wise likelihood scores (ΔGLS), which detects the distribution of phylogenetic signals among loci, to compare the credibility of the constrained and unconstrained trees. ΔGLS were calculated as described by Shen et al. (2017). The locus-specific likelihood of seven competing hypotheses across 13 selected matrices were compared separately (M0-70 M3-70, M3-70-slow, M3-70-inter, M3-70-fast, M3-70-T4, M3-70-slow-T4, M3-70-inter-T4, M3-70-fast-T4, M3-70-T5, M3-70-slow-T5, M3-70-inter-T5 and M3-70-fast-T5). The matrices were selected to study how phylogenetic support varies with different topologies when different strategies are used to reduce LBA error. Matrices of fast-evolving genes were also selected to inspect the favoured topologies of these genes. The gene-specific log-likelihoods of the individual gene tree were calculated using IQ-TREE.
To evaluate the effect of disproportionately strong phylogenetic signals on the resulting topologies, genes with unusually high ΔGLS values (outliers, as defined by Shen et al., 2017) were excluded. The remaining genes were subjected to tree construction using IQ-TREE with partitioned models. M0-70 and M3-70 were used to explore the presence of strong signals in datasets with or with less LBA.
To assess the impact of removing LB taxa on systemic biases in each conflicting topology, the biases across different datasets and topologies were compared. Specifically, we compared M3-70 and M0-70, which differed in their LB filtering approach. We used genesortR to estimate the systematic bias of loci in M3-70 and M0-70. Loci that favoured each competing hypothesis were subsampled. Then, five potential biases (taxon occupancy, missing data, percentages of informative sites, treeness, and average patristic distance) were compared between the seven competing hypotheses and M3-70 and M0-70. Wilcoxon rank-sum tests were conducted to determine if there was a significant difference in systematic errors between the topologies.
3 Results and discussion
The data matrices comprised 283 to 1086 orthogroups with 90,159 to 424,168 amino acid positions and 13% to 23% missing data. The filtering and subsampling strategies of all data matrices in this study are summarised in Figure 2A.
The subsequent discussion focuses on seven hypotheses (topologies) regarding the phylogenetic relationships of Copepoda and the clades within Allotriocarida that are recovered in this and previous studies (Figure 2B). This include six tree topologies that were recovered in most of our phylogenetic analyses (Topo1-3, 5-7, Supplementary Figures S1-S52). We also include Topo4, which was frequently recovered in previous works (Meusemann et al., 2010; Regier et al., 2010; Andrew, 2011; Von Reumont et al., 2012; Lee et al., 2013; Oakley et al., 2013; Misof et al., 2014; Schwentner et al., 2017; Lozano-Fernandez et al., 2019), but was not recovered in this study.
3.1 Phylogenetic implications for basal splits of pancrustaceans
3.1.1 Remipedia +Hexapoda is supported and Xenocarida is rejected
Hexapoda was sister to Remipedia in five of the topologies (Topo1-2, 5-7), equivalent to over 97% of recovered trees (Figure 2A; Supplementary Figure S1-S52), with maximal branch support, regardless of taxon occupancy, LB taxa removal, substitution models and tree inference methods (ultrafast bootstrap resampling frequency – BP = 100%; posterior probability - pp =1), and this relationship corroborates with the prevalent hypothesis of the hexapod’s origin (Von Reumont et al., 2012; Oakley et al., 2013; Schwentner et al., 2017; Schwentner et al., 2018; Lozano-Fernandez et al., 2019; Bernot et al., 2023). In contrast, two less well-accepted hypotheses of Hexapoda placement received minimal support here: (1) Branchiopoda + Hexapoda (Glenner et al., 2006; Meusemann et al., 2010; Andrew, 2011; Rota-Stabelli et al., 2011; Borner et al., 2014; Dell’Ampio et al., 2014; Lozano-Fernandez et al., 2016) is never recovered in any of our tree inferences, while (2) Xenocarida (Cephalocarida+ Remipedia) + Hexapoda (Regier et al., 2010; Schwentner et al., 2018) was only recovered and weakly supported by one of the fast-evolving gene matrices, which is prone to LBA error (Topo3; Figure 2A; M3-70-fast-T4; ML with partitioned models; Supplementary Figure S13). It was suggested that these groupings may be fallacies stemming from incomplete taxon sampling of Allotriocarida (especially when Remipedia and Cephalocarida were missing) and LBA, respectively (Von Reumont et al., 2012; Schwentner et al., 2017; Schwentner et al., 2018; Lozano-Fernandez et al., 2019; Bernot et al., 2023). The underlying relationship of Xenocarida with LBA will be discussed in Section 3.2.3.
3.1.2 Close relationships between Copepoda and Allotriocarida
In this study, the clustering of Copepoda within the paraphyletic Allotriocarida (Topo1-3, 7) or the sister grouping of Copepoda to Allotriocarida (Topo5-6) was well supported in the inferred trees, regardless of taxon occupancy, LB taxa removal, substitution models, tree inference methods, as well as evolutionary rates. Copepoda has been traditionally regarded as a member of Multicrustacea (Meusemann et al., 2010; Regier et al., 2010; Andrew, 2011; Lee et al., 2013; Oakley et al., 2013). Here, after using multiple methods to mitigate systematic errors, we provide strong evidence that Copepoda is closely related to Allotriocarida, and that Multicrustacea is paraphyletic. The close relationship between Copepoda and Allotriocarida was recovered in a few studies when tree searches were conducted using site-heterogenous models, which is regarded as an approach for reducing the effect of LBA (Rota-Stabelli et al., 2013; Schwentner et al., 2017; Schwentner et al., 2018; Lozano-Fernandez et al., 2019). Thus, the conflicts in the placement of Copepoda might be mostly attributable to LBA (see further discussion in section 3.2) (Lartillot and Philippe, 2004; Lartillot et al., 2007; Whelan and Halanych, 2016; Feuda et al., 2017).
Bernot et al. (2023) reported comparable results with respect to the placement of Copepoda. Their analysis of the complete taxonomic sample dataset - Data set 2, revealed that Copepoda is closely related to Allotriocarida in ML (both site-homogeneous and site-heterogeneous models), BI, and ASTRAL analyses. Despite the presence of multiple polytomies in the ASTRAL species tree (their Figure 3), Copepoda was consistently recovered to be clustered in or sister to Allotriocarida. It is noteworthy that the main difference between our taxon sampling is that Bernot et al. (2023)’s study includes a broader range of samples in Amphipoda and Isopoda (Peracarida), while we sampled more Copepoda and Branchiopoda.
3.1.3 Uncertain placements of Branchiopoda, Copepoda and Cephalocarida
In our study, the phylogenetic position of Branchiopoda, Copepoda and Cephalocarida has been sensitive to analytical methods and data filtering without obvious pattern (Figure 2A), as shown in Topo1-2 and 5-7 (Figure 2B), making it impossible to deduce the credibility of various hypotheses at the current stage. Most of our inferred topologies recovered Cephalocarida as sister to the (paraphyletic) Allotriocarida + Copepoda clade (Topo1,7), which was also found in a few prior studies (Rota-Stabelli et al., 2013; Schwentner et al., 2017; Schwentner et al., 2018; Lozano-Fernandez et al., 2019), or as a sister of Hexapoda + Remipedia (Topo2, 5), which has never been reported before. Cephalocarida as sister to Remipedia (Topo3) and as the early split of a (monophyletic) Allotriocarida (Topo6) were only recorded in three of our analyses and were thus deemed unlikely.
In our analyses, Copepoda was either inferred to be nested within a paraphyletic Allotriocarida (Topo1-3, 7), usually as sister to Branchiopoda, or a sister to a monophyletic Allotriocarida (Topo5, 6) with strong statistical support (pp =1). Rota-Stabelli et al. (2013) (analyses of CAT-GTR; their Figures 1C, D) recovered a sister relationship between Copepoda and Branchiopoda, whereas the remaining relationships were never observed. We did not recover Copepoda grouping with Remipedia + Hexapoda as Lozano-Fernandez et al. (2019) did.
Branchiopoda was recovered as a sister to Copepoda in IQ-Tree analyses (Topo1-3). The class was mostly inferred to be sister to Hexapoda + Remipedia in previous molecular studies, which is also recovered in eight of our ASTRAL analyses (Topo6 and Topo7). However, ten ASTRAL analyses recovered a new alternative hypothesis, with Branchiopoda as a sister to the clade Cephalocarida + Hexapoda + Remipedia (Topo5).
ASTRAL and IQ-Tree analyses recovered different topologies (see Figure 2A; Supplementary Figures S32-S52). Contradictory tree topologies between analytical approaches were also observed in the phylogenomic study of Bernot et al. (2023). Copepoda was found at the earliest diverging position of Allotriocarida in the coalescent tree of Data set 2 (their Figure 3E) instead of Cephalocarida in the ML tree (their Figure 3B). It has been shown that tree accuracy is lower in concatenation-based analyses when conflicting gene histories (e.g. ILS or hidden paralogy) are present (Degnan and Rosenberg, 2009; Edwards, 2009; Nakhleh, 2013; Mirarab et al., 2016; Scornavacca and Galtier, 2017). In contrast, the accuracy of coalescent-based studies is prone to gene tree estimation error, which could originate from inaccurate gene alignments (Springer and Gatesy, 2016; Blom et al., 2017; Simmons and Kessenich, 2020). Therefore, the topological disagreement between methods could stem from underlying gene tree conflict or gene tree estimation error (GTEE) in the phylogeny of Pancrustacea (further discussed in Section 3.4) (Edwards et al., 2016; Pease et al., 2016; Bravo et al., 2019; Jiang et al., 2020).
Bernot et al. (2023) found that not only the phylogenetic placements of Branchiopoda, Copepoda and Cephalocarida varied among tree construction methods, but also Remipedia and Hexapoda. With regard to Data set 2, Topo1 was recovered from ML analyses using both site-homogenous and site-heterogenous models and presented as the primary hypothesis of their study. On the other hand, BI analyses recovered an unusual internal structure of Allotriocarida. While ML analyses identified Remipedia as the sister group of Hexapoda, BI analyses revealed Remipedia and Copepoda as sister groups and ASTRAL analyses showed Remipedia forming a polytomy with paraphyletic Hexapoda. The sister group of Branchiopoda was different among ML, BI and ASTRAL analyses. Cephalocarida was found to be the earliest diverging clade of Allotriocarida + Copepoda and remained stable across ML and BI analyses.
3.2 Evidence of LBA based on species tree topologies
Based on LB score calculation, markedly higher rates of evolution was found in 13 taxa and one clade displayed when compared to other lineages, indicating that the pancrustacean phylogeny may be susceptible to LBA error. Bernot et al. (2023) also discovered LB taxa from their Data sets 1 and 2. We found that seven out of eight LB taxa they identified were identical to ours. These included three Copepoda, two Hexapoda (Drosophila melanogaster and Folsomia candida), one Branchiopoda (Branchinecta lindahli), and one Ostracoda (Conchoecia obtusata). Therefore, to probe the impact of LBA in pancrustacean phylogenetic inference, we applied in our analyses several LBA-mitigation strategies, including using site-heterogenous model in ML analyses, removing LB taxa and clade, and binning genes by evolutionary rates (Lartillot and Philippe, 2004; Lartillot et al., 2007; Soubrier et al., 2012; Ballesteros and Sharma, 2019; Duchêne et al., 2022). While we found that the ML trees constructed using site-heterogeneous models, which were supposed to alleviate LBA effect, were identical to the corresponding trees based on partitioned models, regardless of subsampling based on LB taxa and evolutionary rates (Figure 2A; Supplementary Figures S27-S31), this might be because the heterogenous model was insufficient to account for the model violation and assumption violation (i.e., gene history congruence due to biological processes like ILS) in this group instead of an absence of LBA error. Rather, we found notable differences in tree topologies inferred from matrices with the removal of LB taxa and clades, and matrices of different evolutionary rates, strongly suggesting the disposition of current phylogenomic datasets to LBA errors when relevant factors were not considered.
3.2.1 Long branch taxa and clade removal impacted ASTRAL species tree estimations
We found that ASTRAL analyses were markedly affected by LB taxa and clade removal, yielding Topo5 from the M3-50 and M3-70 matrices versus Topo6 from the unfiltered datasets (Figures 2A, 3B; Supplementary Figures S34, S35, S39). The further removal of the fast-evolving clade (Copepoda; M3-70-C1) returned Topo1 (equivalent to Topo4,6,7 without Copepoda, details refer to Figure 2B left) in the ASTRAL analysis (Supplementary Figures S19, S32). However, ML tree topologies were generally not impacted by such operation. For instance, the unfiltered matrices (M0-50 and M0-70) and the exclusion of 13 LB taxa (M3-50 and M3-70) concordantly yielded Topo1 in ML analyses (Figure 1A; Supplementary Figures 1, 5, 6). Summary tree approaches heavily depend on phylogenetic information and inferred topologies from every gene tree included (Degnan and Rosenberg, 2009; Nakhleh, 2013; Mirarab et al., 2016; Zhang et al., 2018). This topological inconsistency in the summary coalescent method implies that the removal of LB taxa and LB clade resulted in different changes in the gene tree topology, possibly improving the gene trees by eliminating spurious groupings from LBA errors. Whether and how these changes in gene tree topology resulted from LB taxa removal impacted the support and the phylogeny of Allotriocarida + Copepoda is further discussed in Section 3.3. Although Copepoda and LB taxa exclusion have no observable effect on tree topology in ML analysis, the exclusion of Copepoda and LB taxa considerably influences gene tree topologies as reflected in ASTRAL analyses.
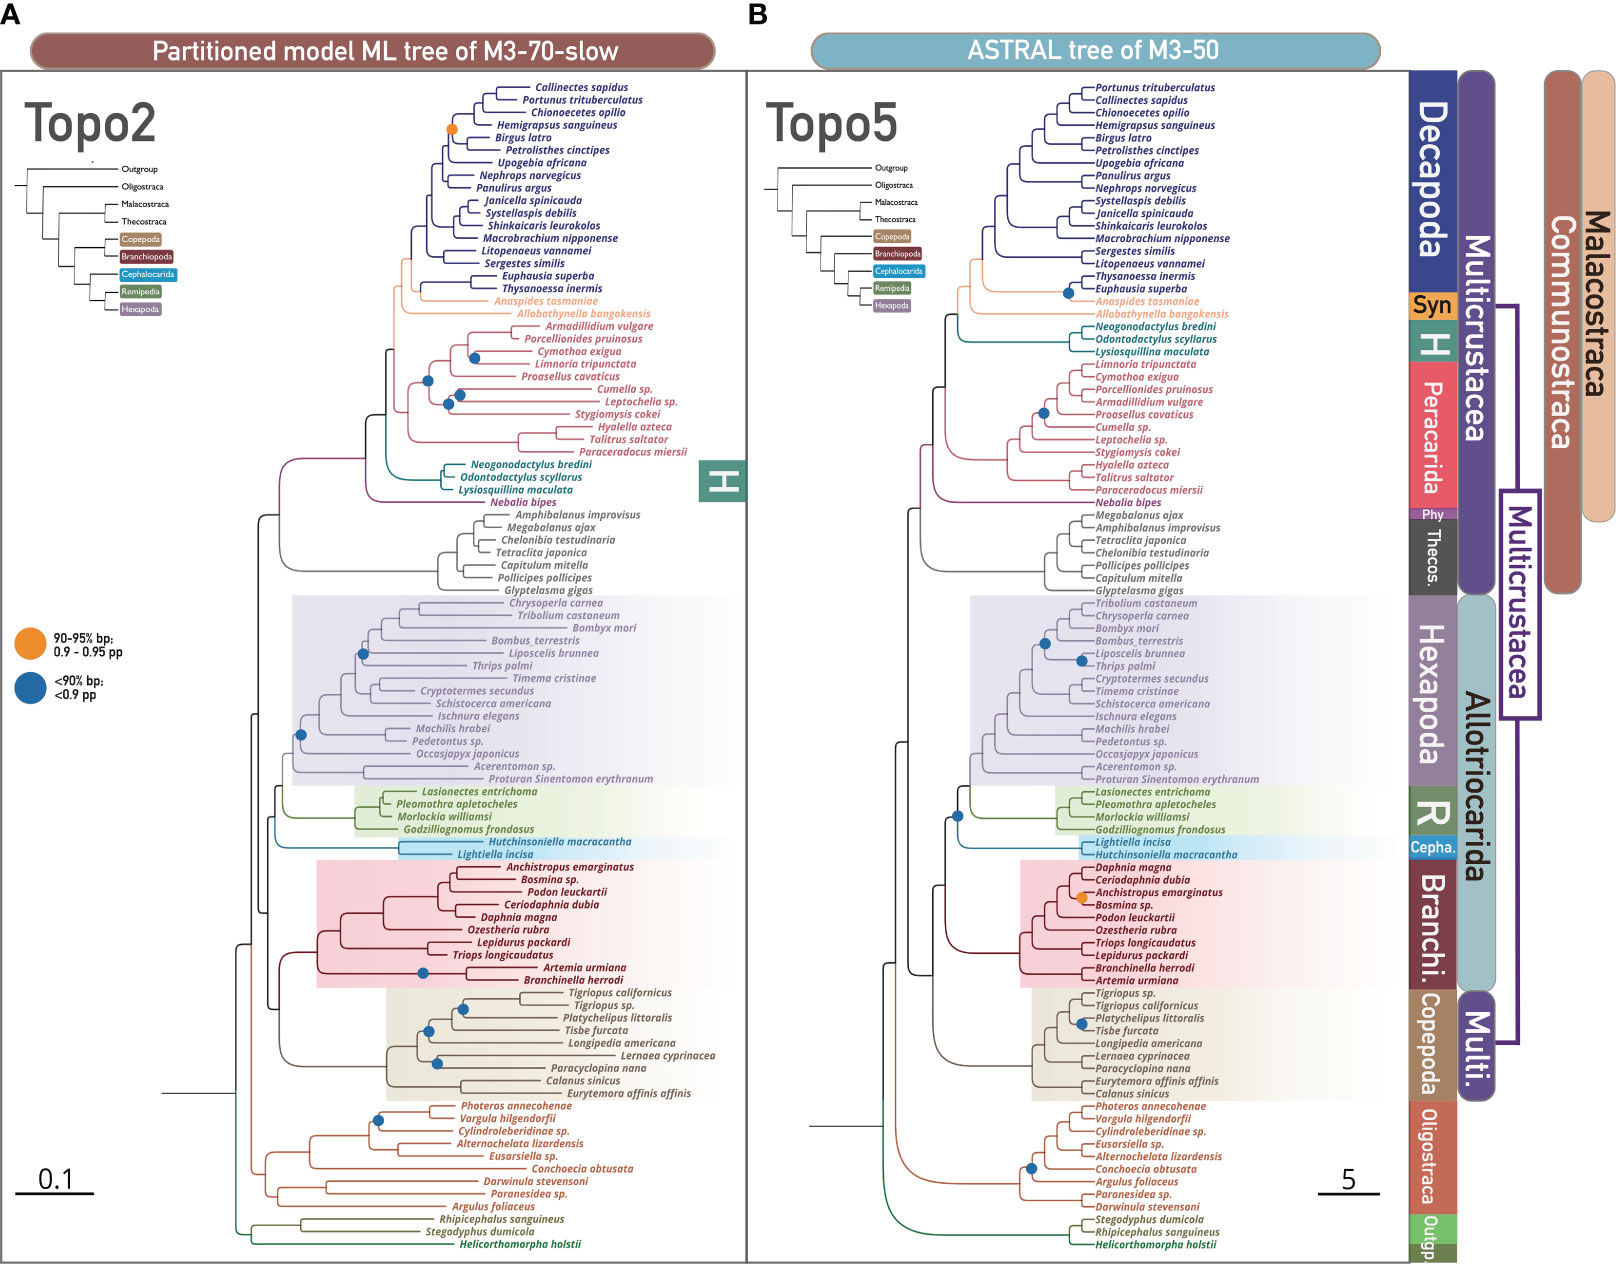
Figure 3 The phylogenomic relationship of 93 pancrustacean taxa and nodal support values across concatenation-based and coalescent-based methods shows two conflicting hypotheses, i.e., Topo2 and Topo5, respectively. Denoted and coloured bipartitions indicate the major clades within Pancrustacea. (A) Concatenation-based species tree based on ML with the partitioned model (IQ-TREE) of slowly evolving loci (M3-70-slow), showing Topo2. All unlabelled nodes indicate high support (> 95% ultrafast bootstrap). Dots on nodes indicate medium support (90–95% ultrafast bootstrap; orange colour), or low support (< 90% ultrafast bootstrap; blue colour). (B) Coalescence-based species tree based on ASTRAL of M3-50, showing Topo5. All unlabelled nodes indicate high support (> 0.95 posterior probability - pp). Dots on nodes indicate medium support (0.90–0.95 posterior probability; orange colour), or low support (< 0.90 posterior probability; blue colour). Abbreviations (from top to bottom): Syn, Syncarida; H, Hoplocarida; Phy, Phyllocarida; Theco, Thecostraca; R, Remipedia; Branchi, Branchiopoda; Cepha, Cephalocarida; Multi, Multicrustacea.
3.2.2 Matrices of different evolutionary rates resulted in different topologies
We found that loci filtering by evolutionary rate exhibit a greater influence on topological uncertainty in concatenation and summary tree analyses than LB taxa and clade exclusion. Both ML and ASTRAL analyses yielded three discordant topologies from the three datasets with different evolutionary rates (Figure 2A). The fast-evolving gene matrices (with less-conserved genes) (M0-70-fast and M3-70-fast) uniformly recovered a strange relationship where paraphyletic Hexapoda clustered with Remipedia (“Others” in Figure 3A, see Supplementary Figures S4, S8 for further details) in ML and ASTRAL analyses (note that Freitas et al. (2018) also challenged the monophyly of Hexapoda using summary tree method). In addition, ML tree searches of slowly-evolving genes resulted in Topo2, with Cephalocarida sister to Hexapoda + Remipedia (M0-70-slow and M3-70-slow; Figure 3A; Supplementary Figure S2), as opposed to the invariable discovery of Topo1 from non-subsampled matrices (M0-50, M0-70, M3-50, and M3-70) and genes of intermediate evolutionary rate (M0-70-intermediate and M3-70-intermediate; Supplementary Figures S3, S7). We note that Topo2 was not recovered by Bernot et al. (2023), which might be because no subsampling of the data matrices by evolutionary rates was conducted in their study. As LBA should be more severe in tree inference from matrices with faster-evolving genes, the disparity of topologies recovered from genes of different evolutionary rates suggests that LBA is a potential source of systematic error in pancrustacean phylogenetic analyses, possibly leading to inaccurate tree inference when evolutionary rates of genes were not considered. Nonetheless, when slowly-evolving genes were subsampled from M0-70 and M3-70 matrices, ASTRAL analyses resulted in a change from Topo6 to Topo5 and from Topo5 to Topo7, respectively, regarding the relationships of the five focal taxa, and also consistently yield an unusual sister relationships between Oligostraca and Communostraca (not shown in Figure 3A, see Supplementary Figures S36, S40 for detail). This could be explained as topological errors in estimating the species tree, as the errors tend to decrease as the number of input gene trees increases in ASTRAL analysis (Mirarab et al., 2016).
3.2.3 LBA is exacerbated by incomplete hexapod sampling
Hexapoda is the most species-rich group of animals on earth, making its complete taxonomic sampling a challenge. Uneven sampling, which may lack representations of early or recently diverged lineages of hexapods, can be detrimental to tree accuracy by introducing unexpected LBs (Hendy and Penny, 1989; Poe, 2003; Wiens, 2005). Although the availability of Hexapoda genomic materials drastically increased in the past decades, not all previous Pancrustacea phylogenetic studies samples evenly covered both early and recently diverged lineages of Hexapoda (Regier et al., 2005; Schwentner et al., 2017; Schwentner et al., 2018). This study conducted two sets of incomplete sampling of hexapods to test the impact on the relationships within Allotriocarida + Copepoda, especially the position of hexapods. M3-T4, which only retained the recently diverged Holometabola among hexapod taxa, displayed a much longer Hexapoda branch than another biasedly sampled matrix, M3-T5. Notably, most matrices with T4 hexapod pruning (matrix group of M3-T4) recovered Topo1, including a slow-evolving matrix (Supplementary Figures S9-S12). It could be interpreted that using slowly-evolving genes only could not alleviate profound LBA artefacts exacerbated by incomplete taxon sampling (forming stronger non-phylogenetic signals and obscure true phylogenetic signals) in this phylogeny. In agreement with previous works and Section 3.1.1, Xenocarida, which was only recovered in a fast-evolving loci matrix (M3-70-fast-T4), is a conceivable LBA artefact (Supplementary Figure S13). Thus, in agreement with previous studies (Agnarsson and May-Collado, 2008; Ontano et al., 2021; Benavides et al., 2023), unbiased hexapod sampling is crucial in resolving the Hexapoda-Crustacea relationship (in alleviating the LBA artefacts).
Complementary to our findings, Bernot et al. (2023) parallelly discovered the presence of LBA in pancrustacean phylogeny (inferring Xenocarida) using a reduced taxon sampling matrix, i.e., Data set 1. Notably, coinciding with our M3-T4, five out of the six hexapods sampled in Data set 1 were Holometabola, a recently diverged hexapod we kept in M3-T4. It is possible that such taxon sampling of Hexapoda in Data set 1 further exacerbated LBA introduced by the incomplete sampling among lineages of Allotriocarida. It might explain several unusual interclass relationships of Allotriocarida inferred using Data set 1, such as Copepoda + Hexapoda (their Figure 3F), not just Xenocarida in our M3-70-T4-fast.
It is observed that spurious groupings were recovered from the data set that have missing allotriocaridan lineages, like Remipedia and Cephalocarida (e.g. Meusemann et al., 2010). Nonetheless, inconsistent with the previous proposal, the effect of incomplete sampling of allotriocaridan lineages was negligible in the ML results here. The clade deletion experiment indicates the relationships of Allotriocarida, especially the derived position of Hexapoda, were not affected by excluding possible sister groups of Hexapoda (Remipedia, Cephalocarida, and Xenocarida) and outgroups (Chelicerata and Myriapoda) (Supplementary Figures S21-S25). Other systematic errors, such as inaccurate orthology inference and LBA, may be responsible for such groupings in previous works, instead of the missing lineages.
In summary, LBA plays a role in causing topological uncertainty in the relationship of Allotriocarida + Copepoda. Removing the least conserved loci with noise and bias is more effective in alleviating LBA in the deep conflicting branches of Allotriocarida than removing fast-evolving clades and taxa in concatenation-based analyses. The unstable results of the coalescent-based method indicate that excluding LB taxa and clades significantly alters the gene tree topologies. We suggest that both the identification and removal of LB taxa and clades could achieve reliable pancrustacean phylogeny in the future. Moreover, markers with a slow mutation rate should be chosen, and complete hexapod sampling is crucial in resolving the deep nodes in the tree of Pancrustacea. Another available method including selecting phylogenetic markers based on informativeness while accounting for LBA could be considered in further studies on LBA-prone lineages (Su and Townsend, 2015).
3.3 Evidence of LBA based on phylogenetic signals
Analysing the bootstrap frequency offers minimal information about the suspected incongruent phylogenetic signals in the pancrustacean phylogeny, as suggested by discrepant results of ML and summary tree approaches. To examine topological discordance among the seven competing hypotheses and the influence of LBA found in this study, concordance factors calculation, discordance analyses on gene trees and ΔGLS test were performed (Figures 4–6).
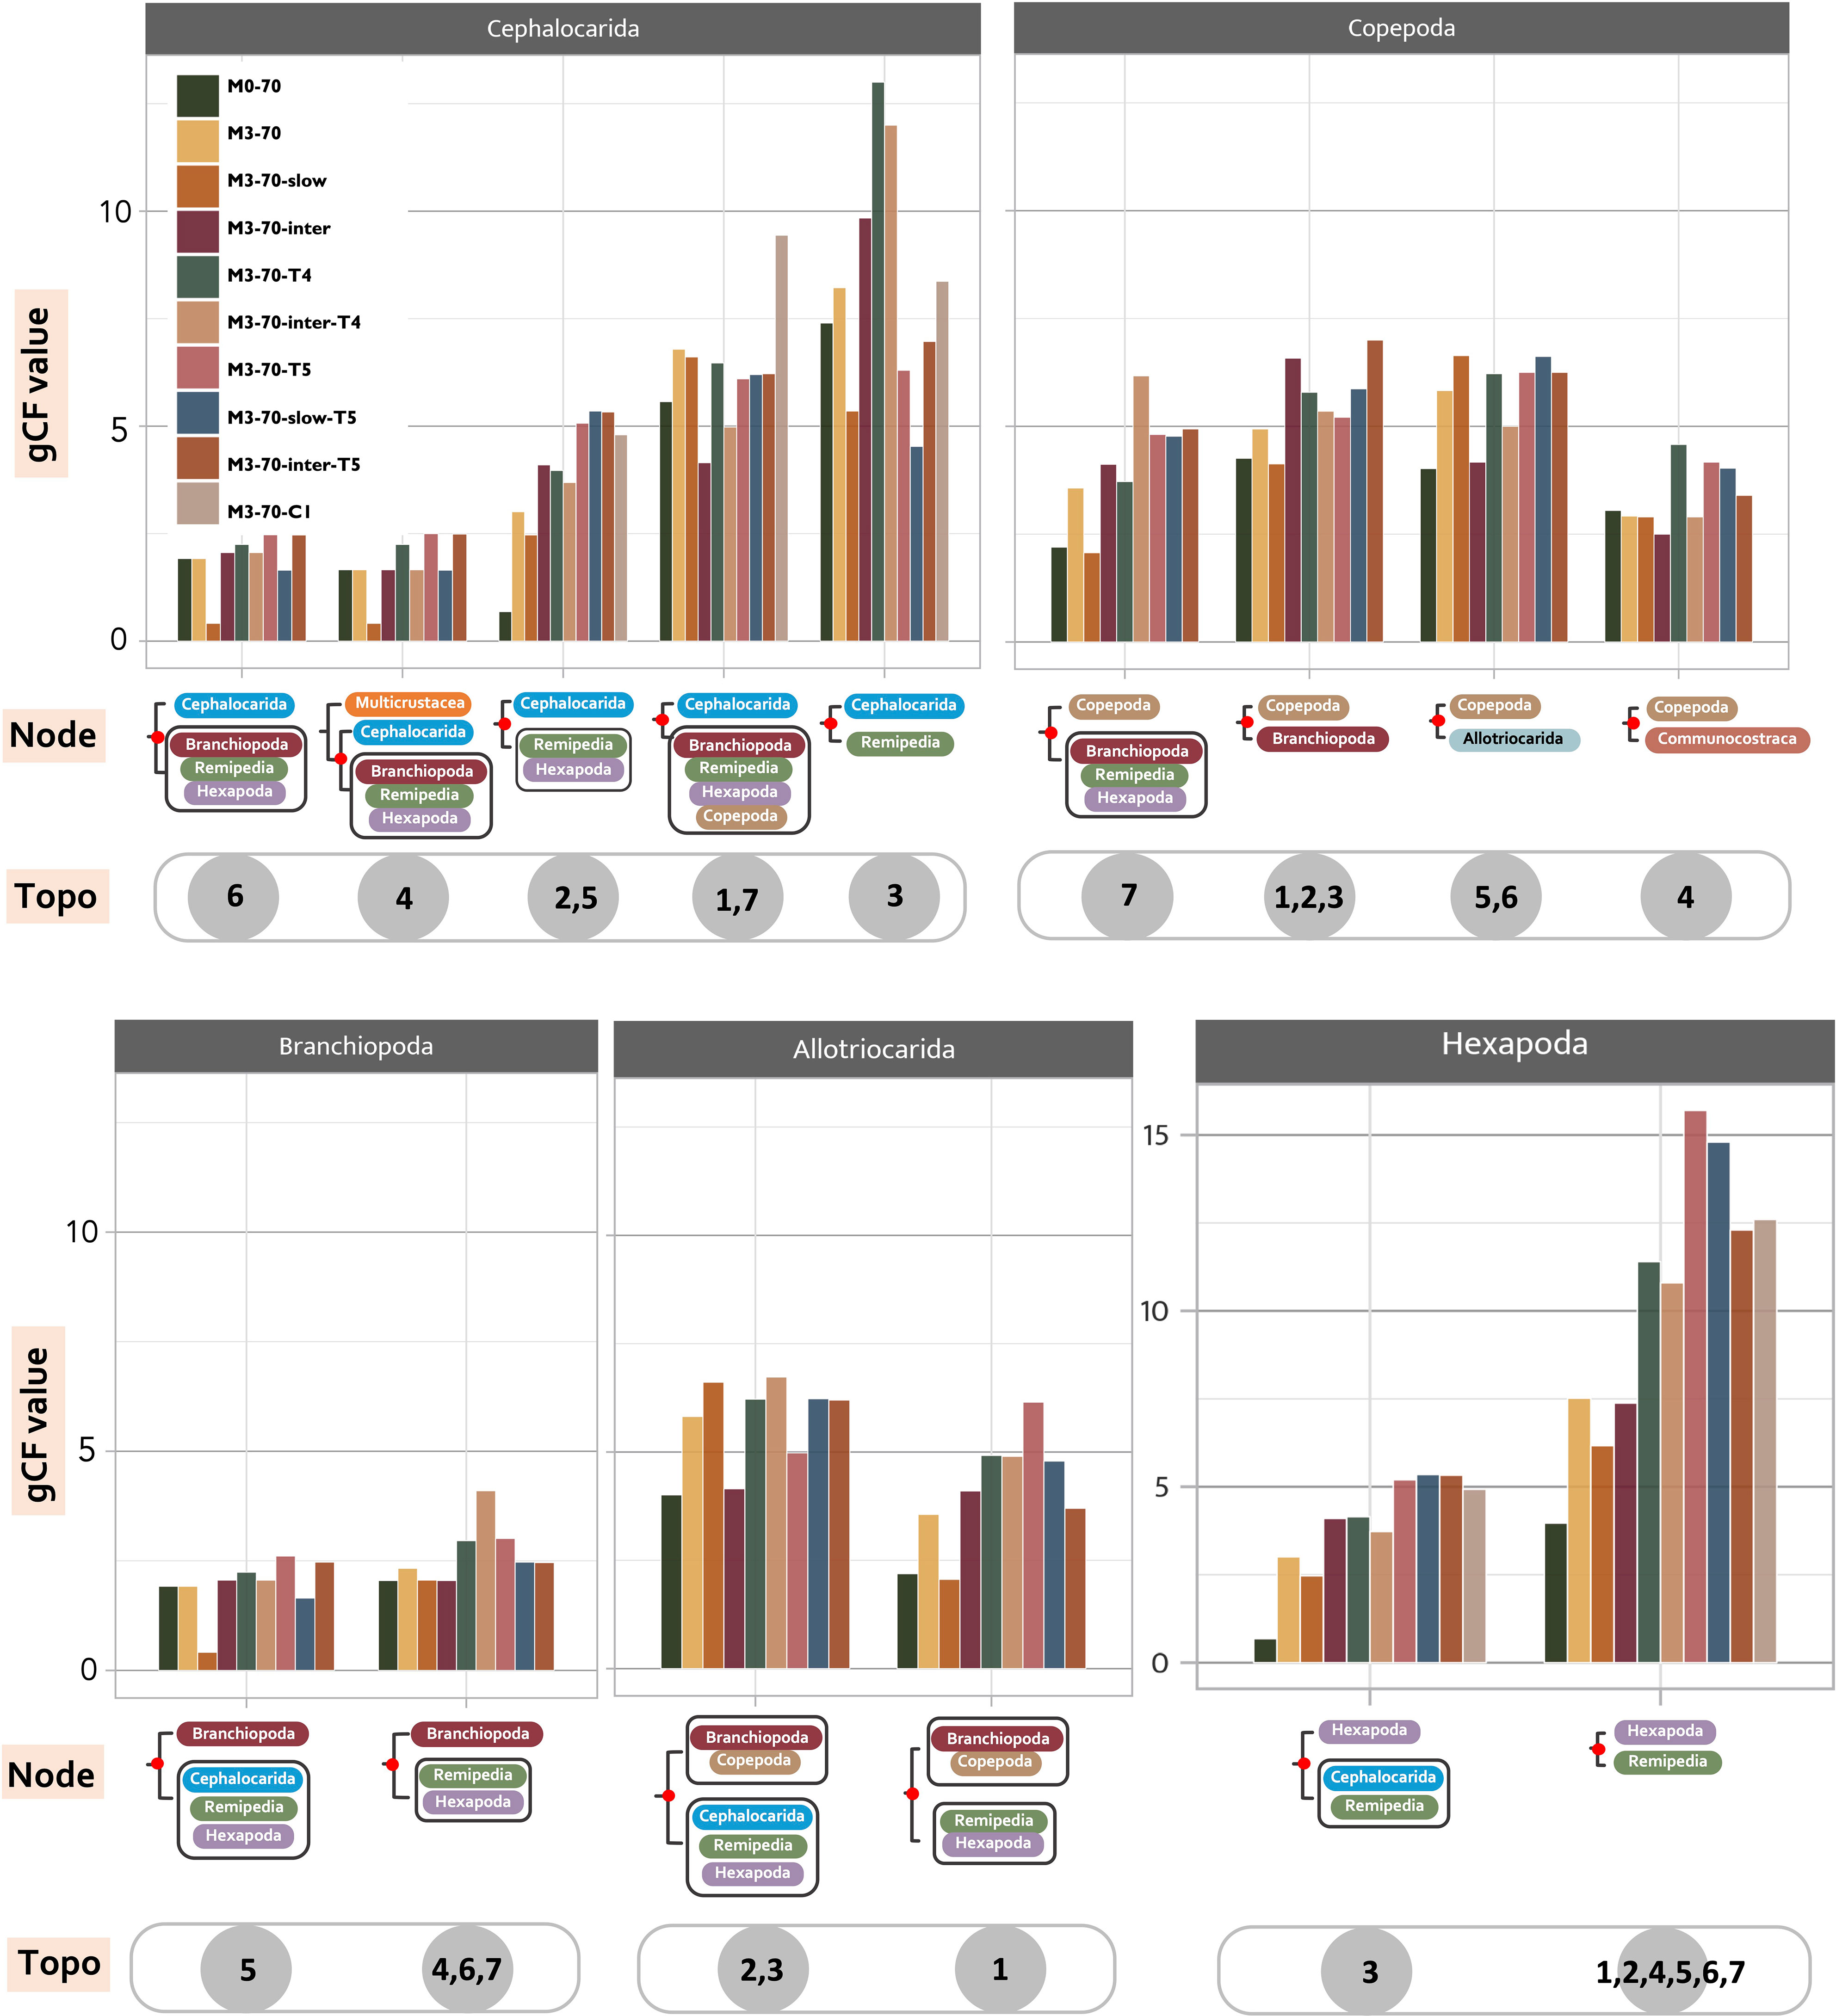
Figure 4 Low support from the analysed genes for various topologies regarding the relationships of Allotriocarida and Copepoda. Invariably low gCF values (gene concordance factors) are found at deep-level Allotriocarida phylogeny across ten selected matrices. The high-level uncertainty indicates the presence of conflicting signals at the deep-level phylogeny. For every member of Allotriocarida + Copepoda, gCF values of every recovered placement calculated from each tested matrix are separately shown. Graphic displays of every assessed relationship (Node) are placed under corresponding sets of gCF data. The grey circles contain numbers that indicate the “Topo” that supports the relationship (indicated by 1-7; “all” means the hypothesis can be recovered in all “Topo”).
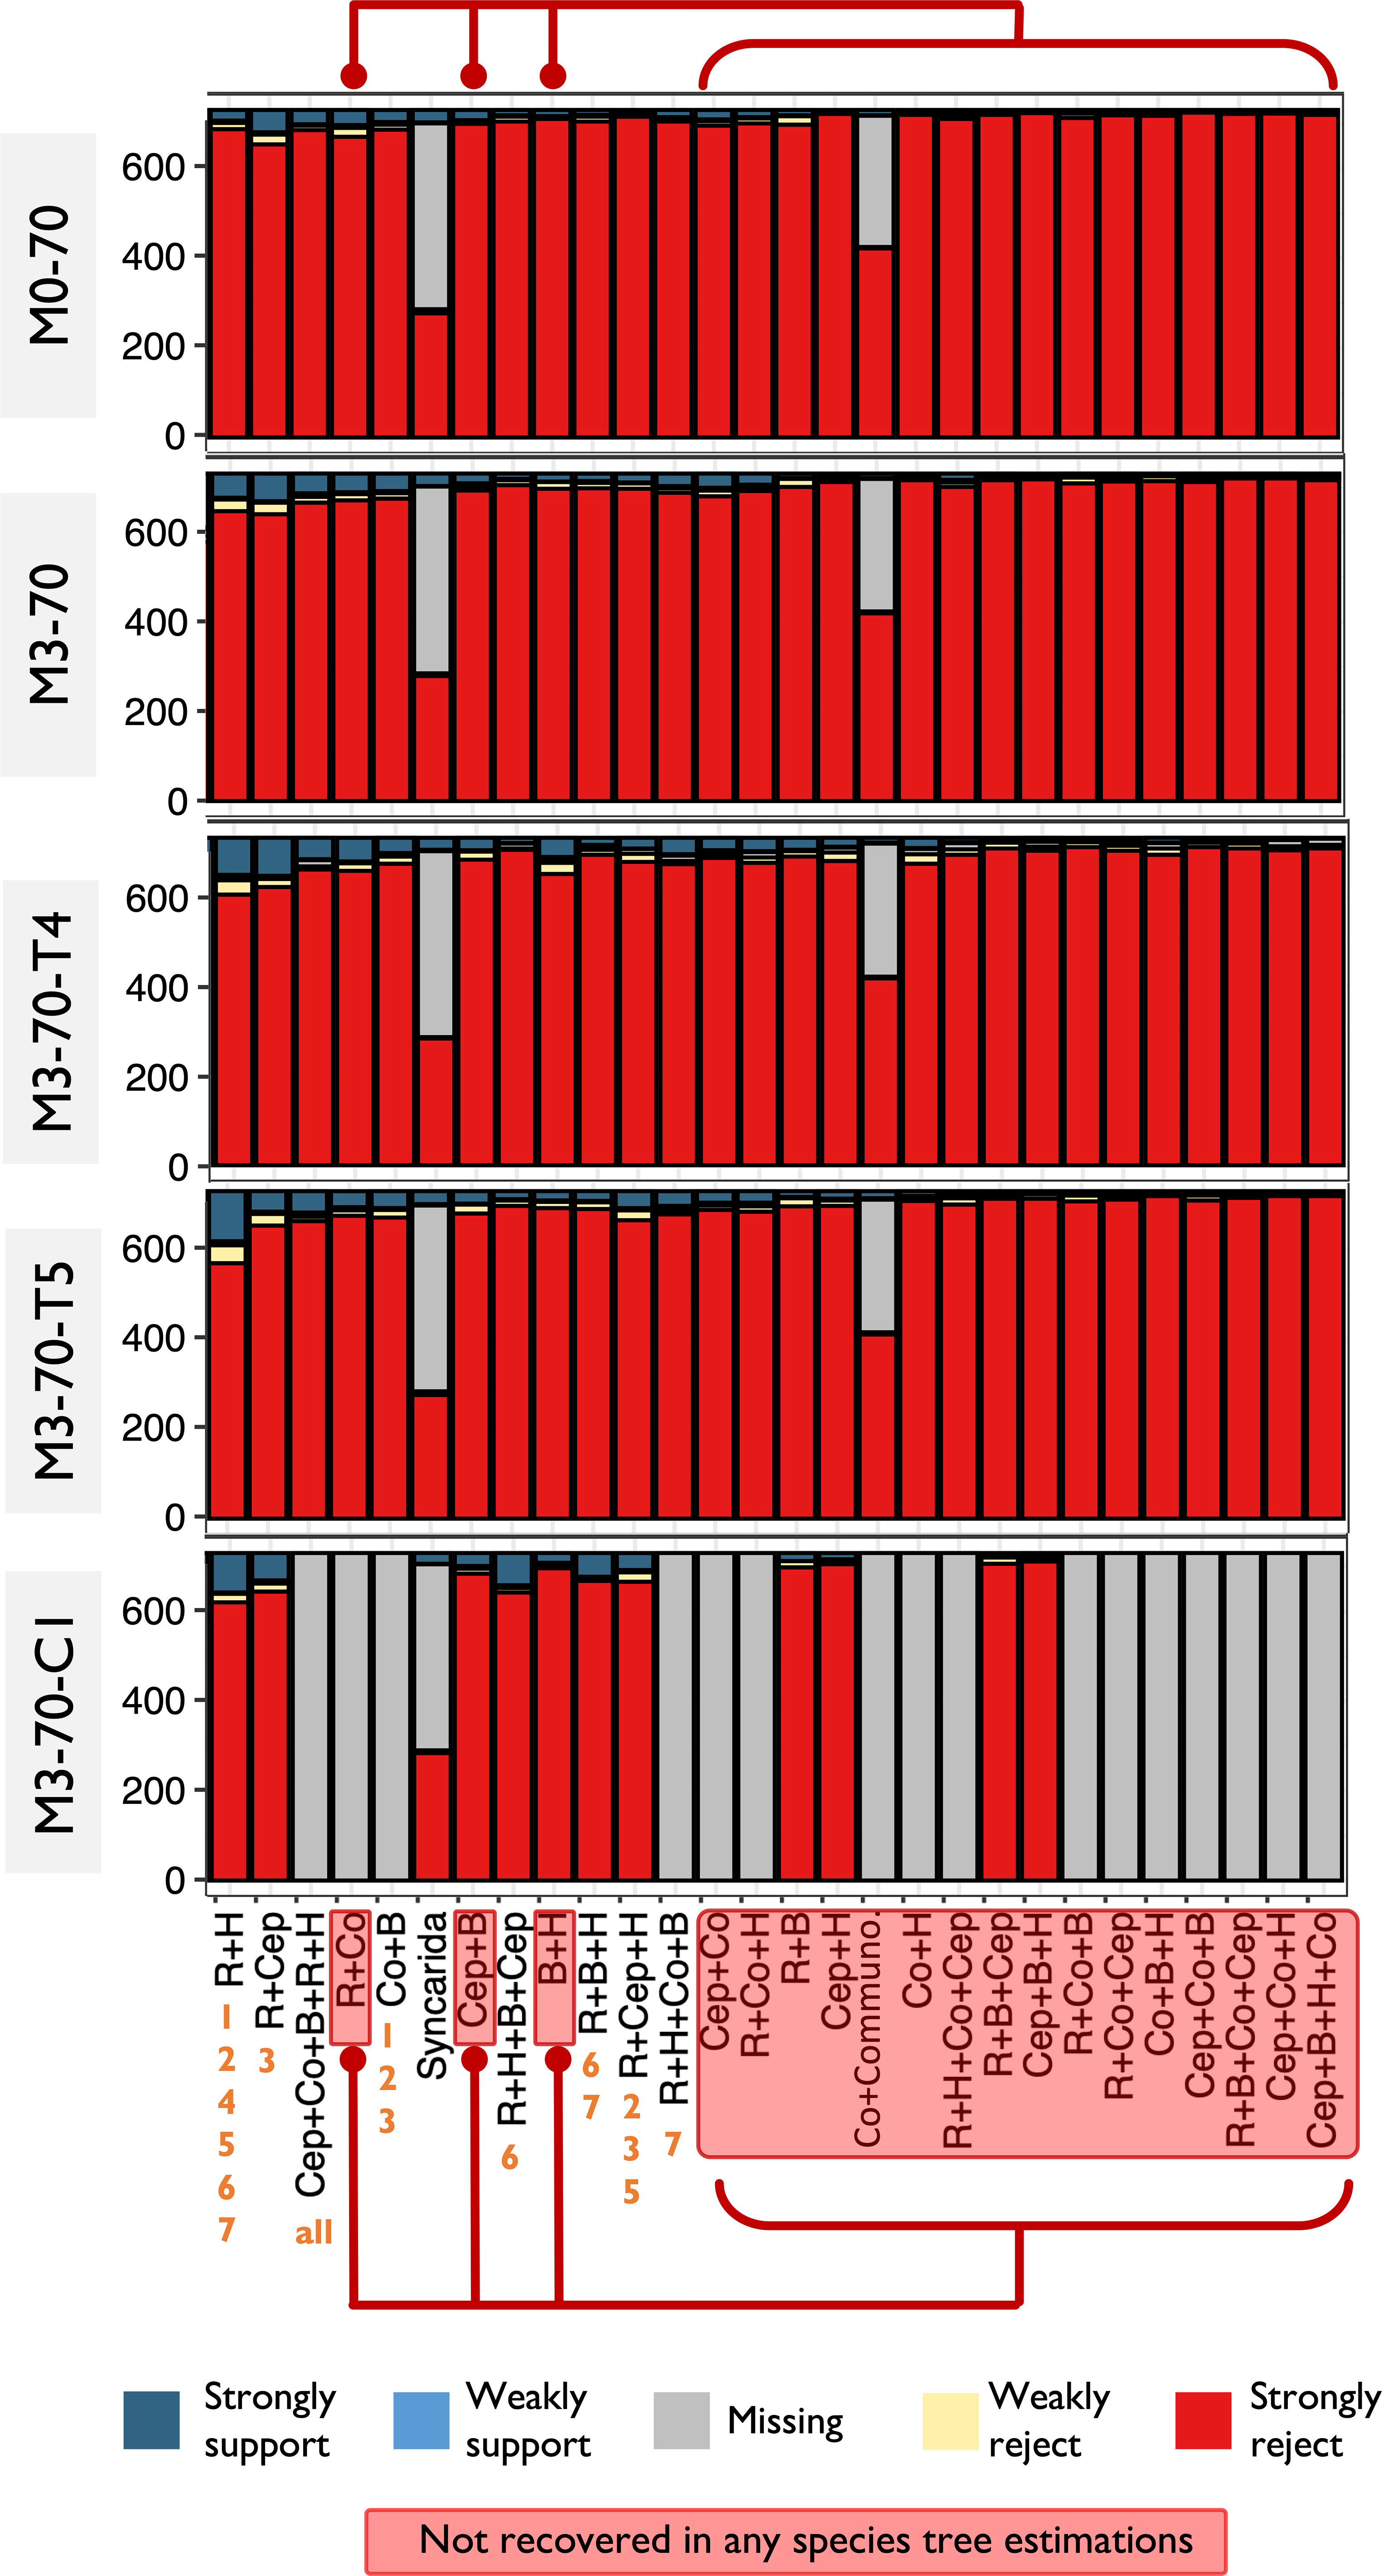
Figure 5 Discordance analysis of gene trees concludes a similar result as Figure 4. Remipedia + Hexapoda and Allotriocarida + Copepoda received slightly higher support from gene trees than the other hypotheses (except Remipedia + Cephalocarida). The relationships that were examined are arranged in descending order of the degree of support from the gene trees, from left to right. The red boxes and lines indicate the hypothetical (possible) topologies not recovered from any species tree estimation in this study.
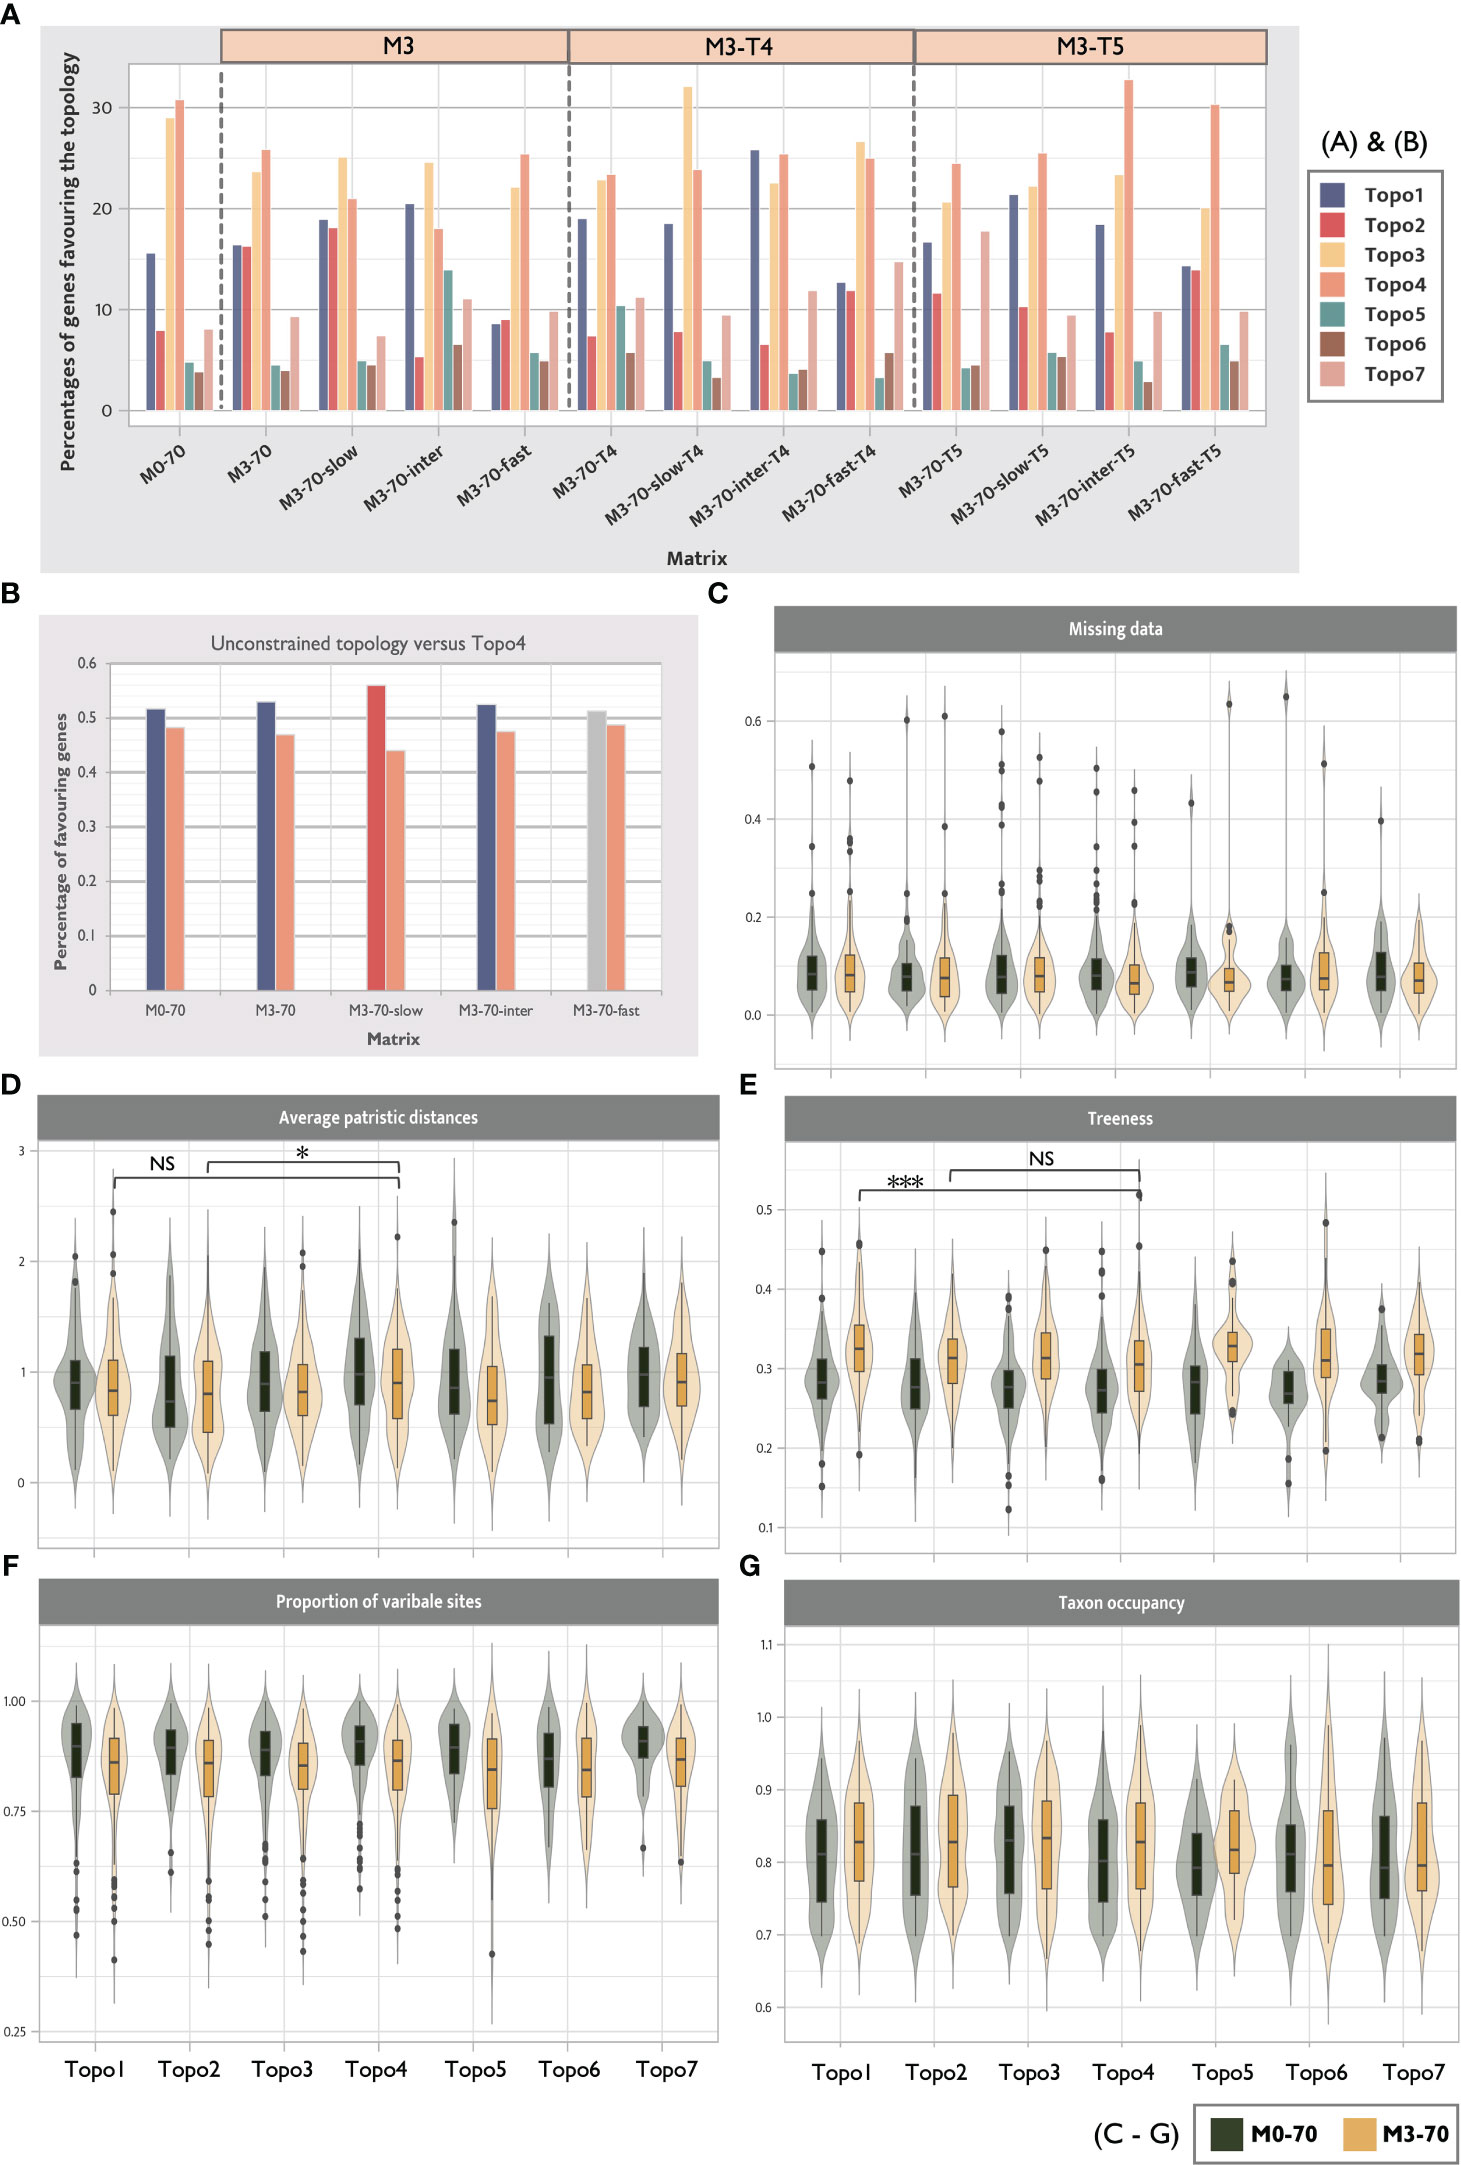
Figure 6 Distribution of phylogenetic signals shows that no hypothesis is supported by a majority of gene trees and the decline of the support of Topo3 and Topo4 after LB taxa removal. (A) ΔGLS distributions show phylogenetic support for seven competing hypotheses across 13 selected matrices. Over 70% of genes supported Hexapoda + Remipedia and Allotriocarida + Copepoda in all data sets. The pale orange boxes above the bars indicate the included matrix families (M3, M3-T4 and M3-T5) (B) The percentage changes in genes supporting unconstrained topologies of each tested matrix and Topo4. Gene-wise likelihood scores between these two topologies are compared exclusively. Unconstrained topologies of the matrices always gain a higher percentage of support from genes. After removing LB taxa and using slow-evolving genes, the number of genes supporting Topo4 decreases. However, it increases when fast-evolving genes are used. (C-G) Summary of five systemic errors between Topo1-7 for M0-70 and M3-70. Wilcoxon rank-sum test was performed between Topo1, 2 and Topo3, 4. (NS, p > 0.05; *p < 0.05, and ***p < 0.001). Genes favouring Topo4 show a significantly higher level of average patristic distance and a significantly lower treeness value than Topo2 and Topo1, respectively.
3.3.1 Concordance factor analyses reveal LBA decreases phylogenetic support of deep nodes of Allotriocarida + Copepoda
gCF and sCF offer direct assessments of uncertainties in the recovered topologies. For all of the seven topologies (Topo1-7) subjected to this assessment and in all assessed matrices, we found invariably low and equivocal gCF and sCF values (<50%) at the basal splits of Allotriocarida + Copepoda, suggesting that none of the bipartitions considered was supported by most gene trees (Figure 4). The combination of low gCF and sCF values can indicate limited phylogenetic information in alignments and conflicting signals for the clade (Minh et al., 2020). Here, Remipedia + Hexapoda and Allotriocarida + Copepoda uniformly received higher support from the gene trees than Hexapoda + Xenocarida and Copepoda + Communostraca across data sets (Figure 4: chart Hexapoda, all matrices; chart Copepoda: Topo4 vs. others, all matrices). In contrast, more than one alternative placement of Branchiopoda, Cephalocarida and Copepoda received comparable support (Figure 4: chart Branchiopoda, chart Cephalocarida and chart Copepoda; all matrices). Notably, using loci with different evolutionary rates and removing LB taxa markedly improved support for several recovered placements. After removing LB taxa, the percentage of supporting gene trees increased by over 30% in the following five groupings (Figure 4; comparing the bars of M0-70 with M3-70 in the following placements): (1) Hexapoda + Remipedia (chart Hexapoda), (2) Cephalocarida + (Hexapoda + Remipedia) (chart Cephalocarida: Topo2, 5), (3) Copepoda + (Branchiopoda + Remipedia + Hexapoda) (chart Copepoda: Topo7), (4) Copepoda at the base of Allotriocarida (chart Copepoda, Topo5, 6), and (5) Allotriocarida + Copepoda (chart Allotriocarida: both). This observation suggests that non-phylogenetic signals from LBA mask the true phylogenetic signals, resulting in reduced confidence in the unresolved deep nodes of Allotriocarida, and that LB taxa affect the accuracy of the phylogenetic tree estimation for Allotriocarida + Copepoda. Furthermore, genes with slow evolutionary rates favoured two alternative hypotheses: Copepoda sister to Allotriocarida, and ((Branchiopoda + Copepoda) + (Cephalocarida + Remipedia + Hexapoda)) (Figure 4, chart Copepoda: Topo5,6; chart Allotriocarida, left; compare M3-70 with M3-70-slow). Concurring with the analysis regarding evolutionary rates in Section 3.2.2, slowly evolving matrices favoured groupings constituting Topo2. Since slowly-evolving genes are better-suited for LBA-plagued phylogeny, these obscure placements should be considered valid competing placements within Allotriocarida. A surge in support for Xenocarida (Topo3) was recorded in M3-70-T4 and M3-70-inter-T4 (Figure 4, chart Cephalocarida: Topo3; compare M3-70 with M3-70-T4), in agreement with exacerbated LBA found in the biased hexapod sampled M3-T4 (as discussed in Section 3.2.3).
Discordance analyses of gene trees (Sayyari et al., 2018) corroborated with the concordance factor examination, providing extra evidence of the deficient support for the deep-level phylogeny of Pancrustacea. It largely agreed with the finding about the inconclusive placements within Allotriocarida described above (Figure 5).
3.3.2 ΔGLS analyses suggest Multicrustacea and Xenocarida are LBA artefacts
The distribution of concatenation-based phylogenetic signals of genes in data sets was investigated by calculating gene-wise log-likelihood scores (ΔGLS) (Shen et al., 2017). No competing hypothesis (Topo1-7) was favoured by more than 50% of genes in any tested matrices (Figure 6A). Notably, ΔGLS of all ASTRAL recovered hypotheses (Topo5-7) were uniformly low in all matrices, in agreement with a general inconsistency of loci support between concatenated and coalescence methods (Shen et al., 2021). Remipedia + Hexapoda and Copepoda + Allotriocarida (Topo1-2, 5-7) were favoured by 40% more genes than Xenocarida (Topo3) and Copepoda + Communostraca (Topo4; Multicrustacea). Notably, Topo4 was best supported in fast-evolving genes (M3-70-fast) compared with genes with slow and intermediate evolutionary rates (M3-70-slow and M3-70-intermediate), suggesting that it was likely a misleading inference stemming from LBA. Additionally, loci supporting Copepoda + Communostraca (Topo4; Multicrustacea) exhibited higher average patristic distances (APD) than those supporting Topo2 (M3-70: p-value < 0.05) and a lower treeness than Topo1 (M3-70: p-value < 0.001). Higher APD values are related to a higher chance of LBA artefacts, and low treeness implies a lower signal-to-noise ratio (Figures 6D, E). Therefore, it further suggests Multicrustacea (Topo4) was probably a result of noise and error in the data sets.
We further compared the likelihood scores of the unconstrained topology in five matrices (M0-70, M3-70, M3-70-slow, M3-70-intermediate, and M3-70-fast) with those in Topo4 (Figure 6B). The percentage of genes favouring unconstrained topologies was consistently higher than Topo4, and the number of genes favouring Topo4 decreased in the slow-evolving matrix. This result further indicates that the clustering of Copepoda + Communostraca (Multicrustacea) was attested by LBA errors and its non-phylogenetic signals (Álvarez and Wendel, 2003; Struck, 2014).
Consistent with the gCF result, the ΔGLS for Topo2 was improved after LB taxa removal (Figure 6A, M3-70) and the employment of slowly-evolving genes (Figure 6A, M3-70-slow), while it vastly dropped in the fast-evolving matrix (Figure 6A, M3-70-fast). Furthermore, fewer genes supported Topo3 and Topo4 after removing 13 LB taxa (Figure 6A, M0-70 vs. M3-70), revealing that Xenocarida (Topo3) was also a potential artefact supported by non-phylogenetic signals from LBA (in accordance with above phylogenomics result and LBA examination; Sections 3.1.1 and 3.2.3).
3.3.3 ΔGLS analyses further suggest incomplete hexapod sampling introduces spurious groupings
Loci favouring the unconstrained topologies and the most highly supported topologies of four matrices (M0-70, M3-70, M3-70-slow and M3-70-T5) were isolated and subjected to tree construction separately. The resulting ML trees mirrored the favoured hypotheses, except M3-70-T5, which recovered spurious groupings across Allotriocarida and Multicrustacea (Supplementary Figures S53, S54). It validates the presence of phylogenetic signals that support the unconstrained topologies in complete sampled matrices and highlights the phylogenetic errors derived from incomplete taxon sampling. It indicates the recovered topologies in complete sampled matrices (M0-70, M3-70 and M3-70-slow) are supported by consistent phylogenetic signals. The erroneous groupings recovered in M3-70-T5 show that there are hidden noise and errors in this incomplete sampled data set.
Unexpectedly, Topo2 was recovered in ML analyses using all matrices of incompletely sampled hexapod taxa set T5, except in M3-70-inter-T5, which yielded Topo1 (Figure 2A). As seen in ΔGLS analyses, the proportions of loci favouring Topo4 were exceptionally high in M3-70-inter-T5 and M3-70-fast-T5 (Figure 6A). The phylogenomic tree reconstruction of the Topo2-favored gene set (which had 85 loci derived from ΔGLS analysis) of M3-70-T5 resulted in a topology with ((Copepoda + Branchiopoda) + Communostraca) instead of Topo2. Similarly, the Topo4-favored gene set (179 loci) recovered ((Cephalocarida + Copepoda) + Communostraca) instead of Topo4 (Supplementary Figures S53-S54). Such erroneous groupings recovered from M3-70-T5 reflect that the matrix is dominated by non-phylogenetic signals introduced by incomplete sampling, further aggravating the difficulties of resolving phylogeny.
Therefore, one of the main findings in the present study, the proposal of the nested or sister placement of Copepoda with Allotriocarida instead of sister to Communostraca, was further confirmed by a series of phylogenetic signal analyses. Xenocarida and Copepoda + Communostraca (Multicrustacea) was refuted and the clades were likely LBA artefacts. Nevertheless, no significant phylogenetic signals supported any examined phylogenetic placement here.
As previously discussed, Bernot et al. (2023) identified Topo1 as the primary hypothesis. In their study, Copepoda is robustly supported as an extra member of Allotriocarida in ML, BI and ASTRAL analyses. However, the internal structure of Allotriocarida was observed to be unstable across different analytical methods. To address this, Bernot et al. (2023) proposed expanding the sampling of Copepoda to break LB leading to Copepoda, which could otherwise create misleading groupings. Nonetheless, the deep level of the relationship among allotriocaridans remained unchanged after the copepod-removal experiments in our study. This indicates the possibility that other sources of errors may be responsible for the uncertain placements of Copepoda in Bernot et al. (2023) (to be discussed below).
3.4 Incomplete lineage sorting is a possible cause of the low resolution in the deep-level phylogeny of Pancrustacea
The conflicting phylogenetic signals at the deep nodes of the Allotriocarida + Copepoda clade was invariably shown in our phylogenetic signal analyses. In addition, we found topology heterogeneity between ML and ASTRAL results (see Section 3.2.1), which can indicate signal conflicts in the data sets (Kubatko and Degnan, 2007; Song et al., 2012; Xi et al., 2014; Edwards et al., 2016; Bravo et al., 2019; Jiang et al., 2020). As ILS is found to be a common cause of phylogenetic incongruence, preliminary detection of ILS was performed by a simple chi-square test using gCF result in Section 3.4 to explore the presence of ILS in Pancrustacea. M0-70, M0-70-slow, M3-70, M3-70-slow, M3-70-T5 and M3-70-slow-T5 were subjected to this test. It was discovered that ILS likely contributes to gene tree discordance on all bipartitions in Allotriocarida + Copepoda. All assessed bipartitions within Allotriocarida + Copepoda were unable to reject the hypothesis of ILS (p-value > 0.5) in different examined matrices. Only the bipartition Copepoda + Branchiopoda was consistently found to be plagued by ILS in all tested matrices.
To further elucidate the prevalence of ILS at the deep-level phylogeny of Allotriocarida + Copepoda, relative frequency analyses were performed by DiscoVista using ASTRAL results (Figure 7), and yield concordant results. The internal nodes that were evaluated (shown in Figures 7A–D as Node 1-4) had similar frequencies and high combined frequencies (over 40%) of alternative quartet topologies (as seen in Figures 7A–D as T2 and T3), indicating the possibility of ILS at these nodes (Li et al., 2022). In particular, Node 2 and Node 3 both showed an almost equal proportion of three quartet frequencies (T1-3), which suggests a substantial degree of ILS. At Node 4 and Node 1, the unconstrained ASTRAL topologies (T1) of all tested matrices recovered the grouping of Remipedia + Hexapoda and the clustered relationship of Copepoda with Allotriocarida, respectively (as indicated by the orange hollow rectangles in Figures 7A, D). These relationships were consistently supported by around 50% and 40% of the quartet proportion of each matrix, respectively. The frequency of T1 was found to be higher in Node 4 as compared to Nodes 2 and 3, where the T1 frequency was less than 40%. Therefore, the level of ILS at Nodes 2 and 3 is more substantial than Node 4.
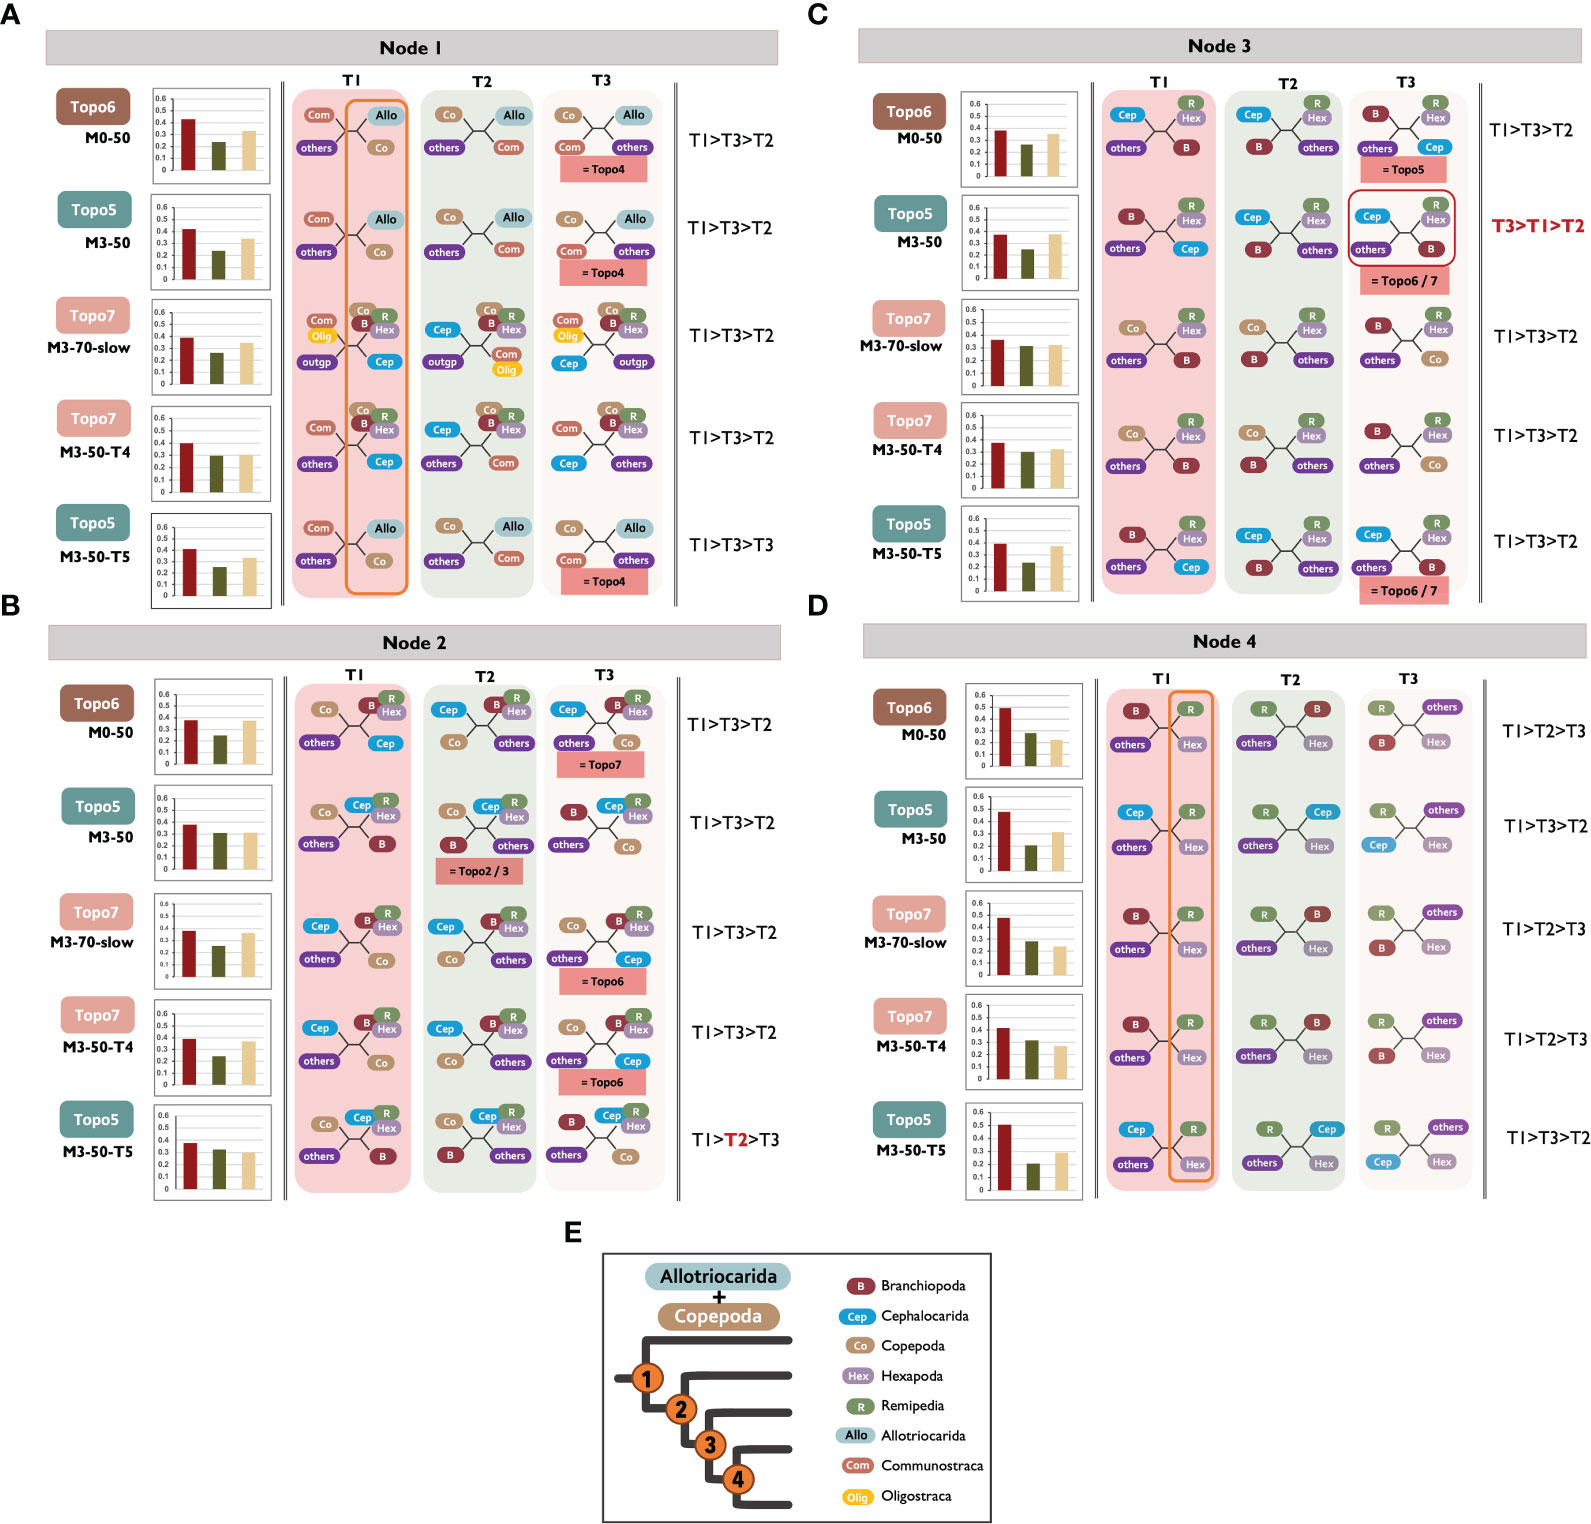
Figure 7 (A-E) Relative frequency analysis of alternative topologies supported by gene trees inferred by ASTRAL analyses. It reveals incomplete lineage sorting at the basal phylogeny of Allotriocarida (Nodes 2 and 3). The left column shows the analysed matrices. The rectangle boxes above each matrix name display the recovered, unconstrained (main) hypotheses from ASTRAL analyses. The bar plots show the percentage of quartet trees supporting the recovered ASTRAL quartet topologies (T1) and two alternative topologies (T2 and T3) in each matrix. The middle column illustrates each quartet topology (T1-3) at specific “Nodes” in each analysed matrix: the recovered ASTRAL quartet topologies (T1) and two alternative topologies (T2 and T3). The red boxes shown below the quartet topologies depict competing hypotheses (Topo) that can match the illustrated topologies. The orange hollow rectangles at Node 1 and Node 4 point out the universal recovery of Copepoda + Allotriocarida and Hexapoda + Remipedia across the matrices. The red hollow square at m3-50 of Node 3 highlights that T3 received higher support than T1. The column on the right shows the quartet topologies’ order based on the quartet support percentage received. (E) (Left) A simplified cladogram of Allotriocarida + Copepoda indicating the name of assessed nodes in relative frequency analysis. (Right) The colour code for each major lineage is described in panel A. Allo, Allotriocarida; B, Branchiopoda; Cep, Cephalocarida; Co, Copepoda; Com, Communostraca; Hex, Hexapoda; R, Remipedia; Olig, Oligostraca; others, reaming taxa; outgp, Chelicerata and Myriapoda.
Furthermore, a slight increase (2.1%) in support for Cephalocarida + Hexapoda/Remipedia (Node 3) was noted after removing LB taxa (M0-50: T1vs. M3-50: T3). This result demonstrates that the suspected LBA and ILS are likely important driving factors of genealogical discordance in the deep-level phylogeny of Allotriocarida + Copepoda (Jarvis et al., 2014; Wickett et al., 2014; Cannon et al., 2016).
ILS is a common systematic error invoking topological incongruence between species trees and gene trees (Avise and Robinson, 2008). It obstructs the accurate reconstruction and understanding of phylogenetic relationships. Although ILS has been proven pervasive in varied phylogenomic data sets, including insects (Pollard et al., 2006; Edwards, 2009; Xi et al., 2015; Richards et al., 2018; Betancur-R. et al., 2019), the impact of ILS on deep nodes of pancrustaceans has not been thoroughly investigated. In the current study, ILS is found to be partly attributable to the contradictory resulting trees between concatenation and coalescence approaches (Edwards et al., 2016; Bravo et al., 2019; Jiang et al., 2020). The variation in gene histories (i.e., ILS in this study) violates the assumption of concatenated-based inference, whereas the coalescent-based method accounts for the presence of ILS (Rannala and Yang, 2003; Liu and Pearl, 2007; Degnan and Rosenberg, 2009). Hypotheses recovered by ASTRAL (Topo5-7) should be more trustworthy. However, significant topological incongruence among ASTRAL trees suggests ILS cannot fully explain the topological heterogeneity among gene trees and species trees in this group. In the coalescent analysis, the influence of GTEE is potent, but it was not thoroughly investigated and evaluated in this study. Likewise, Bernot et al. (2023) explored the potential occurrence of GTEE in Pancrustacea. Their findings revealed multiple polytomies in the ASTRAL species tree of their complete sampled matrix (Data set 2; their Figure 3E), indicating rapid diversification that could potentially induce ILS or insufficient phylogenetic information in the input trees leading to GTEE. In addition, they found that Remipedia was grouped with paraphyletic Hexapoda in the ASTRAL tree, which was only present in the coalescent trees based on fast-evolving matrices in our study. Bernot et al. (2023) used orthologs that were on average shorter (211 AA) than ours (328 AA), which might explain the erroneous groupings and unresolved polytomy. It should be noted that their results also suggest the possibility of ILS in the phylogeny.
It is also known that introgression is another common cause of topological discordance between gene trees and species trees (Hibbins and Hahn, 2022), including in Drosophila (Suvorov et al., 2022). Thus, detecting introgression and GTEE in the phylogeny is essential in detangling the discordant and obscured phylogenetic signals of allotriocaridan phylogeny.
The notable lack of resolution within Allotriocarida owing to the possible presence of ILS is evident in this study. More in-depth analyses are required to confirm the prevalence of ILS in Pancrustacea and to examine the possibility of other biological processes leading to gene tree heterogeneity, gene tree-species tree heterogeneity, and species tree heterogeneity observed in this study. Accordingly, the recalcitrant allotriocaridan relationships could be better visualised as phylogenetic networks rather than bifurcating trees (Cai et al., 2021).
3.5 Future works to resolve Pancrustacea phylogeny
Our research presents new evidence that supports the sister relationship of Remipedia and Hexapoda and rejects the hypothesis that Multicrustacea is a monophyletic group. We propose a new grouping of Copepoda + Allotriocarida, which is complementary to the results of Bernot et al. (2023). LBs are detected in several taxa and clades in our phylogeny. Slowly-evolving genes, which are preferred for resolving deep splits and mitigating LBA, were applied and inferred Topo2 rather than the popular hypothesis Topo1 in ML searches. The major difference between Topo1 and Topo2 is the position of Cephalocarida. In Topo2, Cephalocarida is sister to (Remipedia, Hexapoda), while in Topo1, Cephalocarida is sister to the rest of Allotriocarida + Copepoda. Phylogenetic signal analyses validate that Topo2 is supported by slow-evolving genes (Figures 6A, B). Compared with Topo1, Topo2 is far less favoured in matrices of M3-T4, which have induced a long branch Hexapoda by incomplete hexapod sampling, and the non-LB-removed matrix (M0-70) (Figure 6A). Furthermore, the concordance factor analyses also favour the clustering of Cephalocarida with Remipedia and Hexapoda (Figure 4, chart Allotriocarida). These findings suggest that Topo2 (Figure 3A) might be more accurate than Topo1.
On the other hand, ASTRAL species tree reconstruction of subsampled matrices, filtered by evolutionary rates, results in three alternative topologies (Topo5 - 7) with a reduction of support at the deep nodes of Allotriocarida. Moreover, unusual groupings such as Oligostraca + Communostraca and Remipedia clustering in paraphyletic Hexapoda are found in M3-70-slow and M3-70-fast. This could be explained by the decline in the number of input loci (from ~1000 to 250). Another possible explanation for the unusual grouping is the low phylogenetic signals in slowly evolving genes and the presence of phylogenetic noise in fast-evolving genes. Nonetheless, relative frequency analysis reveals a comparable frequency of two discordant topologies at the nodes connecting Allotriocarida, Communostraca, Oligostraca and outgroups (Allotriocarida + Communostraca: 40%; Oligostraca + Communostraca: 33%; Oligostraca + Allotriocarida: 27%). Under the presence of ILS, more loci are required to improve the accuracy of summary tree approaches (Molloy and Warnow, 2018; Shekhar et al., 2018). Oligostraca + Communostraca found in M3-70-slow could be a spurious relationship caused by insufficient input data to account for ILS in the phylogenetic analyses. Therefore, due to the prevalence of ILS in the high-level phylogeny of Allotriocarida, the ASTRAL species tree inferred from M3-70 is considered to be more reliable (Figure 3B).
However, due to the possibility of introgression in Pancrustacea, these hypotheses should be considered with caution. The models used in concatenation-based and coalescent-based methods do not account for introgression, which might lead to inaccurate tree estimation. Thus, accessing the contribution and co-presence of LBA, ILS, GTEE, and other biological processes (e.g., introgression) to genealogical discordance is crucial before further attempts in designing phylogenetic experiments for pancrustacean members, especially the obdurate nodes in Allotriocarida (Losos, 2011; Roch and Warnow, 2015; Xi et al., 2015; Molloy and Warnow, 2018; Bossert et al., 2020; Cai et al., 2021; Morales-Briones et al., 2020).
3.5.1 Use tree-based orthology approaches to reduce non-phylogenetic signals
The topological divergences between molecular studies might be attributed to different ortholog selection approaches. Previous molecular studies on pancrustacean phylogeny often derived orthologs from OMA (The Orthologous Matrix) (but this study and the concurrent study by Bernot et al. (2023) are the first to utilise tree-based orthology inference from the start (Lozano-Fernandez et al., 2019 applied tree-based filtering on an expanded core dataset derived from pan-arthropod EST). The distance-based orthology inference (e.g., OMA) is prone to systematic errors arising from gene duplication and possible hidden paralogy, while the phylogenetically informed strategy (tree-based) has a higher precision in ortholog identification (Kocot et al., 2013; Yang and Smith, 2014; Ballesteros and Hormiga, 2016). As Hexapoda exhibited extensive genome duplication in various lineages (Li et al., 2018; Roelofs et al., 2020), the drawback of paralog inclusion could be exacerbated in distance-based studies. Therefore, Multicrustacea monophyly may be an erroneous relationship supported by non-phylogenetic signals (non-orthologous signals) stemming from orthology errors. Congruent to our interpretation, Copepoda + Allotriocarida was inferred as the primary topology of Allotriocarida by Bernot et al. (2023) using tree-based ortholog identification.
3.5.2 Use slowly-evolving genes to mitigate LBA
When it comes to uncovering deep-level phylogenetic relationships, slowly-evolving genes that exhibit phylogenetic signals are more reliable than fast-evolving genes that can obscure such signals (Aguinaldo et al., 1997; Li et al., 2008; Soubrier et al., 2012; Zhang et al., 2012; Lang et al., 2013; Patwardhan et al., 2014; Duchêne et al., 2022). This is because fast-evolving genes may have multiple substitutions on the same site, which can increase the saturation level and lead to misleading phylogenetic inference for ancient divergence events (Graybeal, 1994; Townsend, 2007; Philippe et al., 2009; Townsend et al., 2012). By choosing genes with an appropriate evolutionary rate, the accuracy of phylogenetic inferences can be improved (Townsend, 2007).
3.5.3 Higher taxonomic coverage is necessary
Future efforts to resolve deep divergence of Allotriocarida + Copepoda should also focus on improving and expanding the genomic data of Cephalocarida and Remipedia. The position of Cephalocarida is exceptionally unstable in our analyses (see Topo1-7). Given that all available data from these two groups were included in this study, high-throughput sequencing of genera that have not been sequenced is necessary for resolving this phylogenetic uncertainty. Bernot et al. (2023) also agreed that future expansion of well-assembled genomes can be leveraged in synteny analysis to provide additional information to resolve the phylogeny of Pancrustacea.
3.5.4 Future direction of other phylogenetic relationships in Pancrustacea
Although this phylogenomic study cannot fully disentangle the relationship of Allotriocarida + Copepod, most well-established clades and relationships in the other pancrustaceans were maximally supported (see Section 3.2), including Oligostraca recovered as the sister to all other pancrustaceans. Nonetheless, in the present study, inconsistent patterns from recovered ML and ASTRAL analyses emerged at several nodes outside Allotriocarida. The retrieved topologies challenged the monophyly of Ostracoda, the monophyly of Syncarida, the early diverging group of Peracarida and the position of Hoplocarida. The two ostracods and two syncarids sampled in this study were found to be polyphyletic, respectively. Within Peracarida, either Amphipoda or Stygiomysida was recovered to be the earliest diverging group. Most ML results recovered the latter relationship, except M0-70-slow and M3-70-slow, while most ASTRAL analyses recovered the former relationship except M0-70, suggesting underlying gene tree discordance at this node. Lastly, the position of Hoplocarida was affected by taxon occupancy. The resolution of these parts of the tree would be most benefitted from extensive taxon sampling, especially the early diverging group of the clades concerned. Further investigation regarding tree discordance and potential phylogenetic signal conflict is needed to resolve these unstable nodes. Additionally, a recent study showed that prevailing substitution saturation (> 50% of used loci) was found in decapod, butterfly and stinging wasp phylogenetic datasets. Extra attention should be paid to the widespread loci saturation in pancrustaceans and the selection of phylogenetic markers in future works (Duchêne et al., 2022). Available approaches like DAMBE (Xia and Lemey, 2009; Xia, 2018) and assessment of phylogenetic informativeness (Townsend and Leuenberger, 2011; Dornburg et al., 2019) could be used.
4 Conclusion
This study presents a comprehensive phylogenomic analysis, with more accurate orthology inference and novel phylogenetic signal analyses to decipher the deep relationship of Pancrustacea, explicitly targeting the clade Allotriocarida. A high variance in recovered topologies of the deep nodes of Allotriocarida + Copepoda is observed. A total of six different hypotheses regarding the position of Branchiopoda, Cephalocarida, Copepoda, Hexapoda and Remipedia were retrieved from ML and ASTRAL tree estimations. The phylogenomic analyses in this study reject the conventional clustering of Copepoda + Communostraca (i.e., Multicrustacea; Topo4) by consistently recovering Copepoda + Allotriocarida (51/55 tree analyses). Aligned with previous results, the closest crustacean to Hexapoda is invariably found to be Remipedia with maximal bootstrap support (54/55 analyses). Expectedly, LBA is detected in the tree of Pancrustacea. It was shown to reduce the resolution of the phylogenetic analyses and instigate spurious phylogenetic relationships, which were supported in previous works.
Contrary to LB-removal and the employment of slowly evolving genes, the application of the site-heterogeneous model demonstrates a negligible impact on the phylogenetic results. When analysing the impact of LBA, it is recommended to consider different migration practices and conduct follow-up phylogenetic signal analyses. Our study presents a new hypothesis, Cephalocarida clustering with Remipedia + Hexapoda (namely, Topo2 and 5), supported by LBA-mitigating matrices (slow-evolving genes) and phylogenetic signal analyses.
Through the examination of phylogenetic signals, Xenocarida (Topo3) and Copepoda + Communostraca (Topo4) are found to reflect non-phylogenetic signals instead of true phylogenetic signals. Multiple lines of evidence support this result. After removing LB taxa, the support from gene trees for both Topo3 and Topo4 decreased in terms of gene tree topological concordance factors and gene-wise likelihood scores. It was revealed that Topo3 and Topo4 had the lowest gCF values at respective branches (Figure 4, Hexapoda and Copepoda). In fact, Topo3 was only recovered in an LBA-exacerbated matrix (M3-70-fast-T4), implying that LBA likely influences this grouping. Additionally, it was discovered that genes supporting Topo4 exhibited a higher level of systematic errors (i.e., LBA and noise) than Topo1 and 2. This is consistent with the finding that slow-evolving loci less favour Topo4 in gCF and ΔGLS analysis. Taken together, these results suggest that the support for Topo3 and Topo4 in previous works is unreliable because they are due to systematic errors (LBA and noise) and do not reflect accurate phylogenetic relationships.
However, the uncertainty of the placements of Branchiopoda, Cephalocarida and Copepoda remains. A lack of support from the underlying phylogenetic signals was found across deep nodes of Allotriocarida + Copepoda. Together with the topological heterogeneity observed among ML and ASTRAL species trees, it implies the presence of a highly conflicting signal at the deep nodes.
The results of the relative frequency analyses corroborate this observation and suggest that ILS, along with LBA, may be the contributing factors to the conflicting relationships of Allotriocarida + Copepoda, observed topological incongruence between gene trees and species trees, limited support from gene trees, and conflicting phylogenetic signals. This study provides primary proof of how the pervasiveness and incidence of systematic errors (ILS and LBA) obscure the reconstruction of Pancrustacean’s phylogeny, specifically Allotriocarida. To gain a better understanding of pancrustacean evolutionary history, future studies should not only expand the taxonomic sampling of Cephalocarida and Remipedia but also detect other common yet unexplored biological forces responsible for unstable topology recovery, such as introgression.
Data availability statement
Publicly available datasets were analysed in this study. This data can be found here: https://zenodo.org/records/8052582?.
Author contributions
Conceptualisation, Methodology, Investigation, Visualisation, Writing - original draft: HY. Resources, Supervision, Funding acquisition, Writing - review & editing: LT, KC, and KM. All authors contributed to the article and approved the submitted version.
Funding
The author(s) declare financial support was received for the research, authorship, and/or publication of this article. This research was supported by a grant from the General Research Fund of the Research Grants Council, Hong Kong Special Administrative Region, China (project no. CUHK14176317) to KC and LT and a grant from Guangdong Basic and Applied Basic Research Foundation (project no. 2021A1515110244) to KM.
Acknowledgments
The authors would like to thank colleagues in the Simon F.S. Li Marine Science Laboratory, The Chinese University of Hong Kong, for inspiring discussion.
Conflict of interest
The authors declare that the research was conducted in the absence of any commercial or financial relationships that could be construed as a potential conflict of interest.
Publisher’s note
All claims expressed in this article are solely those of the authors and do not necessarily represent those of their affiliated organizations, or those of the publisher, the editors and the reviewers. Any product that may be evaluated in this article, or claim that may be made by its manufacturer, is not guaranteed or endorsed by the publisher.
Supplementary material
The Supplementary Material for this article can be found online at: https://www.frontiersin.org/articles/10.3389/fevo.2024.1243221/full#supplementary-material
References
Agnarsson I., May-Collado L. J. (2008). The phylogeny of Cetartiodactyla: The importance of dense taxon sampling, missing data, and the remarkable promise of cytochrome b to provide reliable species-level phylogenies. Mol. Phylogenet Evol. 48, 964–985. doi: 10.1016/J.YMPEV.2008.05.046
Aguinaldo A. M. A., Turbeville J. M., Linford L. S., Rivera M. C., Garey J. R., Raff R. A., et al. (1997). Evidence for a clade of nematodes, arthropods and other moulting animals. Nature 387, 489–493. doi: 10.1038/387489a0
Altenhoff A. M., Dessimoz C. (2009). Phylogenetic and functional assessment of orthologs inference projects and methods. PloS Comput. Biol. 5, e1000262. doi: 10.1371/journal.pcbi.1000262
Altenhoff A. M., Studer R. A., Robinson-Rechavi M., Dessimoz C. (2012). Resolving the Ortholog Conjecture: Orthologs Tend to Be Weakly, but Significantly, More Similar in Function than Paralogs. PloS Comput. Biol. 8, e1002514. doi: 10.1371/journal.pcbi.1002514
Álvarez I., Wendel J. F. (2003). Ribosomal ITS sequences and plant phylogenetic inference. Mol. Phylogenet Evol. 29, 417–434. doi: 10.1016/S1055-7903(03)00208-2
Andrew D. R. (2011). A new view of insect–crustacean relationships II. Inferences from expressed sequence tags and comparisons with neural cladistics. Arthropod. Struct. Devel. 40, 289–302. doi: 10.1016/J.ASD.2011.02.001
Avise J. C., Robinson T. J. (2008). Hemiplasy: A new term in the lexicon of phylogenetics. Syst. Biol. 57, 503–507. doi: 10.1080/10635150802164587
Ballesteros J. A., Hormiga G. (2016). A new orthology assessment method for phylogenomic data: unrooted phylogenetic orthology. Mol. Biol. Evol. 33, 2117–2134. doi: 10.1093/molbev/msw069
Ballesteros J. A., Sharma P. P. (2019). A critical appraisal of the placement of xiphosura (Chelicerata) with account of known sources of phylogenetic error. Syst. Biol. 68, 896–917. doi: 10.1093/SYSBIO/SYZ011
Bapteste E., Susko E., Leigh J., Ruiz-Trillo I., Bucknam J., Doolittle W. F. (2008). Alternative methods for concatenation of core genes indicate a lack of resolution in deep nodes of the prokaryotic phylogeny. Mol. Biol. Evol. 25, 83–91. doi: 10.1093/MOLBEV/MSM229
Baurain D., Brinkmann H., Philippe H. (2007). Lack of resolution in the animal phylogeny: closely spaced cladogeneses or undetected systematic errors? Mol. Biol. Evol. 24, 6–9. doi: 10.1093/MOLBEV/MSL137
Benavides L. R., Edgecombe G. D., Giribet G. (2023). Re-evaluating and dating myriapod diversification with phylotranscriptomics under a regime of dense taxon sampling. Mol. Phylogenet Evol. 178, 107621. doi: 10.1016/J.YMPEV.2022.107621
Bernot J. P., Owen C. L., Wolfe J. M., Meland K., Olesen J., Crandall K. A. (2023). Major revisions in pancrustacean phylogeny and evidence of sensitivity to taxon sampling. Mol. Biol. Evol. 40, msad175. doi: 10.1093/MOLBEV/MSAD175
Betancur-R. R., Arcila D., Vari R. P., Hughes L. C., Oliveira C., Sabaj M. H., et al. (2019). Phylogenomic incongruence, hypothesis testing, and taxonomic sampling: The monophyly of characiform fishes. Evol. (N. Y.) 73, 329–345. doi: 10.1111/evo.13649
Blom M. P. K., Bragg J. G., Potter S., Moritz C. (2017). Accounting for uncertainty in gene tree estimation: summary-coalescent species tree inference in a challenging radiation of Australian lizards. Syst. Biol. 66, 352–366. doi: 10.1093/SYSBIO/SYW089
Borner J., Rehm P., Schill R. O., Ebersberger I., Burmester T. (2014). A transcriptome approach to ecdysozoan phylogeny. Mol. Phylogenet Evol. 80, 79–87. doi: 10.1016/J.YMPEV.2014.08.001
Bossert S., Murray E. A., Pauly A., Chernyshov K., Brady S. G., Danforth B. N. (2020). Gene tree estimation error with ultraconserved elements: An empirical study on Pseudapis bees. Syst. Biol. 70 (4), 803–821. doi: 10.1093/sysbio/syaa097
Bracken-Grissom H., Wolfe J. M. (2020). The pancrustacean conundrum: A conflicted phylogeny with emphasis on crustacea. Evol. Biogeography 8, 80–104. doi: 10.1093/OSO/9780190637842.003.0004
Bravo G. A., Antonelli A., Bacon C. D., Bartoszek K., Blom M. P. K., Huynh S., et al. (2019). Embracing heterogeneity: Coalescing the tree of life and the future of phylogenomics. PeerJ 2019, e6399. doi: 10.7717/PEERJ.6399/SUPP-2
Brown J. M., Thomson R. C. (2016). Bayes factors unmask highly variable information content, bias, and extreme influence in phylogenomic analyses. Syst. Biol. 66, syw101. doi: 10.1093/sysbio/syw101
Cai L., Xi Z., Lemmon E. M., Lemmon A. R., Mast A., Buddenhagen C. E., et al. (2021). The perfect storm: gene tree estimation error, incomplete lineage sorting, and ancient gene flow explain the most recalcitrant ancient angiosperm clade, malpighiales. Syst. Biol. 70, 491–507. doi: 10.1093/SYSBIO/SYAA083
Cannon J. T., Vellutini B. C., Smith J., Ronquist F., Jondelius U., Hejnol A. (2016). Xenacoelomorpha is the sister group to Nephrozoa. Nature 530 (7588), 89–93. doi: 10.1038/nature16520
Capella-Gutiérrez S., Silla-Martínez J. M., Gabaldón T. (2009). trimAl: a tool for automated alignment trimming in large-scale phylogenetic analyses. Bioinformatics 25, 1972–1973. doi: 10.1093/BIOINFORMATICS/BTP348
Chen F., Mackey A. J., Vermunt J. K., Roos D. S. (2007). Assessing performance of orthology detection strategies applied to eukaryotic genomes. PloS One 2, e383. doi: 10.1371/journal.pone.0000383
Degnan J. H., Rosenberg N. A. (2009). Gene tree discordance, phylogenetic inference and the multispecies coalescent. Trends Ecol. Evol. 24, 332–340. doi: 10.1016/J.TREE.2009.01.009
Dell’Ampio E., Meusemann K., Szucsich N. U., Peters R. S., Meyer B., Borner J., et al. (2014). Decisive data sets in phylogenomics: lessons from studies on the phylogenetic relationships of primarily wingless insects. Mol. Biol. Evol. 31, 239–249. doi: 10.1093/molbev/mst196
Delsuc F., Brinkmann H., Philippe H. (2005). Phylogenomics and the reconstruction of the tree of life. Nat. Rev. Genet. 6, 361–375. doi: 10.1038/nrg1603
Dornburg A., Su Z., Townsend J. P. (2019). Optimal rates for phylogenetic inference and experimental design in the era of genome-scale data sets. Syst. Biol. 68, 145156. doi: 10.1093/SYSBIO/SYY047
Duchêne D. A., Mather N., van der Wal C., Ho S. Y. W. (2022). Excluding loci with substitution saturation improves inferences from phylogenomic data. Syst. Biol. 71, 676–689. doi: 10.1093/SYSBIO/SYAB075
Eddy S. R. (2011). Accelerated profile HMM searches. PloS Comput. Biol. 7, e1002195. doi: 10.1371/journal.pcbi.1002195
Edwards S. V. (2009). Is a new and general theory of molecular systematics emerging? Evolution 63, 1–19. doi: 10.1111/J.1558-5646.2008.00549.X
Edwards S. V., Xi Z., Janke A., Faircloth B. C., McCormack J. E., Glenn T. C., et al. (2016). Implementing and testing the multispecies coalescent model: A valuable paradigm for phylogenomics. Mol. Phylogenet Evol. 94, 447–462. doi: 10.1016/J.YMPEV.2015.10.027
Emms D. M., Kelly S. (2019). OrthoFinder: Phylogenetic orthology inference for comparative genomics. Genome Biol. 20, 238. doi: 10.1186/s13059-019-1832-y
Eyun S. (2017). Phylogenomic analysis of copepoda (Arthropoda, crustacea) reveals unexpected similarities with earlier proposed morphological phylogenies. BMC Evol. Biol. 17, 112. doi: 10.1186/S12862-017-0883-5/FIGURES/4
Felsenstein J. (1978). Cases in which Parsimony or Compatibility Methods will be Positively Misleading. Syst. Biol. 27, 401–410. doi: 10.1093/SYSBIO/27.4.401
Feuda R., Dohrmann M., Pett W., Philippe H., Rota-Stabelli O., Lartillot N., et al. (2017). Improved modeling of compositional heterogeneity supports sponges as sister to all other animals. Curr. Biol. 27, 38643870. doi: 10.1016/j.cub.2017.11.008
Freitas L., Mello B., Schrago C. G. (2018). Multispecies coalescent analysis confirms standing phylogenetic instability in Hexapoda. J. Evol. Biol. 31, 1623–1631. doi: 10.1111/JEB.13355
Fu L., Niu B., Zhu Z., Wu S., Li W. (2012). CD-HIT: accelerated for clustering the next-generation sequencing data. Bioinformatics 28, 3150. doi: 10.1093/BIOINFORMATICS/BTS565
Gabaldón T. (2008). Large-scale assignment of orthology: back to phylogenetics? Genome Biol. 9, 235. doi: 10.1186/gb-2008-9-10-235
Glenner H., Thomsen P. F., Hebsgaard M. B., Sørensen M. V., Willerslev E. (2006). The origin of insects. Sci. (1979) 314, 1883–1884. doi: 10.1126/science.1129844
Graybeal A. (1994). Evaluating the phylogenetic utility of genes: A search for genes informative about deep divergences among vertebrates. Syst. Biol. 43, 174–193. doi: 10.1093/SYSBIO/43.2.174
Heath T. A., Hedtke S. M., Hillis D. M. (2008). Taxon sampling and the accuracy of phylogenetic analyses. J. Syst. Evol. 46, 239–257. doi: 10.3724/SP.J.1002.2008.08016
Hedtke S. M., Townsend T. M., Hillis D. M. (2006). Point of view resolution of phylogenetic conflict in large data sets by increased taxon sampling. Syst. Biol. 55, 522–529. doi: 10.1080/10635150600697358
Hendy M. D., Penny D. (1989). A framework for the quantitative study of evolutionary trees. Syst. Zool 38, 297. doi: 10.2307/2992396
Hibbins M. S., Hahn M. W. (2022). Phylogenomic approaches to detecting and characterizing introgression. Genetics 220, iyab173. doi: 10.1093/GENETICS/IYAB173
Hillis D. M. (1998). Taxonomic sampling, phylogenetic accuracy, and investigator bias. Syst. Biol. 47, 3–8. doi: 10.1080/106351598260987
Hoang D. T., Chernomor O., Von Haeseler A., Minh B. Q., Vinh L. S. (2018). UFBoot2: improving the ultrafast bootstrap approximation. Mol. Biol. Evol. 35, 518–522. doi: 10.1093/MOLBEV/MSX281
Jarvis E. D., Mirarab S., Aberer A. J., Li B., Houde P., Li C., et al. (2014). Whole-genome analyses resolve early branches in the tree of life of modern birds. Science. 346 (6215), 1320–1331. doi: 10.1126/SCIENCE.1253451
Jeffroy O., Brinkmann H., Delsuc F., Philippe H. (2006). Phylogenomics: the beginning of incongruence? Trends Genet. 22 (4), 225–231. doi: 10.1016/j.tig.2006.02.003
Jiang X., Edwards S. V., Liu L., Faircloth B. (2020). The multispecies coalescent model outperforms concatenation across diverse phylogenomic data sets. Syst. Biol. 69, 795–812. doi: 10.1093/SYSBIO/SYAA008
Johnson M. G., Gardner E. M., Liu Y., Medina R., Goffinet B., Shaw A. J., et al. (2016). HybPiper: Extracting coding sequence and introns for phylogenetics from high-throughput sequencing reads using target enrichment. Appl. Plant Sci. 4. doi: 10.3732/apps.1600016
Kalyaanamoorthy S., Minh B. Q., Wong T. K. F., Von Haeseler A., Jermiin L. S. (2017). ModelFinder: fast model selection for accurate phylogenetic estimates. Nat. Methods 14, 587–589. doi: 10.1038/nmeth.4285
Katoh K., Standley D. M. (2013). MAFFT multiple sequence alignment software version 7: improvements in performance and usability. Mol. Biol. Evol. 30, 772–780. doi: 10.1093/molbev/mst010
Kocot K. M., Citarella M. R., Moroz L. L., Halanych K. M. (2013). PhyloTreePruner: A phylogenetic tree-based approach for selection of orthologous sequences for phylogenomics. Evol. Bioinform. Online 9, 429–435. doi: 10.4137/EBO.S12813
Kubatko L. S., Degnan J. H. (2007). Inconsistency of phylogenetic estimates from concatenated data under coalescence. Syst. Biol. 56, 17–24. doi: 10.1080/10635150601146041
Kumar S., Filipski A. J., Battistuzzi F. U., Kosakovsky Pond S. L., Tamura K. (2012). Statistics and truth in phylogenomics. Mol. Biol. Evol. 29, 457–472. doi: 10.1093/molbev/msr202
Lang J. M., Darling A. E., Eisen J. A. (2013). Phylogeny of bacterial and archaeal genomes using conserved genes: supertrees and supermatrices. PloS One 8, e62510. doi: 10.1371/JOURNAL.PONE.0062510
Lartillot N., Brinkmann H., Philippe H. (2007). Suppression of long-branch attraction artefacts in the animal phylogeny using a site-heterogeneous model. BMC Evol. Biol. 7, 1–14. doi: 10.1186/1471-2148-7-S1-S4/FIGURES/5
Lartillot N., Philippe H. (2004). A bayesian mixture model for across-site heterogeneities in the amino-acid replacement process. Mol. Biol. Evol. 21, 1095–1109. doi: 10.1093/MOLBEV/MSH112
Lee M. S. Y., Soubrier J., Edgecombe G. D. (2013). Rates of phenotypic and genomic evolution during the cambrian explosion. Curr. Biol. 23, 1889–1895. doi: 10.1016/J.CUB.2013.07.055
Li C., Lu G., Ortí G. (2008). Optimal data partitioning and a test case for ray-finned fishes (Actinopterygii) based on ten nuclear loci. Syst. Biol. 57, 519–539. doi: 10.1080/10635150802206883
Li F., Rane R. V., Luria V., Xiong Z., Chen J., Li Z., et al. (2022). Phylogenomic analyses of the genus Drosophila reveals genomic signals of climate adaptation. Mol. Ecol. Resour. 22, 1559–1581. doi: 10.1111/1755-0998.13561
Li Z., Tiley G. P., Galuska S. R., Reardon C. R., Kidder T. I., Rundell R. J., et al. (2018). Multiple large-scale gene and genome duplications during the evolution of hexapods. Proc. Natl. Acad. Sci. U.S.A. 115, 4713–4718. doi: 10.1073/pnas.1710791115
Liu L., Pearl D. K. (2007). Species trees from gene trees: reconstructing bayesian posterior distributions of a species phylogeny using estimated gene tree distributions. Syst. Biol. 56, 504–514. doi: 10.1080/10635150701429982
Losos J. B. (2011). Lizards in an Evolutionary Tree: Ecology and Adaptive Radiation of Anoles (Berkeley, CA: Univ of California Press).
Lozano-Fernandez J., Carton R., Tanner A. R., Puttick M. N., Blaxter M., Vinther J., et al. (2016). A molecular palaeobiological exploration of arthropod terrestrialization. Philos. Trans. R. Soc. B.: Biol. Sci. 371, 20150133. doi: 10.1098/RSTB.2015.0133
Lozano-Fernandez J., Giacomelli M., Fleming J. F., Chen A., Vinther J., Thomsen P. F., et al. (2019). Pancrustacean evolution illuminated by taxon-rich genomic-scale data sets with an expanded remipede sampling. Genome Biol. Evol. 11, 2055–2070. doi: 10.1093/GBE/EVZ097
Mai U., Mirarab S. (2018). TreeShrink: fast and accurate detection of outlier long branches in collections of phylogenetic trees. BMC Genomics 19, 272. doi: 10.1186/S12864-018-4620-2
Martín-Durán J. M., Ryan J. F., Vellutini B. C., Pang K., Hejnol A. (2017). Increased taxon sampling reveals thousands of hidden orthologs in flatworms. Genome Research 27 (7), 1263–1272. doi: 10.1101/gr.216226.116
Meusemann K., Von Reumont B. M., Simon S., Roeding F., Strauss S., Kück P., et al. (2010). A phylogenomic approach to resolve the arthropod tree of life. Mol. Biol. Evol. 27, 2451–2464. doi: 10.1093/MOLBEV/MSQ130
Minh B. Q., Hahn M. W., Lanfear R. (2020). New methods to calculate concordance factors for phylogenomic datasets. Mol. Biol. Evol. 37, 2727–2733. doi: 10.1093/molbev/msaa106
Mirarab S., Bayzid M. S., Warnow T. (2016). Evaluating summary methods for multilocus species tree estimation in the presence of incomplete lineage sorting. Syst. Biol. 65, 366–380. doi: 10.1093/sysbio/syu063
Misof B., Liu S., Meusemann K., Peters R. S., Donath A., Mayer C., et al. (2014). Phylogenomics resolves the timing and pattern of insect evolution. Science 346, 763–767. doi: 10.1126/SCIENCE.1257570/SUPPL_FILE/1257570S9.XLS
Molloy E. K., Warnow T. (2018). To include or not to include: the impact of gene filtering on species tree estimation methods. Syst. Biol. 67, 285–303. doi: 10.1093/SYSBIO/SYX077
Mongiardino Koch N. (2021). Phylogenomic subsampling and the search for phylogenetically reliable loci. Mol. Biol. Evol. 38, 40254038. doi: 10.1093/MOLBEV/MSAB151
Morales-Briones D. F., Kadereit G., Tefarikis D. T., Moore M. J., Smith S. A., Brockington S. F., et al. (2020). Disentangling sources of gene tree discordance in phylogenomic datasets: testing ancient hybridizations in amaranthaceae s.l. Syst. Biol. 70 (2), 219–235. doi: 10.1093/sysbio/syaa066
Nabhan A. R., Sarkar I. N. (2012). The impact of taxon sampling on phylogenetic inference: a review of two decades of controversy. Brief Bioinform. 13, 122134. doi: 10.1093/bib/bbr014
Nakhleh L. (2013). Computational approaches to species phylogeny inference and gene tree reconciliation. Trends Ecol. Evol. 28, 719–728. doi: 10.1016/J.TREE.2013.09.004
Nguyen L. T., Schmidt H. A., Von Haeseler A., Minh B. Q. (2015). IQ-TREE: A fast and effective stochastic algorithm for estimating maximum-likelihood phylogenies. Mol. Biol. Evol. 32, 268–274. doi: 10.1093/MOLBEV/MSU300
Oakley T. H., Wolfe J. M., Lindgren A. R., Zaharoff A. K. (2013). Phylotranscriptomics to bring the understudied into the fold: monophyletic ostracoda, fossil placement, and pancrustacean phylogeny. Mol. Biol. Evol. 30, 215–233. doi: 10.1093/MOLBEV/MSS216
Ontano A. Z., Gainett G., Aharon S., Ballesteros J. A., Benavides L. R., Corbett K. F., et al. (2021). Taxonomic sampling and rare genomic changes overcome long-branch attraction in the phylogenetic placement of pseudoscorpions. Mol. Biol. Evol. 38, 2446–2467. doi: 10.1093/MOLBEV/MSAB038
Patwardhan A., Ray S., Roy A. (2014). Molecular markers in phylogenetic studies-A review. J. Phylogenet Evol. Biol. 2, 1–9. doi: 10.4172/2329-9002.1000131
Pease J. B., Haak D. C., Hahn M. W., Moyle L. C. (2016). Phylogenomics reveals three sources of adaptive variation during a rapid radiation. PloS Biol. 14, e1002379. doi: 10.1371/JOURNAL.PBIO.1002379
Philippe H. (2000). Opinion: long branch attraction and protist phylogeny. Protist 151, 307–316. doi: 10.1078/S1434-4610(04)70029-2
Philippe H., Brinkmann H., Lavrov D. V., Littlewood D. T. J., Manuel M., Wörheide G., et al. (2011). Resolving difficult phylogenetic questions: why more sequences are not enough. PloS Biol. 9, e1000602. doi: 10.1371/JOURNAL.PBIO.1000602
Philippe H., Derelle R., Lopez P., Pick K., Borchiellini C., Boury-Esnault N., et al. (2009). Phylogenomics revives traditional views on deep animal relationships. Curr. Biol. 19, 706–712. doi: 10.1016/j.cub.2009.02.052
Pick K. S., Philippe H., Schreiber F., Erpenbeck D., Jackson D. J., Wrede P., et al. (2010). Improved phylogenomic taxon sampling noticeably affects nonbilaterian relationships. Mol. Biol. Evol. 27, 1983–1987. doi: 10.1093/MOLBEV/MSQ089
Poe S. (2003). Evaluation of the strategy of long-branch subdivision to improve the accuracy of phylogenetic methods. Syst. Biol. 52, 423–428. doi: 10.1080/10635150390197046
Pollard D. A., Iyer V. N., Moses A. M., Eisen M. B. (2006). Widespread discordance of gene trees with species tree in drosophila: evidence for incomplete lineage sorting. PloS Genet. 2, e173. doi: 10.1371/JOURNAL.PGEN.0020173
Pollock D. D., Zwickl D. J., McGuire J. A., Hillis D. M. (2002). Increased taxon sampling is advantageous for phylogenetic inference. Syst. Biol. 51, 664. doi: 10.1080/10635150290102357
Prasanna A. N., Gerber D., Kijpornyongpan T., Aime M. C., Doyle V. P., Nagy L. G. (2020). Model choice, missing data, and taxon sampling impact phylogenomic inference of deep basidiomycota relationships. Syst. Biol. 69, 17–37. doi: 10.1093/sysbio/syz029
Qin J., Hu Y., Ma K. Y., Jiang X., Ho C. H., Tsang L. M., et al. (2017). CrusTF: A comprehensive resource of transcriptomes for evolutionary and functional studies of crustacean transcription factors. BMC Genomics 18, 1–9. doi: 10.1186/S12864-017-4305-2/FIGURES/2
Rannala B., Huelsenbeck J. P., Yang Z., Nielsen R. (1998). Taxon sampling and the accuracy of large phylogenies. Syst. Biol. 47, 702–710. doi: 10.1080/106351598260680
Rannala B., Yang Z. (2003). Bayes estimation of species divergence times and ancestral population sizes using DNA sequences from multiple loci. Genetics 164, 1645–1656. doi: 10.1093/GENETICS/164.4.1645
Regier J. C., Shultz J. W., Ganley A. R. D., Hussey A., Shi D., Ball B., et al. (2008). Resolving Arthropod Phylogeny: Exploring Phylogenetic Signal within 41 kb of Protein-Coding Nuclear Gene Sequence. Syst. Biol. 57, 920–938. doi: 10.1080/10635150802570791
Regier J. C., Shultz J. W., Kambic R. E. (2005). Pancrustacean phylogeny: hexapods are terrestrial crustaceans and maxillopods are not monophyletic. Proc. R. Soc. B.: Biol. Sci. 272, 395. doi: 10.1098/RSPB.2004.2917
Regier J. C., Shultz J. W., Zwick A., Hussey A., Ball B., Wetzer R., et al. (2010). Arthropod relationships revealed by phylogenomic analysis of nuclear protein-coding sequences. Nature 463 (7284), 1079–1083. doi: 10.1038/nature08742
Richards E. J., Brown J. M., Barley A. J., Chong R. A., Thomson R. C. (2018). Variation across mitochondrial gene trees provides evidence for systematic error: how much gene tree variation is biological? Syst. Biol. 67, 847–860. doi: 10.1093/SYSBIO/SYY013
Roch S., Warnow T. (2015). On the Robustness to Gene Tree Estimation Error (or lack thereof) of Coalescent-Based Species Tree Methods. Syst. Biol. 64, 663–676. doi: 10.1093/SYSBIO/SYV016
Roelofs D., Zwaenepoel A., Sistermans T., Nap J., Kampfraath A. A., Van de Peer Y., et al. (2020). Multi-faceted analysis provides little evidence for recurrent whole-genome duplications during hexapod evolution. BMC Biol. 18, 1–13. doi: 10.1186/S12915-020-00789-1
Rota-Stabelli O., Campbell L., Brinkmann H., Edgecombe G. D., Longhorn S. J., Peterson K. J., et al. (2011). A congruent solution to arthropod phylogeny: phylogenomics, microRNAs and morphology support monophyletic Mandibulata. Proc. R. Soc. B.: Biol. Sci. 278, 298–306. doi: 10.1098/RSPB.2010.0590
Rota-Stabelli O., Lartillot N., Philippe H., Pisani D. (2013). Serine codon-usage bias in deep phylogenomics: pancrustacean relationships as a case study. Syst. Biol. 62, 121–133. doi: 10.1093/SYSBIO/SYS077
Sayyari E., Whitfield J. B., Mirarab S. (2018). DiscoVista: Interpretable visualizations of gene tree discordance. Mol. Phylogenet Evol. 122, 110–115. doi: 10.1016/J.YMPEV.2018.01.019
Schwentner M., Combosch D. J., Pakes Nelson J., Giribet G. (2017). A phylogenomic solution to the origin of insects by resolving crustacean-hexapod relationships. Curr. Biol. 27, 1818–1824.e5. doi: 10.1016/J.CUB.2017.05.040
Schwentner M., Richter S., Rogers D. C., Giribet G. (2018). Tetraconatan phylogeny with special focus on Malacostraca and Branchiopoda: highlighting the strength of taxon-specific matrices in phylogenomics. Proc. R. Soc. B. 285, 20181524. doi: 10.1098/RSPB.2018.1524
Scornavacca C., Galtier N. (2017). Incomplete lineage sorting in mammalian phylogenomics. Syst. Biol. 66, 112–120. doi: 10.1093/SYSBIO/SYW082
Sela I., Ashkenazy H., Katoh K., Pupko T. (2015). GUIDANCE2: accurate detection of unreliable alignment regions accounting for the uncertainty of multiple parameters. Nucleic Acids Res. 43, W7. doi: 10.1093/NAR/GKV318
Shekhar S., Roch S., Mirarab S. (2018). Species tree estimation using ASTRAL: How many genes are enough? IEEE/ACM Trans. Comput. Biol. Bioinform. 15, 17381747. doi: 10.1109/TCBB.2017.2757930
Shen X. X., Steenwyk J. L., Rokas A. (2021). Dissecting incongruence between concatenation- and quartet-based approaches in phylogenomic data. Syst. Biol. 70, 997–1014. doi: 10.1093/SYSBIO/SYAB011
Shen X.-X., Todd Hittinger C., Rokas A. (2017). Contentious relationships in phylogenomic studies can be driven by a handful of genes. Nat. Ecol. Evol. 1, 0126. doi: 10.1038/s41559-017-0126
Simmons M. P., Kessenich J. (2020). Divergence and support among slightly suboptimal likelihood gene trees. Cladistics 36, 322–340. doi: 10.1111/CLA.12404
Song S., Liu L., Edwards S. V., Wu S. (2012). Resolving conflict in eutherian mammal phylogeny using phylogenomics and the multispecies coalescent model. Proc. Natl. Acad. Sci. U.S.A. 109, 14942–14947. doi: 10.1073/PNAS.1211733109/-/DCSUPPLEMENTAL
Soubrier J., Steel M., Lee M. S. Y., Der Sarkissian C., Guindon S., Ho S. Y. W., et al. (2012). The influence of rate heterogeneity among sites on the time dependence of molecular rates. Mol. Biol. Evol. 29, 3345–3358. doi: 10.1093/MOLBEV/MSS140
Springer M. S., Gatesy J. (2016). The gene tree delusion. Mol. Phylogenet Evol. 94, 1–33. doi: 10.1016/J.YMPEV.2015.07.018
Steenwyk J. L., Buida T. J., Labella A. L., Li Y., Shen X. X., Rokas A. (2021). PhyKIT: a broadly applicable UNIX shell toolkit for processing and analyzing phylogenomic data. Bioinformatics 37, 2325–2331. doi: 10.1093/BIOINFORMATICS/BTAB096
Struck T. H. (2013). The impact of paralogy on phylogenomic studies - a case study on annelid relationships. PloS One 8, e62892. doi: 10.1371/journal.pone.0062892
Struck T. H. (2014). Trespex-detection of misleading signal in phylogenetic reconstructions based on tree information. Evol. Bioinfor. 10, 51–67. doi: 10.4137/EBo.s14239
Su Z., Townsend J. P. (2015). Utility of characters evolving at diverse rates of evolution to resolve quartet trees with unequal branch lengths: Analytical predictions of long-branch effects. BMC Evol. Biol. 15, 1–13. doi: 10.1186/S12862-015-0364-7/FIGURES/6
Suvorov A., Kim B. Y., Wang J., Armstrong E. E., Peede D., D’Agostino E. R. R., et al. (2022). Widespread introgression across a phylogeny of 155 Drosophila genomes. Curr. Biol. 32, 111. doi: 10.1016/J.CUB.2021.10.052
Tekaia F. (2016). Inferring orthologs: open questions and perspectives. Genomics Insights 9, 17–28. doi: 10.4137/GEI.S37925
Thalén F. (2018) PhyloPyPruner: Tree-based Orthology Inference for Phylogenomics with New Methods for Identifying and Excluding Contamination. Available at: http://lup.lub.lu.se/student-papers/record/8963554.
Townsend J. P. (2007). Profiling phylogenetic informativeness. Syst. Biol. 56, 222–231. doi: 10.1080/10635150701311362
Townsend J. P., Leuenberger C. (2011). Taxon sampling and the optimal rates of evolution for phylogenetic inference. Syst. Biol. 60, 358–365. doi: 10.1093/SYSBIO/SYQ097
Townsend J. P., Lopez-Giraldez F. (2010). Optimal selection of gene and ingroup taxon sampling for resolving phylogenetic relationships. Syst. Biol. 59, 446–457. doi: 10.1093/SYSBIO/SYQ025
Townsend J. P., Naylor G. (2007). Increased taxon sampling greatly reduces phylogenetic error. Syst. Biol. 51, 588–598. doi: 10.1080/10635150701311362
Townsend J. P., Su Z., Tekle Y. I. (2012). Phylogenetic signal and noise: predicting the power of a data set to resolve phylogeny. Syst. Biol. 61, 835–835. doi: 10.1093/SYSBIO/SYS036
Von Reumont B. M., Jenner R. A., Wills M. A., Dell’Ampio E., Pass G., Ebersberger I., et al. (2012). Pancrustacean phylogeny in the light of new phylogenomic data: support for remipedia as the possible sister group of hexapoda. Mol. Biol. Evol. 29, 1031–1045. doi: 10.1093/MOLBEV/MSR270
von Reumont B. M., Wägele J. W., Wägele J. W., Bartholomaeus T. (2014). “Advances in molecular phylogeny of crustaceans in the light of phylogenomic data” in Deep metazoan phylogeny: the backbone of the tree of life. New insights from analyses of molecules, morphology, and theory of data analysis, ed. Wägele J. W., Bartholomaeus T. (Berlin/Boston: De Gruyter), 385398.
Wang H. C., Minh B. Q., Susko E., Roger A. J. (2018). Modeling site heterogeneity with posterior mean site frequency profiles accelerates accurate phylogenomic estimation. Syst. Biol. 67, 216–235. doi: 10.1093/SYSBIO/SYX068
Whelan N. V., Halanych K. M. (2016). Who let the CAT out of the bag? Accurately dealing with substitutional heterogeneity in phylogenomic analyses. Syst. Biol. 66, syw084. doi: 10.1093/sysbio/syw084
Whelan N. V., Kocot K. M., Moroz L. L., Halanych K. M. (2015). Error, signal, and the placement of Ctenophora sister to all other animals. Proc. Natl. Acad. Sci. U.S.A. 112, 5773–5778. doi: 10.1073/PNAS.1503453112/SUPPL_FILE/PNAS.201503453SI.PDF
Wickett N. J., Mirarab S., Nguyen N., Warnow T., Carpenter E., Matasci N., et al. (2014). Phylotranscriptomic analysis of the origin and early diversification of land plants. Proc. Natl. Acad. Sci. U.S.A. 111, E4859–E4868. doi: 10.1073/PNAS.1323926111/-/DCSUPPLEMENTAL
Wiens J. J. (2005). Can incomplete taxa rescue phylogenetic analyses from long-branch attraction? Syst. Biol. 54, 731–742. doi: 10.1080/10635150500234583
Willson J., Roddur M. S., Liu B., Zaharias P., Warnow T. (2022). DISCO: Species tree inference using multicopy gene family tree decomposition. Syst. Biol. 71, 610629. doi: 10.1093/SYSBIO/SYAB070
Xi Z., Liu L., Davis C. C. (2015). Genes with minimal phylogenetic information are problematic for coalescent analyses when gene tree estimation is biased. Mol. Phylogenet Evol. 92, 63–71. doi: 10.1016/J.YMPEV.2015.06.009
Xi Z., Liu L., Rest J. S., Davis C. C. (2014). Coalescent versus concatenation methods and the placement of amborella as sister to water lilies. Syst. Biol. 63, 919–932. doi: 10.1093/SYSBIO/SYU055
Xia X. (2018). DAMBE7: New and improved tools for data analysis in molecular biology and evolution. Mol. Biol. Evol. 35, 15501552. doi: 10.1093/MOLBEV/MSY073
Xia X., Lemey P. (2009). “Assessing substitution saturation with DAMBE,” in The phylogenetic handbook: a practical approach to DNA and protein phylogeny, vol. 2. , 615–630.
Yang Y., Smith S. A. (2014). Orthology inference in nonmodel organisms using transcriptomes and low-coverage genomes: improving accuracy and matrix occupancy for phylogenomics. Mol. Biol. Evol. 31, 3081–3092. doi: 10.1093/MOLBEV/MSU245
Zhang C., Rabiee M., Sayyari E., Mirarab S. (2018). ASTRAL-III: Polynomial time species tree reconstruction from partially resolved gene trees. BMC Bioinform. 19, 15–30. doi: 10.1186/S12859-018-2129-Y/TABLES/2
Zhang N., Zeng L., Shan H., Ma H. (2012). Highly conserved low-copy nuclear genes as effective markers for phylogenetic analyses in angiosperms. New Phytol. 195, 923–937. doi: 10.1111/J.1469-8137.2012.04212.X
Keywords: systematic error, phylogenetic signal, species tree, gene tree, Hexapoda, Crustacea
Citation: Yu HY, Chu KH, Tsang LM and Ma KY (2024) Incomplete lineage sorting and long-branch attraction confound phylogenomic inference of Pancrustacea. Front. Ecol. Evol. 12:1243221. doi: 10.3389/fevo.2024.1243221
Received: 20 June 2023; Accepted: 05 January 2024;
Published: 30 January 2024.
Edited by:
Liang Liu, University of Georgia, United StatesReviewed by:
Zhuo Su, Yale University, United StatesJeffrey Peter Townsend, Yale University, United States
Copyright © 2024 Yu, Chu, Tsang and Ma. This is an open-access article distributed under the terms of the Creative Commons Attribution License (CC BY). The use, distribution or reproduction in other forums is permitted, provided the original author(s) and the copyright owner(s) are credited and that the original publication in this journal is cited, in accordance with accepted academic practice. No use, distribution or reproduction is permitted which does not comply with these terms.
*Correspondence: Ka Yan Ma, bWFqeDI2QG1haWwuc3lzdS5lZHUuY24=