 Chongqing Zhong
 Xiaowei Wu
 Peihong Jia
 Kehui Zhang5
- 1School of Geographic and Oceanographic Sciences, Nanjing University, Nanjing, China
- 2School of Urban and Environmental Sciences, Huaiyin Normal University, Huai’an, China
- 3Ministry of Education Key Laboratory for Coast and Island Development, Nanjing University, Nanjing, China
- 4School of History, Culture and Tourism, Huaiyin Normal University, Huai’an, China
- 5College of International Tourism and Public Administration, Hainan University, Haikou, China
As a Free Trade Port in China, the protection of ecological environment and high-quality tourism development on Hainan Island have become a national strategy. Exploring the coupling relationship of the two subsystems holds great practical significance for promoting the island’s international demonstration area and high-quality development. Based on the characteristics of international islands, a comprehensive index system is established to explore the coupling coordination evolutionary process and interactive stress relationship of tourism development and the ecological environment in Hainan Island from 2005 to 2020. The results show: (1) From 2005 to 2019, the comprehensive evaluation index of the two subsystems of Hainan Island generally showed a continuous growth trend. (2) From 2005 to 2019, the coupling degree of the two subsystems of Hainan Island strengthened continuously, the coupling coordination degree increased steadily from a moderate imbalance to good coordination, and tourism development and the ecological environment entered a stage of parallel and benign interactive development. (3) In 2020, affected by COVID-19, the tourism development indicators declined rapidly, while the ecological environment still maintained a rising trend. (4) Based on the inverted U-shaped curve model, when the tourism development index reaches 0.7269, the ecological environment quality reaches the maximum value of 0.7956, which is the best state between the two subsystems. The ecological environment and tourism development of Hainan Island are generally in a benign interaction, but there are signs of interactive stress starting in 2017. In the future, the pressure on the ecological environment of Hainan Island will increase.
1 Introduction
In China, coastal tourism contributes 49% of the total marine economy (Ministry of Natural Resources of China, 2020). Coastal zones have become the most preferred tourist destinations, and in them, the economy is highly promoted by tourism development and accompanied by substantial ecological impacts (Martínez et al., 2007). Charming coastal zone tourism is inseparable from natural environmental resources such as sunshine, sandy beaches, seawater and tropical vegetation (Pickering and Hill, 2007). Therefore, environmental support and resource consumption are the basic attributes of such tourism, which also determines that there is a dialectical relationship between tourism development and the ecological environment (Wang and Li, 2022). The ecological environment here not only considers the natural environment related to humans, but also considers the organisms and its ecological relationships. How to achieve the coordinated development of the two subsystems has always been a hot and difficult issue for scholars. Since the construction of Hainan Free Trade Port of China in 2020, Hainan Island has further become a demonstration and leading area of China’s coastal zone tourism. The protection of its ecological environment and its high-quality tourism development have been incorporated into the national strategy. Exploring the dynamic change process of the coupling and coordination relationship between the island’s ecological environment and tourism industry development holds important practical significance for high-quality development decision-making. The results of this research can also provide a reference for other island tourism and coastal zone tourism in China. The interactive stress between tourism development and the ecological environment on Hainan Island is becoming a hot research point.
Research on the relationship between tourism and the ecological environment can be traced back to the 1920s (Gössling, 2002). With the rapid development of the tourism industry worldwide, the relationship between tourism and the ecological environment has become increasingly prominent. In the early stage of research, scholars focused on the concept of the environmental impact of tourism activities, the environmental changes brought by tourism activities, tourism and environmental ethics, and sustainable tourism evaluation systems (Wall and Wright, 1977; Romeril, 1985; Hockings and Twyford, 1997; Miller, 2001; Gössling, 2002; Chen et al., 2009; Guan et al., 2011; Liu et al., 2011a). Wall and Wright (1977) discussed the concept and research methods of the impact of tourism on the environment, as well as the relationship and impact mechanism between tourism activities and environmental factors. Romeril (1985) systematically analyzed the interaction between tourism and the environment. Miller (2001) proposed an evaluation system for sustainable tourism development based on the relationship between tourism and the environment. With the deepening of research, scholars have begun to pay attention to the impacts of the ecological environment on tourism, such as the significant impacts of climate change on coastal tourism, mountaineering tourism, ice and snow tourism, etc (Shani and Arad, 2014; Joye, 2018; Vyddiyaratnam et al., 2021). Recently, some scholars have found that recreational beaches are polluted by new pollutant microplastics, which pose potential threats to the health of coastal organisms and coastal tourists (Defeo et al., 2021; Wu et al., 2021). Meanwhile, research on the relationship between tourism and the ecological environment has begun to expand to a higher level of interaction, symbiosis and coupling coordination. Common research methods include the tourism pressure index method, ecological footprint analysis method, and panel regression method (Patterson et al., 2008; Brahmasrene and Lee, 2017; Yu et al., 2021).
Research on the relationship between tourism and the ecological environment in China started relatively late, but the results are considerable (Liang et al., 2022; Wu et al., 2022). Zhang et al. (2013) studied the coupling relationship between tourism cities and the environment in coastal areas based on sustainable development theory and a coupling model, and they found that the coupling degree of the level of tourism orientation and ecological environment in the coastal area of China stayed in the antagonistic period between 2000 and 2010. Tang (2015) analyzed the spatiotemporal characteristics of the coupling coordination degree between the tourism economy and ecological environment in Heilongjiang Province from 2005 to 2015 by using the entropy approach and coupling coordination model. Geng et al. (2021) explored the coupling coordination relationship between the air environment and inbound tourism and discovered their mutual interaction mechanism. Some empirical studies have been conducted to investigate the coupling relationship between tourism and the environment in Dalian city, Lianyungang city, Shanghai city and Hangzhou (Wang et al., 2006; Cui, 2008; Pang et al., 2011; Luo and Tan, 2012; Liu and Hu, 2020). Recently, some scholars have begun to pay attention to the coupling coordination of three subsystems: the economy, tourism and the ecological environment (Liu and Yang, 2011b; Li and Wang, 2017; Lai et al., 2020; Su et al., 2021; Li et al., 2022).
In general, the coupling coordination relationship between tourism development and the ecological environment has been widely recognized. Scholars have studied it through a variety of methods, and the coupling coordination degree model (CCDM) is widely used. The perspective of existing studies has changed from a static to a dynamic evolutionary process. The contents of research are becoming increasingly richer, from a one-way relationship to a higher level of interactive symbiosis and coupling coordination. As the largest international tourism island in China, the dynamic evolutionary process and interactive stress relationship of the coupling and coordination relationship between tourism and the ecological environment in Hainan Island are still unclear. Therefore, it is necessary to explore the coupling coordination mechanism and to use effective systems and approaches to evaluate the interactions between them so that a coordinated improvement in the ecological environment and tourism can be achieved. Using 2005-2020 data of tourism development and the ecological environment on Hainan Island, this study aims to build a unique comprehensive evaluation index system for the ecological environment and tourism development, and it uses the comprehensive evaluation model, CCDM and RDM to explore the interactive stress relationship between the two subsystems. First, we theoretically discover the coordination mechanism to discuss the coupling coordination relationship of the ecological environment and tourism development in the two subsystems. Second, we are trying to find the evolutionary rule of the coupling relationship between tourism development and the ecological environment on Hainan Island. Third, we verify and analyze the interactive stress effect between tourism development and the ecological environment on Hainan Island.
2 Materials
2.1 Study area
Hainan Island (109°45’E to 110°08’E and 18°22’N to 18°47’N) is located in the South China Sea (Figure 1). It is the largest tropical island of China, with a 1,823 km coastline, 68 bays, 487 km2 of tideland, and various high-quality beaches. It has excellent marine ecosystems, with coral reefs, mangroves, and seagrass beds. Furthermore, it includes 12 coastal cities and 6 inland cities (or counties), which cover an area of 35,400 km2. The island’s resident population is approximately 9.25 million, 87% of whom live in coastal cities (Hainan Provincial Bureau of Statistics of China, 2023). Northern Hainan has a subtropical climate, and the remainder of the island has a tropical monsoon climate. The annual mean temperature is 22.8-25.8°C, with January and February being the coldest months and July and August being the hottest months. It is a typical tropical tourist destination. In 2020, Hainan Island became the Hainan Free Trade Port in China, and its long coastline and high-quality coastal tourism environment will further promote the development of tourism in Hainan.
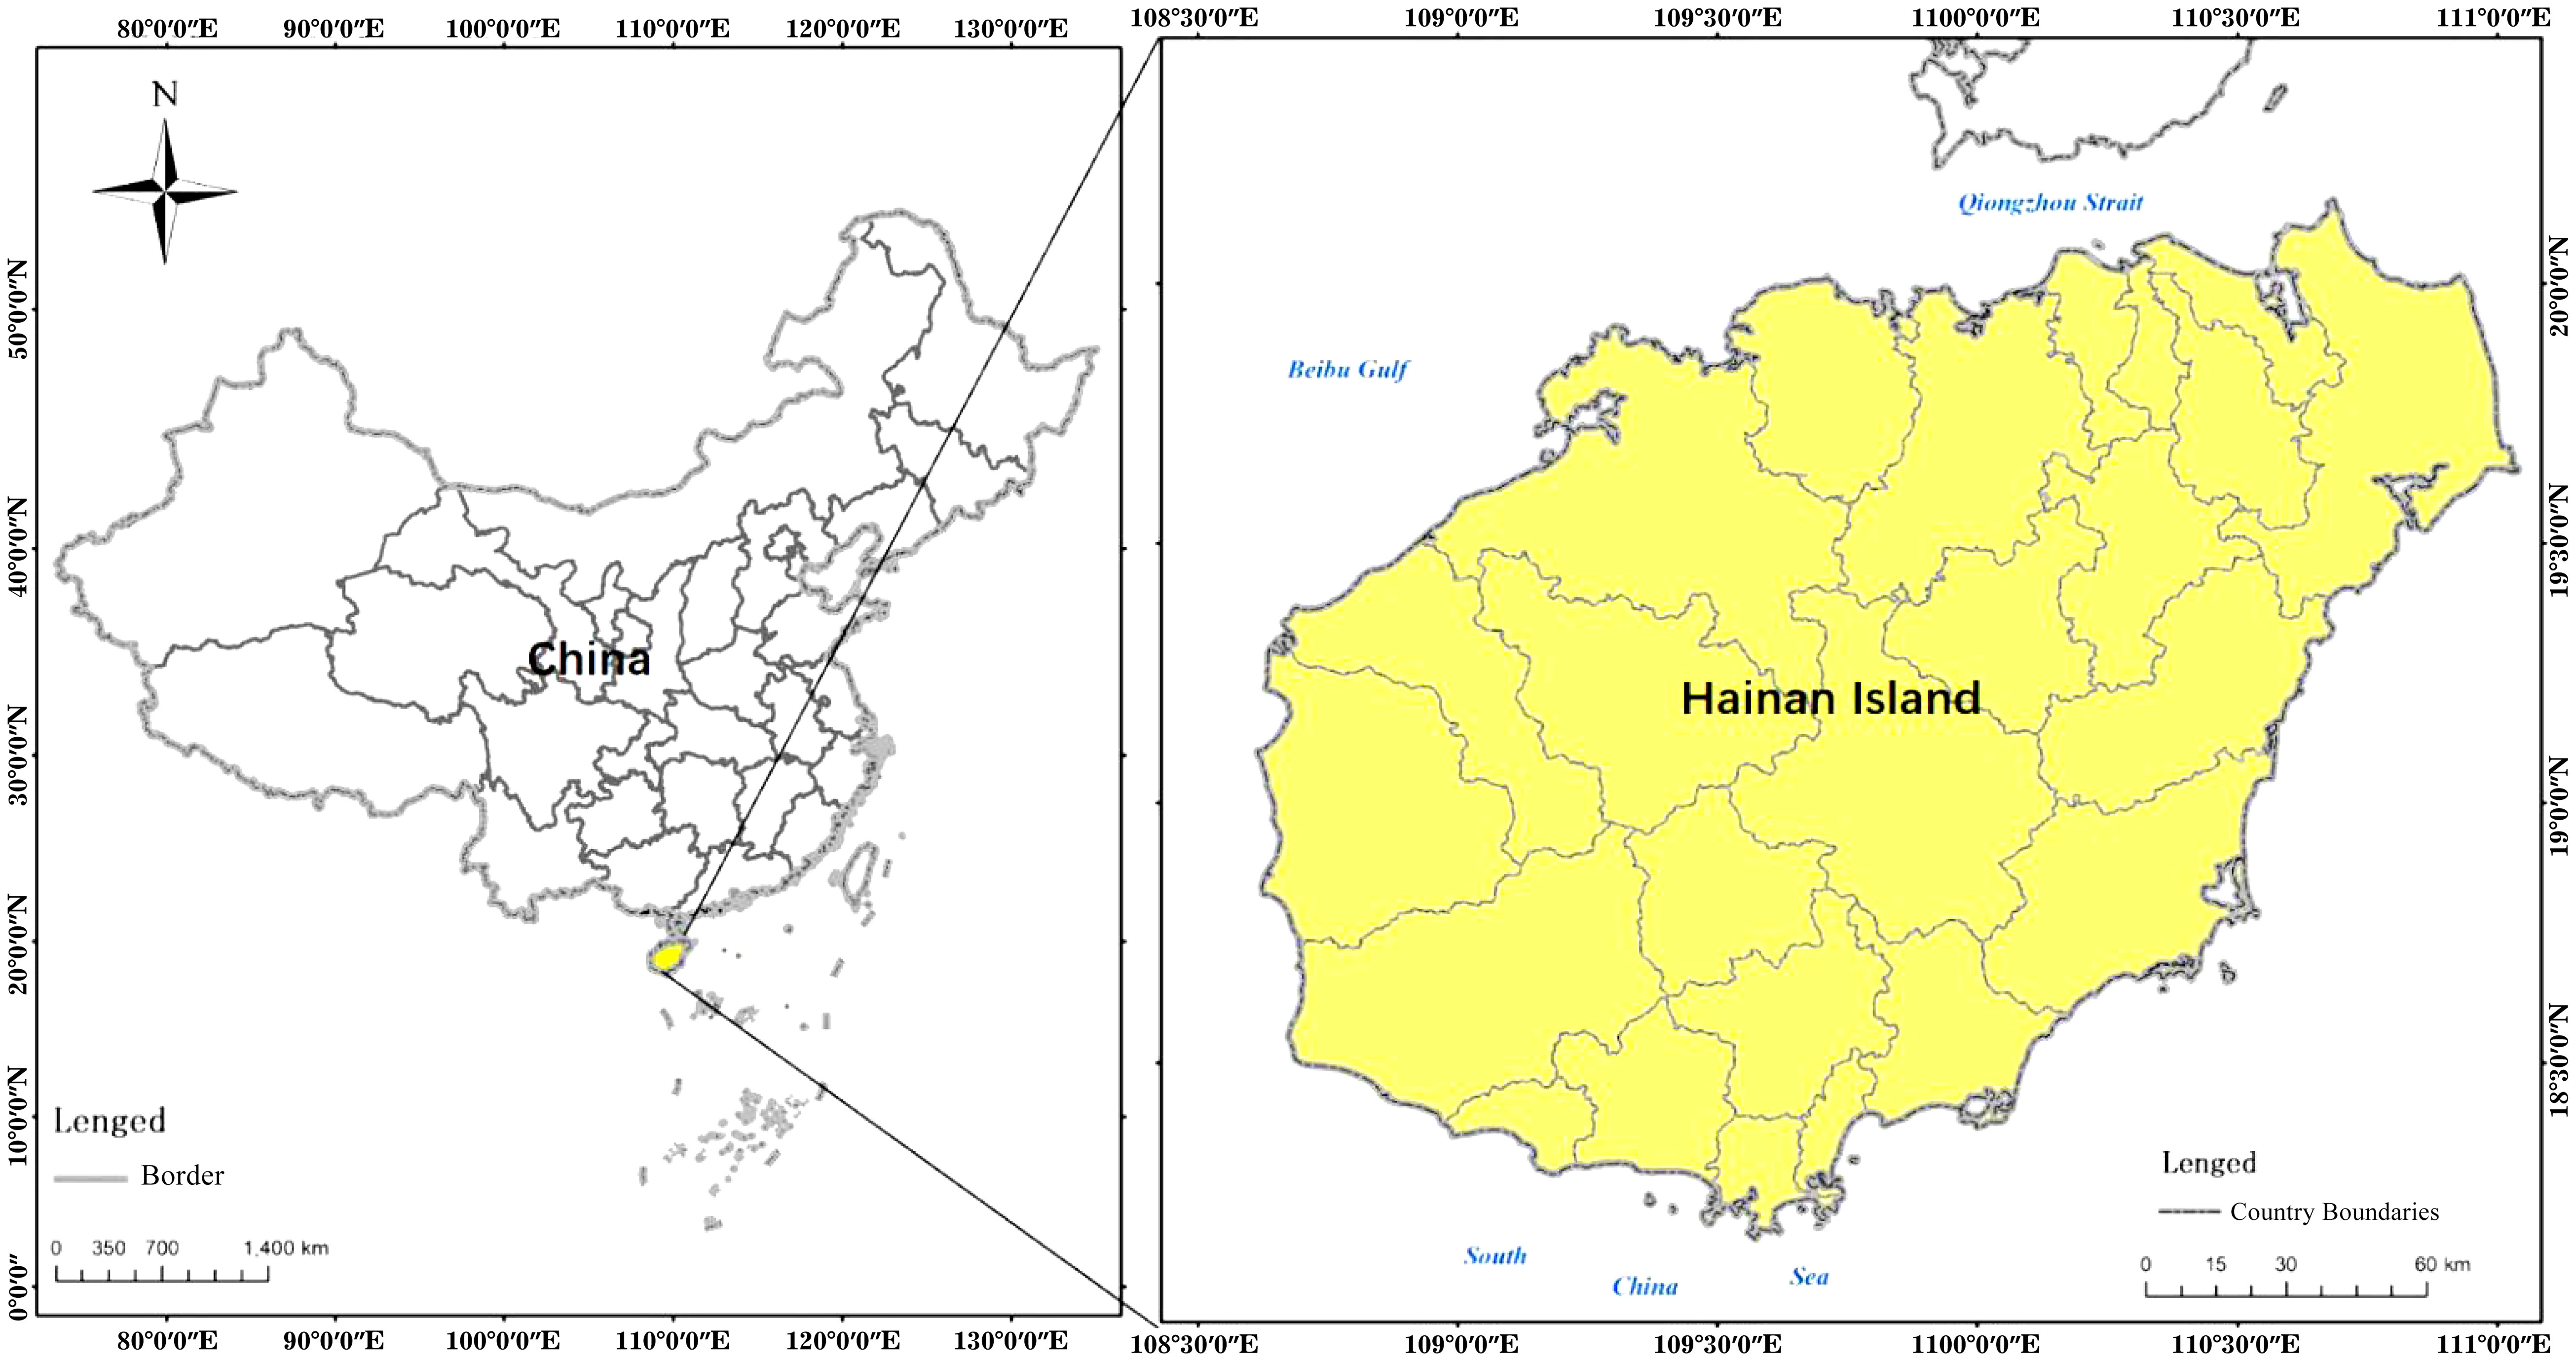
Figure 1 The location of Hainan Island.
2.2 Data sources
The raw data of tourism development were collected from the Hainan Statistical Yearbook (2006-2021) (Hainan Provincial Bureau of Statistics of China, 2023). The raw data of the ecological environment were collected from the Hainan Statistical Yearbook (2006-2021) (Hainan Provincial Bureau of Statistics of China, 2023), China Urban Construction Statistical Yearbook (2005-2020)1 and Bulletin on the Environmental Situation of Hainan (2005-2020).2
3 Methodology
All the Statistic data collection was completed using EXCEL (2016), data analysis was completed using Stata 16.0 software, and maps were made using ArcGIS 10.2 software. Otherwise, some other methodologies are used as below.
3.1 Coupling coordination degree model
Coupling originates from physics. It is a phenomenon in which two or more systems influence each other through various interactions (Illingworth, 1996). This paper constructs the coupling degree Equation (1) between tourism development and ecological environment to analyze and measure the relationship between tourism and the ecological environment of Hainan Island. The degree of coupling can explain only the strength of the interaction between the two subsystems and cannot reflect the overall development level. It is possible that the actual development level of the two systems is low and that the coupling degree is high. To reflect the overall efficiency and synergy of the two subsystems, the coupling coordination index D is introduced, as shown in Equation (3). The coupling coordination degree model (CCDM) is given in the following formulas:
where Ti and Ei are the integration value of the tourism subsystem and the environment subsystem, respectively; Ci represents the degree of coupling between tourism and the environment; and Qi reflects the overall level of tourism and the ecological environment. wt and we are the weights of T and E, representing the contributions of tourism and the environment, respectively. For Hainan, tourism development is as equally important as environmental quality; thus, the values of wt and we are equivalent, i.e., wt=we=0.5. Di represents the degree of coupling coordination, and the development of the coupling of tourism and ecological environment is calculated.
According to existing research (Tang, 2015; He et al., 2017), the coupling degree indicates the interaction degree of two subsystems, and C ∈ [0,1]. When C=1, it means that there exists the greatest coupling degree, and the system will tend toward a new ordered structure; when C=0, it means that there is almost no relationship between the tourism subsystem and ecological environment subsystem, and the system will develop in a disorderly manner (Zhang et al., 2013). When the value of C decreases, it means that the interaction between the tourism economy and ecological environment decreases, and the coupling interaction degenerates and develops in the direction of disorder. When the value of C increases, it indicates that the degree of correlation between the systems is enhanced, and the coupling interaction shows benign development, developing in the direction of orderly self-organization. When C ∈ (0, 0.2), the coupling interaction between the two subsystems is poor; when C ∈ [0.2, 0.4), the coupling interaction is ordinary; when C ∈ [0.4, 0.6], the coupling interaction is fair; when C ∈ [0.6, 0.8), the coupling interaction is good; and when C ∈ [0.8, 1), the coupling interaction is excellent.
Accordingly, the coupling coordination degree (D) can be divided into 10 classes, ranging from extremely uncoordinated to highly coordinated (Table 1).
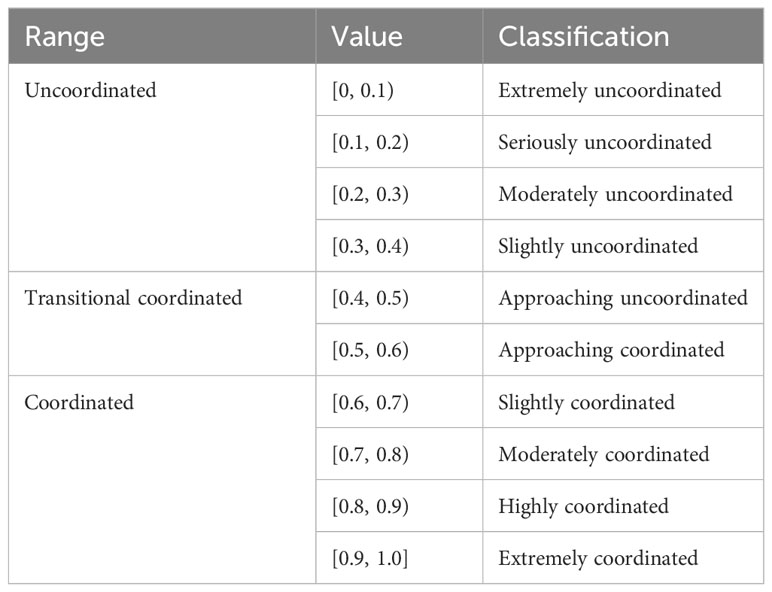
Table 1 Classification grades of coupling coordination.
3.2 Evaluation of the tourism and ecological environment subsystems
As shown in Table 2, T and E represent the level of tourism industry development and the ecological environmental quality of Hainan Island. The integration values of the tourism and ecological environment subsystems are calculated using Equations (4) and (5), respectively.
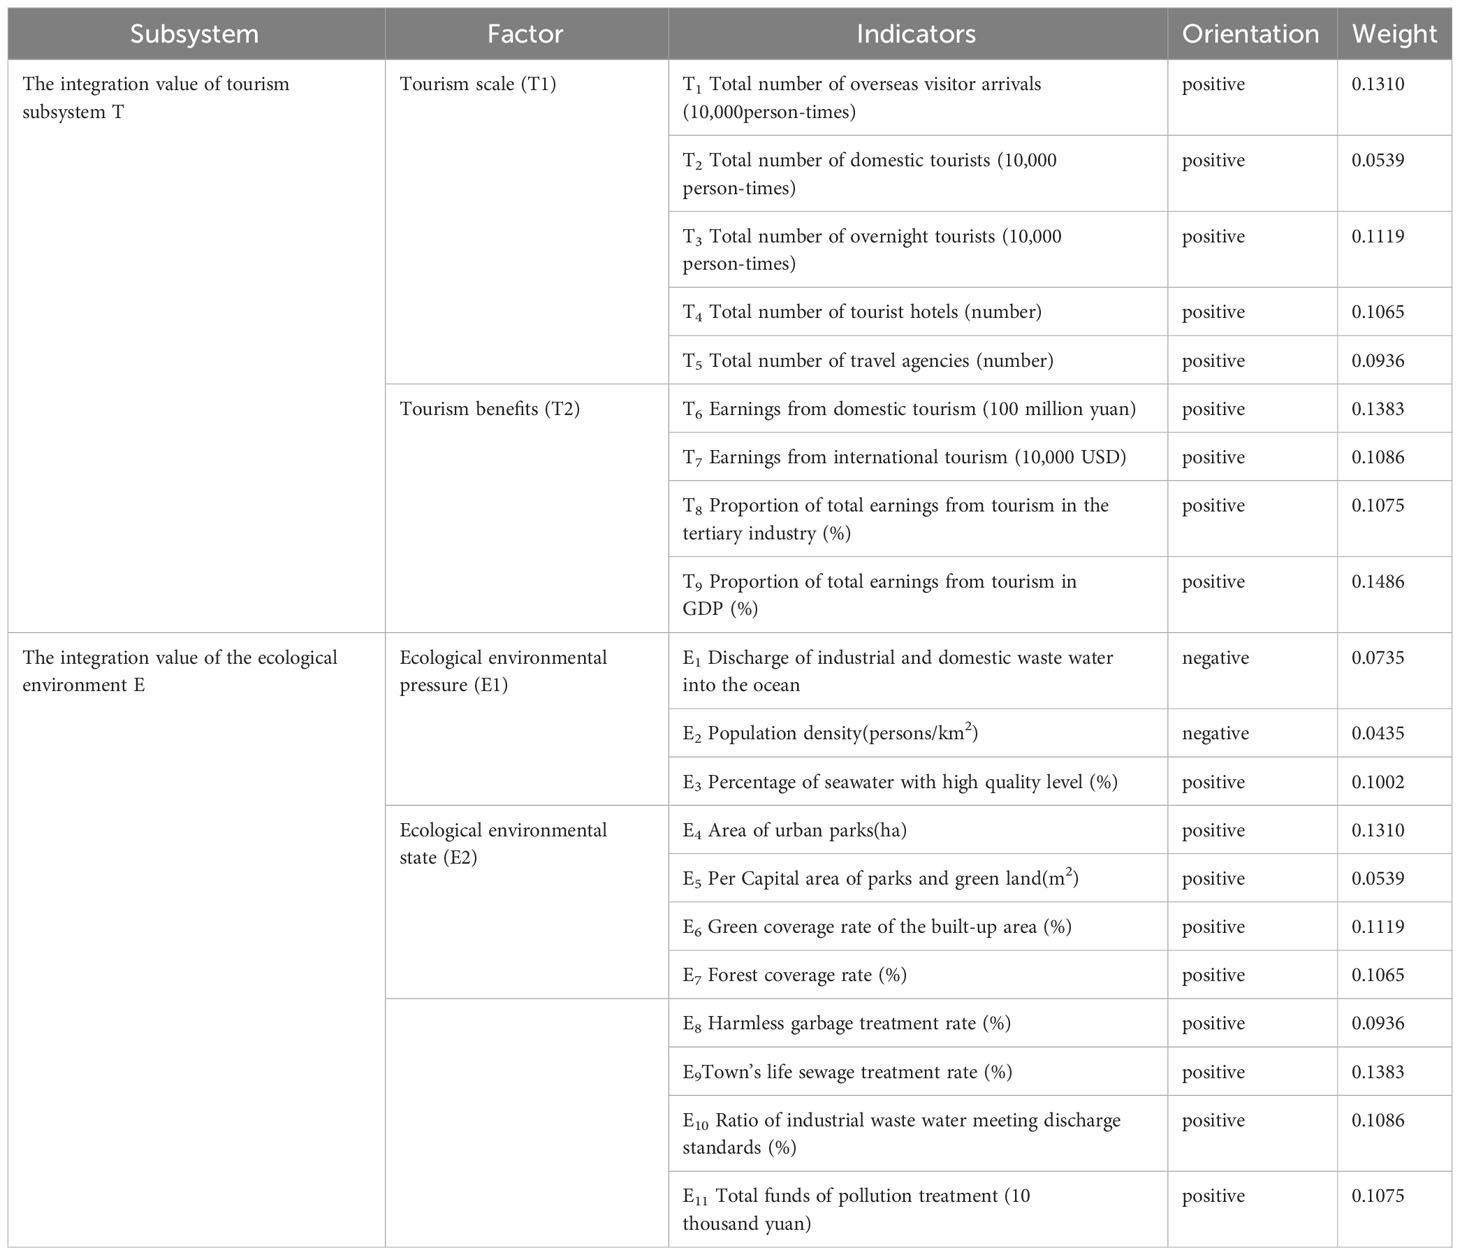
Table 2 Comprehensive evaluation index system for the relationship between tourism and the ecological environment.
where wj is the weight of indicator j of the tourism subsystem and wk is the weight of indicator k of the ecological environment subsystem.
3.3 Data preprocessing
We normalized the data using Equations (6) and (7), eliminated the influence of different dimensions (Zhang et al., 2013), and obtained the magnitude of positive and negative orientations.
If it is a positive indicator, Equation (4) is used:
However, if it is a negative indicator, Equation (5) is used:
where xij represents the value of indicator j in year i and is the standardized value of xij.
3.4 Information entropy method
Here, the weights are calculated based on the information entropy method. The concept of information entropy was first proposed by Shannon in 1948. It is an effective tool for measuring the uncertainty of the system status, and it has been popularly used in previous studies (Li et al., 2012; Tang, 2015). If the value of information entropy is higher, the structure of the system is more balanced, and the variation is less. When the value of information entropy is lower, the structure of the system is more unbalanced, and the variation is greater. Therefore, the weight of the indicators, i.e., the degree of variation of the indicators, can be calculated by the value of information entropy, and the bias brought by the influence of subjectivity can be avoided to a certain extent (Shannon, 1948; Li et al., 2012; Tang, 2015). The steps are as follows:
The proportion of indicator j in year i:
Information entropy of indicator j:
Entropy redundancy:
Weight of the indicator:
where n is the number of indicators and m is the number of years. The raw data (2005-2020) describing the indicators of Hainan Island are processed using the above steps (Table 2). The related values are subsequently calculated.
3.5 Relative development model
To further clarify the relative level of tourism and the ecological environment in the development process, this study introduces the relative development model (Wang and Li, 2022). The formula is as follows, where δ is the relative development degree; 0<δ≤0.9 indicates that the ecological environment leads the development of tourism; 0.9<δ≤1.2 indicates the coordinated development of tourism and the ecological environment, which are driven by each other; and δ>1.2 shows that the ecological environment lags behind the development of tourism, and environmental protection should be strengthened.
3.6 Verification of the interactive stress effect
To verify the interaction effect between the ecological environment and tourism development on Hainan Island, a new interaction term Ei*Ti is generated on the basis of the main effect of eco-tourism and tourism development. ANOVA and regression analysis are carried out. The variance, determination coefficient R2 and p value of the interaction term coefficient are used to determine whether tourism development and the ecological environment have a significant interactive stress effect and whether the interactive stress effect has a significant impact on the coupling and coordination between tourism development and the ecological environment on Hainan Island.
We normalized the data using Equations (6) and (7) and eliminated the influence of different dimensions. The weight of each indicator was calculated using the information entropy method (IEM) [Equations (8)–(11)]. Then, based on the comprehensive evaluation model, coupling degree model, coupling coordination degree model and relative development model, using Equations (4)–(12), we calculate the evaluation values T and E, coupling degree C, coupling coordination degree D and relative development degree δ of the two subsystems (tourism development and the ecological environment).
4 Results
4.1 Coupling mechanism between island tourism development and the ecological environment
Human-land system theory is the foundation of the coupling study of island tourism and the ecological environment (Wang and Li, 2022). The coordinated development of tourism and the ecological environment is an important embodiment of the sustainable development of the human-land relationship. Island tourism development and the ecological environment constitute an open and complex system, and they interact and restrict each other while maintaining material and energy exchange with the outside world. Both positive and negative effects exist at the same time (Figure 2).
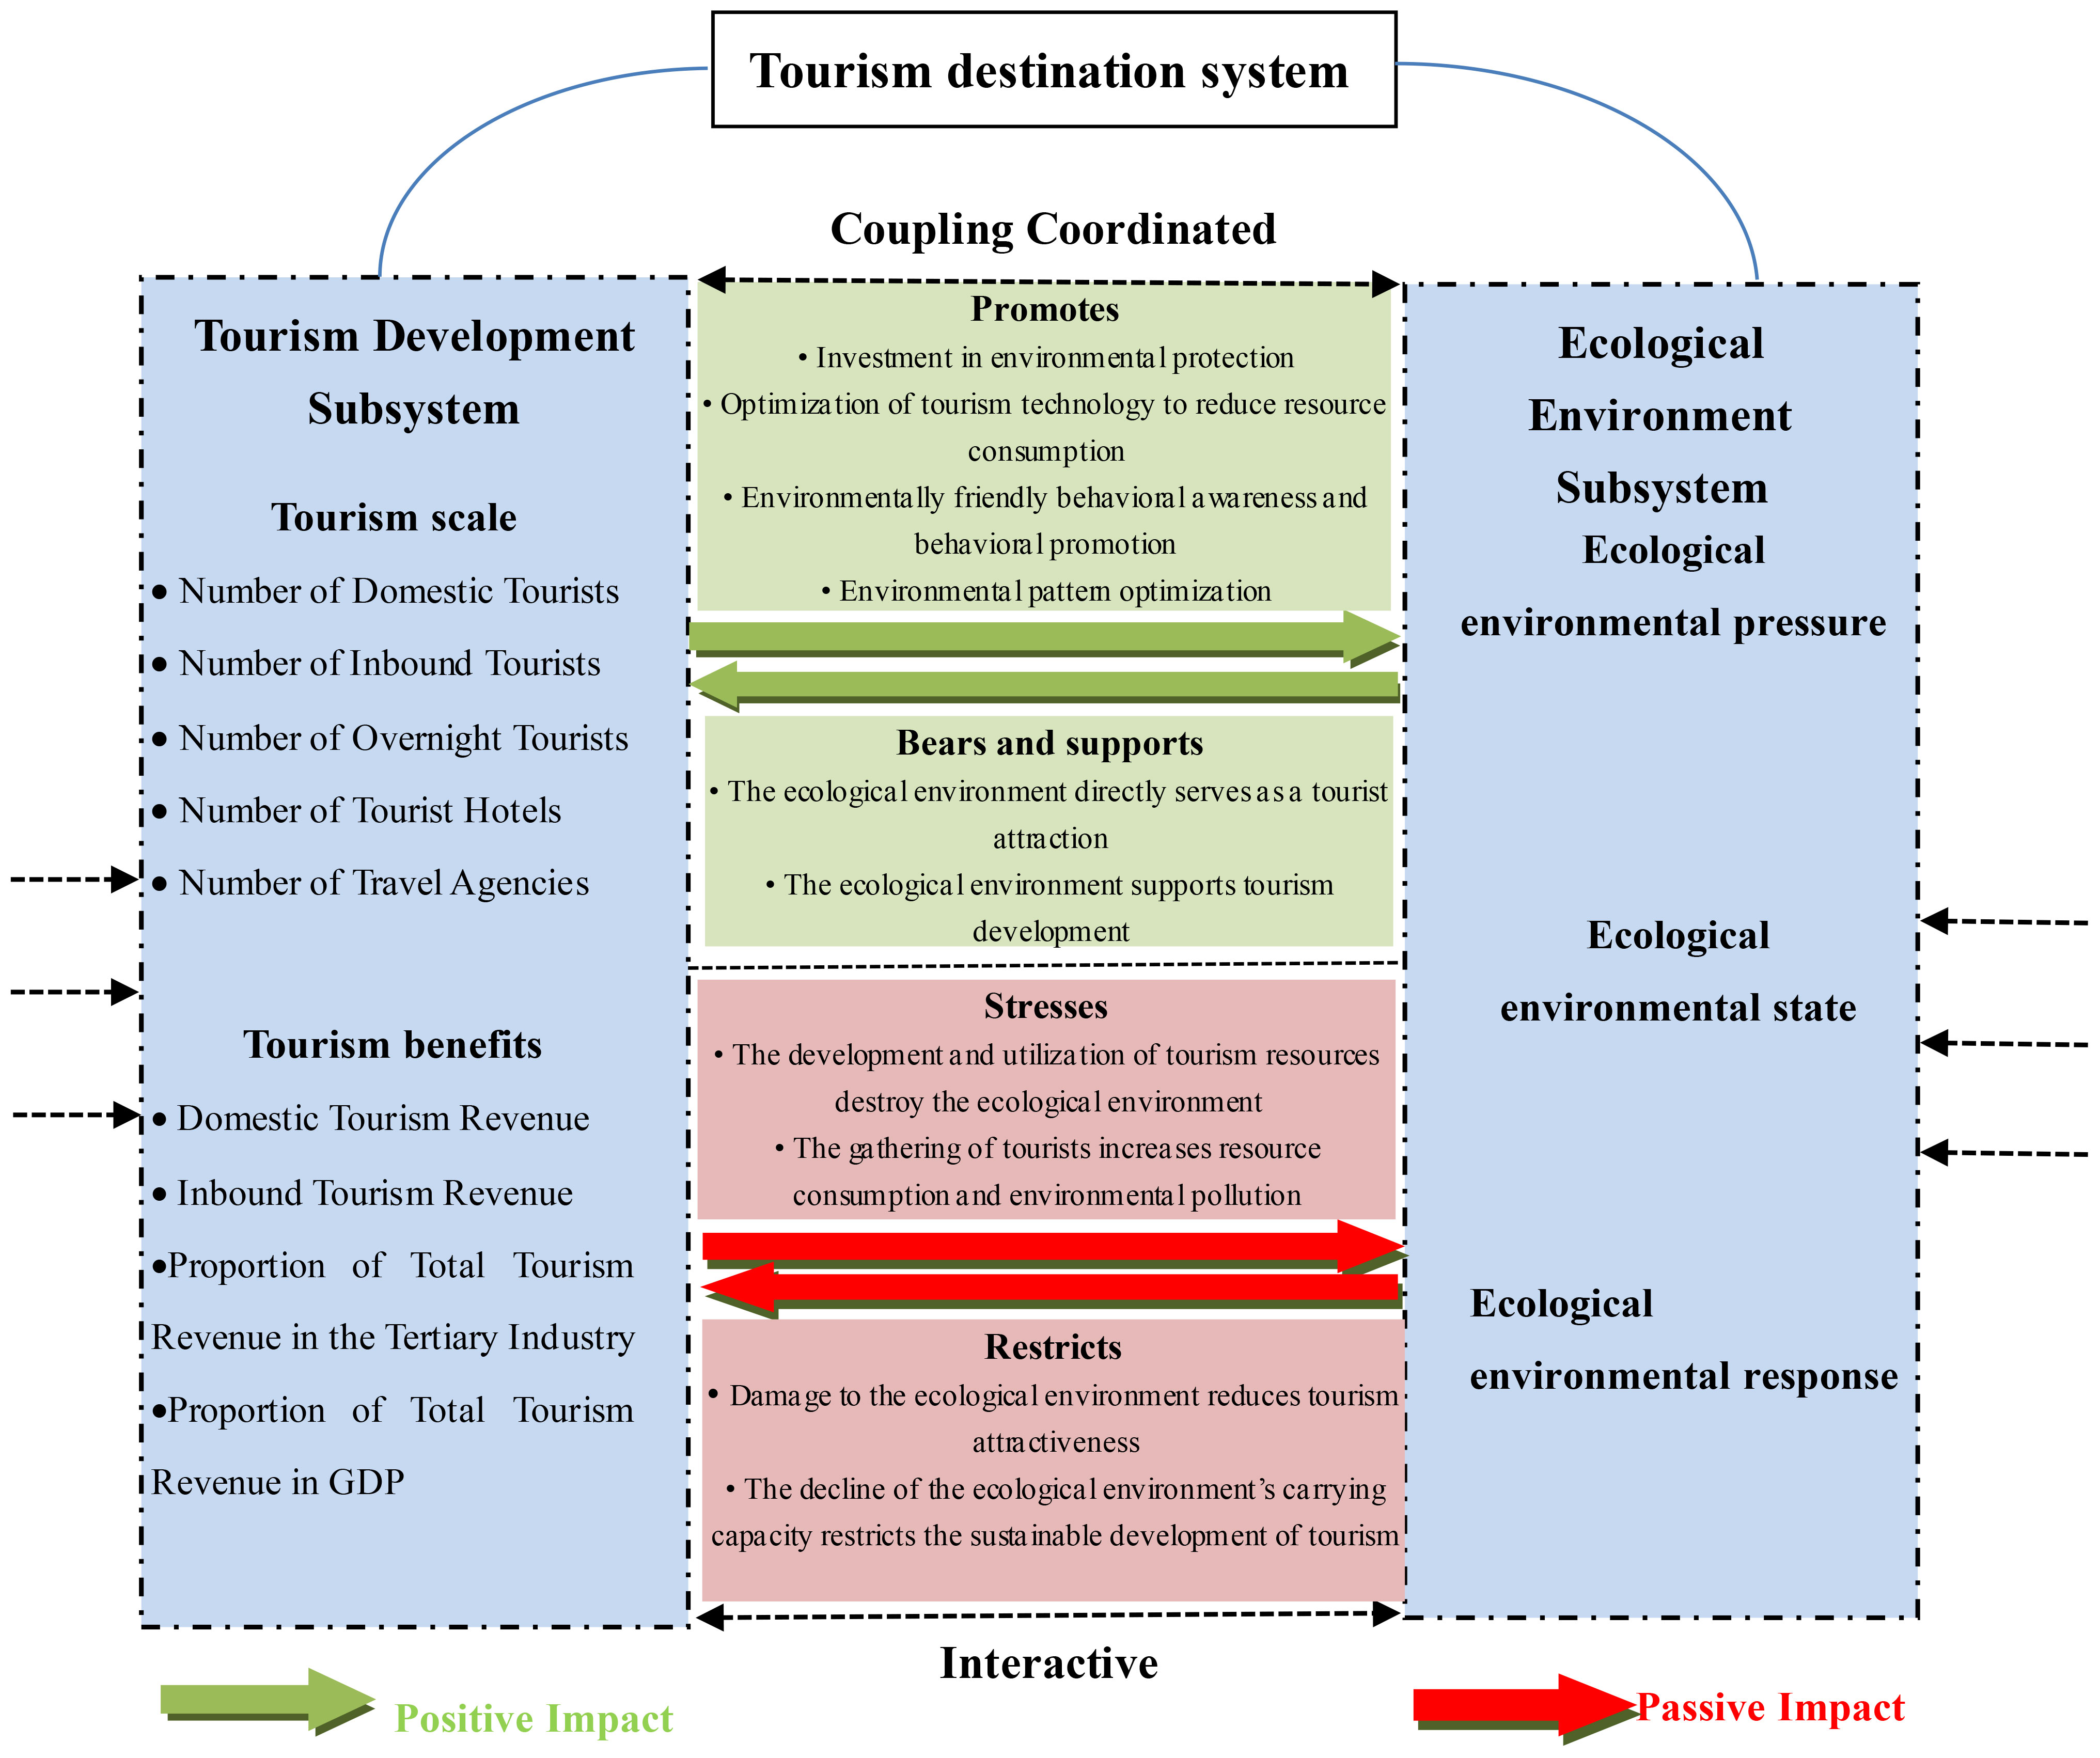
Figure 2 Coupling mechanism of island tourism development and the ecological environment system.
The positive interactions are shown as follows: (1) the ecological environment bears and supports tourism development. On the one hand, the sunshine, beach, climate, vegetation, seawater and other aspects of the ecological environment of the island are favored attractions among tourists and are the basic resources for tourism development. On the other hand, the ecological environment provides a supporting environment for tourism activities and projects and offsets various pollution and damage caused by tourism development within a certain threshold. (2) Tourism development promotes the protection and optimization of the ecological environment. Tourism development needs a beautiful ecological environment. Therefore, the development of tourism will help beautify the ecological environment of the destination and realize the optimization of the spatial pattern of the ecological environment. The sustainable growth of the tourism economy will help to provide more financial support for ecological environment protection. At the same time, technological innovation and improvement in the process of tourism development can effectively reduce the level of consumption of resources and the environment. Tourism development also brings cultural integration, which helps to enhance environmentally friendly awareness and behavior, thus helping to make sustainable use of the ecological environment.
The negative interactions are shown as follows: (1) The development of island tourism leads to pressures on and threats to the ecological environment. The development and utilization of tourism resources will inevitably damage the ecological environment. Examples include the construction of vacation projects, entertainment and reception facilities, and scenic spot roads. Furthermore, the development of tourism brings aggregations of crowds and excessive environmental pollution, such as waste water, solid waste, and domestic waste from hotels and tourist attractions, exhaust gas emissions from intensive tourism traffic, excessive trampling by crowds of people, the destruction of vegetation on coasts, and a reduction of biodiversity. (2) The deteriorating ecological environment also reacts to tourism development, reducing the attractiveness of tourism and the carrying capacity of the ecological environment, which will inhibit or even reverse tourism development. The positive interaction between tourism development and the ecological environment is the premise for achieving sustainable development. By analyzing their coupling, coordination, symbiosis and dynamic changes, we can effectively grasp their sustainable development status.
4.2 Determination of indicators and construction of the index system
Tourism development and the ecological environment form a complex system of mutual connection and restriction. At present, the selection of evaluation indicators for the study of tourism development and ecological environment coupling development has not formed a unified standard. This study follows the indicator selection principles of representativeness, systematization, independence and availability, refers to the selection of indicators in previous studies, and combines the actual situation of tourism development and the ecological environment on Hainan Island. ecological environment assessment indicators are constructed based on the pressure-state-response (PSR) model, and can effectively evaluate the health of the ecological environment system. Therefore, the ecological environment subsystem includes three levels, i.e., ecological environment pressure, ecological environment status and ecological environment response, with a total of 11 indicators. The tourism development subsystem reflects the overall scale and benefit level, and it includes 9 indicators (Table 2).
4.3 Temporal dynamic changes in tourism and the ecological environment
As shown in Figure 3A, the Qi curve of the “tourism ecological environment” comprehensive system rose year by year from 2005 to 2019, from 0.156 in 2005 to 0.8618 in 2019, indicating that the complex system composed of tourism and the ecological environment on Hainan Island was in a benign development stage of continuous growth over this 15-year period. In 2020, the overall development index of the system dropped sharply, lower than the overall level two years prior (2017). This result is directly related to the global outbreak of COVID-19 in 2020.
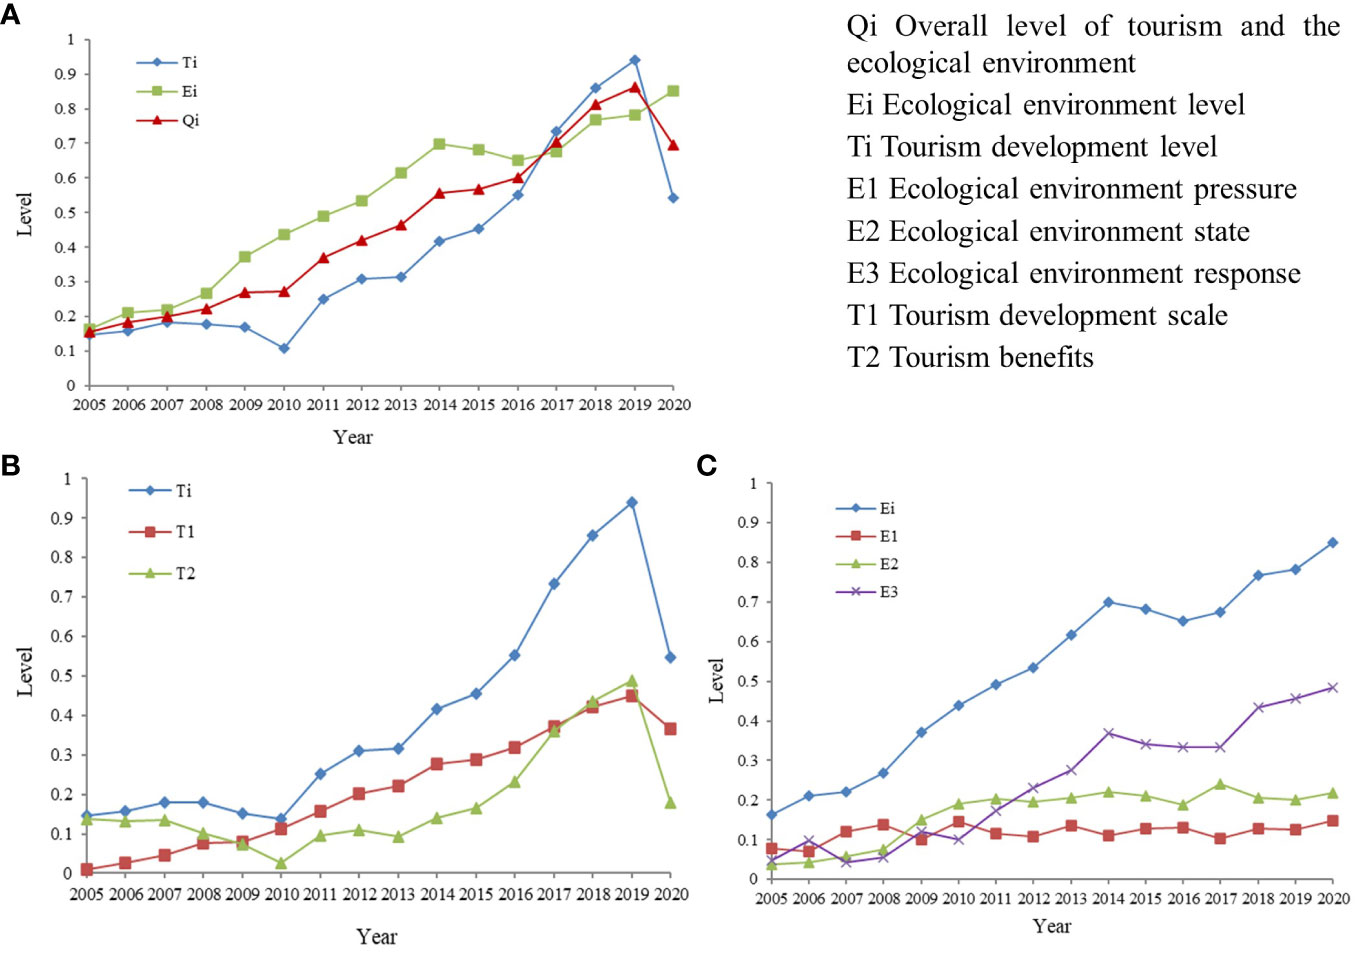
Figure 3 (A) Trends of the overall levels of tourism development and the ecological environment Subsystems; (B) Trends of the overall levels of tourism Ti; (C) Trends of the overall levels of the ecological environment Ei.
Based on the Ti curve, in the 15 years (2005-2019) before the global outbreak of COVID-19, the tourism development of Hainan Island showed a fluctuating and rapidly increasing dynamic change trend. In 2019, the tourism development index reached the maximum value of 0.9387, which was 6.3 times that of 2005. During this period, Hainan Island experienced several fluctuations. Specifically, from 2005 to 2007, the tourism development of Hainan Island grew slowly. From 2008 to 2010, there was a shock of a decline of more than 30%. In 2010, it fell to the lowest level of 0.1070 (0.1483 in 2005) and then climbed rapidly. In the nine years after 2011, Hainan Island tourism entered a relatively long period of stable and rapid development. At present, the tourism industry is the leading industry of Hainan Island.
As shown in Figure 3B, the comprehensive level of tourism development was obviously low from 2008 to 2010, but the scale of tourism development T1 continued to expand during this period. The main reason for its relative underdevelopment was the impact of tourism benefits T2. Further analysis of the factor indicators of the composition of tourism benefits shows that, despite the positive growth in tourism reception income and the number of people from 2008 to 2010, its contribution to the overall economy and the tertiary industry of Hainan Island was relatively weak. That is, compared with other industries on Hainan Island, the contribution of the tourism economy was poor, showing a relatively underdeveloped trend. However, we also found that although the economic contribution was poor during this period, the investment and supporting facility construction of the state and Hainan Province in tourism development were unprecedented. According to statistical data, the number of hotels on Hainan Island increased from 440 in 2008 to 540 in 2011, an increase of 22.7%. The number of travel agencies increased from 196 to 335, an increase of 70.9%. This is directly related to the national strategy of developing Hainan Island into an international tourism island. The national and local governments have continuously increased tourism investment, which has pushed the island’s tourism development into the fast lane. In 2020, the tourism development level of Hainan Island dropped sharply. As we all know, this was due to the global outbreak of COVID-19. The global economy regressed, and the number of tourists decreased by 70-75% compared with 2019 (WTO, 2021). As shown in Figure 2, the tourism development level of Hainan Island dropped to the 2016-2017 level.
As shown in Figure 3C, the ecological environment of Hainan Island was continuously optimized by approximately 5% every year from 2005 to 2019. There was a slight retrogression in the 2015-2017 period, and the ecological environment level rose again after 2017, maintaining the momentum of continuous optimization. The high-quality and unique coastal ecological environment is the basis for the tourism development of Hainan Island. Hainan Island has always attached importance to the protection of the ecological environment. Especially after the development goal of the international tourism island was made clear in 2009, a high-quality ecological environment has become the top priority. The government has invested much in the protection and restoration of the ecological environment. According to statistics, in 2006, Hainan Island invested 540.12 billion yuan in the ecological environment, an increase of 93.8% over the previous year. Such a large investment reached a new high of 5384.42 billion yuan in 2014. In 2018, investment in environmental governance reached a new high, and in the following two years, it maintained a record high. The curve in the figure shows that COVID-19 has had no inhibitory impact on the ecological environment.
4.4 Temporal dynamic changes in the coupling coordination degree of the tourism and ecological environment subsystems
Taking the calculation results of the tourism development Ti and ecological environment Ei of Hainan Island from 2005 to 2020 into Equations (1)–(3), the results of coupling degree C and coupling coordination degree D of the tourism development and ecological environment of Hainan Island are calculated (Figure 4).
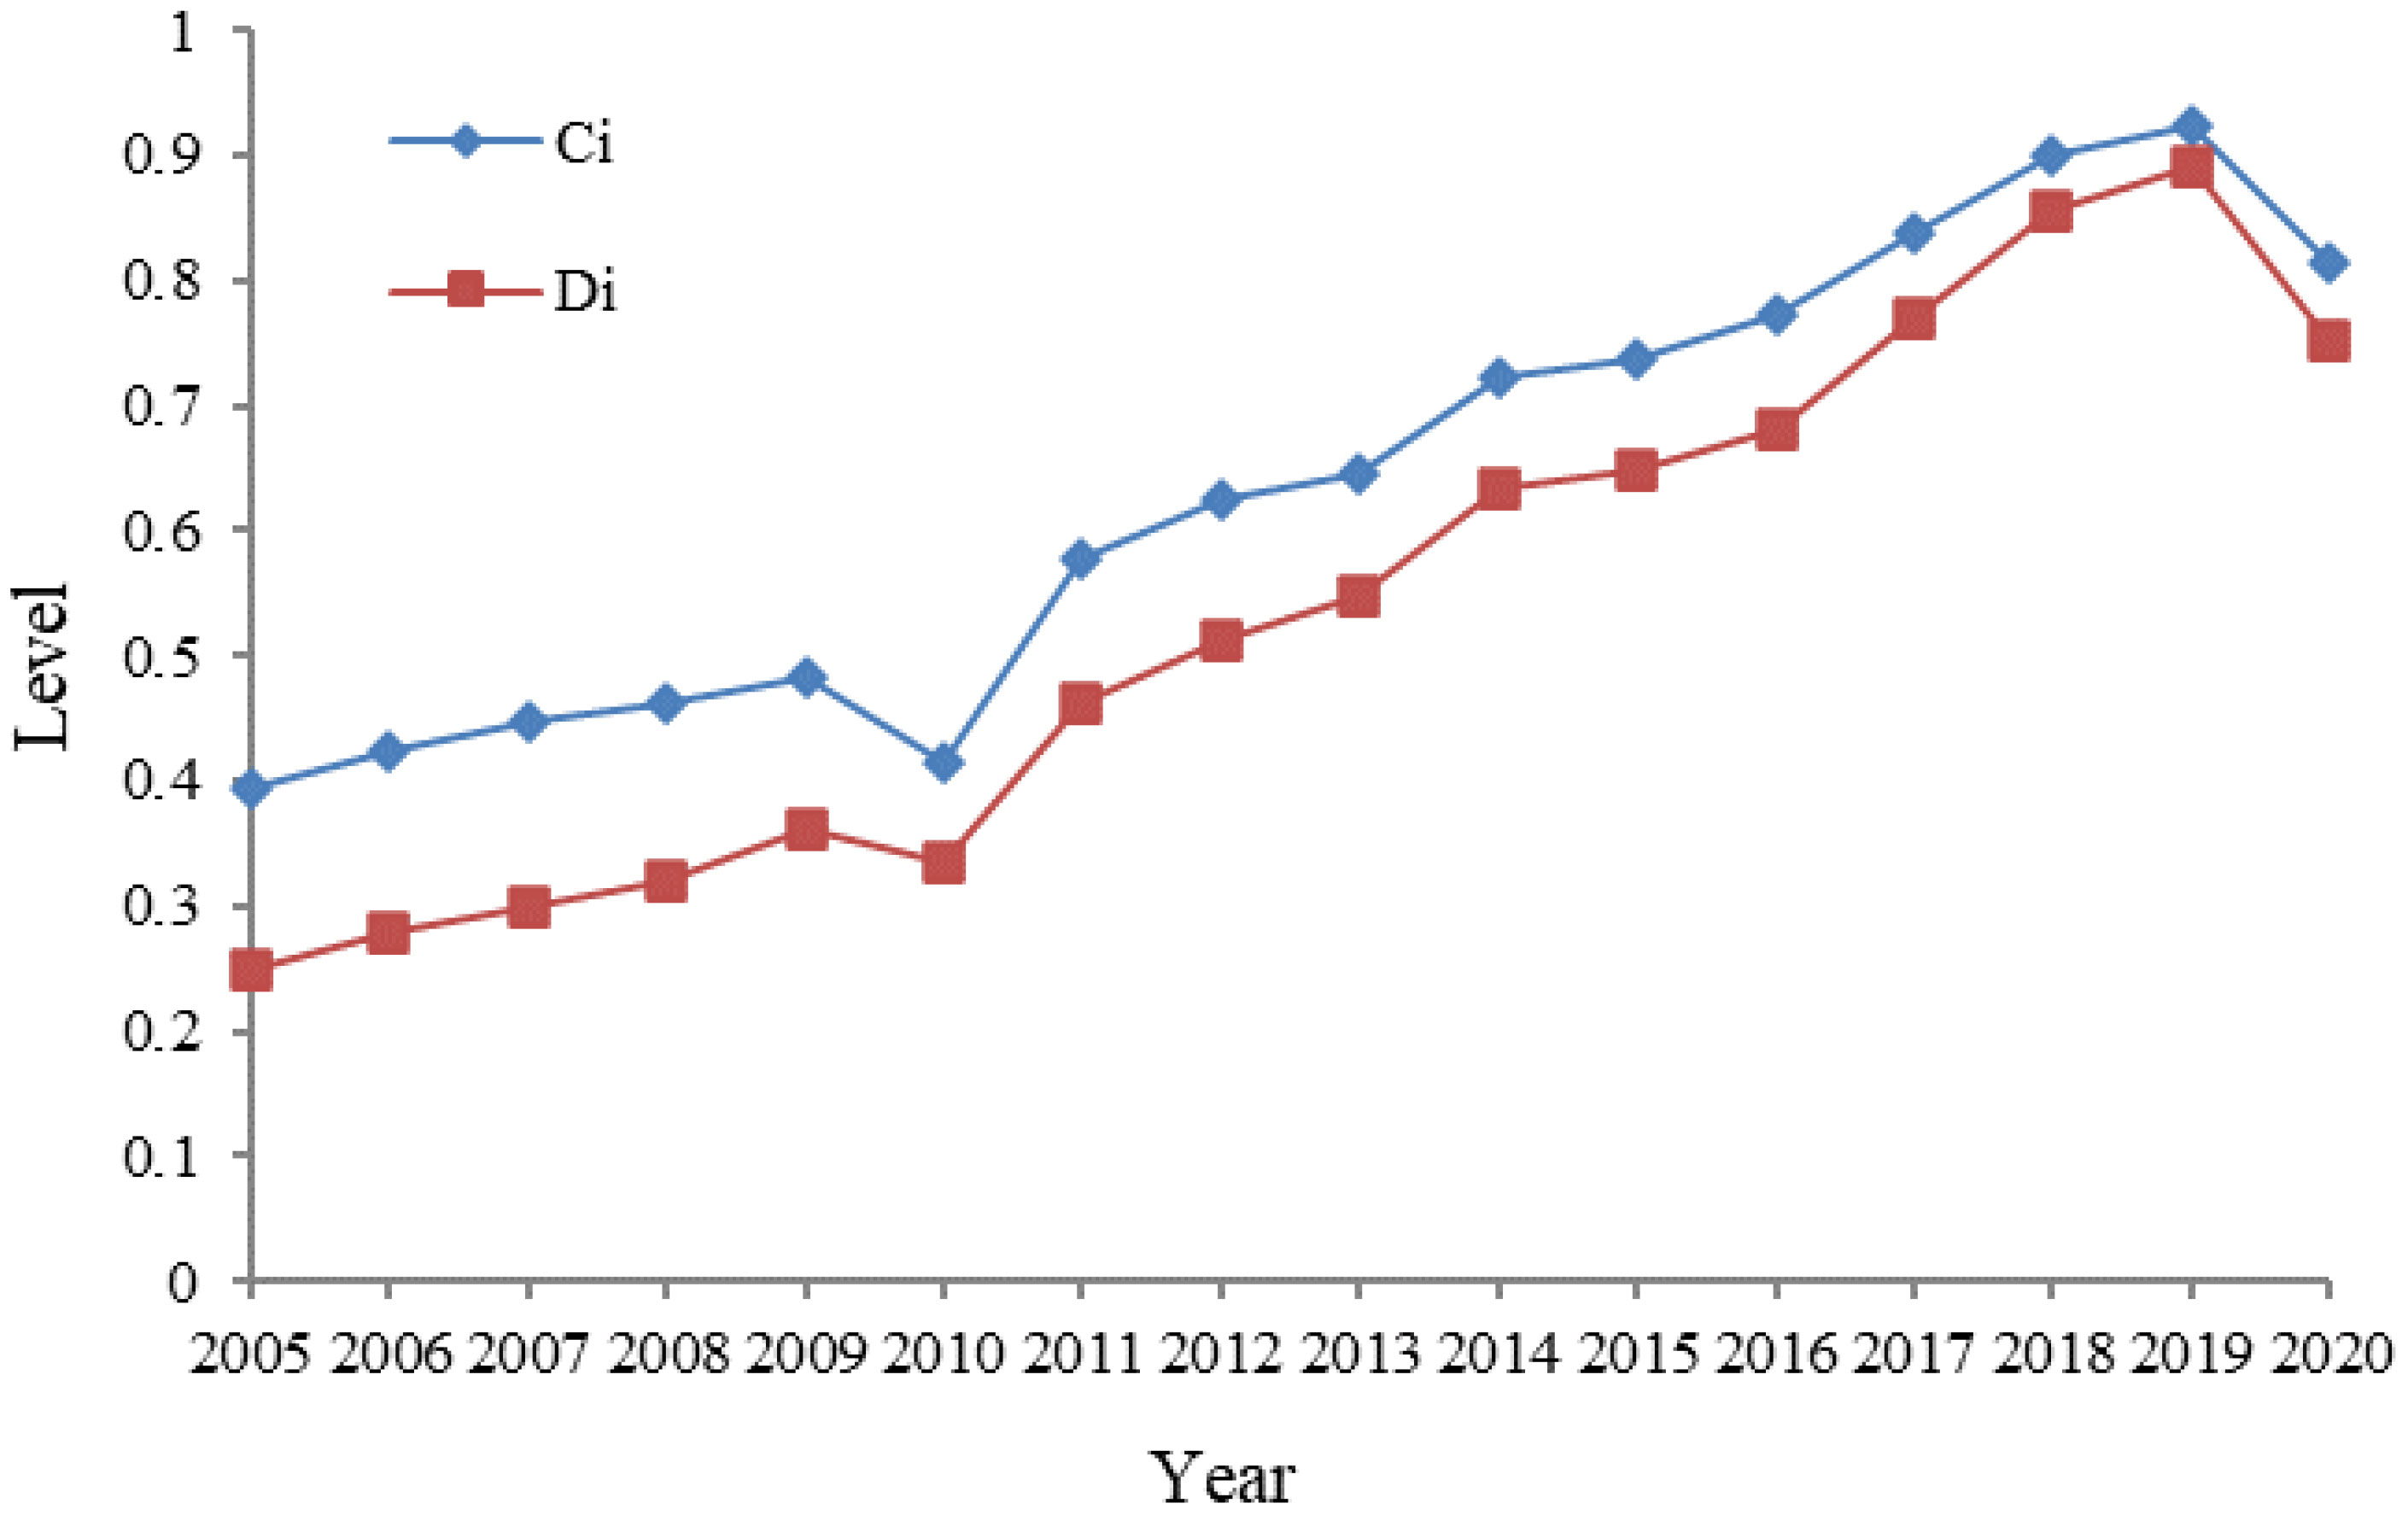
Figure 4 Trend of the coupling degree and coupling coordination degree of the integrated system (Ci is the degree of coupling between tourism and the environment, and Di is the degree of coupling coordination between tourism and the environment).
As shown in Figure 4, from 2005 to 2020, the coupling degree of the two subsystems had a relatively stable increasing trend, from 0.4 to 0.9, reflecting the increasing trend of the relationship between tourism and the ecological environment and the evolution from low coupling to high coupling. Based on the D values, the coupling and coordination relationship between tourism and the ecological environment on Hainan Island continuously strengthened from 2005 to 2019. It experienced seven stages from moderate imbalance to high coordination. The average time span of each stage was two to three years, and the leap from quantity to quality occurred rapidly. The details are as follows: the coupling and coordination relationship between tourism and ecological environment on Hainan Island experienced moderate incoordination from 2005 to 2007, slight incoordination from 2008 to 2010, and a transition from 2011 to 2012. Then, it entered a relatively long-term coordinated development stage from 2013 to 2019. The stage of coordination of tourism and the ecological environment on Hainan Island specifically includes the qualitative leap from approaching coordinated to slightly coordinated to moderately coordinated and then to highly coordinated from 2013 to 2019.
As shown by the relative development value δ in Table 3, from 2005 to 2020, the ecological environment provided strong support and guarantees for tourism on Hainan Island. From 2005 to 2016, the ecological environment of Hainan Island was always ahead of tourism development, providing favorable ecological environment base dividends for tourism development. From 2017 to 2018, tourism and the ecological environment entered the stage of coupling coordinated development at a medium and high level, driving each other and entering the ideal stage of mutually promoting development. However, it is noteworthy that the ecological environment began to lag behind the development of tourism after 2019. In 2020, due to the impact of the global outbreak of COVID-19, the coupling degree and the coupling coordination degree of tourism and the ecological environment on Hainan Island showed a backward trend, mainly due to the constraints of tourism development.
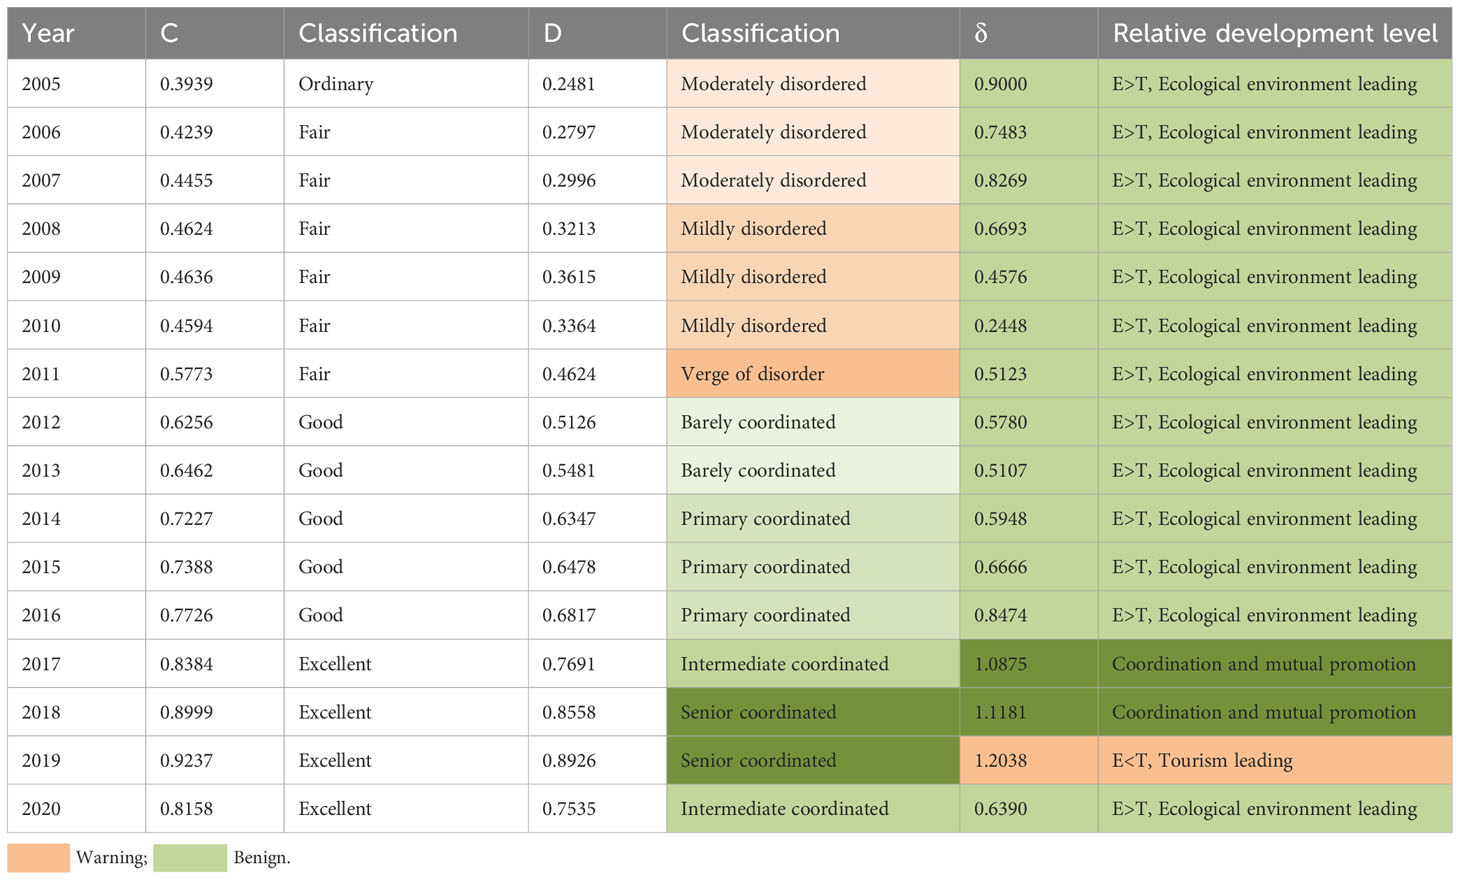
Table 3 Degree of coordinated coupling of tourism development and the ecological environment on Hainan Island.
4.5 Interaction effect between tourism development and the ecological environment on Hainan Island
To verify the interaction between the ecological environment and tourism development on Hainan Island, this study generated a new interaction term Ei*Ti, which was verified by ANOVA and regression analysis using Stata 16.0 software (Table 4). The validation results show that the coefficient of determination R2 was 0.9996, the coefficient of the interaction term Ei*Ti was -0.3232, and the p value was 0.0000<0.01, indicating that tourism development and the ecological environment had significant interactive stress, which had extremely significant impacts on the coupling coordination of tourism development and the ecological environment on Hainan Island.
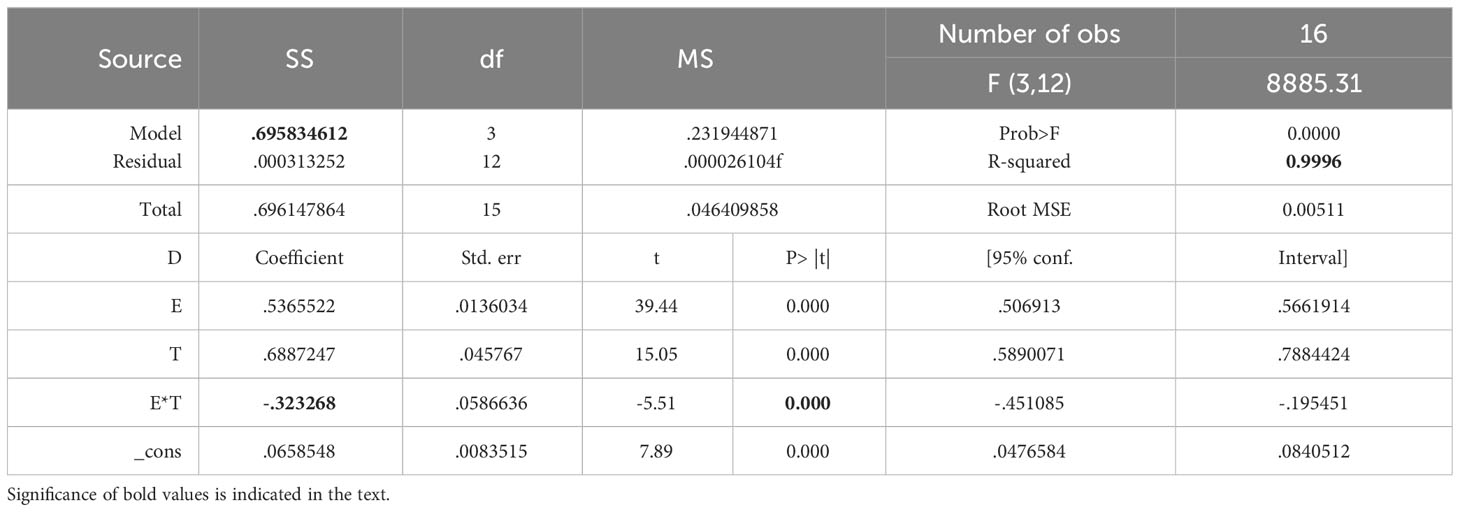
Table 4 Interactive stress and significance of tourism development and the ecological environment on Hainan Island.
The results above confirm that the ecological environment subsystem and tourism development subsystem of Hainan Island had significant interactive stress during the last 16 years. To further analyze the internal interactive stress process, the following assumption is made: there was an inverted U-shaped curve change relationship between Hainan Island’s ecological environment and tourism development. That is, the quality of Hainan Island’s ecological environment was optimized with the continuous increase in the tourism development level, but the optimization rate gradually decreased until tourism development reached a certain level, and the quality of the ecological environment was no longer optimized, but with the continuous promotion of tourism development, it showed a declining trend. The reasons for making the assumption above are as follows: Grossman and Krueger (1995) proposed the hypothesis of the inverted U-shaped environmental Kuznets curve (EKC) for the first time in their environmental economics study, pointing out that there was an inverted U-shaped curve change relationship between the state of the ecological environment and the level of economic development. On this basis, scholars have also proposed that there is an inverted U-shaped curve between the tourism economy and ecological environment (Wang et al., 2006; Wang and Li, 2022). The tourism industry is the leading industry on Hainan Island, plays an important role in its economic development and has a very close relationship with the ecological environment. Therefore, the assumption above is proposed.
Based on the theory of system dynamics, the function change curve between the two subsystems of Hainan Island’s ecological environment and tourism development from 2005 to 2020 was fitted and generated by using Stata 16.0 software (Figure 5). The specific parameters are shown in Table 5, and the binomial regression function model is constructed [Equation (13)].
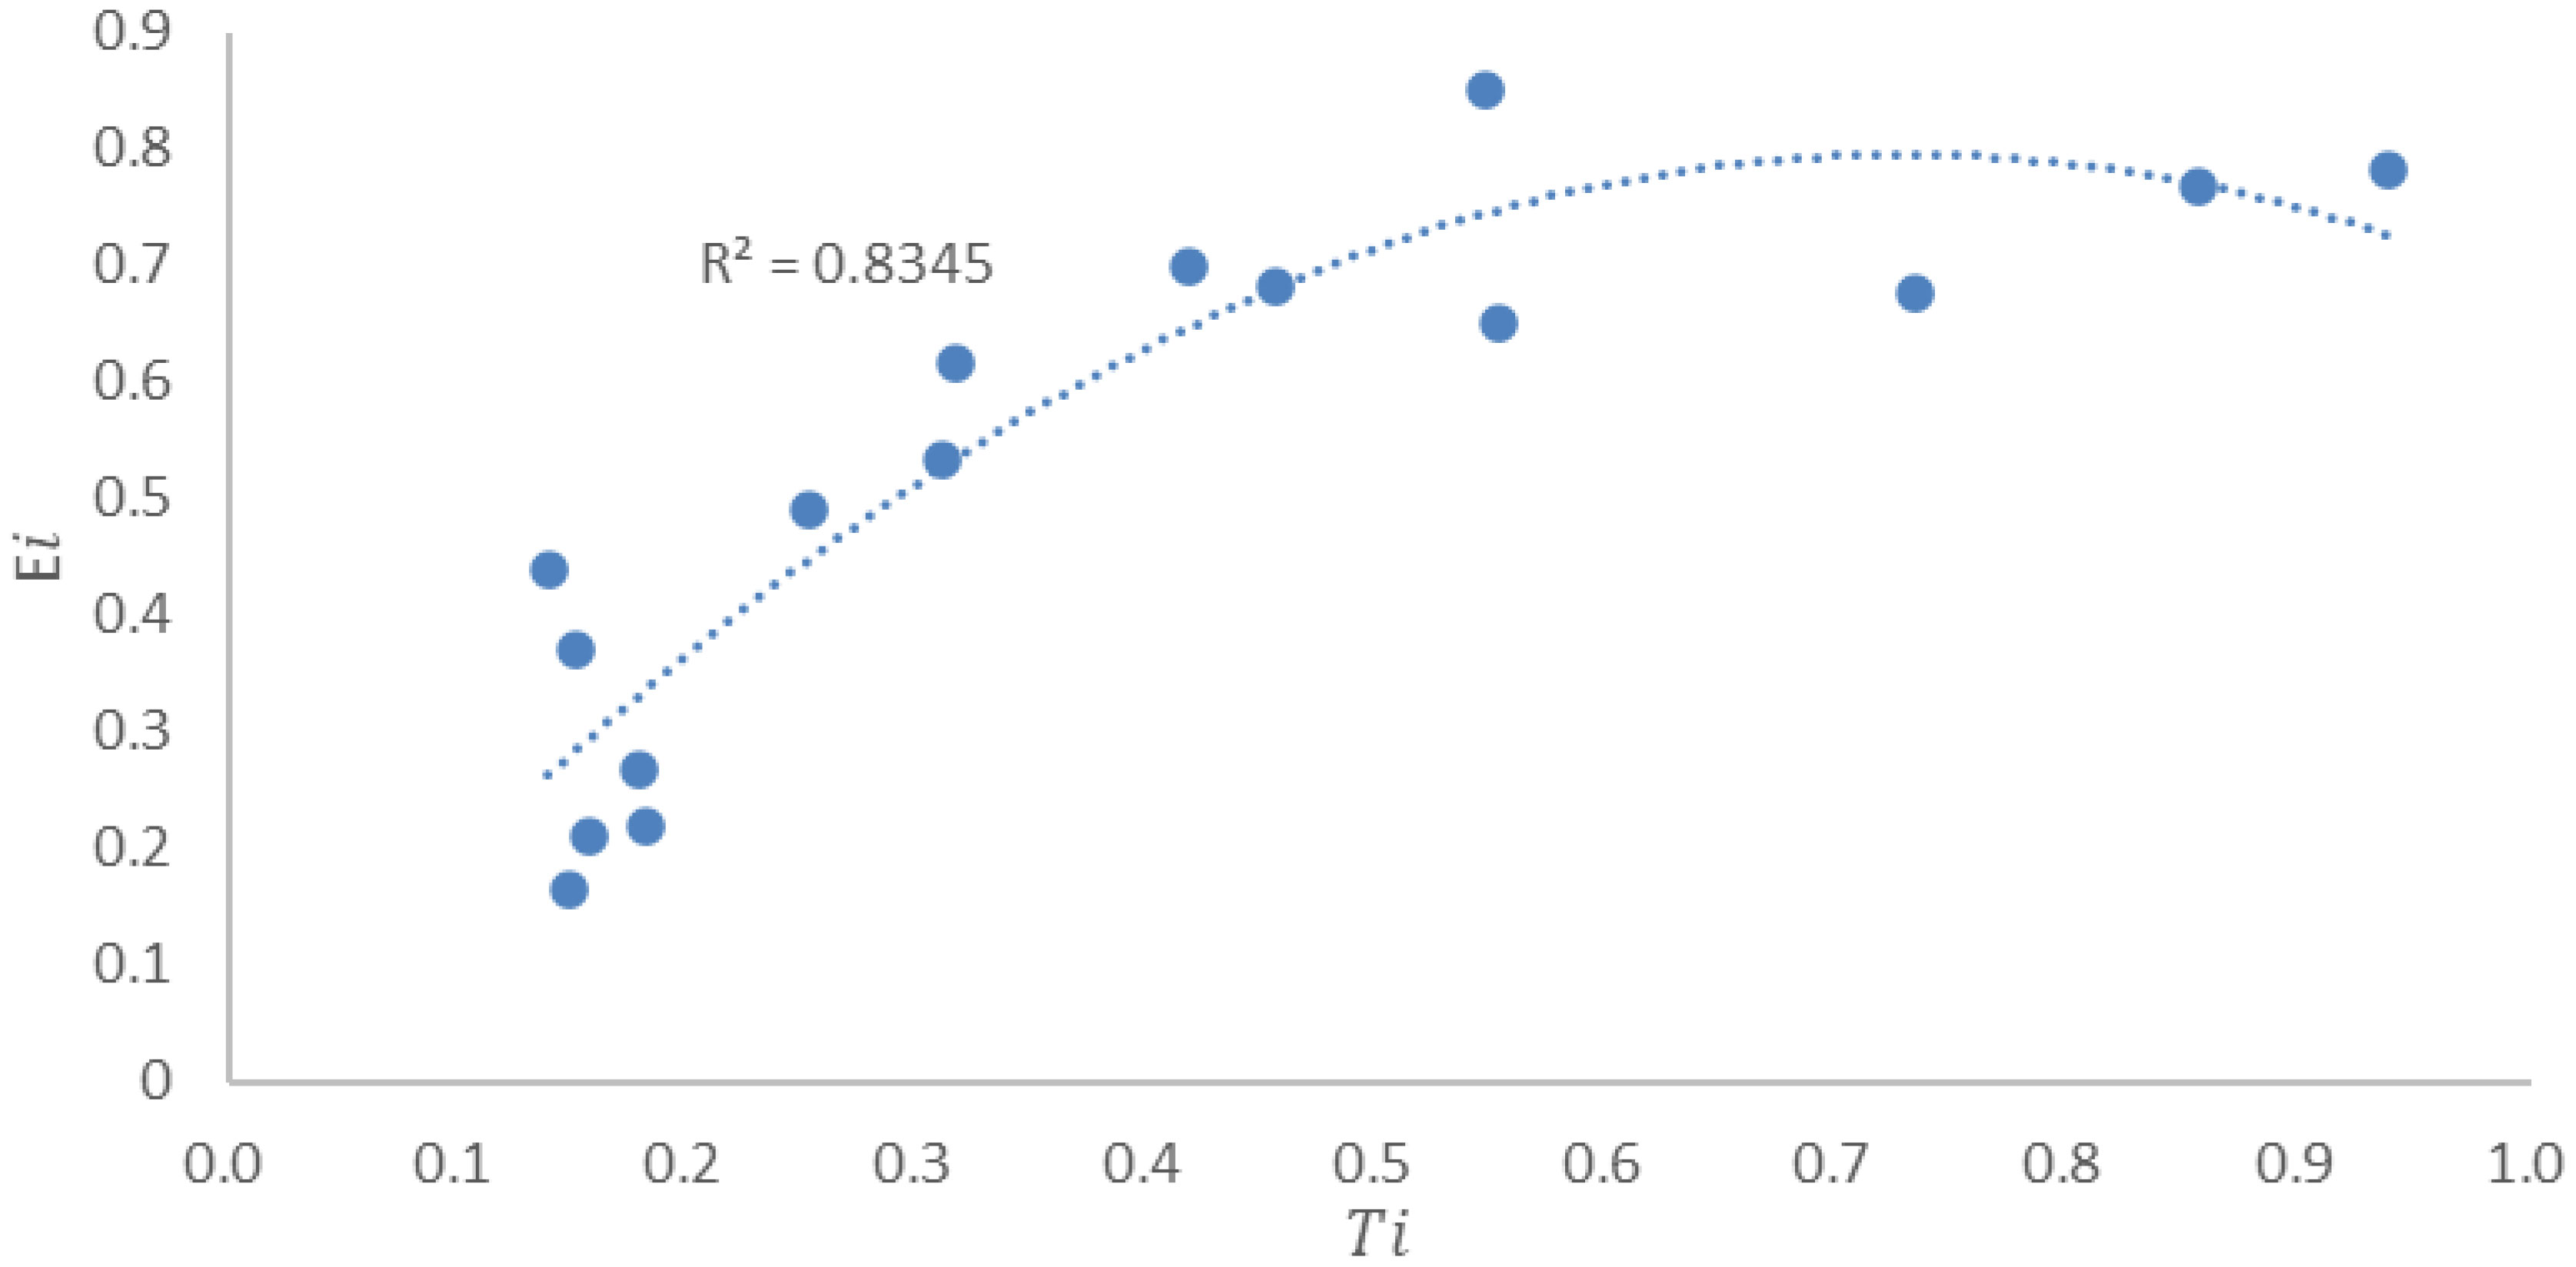
Figure 5 Functional change curve between the two subsystems of the ecological environment and tourism development on Hainan Island.
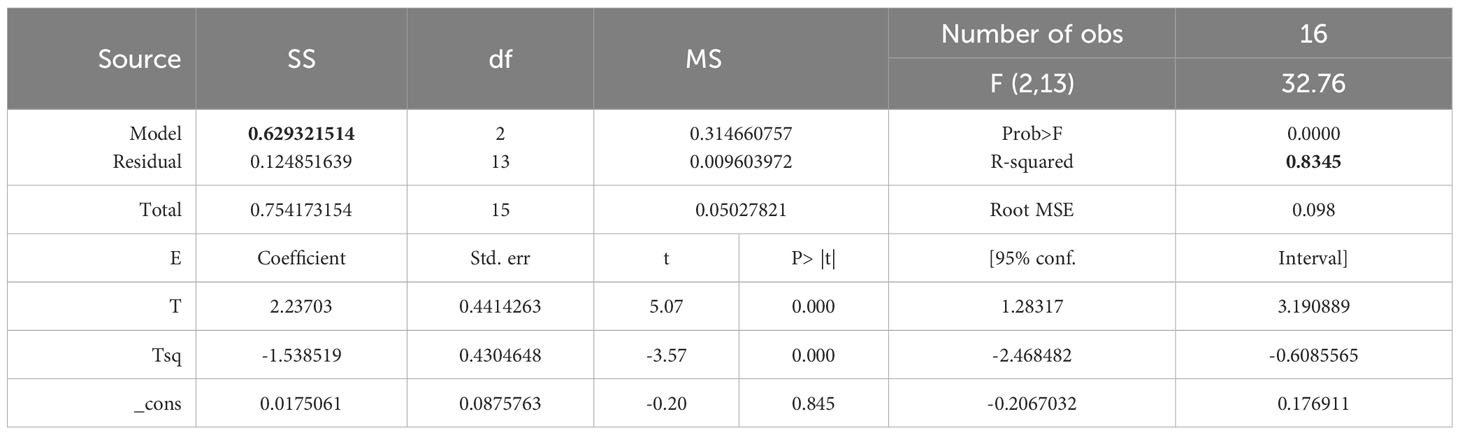
Table 5 Correlation coefficient of and variance in the regression model between the ecological environment and tourism development on Hainan Island.
As shown in Table 5, the SSM value is 0.6293, and R2 is 0.8345, indicating that the curve model fits well. Meanwhile, the p values of the coefficients of tourism development index T and T2 are 0.000 and 0.003, respectively, which are less than 0.01, indicating that at the 99% confidence level, the tourism development index T and its square value T2 have significant impacts on the ecological environment of Hainan Island.
Based on the analysis results above, it can be effectively confirmed that there is a significant inverted U-shaped curve function relationship between the quality of the ecological environment and the level of tourism development of Hainan Island, which is expressed by the binomial regression function as follows:
After further adjustment, the following function is obtained:
Based on Equation (13), when the tourism development index of Hainan Island reaches 0.7269 in a period of time, the optimal value of the ecological environmental quality index is 0.7956, which also represents the best state between tourism development and the ecological environment. In detail, the ecological environment quality of Hainan Island is also optimized with the continuous improvement in the tourism development level, but the optimization rate gradually decreases. Once tourism development reaches 0.7269, the ecological environment quality begins to deteriorate with the continuous promotion of tourism development, and the degradation rate gradually accelerates with the improvement in the tourism development level.
5 Discussion
Based on the function law above, corresponding to the history of the relationship between tourism development and ecological environment development on Hainan Island, it is found that the tourism development index of Hainan Island in 2017 was 0.7326, the closest to the critical value of 0.7269. The overall law shows that the ecological environment of Hainan Island was continuously optimized with tourism development from 2005 to 2017, and the two promoted each other and complemented each other. After 2017, Hainan Island’s ecological environment and tourism development entered a stage of stress development. With the improvement in the tourism development level, the ecological environment had a trend of degradation. The relative development index of the ecological environment and tourism development δ also showed that the ecological environment lagged behind the development of tourism, proving the credibility of this trend to some extent. This trend constitutes a warning that is worthy of the attention of the tourism development and ecological environment protection departments of Hainan Island. On the one hand, these departments should improve the protection of the ecological environment base of Hainan Island, increase investment in environmental improvement, and build an ecological civilization demonstration area. On the other hand, they should balance the tourism development level index and adhere to the high-quality development path of promoting the integration of culture and tourism.
In addition, the confirmation of the inverted U-shaped curve relationship between the ecological environment and tourism provides evidence for the hypotheses proposed by some scholars. In research on the relationship between the ecological environment and tourism stress, scholars such as Wang et al. (2019) and Wang and Li (2022) directly cited the inverted U-shaped model constructor based on the verification of the inverted U-shaped relationship between the environment and the economy or urbanization and the economy from the studies of Zhou (1982) and Huang and Fang (2003). The results of this study can directly provide evidence that the relationship between ecological environment and tourism exhibits an inverted U-shaped curve.
Multiple models and parameters were applied in the study to analyze the coupling and coordination relationship between ecological environment and tourism development, which inevitably leads to some uncertainties. For example, in the coupling coordination degree model (CCDM), wt and we are the weights of T and E, representing the contributions of tourism and the environment, respectively. For Hainan, tourism development and the ecological environment complement each other, so tourism development and the ecological environmental quality are equally important; thus, the values of wt and we are equivalent, i.e., wt=we=0.5. Although uncertainty still exists, it does not affect the general trend of coupling coordination degree.
Based on the dynamic change process of the coupling and coordination relationship between tourism development and the ecological environment of Hainan Island, we have found that the degradation rate of ecological environment will gradually accelerate with the improvement of tourism development level. It is urgent for Hainan Island to transform its tourism industry, the internationally popular ESG (Environmental, Social and Governance) concept can be introduced. As an evaluation standard to measure the contribution of tourism enterprises in ecological environment protection, social responsibility fulfillment and corporate governance, ESG is highly consistent with the green transformation of tourism industry and the essential requirements of high-quality development, and it is of great significance for promoting the sustainable development of tourism and ecological environment of Hainan Island.
6 Conclusion
Hainan Island is the largest international tourism island in China. Its coastal tourism development and ecological civilization construction have been incorporated into the national development strategy. Revealing the coupling coordination relationship between regional leading industry, i.e., tourism and the ecological environment holds great value. The following conclusions are drawn from this study:
(1) During the 15 years before the global outbreak of COVID-19, from 2005 to 2019, the complex system composed of tourism and the ecological environment on Hainan Island was in the stage of continuous upward benign development. Tourism development showed a dynamic trend of fluctuating and rapid enhancement, with an increase of 6.3 times in 2019, especially after 2011. Hainan Island tourism entered a relatively long period of stable and rapid development. Overall, the ecological environment was continuously optimized by approximately 5% every year. After being affected by the COVID-19 outbreak in 2020, the tourism development level of Hainan Island experienced a steep decline, falling back to the 2016-2017 level. However, COVID-19 had no inhibitory impacts on the ecological environment, and the ecological environment of Hainan Island continued to remain optimized compared with the 2019 ecological environment level.
(2) From 2005 to 2020, the coupling degree of the two subsystems (tourism development and the ecological environment) showed a relatively stable increasing trend, from low coupling to high coupling. The coupling coordination relationship of the two subsystems continuously strengthened from 2005 to 2019. It experienced seven stages from moderately uncoordinated to highly coordinated. The average time span of each stage was two to three years, and the leap from quantity to quality occurred rapidly. In 2020, due to the impacts of the global outbreak of COVID-19, the coupling degree and the coupling coordination degree of the two subsystems showed backward trends, which were mainly related to tourism development.
(3) From 2005 to 2017, Hainan Island was in the ecological environment leading stage. From 2017 to 2019, it entered the stage in which the ecological environment lagged behind tourism development, while from 2017 to 2018, the relative development degree δ belonged to (0.9,1.2), showing that tourism and the ecological environment were in the mutual promotion and coordinated development stage. In 2019, the ecological environment lagged behind the tourism development index, which is an important warning signal. If tourism development did not slow down due to the impacts of COVID-19, this trend would be likely to continue to strengthen, and the steady optimization trend of the ecological environment of Hainan Island would be blocked.
(4) Tourism development and the ecological environment on Hainan Island have significant interactive stress, which has significant impacts on the coupling coordination of the two subsystems. The relationship of the two subsystems on Hainan Island is an inverted U-shaped function curve. Based on the model, when tourism development reaches 0.7269, the ecological environment quality also reaches the best state.
Data availability statement
The original contributions presented in the study are included in the article/supplementary material. Further inquiries can be directed to the corresponding author.
Author contributions
CZ: Conceptualization, Data curation, Formal Analysis, Investigation, Methodology, Software, Writing – original draft. XW: Conceptualization, Formal Analysis, Funding acquisition, Investigation, Writing – review & editing. PJ: Conceptualization, Funding acquisition, Supervision, Writing – review & editing. KZ: Data curation, Writing – review & editing.
Funding
The author(s) declare financial support was received for the research, authorship, and/or publication of this article. This study was supported by National Social Science Foundation in China[21XGL019], Scientific Research Project of Colleges and Universities of Hainan Province [Hnky2019-19] and Major Projects of Philosophy and Social Sciences in Colleges and Universities in Jiangsu Province [2021SJZDA034].
Conflict of interest
The authors declare that the research was conducted in the absence of any commercial or financial relationships that could be construed as a potential conflict of interest.
Publisher’s note
All claims expressed in this article are solely those of the authors and do not necessarily represent those of their affiliated organizations, or those of the publisher, the editors and the reviewers. Any product that may be evaluated in this article, or claim that may be made by its manufacturer, is not guaranteed or endorsed by the publisher.
Footnotes
- ^ https://www.mohurd.gov.cn/gongkai/fdzdgknr/sjfb/tjxx/jstjnj/index.html
- ^ https://hnsthb.hainan.gov.cn/xxgk/0200/0202/hjzl/hjzkgb/xxgkindex.html
References
Brahmasrene T., Lee J. W. (2017). Assessing the dynamic impact of tourism, industrialization, urbanization, and globalization on growth and environment in Southeast Asia. Int. J. Sustain. Dev. World Ecol. 24, 362–371. doi: 10.1080/13504509.2016.1238021
Chen M. X., Lu D. D., Zhang H. (2009). Comprehensive evaluation and the driving factors of China’s urbanization. Acta Geographica. Sin. 64, 387–398. doi: 10.11821/xb200904001
Cui F. (2008). Coordinated development degree of tourism economy and ecological environment in Shanghai. China Population. Resour. Environ. 18, 64–69. doi: 10.3969/j.issn.1002-2104.2008.05.011
Defeo O., Mclachlan A., Armitage D., Elliott M., Pittman J. (2021). Sandy beach social–ecological systems at risk: regime shifts, collapses, and governance challenges. Front. Ecol. Environment. 19, 564–573. doi: 10.1002/fee.2406
Geng Y. Q., Wang R., Wei Z. J., Zhai Q. H. (2021). Temporal-spatial measurement and prediction between air environment and inbound tourism: Case of China. J. Cleaner. Production. 287 (5), 125486. doi: 10.1016/j.jclepro.2020.125486
Gössling S. (2002). Global environmental consequences of tourism. Global Environmental Change 12 (4), 283–302. doi: 10.1016/S0959-3780(02)00044-4
Grossman G. M., Kreuger A. B. (1995). Economic growth and the environment. Q. J. Econ. 110, 353–377. doi: 10.2307/2118443
Guan D. J., Gao W. J., Su W. C., Li H., Hokao K.. (2011). Modeling and dynamic assessment of urban economy-resource-environment system with a coupled system dynamics geographic information system model. Ecol. Indic. 11, 1333–1344. doi: 10.1016/j.ecolind.2011.02.007
Hainan Provincial Bureau of Statistics of China. (2023). Hainan Statistical Yearbook. Available at: https://stats.hainan.gov.cn/tjj/tjsu/ndsj/.
He J. Q., Wang S. J., Liu Y. Y., Ma, H. T., Liu Q. Q. (2017). Examining the relationship between urbanization and the eco-environment using a coupling analysis: Case study of Shanghai, China. Ecol. Indic. 77, 185–193. doi: 10.1016/j.ecolind.2017.01.017
Hockings M., Twyford K. (1997). Assessment and management of beach camping within Fraser Island World Heritage Area, South-East Queensland. Aust. J. Environ. Management. 4, 25–39. doi: 10.1080/14486563.1997.10648369
Huang J. C., Fang C. L. (2003). Analysis of coupling mechanism and rules between urbanization and eco-environment. Geographical. Res. 22, 211–220. doi: 10.11821/yj2003020010
Joye J. F. (2018). Tourism development and adaptation to climate change through legal constraint. Worldwide. Hospitality. Tourism. Themes. 10, 244–252. doi: 10.1108/WHATT-12-2017-0074
Lai Z. Z., Ge D. M., Xia H. B., Yue Y. L., Wang Z. (2020). Coupling coordination between environment, economy and tourism: A case study of China. PLoSONE 15 (2), e0228426. doi: 10.1371/journal.pone.0228426
Li R. R., Ding Z. Y., An Y. (2022). Examination and forecast of relationship among tourism, environment, and economy: A case study in shandong province, China. Int. J. Environ. Res. Public Health 19, 2581. doi: 10.3390/ijerph19052581
Li Y. F., Li Y., Zhou Y., Shi Y. L., Zhu X. D. (2012). Investigation of a coupling model of coordination between urbanization and the environment. J. Environ. Management. 98, 127–133. doi: 10.1016/j.jenvman.2011.12.025
Li S. J., Wang T. (2017). An empirical study on the coupling and coordination of tourism-economy-ecological environment in coastal cities. J. Ocean. Univ. China (Social. Sci. Edition). 157, 43–49. doi: 10.3969/j.issn.1672-335X.2017.06.009
Liang L., Zhang F., Wu F., Chen Y. X., Qin K. Y. (2022). Coupling coordination degree spatial analysis and driving factor between socio-economic and eco-environment in northern China. Ecol. Indic. 135, 108555. doi: 10.1016/j.ecolind.2022.108555
Liu Y. Z., Hu Z. Y. (2020). Research on the coordination of tourism development and protection coupling of ecological environment based on PSR model: The empirical evidence from Guizhou Province. Ecol. Econ. 36, 132–136. doi: 10.14071/j.1008-8105(2020)-6017
Liu D. H., Yang Y. C. (2011b). Coupling coordinative degree of regional economy tourism-ecological environment: a case of Anhui Province. Resour. Environ. Yangtze. Basin. 20, 892–896.
Liu Y. B., Yao C. S., Wang G. X. (2011a). An integrated sustainable development approach to modeling the eco-environmental effects from urbanization. Ecol. Indic. 11, 1599–1608. doi: 10.1016/j.ecolind.2011.04.004
Luo W. B., Tan R. (2012). Quantitative study on the coordination of urban tourism and urban development: a case of Hangzhou. Geographic. Res. 31, 1103–1110. doi: 10.11821/yj2012060013
Martínez M. L., Intralawan A., Vazquez G. (2007). The coasts of our world: ecological, economic and social importance. Ecol. Economy. 63, 254–272. doi: 10.1016/j.ecolecon.2006.10.022
Miller G. (2001). The Development of indicators for sustainable tourism: results of a Delphi survey of tourism researchers. Tourism. Manage. 22, 351–362. doi: 10.1016/S0261-5177(00)00067-4
Ministry of Natural Resources of China. (2020). China Marine Economy Statistical Bulletin 2019. Available at: http://gi.mnr.gov.cn/202005/t20200509_2511614.html.
Pang W., Ma Y. F., Tang Z. X. (2011). The coupling relationship and coordinated development between tourism economy and ecological environment: a case study of Xi’an City. J. Northwest. Univ. (Natural. Sci. Edition). 41, 1097–1101.
Patterson T., Niccolucci V., Marchettini N. (2008). Adaptive environmental management of tourism in the Province of Siena, Italy using the ecological footprint. J. Environ. Management. 86, 407–418. doi: 10.1016/j.jenvman.2006.04.017
Pickering C. M., Hill W. (2007). Impacts of recreation and tourism on plant biodiversity and vegetation in protected areas in Australia. J. Environ. Management. 85, 791–800. doi: 10.1016/j.jenvman.2006.11.021
Romeril M. (1985). Tourism and the environment: Towards a symbiotic relationship. Int. J. Environ. Stud. 25, 215–218. doi: 10.1080/00207238508710228
Shani A., Arad B. (2014). Climate change and tourism: Time for environmental skepticism. Tourism. Manage. 44, 82–85. doi: 10.1016/j.tourman.2014.02.014
Shannon C. E. (1948). A mathematical theory of communication. Bell. System. Tech. J. 27, 379–423, 623-656. doi: 10.1002/j.1538-7305.1948.tb01338.x
Su Z. J., Zhao Z. Q., Zhu P. T. (2021). Study on coupling coordination relationship and spatial evolution law of tourism-economy-ecological environment in Anhui Province. J. Northeast Normal. Univ. (Natural. Sci. Edition). 53, 115–122. doi: 10.16163/j.cnki.22-1123/n.2021.03.019
Tang Z. (2015). An integrated approach to evaluating the coupling coordination between tourism and the environment. Tourism. Management. 46, 11–19. doi: 10.1016/j.tourman.2014.06.001
Vyddiyaratnam P., Sheeba N., Hong C. (2021). Linkages between climate change and coastal tourism: A bibliometric analysis. Sustainability 13, 10830. doi: 10.3390/su131910830
Wall G., Wright C. (1977). The Environmental Impact of Outdoor Recreation (Ontario: University of Waterloo).
Wang Z. F., Li J. Y. (2022). Verify and study the coupling coordination development and the interactive stress between tourism and eco-environment in the yellow river basin. Resour. Environ. Yangtze. Basin. 31, 447–460. doi: 10.11870/cjlyzyyhj202202018
Wang Z. B., Liang L. W., Chu X. Y., Li J. X. (2019). Examining the coordination effect and interactive stress between tourism economy and eco-environment in the Tibetan Plateau. J. Geo-information. Sci. 21 (9), 1352–1366. doi: 10.12082/dqxxkx.2019.190279
Wang H., Lin J. G., Jiang B. (2006). Analysis on the coordination development degree of tourism and environment in Dalian. Mar. Environ. Sci. 25, 84–86. doi: 10.3969/j.issn.1007-6336.2006.01.023
WTO. (2021). UNWTO World Tourism Barometer and Statistical Annex 2021. Available at: https://www.e-unwto.org/doi/abs/10.18111/wtobarometereng.2021.19.1.6.
Wu X. Y., Zhang Y. J., Wang L. Z. (2022). Coupling relationship between regional urban development and eco-environment: Inspiration from the old industrial base in Northeast China. Ecological Indicators 142, 109259. doi: 10.1016/j.ecolind.2022.109259
Wu X. W., Zhong C. Q., Wang T., Zou X. Q., Zang Z., Li Q. J., et al. (2021). Occurrence and distribution of microplastics onrecreational beaches of Haichow Bay, China. Environ. Sci. pollut. Res. 28, 6132–6145. doi: 10.1007/s11356-020-10987-7
Yu J. B., Zhou D., Yu M., Yang J. S., Li Y. Z., Guan B., et al. (2021). Environmental threats induced heavy ecological burdens on the coastal zone of the Bohai Sea, China. Sci. Total. Environ. 765, 142694. doi: 10.1016/j.scitotenv.2020.142694
Zhang G. H., Liu Z. Z., Wang X. Y. (2013). Analysis and forecast of coupling degree between tourism-oriented development and eco-environment in coastal region of China. Ecol. Environ. Sci. 22, 792–800.
Keywords: ecological environment, tourism development, coupling coordination model, interactive stress, Hainan Island
Citation: Zhong C, Wu X, Jia P and Zhang K (2024) Study on the coupling coordination effect and dynamic relationship between tourism development and the ecological environment: a case study of Hainan Island. Front. Ecol. Evol. 12:1284278. doi: 10.3389/fevo.2024.1284278
Received: 28 August 2023; Accepted: 06 February 2024;
Published: 23 February 2024.
Edited by:
Wei Song, Chinese Academy of Sciences (CAS), ChinaReviewed by:
Fajin Chen, Guangdong Ocean University, ChinaQuanlin Zhong, Fujian Normal University, China
Copyright © 2024 Zhong, Wu, Jia and Zhang. This is an open-access article distributed under the terms of the Creative Commons Attribution License (CC BY). The use, distribution or reproduction in other forums is permitted, provided the original author(s) and the copyright owner(s) are credited and that the original publication in this journal is cited, in accordance with accepted academic practice. No use, distribution or reproduction is permitted which does not comply with these terms.
*Correspondence: Peihong Jia, amlhcGhAaGFpbmFudS5lZHUuY24=