 Sima Mohammadi
 Faraham Ahmadzadeh
- Department of Biodiversity and Ecosystem Management, Environmental Sciences Research Institute, Shahid Beheshti University, Tehran, Iran
Introduction: Land snails play a crucial role in maintaining ecosystem sustainability within their habitats. Therefore, understanding the characteristics of their communities is vital for ecological studies and the development of effective conservation strategies. In this study, land snail communities inhabiting the Hyrcanian forest were identified and the variations in their community composition along elevational gradients were investigated.
Methods: Snail samples were collected from three distinct elevations in three different forest locations within the Hyrcanian area of Iran. This study utilized DNA barcoding to identify land snail species. By employing statistical analyses such as ANOVA and PERMANOVA, significant differences in the features of snail communities across different elevations were examined. Concurrently, soil samples were collected from each site to assess soil physicochemical parameters about snail presence.
Result: Through this comprehensive analysis, a total of 10 OTUs, were further classified into seven families, and nine genera were identified. Five of these genera had never been reported in the study region before. We observed a decline in OTU richness with increasing elevation; however, the maximum abundance of snails was found at higher elevations. CCA demonstrated that Ca, Mg, and moisture saturation predominantly shape snail community composition.
Discussion: The unique climatic conditions and spatial distribution of precipitation from lowlands to highlands, as well as from west to east, make the Hyrcanian forests an ideal case study area for understanding the dynamics of land snail communities. In summary, this study provides new insights into the land snail communities thriving in the Hyrcanian forests. The findings from our research can contribute to the development of effective conservation management strategies for forest ecosystems. By understanding the factors influencing the distribution and composition of land snail communities, we can make informed decisions to protect and preserve land snails and the balance they maintain within their habitats.
Introduction
Land snails are a diverse group of animals belonging to the Mollusca phylum, with over 24,000 recognized species (Brown and Lydeard, 2010). They are important due to their position in the food web and provide a vital source of calcium for other animals, such as birds, snakes, and mammals (Rull et al., 2019; Dempsey et al., 2020). These gastropods inhabit a variety of terrestrial environments, such as leaf litter, soil, rocks, and trees. Different species have specific habitat preferences based on factors such as moisture, temperature, and soil composition (Jurickova et al., 2008). The physicochemical characteristics of soil, particularly the presence of calcium, have a significant impact on the population density and shell formation of land snails (Hotopp, 2002; Meyer and Paulay, 2005). Land snails are very important bioindicators as they provide valuable insights into the overall health and diversity of ecosystems. This is because they typically have a restricted annual movement within specific habitats (Baur and Baur, 1992; Aubry et al., 2005). In various pollution scenarios, such as toxicity bioassays (Swaileh and Ezzughayyar, 2000), oil pollution (Achuba, 2008), and soil pollution (Leomanni et al., 2016) snails are used as bioindicators Their ecological responses to environmental challenges such as climate change (Teles et al., 2022; Zheng et al., 2022; Guan et al., 2023), introduced species (Cowie and Rundell, 2002), and habitat fragmentation (Gheoca et al., 2021) make land snails as an ideal model for ecological studies (Shimizu and Ueshima, 2000). Land snails’ distribution and activity are also affected by elevation. As many studies have shown, there is a decline in land snail species richness at high elevations, accompanied by changes in abundance and species composition (Aubry et al., 2005; Wronski and Hausdorf, 2008; Liew et al., 2010; Dourson and Langdon, 2012). Gaining a comprehensive understanding of the correlation between snail communities and environmental factors, especially in spatial dimensions like altitudinal gradients, provides conservation managers with valuable insights for protecting biodiversity and habitat conservation (Mathias et al., 2001; Goodacre, 2002; Arnaud et al., 2003; Jackson and Blois, 2015; Nicolai and Ansart, 2017).
In this context, the Hyrcanian forest of Iran serves as a compelling case study. This forest holds immense significance as the primary remnant of Cenozoic forests and served as a refuge for ancient species during the last ice age (Tarkhnishvili et al., 2012; Ahmadzadeh et al., 2020; Amiri et al., 2021; Saberi-Pirooz et al., 2021). Although some studies have identified land snail species in the Hyrcanian forest, research is scarce regarding the composition of these snail communities and their ecological analysis. To date, approximately 40 species have been reported (Issel, 1865; Forcart, 1935; Starmuhlner and Edlauer, 1957; Yassini, 1976; Eliazian et al., 1979; Mansoorian, 2005; Ahmadi, 2012). In previous studies, snails were identified solely based on their morphological characteristics. However, this approach can result in misidentification, which can have a significant impact on biodiversity evaluation. Accurate identification is crucial for conservation management. Relying exclusively on morphological characteristics for species identification can lead to misidentification, which can significantly affect the evaluation of biodiversity, a crucial factor in conservation management (Bickford et al., 2007). Despite numerous researches conducted on the identification of land snails using morphological features in various regions, there are still numerous species with uncertain systematic status (Tattersfield et al., 2001). This lack of clarity can pose significant challenges for ecological studies. Land snail morphological identification relies on conchology, which is the study of shells. It is prone to frequent misidentification, especially for small species, due to shell variations influenced by habitat-specific environmental factors (Nekola and Coles, 2010; Smith and Hendricks, 2013). Land snails, like many other organisms, can have cryptic species that look very similar despite having significant genetic differences. Furthermore, there is a limited number of biologists who have the necessary expertise to accurately identify and name different species of land snails based on their morphological characteristics (Waugh, 2007; Zeng et al., 2017; Mouahid et al., 2018). To overcome the challenges related to identifying land snail species, it is beneficial to combine morphological identification with other methods such as DNA barcoding and molecular techniques. In recent years, DNA barcoding has become a popular method for species identification due to its quick and precise nature, which has proven to be more effective than traditional morphology-based approaches (Ezzine et al., 2018; Galan et al., 2018; Nantarat et al., 2019).
Our main objective for this study is to identify and evaluate the diversity of terrestrial snail species in the Hyrcanian forest ecosystem by utilizing a combination of the DNA barcode method and a morphological approach. We plan to investigate the composition, abundance, and diversity of these snail communities across different elevational gradients, which are divided into three distinct elevation zones within the study area. Comparing the land snail communities of different forests is also important as it will help us understand the variations in species influenced by specific geographical locations and climatic conditions of each forest. Our expectations are focused on how elevation affects the distribution patterns of land snail species within the forest. We anticipate that the communities of land snails will exhibit responses in terms of total abundance, diversity, and species composition to elevation, as well as variations across different forests. Furthermore, we aim to investigate the relationship between soil parameters and the presence of land snails. We hypothesize that the soil’s moisture and calcium content are critical factors that shape the land snail communities. Our ultimate goal is to contribute towards a better understanding of the correlation between land snail species composition and environmental variables in this unique forest ecosystem. This knowledge can aid in ecosystem management and biodiversity preservation not only in the Hyrcanian forest but also in similar ecosystems.
Materials and methods
Study area
The Hyrcanian forests are considered to be one of the most significant biomes in the world. They stretch from the Talish area, located in the southeast of the Republic of Azerbaijan, to the Golestan Province in the northeast of Iran, covering an area of around 50,000 km². These forests range from sea level to altitudes of 2800 meters, and there are three identified altitudinal belts (lowland, sub-montane, and montane forests) across the Hyrcanian region (Hamzeh’ee et al., 2008; Siadati et al., 2010). The Hyrcanian region exhibits distinct climatic patterns in its western and eastern parts, with annual rainfall decreasing from west to east (Akhani et al., 2010). The ecological coefficient of drought in the region is generally insignificant. The climate in the eastern part of Hyrcanian is warm and Mediterranean, while in the central and western parts, it is characterized as temperate and semi-temperate Mediterranean, occasionally becoming temperate and dry (Talebi et al., 2014).
Sampling
Land snails were sampled during Spring 2021 on cloudy days to optimize collection efficiency, considering their nocturnal nature (Sallam and El-Wakeil, 2012). The selection of sample sites was based on a careful consideration of both ecological and geographical factors. Three distinct locations, Kordkoy (Forest 1), Amol (Forest 2), and Tonekabon (Forest 3), were chosen to cover the east-to-west gradient of the Caspian Hyrcanian forests in our study area. These locations were selected to capture potential variations in land snail communities influenced by the distinct climatic patterns observed in the western and eastern parts of the Hyrcanian region, particularly the variation in annual rainfall from west to east. Within each location, three sampling sites were specified along an elevation slope, ranging from approximately 170m to 1600m in height from sea level (Elevation 1, Elevation 2, and Elevation 3 that demonstrate the highest elevation to lowest elevation in each location respectively). The elevation gradient was chosen to represent a range of ecological conditions and potential habitat preferences for land snails. This approach allowed us to explore the influence of elevation on land snail distribution patterns within each forest. The combination of geographical coverage and elevation variability was designed to ensure a comprehensive representation of the Hyrcanian forest ecosystem (Figure 1; the map was prepared using ArcGIS software v.10.7.1. and Table 1).
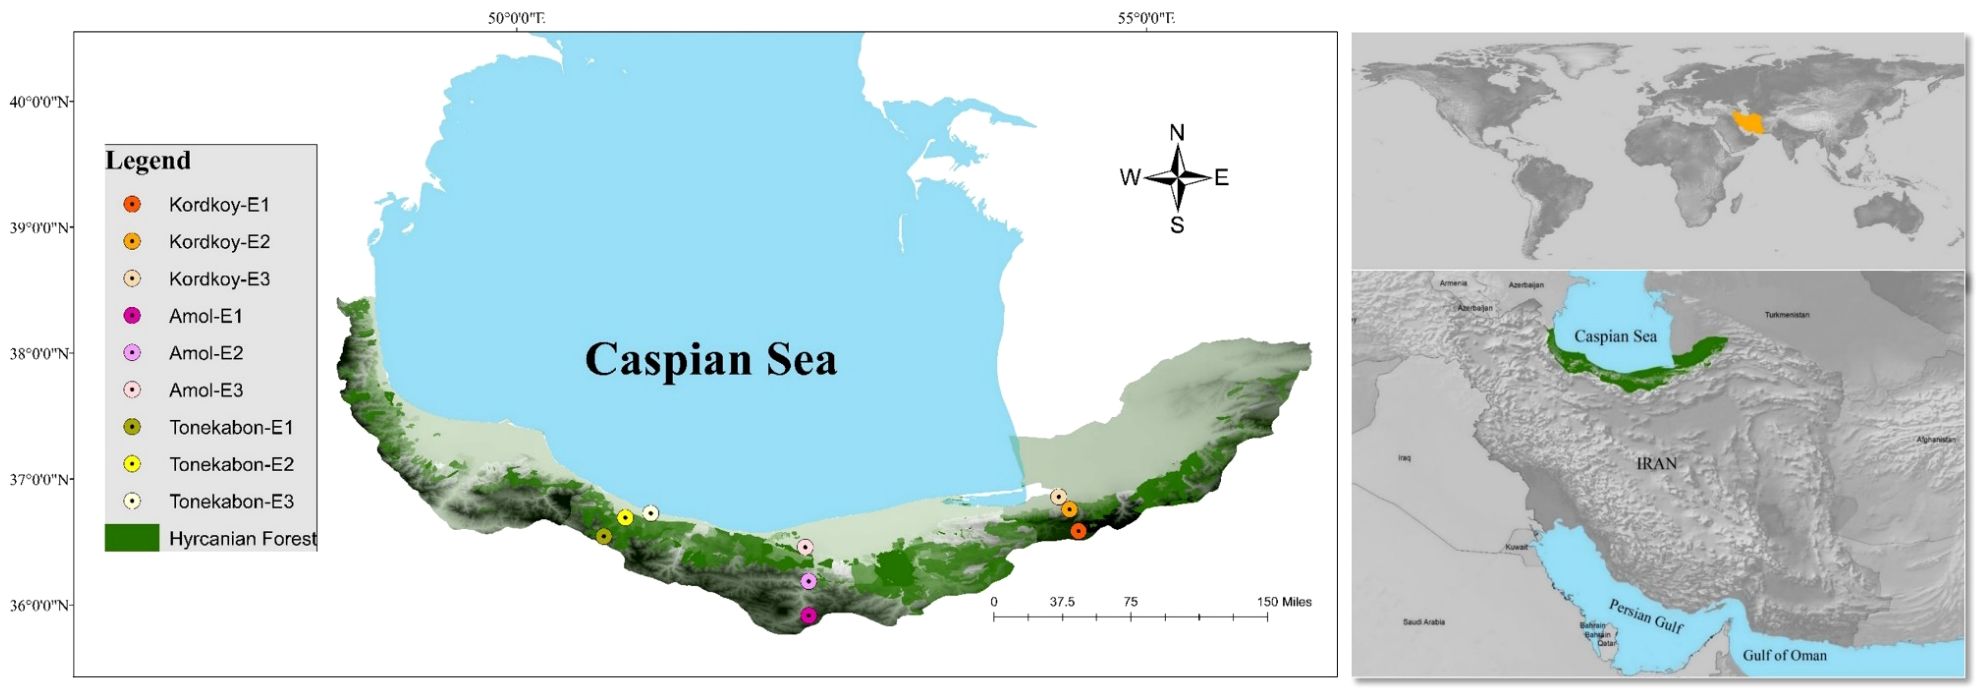
Figure 1 Study areas and sampling sites (the map was prepared using ArcGIS software v.10.7.1).
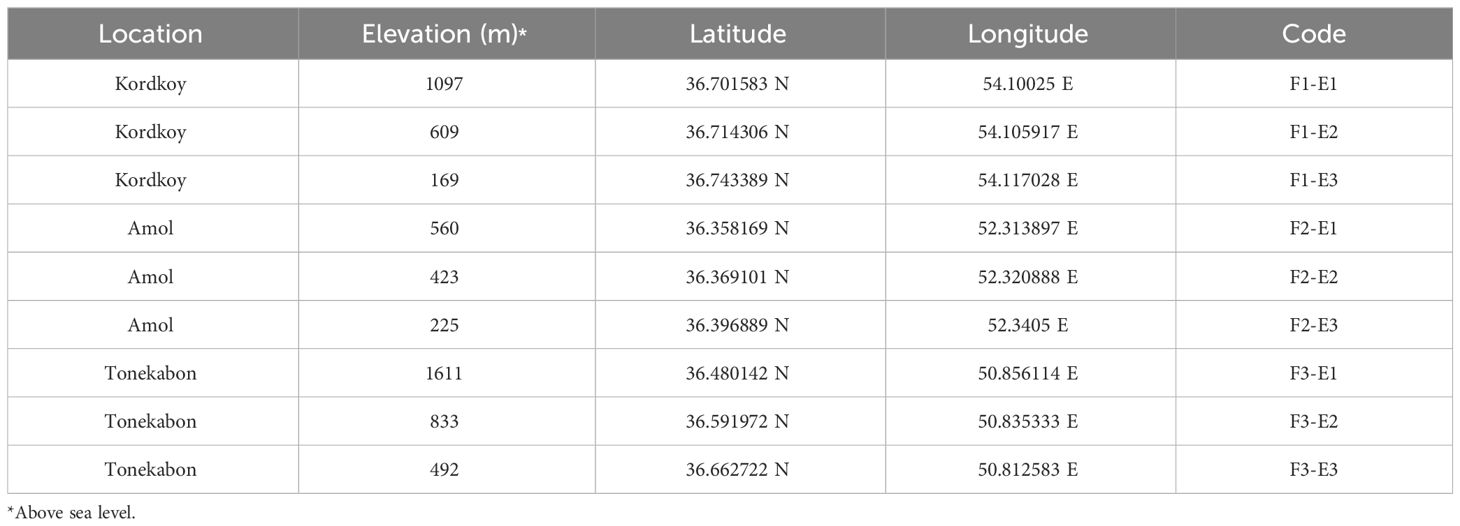
Table 1 Information on the sampling sites.
Three plots measuring 3 m x 3 m were randomly placed within each elevation (Clergeau et al., 2011) covering an area of approximately 150 m². Two researchers collected snail species from each site for one hour and then allowed them to rest in water for a day. The snails were later preserved in 96% ethanol. To ensure comprehensive biodiversity representation, litter samples were collected and transported to the lab for examination of smaller species. A total of 679 samples were collected from 27 plots across nine sites. In addition, soil samples were taken from each plot and brought to the laboratory in plastic bags for measuring various soil physicochemical parameters. These parameters included soil pH, % moisture saturation, total calcium (Ca), exchangeable calcium (Ca++), total magnesium (Mg), and exchangeable magnesium (Mg++). The selection of these specific parameters was based on previous studies that investigated the correlation between land snail communities and soil physicochemical factors (see Ondina et al., 1998; Nekola and Smith, 2000; Silvan et al., 2000; Pflug and Wolters, 2001; Hotopp, 2002; Millar and Waite, 2002; Morecroft et al., 2002; Jafarian Jeloudar et al., 2010). In the following F1, F2, and, F3 refer to Forest 1, Forest 2, and Forest 3, and also E1, E2, and E3 refer to Elevation 1, Elevation 2, and Elevation 3, respectively.
Laboratory procedures
The collected land snail samples were identified in the laboratory using available morphological keys (Eliazian et al., 1979; Dourson and Dourson, 2006; Perez et al., 2008) and assigned into distinct morphospecies. In the study area, a total of 16 morphospecies were identified. For further molecular investigation, 37 specimens were chosen (with at least two samples from each morphospecies). The high-salt method was used to extract total DNA from the selected samples (Sambrook and Russell, 2006). A portion of the mitochondrial cytochrome c oxidase subunit 1 (COI) gene was utilized for a barcoding study. The study used primers LCO 1490/HCO 2198 (Folmer et al., 1994) and HCO2198-JJ/LCO1490-JJ (Astrin and Stuben, 2008). Polymerase chain reactions (PCRs) were carried out in a total volume of 25 μl, which included 10.5 μl of ddH2O, 12.5 μl of Mastermix Red (Amplicon, Copenhagen, Denmark), 0.5-1 μl of each primer (10 pmol/µl), and 1 μl of template DNA. The PCR cycling for LCO 1490/HCO 2198 was performed under the following conditions: 94°C for 5 min, 94°C for 30 s (repeated for 35 cycles), 48°C for 30 s, 72°C for 1 min, and finally, an extension cycle at 72°C for 5 min. The PCR conditions for HCO2198-JJ/LCO1490-JJ were 94°C for 1 min, 94°C for 30 s (repeated for 5 cycles), 47°C for 90 s, 72°C for 1 min, 94°C for 30 s (repeated for 35 cycles), 51°C for 90 s, 72°C for 1 min, and a final extension cycle at 72°C for 5 min. The PCR product quality was evaluated using 1% agarose gel stained with Safe-Red. Then, the acceptable amplicons were sent to Pishgam Company (Tehran, Iran) for purification and sequencing.
Measurement of soil physicochemical properties
Soil samples were gathered from the central area of each plot, digging up to a depth of 10 cm to analyze the soil’s physicochemical properties. The soil samples from three plots at each elevation were combined and analyzed for six factors, including soil pH, % saturation moisture, Ca, Ca++, Mg, and Mg++. The measurements were done using standard methods by the Research Institute of Forest and Rangeland based in Tehran, Iran.
Genetic analysis
DNA sequences from 36 individuals were edited using Geneious Prime v. 2022.1.1 and deposited to GenBank (Table 2). The sequences were checked using the Standard Nucleotide Basic Local Alignment Search Tool (BLASTn) (5) at NCBI (https://blast.ncbi.nlm.nih.gov/) and Barcode of Life Data Systems (BOLD) (Ratnasingham and Hebert, 2007) (https://www.boldsystems.org/). To assess the phylogenetic status of the snails identified, additional sequences of land snails from NCBI were incorporated into our dataset (Supplementary Table S4). Alignments were obtained with MAFFT 7 online version (Katoh et al., 2002). The best-fit evolutionary model was determined GTR+I+G model using MrModeltest V.2.3 (Nylander, 2004) according to Akaike’s Information Criterion (Akaike, 1974).
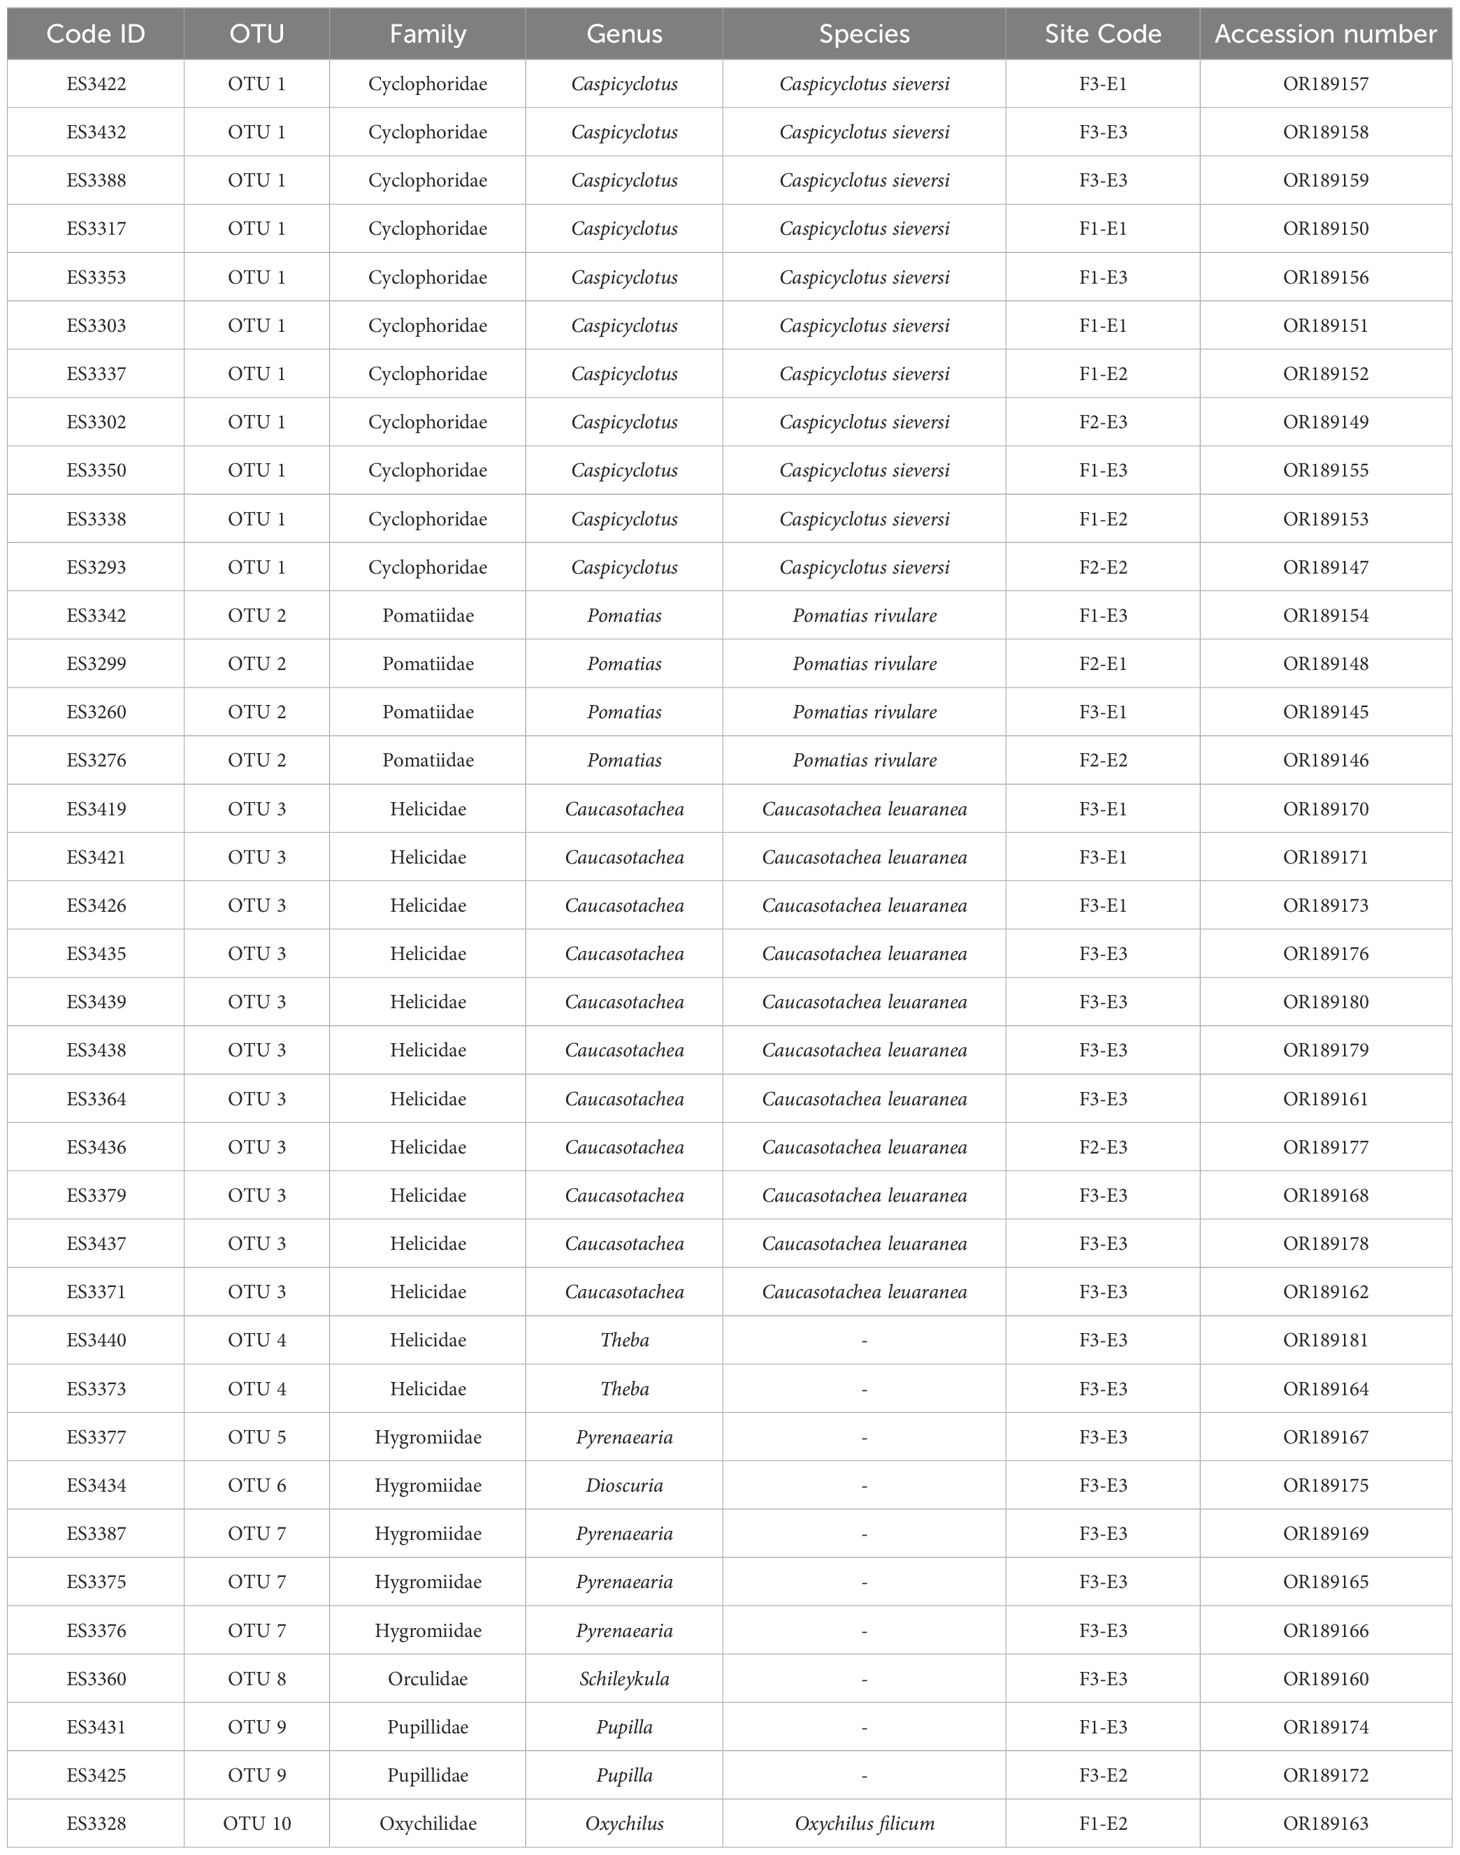
Table 2 List of land snails identified in this study area, Code ID, OTUs, Site code, and GenBank accession number.
Phylogenetic trees were constructed using both Bayesian Inference (BI) and maximum likelihood (ML) methods. Enchytraeidae sp. was considered as outgroup. MrBayes was accomplished with MrBayes version 3.2. (Ronquist et al., 2012) under two independent runs (four chains for each run) for 5×10⁶ generations and sampling trees every 100 generations. Finally, 10% of the trees were cast off as burn-in. Tracer V.1.7 (Rambaut et al., 2018) was used to assess the efficiency of runs. The Maximum Likelihood (ML) analysis was conducted with RAxML v.8.2.X (Stamatakis, 2016) under the GTR + I + G model employing 1,000 bootstrap pseudoreplicates to assess the confidence of branches. Uncorrected genetic distances (p - distances) among species were calculated by MEGA11 (Tamura et al., 2021).
Species-delimitation
To identify hypothetical candidate species, two widely-used statistical methods of species delimitation were used: automatic barcode gap discovery (ABGD) (Puillandre et al., 2012) and Bayesian implementation of the Poisson tree processes (bPTP) (Zhang et al., 2013). ABGD analysis is a clustering method based on the pairwise distance between species sequences. It was performed on ABGD Web Server (https://bioinfo.mnhn.fr/abi/public/abgd/abgdweb.html) using Kimura (K80) distance with the default Ts/Tv ratio (2.0) and the following conditions: range of prior intraspecific divergence from 0.01(Pmin) to 0.1 (Pmax) with 20 steps in between, X (relative gap width): 0.05 and Nbin: 10 (Mason et al., 2020). bPTP is a tree-based method that requires a non-ultrametric phylogenetic tree as input. Analysis was carried out on the bPTP web server [Species delimitation server (h-its.org)] using a rooted RAxML tree for 500,000 MCMC generations, with 0.1 of samples conservatively discarded as burn-in (Mason et al., 2020).
Statistical analyses
The statistical analysis for the research was done using R version 4.0.3. (R Core Team, 2020) Two-way analysis of variance (two-way ANOVA) was performed to evaluate the differences in total snail density, total OTUs, and Shannon-Wiener diversity index, which are biodiversity metrics, across different elevations (three levels) in each forest. Two-sided Tukey HSD tests were conducted after the ANOVA. The “aov” function was used to carry out the statistical analyses. The assumptions of homogeneity of variances, tested with Levene’s test (p > 0.05), and normality of residuals, tested with Shapiro-Wilk test (p > 0.05), were checked using the R package version 1.2-7 in R (Fox et al., 2007).
To assess dissimilarities in the snail communities at various elevations within each forest (β-diversity), the betapart package (Baselga et al., 2018) was used, utilizing the Jaccard dissimilarity index. β-diversity was used to measure changes in species composition among samples across an area (Graham and Fine, 2008). This approach offers a theoretical framework for partitioning total dissimilarity into nestedness (species gains or losses) and turnover components (species replacement) (Baselga, 2010). Biodiversity metrics were calculated to assess the snail communities using various measures. The Shannon-Wiener diversity index (H) was calculated using the vegan package (v. 1.17-8). Additionally, the R package Picante (Kembel et al., 2010) was utilized to calculate phylogenetic diversity (PD) and mean pairwise distance (MPD) between pairs of communities. To examine the spatial compositional differences in snail compositions, permutational multivariate analysis of variance (PERMANOVA) was employed. Permutations of residuals (n=9999) were performed under the reduced model, following the same factorial design as the univariate analysis. The Sorensen dissimilarity matrices were used for the analysis. In cases where significant differences were found, the SIMPER routine was applied to determine the proportional contribution of each species and main group to the observed pairwise dissimilarity in composition. The SIMPER results included species with a cumulative dissimilarity cut-off of 70% (Clarke, 1993). Both the PERMANOVA and SIMPER analyses were conducted using the vegan package.
Additionally, Canonical Correspondence Analysis (CCA) was employed as a multivariate statistical approach to investigate the relationship between species and environmental variables. The analysis utilized a dataset containing OTUs present in each forest, and six soil variables were selected as explanatory factors. Before conducting the analysis, the environmental data underwent initial screening using the Principal Component Analysis (PCA) methodology. The entire variation in the environmental data was explained by the initial six principal components (PCs). Prominent variables were identified by considering the highest absolute loading values within each PC. Subsequently, two parameters were chosen for further analysis after the screening process in each forest.
Results
Detection of land snail biodiversity
Our research involved examining 679 land snail specimens, we extracted COI sequences from 37 individuals. The length of the complete COI fragment varied between 617 and 649 bp. The majority of snail sequences demonstrated a minimum of 80% identity during all BLAST searches. Based on the interpretation of the BLAST results the sequences were classified into six families (Pomatiidae, Helicidae, Hygromiidae, Pupillidae, Orculidae, and Oxychilida) and eight genera (Pomatias, Caucasotachea, Pyrenaearia, Theba, Dioscuria, Pupilla, Schileykula, and Oxychilus). However, due to the lack of a comprehensive DNA reference library in GenBank (NCBI and BOLD database), approximately 16 sequences could only be classified at the genus level. Among these, three species were identified: Pomatias rivulare, Oxychilus filicum, and Caucasotachea leucoranea.
Sequences belonging to OTU 1 were not matched with any sequences in the NCBI and BOLD datasets, marking the first barcoding study on this species (Table 2). Identified based on shell features, this OTU was recognized as Caspicyclotus sieversi. The p-distance between OTUs ranged from 0.09 to 0.33. The criterion for categorizing sequences into OTUs was a genetic distance of more than eight percent among sequences (Table 3).

Table 3 Uncorrected genetic distances (p - distances) between land snail OTUs based on COI gene.
Species delimitation with bPTP resulted in 10 putative species for the dataset and most of them were supported with high values (> 80%). The ABGD analysis yielded 7-17 hypothetical OTUs using about 0.1–0.01 maximum intraspecific divergence (Supplementary Figure S1). Furthermore, the phylogenetic tree revealed similar terminals (Figure 2). In total, 10 OTUs were recognized in this study. Based on both morphological and barcoding approaches, these OTUs are categorized into seven families Cyclophoridae, Pomatiidae, Helicidae, Hygromiidae, Pupillidae, Orculidae, and Oxychilidae.
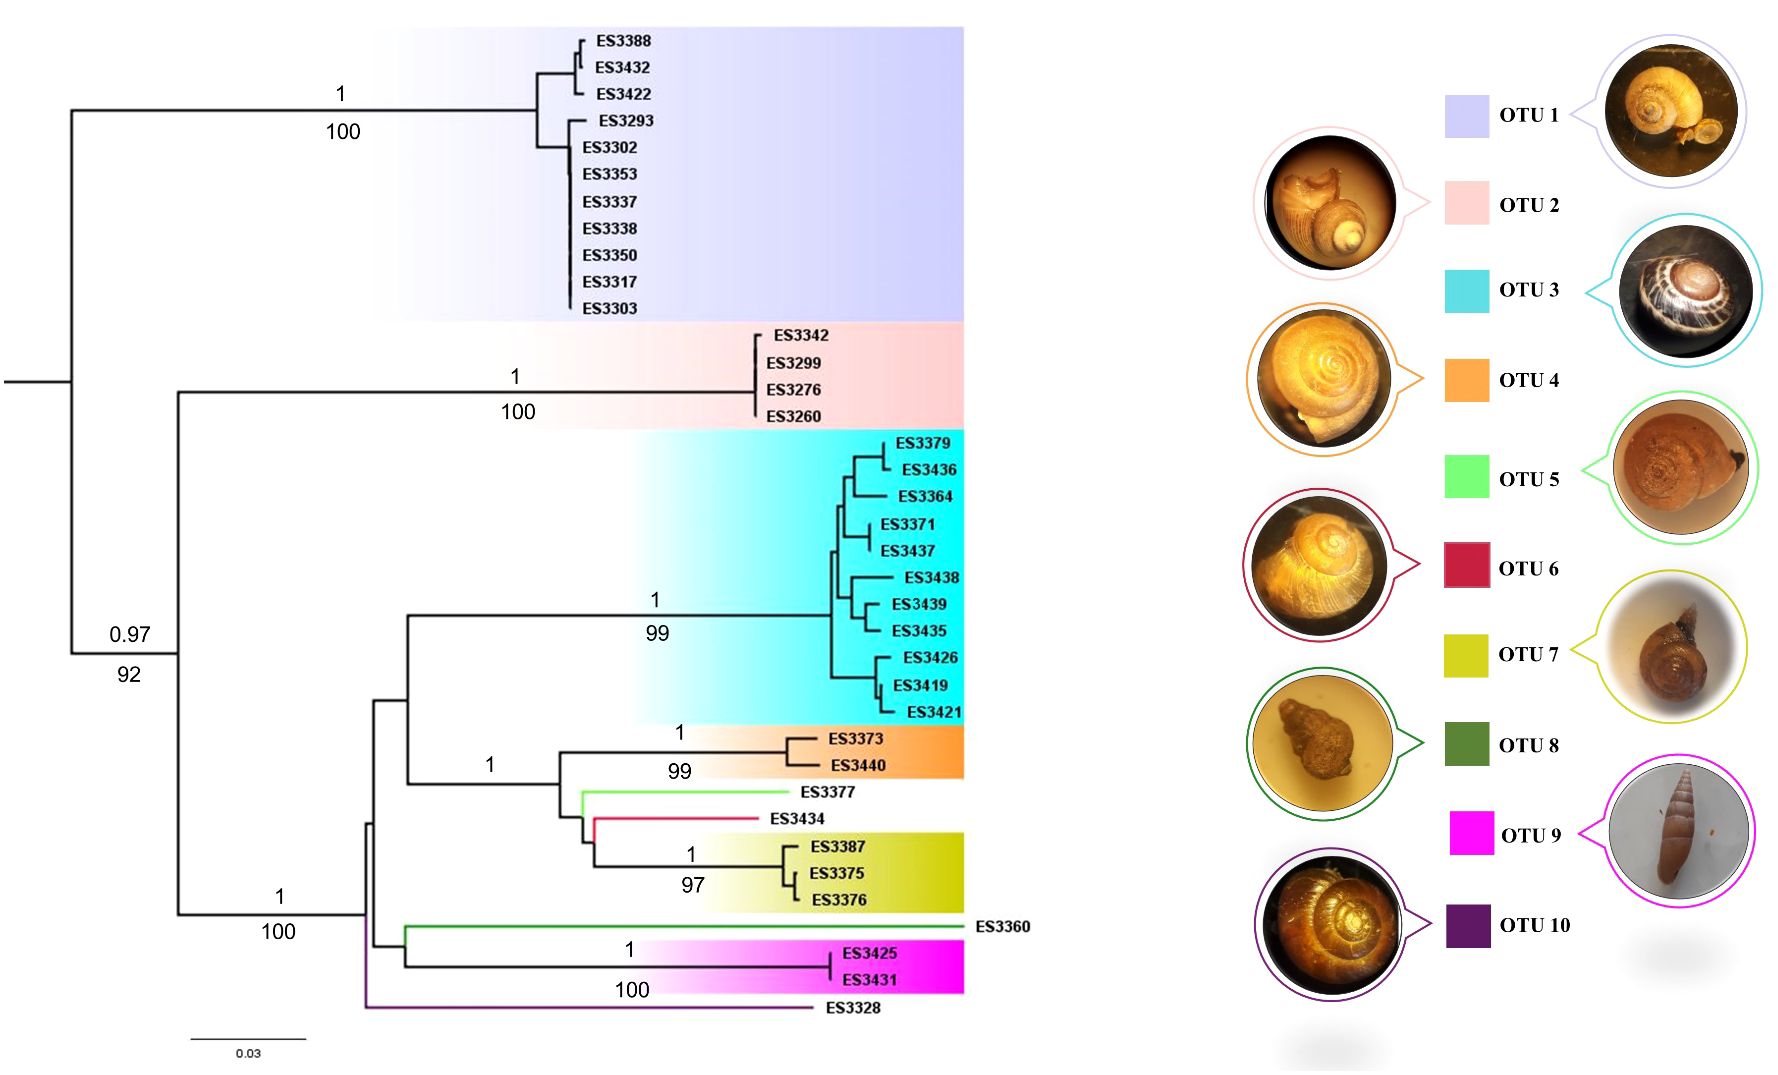
Figure 2 The phylogenetic tree of Hyrcanian land snails using the COI gene. BI and Ml trees show the same tree topology, therefore only the ML tree is illustrated. The number at the branches are posterior probabilities for the Bayesian (above) and bootstrap supports for ML (below). Only values greater than 0.9 and 90 are shown.
Comparison of land snail abundance and OTUs diversity
It has been observed that there is a considerable difference in the abundance of land snails among the three forests. The data shows that Forest 3 has a notably higher snail abundance compared to Forest 1 and Forest 2. Furthermore, when comparing all sites, the highest elevation in Forest 3 (F3-E1) exhibits the highest abundance. The bar chart (Figure 3) displays a bit of a decline in snail abundance from Forest 1 to Forest 2, followed by a substantial increase in Forest 3. Additionally, comparing the snail abundance across three elevations in each forest revealed that the highest elevations in all forests have more snails than the lowlands. As illustrated in Figure 4, there is a decrease in the number of OTUs with increasing elevation across all forests. Forest 3, at its lowest elevation (F3-E3), displays the highest number of OTUs. Conversely, the minimum number of OTUs was observed in the highest elevations of Forest 1 and Forest 2 (F1-E1 and F2-E1).
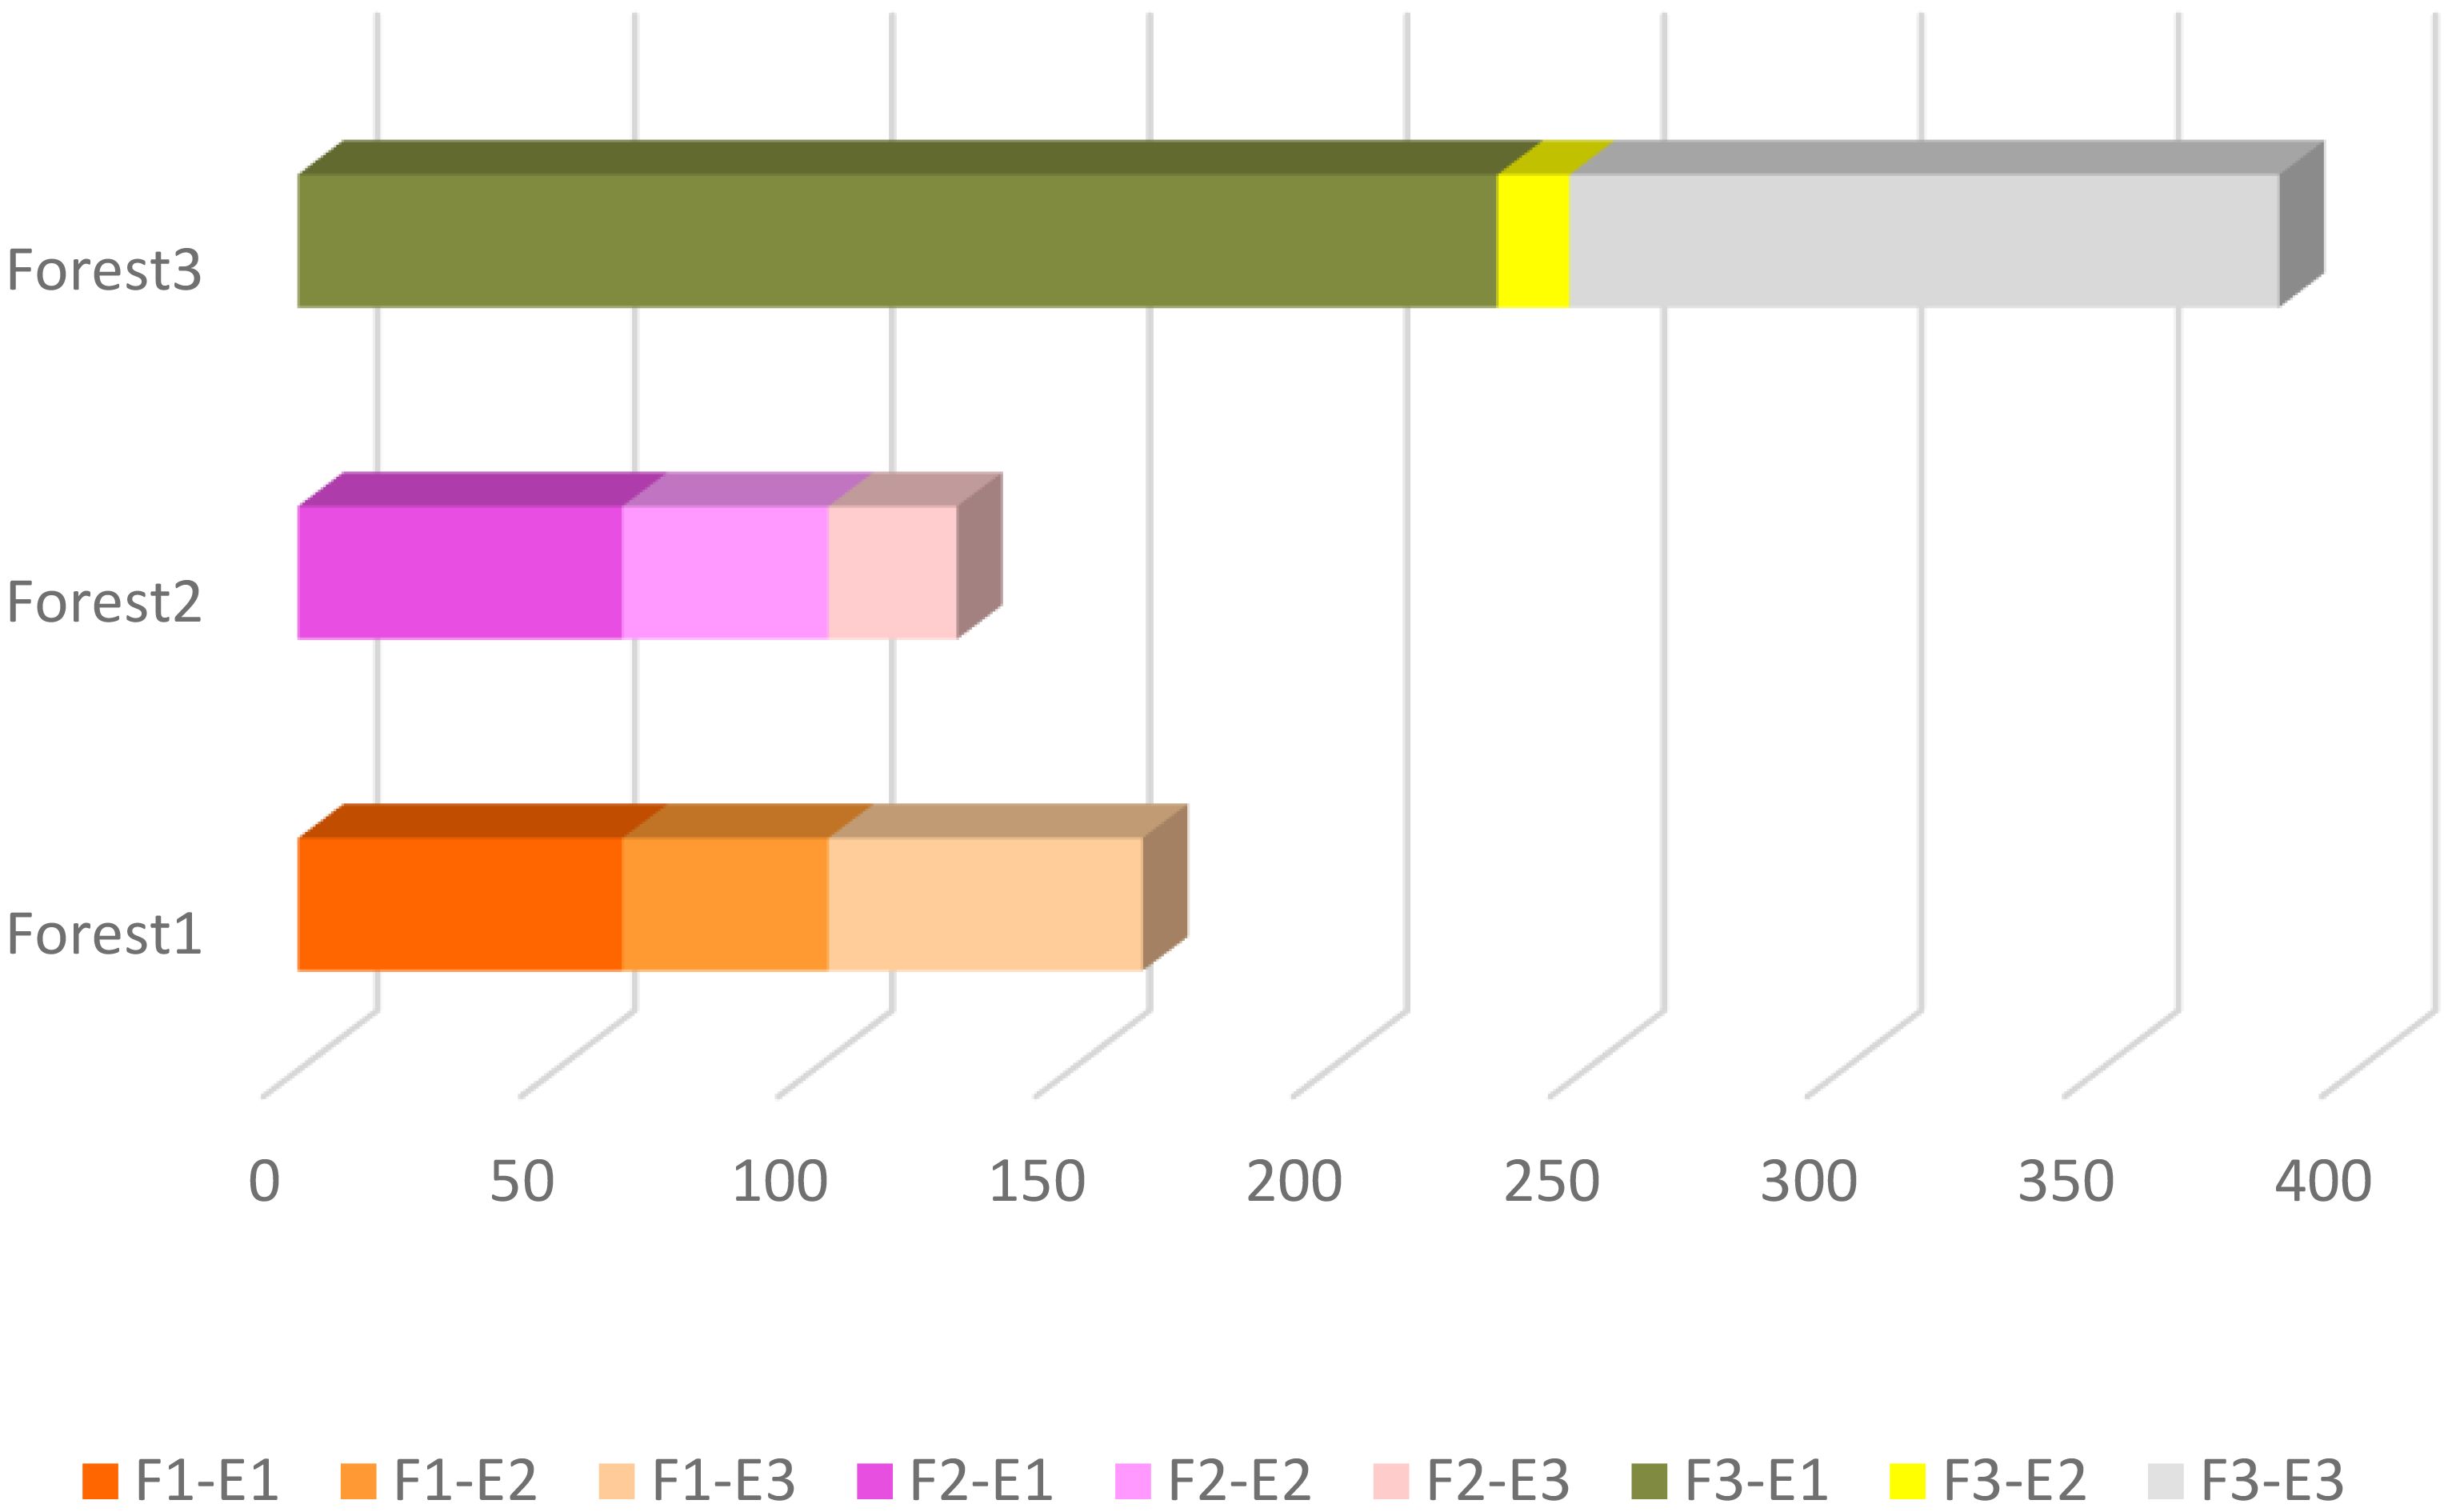
Figure 3 Land snails abundance within each site and between forests.
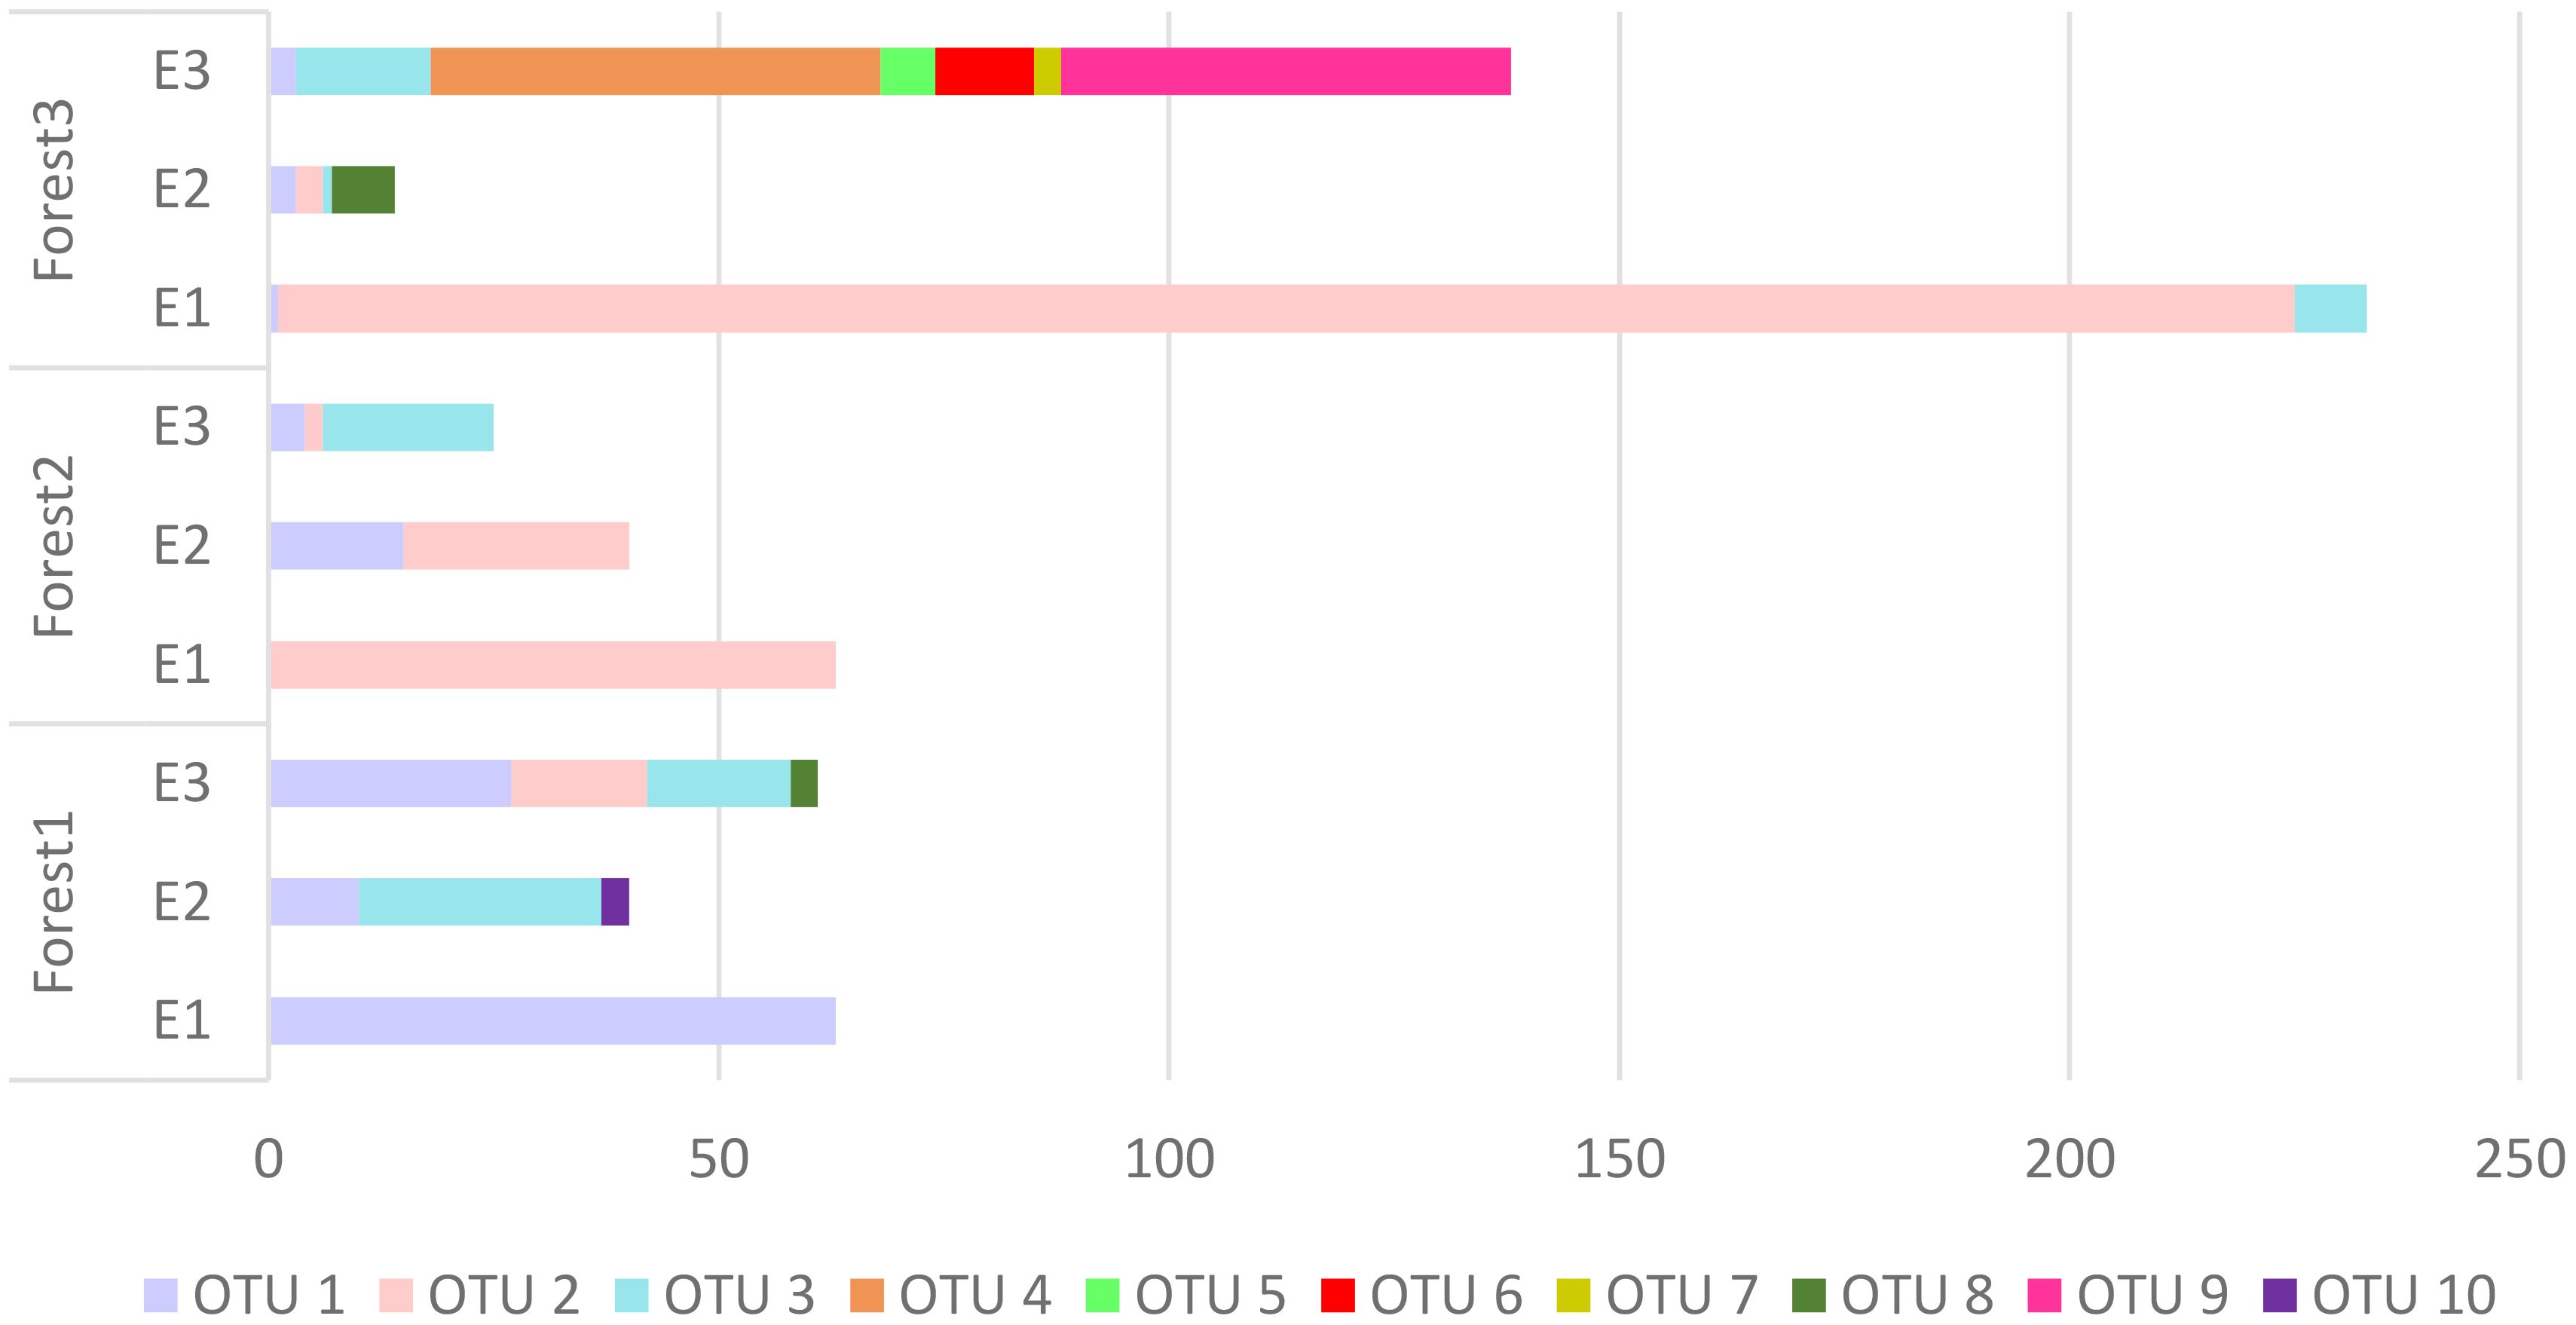
Figure 4 The number of OTUs and their abundance within each forest.
The ANOVA results highlight a significant impact of elevations, forests, and their interaction on the land snail community in the study area. (Table 4).
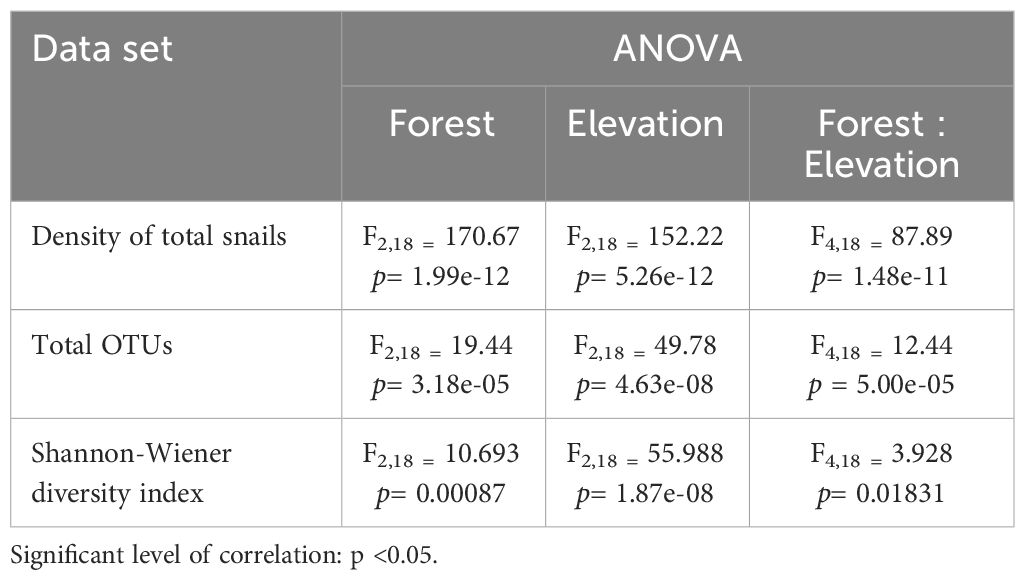
Table 4 Summary of statistical analysis of ANOVA including density of total snails, total of OTUs, and Shannon-Wiener diversity index.
Based on the total OTUs and also Shannon-Wiener diversity index, T-test analysis showed that there was a significant difference between high elevation (E1) and lowland (E3) in Forest 2. Additionally, the highest elevation in Forest 1 exhibited significant differences when compared to the mid and low elevations within this forest (E2 and E3). Furthermore, the density of OTUs in the lower elevation of Forest 3 (E3) differed significantly from both the high elevation (E1) and mid-elevation (E2) in this forest, also Forest 3 was different from the other two locations in the density of OTUs. In addition, the results indicate a significant difference between highlands and lowlands in Forest 2 and Forest 3 (See Supplementary Table S1).
Investigation of β-diversity partitioning figured out that the spatial turnover portion occurred between three elevations in Forest 3. However, Forest 2 and Forest 1 had different results, and nestedness was also detected. Generally, the β-diversity index was between 0.5 to 0.8 in all datasets (Table 5). All forests showed an increase in PD values as elevation increased. Conversely, the MPD values remained relatively consistent across the three elevations within each forest. The result of the Shannon-Wiener diversity index is shown in Table S2. Forest 3 exhibited the highest level of the Shannon-Wiener index (1.097), indicating greater biodiversity. In contrast, Forest 2 recorded the lowest value of this index (1.087), suggesting comparatively lower diversity in this forest.
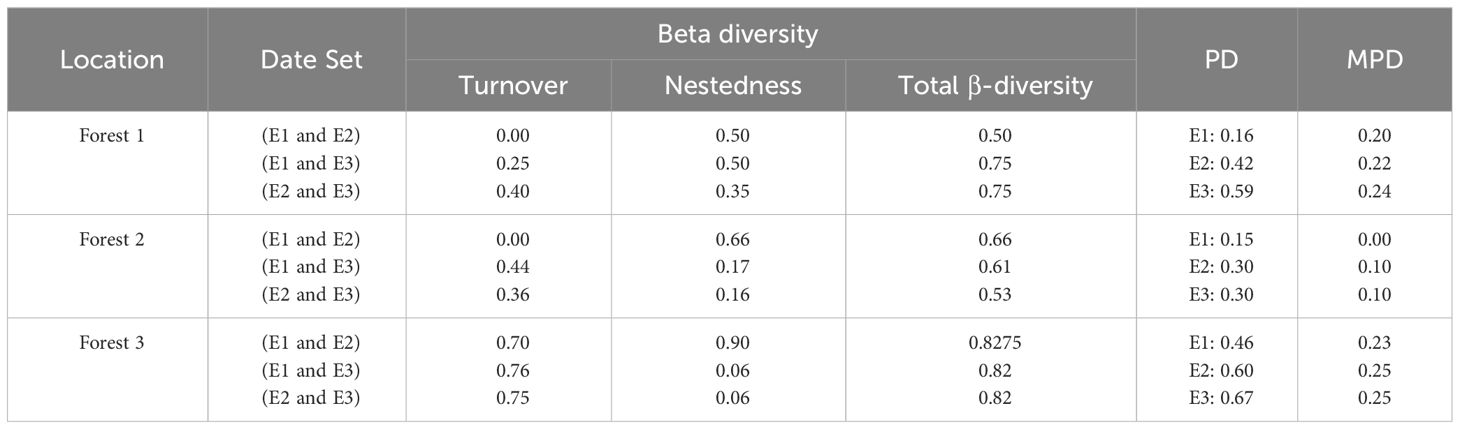
Table 5 β-diversity, phylogenetic diversity (PD), mean pairwise distance (MPD) for each forest and every elevation.
Assemblage composition
The PERMANOVA indicated significant effects of elevation levels (F2,18 = 3.8246, p= 0.004), forests (F2,18 = 7.5693, p= 0.001), and their interactions (F4,18 = 6.0400, p= 0.001) on the OTUs composition OTUs. SIMPER analysis indicated that three OTUs including OTU 1, OTU 2, and OTU 3 were the most responsible groups for the observed significant difference between all of the comparisons (elevation levels and forests). The list of OTUs that have differences between elevations and forests is shown in Table 6.
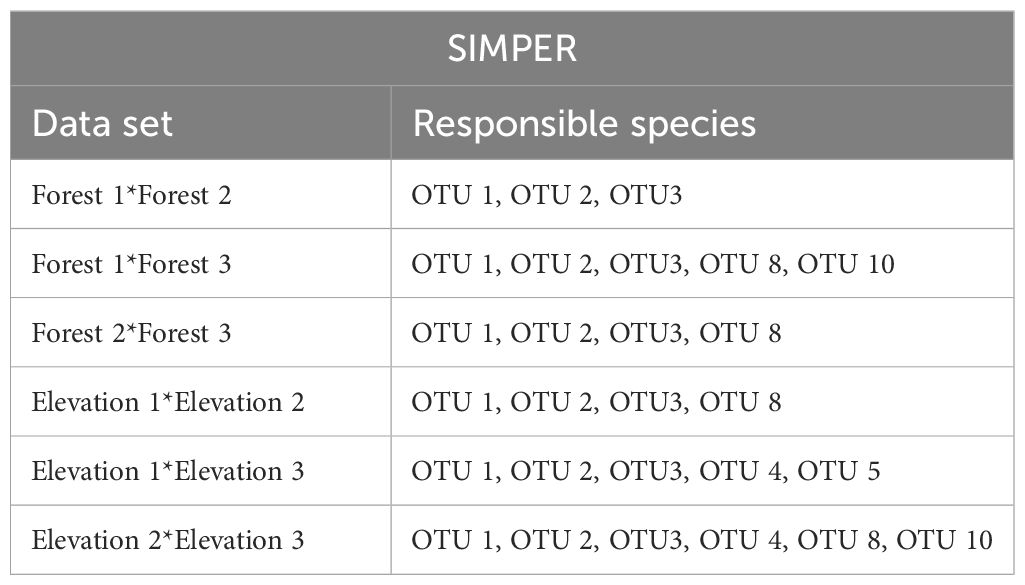
Table 6 Output from SIMPER analysis of the difference in OTUs composition between three forests and three elevations.
Relationship between snail communities and environmental variables
The measurement of soil parameters (pH, Ca, Mg, Ca++, Mg++. and %saturation moisture) are shown in Supplementary Table S3. The range of pH values were varied from 6.1 (F1-E1) to 7.7 (F3-E1). According to our results, Forest 2 had the highest Ca content (44 mg) observed in E3, and Forest 1 at E2 had the lowest amount (16 mg). The Ca++ content (6.09%) was found in F2-E1 and the minimum amount (0.79%) was recorded in F3-E2. Forest 1 exhibited the highest Mg content (44 meq/lit) at E1, whereas F3-E1 had the lowest amount (4 meq/lit). The highest Mg++ content (2.21%) was observed in F3-E1, and the lowest amount (0.49%) was recorded in F2-E3. The highest content of %saturation moisture (=95) was recorded in F3-E3 and the lowest amount (=51.9) was observed in F3-E1.
To determine the environmental factors responsible for shaping the composition of snail communities in each forest, CCA was conducted using OTUs data and the selected environmental parameters after PCA analysis. According to PCA analysis, %saturation moisture and Ca in Forest 1, %saturation moisture and Mg in Forest 2, and in Forest 3, Ca and Mg have more contribution to each forest. In Forest 1, the selected variables explained 88% of the total variation in OTUs composition. In Forest 1, selected variables explain a total of 0.88 bits of inertia, which is about 62.5%, leaving about 37.5% unexplained. In Forest 2, there is a total inertia of 0.53, and X variables explain a total of 0.42 bits of inertia, which is about 80%, leaving about 20% unexplained. In Forest 3, a total inertia of 1.51 and X variables explain about 69%, leaving about 31% unexplained (Figure 5).
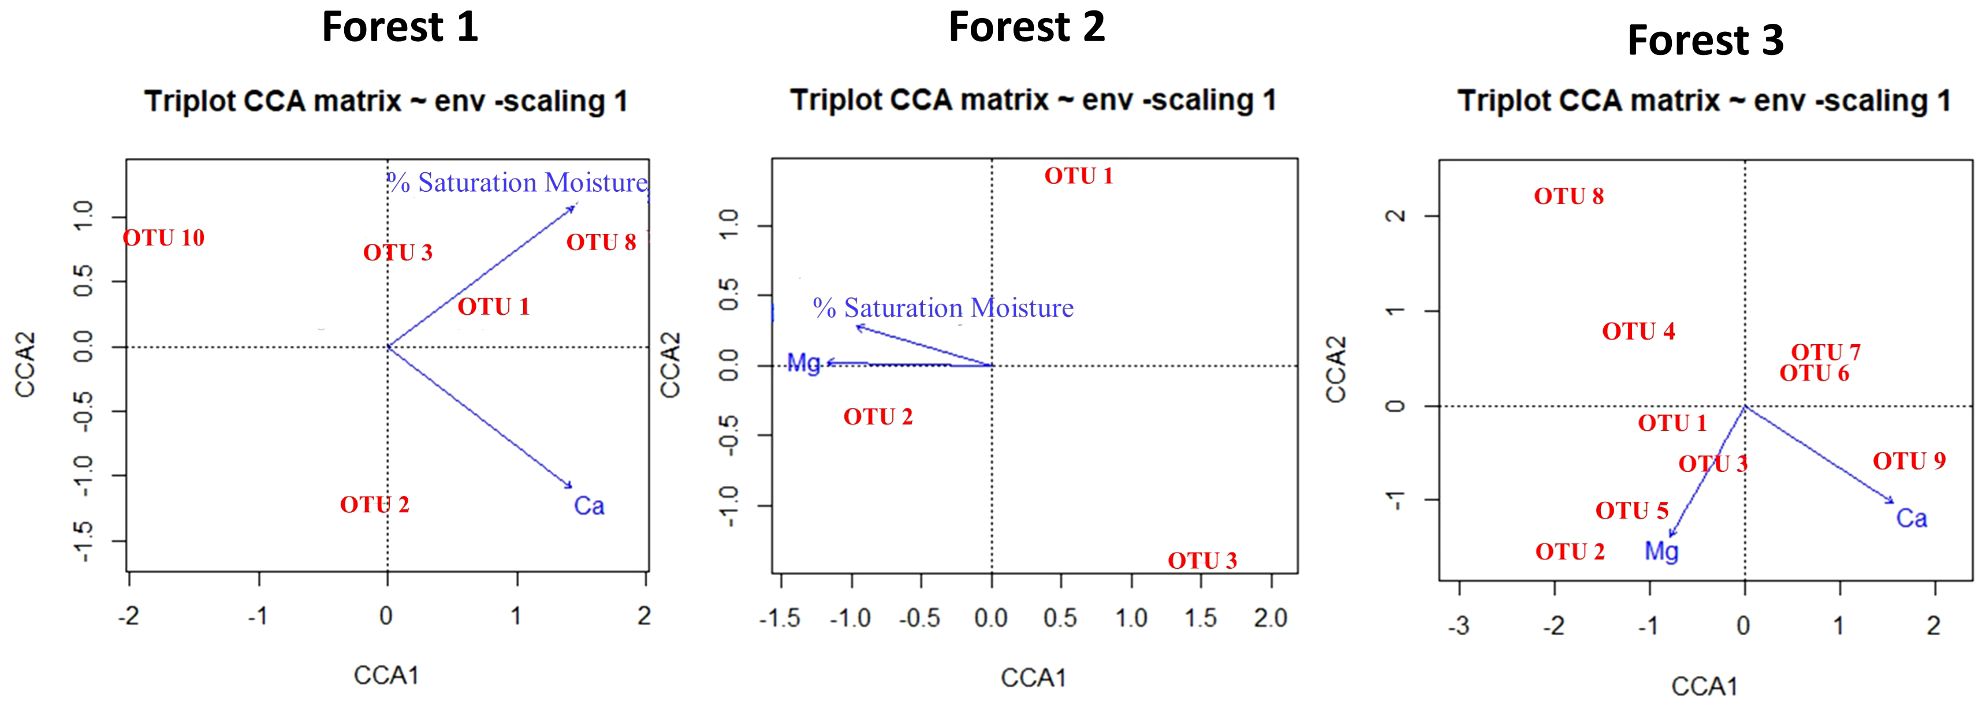
Figure 5 The CCA ordination plot illustrates the connection between environmental parameters and the structure of the land snails community in Forest 1, Forest 2, and Forest 3.
Discussion
This study is the first genetic investigation on terrestrial snail diversity in the Hyrcanian forest (in the northern part of Iran), which lead to the identification of 10 OTUs in the area based on COI marker. Furthermore, land snails abundance and OTUs diversity were compared in an elevational incline and the results showed that elevation affected snail communities. In addition, the survey on soil physicochemical parameters displayed a correlation between some soil features and land snails’ presence.
Estimation of land snails’ biodiversity
Initially, the creation of a standard list of species serves as a practical metric for assessing biodiversity and ecosystem quality, an essential component of natural resources management (Sivu and Pradeep, 2017).
For a comprehensive phylogenetic context, matching sequences from GenBank database were then integrated into our analysis. The resulting BI phylogenetic tree, presented in Supplementary Figure S2, provides a clear depiction of the relationships among the identified OTUs and their relationship to known species. It is noteworthy that certain OTUs were classified at the genus level. In cases where sequences closely resembling their species were not available in the NCBI and BOLD datasets, these OTUs were positioned in distinct clades but close to each other. Conversely, other OTUs classified at the genus level were found to share a clade with the additional sequences from NCBI.
Based on the findings on morphology, species delimitation, genetic distances, and the phylogenetic tree, a total of 10 OTUs of 16 morphospecies were recognized in the study area. Notably, certain samples within OTU 1, OTU 2, and OTU 3 exhibited variations in shell color and pattern, resulting in misidentifications based on morphology, though genetic analyses revealed their belonging to the same OTUs. This underscores the utility of molecular methods in preventing the misclassification of phenotype plasticity as a distinct species. Four OTUs including OTU 1, OTU 2, OTU 3, and OTU 10 refer to Caspicylotus sieversi, Pomatias rivulare, Caucasotachea leuaranea, and Oxychilus filicum, respectively which reported in the previous studies from the region (Issel, 1865; Forcart, 1935; Starmuhlner and Edlauer, 1957; Yassini, 1976; Eliazian et al., 1979; Mansoorian, 2005; Ahmadi, 2012). It is worth noting that the remaining six OTUs which referred to five genera named Pyrenaearia, Theba, Dioscuria, Pupilla, and Shileykula are the first documented occurrences of these genera in the Hyrcanian forest of Iran.
The comparison between morphological and genetic results highlights the efficacy of the molecular method in estimating land snail biodiversity and accurately defining a significant portion of OTUs through the DNA barcoding strategy. Previous studies have revealed discrepancies in estimating OTU numbers based on molecular evidence compared to pre-identifications using the morphological approach (Song et al., 2018; De Vivo et al., 2023).
Employing species delimitation methods, specifically the ABGD (distance-based) and bPTP (tree-based) approaches, identified 7-17 and 10 putative species, respectively. It is noteworthy that the ABGD method is considered less accurate than bPTP due to its disregard for evolutionary relationships and variation in threshold values across taxonomic groups (Havermans et al., 2011; Kapli et al., 2017).
Although land snails exhibit substantial mitochondrial diversity and are among the most diverse animals, there have been limited barcoding studies conducted on them, with the majority of investigations focusing on marine gastropods (Meyer and Paulay, 2005; Kelly et al., 2007; Campbell et al., 2008). Consequently, there is a lack of comprehensive genetic data available in the GenBank dataset for barcoding studies and the COI marker dataset alone cannot currently serve as a practical method for identifying land snail species. However, it can serve as a reliable tool for assessing their biodiversity (Davison et al., 2009; Ranasinghe et al., 2022). Molecular approaches provide a powerful tool for exploring diversity and investigating ecology and conservation science in biodiversity hotspots, particularly when recognition is challenging due to morphological differences in larval and juvenile stages and cryptic diversity. These approaches provide an opportunity to delimit species boundaries and discover novel diversity (Bhaskar and Sharon, 2022; Nielsen et al., 2023). Additionally, DNA sequences can help classify taxa when morphology is conflicting or of a doubtful interpretation, potentially accelerating the discovery of systematic relationships (Allwood et al., 2021).
Statistical analysis
The ANOVA analysis revealed significant differences in the total density of land snails among different elevations within each forest. In addition, evaluating the abundance in three elevations at each forest indicates the abundance of snails in the highest elevation is more than in the lowlands (Figure 6A). A possible explanation for this difference is precipitation patterns and humidity levels in this area. Highlands in Hyrcanian forests are more humid, and also precipitation increases at higher elevations (Talebi et al., 2014). In line with our findings, Tattersfield et al. (2006) found out land snail abundance increases in high-elevation sets. In addition, De Chavez and De Lara (2010) observed a positive relationship between land snail abundance and elevation in the Mount Makiling rainforest in the Philippines. However, in some cases has been obtained different results. Tattersfield et al. (2001) expressed that land snail abundance in forest habitats in mountain Kenya decreases with enhancing elevation and also Liew et al. (2010) concluded that there is no relationship between land snail abundance and elevation. It appears that the range of elevations studied and the type of ecosystem can influence the observed results.
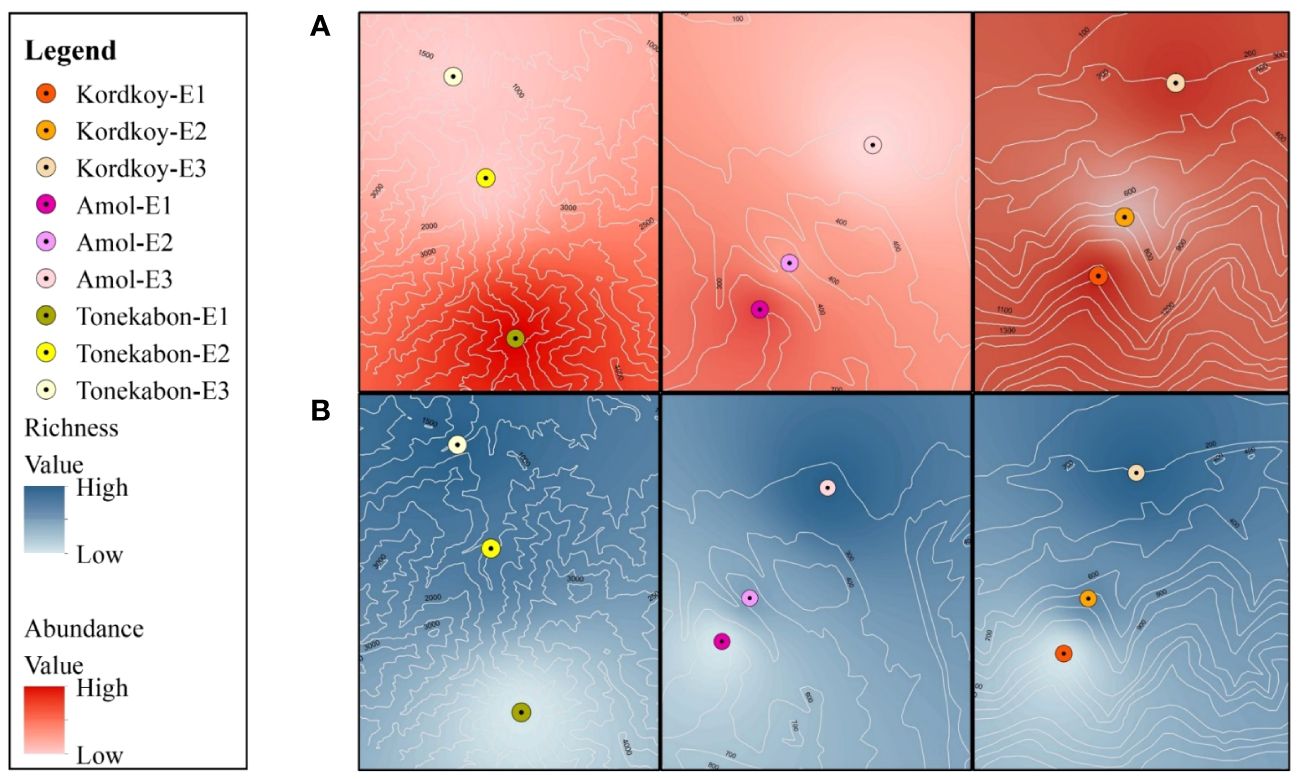
Figure 6 Comparison of land snails abundance (A) and OTUs richness (B) within each site.
The number of OTUs in each forest gradually increases from high elevation to low elevation (Figure 6B). Additionally, the ANOVA revealed a significant distinction in Shannon-Wiener diversity and total diversity of OTUs between three elevations across all forests. Similarly, the PD analyses confirm this pattern, showing an inverse relationship between PD values and increasing elevation. This result may be related to snails’ dispersal ability. Various species of land snails exhibit significant disparities in their migratory abilities and the extent to which they expand their distribution areas. While some species can migrate to higher elevations, others lack this capability (Kramarenko, 2014; Dahirel et al., 2021). Additionally, this trend of declining diversity in highlands aligns with the common trend observed in the majority of organisms across different environments (Gaston, 2000). As elevation affects many climatic variations including temperature and precipitation it can play an important role in habitat suitability. Precipitation enhancement, the longer period of cold temperatures besides less productivity in highlands cause a decrease in the amount of available energy in these areas. Thus the species-energy relationship (the relationship between energy availability and species richness) may clarify this pattern between species richness and elevation. Receiving a specified content of energy can preserve a specified number of species which means higher elevations shelter fewer species than lowlands (Gaston, 2000; Whittaker et al., 2001; Willis and Whittaker, 2002; Aubry et al., 2005). The lower diversity in higher elevations implies that the species inhabiting these areas face fewer competitors. Consequently, more resources are available for them, leading to increased abundance and the establishment of dominant species in these high-elevation regions (Dani et al., 2023).
Several investigations reported an increase in land snails species richness and species density in an elevation slope; Tattersfield et al. (2001) achieved the same result for forest habitats in Kenya, they remarked rainfall as the most important factor for land snail communities, as well as Aubry et al. (2005) observed the same pattern in south-eastern France. Based on their research different factors such as climate altitudinal slope and also land cover heterogeneities can explain this pattern. Liew et al. (2010) reported a decline in land snail and slugs species density with elevation as a result of less nich diversity in high elevations and also historical events that lead to snail upward migration. However, Tattersfield et al. (2006) observed an increase in land snail richness and species density in elevation in Mwanihana Forest in Tanzania.
Comparing three forests altogether revealed that Forest 3 which is located in the western part of the study area was different from the two other forests with higher OTUs richness and abundance. Considering that land snails are highly dependent on humidity, the observed differences can be explained by the decreasing precipitation pattern along the southern Caspian Sea shoreline from east to west (Akhani et al., 2010). In addition, ecological dryness declined from the east toward the west of the Hyrcanian forests and the climate in the western part is more humid than the eastern part (Talebi et al., 2014).
Based on the PERMANOVA analysis there were significant differences in snail composition across various elevations and among the three forests under investigation. These findings highlight the intricate ecological patterns and distinct species assemblages within each forest ecosystem. In general, some OTUs were exclusively identified in certain forests, indicating unique ecological characteristics that allow them to thrive in specific habitats. Five OTUs, namely OTU 5 and OTU 7 representing (Hygromiidae) Pyrenaearia, OTU 4 representing (Helicidae) Theba, OTU 6 representing (Hygromiidae) Dioscuria, and OTU 9 representing (Pupillidae) Pupilla, were exclusively observed in Forest 3. Additionally, Forest 1 showed the exclusive presence of OTU 10 (Oxychilus filicum). Furthermore, three OTUs (OTU 1 (Cyclophoridae Caspicyclotus sieversi), OTU 2 (Pomatiidae Pomatias rivulare), and OTU 3 (Helicidae Caucasotachea leuaranea) were observed, across all forests. The SIMPER analysis highlighted these three OTUs are mainly responsible for observed differences among forests and elevation levels. Additionally, the β-diversity partitioning results showed that the spatial turnover component played a dominant role in driving dissimilarity within Forest 2 and Forest 3 (Table 3). This finding implies that species replacement exerts a more substantial influence on the observed variation than differences in species richness. Conversely, in Forest 1, dissimilarity was primarily attributed to nestedness, indicating that dissimilarities were influenced by disparities in species richness.
Environmental variable
The result of PCA revealed that Ca, Mg, and %saturation moisture have more contribution in shaping the distribution and diversity of snail populations. These factors exhibited positive trends with most of the OTUs (see CCA results, Figure 5). Calcium and magnesium are essential for land snails’ shell development and overall functions (Akinnusi et al., 2018). Evidence from previous studies consistently supports the notion that land snail abundance and species richness tend to be higher in areas characterized by elevated levels of calcium (Ca), magnesium (Mg), and moisture (Silvan et al., 2000; Hotopp, 2002). Snails flourish in regions with ample soil levels of these minerals, resulting in larger populations and more diverse species (51, 56). Soil moisture represents another crucial abiotic factor that significantly influences the local diversity of soil fauna (Nekola and Smith, 2000; Millar and Waite, 2002). Moisture availability plays a significant role in explaining variations in species richness and population densities of land snails observed across different sites (Martin and Sommer, 2004). Areas with higher moisture content in the soil create favorable conditions for snails, as it provides them with a suitable microhabitat (Getz and Uetz, 1994; Morecroft et al., 2002).
Conclusion
This survey represents the first barcoding study conducted on land snail species within the Hyrcanian forest, resulting in the identification of 10 OTUs across the region. Notably, this study reports the occurrence of five genera, namely Pyrenaearia, Theba, Dioscuria, Pupilla, and Schileykula, for the first time within this geographical area. Furthermore, the examination of land snail communities along a gradient of elevation revealed significant alternation in their abundance, richness, and community composition. Soil physicochemical parameters analyses revealed that Ca, Mg, and %saturation moisture impact snail distribution. This foundational study offers new insights into the snail community within the Hyrcanian forest, providing valuable data that can be utilized for future research in this globally significant world heritage site and similar habitats elsewhere. Further barcoding studies in different parts of the region are recommended for future studies to uncover additional species as well as consider other environmental factors such as climatic variables can contribute to a better understanding of land snail communities along elevational slopes. These efforts will play a significant role in offering valuable insights into the conservation of snail biodiversity and the preservation of their habitats.
Data availability statement
The original contributions presented in the study are included in the article/Supplementary Files, further inquiries can be directed to the corresponding author/s.
Ethics statement
Ethical approval was not required for the study involving animals in accordance with the local legislation and institutional requirements because Ethical approval was not required for this study because this research solely pertained to ecological and taxonomic investigations of land snail communities within the natural environment. As such, it falls outside the scope of research that necessitates ethical approval as it does not raise ethical concerns related to human or animal welfare, informed consent, or privacy.
Author contributions
SM: Writing – original draft. FA: Writing – review & editing.
Funding
The author(s) declare that no financial support was received for the research, authorship, and/or publication of this article.
Acknowledgments
We wish to express our gratitude to everyone who contributed to the completion of this article. Special thanks go to Reihaneh Saberi-Pirooz for her invaluable assistance in data analysis and the preparation of the paper. Her expertise and dedication significantly enhanced the quality of our research. Furthermore, we would like to express our profound appreciation to Khashayar Allahbedashti for his unwavering support and significant contributions during the sampling phase of this study.
Conflict of interest
The authors declare that the research was conducted in the absence of any commercial or financial relationships that could be construed as a potential conflict of interest.
Publisher’s note
All claims expressed in this article are solely those of the authors and do not necessarily represent those of their affiliated organizations, or those of the publisher, the editors and the reviewers. Any product that may be evaluated in this article, or claim that may be made by its manufacturer, is not guaranteed or endorsed by the publisher.
Supplementary material
The Supplementary Material for this article can be found online at: https://www.frontiersin.org/articles/10.3389/fevo.2024.1329581/full#supplementary-material
References
Achuba F. I. (2008). African land snail Achatina marginatus, as bioindicator of environmental pollution. North-West J. Zoo 4, 1–5.
Ahmadi E. (2012). Identification of snails in citrus orchards in Mazandaran province, Iran. J. Field Crop Entomol. 2, 57–64.
Ahmadzadeh F., Shahrokhi G., Saberi-Pirooz R., Oladi M., Taati M., Poyarkov N. A., et al. (2020). Alborz Heritage: geographic distribution and genetic differentiation of the Iranian Paradactylodon (Amphibia: Hynobiidae). Amphibia-Reptilia 41, 519–534. doi: 10.1163/15685381-bja10022
Akaike H. (1974). A new look at the statistical model identification. IEEE Trans. automatic control 19, 716–723. doi: 10.1109/TAC.1974.1100705
Akhani H., Djamali M., Ghorbanalizadeh A., Ramezani E. (2010). Plant biodiversity of Hyrcanian relict forests, N Iran: an overview of the flora, vegetation, palaeoecology, and conservation. Pakistan J. Bot. 42, 231–258. doi: 42:231-258
Akinnusi F. A. O., Oni O. O., Ademolu K. O. (2018). Mineral composition of giant African land snail’s (Archachatina marginata) shells from six south West States, Nigeria. Nigerian J. Anim. Sci. 20, 485–489.
Allwood J. S., Meredith E., Lindquist C., Breen M. (2021). Application of an established canine genotyping method to a sequence-based approach. Forensic Sci. International: Anim. Environments 1, 100029. doi: 10.1016/j.fsiae.2021.100029
Amiri N., Vaissi S., Aghamir F., Saberi-Pirooz R., Rödder D., Ebrahimi E., et al. (2021). Tracking climate change in the spatial distribution pattern and the phylogeographic structure of Hyrcanian wood frog, Rana pseudodalmatina (Anura: Ranidae). J. Zoological Systematics Evolutionary Res. 59, 1604–1619. doi: 10.1111/jzs.12503
Arnaud J. F., Madec L., Guiller A., Deunff J. (2003). Population genetic structure in a human-disturbed environment: a case study in the land snail Helix aspersa (Gastropoda: Pulmonata). Heredity 90, 451–458. doi: 10.1038/sj.hdy.6800256
Astrin J. J., Stuben P. E. (2008). Phylogeny in cryptic weevils: molecules, morphology and new genera of western Palaearctic CryptorhynChinae (Coleoptera: Curculionidae). Invertebrate systematics 22, 503–522. doi: 10.1071/IS07057
Aubry S., Magnin F., Bonnet V., Preece R. C. (2005). Multi-scale altitudinal patterns in species richness of land snail communities in south-eastern France. J. Biogeogr. 32, 985–998. doi: 10.1111/j.1365-2699.2005.01275.x
Baselga A. (2010). Partitioning the turnover and nestedness components of beta diversity. Global Ecol. biogeogr. 19, 134–143. doi: 10.1111/j.1466-8238.2009.00490.x
Baselga A., Orme D., Villeger S., De Bortoli J., Leprieur F., Baselga M. A. (2018). Package ‘betapart’. Partitioning beta diversity into turnover and nestedness components, version, 1(0).
Baur B., Baur A. (1992). Effect of courtship and repeated copulation on egg production in the simultaneously hermaphroditic land snail Arianta arbustorum. Invertebrate Reprod. Dev. 21, 201–206. doi: 10.1080/07924259.1992.9672239
Bhaskar R., Sharon E. A. (2022). “Molecular Genetic Approaches in Wildlife Conservation,” in Genetic Diversity-Recent Advances and Applications (Turkey: IntechOpen). doi: 10.5772/intechopen.100913
Bickford D., Lohman D. J., Sodhi N. S., Ng P. K., Meier R., Winker K., et al. (2007). Cryptic species as a window on diversity and conservation. Trends Ecol. Evol. 22, 148–155. doi: 10.1016/j.tree.2006.11.004
Brown K. M., Lydeard C. (2010). “Mollusca: gastropoda,” in Ecology and classification of North American freshwater invertebrates (Academic Press). doi: 10.1016/B978-0-12-374855-3.00010-8
Campbell D. C., Johnson P. D., Williams J. D., Rindsberg A. K., Serb J. M., Small K. K., et al. (2008). Identification of ‘extinct freshwater mussel species using DNA barcoding. Mol. Ecol. Resour. 8, 711–724. doi: 10.1111/j.1755-0998.2008.02108.x
Clarke K. R. (1993). Non-parametric multivariate analyses of changes in community structure. Aust. J. Ecol. 18, 117–143. doi: 10.1111/j.1442-9993.1993.tb00438.x
Clergeau P., Tapko N., Fontaine B. (2011). A simplified method for conducting ecological studies of land snail communities in urban landscapes. Ecol. Res. 26, 515–521. doi: 10.1007/s11284-011-0808-5
Cowie R. H., Rundell R. J. (2002). The land snails of a small tropical Pacific island, Aunu’u, American Samoa. Pacific Sci. 56, pp.143–pp.147. doi: 10.1353/psc.2002.0011
Dahirel M., Menut L., Ansart A. (2021). Increased population density depresses activity but does not influence emigration in the snail Pomatias elegans. J. Zool. 313, 172–181. doi: 10.1111/jzo.12846
Dani R. S., Divakar P. K., Baniya C. B. (2023). Diversity and composition of plants species along elevational gradient: research trends. Biodiversity Conserv. 32, 1–20. doi: 10.1007/s10531-023-02638-3
Davison A., Blackie R. L., Scothern G. P. (2009). DNA barcoding of stylommatophoran land snails: a test of existing sequences. Mol. Ecol. Resour. 9, 1092–1101. doi: 10.1111/j.1755-0998.2009.02559.x
De Chavez E. R. C., De Lara A. V. (2010). Diversity and spatial distribution patterns of macro land snails in Mount Makiling Forest Reserve, Philippines. Asian Int. J. Life Sci. 20, 183–197.
Dempsey Z. W., Goater C. P., Burg T. M. (2020). Living on the edge: comparative phylogeography and phylogenetics of Oreohelix land snails at their range edge in Western Canada. BMC evolutionary Biol. 20, 1–13. doi: 10.1186/s12862-019-1566-1
De Vivo M., Chen W. Y., Huang J. P. (2023). Testing the efficacy of different molecular tools for parasite conservation genetics: a case study using horsehair worms (Phylum: Nematomorpha). Parasitology 150, 842–851. doi: 10.1017/S0031182023000641
Dourson D., Dourson J. (2006). Land snails of the great smoky mountains (Eastern Region) (U.S.A: Appalachian Highlands Science Learning Center, Purchase Knob, Great Smokey Mountains National Park).
Dourson D. C., Langdon K. (2012). Land snails of selected rare high elevation forests and heath balds of the great smoky mountains national park. J. North Carolina Acad. Sci. 128, 27–32. doi: 10.7572/2167-5880-128.2.27
Eliazian M., Tamiji Y., Akbarzadeh M., Hagh-Nazari J. (1979). Snails from the northern parts of Iran (Caspian Area) (Iran: Archives of Razi Institute).
Ezzine I. K., Dimassi N., Pfarrer B., Said K., Neubert E. (2018). New records of the endemic Sicilian land snail species Marmorana (Murella) muralis (OF Müller 1774) from the north of Tunisia (Pulmonata, gastropoda). ZooKeys 775, 131. doi: 10.3897/zookeys.775.25740
Folmer O., Black M., Hoeh W., Lutz R., Vrijenkoek R. (1994). DNA primers for amplification of mitochondrial cytochrome c oxidase subunit I from diverse metazoan invertebrates. Mol. Mar. Biol. Biotechnol. 3, 294–299.
Forcart L. (1935). Die Mollusken der nordpersischen Provinz Masenderan und ihre tiergeographischen Bedeutung (Germany: Akademische Verlagsgesellschaft).
Fox J., Friendly G. G., Graves S., Heiberger R., Monette G., Nilsson H., et al. (2007). Suggests M: The car package (R Found. Stat. Comput).
Galan G. L., Mendez N. P., dela Cruz R. Y. (2018). DNA barcoding of three selected gastropod species using cytochrome oxidase (COI) gene. Annales West Univ. Timisoara Ser. Biol. 21, 93–102.
Getz L. L., Uetz G. W. (1994). Species diversity of terrestrial snails in the southern Appalachian mountains, USA. Malacological Rev. 27, 61–74.
Gheoca V., Benedek A. M., Schneider E. (2021). Exploring land snails’ response to habitat characteristics and their potential as bioindicators of riparian forest quality. Ecol. Indic. 132, 108289. doi: 10.1016/j.ecolind.2021.108289
Goodacre S. L. (2002). Population structure, history and gene flow in a group of closely related land snails: genetic variation in Partula from the Society Islands of the Pacific. Mol. Ecol. 11, 55–68. doi: 10.1046/j.0962-1083.2001.01422.x
Graham C. H., Fine P. V. (2008). Phylogenetic beta diversity: linking ecological and evolutionary processes across space in time. Ecol. Lett. 11, 1265–1277. doi: 10.1111/j.1461-0248.2008.01256.x
Guan Q., Wu H., Xu X., Zhang Z., Xue Z. (2023). Geographical and climate-dependent patterns in spatial distributions of snail (Mollusca: Gastropoda) assemblages in freshwater wetlands across Northeast China. Freshw. Biol. doi: 10.1111/fwb.14086
Hamzeh’ee B., Naqinezhad A., Attar F., Ghahreman A., Assadi M., Prieditis N. (2008). Phytosociological survey of remnant Alnus glutinosa ssp. barbata communities in the lowland Caspian forests of northern Iran. Phytocoenologia 38, 117–132. doi: 10.1127/0340-269X/2008/0038-0117
Havermans C., Nagy Z. T., Sonet G., De Broyer C., Martin P. (2011). DNA barcoding reveals new insights into the diversity of Antarctic species of Orchomene sensu lato (Crustacea: Amphipoda: Lysianassoidea). Deep Sea Res. Part II: Topical Stud. Oceanogr. 58, 230–241. doi: 10.1016/j.dsr2.2010.09.028
Hotopp K. P. (2002). Land snails and soil calcium in central Appalachian Mountain forest. Southeastern Nat. 1, 27–44. doi: 10.1656/1528-7092(2002)001[0027:LSASCI]2.0.CO;2
Issel A. (1865). Catalogo del molluschi raccolti della Missione Italiana in Persia. Mem. Delle realeacademia della scienze di Torino. (Italy) 2(23):305–316.
Jackson S. T., Blois J. L. (2015). Community ecology in a changing environment: Perspectives from the Quaternary. Proc. Natl. Acad. Sci. 112, 4915–4921. doi: 10.1073/pnas.1403664111
Jafarian Jeloudar Z., Jafari M., Arzani H., Kavian A., Zahedi G., Azarivand H. (2010). Vegetation community in relation to the soil characteristics of Rineh rangeland, Iran. Caspian J. Environ. Sci. 8, 141–150.
Jurickova L., Horsak M., Cameron R., Hylander K., Mikovcova A., Hlavac J. C., et al. (2008). Land snail distribution patterns within a site: the role of different calcium sources. Eur. J. Soil Biol. 44, 172–179. doi: 10.1016/j.ejsobi.2007.07.001
Kapli P., Lutteropp S., Zhang J., Kobert K., Pavlidis P., Stamatakis A., et al. (2017). Multi-rate Poisson tree processes for single-locus species delimitation under maximum likelihood and Markov chain Monte Carlo. Bioinformatics 33, 1630–1638. doi: 10.1093/bioinformatics/btx025
Katoh K., Misawa K., Kuma K., Miyata T. (2002). MAFFT: a novel method for rapid multiple sequence alignments based on fast Fourier transform. Nucleic Acids Res. 30, 3059–3066. doi: 10.1093/nar/gkf436
Kelly R. P., Sarkar I. N., Eernisse D. J., Desalle R. (2007). DNA barcoding using chitons (genus Mopalia). Mol. Ecol. Notes 7, 177–183. doi: 10.1111/j.1471-8286.2006.01641.x
Kembel S. W., Cowan P. D., Helmus M. R., Cornwell W. K., Morlon H., Ackerly D D., et al. (2010). Picante: R tools for integrating phylogenies and ecology. Bioinformatics 26, 1463–1464. doi: 10.1093/bioinformatics/btq166
Kramarenko S. (2014). Active and passive dispersal of terrestrial mollusks: a review. Ruthenica Russian Malacological J. 24, 1–14.
Leomanni A., Schettino T., Calisi A., Lionetto M. G. (2016). Mercury induced haemocyte alterations in the terrestrial snail Cantareus apertus as novel biomarker. Comp. Biochem. Physiol. Part C: Toxicol. Pharmacol. 183, 20–27. doi: 10.1016/j.cbpc.2016.01.004
Liew T. S., Schilthuizen M., Lakim M. (2010). The determinants of land snail diversity along a tropical elevational gradient: insularity, geometry, and niches. J. Biogeogr. 37, 1071–1078. doi: 10.1111/j.1365-2699.2009.02243.x
Mansoorian A. (2005). Terrestrial Molluscs of Golestan, and Mazandaran provinces, northern Iran. J. Veterinary Res. 6, 31–36.
Martin K., Sommer M. (2004). Relationships between land snail assemblage patterns and soil properties in temperate-humid forest ecosystems. J. Biogeogr. 31, 531–545. doi: 10.1046/j.1365-2699.2003.01005.x
Mason K., Feher Z., Bamberger S., Reier S., Szekeres M., Sattmann H., et al. (2020). New insights into and limitations of the molecular phylogeny in the taxon-rich land snail genus Montenegrina (Mollusca: Gastropoda: Clausiliidae). J. Zoological Systematics Evolutionary Res. 58, 662–690. doi: 10.1111/jzs.12413
Mathias A., Kisdi E., Olivieri I. (2001). Divergent evolution of dispersal in a heterogeneous landscape. Evolution 55, 246–259. doi: 10.1111/j.0014-3820.2001.tb01290.x
Meyer C. P., Paulay G. (2005). DNA barcoding: error rates based on comprehensive sampling. PloS Biol. 3, 422. doi: 10.1371/journal.pbio.0030422
Millar A. J., Waite S. (2002). The relationship between snails, soil factors and calcitic earthworm granules in a coppice woodland in Sussex. J. Conchol. 37, 483–504.
Morecroft M. D., Bealey C. E., Howells O., Rennie S., Woiwod I. P. (2002). Effects of drought on contrasting insect and plant species in the UK in the mid-1990s. Global Ecol. Biogeogr. 11, 7–22. doi: 10.1046/j.1466-822X.2002.00174.x
Mouahid G., Clerissi C., Allienne J. F., Chaparro C., Al Yafae S., Mintsa Nguema R., et al. (2018). The phylogeny of the genus Indoplanorbis (Gastropoda, Planorbidae) from Africa and the French West Indies. Zoologica Scripta 47, 558–564. doi: 10.1111/zsc.12297
Nantarat N., Sutcharit C., Tongkerd P., Wade C. M., Naggs F., Panha S. (2019). Phylogenetics and species delimitations of the operculated land snail Cyclophorus volvulus (Gastropoda: Cyclophoridae) reveal cryptic diversity and new species in Thailand. Sci. Rep. 9, 1–12. doi: 10.1038/s41598-019-43382-5
Nekola J. C., Coles B. F. (2010). Pupillid land snails of eastern North America. Am. Malacological Bull. 28, 29–57. doi: 10.4003/006.028.0221
Nekola J. C., Smith T. M. (2000). Terrestrial gastropod richness patterns in Wisconsin carbonate cliff communities. Malacologia Philadelphia 41, 253–270.
Nicolai A., Ansart A. (2017). Conservation at a slow pace: terrestrial gastropods facing fast-changing climate. Conserv. Physiol. 5, 007. doi: 10.1093/conphys/cox007
Nielsen E. S., Hanson J. O., Carvalho S. B., Beger M., Henriques R., Kershaw F., et al. (2023). Molecular ecology meets systematic conservation planning. Trends Ecol. Evol. 38, 143–155. doi: 10.1016/j.tree.2022.09.006
Nylander J. (2004). MrModeltest 2.2. Progr. Distrib. by author. (Uppsala University, Uppsala: Evolutionary Biology Centre)
Ondina P., Mato S., Hermida J., Outeiro A. (1998). Importance of soil exchangeable cations and aluminium content on land snail distribution. Appl. Soil Ecol. 9, 229–232. doi: 10.1016/S0929-1393(98)00080-8
Perez K. E., Cordeiro J. R., Coppolino M. L. (2008). “A guide for terrestrial gastropod identification,” in Proceedings of the American Malacological Society Annual Meeting, (Carbondale, U.S.A: American Malacological Society).
Pflug A., Wolters V. (2001). Influence of drought and litter age on Collembola communities. Eur. J. Soil Biol. 37, 305–308. doi: 10.1016/S1164-5563(01)01101-3
Puillandre N., Lambert A., Brouillet S., Achaz G. (2012). ABGD, Automatic Barcode Gap Discovery for primary species delimitation. Mol. Ecol. 21, 1864–1877. doi: 10.1111/j.1365-294X.2011.05239.x
Rambaut A., Drummond A. J., Xie D., Baele G., Suchard M. A. (2018). Posterior summarization in Bayesian phylogenetics using Tracer 1.7. Systematic Biol. 67, 901–904. doi: 10.1093/sysbio/syy032
Ranasinghe U. G. S. L., Eberle J., Thormann J., Bohacz C., Benjamin S. P., Ahrens D. (2022). Multiple species delimitation approaches with COI barcodes poorly fit each other and morphospecies–An integrative taxonomy case of Sri Lankan Sericini chafers (Coleoptera: Scarabaeidae). Ecol. Evol. 12, 8942. doi: 10.1002/ece3.8942
Ratnasingham S., Hebert P. D. N. (2007). BOLD: The Barcode of Life Data System Vol. 7 (Molecular Ecology Notes), 355–364. Available at: http://www.barcodinglife.org. doi: 10.1111/j.1471-8286.2007.01678.x
R Core Team (2020). A Language and Environment for Statistical Computing (Version 3.4. 0) (R Foundation for Statistical Computing).
Ronquist F., Teslenko M., van der Mark P., Ayres D. L., Darling A., Hohna S., et al. (2012). MrBayes 3.2: efficient Bayesian phylogenetic inference and model choice across a large model space. Systematic Biol. 61, 539–542. doi: 10.1093/sysbio/sys029
Rull V., Vegas Vilarrubia T., Huber O., Senaris C. (2019). Biodiversity of Pantepui: The Pristine” Lost World” of the Neotropical Guiana Highlands (Academic Press).
Saberi-Pirooz R., Rajabi Maham H., Ahmadzadeh F., Kiabi B. H., Javidkar M., Carretero M. (2021). Pleistocene climate fluctuations as the major driver of genetic diversity and distribution patterns of the Caspian green lizard, Lacerta strigata Eichwald 1831. Ecol. Evol. 11, 6927–6940. doi: 10.1002/ece3.7543
Sallam A., El-Wakeil N. (2012). “Biological and ecological studies on land snails and their control,” in Integrated Pest Management and Pest Control-Current and Future Tactics. InTech vol. 1. doi: 10.5772/29701
Sambrook J., Russell D. W. (2006). The condensed protocols from molecular cloning: a laboratory manual (U.S.A: Cold Spring Harbor Laboratory Press).
Shimizu Y., Ueshima R. (2000). Historical biogeography and interspecific mtDNA introgression in Euhadra peliomphala (the Japanese land snail). Heredity 85, 84–96. doi: 10.1046/j.1365-2540.2000.00730.x
Siadati S., Moradi H., Attar F., Etemad V., Hamzeh’ee B., Naqinezhad A. (2010). Botanical diversity of Hyrcanian forests; a case study of a transect in the Kheyrud protected lowland mountain forests in northern Iran. Phytotaxa 7, 1–18. doi: 10.11646/phytotaxa.7.1
Silvan N., Laiho R., Vasander H. (2000). Changes in mesofauna abundance in peat soils drained for forestry. For. Ecol. Manage. 133, 127–133. doi: 10.1016/S0378-1127(99)00303-5
Sivu A. R., Pradeep N. S. (2017). “Trends in Biodiversity Documentation and Assessment,” in Bioresources and Bioprocess in Biotechnology (Springer: Status and Strategies for Exploration), 167–183.
Smith U. E., Hendricks J. R. (2013). Geometric morphometric character suites as phylogenetic data: extracting phylogenetic signal from gastropod shells. Systematic Biol. 62, 366–385. doi: 10.1093/sysbio/syt002
Song C., Lin X. L., Wang Q., Wang X. H. (2018). DNA barcodes successfully delimit morphospecies in a superdiverse insect genus. Zoologica Scripta 47, 311–324. doi: 10.1111/zsc.12284
Stamatakis A. (2016). RAxML version 8.2.X: a tool for phylogenetic analysis and post-analysis of large phylogenies. Bioinformatics 30, 1312–1313. doi: 10.1093/bioinformatics/btu033
Starmuhlner F., Edlauer A. (1957). Ergebnisse der österreichischen Iran-Expedi-tion 1949/50: Beiträge zur Kenntnis der Molluskenfauna des Iran. Sitz. Ber. öst. Akad. Wiss., Math.-naturw (Germany: Klasse, Abteilung I) Vol. 1(166):445–480.
Swaileh K. M., Ezzughayyar A. (2000). Effects of dietary Cd and Cu on feeding and growth rates of the landsnail Helix engaddensis. Ecotoxicol. Environ. Saf. 47, 253–260. doi: 10.1006/eesa.2000.1961
Talebi K. S., Sajedi T., Pourhashemi M. (2014). Forests of Iran. A treasure from the past, a hope for the future (Springer).
Tamura K., Stecher G., Kumar S. (2021). MEGA11: molecular evolutionary genetics analysis version 11. Mol. Biol. Evol. 38, 3022–3027. doi: 10.1093/molbev/msab120
Tarkhnishvili D., Gavashelishvili A., Mumladze L. (2012). Palaeoclimatic models help to understand current distribution of Caucasian forest species. Biol. J. Linn. Soc. 105, 231–248. doi: 10.1111/bij.2012.105.issue-1
Tattersfield P., Seddon M. B., Ngereza C., Rowson B. (2006). Elevational variation in diversity and composition of land-snail faunas in a Tanzanian forest. Afr. J. Ecol. 44, 47–60. doi: 10.1111/j.1365-2028.2006.00612.x
Tattersfield P., Warui C. M., Seddon M. B., Kiringe J. W. (2001). Land-snail faunas of afromontane forests of Mount Kenya, Kenya: Ecology, diversity and distribution patterns. J. Biogeogr. 28, 843–861. doi: 10.1046/j.1365-2699.2001.00606.x
Teles W. S., Silva D. D. P., Vilela B., Lima-Junior D. P., Pires-Oliveira J. C., Miranda M. S. (2022). How will the distributions of native and invasive species be affected by climate change? Insights from giant South American land snails. Diversity 14, 467. doi: 10.3390/d14060467
Waugh J. (2007). DNA barcoding in animal species: progress, potential and pitfalls. Bioessays 29, 188–197. doi: 10.1002/bies.20529
Whittaker R. J., Willis K. J., Field R. (2001). Scale and species richness: towards a general, hierarchical theory of species diversity. J. Biogeogr. 28, 453–470. doi: 10.1046/j.1365-2699.2001.00563.x
Willis K. J., Whittaker R. J. (2002). Species diversity-scale matters. Science 295, 1245–1248. doi: 10.1126/science.1067335
Wronski T., Hausdorf B. (2008). Distribution patterns of land snails in Ugandan rainforest support the existence of Pleistocene forest refugia. J. Biogeogr. 35, 1759–1768. doi: 10.1111/j.1365-2699.2008.01933.x
Yassini I. (1976). Contribution to the study of some terrestrial mollusks of Mazandaran Gilan and Azerbaijan province. J. Environ. Stud. 6, 129–147.
Zeng X., Yiu W. C., Cheung K. H., Yip H. Y., Nong W., He P., et al. (2017). Distribution and current infection status of Biomphalaria straminea in Hong Kong. Parasites Vectors 10, 1–12. doi: 10.1186/s13071-017-2285-3
Zhang J., Kapli P., Pavlidis P., Stamatakis A. (2013). A general species delimitation method with applications to phylogenetic placements. Bioinformatics 29, 2869–2876. doi: 10.1093/bioinformatics/btt499
Keywords: snail community composition, elevational gradients, OTU richness, snail abundance, soil physicochemical parameters, CCA
Citation: Mohammadi S and Ahmadzadeh F (2024) Revealing hidden diversity and community dynamics of land snails through DNA barcoding: implications for conservation and ecological studies. Front. Ecol. Evol. 12:1329581. doi: 10.3389/fevo.2024.1329581
Received: 29 October 2023; Accepted: 29 March 2024;
Published: 16 April 2024.
Edited by:
Robert Guralnick, University of Florida, United StatesReviewed by:
Ismail Kudret Saglam, Koç University, TürkiyeEnrico Alejandro Ruiz, National Polytechnic Institute, Mexico
Copyright © 2024 Mohammadi and Ahmadzadeh. This is an open-access article distributed under the terms of the Creative Commons Attribution License (CC BY). The use, distribution or reproduction in other forums is permitted, provided the original author(s) and the copyright owner(s) are credited and that the original publication in this journal is cited, in accordance with accepted academic practice. No use, distribution or reproduction is permitted which does not comply with these terms.
*Correspondence: Faraham Ahmadzadeh, Rl9haG1hZHphZGVAc2J1LmFjLmly
†ORCID: Sima Mohammadi, orcid.org/0000-0002-8000-2916
Faraham Ahmadzadeh, orcid.org/0000-0001-7152-8484