 Yaobin Liu1,2
 Nan Huang
 Chenghao Liu
 Shuoshuo Li
 Biagio Fernando Giannetti
- 1School of Economics and Management, Nanchang University, Nanchang, China
- 2Key Laboratory of Poyang Lake Environment and Resource Utilization, Ministry of Education, School of Resource and Environment, Nanchang University, Nanchang, China
- 3Laboratory of Production and Environment, Universidade Paulista, São Paulo, Brazil
Clarifying the driving mechanisms of spatial and temporal changes in the regulating ecosystem service value (RESV) is an important part of realizing the goal of sustainable development. Existing studies have focused on specific factors, ignoring the complex interactions between factors and their regional differences. In this regard, the spatial and temporal changes of RESV and its driving mechanisms in the different zones (core area, fringe area, and peripheral area) were explored in the Poyang Lake Area, China. The results showed that RESV spatially showed the distribution characteristics of fringe area > core area > peripheral area, while the lakes influenced the provision of regulating ecosystem services, showing that RESV per unit area was higher in the core area, and gradually declined with the increase of distance from the lakes, presenting the decreasing trend of fringe area > peripheral area. From 2000 to 2020, the study area lost 70.5988 billion CNY for RESV, in which the core area was the most affected. Further analysis of the driving mechanism of RESV in different areas found that there are regional differences in the paths of the driving factors: Population density mainly affects the core area, precipitation mainly affects the fringe area, and GDP per land mainly affects the peripheral area.
1 Introduction
Regulating ecosystem services are essential in sustaining global material flows and energy cycles. In the current climate change context, the status of regulating ecosystem services has been further elevated, due to its important role in mitigating heat waves and storing floods. Their sustainable provisioning is not only related to basic human survival and social development but is also directly related to realizing the United Nations’ sustainable development goals. However, global ecosystems have evolved significantly under the influence of frequent extreme weather events and intensified human activities. This has constrained their ability to provide a wide range of goods and services, affecting their economic value (Bongaarts, 2019). IPBES notes that there has been a decline in 14 categories of natural contributions, with a highly significant decline in regulating contributions (IPBES, 2019). In this context, it is of great significance to study in depth the spatial and temporal evolution of regulating ecosystem service value (RESV) and its drivers.
RESV evolution is often the result of a combination of factors. Among them, climatic factors, such as rainfall and temperature, have long influenced ecosystems, affecting their structure and function by altering geo-biochemical processes such as the water cycle and carbon cycle (Yun et al., 2021; Felton et al., 2024). Since the 20th century, the impacts of human activities on it have become increasingly visible (Wang et al., 2021; Li et al., 2022a). Studies often focus on anthropogenic factors such as land use, population density, and socioeconomics (Belay et al., 2022; Baidoo and Obeng, 2023; Su et al., 2023). Land is an important carrier of human activities, and land use is the most direct form of human activity that has a great impact on the ecosystem, which exacerbates environmental change and unsustainability (Morshed et al., 2022; Yuan et al., 2024). Population and environment are interdependent, and the rise in population density directly leads to the extrusion of human living space, accelerating a series of human activities such as resource extraction and environmental exploitation, which have a profound impact on the ecosystem (Fei et al., 2016). Uneven socio-economic development indirectly leads to environmental complexity (Chen et al., 2023a), for example, Sun et al. (2020) found that gross domestic product (GDP) has a profound impact on regional RESV. Some studies have comprehensively explored the impact of factors such as climate and anthropogenic on RESV (Mahmoud and Gan, 2018; Guo et al., 2022; He et al., 2022). For example, Wang et al. (2016) decomposed the impacts of natural and anthropogenic factors and found that there is a large quantitative difference between the impacts of climate change and human activities. Li et al. (2022b) applied spatial econometric modeling to calculate the spillover effects of drivers and regulating ecosystem service values. However, these studies tend to focus on the extent to which each type of factor affects RESV while ignoring the interrelationships between the drivers and how these factors drive changes in RESV. In addition, the above processes tend to focus on ecosystems such as forests, grasslands, and coastal wetlands (Helseth et al., 2022; Li et al., 2022c; Zhang et al., 2023a), with insufficient attention paid to lake areas.
Lake areas are often critical areas for global biodiversity and have an irreplaceable role in the provision of regulating ecosystem services such as climate regulation and water purification (Zhang et al., 2023b). Any change in the environmental quality of the lake areas involves a wide range of social and ecological impacts (Vincent, 2009). In recent years, the lake areas have faced ecological risks such as deteriorating water connectivity, and gas and water pollution. Regulating ecosystem services are the type of ecosystem services that are most relevant to these problems. It is of great significance to study RESV and its driving factors for the sustainable development of the lake area. At the same time, Lake landscapes are highly heterogeneous and dynamic, with intricate relationships between RESV and its drivers (Blagrave et al., 2023). The distribution of lakes may allow for regional variation in this relationship, but this is not yet clear.
To solve the above problems, this study takes the Poyang Lake Area (PLA) as an example, which has an important position in global wetland protection and ecological conservation, as well as being an internationally important wetland and a potential World Natural Heritage site with a unique hydrological environment. Based on the analysis of its RESV spatial and temporal characteristics, this study evaluates the drivers and their interactions in the different regions around the lake by using Structural Equation Modeling (SEM).
2 Material and methods
2.1 Study area
PLA is situated in Jiangxi, China, covering an area of 21 thousand km² (Figure 1). Previous studies (Liu et al., 2012) have divided the study area into three areas: the core area, the fringe area, and the peripheral area. In terms of natural conditions, the terrain of the study area is complex and varied, forming a circular tilted distribution pattern of mountain-hills-plains from the outside to the inside. The water system in the study area, with Poyang Lake as the convergence center, is intricate and complex, and there are many river runoffs. Socio-economically, PLA is the most economically advanced area and the green industry cluster in Jiangxi Province. In 1992, Ramsar Convention classified Poyang Lake as a wetland of international importance. Under the regional development and protection pattern, PLA is listed as an inland open highland linking the “Belt and Road”, playing the role of linking the Yangtze, Zhuhai, Fujian, and the central and western regions. However, under the combined influence of natural factors and human factors, PLA faces certain environmental pressures (Chen et al., 2023b).
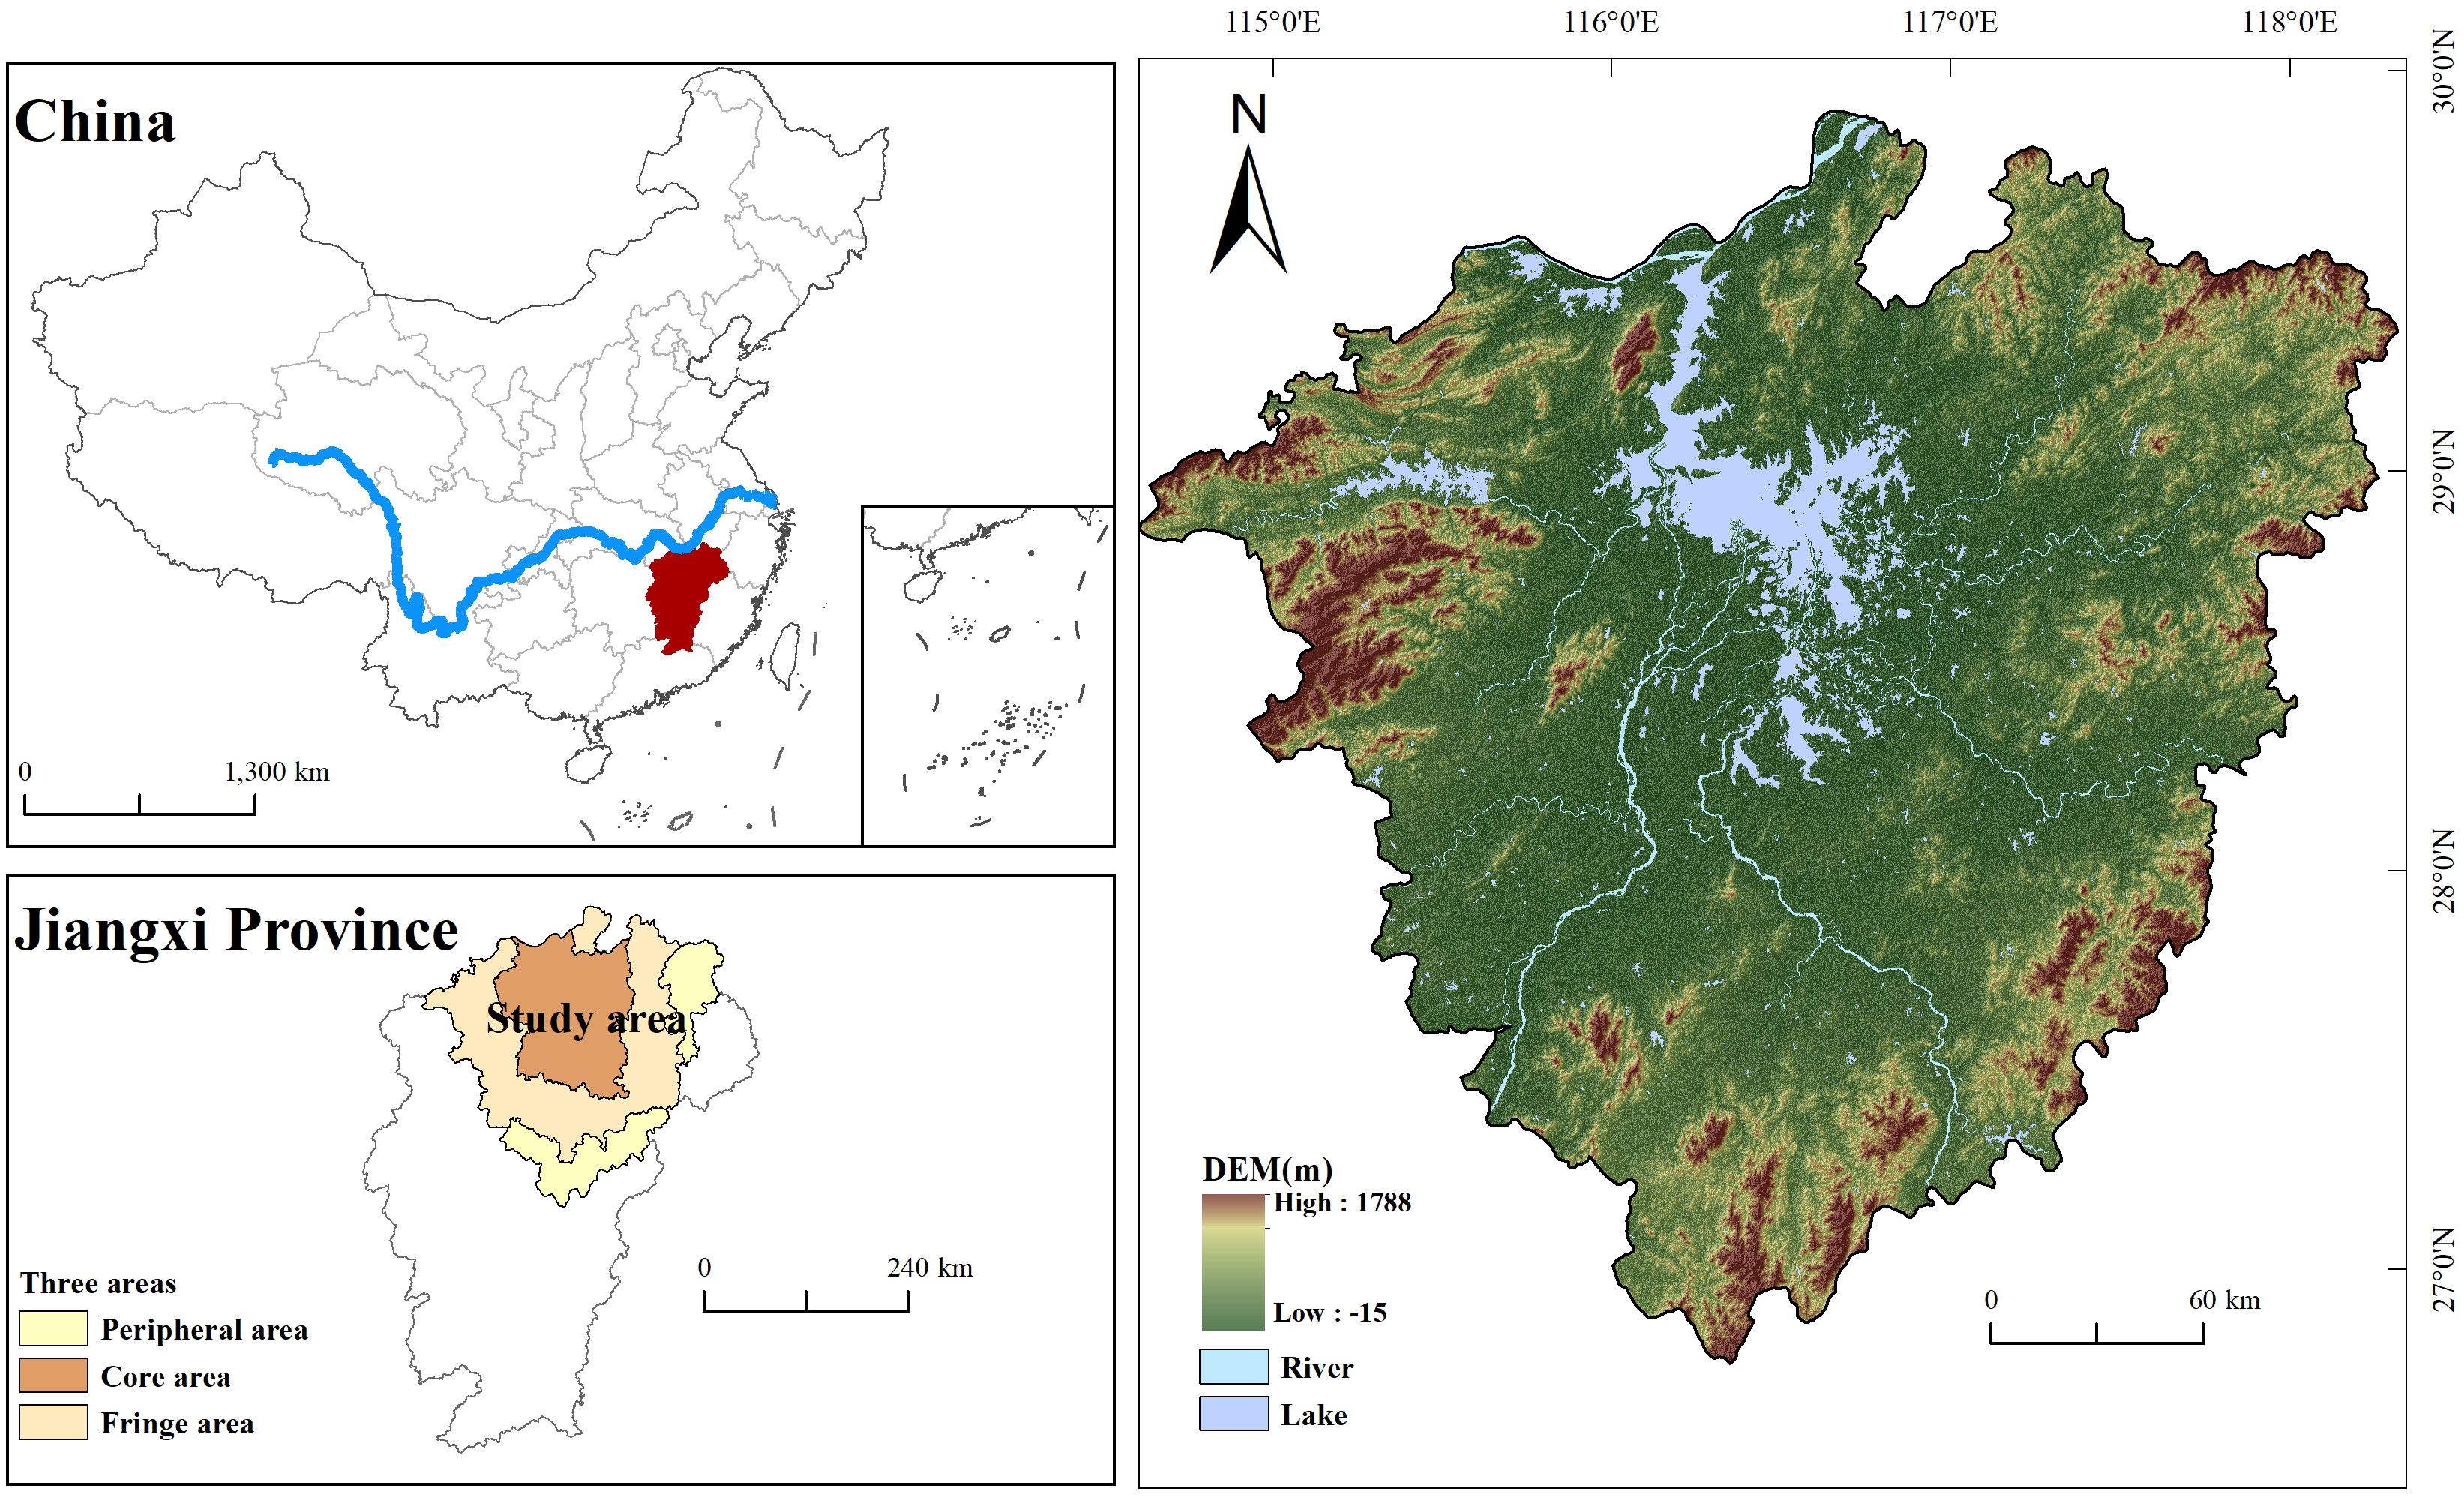
Figure 1 Location of Poyang Lake Area.
2.2 Data
The study data mainly include: ①land use and NDVI data from the Resource and Environment Science and Data Center (https://www.resdc.cn/) of the Chinese Academy of Sciences (CAS), which has a spatial resolution of 30 meters. Based on the needs of the study, the land use was merged into seven types, namely, woodland, grassland, arable land, watersheds, wetlands, construction land, and unutilized land. According to this, the land use intensity index was calculated and obtained. ②soil data, from the National Tibetan Plateau Science Data Center (http://data.tpdc.ac.cn/), based on the World Soil Database China Soil Dataset (V1.1), including silt, clay, sand, and organic carbon content, and resampled with ArcGIS 10.8. The spatial resolution is consistent with the data above. ③digital elevation data, from the U.S. American Institute for Geosciences (AIOG), with a spatial resolution of 30 m. Digital elevation data, from the ASTEM GDEM V3 dataset of NASA (https://www.nasa.gov/). The spatial resolution is consistent with the data above. ④Meteorological data, from the China Meteorological Data Website, interpolated by the ArcGIS 10.8 inverse distance weight method to obtain the meteorological raster data with a spatial resolution of 30 m. ⑤The GDP per land was obtained from the Resource and Environmental Sciences Data Centre of the Chinese Academy of Sciences (https://www.resdc.cn/DOI/DOI.aspx?DOIID=33). The population density is from the Worldpop dataset, and the land-use intensity is calculated based on the land-use type (Liu et al., 2023).
2.3 Methods
2.3.1 Estimation of RESV
The Millennium Ecosystem Assessment (MEA, 2005) subdivided regulating ecosystem services into four main types: gas conditioning, climate regulation, environmental purification, and water conditioning. Carbon sequestration and oxygen release (CSOR) are considered to be the most important forms of gas conditioning (Shi et al., 2020). Water conservation is an important ecosystem service that the Lake can provide (Yan et al., 2023). Accordingly, in this study, based on the MA classification and taking into account the actual situation of PLA, four indicators, namely, CSOR, climate regulation, water conservation, and environmental purification, were selected to account for RESV.
Z is the value of CSOR (CNY); V is the value of climate regulation (CNY); W is the value of water conservation (CNY); and T is the value of environmental purification (CNY) (Equation 1).
2.3.1.1 CSOR
CSOR is the function of natural ecosystems to absorb atmospheric CO2 to synthesize organic compounds during photosynthesis, and release O2 (Zhang et al., 2016). For each kilogram of dry substances produced by a plant, it consumes about 1.63 kg of CO2 and releases about 1.19 kg of O2 (Lin et al., 2022; Chen et al., 2024).
In the formula, Uci denotes the value produced by fixing CO2 per unit area of land use type i (CNY); Bi denotes the net primary productivity of land use type i [of which 11.64 t/hm² for the forest (Lin et al., 2022), 9.402 t/hm² for grassland (Lyu et al., 2023), 29.686 t/hm² for wetland (Li et al., 2008), 5.55 t/hm² for arable land (Zhou et al., 2013), and 0 t/hm² for all watershed construction land (Zhou et al., 2013)]; Rc denotes the carbon content of 27.27% in CO2; Pc denotes the price of carbon sequestration per unit area of 771.2 CNY/t (State Forestry Administration, 2016); Uo2i denotes the value of services (CNY) generated by O2 released per unit area of land type i; Po2 denotes the price of oxygen release per unit area (cost of industrial oxygen production 376.47 CNY/t) (State Forestry Administration, 2016); Z denotes the value of CSOR in PLA (CNY); Si is the area of land use type i (hm²) (Equations 2–4).
2.3.1.2 Climate regulation
The two most important forms of climate regulation are cooling and humidification, which are generally realized through the transpiration of plant cover and moisture evaporation from air (Liang et al., 2021). The transpiration of plant cover is mainly provided by forests and grasslands, and the evaporation of water is mainly provided by water bodies and surrounding wetlands. The alternative cost method was applied to account for the value of climate regulation.
Where V is the climate regulation value (CNY); Va is the value of plant transpiration (CNY); Vb is the value of water evaporation (CNY); Si is the area of land-use type i (hm²); Ha=81,100kj/hm² (Liang et al., 2021); β is a constant, taken as 1kWh/3,600kj (Liang et al., 2021); P is the electricity price in Jiangxi (0.62CNY/kWh); a is the air-conditioning efficiency ratio; E is the annual evaporation (mm), and λ is the power consumption of 1 m³ water evaporation, which is about 125 kWh (Li et al., 2023) (Equations 5–7).
2.3.1.3 Water conservation
Water conservation ensures the security of water supply in PLA, which is significant to the hydrological and greening of the economy of the urban agglomeration around Poyang Lake. In this study, the water yield is emulated by the InVEST model, which calculates water yield in the watershed according to the principle of water balance. The fundamental theory of the InVEST water yield calculation originates from the Budyko hydrothermal coupled equilibrium hypothesis (Li et al., 2021).
In the formula, W is the value of water conservation (CNY); C is the amount of investment in reservoir construction (CNY/m³); WR is the mean amount of water conservation over years (mm); TI is topographic index, dimensionless, calculated according to the DEM; Ksat is the saturated hydraulic conductivity of the soil (cm/d); TravTime is the time of runoff movement (min) (Wang et al., 2023a) (Equations 8, 9); Yield is the water yield (mm), which was calculated as follows:
where Yieldjx is the annual water yield (mm); x is the raster cell; j is the land use type; Px is the mean annual precipitation (mm) of raster cell x; and AETxj is the mean annual evapotranspiration (mm) of raster cell x on land use type j (Wu et al., 2023a) (Equation 10).
2.3.1.4 Environmental purification
Environmental purification is very important for the health of lake ecosystems. Environmental purification includes two forms–air cleaning and water purification. Ecosystems that are covered with high plants, such as woodlands and savannas, can degrade and absorb atmospheric pollutants such as sulfur dioxide, and at the same time have great adsorption, blocking and filtering effect on dust, thus purifying the ecological environment (Ouyang et al., 2020).
Ve is the value of air cleaning (CNY); Si is the area of land of category i (hm²); Ui is the purification capacity of environmental pollutant i (kg/hm²); Pi is the price of purifying environmental pollutant i (CNY/kg). According to China Biodiversity National Situation Research Report, the annual SO2 absorption capacity of forest land is 117.6 kg/hm²; the absorption capacity of grassland is 21.7 kg/hm²; the cost of SO2 treatment in the market is 0.6 CNY/kg; the dust stagnation in forests and paddy fields is 33.20 t/hm²; the dust stagnation in dry land is 30 t/hm²; and the cost of dust reduction is 170 CNY/t (China Biodiversity National Situation Study Report Writing Group, 1998) (Equation 11).
The following equation is used to calculate the economic value generated by water purification (Equation 12):
Vt represents the total value of water quality purification (CNY); C represents the cost of artificial treatment of sewage (CNY/t), taking the values of 1.38 (wetland, water body), 0.0467 (paddy field); H1 and H2 represent the capacity of wetland and water body to retain N and P per unit area (kg/hm²), respectively, H1 takes the values of 189.245 (wetland), 39.8 (water body), H2 takes the values of 34.066 (wetland), 18.6 (water body); T1 and T2 represent the concentration of N and P removed per unit area of wastewater treatment plant (mg/L), respectively, and the values were taken as 32 and 4; P1 and P2 represent the capacity of water field per unit area for the retention of BOD and COD (kg/hm²), and the values were taken as 17.07 (BOD) and 26.43 (COD) (Jiang et al., 2017).
The total value of environmental purification is (Equation 13):
2.3.2 Driving mechanism analysis
2.3.2.1 Driving factors
In this study, six drivers, namely mean annual temperature (MAT), mean annual precipitation (MAP), normalized difference vegetation index (NDVI), population density (PD), land use intensity (LUI), and GDP per land (GDPPL), were selected to investigate in depth their impacts on RESV as well as the combined impacts of interactions among the drivers on RESV (Table 1). Among them, precipitation and temperature are the main climate factors (Yan et al., 2022; Xu et al., 2024a), which are directly related to the hydrological cycle, soil evapotranspiration, and biological growth. Vegetation is crucial to ecosystems and is of great significance in climate regulation and water conservation (Zheng et al., 2020a; Feng et al., 2023). Population density, land use intensity, and GDP per land are the main anthropogenic factors. The GDP per land, as an economic indicator, reflects the economic intensity of human activities in a place. Population density represents the degree of agglomeration of social activities (Liang et al., 2023). Land use intensity, to a certain degree, reflects the degree of impact of human activities on natural ecosystems (Chen et al., 2023c; Pan et al., 2024). These six factors were selected to comprehensively understand the complex interactions between natural and anthropogenic factors, reveal their joint impacts on the spatial and temporal changes of regulating ecosystem services, and provide a comprehensive and in-depth understanding of sustainable development and ecological conservation.
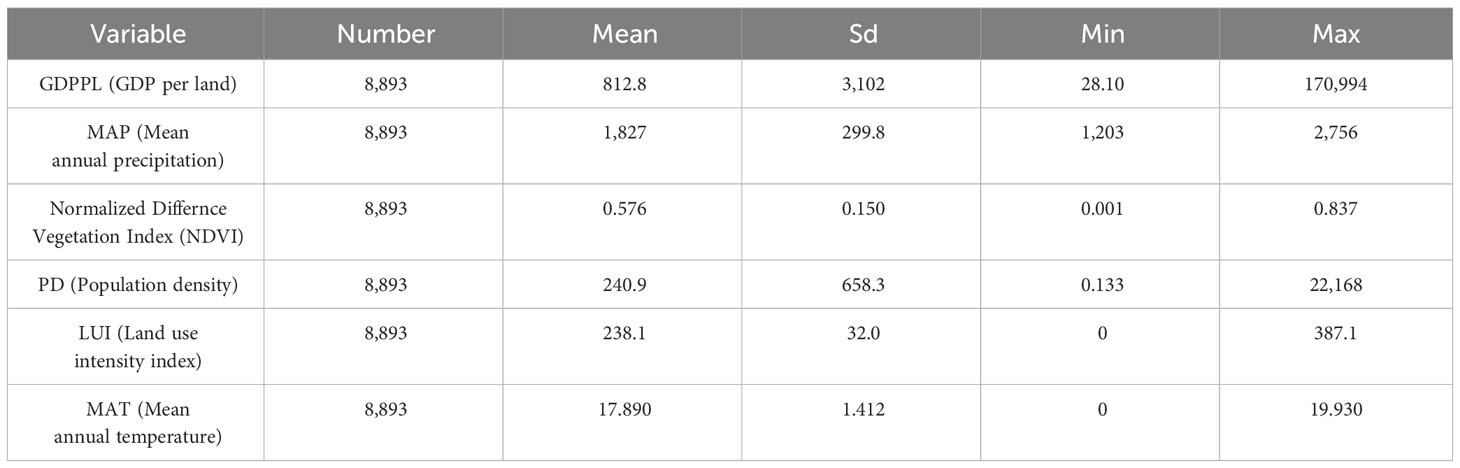
Table 1 Descriptive statistics of drivers.
2.3.2.2 Analysis of mechanisms driving changes in RESV
Structural equation modeling (SEM), based on the covariance matrix of variables, is of great significance in dealing with the causal relationships among multiple factors, and it can consider multiple dependent variables simultaneously, thus providing a solution to the problem of multiple causation and unobservable latent variables in research (Zhou et al., 2023; Thiam et al., 2024; Wang et al., 2024). Therefore, this study chose to use structural equation modeling to investigate the driving mechanisms of changes in RESV at the 5 km2 grid scale, and the interactions among the factors. Combined with the regional heterogeneity, we compare the differences in the driving mechanisms in the core, fringe, and peripheral areas. In addition, the principle of “increase and decrease” was followed to adjust the structural equation modeling. By adding correlations between variables and deleting variables with insignificant path coefficients, the model’s goodness of fit was improved.
2.3.3 Scale selection
Spatial heterogeneity in ecosystematics is one of the more important issues in ecological research (Xu et al., 2024a). Scale is the unit of measurement for spatial heterogeneity, and the degree of spatial heterogeneity is determined by the size of the scale used for measurement. To avoid some unnecessary selection errors, this study calculates the Shannon Diversity Index (SHDI) of land use around PLA by Fragstats software based on the range of 1000-5000 m, with 1000 m as the step size, respectively. By comparing the average value of SHDI, 5000 m was chosen as the grid analysis scale (Table 2). The sampling grid was generated by ArcGIS 10.2 software. The raster information was extracted batch-wise by its zonal mean statistics tool.
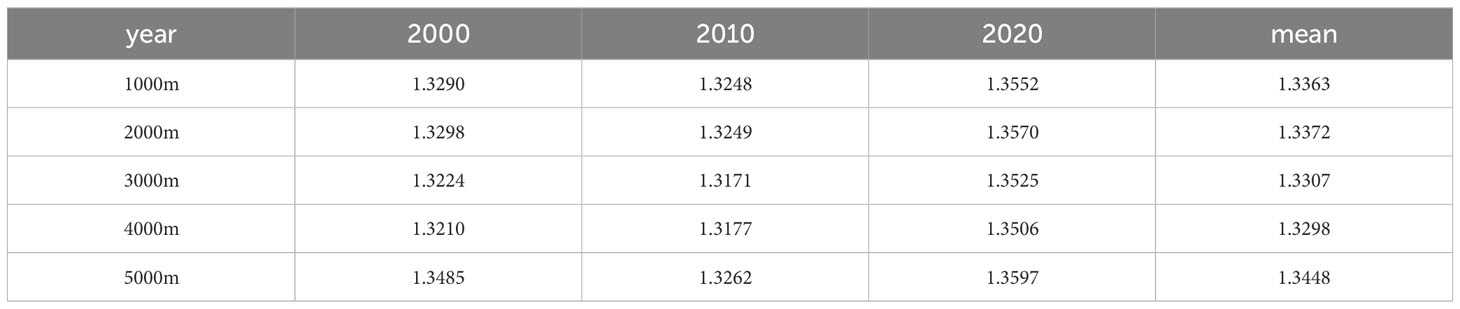
Table 2 SHDI values for 1000m-5000m, 2000-2020.
3 Results
3.1 Spatial and temporal changes of RESV
From 2000 to 2020, the RESV of PLA showed a decreasing trend. It is shown in the decline from 284.78 × 10¹⁰ CNY in 2000 to 279.94 × 10¹⁰ CNY in 2010 and continues to decline to 277.72 × 10¹⁰ CNY in 2020. RESV in the study area decreased by 705.988 × 10⁸ CNY in 20 years, but the deceleration slowed down from 1.7% in 2000-2010 to 0.8% in 2010-2020. RESV of each ecosystem was in the order of climate regulation, CSOR, environmental purification, and water conservation.
From three areas (Figure 2), the total RESV is largest in the fringe area, followed by the core area, and smallest in the peripheral area; however, the core area has the largest RESV per unit area, while the fringe area is almost the same as the peripheral area. RESV of the three major areas declined by varying degrees in the period from 2000 to 2020. Among them, the fringe area decreased by 109.305 × 10⁸CNY, and the rate of decrease accelerated from 0.1% in 2000-2010 to 0.8% in 2010-2020. The core area decreased by 558.308 × 10⁸CNY, and the rate of decrease slowed down from 4.4% to 0.9%. And the peripheral area decreased by 381.602 ×.07CNY in general. The trend of change first increased and then decreased.
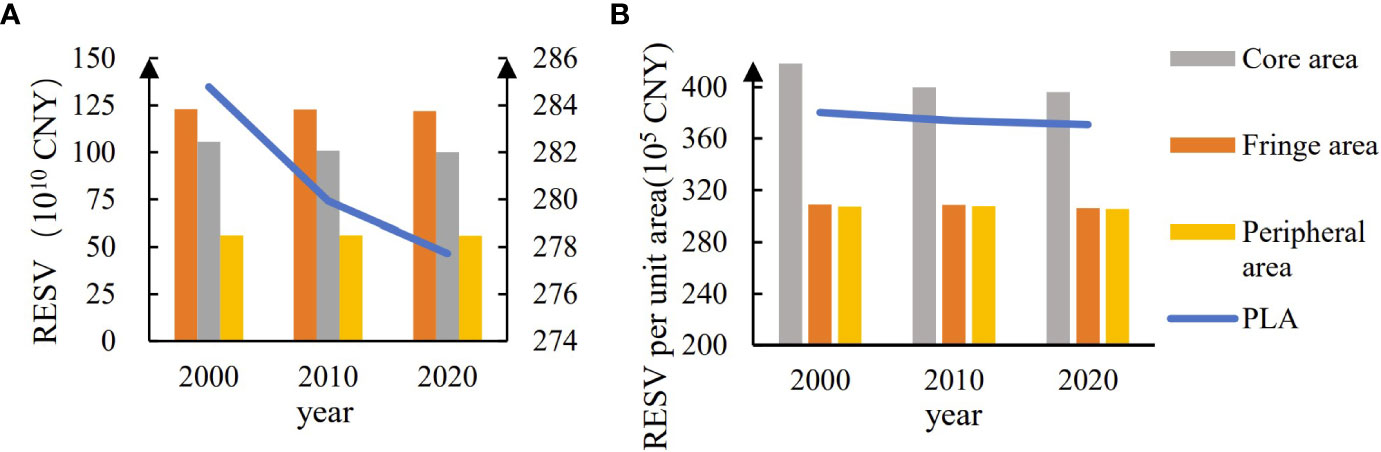
Figure 2 (A) RESV in the PLA and three areas, 2000-2020 (B) RESV per unit area in PLA and three areas, 2000-2020.
From a specific spatial perspective (Figure 3), the high RESV were mostly gathered in the center of the core area of PLA, while the low values were mostly distributed in the peripheral area. Among the various types of regulating ecosystem services, high values of CSOR are mostly distributed in the peripheral area, high values of climate regulation are mostly distributed in the core area, high values of water conservation are mostly distributed in the fringe area, and high values of environmental purification are mostly distributed in the core area.
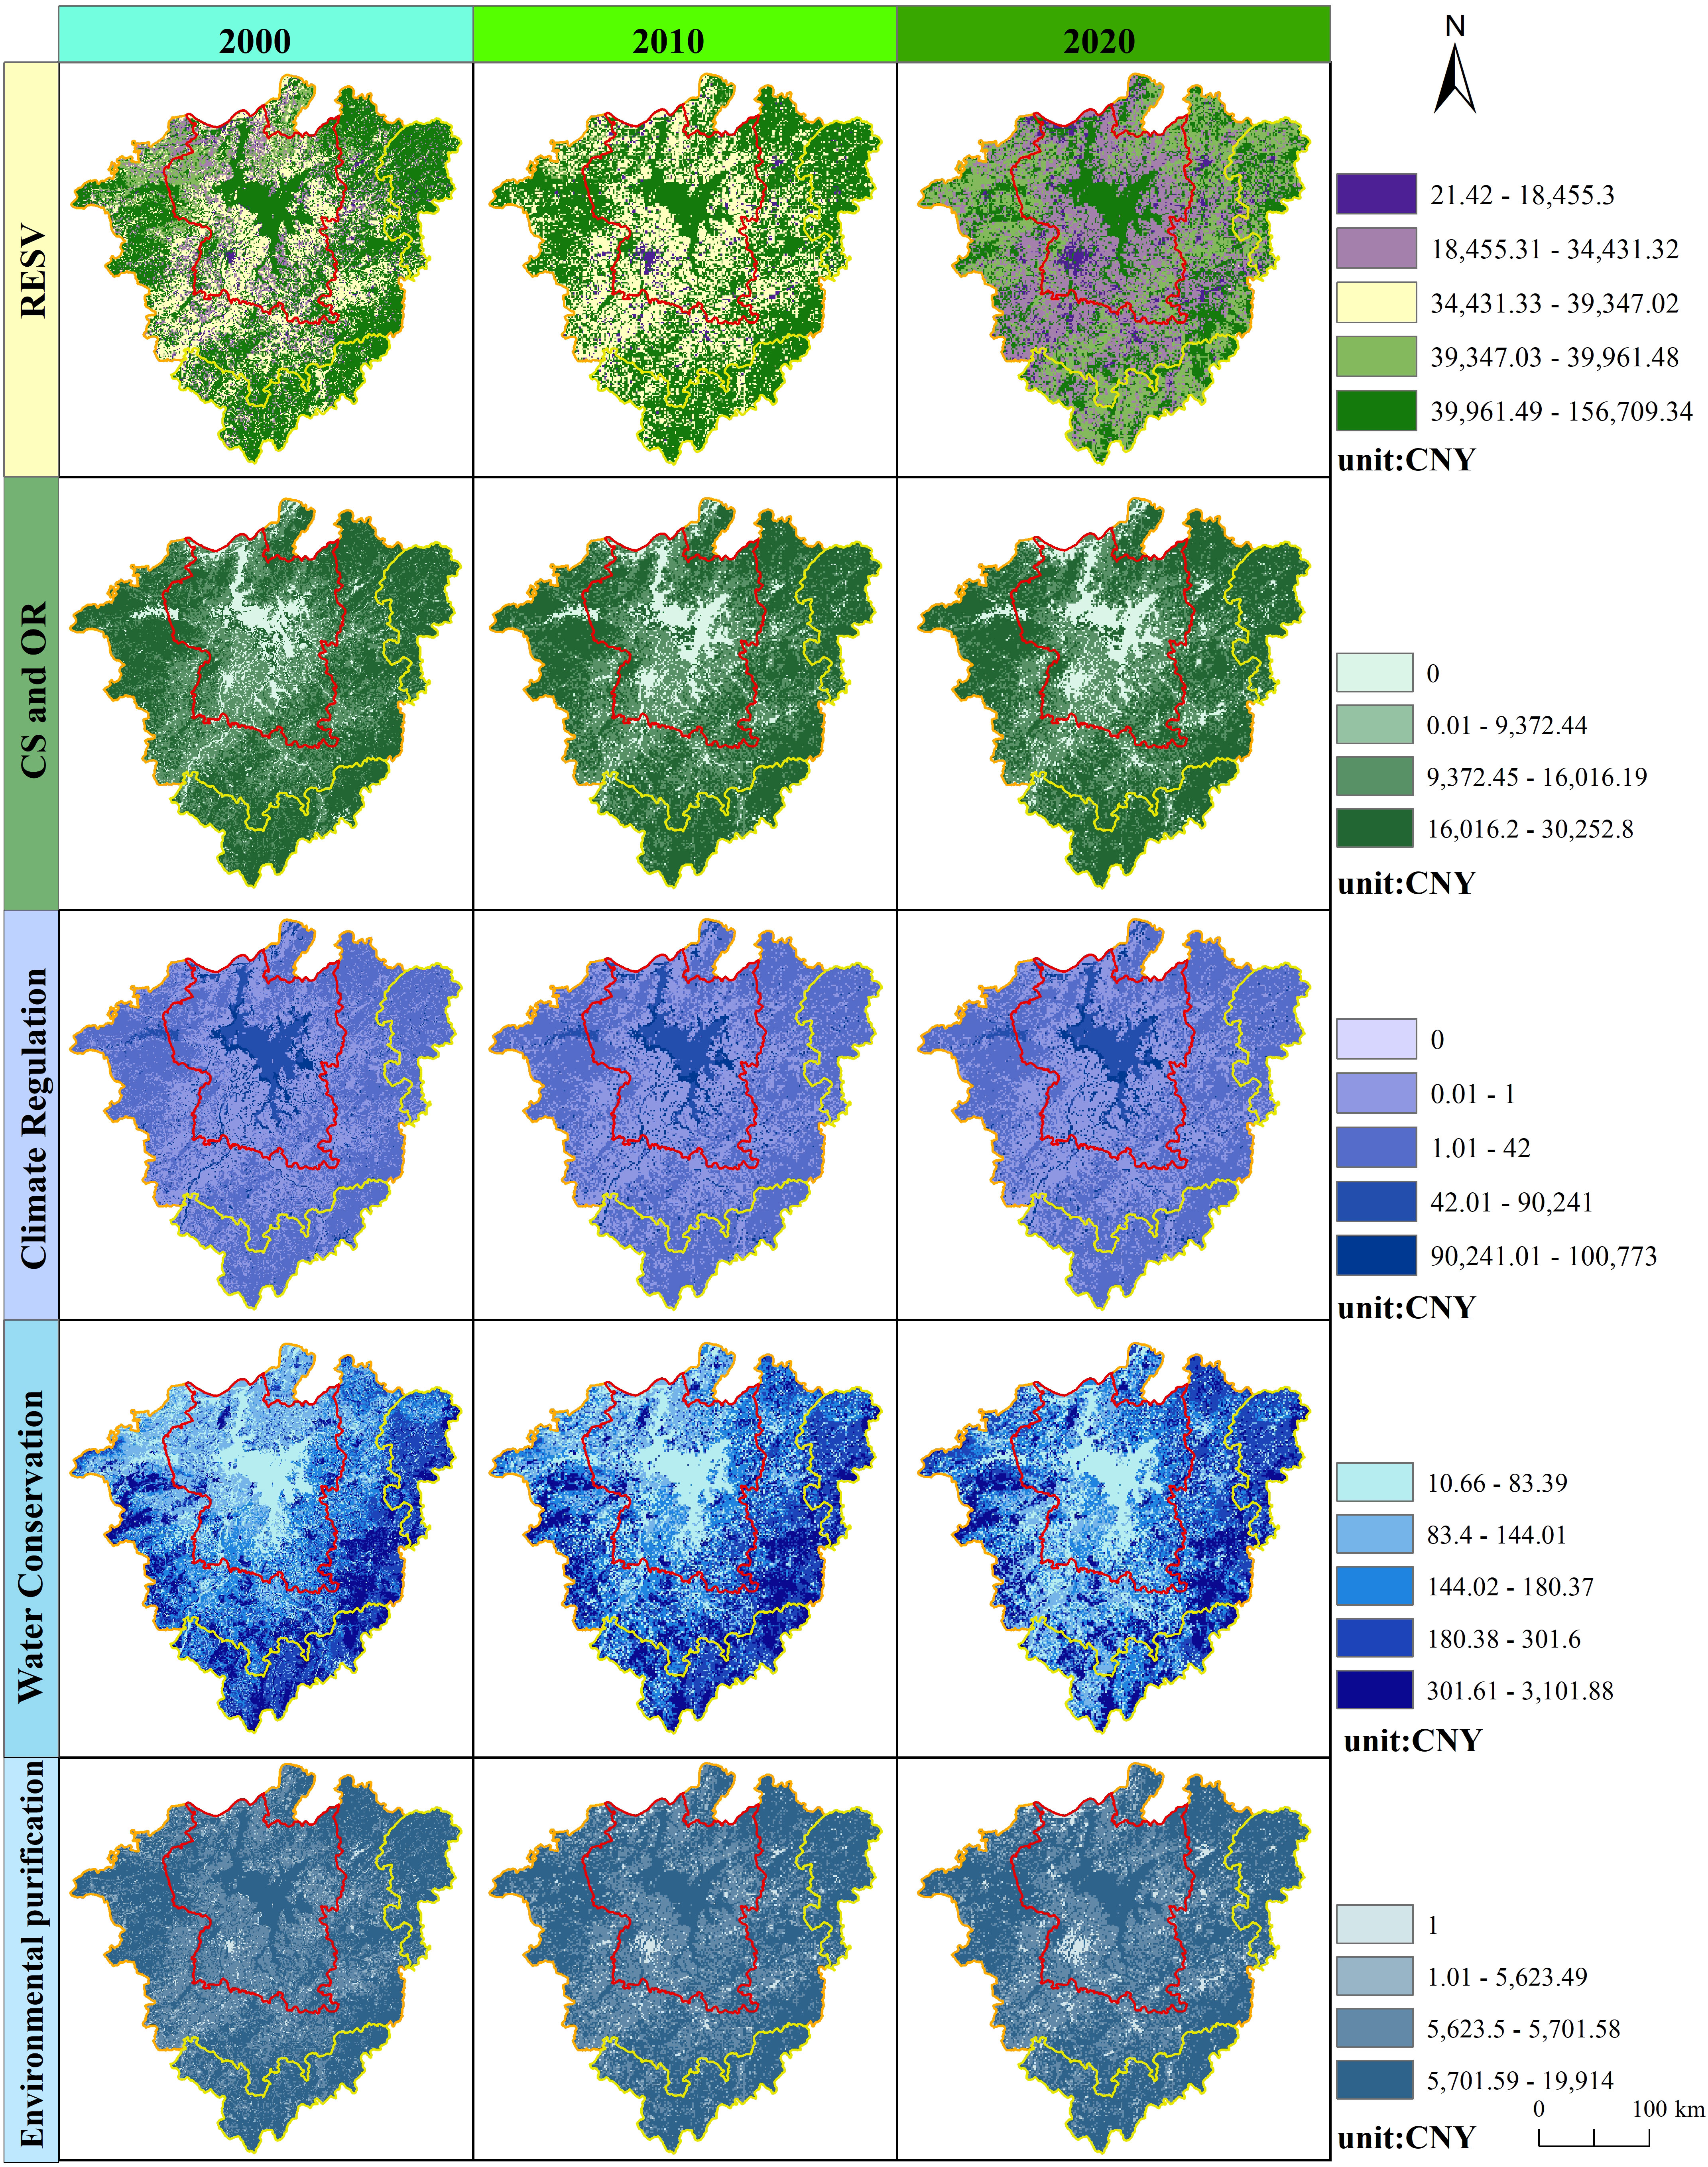
Figure 3 Spatial distribution of RESV in PLA, 2000-2020.
3.2 Driving mechanism analysis based on structural equation modeling
3.2.1 Model fit tests
The following metrics were used to assess the overall capability and fit of the model. According to Browne and Cudeck (1992) and MacCallum et al. (1996), the RMSEA (Root Mean Square Error of Approximation) is generally below 0.08, with 0.05-0.08 indicating a good fit. The RMR (Root Mean Square Residual) is generally less than 0.08. The GFI (Goodness of Fit Index) is greater than 0.9, and the NFI (Normative Fit Index) ranges from 0 to 0.9, which is considered a good fit. GFI (Goodness of Fit Index) is greater than 0.9, the model is considered to be well-fitted. CFI (Comparative Fit Index), and NFI (Normative Fit Index) values range from 0-1, the closer to 1 indicates a better fit. The results show that the model accuracy meets the requirements (Table 3).
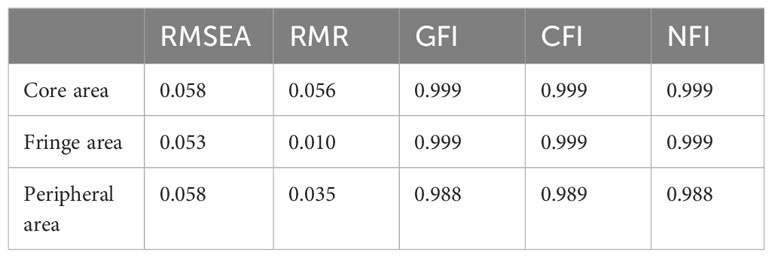
Table 3 Structural equation model fitting effect of three areas.
3.2.2 Driving mechanism analysis
As can be seen from Table 4 and Figure 4, the pathways of climate change and human activities on RESV in PLA are complex and diverse. The direct effects of climate change factors on RESV are mostly positive, especially within the appropriate range. Anthropogenic factors, on the other hand, tended to have a negative direct effect on RESV. However, when climate change factors interact with human activity factors, the impacts can become complex. In three areas, the mechanisms driving changes in RESV differed among the core, fringe, and peripheral areas.
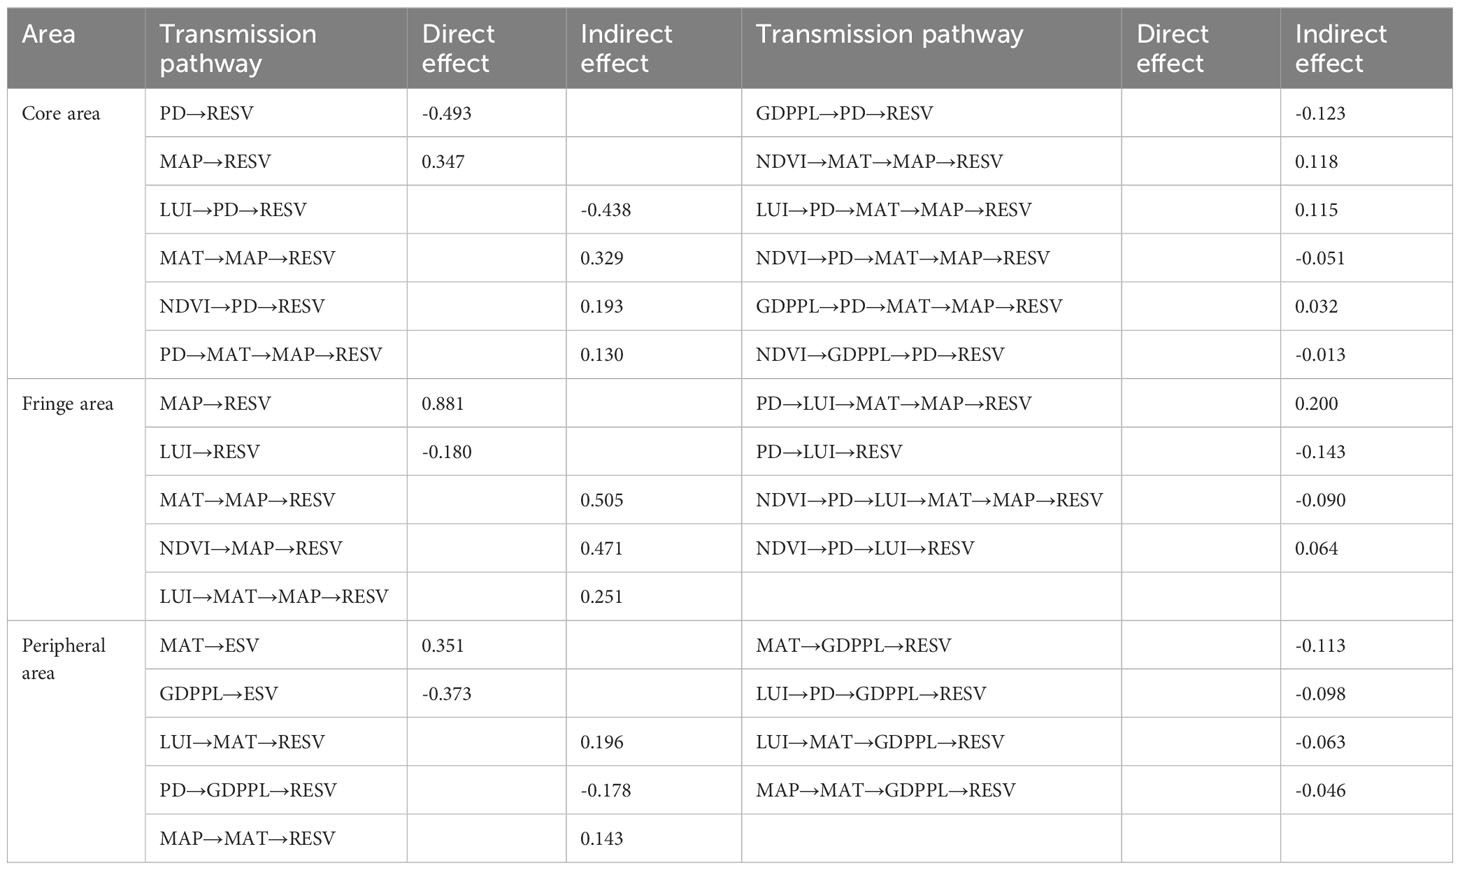
Table 4 Transmission pathways of the impact of drivers on RESV.
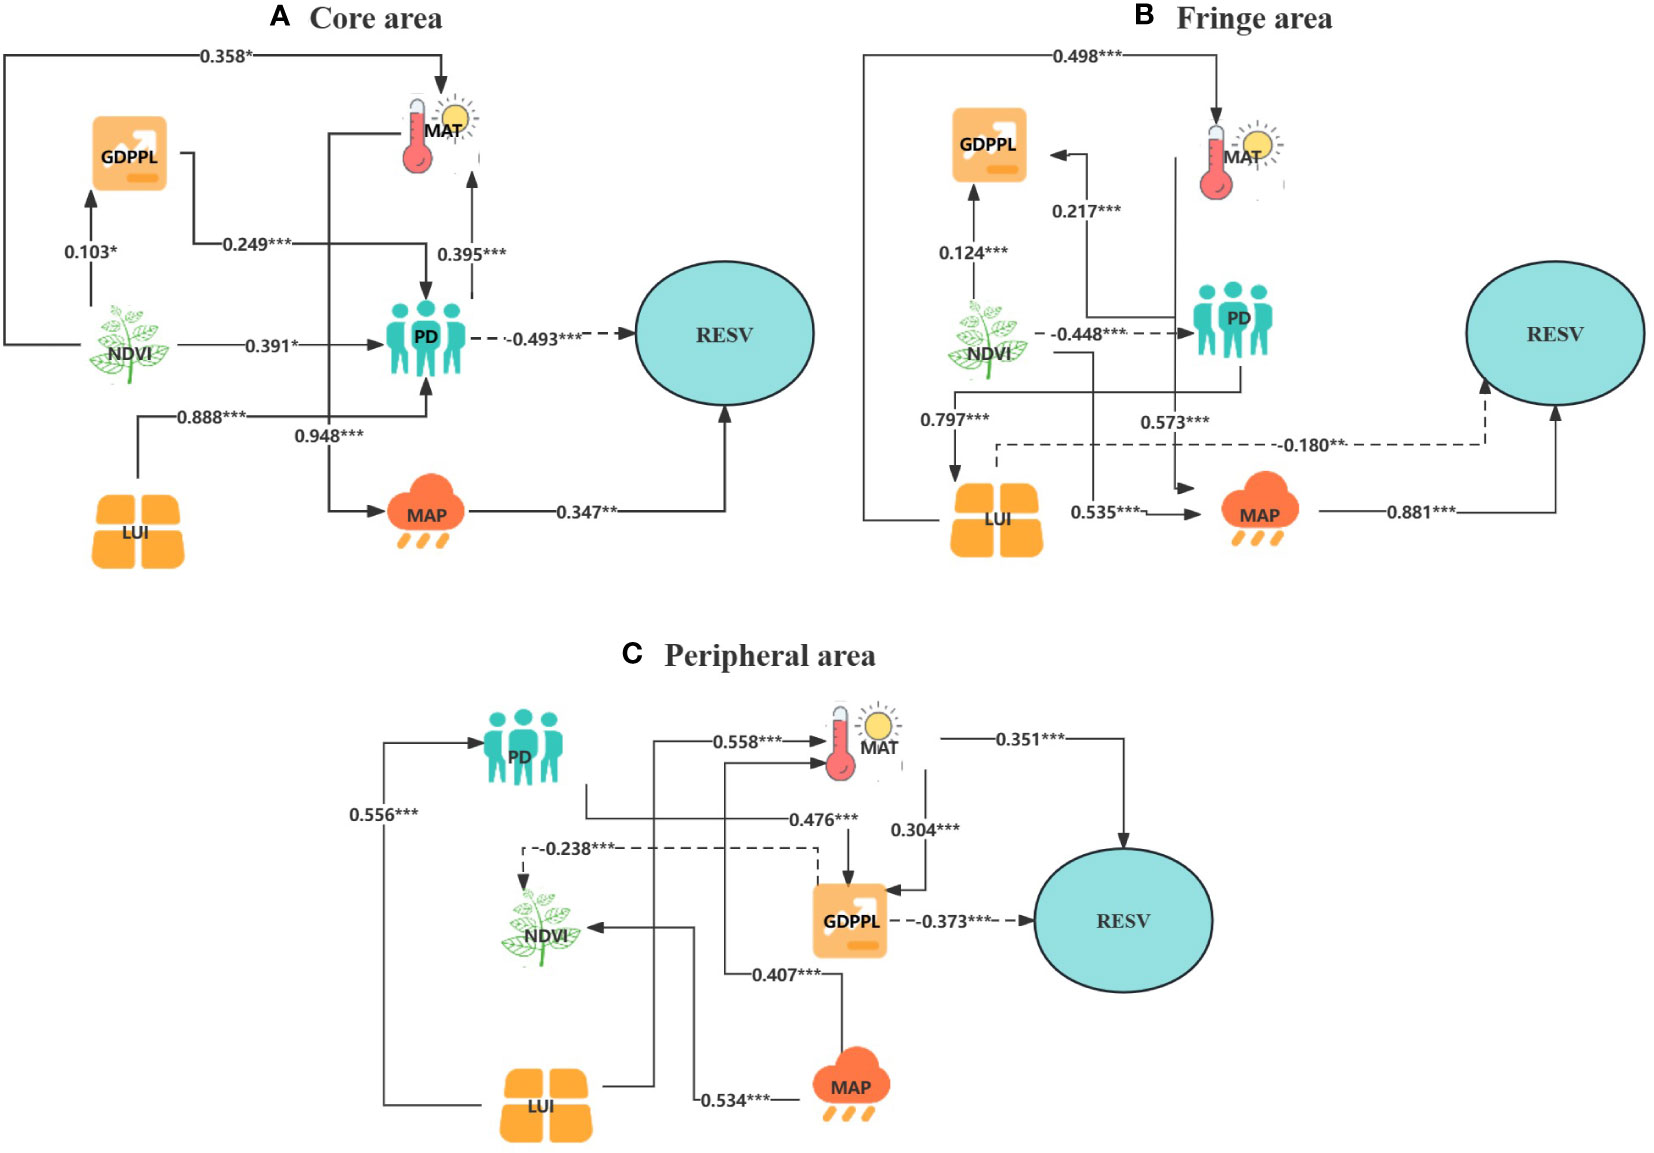
Figure 4 Structural equation model diagram of three areas. Solid lines represent a positive effect, dashed lines represent a negative effect, numbers are standardized coefficients, *, **, *** represent significant at the 10%, 5%, and 1% levels, respectively.
In the core area, population density had a negative direct effect (-0.493) on RESV. On the other hand, mean annual precipitation had a positive direct effect on RESV (0.347). In addition, population density contributes indirectly RESV (0.130) by affecting the mean annual temperature (0.395), and the mean annual temperature contributes indirectly to RESV (0.130) by affecting the mean annual precipitation (0.948). GDP per land has an indirect inhibitory effect on RESV by acting on population density (-0.123). NDVI and land use intensity indirectly contribute to or inhibit changes in ESV through multiple factors.
In the fringe area, mean annual precipitation had a positive direct effect (0.881) on RESV. However, land use intensity had a negative direct effect on RESV (-0.180). Mean annual temperature contributes indirectly to RESV by acting on mean annual precipitation (0.505). Population density also indirectly inhibits the growth of RESV by acting on land use intensity (-0.143). NDVI indirectly contributes to the growth of RESV through several factors.
In the peripheral area, GDP per land had a negative direct effect on RESV (-0.373). Mean annual air temperature had a positive direct effect on RESV (0.351). In addition, mean annual temperature indirectly inhibits the growth of RESV through its effect on land average GDP (-0.113). Land use intensity indirectly contributes to the growth of RESV through several factors, but population density indirectly suppresses the growth of RESV through its effect on GDP per land (-0.178).
4 Discussion
4.1 The lake affects the provision of RESV in the surrounding area
The results of the study indicate that the overall RESV in PLA shows a decreasing trend during the period of 2000-2020, which is similar to the relevant studies (Dai et al., 2020; Meng et al., 2022). This can be attributed to the disturbance of the ecosystem by production and living activities in the lake area, such as increasing eutrophication and reducing biodiversity (Meng et al., 2022). In comparison with similar studies, this study characterizes the value of ecosystem regulation services in different circles of the lake region in terms of regional heterogeneity. It was found that the RESV per unit area in PLA had a circle structure of core area > fringe area > peripheral area, i.e., the RESV per unit area decreased as the distance from the lake increased. In other words, the lake influenced the provision of regulating ecosystem services in the PLA. Heterogeneity and differences in the spatial distribution of ecosystem services are quite common phenomena, as socio-ecological resources differ significantly among regions (Dong et al., 2023). For example, Wu et al. (2023b) found that topography influenced the provision of CSOR service values in the PRD region, with high values concentrated in the peripheral ecologically favorable mountainous hills and low values in the central plains, while Zheng et al. (2020b) found that watersheds influenced the provision of ecosystem services, with the basins of the Sanjiangyuan district having the ESV contribution was the highest. For lake areas, it is an established fact that lakes have an impact on the surrounding ecology (Zhao et al., 2021). The factors involved in this impact are numerous and complex, as the diffuse correlates of lake water environmental benefits can involve social, ecological, and other factors (Manteghi et al., 2015; Qin et al., 2023). For example, the core area is closer to the lake itself, is more directly affected by the lake waters, and its climate regulation effect is more significant. In addition, the core area usually contains more wetlands, aquatic vegetation, and other rich habitats, which provide a suitable environment for a diversity of organisms. This may lead to higher biodiversity and regulating ecosystem service provisioning capacity in the core area. With increasing distance from the lake, the landscape is highly heterogeneous and may be more susceptible to the direct impacts of anthropogenic pressures such as agriculture and urbanization (Liu et al., 2012), which was verified in further studies. This finding emphasizes the need to fully understand the variability and complexity at the spatial scale when considering lake protection and sustainable management.
4.2 Mechanisms driving spatial and temporal changes in the RESV
Various drivers have different impacts on RESV in lakes (Xu et al., 2024b). Liu et al. (2024) found that precipitation has a significant positive effect on ecosystem services in lakes, and Mekuria et al. (2023) found that land degradation due to increased land use intensity inhibits RESV growth. However, related studies have focused on direct effects, often ignoring the interactions between these factors and the more complex pathways by which each factor influences RESV. Meanwhile, due to the unique environmental characteristics of the lake area, the driving mechanisms differ from one area to another. Therefore, this study investigates the influence pathways of natural and anthropogenic factors on RESV in different regions, including a series of more complex influence pathways arising from the interaction between natural and anthropogenic factors. It also compares the driving mechanisms of each factor in the three areas.
4.2.1 Factors driving changes in RESV and their influence pathway
Climatic factors, including precipitation and temperature, show positive effects on RESV, and their synergistic effects contribute to RESV growth. Mechanistically, temperature enhances carbon sequestration in the region by enhancing the assimilation process of photosynthesis (Yang et al., 2023), resulting in a higher value of CSOR. At the same time, precipitation also increases air relative humidity and regulates the water vapor pressure difference between air and plant leaves (Zhao et al., 2023), which promotes transpiration and leads to an increase in climate regulation value.
On the other hand, anthropogenic factors negatively affect RESV, reflecting environmental externalities such as those brought about by urbanization and economic development. Increased environmental pollution and resource demand brought about by higher population density and economic intensity increase the burden on regional ecosystem regulation services (Akhtar et al., 2022; Shen et al., 2023). RESV is mainly contributed by natural landscapes such as woodlands, grasslands, and wetlands, which was confirmed in this and other studies (Jo et al., 2024; Y. Pan et al., 2014; Seidl et al., 2019). And the increase in land use intensity brought about by urban expansion and other factors inevitably compresses the area of the natural landscape and inhibits RESV growth (Xiao et al., 2023).
As an indicator of vegetation cover, NDVI indirectly contributes to the growth of RESV by increasing precipitation and limiting population density through effects such as promoting vegetation transpiration and increasing urban green cover (Wolch et al., 2014).
In contrast to studies that have focused on the direct effects of various factors on ecosystem service value (Ebner et al., 2022; Schirpke and Ebner, 2022), this study expands on the interactions between factors and complex pathways of influence of each factor on RESV. In this study, climatic factors positively influenced RESV, but there was also a negative influence on RESV through a positive effect on anthropogenic factors, and anthropogenic factors negatively influenced RESV, but there was also some positive influence on RESV through a positive effect on climatic factors.
4.2.2 Differences in the driving mechanisms of the three lake areas
It should be emphasized that the driving mechanisms produced different results in the three areas (the core area, the fringe area, and the peripheral area). Proximity to the lake and topographic variations led to different responses in each area, highlighting the subtle nature of RESV dynamics. Among the effects of climatic factors on RESV in the three areas, precipitation in the core area and fringe area had a direct positive effect on ERSV, whereas precipitation in the peripheral area was needed to indirectly contribute to the growth of ERSV through temperature. ERSV in the peripheral area, on the other hand, was significantly and directly positively affected by temperature, while temperature in the core and fringe area indirectly promoted ERSV growth through precipitation. The reason for this is that the core area is close to the lake and the lake effect is significant, while the fringe area has a large terrain difference and is significantly affected by strong convection. Both the lake effect and frequent strong convective weather lead to higher-intensity precipitation (Nicholson, 2022; Kvak et al., 2023). Consequently, these two areas have greater rainfall intensity than the peripheral area, and the positive effect on RESV is more significant. The peripheral area is farther away from the lake. The lake effect is weak and influenced by land, and the daily and annual differences in temperature are larger (Wang et al., 2023b). Its RESV response to air temperature is more sensitive than that of the core area and the fringe area and is more significantly affected by the direct effect of temperature. In contrast, when studying the effect of NDVI on RESV in the PLA, it was found that its indirect effect only existed in the core and fringe areas. This reflects that the lake has a great influence on the role of NDVI. The core and fringe areas have higher vegetation diversity due to their closer proximity to the lake than the peripheral area, and the vegetation has a significant indirect effect on RESV.
4.3 Policy recommendations for the enhancement of RESV
Understanding the spatial and temporal evolution of ERSV in PLA and studying its driving factors can provide scientific support for the sustainability and environmental protection of the region. ERSV in the core area is directly and negatively affected by population density. This area is significantly affected by the interaction of anthropogenic factors, which further inhibits the growth of ERSV. This area covers the economic, cultural, and transportation center of Jiangxi Province, and the population is concentrated. Therefore, this area can be reasonably allocated to the peripheral regions of the city through the formulation of a rational regional development plan that allocates the layout of population, industry, and infrastructure to the peripheral areas of the city. It is worth noting that the contradiction between ecological land and construction land in the city center is unavoidable, and the advantages of green infrastructures, such as air gardens, should be brought into play to mitigate the impact of human activities on the ecological environment. The fringe area is subject to the direct negative influence of land use intensity. The area has a high urbanization rate and high land use intensity. The allocation of land resources should be optimized, the moderately intensive mode should be applied to improve the efficiency of construction land use according to the actual situation, and a certain proportion of ecological parks should be planned and constructed to promote RESV. The peripheral area is significantly negatively affected by the GDP per land. The ecological background of this area is relatively good, and it should promote the transformation of the economic growth mode from rough to intensive, realize the synergistic development of environmental protection and economic growth, and pilot the development of eco-industries and the construction of new green eco-districts (urban areas and parks).
5 Conclusion
Clarifying the spatial and temporal evolution of RESV and the driving mechanism of its changes is very significant to the realization of sustainable development goals. Taking the PLA as an example, this study analyzes the spatiotemporal changes of its RESV from 2000 to 2020 and explores the spatial heterogeneity of the drivers of RESV. This study found that 1) the RESV of PLA decreased period by period. Of these, CSOR values declined most significantly. 2) The high RESV is mostly concentrated in the central PLA where lakes are mainly clustered. In terms of specific indicators, the high values of climate regulation and environmental purification are concentrated in the core area, the high values of CSOR are concentrated in the peripheral area, and the high values of water conservation are concentrated in the fringe area. 3) RESV in different areas is influenced by different kinds of factors, and the influence paths are different. Climate change factors mainly positively affect the RESV, but the impacts are complex when interacting with human activities. Meanwhile, anthropogenic factors often negatively affect RESV, but can also positively affect it in some contexts through interaction pathways, and NDVI indirectly affects RESV by other factors. The study emphasizes the complexity of RESV under the influence of multiple factors, which has important implications for ecological conservation and sustainable development.
Data availability statement
The original contributions presented in the study are included in the article/Supplementary Material. Further inquiries can be directed to the corresponding author.
Author contributions
YL: Conceptualization, Methodology, Resources, Writing – review & editing. NH: Conceptualization, Formal analysis, Methodology, Software, Writing – original draft. CL: Conceptualization, Methodology, Writing – review & editing. SL: Supervision, Writing – review & editing. BG: Supervision, Writing – review & editing.
Funding
The author(s) declare financial support was received for the research, authorship, and/or publication of this article. This work was supported by the National Natural Science Foundation of China (grant number 42271209) and the Key Research and Development Program of Jiangxi Province (grant number 20223BBG71013).
Acknowledgments
Thanks to the editors and reviewers for their comments on this article.
Conflict of interest
The authors declare that the research was conducted in the absence of any commercial or financial relationships that could be construed as a potential conflict of interest.
Publisher’s note
All claims expressed in this article are solely those of the authors and do not necessarily represent those of their affiliated organizations, or those of the publisher, the editors and the reviewers. Any product that may be evaluated in this article, or claim that may be made by its manufacturer, is not guaranteed or endorsed by the publisher.
Supplementary material
The Supplementary Material for this article can be found online at: https://www.frontiersin.org/articles/10.3389/fevo.2024.1358822/full#supplementary-material
References
Akhtar M., Zhao Y., Gao G., Gulzar Q., Hussain A. (2022). Assessment of spatiotemporal variations of ecosystem service values and hotspots in dryland: A case-study in Pakistan. Land Degradation Dev. 33, 1383–1397. doi: 10.1002/ldr.4245
Baidoo R., Obeng K. (2023). Evaluating the impact of land use and land cover changes on forest ecosystem service values using landsat dataset in the Atwima Nwabiagya North, Ghana. Heliyon 9, 21736. doi: 10.1016/j.heliyon.2023.e21736
Belay T., Melese T., Senamaw A. (2022). Impacts of land use and land cover change on ecosystem service values in the Afroalpine area of Guna Mountain, Northwest Ethiopia. Heliyon 8, 12246. doi: 10.1016/j.heliyon.2022.e12246
Blagrave K., Bailey K., Basu A., Benoit N., Howell T., Sharma S. (2023). Spatial heterogeneity in water quality across the northern nearshore regions of the Laurentian Great Lakes. J. Great Lakes Res. 49, 102231. doi: 10.1016/j.jglr.2023.09.002
Bongaarts J. (2019). IPBES 2019. Summary for policymakers of the global assessment report on biodiversity and ecosystem services of the Intergovernmental Science-Policy Platform on Biodiversity and Ecosystem Services. Population Dev. Review. 45, 680–681. doi: 10.1111/padr.12283
Browne M. W., Cudeck R. (1992). Alternative ways of assessing model fit. Sociological Methods Res. 21, 230–258. doi: 10.1177/0049124192021002005
Chen Y., Duo L., Zhao D., Zeng Y., Guo X. (2023c). The response of ecosystem vulnerability to climate change and human activities in the Poyang lake city group, China. Environ. Res. 233, 116473. doi: 10.1016/j.envres.2023.116473
Chen X., He L., Luo F., He Z., Bai W., Xiao Y., et al. (2023b). Dynamic characteristics and impacts of ecosystem service values under land use change: A case study on the Zoigê plateau, China. Ecol. Inf. 78, 102350. doi: 10.1016/j.ecoinf.2023.102350
Chen J., Qi Q., Wang B., He S., Li Z., Wang L., et al. (2023a). Response of ecosystem services to landscape patterns under socio-economic-natural factor zoning: A case study of Hubei Province, China. Ecol. Indicators. 153, 110417. doi: 10.1016/j.ecolind.2023.110417
Chen L., Wei W., Tong B., Liu Y., Liu Z., Chen S., et al. (2024). Long-term terrace change and ecosystem service response in an inland mountain province of China. CATENA. 234, 107586. doi: 10.1016/j.catena.2023.107586
China Biodiversity National Situation Study Report Writing Group. (1998). Study on China’s Biodiversity National Situation. (Beijing, China).
Dai X., Wang L., Huang C., Fang L., Wang S., Wang L. (2020). Spatio-temporal variations of ecosystem services in the urban agglomerations in the middle reaches of the Yangtze River, China. Ecol. Indic. 115, 106394. doi: 10.1016/j.ecolind.2020.106394
Dong W., Wu X., Zhang J., Zhang Y., Dang H., Lü Y., et al. (2023). Spatiotemporal heterogeneity and driving factors of ecosystem service relationships and bundles in a typical agropastoral ecotone. Ecol. Indicators. 156, 111074. doi: 10.1016/j.ecolind.2023.111074
Ebner M., Schirpke U., Tappeiner U. (2022). How do anthropogenic pressures affect the provision of ecosystem services of small mountain lakes? Anthropocene 38, 100336. doi: 10.1016/j.ancene.2022.100336
Fei L., Shuwen Z., Jiuchun Y., Kun B., Qing W., Junmei T., et al. (2016). The effects of population density changes on ecosystem services value: A case study in Western Jilin, China. Ecol. Indicators. 61, 328–337. doi: 10.1016/j.ecolind.2015.09.033
Felton A., Belyazid S., Eggers J., Nordström E.-M., Öhman K. (2024). Climate change adaptation and mitigation strategies for production forests: Trade-offs, synergies, and uncertainties in biodiversity and ecosystem services delivery in Northern Europe. Ambio 53, 1–16. doi: 10.1007/s13280-023-01909-1
Feng H., Kang P., Deng Z., Zhao W., Hua M., Zhu X., et al. (2023). The impact of climate change and human activities to vegetation carbon sequestration variation in Sichuan and Chongqing. Environ. Res. 238, 117138. doi: 10.1016/j.envres.2023.117138
Guo S., Wu C., Wang Y., Qiu G., Zhu D., Niu Q., et al. (2022). Threshold effect of ecosystem services in response to climate change, human activity and landscape pattern in the upper and middle Yellow River of China. Ecol. Indicators. 136, 108603. doi: 10.1016/j.ecolind.2022.108603
He Z., Shang X., Zhang T., Yun J. (2022). Coupled regulatory mechanisms and synergy/trade-off strategies of human activity and climate change on ecosystem service value in the loess hilly fragile region of northern Shaanxi, China. Ecol. Indicators. 143, 109325. doi: 10.1016/j.ecolind.2022.109325
Helseth E. V., Vedeld P., Framstad E., Gómez-Baggethun E. (2022). Forest ecosystem services in Norway: Trends, condition, and drivers of change, (1950–2020). Ecosystem Serv. 58, 101491. doi: 10.1016/j.ecoser.2022.101491
IPBES. (2019). Summary for policymakers of the global assessment report on biodiversity and ecosystem services of the Intergovernmental Science-Policy Platform on Biodiversity and Ecosystem (Bonn: IPBES Secretariat). doi: 10.5281/zenodo.3553579
Jiang Y., Li J., Gong H., Ye M., Feng B., He G., et al. (2017). Ecosystem service value assessment of coastal zone caused by reclamation —A case study of Ningbo Hangzhou Bay New Zone. ECONOMIC Geogr. 37, 181–190. doi: 10.15957/j.cnki.jjdl.2017.11.022
Jo J.-H., Choi M., Kweon D., Son Y.-G., Lim E. M. (2024). Regulating ecosystem services in a local forest: Navigating supply, trade-offs, and synergies. Trees Forests People. 15, 100466. doi: 10.1016/j.tfp.2023.100466
Kvak R., Okon Ľ., Bližňák V., Méri L., Kašpar M. (2023). Spatial distribution and precipitation intensity of supercells: Response to terrain asymmetry in the Western Carpathians, Central Europe. Atmospheric Res. 292, 106885. doi: 10.1016/j.atmosres.2023.106885
Li L., Li G., Du J., Wu J., Cui L., Chen Y. (2022b). Effects of tidal flat reclamation on the stability of coastal wetland ecosystem services: A case study in Jiangsu Coast, China. Ecol. Indicators. 145, 109697. doi: 10.1016/j.ecolind.2022.109697
Li J., Li W., Yang X., Zhang D., Tong Y. (2008). The impact of land use change on quality evolution of soil genetic layers on the coastal plain of south Hangzhou Bay. J. Geographical Sci. 18, 469–482. doi: 10.1007/s11442-008-0469-7
Li M., Liang D., Xia J., Song J., Cheng D., Wu J., et al. (2021). Evaluation of water conservation function of Danjiang River Basin in Qinling Mountains, China based on InVEST model. J. Environ. Management. 286, 112212. doi: 10.1016/j.jenvman.2021.112212
Li F., Wang F., Liu H., Huang K., Yu Y., Huang B. (2023). A comparative analysis of ecosystem service valuation methods: Taking Beijing, China as a case. Ecol. Indicators. 154, 110872. doi: 10.1016/j.ecolind.2023.110872
Li F., Yin X., Shao M. (2022a). Natural and anthropogenic factors on China’s ecosystem services: Comparison and spillover effect perspective. J. Environ. Management. 324, 116064. doi: 10.1016/j.jenvman.2022.116064
Li N., Zhang Y., Wang T., Li J., Yang J., Luo M. (2022c). Have anthropogenic factors mitigated or intensified soil erosion over the past three decades in South China? J. Environ. Management. 302, 114093. doi: 10.1016/j.jenvman.2021.114093
Liang D., Lu H., Guan Y., Feng L., He L., Qiu L., et al. (2023). Population density regulation may mitigate the imbalance between anthropogenic carbon emissions and vegetation carbon sequestration. Sustain. Cities Society. 92, 104502. doi: 10.1016/j.scs.2023.104502
Liang L.-N., Siu W. S., Wang M.-X., Zhou G.-J. (2021). Measuring gross ecosystem product of nine cities within the Pearl River Delta of China. Environ. Challenges. 4, 100105. doi: 10.1016/j.envc.2021.100105
Lin C.-Y., Fu C.-Y., Liu Y., Zhang M.-Q., Liu Y., Wu W.-Y., et al. (2022). Assessing the changes of the monetary value of mangrove ecosystem services in China and its application. Front. Environ. Science. 10. doi: 10.3389/fenvs.2022.1018801
Liu C., Liu Y., Giannetti B. F., Almeida C. M. V. B., Sevegnani F., Li R. (2023). Spatiotemporal differentiation and mechanism of anthropogenic factors affecting ecosystem service value in the Urban Agglomeration around Poyang Lake, China. Ecol. Indic. 154, 110733. doi: 10.1016/j.ecolind.2023.110733
Liu Y., Wang X., Liu L. (2012). The spatial distribution model of urban economic potential zones and its application based on the hypothesis of lake effect: the area around Poyang Lake as a case. Scientia Geographica Sinica 32, 681–685. doi: 10.13249/j.cnki.sgs.2012.06.005
Liu Q., Xu X., Chen M. (2024). Changing pattern and driving factors of ecosystem service value of the lakes in Northern China since 1990. Ecol. Indic. 158, 111370. doi: 10.1016/j.ecolind.2023.111370
Lyu J., Fu X., Lu C., Zhang Y., Luo P., Guo P., et al. (2023). Quantitative assessment of spatiotemporal dynamics in vegetation NPP, NEP and carbon sink capacity in the Weihe River Basin from 2001 to 2020. J. Cleaner Production 428, 139384. doi: 10.1016/j.jclepro.2023.139384
MacCallum R. C., Browne M. W., Sugawara H. M. (1996). Power analysis and determination of sample size for covariance structure modeling. Psychol. Methods 1, 130–149. doi: 10.1037/1082-989X.1.2.130
Mahmoud S. H., Gan T. Y. (2018). Impact of anthropogenic climate change and human activities on environment and ecosystem services in arid regions. Sci. Total Environment. 633, 1329–1344. doi: 10.1016/j.scitotenv.2018.03.290
Manteghi G., Limit H., Remaz D. (2015). Water bodies an urban microclimate: A review. Modern Appl. Sci. 9, 1844–1913. doi: 10.5539/mas.v9n6p1
MEA. (2005). Millennium ecosystem assessment M. Ecosystems and human well-being Vol. 5 (Washington, D.C: Island Press).
Mekuria W., Gedle A., Tesfaye Y., Phimister E. (2023). Implications of changes in land use for ecosystem service values of two highly eroded watersheds in Lake Abaya Chamo sub-basin, Ethiopia. Ecosystem Serv. 64, 101564. doi: 10.1016/j.ecoser.2023.101564
Meng J.-N., Fang H., Huang L., He G., Liu X., Xu C., et al. (2022). Multidimensional ecosystem assessment of Poyang Lake under anthropogenic influences. Ecol. Model. 473, 110134. doi: 10.1016/j.ecolmodel.2022.110134
Morshed S. R., Fattah M., Haque M., Morshed S. Y. (2022). Future ecosystem service value modeling with land cover dynamics by using machine learning based Artificial Neural Network model for Jashore city, Bangladesh. Phys. Chem. Earth Parts A/B/C 126, 103021. doi: 10.1016/j.pce.2021.103021
Nicholson S. E. (2022). Lake-effect rainfall over Africa’s great lakes and other lakes in the rift valleys. J. Great Lakes Res. 49, 101971. doi: 10.1016/j.jglr.2021.12.004
Ouyang Z., Song C., Zheng H., Polasky S., Xiao Y., Bateman I. J., et al. (2020). Using gross ecosystem product (GEP) to value nature in decision making. Proc. Natl. Acad. Sci. 117, 14593–14601. doi: 10.1073/pnas.1911439117
Pan H., Du Z., Wu Z., Zhang H., Ma K. (2024). Assessing the coupling coordination dynamics between land use intensity and ecosystem services in Shanxi’s coalfields, China. Ecol. Indicators. 158, 111321. doi: 10.1016/j.ecolind.2023.111321
Pan Y., Wu J., Xu Z. (2014). Analysis of the tradeoffs between provisioning and regulating services from the perspective of varied share of net primary production in an alpine grassland ecosystem. Ecol. Complexity. 17, 79–86. doi: 10.1016/j.ecocom.2013.11.001
Qin X., Hu X., Xia W. (2023). Investigating the dynamic decoupling relationship between regional social economy and lake water environment: The application of DPSIR-Extended Tapio decoupling model. J. Environ. Management. 345, 118926. doi: 10.1016/j.jenvman.2023.118926
Schirpke U., Ebner M. (2022). Exposure to global change pressures and potential impacts on ecosystem services of mountain lakes in the European Alps. J. Environ. Manage. 318, 115606. doi: 10.1016/j.jenvman.2022.115606
Seidl R., Albrich K., Erb K., Formayer H., Leidinger D., Leitinger G., et al. (2019). What drives the future supply of regulating ecosystem services in a mountain forest landscape? For. Ecol. Management. 445, 37–47. doi: 10.1016/j.foreco.2019.03.047
Shen W., Li Y., Qin Y., Cheng J. (2023). Influencing mechanism of climate and human activities on ecosystem health in the middle reaches of the Yellow River of China. Ecol. Indicators. 150, 110191. doi: 10.1016/j.ecolind.2023.110191
Shi Y., Shi D., Zhou L., Fang R. (2020). Identification of ecosystem services supply and demand areas and simulation of ecosystem service flows in Shanghai. Ecol. Indicators. 115, 106418. doi: 10.1016/j.ecolind.2020.106418
State Forestry Administration. (2016). 2016 national report on ecological benefit monitoring of grain for green project. (Beijing, China).
Su Y., Ma X., Feng Q., Liu W., Zhu M., Niu J., et al. (2023). Patterns and controls of ecosystem service values under different land-use change scenarios in a mining-dominated basin of northern China. Ecol. Indicators. 151, 110321. doi: 10.1016/j.ecolind.2023.110321
Sun X., Shan R., Liu F. (2020). Spatio-temporal quantification of patterns, trade-offs and synergies among multiple hydrological ecosystem services in different topographic basins. J. Cleaner Production. 268, 122338. doi: 10.1016/j.jclepro.2020.122338
Thiam H. I., Owusu V., Villamor G. B., Schuler J., Hathie I. (2024). Farmers’ intention to adapt to soil salinity expansion in Fimela, Sine-Saloum area in Senegal: A structural equation modelling approach. Land Use Policy. 137, 106990. doi: 10.1016/j.landusepol.2023.106990
Vincent W. F. (2009). “Effects of Climate Change on Lakes,” in Encyclopedia of Inland Waters, (Elsevier), 55–60. doi: 10.1016/B978-012370626-3.00233-7
Wang N., Li J.-M., Zhou Y.-F. (2024). Mechanism of action of marine ecological restoration on ecological, economic, and social benefits—An empirical analysis based on a structural equation model. Ocean Coast. Management. 248, 106950. doi: 10.1016/j.ocecoaman.2023.106950
Wang J., Qian Y., Pringle W., Chakraborty T. C., Hetland R., Yang Z., et al. (2023a). Contrasting effects of lake breeze and urbanization on heat stress in Chicago metropolitan area. Urban Climate. 48, 101429. doi: 10.1016/j.uclim.2023.101429
Wang J., Wu T., Li Q., Wang S. (2021). Quantifying the effect of environmental drivers on water conservation variation in the eastern Loess Plateau, China. Ecol. Indicators. 125, 107493. doi: 10.1016/j.ecolind.2021.107493
Wang H., Zhou S., Li X., Liu H., Chi D., Xu K. (2016). The influence of climate change and human activities on ecosystem service value. Ecol. Engineering. 87, 224–239. doi: 10.1016/j.ecoleng.2015.11.027
Wang J., Zhou J., Ma D., Zhao X., Wei W., Liu C., et al. (2023b). Impact of ecological restoration project on water conservation function of qilian mountains based on inVEST model—A case study of the upper reaches of Shiyang River Basin. Land 12, 1850. doi: 10.3390/land12101850
Wolch J. R., Byrne J., Newell J. P. (2014). Urban green space, public health, and environmental justice: The challenge of making cities ‘just green enough.’. Landscape Urban Planning. 125, 234–244. doi: 10.1016/j.landurbplan.2014.01.017
Wu J., Fan X., Li K., Wu Y. (2023a). Assessment of ecosystem service flow and optimization of spatial pattern of supply and demand matching in Pearl River Delta, China. Ecol. Indic. 153, 110452. doi: 10.1016/j.ecolind.2023.110452
Wu Y., Xu Y., Zhang X., Li C., Hao F. (2023b). Multi-remote sensing data analysis for identifying the impact of human activities on water-related ecosystem services in the yangtze river economic belt, China. Water 15, 915. doi: 10.3390/w15050915
Xiao J., Song F., Su F., Song S., Wei C. (2023). Exploring the interaction mechanism of natural conditions and human activities on wetland ecosystem services value. J. Cleaner Production. 426, 139161. doi: 10.1016/j.jclepro.2023.139161
Xu L., Fan Y., Zheng J., Guan J., Lin J., Wu J., et al. (2024b). Impacts of climate change and human activity on the potential distribution of Aconitum leucostomum in China. Sci. Total Environment. 912, 168829. doi: 10.1016/j.scitotenv.2023.168829
Xu D., Wang Y., Zhou D., Wang Y., Zhang Q., Yang Y. (2024a). Influences of urban spatial factors on surface urban heat island effect and its spatial heterogeneity: A case study of Xi’an. Building Environ. 248, 111072. doi: 10.1016/j.buildenv.2023.111072
Yan X., Cao G., Cao S., Yuan J., Zhao M., Tong S., et al. (2023). Spatiotemporal variations of water conservation and its influencing factors in the Qinghai Plateau, China. Ecol. Indicators. 155, 111047. doi: 10.1016/j.ecolind.2023.111047
Yan W., Wang Y., Chaudhary P., Ju P., Zhu Q., Kang X., et al. (2022). Effects of climate change and human activities on net primary production of wetlands on the Zoige Plateau from 1990 to 2015. Global Ecol. Conserv. 35, e02052. doi: 10.1016/j.gecco.2022.e02052
Yang S., Zhang L., Zhu G. (2023). Effects of transport infrastructures and climate change on ecosystem services in the integrated transport corridor region of the Qinghai-Tibet Plateau. Sci. Total Environment. 885, 163961. doi: 10.1016/j.scitotenv.2023.163961
Yuan S., Mei Z., Zhu C., Cao R., Li S., Yang L., et al. (2024). Investigating the spatio-temporal interactive relationship between land use structure and ecosystem services in urbanizing China. Ecol. Indicators. 158, 111315. doi: 10.1016/j.ecolind.2023.111315
Yun X., Tang Q., Li J., Lu H., Zhang L., Chen D. (2021). Can reservoir regulation mitigate future climate change induced hydrological extremes in the Lancang-Mekong River Basin? Sci. Total Environment. 785, 147322. doi: 10.1016/j.scitotenv.2021.147322
Zhang X., Chen Y., Zhang Q., Xia Z., Hao H., Xia Q. (2023a). Potential evapotranspiration determines changes in the carbon sequestration capacity of forest and grass ecosystems in Xinjiang, Northwest China. Global Ecol. Conserv. 48, 2737. doi: 10.1016/j.gecco.2023.e02737
Zhang Z., Liu Q., Gao G., Shao J., Pan J., He G., et al. (2023b). Integrating ecosystem services closely related to human well-being into the restoration and management of deep lakes facing multiple stressors: Lessons from long-term practice in Qiandao Lake, China. Sci. Total Environment. 902, 166456. doi: 10.1016/j.scitotenv.2023.166457
Zhang M., Wang K., Liu H., Wang J., Zhang C., Yue Y., et al. (2016). Spatio-temporal variation and impact factors for vegetation carbon sequestration and oxygen production based on rocky desertification control in the karst region of Southwest China. Remote Sens. 8, 102. doi: 10.3390/rs8020102
Zhao L., Li T., Przybysz A., Guan Y., Ji P., Ren B., et al. (2021). Effect of urban lake wetlands and neighboring urban greenery on air PM10 and PM2.5 mitigation. Build Environ. 206, 108291. doi: 10.1016/j.buildenv.2021.108291
Zhao L., Li T., Przybysz A., Liu H., Zhang B., An W., et al. (2023). Effects of urban lakes and neighbouring green spaces on air temperature and humidity and seasonal variabilities. Sustain. Cities Society. 91, 104438. doi: 10.1016/j.scs.2023.104438
Zheng D., Wang Y., Hao S., Xu W., Lv L., Yu S. (2020a). Spatial-temporal variation and tradeoffs/synergies analysis on multiple ecosystem services: A case study in the Three-River Headwaters region of China. Ecol. Indicators. 116, 106494. doi: 10.1016/j.ecolind.2020.106494
Zheng Z., Zhu W., Zhang Y. (2020b). Seasonally and spatially varied controls of climatic factors on net primary productivity in alpine grasslands on the Tibetan Plateau. Global Ecol. Conserv. 21, e00814. doi: 10.1016/j.gecco.2019.e00814
Zhou J., Ding Q., Zou Z., Deng J., Xu C., Yang W. (2023). Land suitability evaluation of large-scale photovoltaic plants using structural equation models. Resources Conserv. Recycling. 198, 107179. doi: 10.1016/j.resconrec.2023.107179
Keywords: regulating ecosystem services, lake, driving mechanisms, climate change, anthropogenic pressures
Citation: Liu Y, Huang N, Liu C, Li S and Giannetti BF (2024) Spatio-temporal evolution and driving factors of regulating ecosystem service value: a case study of Poyang Lake Area, China. Front. Ecol. Evol. 12:1358822. doi: 10.3389/fevo.2024.1358822
Received: 20 December 2023; Accepted: 05 February 2024;
Published: 22 February 2024.
Edited by:
Salvador García-Ayllón Veintimilla, Polytechnic University of Cartagena, SpainReviewed by:
Binggeng Xie, Hunan Normal University, ChinaQinghai Guo, Zhejiang Sci-Tech University, China
Copyright © 2024 Liu, Huang, Liu, Li and Giannetti. This is an open-access article distributed under the terms of the Creative Commons Attribution License (CC BY). The use, distribution or reproduction in other forums is permitted, provided the original author(s) and the copyright owner(s) are credited and that the original publication in this journal is cited, in accordance with accepted academic practice. No use, distribution or reproduction is permitted which does not comply with these terms.
*Correspondence: Chenghao Liu, Y2hsaXVAZW1haWwubmN1LmVkdS5jbg==