 Shiwen Xu
 Pu Miao2†
 Fan Song
 Zhenyuan Xia
- 1Department of Entomology and Ministry of Agriculture (MOA) Key Lab of Pest Monitoring and Green Management College of Plant Protection, China Agricultural University, Beijing, China
- 2Henan Province Tobacco Company, Luoyang, China
- 3Department of Entomology, College of Plant Protection, South China Agricultural University, Guangzhou, China
- 4Yunnan Tobacco Company, Yuxi, China
- 5Yunnan Academy of Tobacco Agricultural Sciences, Kunming, China
Introduction: Mitochondrial genome (mitogenome) is a widely utilized source of genetic data for animal species identification, molecular phylogeny, phylogeography, and evolutionary research at various taxonomic scales. With 14,500 recognized species placed in over 1,100 genera, Galerucinae (Coleoptera: Chrysomelidae), also known as leaf beetles, is the largest subfamily within Chrysomelidae.
Methods: We newly sequenced and annotated five mitogenomes from Galerucinae. Additionally, we investigated their nucleotide composition, codon usage, relative synonymous codon usage and evolutionary rate of protein-coding genes (PCGs). The phylogenetic relationship of Galerucinae also been inferred by gathering mitogenomes of 97 species from GenBank and our newly sequenced five mitogenomes. The divergence times within Galerucinae were estimated using three calibration nodes in MCMCTree. Furthermore, we investigated the structural features of the control regions (CRs) within the phylogenetic framework of Galerucinae.
Results and discussion: The length of mitogenomes ranged from 15,737 to 16,484 bp. All of these mitogenomes exhibited high AT content, as well as positive AT skew and negative GC skew. Most PCGs have ATN as their start codons, and TAA and TAG were the most widely assigned stop codons. The substitution rate analysis suggested that ATP8 experienced positive selection, while COX1 underwent purifying selection. Phylogenetic analyses showed that both tribes Alticini and Galerucini were monophyletic sister groups. Within two tribes, most groups and subtribes were monophyletic. Our divergence time inference, dating the origin of Galerucinae to the Middle Cretaceous period (102.69 Ma), and indicated main groups of Galerucinae diverged and occurred during the period from Middle Cretaceous to Middle Paleogene. Finally, we analysis revealed variations in the length and structural organization of the CRs even among closely related groups, which can be attributed to variations in specific structural elements.
1 Introduction
Galerucinae (Coleoptera: Chrysomelidae), also known as leaf beetles, is the largest subfamily within Chrysomelidae, with approximately 14,500 recognized species placed in over 1,100 genera occurring worldwide (Nie et al., 2018). The species of Galerucinae exhibit ecological diversity, with specialized feeders, monophagous or oligophagous on various angiosperm families (Schoohoven et al., 2005; Salvi et al., 2019). Consequently, these taxa are not only economically significant pests in agriculture and forestry and play vital roles in the biological control of weeds, but are also extensively utilized in the study of biological evolution and ecology (Bunnige et al., 2008; Ge et al., 2011; Eben and Espinosa de los Monteros, 2015; Salvi et al., 2019). The phylogeny of Galerucinae has been debated for decades and remains controversial. However, few molecular studies have addressed the internal relationships with the subfamily, and often these are restricted to subclades or limited to a handful of genetic loci. Some researchers advocate that the Alticinae is an independent subfamily (Seeno and Wilcox, 1982; Konstantinov and Vandenberg, 1996), while others consider it a tribe within the subfamily Galerucinae (Lingafelter and Konstantinov, 1999). Ge et al. (2011) conducted phylogenetic analyses using mitochondrial (lrRNA and COX1) and nuclear (small and large subunits) genes to study the evolution of the jumping apparatus in the hind legs, and their results strongly supports multiple independent origins of the metafemoral spring and rejects the monophyly of the Alticinae. In a subsequent phylogenetic study based on the same molecular markers in 165 species across 158 genera of leaf beetles has supported the distinctiveness of Alticinae and Galerucinae, which justified their classification into two distinct lineages (Ge et al., 2012). Recently, combined nuclear rRNA genes with mitochondrial genomes (mitogenomes), Nie et al. (2018) inferred their phylogenetic relationships using different methods and dataset. The results confirmed that the Galerucini and Alticini are reciprocally monophyletic sister groups. Considering the inconsistencies in these studies, more empirical data will be helpful to further clarify the phylogenetic relationships of this important insect clade.
Mitogenome is a double-stranded circular DNA molecule with relatively conserved composition and size across metazoans (typically ranges from 14 kb to 20 kb in length), consisting of 13 protein-coding genes (PCGs), 22 transfer RNA (tRNA) genes, two ribosomal RNA (rRNA) genes, and a control region (CR) (Boore, 1999; Cameron, 2014). Over the past decade, mitogenome is a widely utilized source of genetic data for animal species identification, molecular phylogeny, phylogeography, and evolutionary research at various taxonomic scales (Du et al., 2019; Guo et al., 2023). However, the sequencing of mitogenomes of Galerucinae is very limited. Up to now, only 124 complete or partial mitogenome sequences of Galerucinae have been deposited in GenBank (accessed on 5 July 2024). These few mitogenomes significantly restrict the capacity for phylogenetic inferences of the Galerucinae.
The CR is involved in the initiation and regulation of transcription and replication of the mitogenome (Zhang et al., 1995; Ji et al., 2019; Xu et al., 2023a). Previous studies have found that the CRs in insects are primarily rich in adenine and thymine (Huang et al., 2023a, Huang et al., 2023b; Xu et al., 2023b). And it is largely responsible for the variation in the DNA sequence and size of the mitogenome (Xu et al., 2021). Due to its high variability, reduced selective pressure, and strong compatibility across taxa, the CR has become a powerful and novel marker to explore evolutionary biology issues in insects, outperforming conventional mitochondrial markers (Vila and Björklund, 2004; Li and Liang, 2018; Dong et al., 2021). However, the understanding of the evolutionary patterns of CR in Galerucinae remains poorly understood.
In the present study, we used next-generation sequencing determined five complete mitogenomes from Galerucinae. Subsequently, we investigated their nucleotide composition, codon usage, relative synonymous codon usage (RSCU) and evolutionary rate of PCGs. The phylogenetic relationship of Galerucinae also been inferred by gathering mitogenomes of 97 species from GenBank and our newly sequenced five mitogenomes. Furthermore, under the context of mitogenome-based phylogeny, we study the evolutionary patterns of these CRs, enhancing our understanding of characteristics and phylogeny of Galerucinae mitogenome sequences.
2 Materials and methods
2.1 Sample collection and DNA extraction
The voucher specimens of 5 adult leaf beetles were preserved in anhydrous ethanol and stored in a refrigerator at -20°C before DNA extraction. All specimens were collected from tobacco fields and detailed collection information is provided in Supplementary Table S1. After being identified based on morphological characters, the genomic DNA was extracted using DNeasy Blood and Tissue kit (Qiagen, Germany) on the basis of the manufacturer’s protocol, and the voucher specimen was stored at Entomological Museum of China Agricultural University.
2.2 Mitogenome sequencing and assembly
The Illumina TruSeq library was prepared with an average insert size of 350 bp and sequenced with the paired-end reads length of 150 bp on Illumina NovaSeq 6000 platform (Berry Genomic, Beijing, China). A total of 6 Gb raw data was obtained. We used Prinseq version 0.20.4 (Schmieder and Edwards, 2011) to remove short and low-quality reads with the poly-Ns > 15 bp, or > 75 bp bases with quality score < 3. The remaining reads were de novo assembled using IDBA-UD (Peng et al., 2012), with minimum and maximum k values of 41 and 141 bp, respectively. The DNA barcode regions of each species (~658 bp) were amplified by the following primer pair LCO1490/HCO2198. PCR cycling condition was: 95°C for 1 min, 40 cycles of 95°C for 20 s, 50°C for 50 s, and 68°C for 1.5 min, followed by 72°C for 5 min. The PCR products were sequenced by Sanger sequencing at Tsingke Biotechnology (Beijing, China). To identify the corresponding mitogenome assemblies, the assembled contigs were searched with COX1 sequence using BLAST with at least 98% similarity. To investigate the assembled accuracy and sequencing depth, clean reads were mapped using Geneious version 10.1.3 (Kearse et al., 2012). Finally, we obtained five complete circular mitogenomes.
2.3 Mitogenome annotation and nucleotide composition analysis
All five mitogenome sequences were preliminarily annotated by MitoZ (Meng et al., 2019) and accurately corrected in Geneious. The locations and secondary structures of tRNA genes were determined by tRNAscan-SE search server (Lowe and Eddy, 1997) and ARWEN version 1.2 (Laslett and Canbäck, 2008). PCGs and rRNA genes were identified by alignment with homologous genes of other Galerucinae species, and the secondary structure of rRNAs was predicted by RNAfold WebServer Version 2.4.18 (Lorenz et al., 2011) online platform. The control region of each species was confirmed by mapping the read sequences to the mitogenome with a depth > 1,000×. The circular mitogenome maps with A + T content and G + C content were generated using Geneious (Kearse et al., 2012). The nucleotide composition of mitogenome and relative synonymous codon usage (RSCU) of PCGs were analyzed by MEGA version 7.0 (Kumar et al., 2016). Nucleotide compositional differences were calculated by the formulae: AT skew = (A – T)/(A + T) and GC skew = (G - C)/(G + C) (Perna and Kocher, 1995). The tandem repeat units of the control region were identified using the Tandem Repeats Finder server (https://tandem.bu.edu/trf/home, accessed on 5 July 2024) (Benson, 1999).
2.4 Phylogenetic analysis
The phylogenetic analysis of Galerucinae was performed by merging 92 mitogenomes published in GenBank and our newly determined 5 mitogenomes. Chrysomela vigintipunctata and Gonioctena intermedia from Chrysomelinae, as well as Physosmaragdina nigrifrons and Cryptocephalus dimidiatipennis from Cryptocephalinae were selected as outgroups, according to a prior study (Douglas et al., 2023) (Supplementary Table S2).
All 13 PCGs of each mitogenome were aligned separately using the L-INS-I strategy of the MAFFT algorithm (Katoh and Standley, 2013) implemented in TranslatorX (Abascal et al., 2010). Two rRNA genes were aligned individually using the G-INS-I strategy of MAFFT version 7.0 online server (Katoh and Standley, 2013). All alignments were checked manually in MEGA (Kumar et al., 2016). Gene fragments were imported into Geneious and concatenated into two datasets: (1) the PCGRNA matrix with 13,499 nucleotides, corresponding to 13 PCGs and two rRNA genes; and (2) the PCG12RNA matrix with 9,881 nucleotides, corresponding to the first and second codon positions of the 13 PCGs and two rRNA genes.
Both datasets were analyzed under the strategy of Bayesian inference (BI) and maximum-likelihood (ML). The BI phylogenetic trees were recovered using PhyloBayes MPI version 1.5a (Lartillot et al., 2013) under the site-heterogeneous mixture CAT + GTR model (Tavare, 1986; Lartillot and Philippe, 2004). The Markov Chain Monte Carlo chains were run independently after removing constant sites from the alignment and were stopped after the two runs had satisfactorily converged (maxdiff < 0.1). A consensus tree was yielded from the remaining trees after discarding initial 25% trees of each run as “burn-in”. The ML phylogenetic trees were recovered using IQ-TREE web server (Trifinopoulos et al., 2016), with automatic model prediction and 1000 ultrafast bootstrap replicates.
2.5 Divergence time estimation
A Bayesian algorithm of MCMCTree in PAML 4.9j (Yang, 2007) package was implemented to estimate divergence times within Galerucinae with the molecular clock under the auto-correlated rates model. We used the topology generated by PCRRNA and ML method as the fixed tree for subsequent analysis. The Dirichlet-gamma prior to the overall substitution rate (rgene gamma) was set to G (1, 1.72), calculated by baseml.
Divergence time estimation was performed based on three vetted internal calibrations nodes. The root age for the divergence between Alticini and Galerucini was set to 102.21 million years ago (Ma) according to the results of Nie et al. (2021). The fossil Theonenosa nigripennis served as the calibration node for the tribe Galerucini with the upper- and lower-bound was assigned to 99.4 and 98.2 Ma following the recommendation of Nie et al. (2021). The maximum- and minimum-bound values of fossil record (15.97-20.44 Ma), Altica tholimorpha provided by the Paleobiology Database (https://paleobiodb.org/) was assigned to the crown node of Altica. MCMCTree analyses used two independent MCMC chains with a 1,000,000 generation burnin, subsequently sampling every 100 generations until 10,000 samples were collected. To further ensure convergence, effective sample size (ESS) values of parameters were calculated for the combined results in Tracer v1.7.1 (Rambaut et al., 2018).
3 Results and discussion
3.1 Mitogenomic organization and nucleotide composition
We obtained complete mitogenomes of five leaf beetles (GenBank accession number PQ038342-PQ038346) (Figure 1; Supplementary Tables S3–S7). The mitogenomes of these leaf beetles ranged in size from 15,737 (O. maculatus) to 16,484 bp (Euphitrea sp.) and included conventional 37 coding genes (13 PCGs, two rRNAs, and 22 tRNAs) and a control region (CR). Four PCGs (ND5, ND4, ND4L and ND1), eight tRNA genes (trnQ, trnC, trnY, trnF, trnH, trnP, trnL(CUN) and trnV) and two rRNA genes (srRNA and lrRNA) were encoded on the minority strand (N-strand) while the other 23 genes were encoded on the majority strand (J-strand). The gene orders of mitogenomes of five leaf beetles were consistent with the ancestral gene order of Drosophila yakuba, which is thought to be the putative ancestral pattern of insect mitogenomes (Clary and Wolstenholme, 1985; Boore, 1999). The AT content of the five complete mitogenomes of Galerucinae varied from 77.7% in Altica sp. to 80.9% in O. maculatus (Table 1), suggesting a strong AT bias, similar to that observed in other mitogenomes of leaf beetles (Wang et al., 2019; Li et al., 2023). The five mitogenomes all exhibited a positive AT skew, ranging from 0.063 (O. bowringii) to 0.033 (Euphitrea sp.), and a negative GC skew, varying from -0.234 (Euphitrea sp.) to -0.107 (O. maculatus) (Table 1), indicating that the nucleotide composition was significantly biased toward A and C.
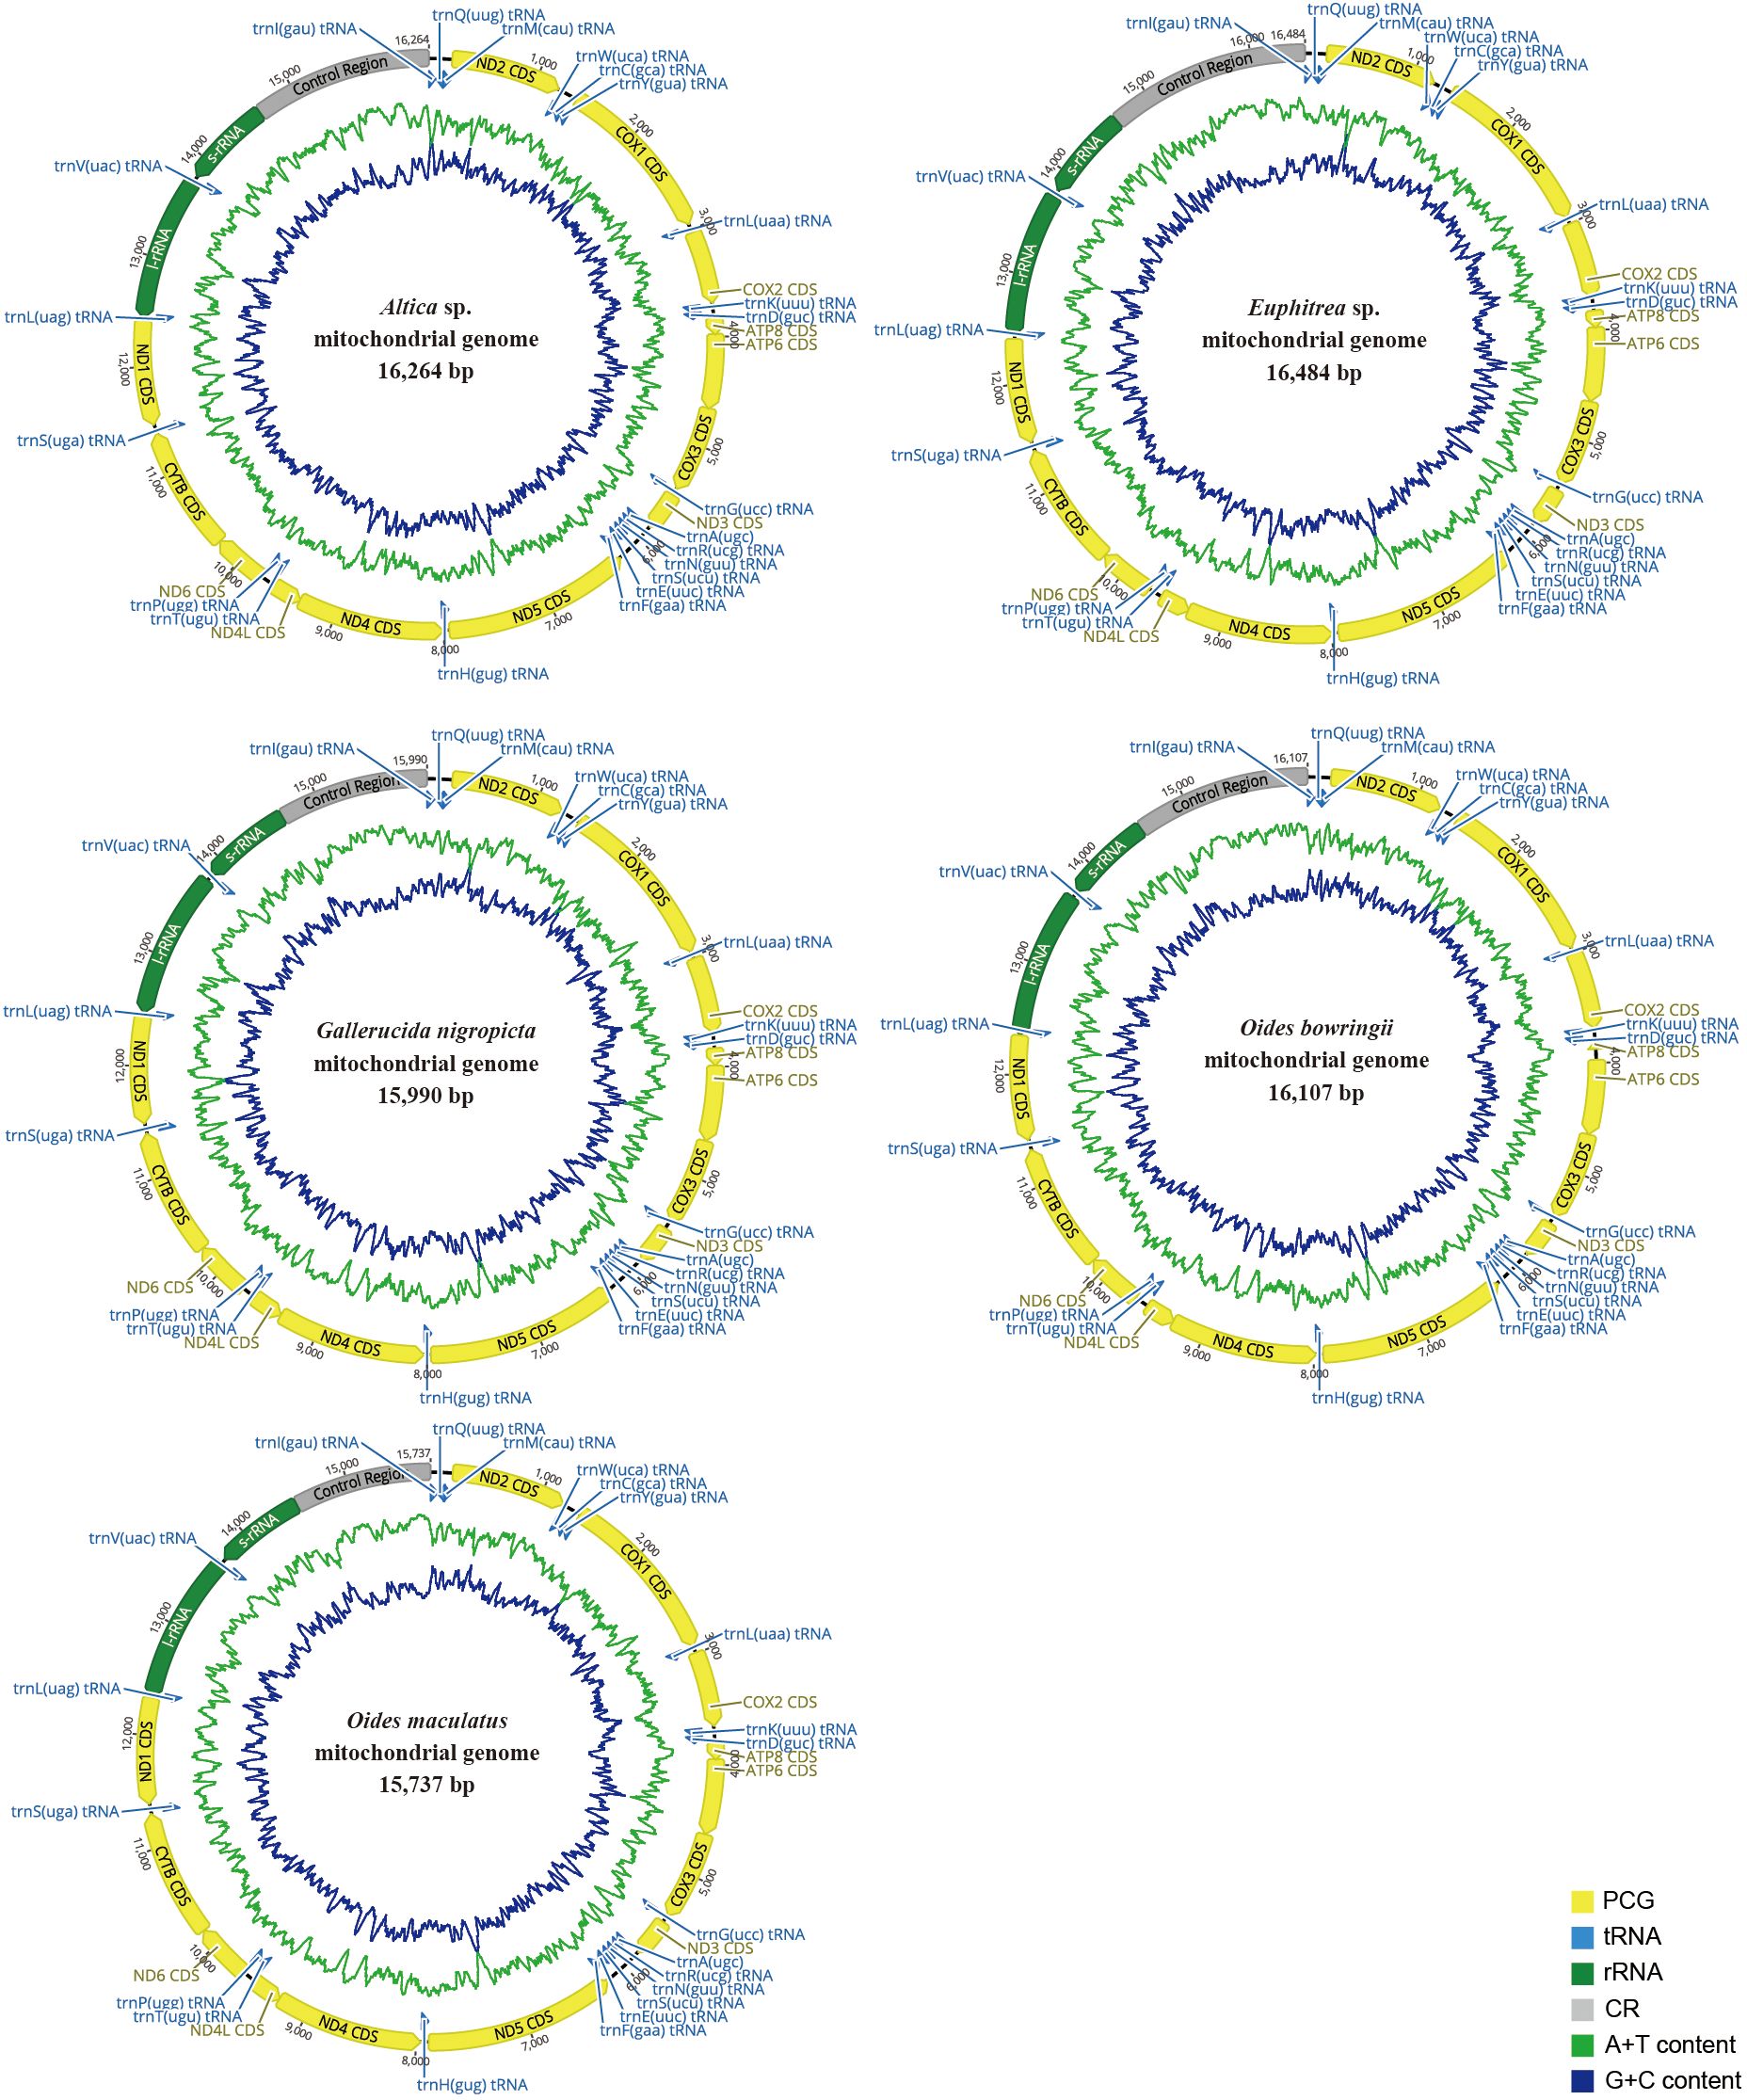
Figure 1. Circular organization maps of the five mitochondrial genomes of Galerucinae. Orientation of gene transcription is indicated by the arrows. Protein‐coding genes (PCGs) are shown as yellow arrows, transfer RNA (tRNA) genes as blue arrows, and ribosomal RNA (rRNA) genes as green arrows. The green line in the circle shows the A + T content, and the blue shows the G + C content.
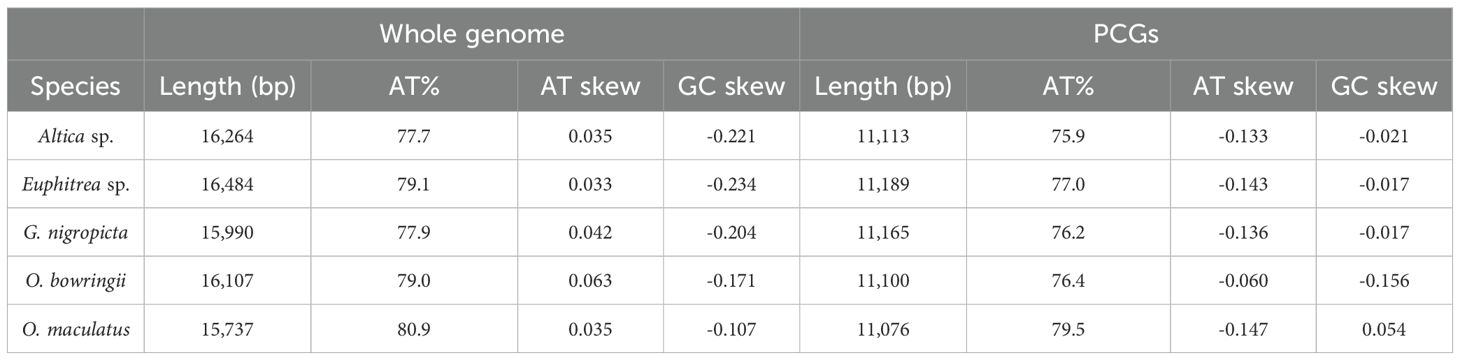
Table 1. Nucleotide compositions of the five complete mitochondrial genomes of Galerucinae.
3.2 PCGs and codon usage
All newly sequenced Galerucinae mitogenomes comprised 13 PCGs (ND4, ND4L, ND5, and ND1 coded on the N-strand and COX1, COX2, COX3, CYTB, ATP6, ATP8, ND2, ND3, and ND6 coded on the J-strand). The total length of these 13 PCGs ranged from 11,076 bp (O. maculatus) to 11,189 bp (Euphitrea sp.), and the A + T content of PCGs ranged from 75.9% (Altica sp.) to 79.5% (O. maculatus) (Table 1). The mean A + T content of PCGs (77.1%) were slightly lower than that of the whole mitogenome (78.9%). The AT skew (-0.147 to -0.060) indicated a bias towards T in the nucleotide composition of PCGs, which was different from that of the whole genome (Table 1). Additionally, the GC skew of PCGs in the five Galerucinae species ranged from -0.156 to 0.054 (Table 1). The negative AT skew was consistent in all three codons, while the positive GC skew was consistent in the first codon and the negative GC skew in the third codon of PCGs across five leaf beetles (Supplementary Table S8).
We calculated the RSCU values, and found the six most prevalent codons UUA, GUU, GGA, UCU, CGA and GCU were mainly composed by T and/or A (Figure 2). At the third codon position, A or T were overrepresented in PCGs. The biased usage of A + T nucleotides was reflected in codon frequencies. The codon usage pattern of five newly sequenced mitogenomes was similar to the pattern found in previously reported Galerucinae species (Li et al., 2023). In five leaf beetles, all 13 PCGs were initiated with ATN as the start codon (eight with ATA, six with ATC, 27 with ATG and 21 with ATT), except for ND1 in G. nigropicta, O. bowringii and O. maculatus, which used TTG as the start codon (Supplementary Tables S3–S7). The complete stop codon TAA and TAG was most widely assigned to ten PCGs, while single T and TA residue were found in COX2 and ND4 respectively as incomplete stop codons (Supplementary Tables S3–S7), and the stop codons are presumed to be completed through post-transcriptional polyadenylation (Stewart and Beckenbach, 2009; Zhao et al., 2023).
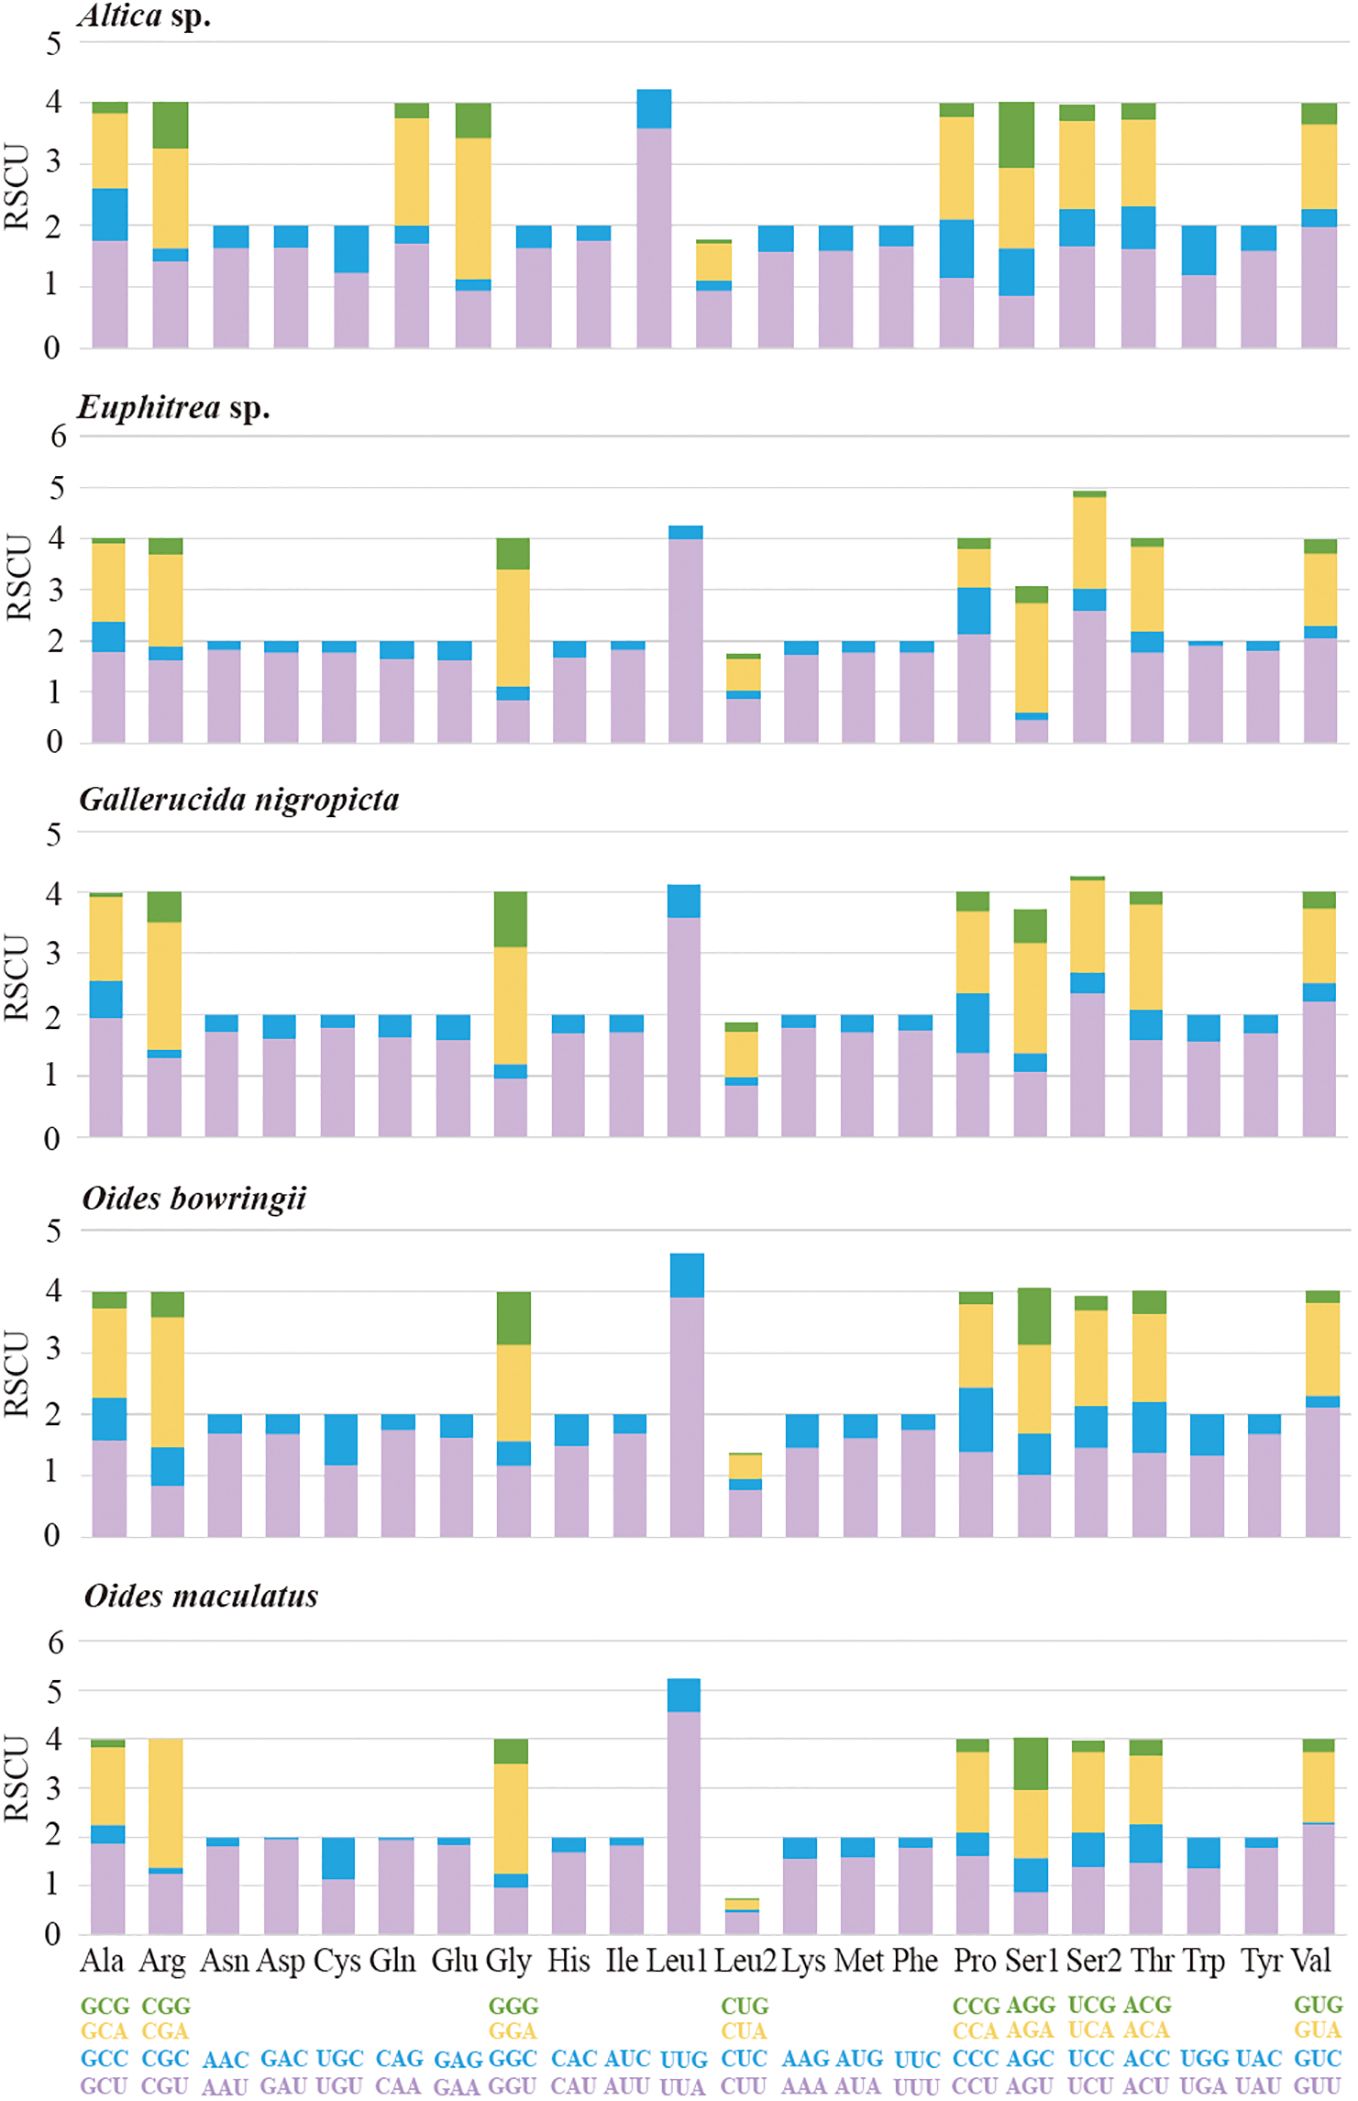
Figure 2. Relative synonymous codon usage (RSCU) of the mitochondrial genomes of five Galerucinae species. The stop codon is not included. Codon families are provided in boxes below the x-axis, and the values of RSCU are shown on the y-axis.
To analyze the evolutionary rate of PCGs, we calculated the nonsynonymous substitution rate (Ka), synonymous substitution rate (Ks), and the ratio of Ka/Ks for each PCG in five Galerucinae species (Figure 3). The highest average Ka value was observed in ATP8, whereas ND2 exhibited the highest Ks value. The average Ka/Ks value ranged from 0.092 (COX1) to 1.065 (ATP8). All Ka/Ks ratios were lower than 1 except for ATP8, indicating that mutations in these PCGs were primarily exchanged through synonymous substitutions and evolved under purifying selection. On average, the Ka/Ks value of ATP8 was greater than 1, indicating that positive selection played a predominant role in the evolution of ATP8 gene. In contrast, COX1 exhibited the lowest evolutionary rate, and underwent the strongest purifying selection. The analysis revealed that almost all the genes mitochondrial functional genes in Galerucinae have been influenced by purifying selection and only one by positive selection, with none evolving neutrally. The phenomenon was also reported in other Galerucinae species or insect groups (Huang et al., 2025; Li et al., 2023; Liu et al., 2025).
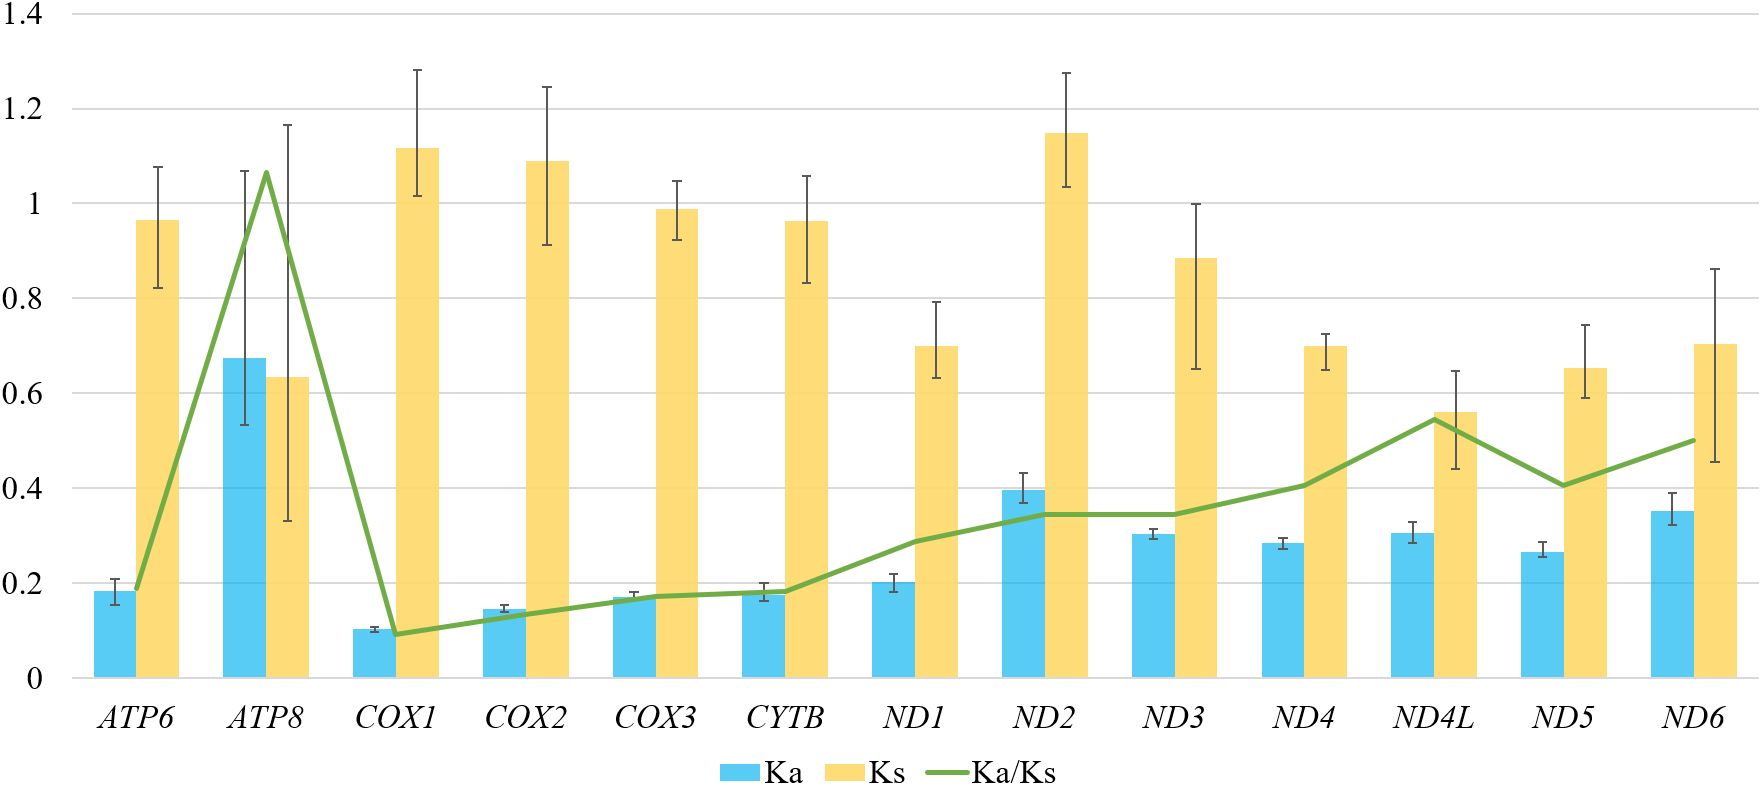
Figure 3. The evolutionary rates of 13 protein-coding genes calculated among the five Galerucinae species. The blue and yellow boxes represent the non-synonymous substitutions rate (Ka) and the synonymous substitutions rate (Ks), respectively. The Ka/Ks value is indicated by the green line.
3.3 tRNA and rRNA genes
Twenty-two typical tRNA genes were identified in the five mitogenomes of Galerucinae. The mean length of tRNAs varied from 64.4 bp (O. maculatus) to 65.7 bp (Euphitrea sp.) (Supplementary Tables S3–S7). The longest tRNA is trnK of Altica sp. and Euphitrea sp., whereas the shortest tRNA is trnR of O. maculatus. All tRNAs could be folded into a typical clover-leaf structure, except for trnS(AGN), where the dihydrouridine (DHU) arm forms a simple loop (Supplementary Figure S1). The structure is commonly found in other beetles’ mitogenomes (Li et al., 2023; Huang et al., 2023b; Zhao et al., 2025). The lrRNAs of Galerucinae mitogenomes were located between trnV and trnL(CUN), and srRNAs were located between trnV and the CR. The lengths of lrRNA genes ranged from 1,265 (O. bowringii) to 1,284 bp (Euphitrea sp.), and those of srRNAs ranged from 793 (O. bowringii) to 826 bp (Euphitrea sp.). The mean AT content of lrRNAs is 82.9%, and the mean AT content of srRNAs is slightly lower at 81.9%.
3.4 Control region
As an indispensable noncoding fragment, the CR of mitogenome initiates the transcription and replication (Zhang et al., 1995; Ji et al., 2019). The CR of five mitogenomes of Galerucinae was located between srRNA and trnI, ranging in size from 1,220 bp (O. maculatus) to 1,836 bp (Euphitrea sp.) (Supplementary Tables S3–S7). The A + T content was ranged from 84.3% (Altica sp.) to 88.7% (O. maculatus), with mean AT skew of 0.025 and mean CG skew of -0.309. The CRs of insect mitogenomes comprise several structural elements (tandem repeat sequences, poly-T regions, GA-rich regions, and replication origin sequences etc.), that lack evident patterns of conservation. We analyzed the CRs of five Galerucinae species and identified their structural elements. The tandem repeats and poly-T regions were all found in five CRs, while the poly-A regions were only found in O. maculatus (Figure 4). Two types of tandem repeat regions were present in Altica sp., with lengths of 314 bp and 77 bp, and three poly-T regions were found between these tandem repeat regions. In Euphitrea sp., three tandem repeat regions were identified, with repeat units of 72 bp, 35 bp, and 22 bp, each containing three units. Three poly-T regions were located between the first and second tandem repeat regions, and another poly-T region was situated between the third repeat region and trnI. The CR of G. nigropicta contained only one 40 bp repeat region and one 16 bp poly-T region. In O. bowringii, three tandem repeat regions with lengths of 185 bp, 95 bp and 77 bp were identified, and there were four poly-T regions interspersed between them. In O. maculatus, four tandem repeats were found, along with three poly-T regions. Additionally, there were two poly-A regions each 10 bp in size, located between the third and fourth tandem repeats, and between the fourth tandem repeat and trnI, respectively. The tandem repeat regions, poly-T regions, and poly-A regions are commonly found in the CRs of insect mitogenomes (Huang et al., 2023a; Xu et al., 2021; Li et al., 2023). The variability in the number and length of structural elements, particularly tandem repeats, results in significant differences in the CR among species. These characteristics were then proposed as novel and reliable markers for studies in phylogenetics and evolution (Zhang et al., 1995; Li and Liang, 2018).
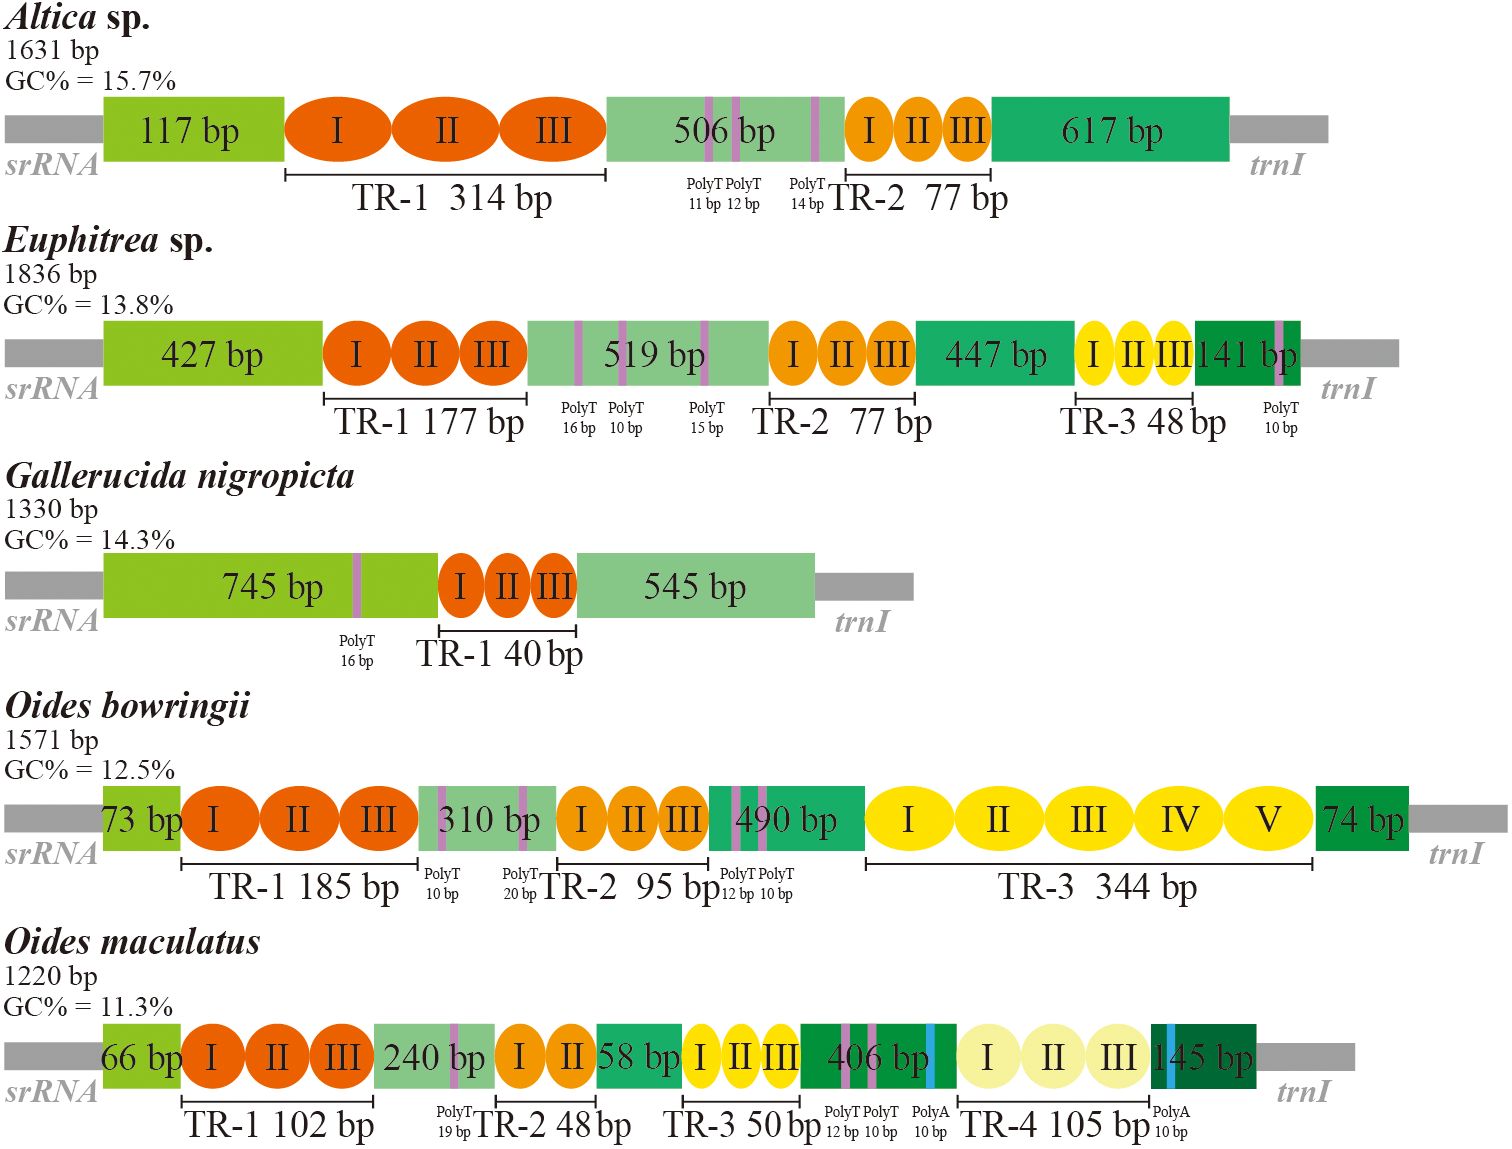
Figure 4. Organization of the control regions in the complete mitochondrial genomes of five Ga-lerucinae species. Gray blocks represent the srRNA and trnI genes. The orange and yellow blocks indicate the tandem repeats. The purple and blue blocks denote the poly-T and poly-A regions, respectively. TR: tandem repeats.
3.5 Phylogenetic analysis and evolutionary patterns of control region
The phylogenetic studies of Galerucinae were conducted based on the two datasets using BI and ML approaches yield broadly consistent topology with high node support values in Galerucinae (Figure 5). The subfamily Galerucinae has been split into two tribes, the Alticini and Galerucini (Bouchard et al., 2011). Both Alticini and Galerucini were inferred as monophyletic groups, exhibiting strong sister-group relationships supported by high Bayesian posterior probabilities (BPP = 1/1) and ML bootstrap values (BSV = 83) inferred from PCG12RNA, but moderately supported by ML analysis based on PCGRNA dataset (BSV = 65). The phylogenetic relationships were congruent with those of previous studies (Nie et al., 2018; Douglas et al., 2023; Li et al., 2023). Within the tribe Alticini, the high consistency of topological structures obtained from various methods and data sets indicates the robustness and reliability of the results. Specifically, the cluster (Altica group + (Blepharida group + Nisotra group)) was observed to form sister groups with other groups of Alticini. This finding is consistent with previous studies based on 13 PCGs of mitogenome and nuclear genes, including 18S, 28S-D2, and 28S-D3 regions (Nie et al., 2018). Furthermore, the sister relationship between the Sphaeroderma group and the Chabria group recovered in our results was also supported by research conducted by Nie et al. (2018). However, in an earlier study, the Sphaeroderma group formed a sister group with the Nisotra group by analyzing the lrRNA and nuclear genes 18S and 28S (Ge et al., 2012).
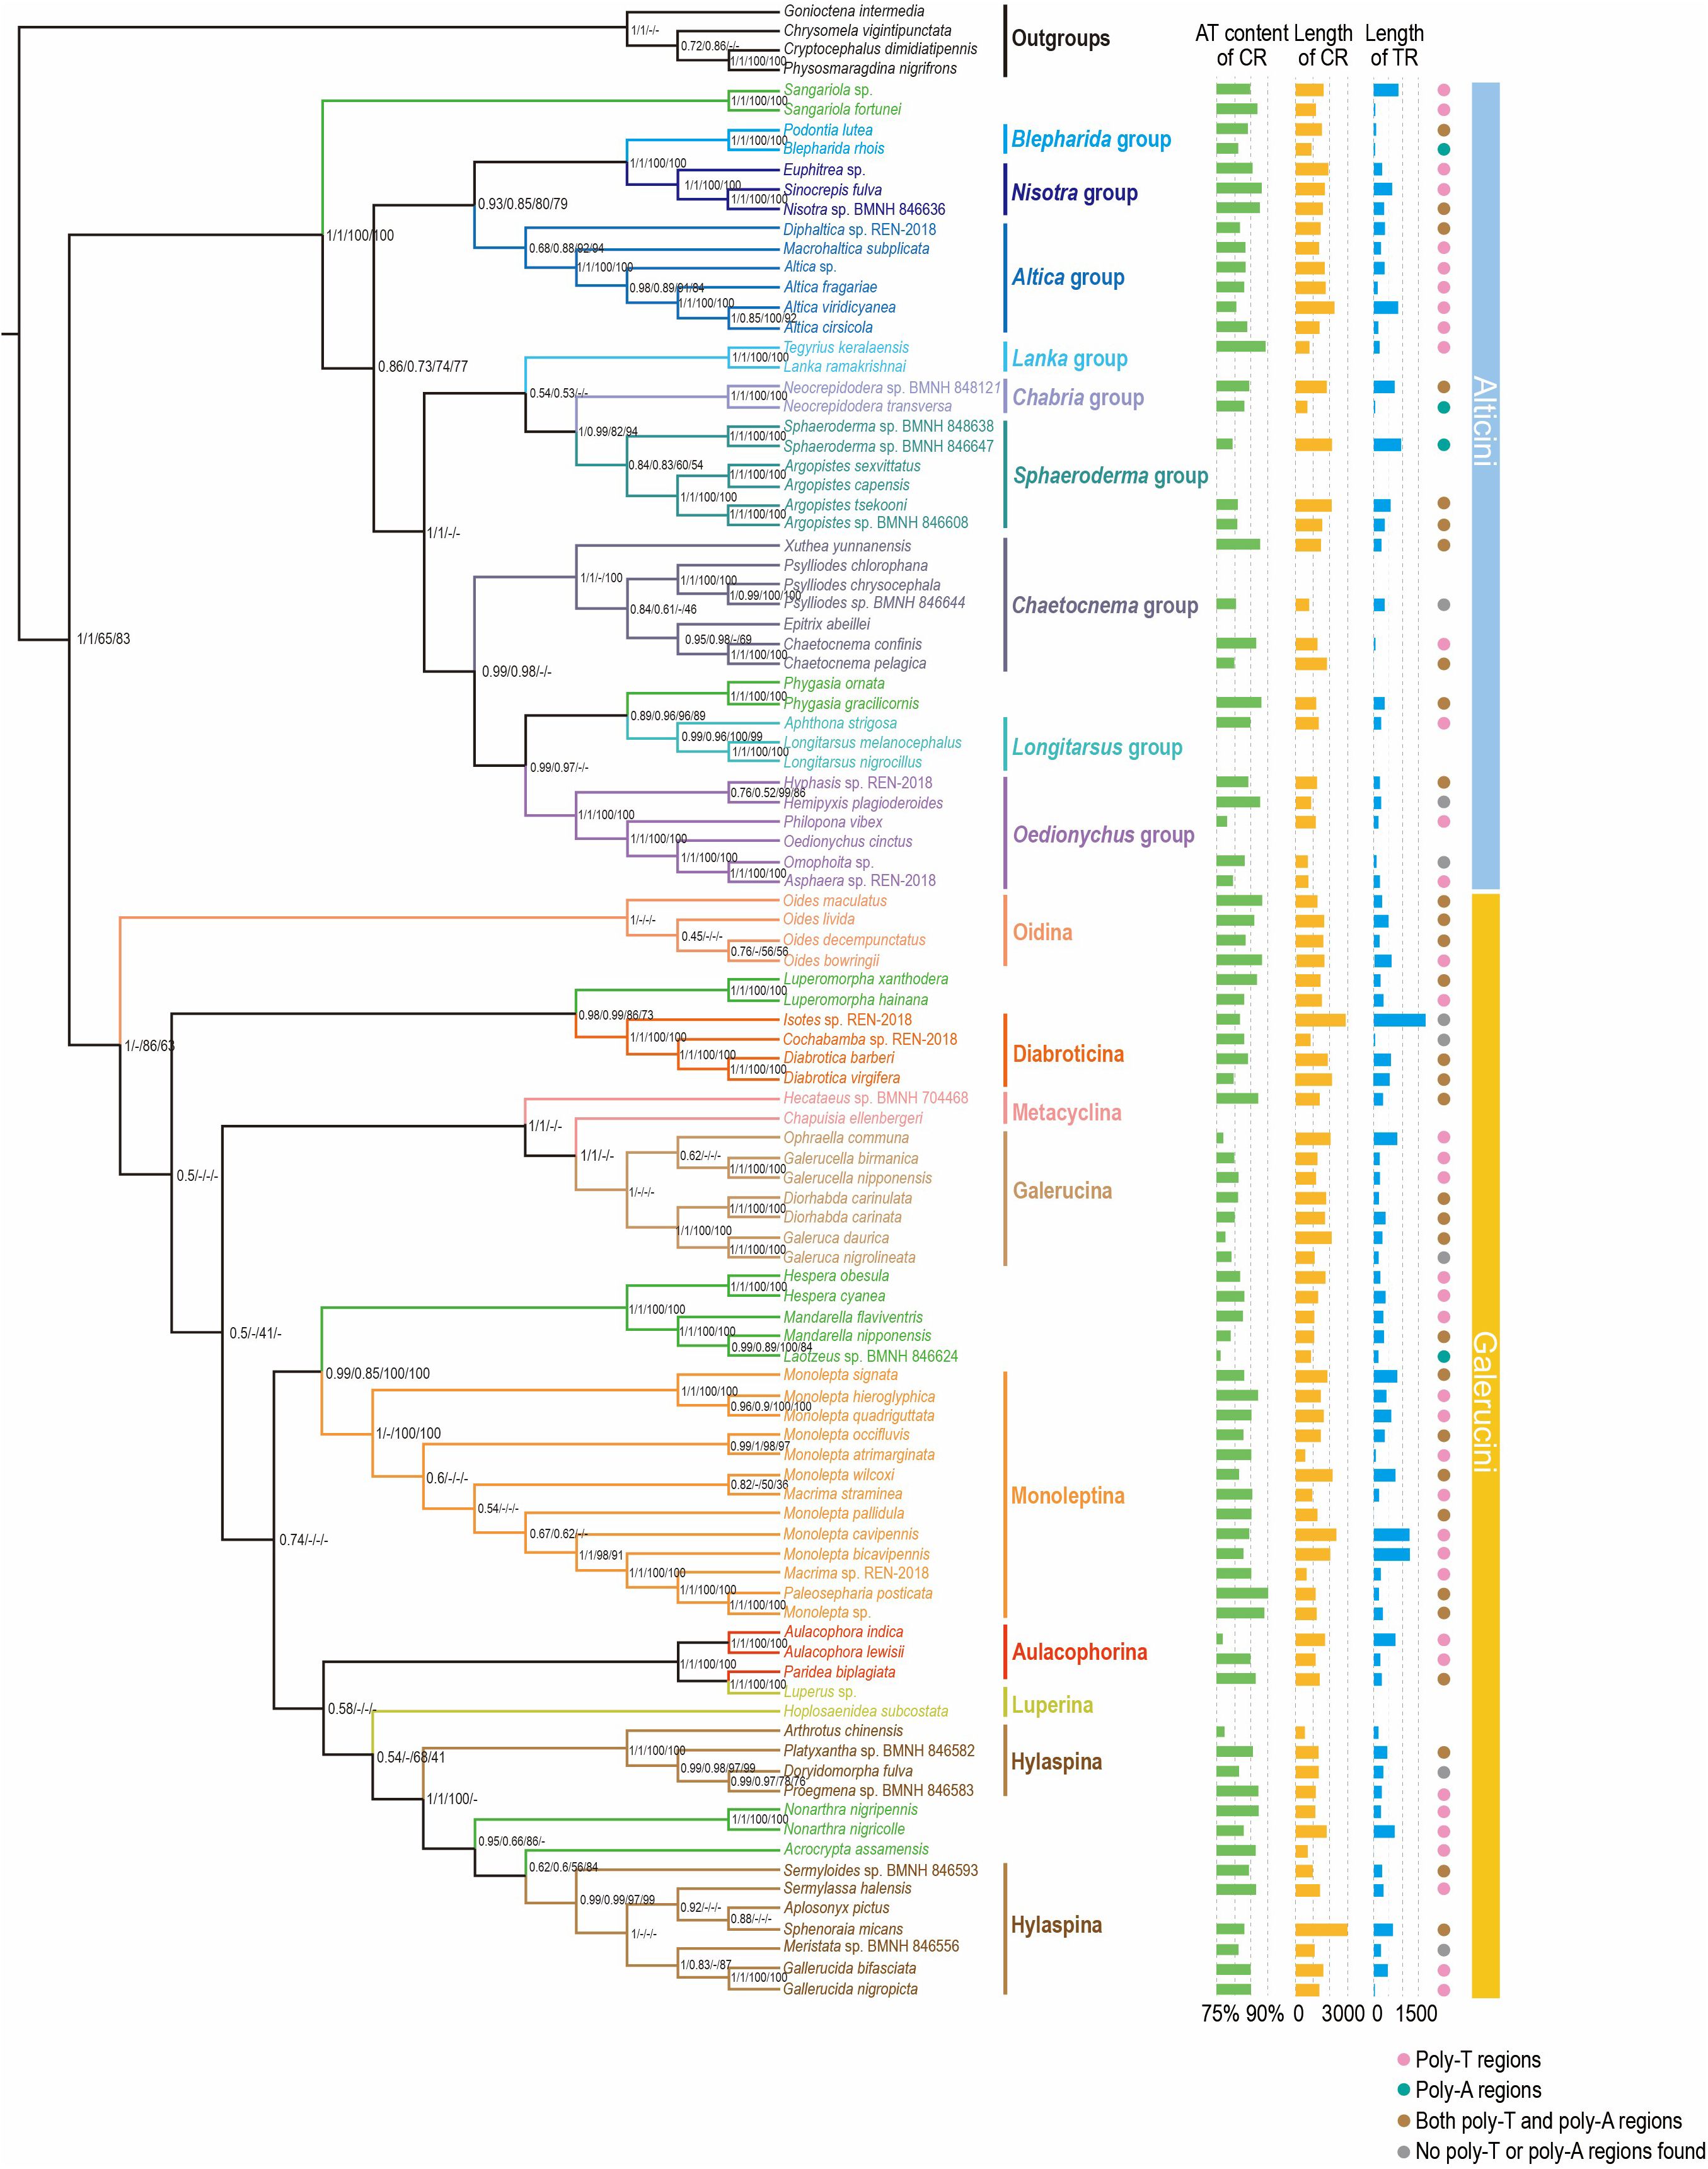
Figure 5. Phylogenetic tree of Galerucinae inferred via PhyloBayes and maximum likelihood (ML) analyses based on the PCGRNA and PCG12RNA datasets. The nodal support (from left to right) indicates the Bayesian posterior probabilities of PCGRNA/PCG12RNA and ML bootstrap values of PCGRNA/PCG12RNA. “-” indicates node support values below 0.50. The clades in green represent the “problematic” genera mentioned in previous studies. The AT content and length of control re-gion (CR) and length of tandem repeats (TR) have been mapped onto the tree, and the presence of poly-A/poly-T regions has also been marked.
Within the tribe Galerucini, all analyses recovered the subtribes Oidina, Diabroticina, Galerucina and Monoleptina as monophyletic, whereas the subtribes Metacyclina, Aulacophorina and Luperina were paraphyletic. Both of genera Nonarthra and Acrocrypta were nested in the tribe Hylaspina, which is consisted with previous study (Nie et al., 2018). Metacyclina consistently grouped with Galerucina despite the limited taxon sampling (Nie et al., 2018; Ge et al., 2011; Gillespie et al., 2004). The subtribe Oidina formed a monophyletic clade, branching at the base of Galerucini and constituting sister groups with the rest of the Galerucini, which was similar to previous findings (Li et al., 2023). In addition, within the six-subtribe classification system, the subtribe Luperina was found to be paraphyletic (Gillespie et al., 2004; Ge et al., 2011), and it was subsequently split into three subtribes: Aulacophorina, Diabroticina and Monoleptina based on mitochondrial protein-coding and nuclear genes (Ge et al., 2011). In our analysis, only the monophyly of Diabroticina and Monoleptina was supported, the subtribe Luperina and Aulacophorina were still recovered as paraphyletic. Therefore, we considered that the phylogenetic relationships within the subtribe Luperina still need to be discussed prudently with the addition of more samples and molecular markers. In addition, regarding the classification of the Alticini and Galerucini, some genera are considered “problematic” (see green clades in Figure 5) as their placement is not easily determined based on the presence or absence of the metafemoral extensor tendon (MET) (Seeno and Wilcox, 1982; Furth and Suzuki, 1994; Ge et al., 2012). All analyses in our study supported that “problematic genera” Sangariola and Phygasia were included in Alticini, and Luperomorpha, Hespera, Mandarella, Laotzeus, Nonarthra and Acrocrypta were grouped in Galerucini with high support. The result was in line with the previous research based on different molecular data (Ge et al., 2011; Nie et al., 2018).
In order to further understand the evolutionary modes of the CR in Galerucinae, we calculated the AT content and the CR length across 82 species of Galerucinae with complete CR (Supplementary Table S9). Additionally, we investigated structural features in CRs such as tandem repeats, poly-A, and poly-T regions. These findings were then mapped onto phylogenetic trees to provide insights into their evolutionary patterns (Figure 5). The CR in Galerucinae exhibited significantly high AT contents, varying from 77.6% in Laotzeus sp. to 90.3% in Paleosepharia posticata (Supplementary Table S9). The average AT content of CR in Alticini (88.4%) was higher than Galerucini (87.8%), while the variation in AT content was lower in Alticini than in Galerucini. The length of CR exhibited obvious variation among species within subfamily Galerucinae, ranging from 512 bp in Arthrotus chinensis to 2,909 bp in Sphenoraia micans (Supplementary Table S9). The average length of the CR in Alticini (1,348.6 bp) was shorter than that in Galerucini (1,409.4 bp), and the variation in CR length was also less in Alticini.
Many CRs contain tandem repeats, which are associated with the initiation and termination of transcription in mitogenomes (Ji et al., 2019). Previous studies have found that tandem repeats are present in the mitogenomes of various insect groups (Huang et al., 2023a; Li et al., 2023), and that variations in the size and copy number of these tandem repeat units lead to differences in CR sequence length, resulting in heteroplasmy of mitochondrial molecules (Zhang et al., 1995; Oliveira et al., 2007; Huang et al., 2023a). Tandem repeats were observed in 79 out of 82 complete CR sequences, excluding Chaetocnema pelagica from Alticini and two species from Galerucini: Acrocrypta assamensis and Monolepta pallidula (Figure 5). The length of tandem repeats ranged from 40 bp in G. nigrolineata to 1,897 bp in Isotes sp., and the average length of tandem repeats in Alticini (336.3 bp) was shorter than that in Galerucini (429.8 bp), which aligned with the general trend observed in CR lengths (Figure 5). The structural features, poly-A and poly-T regions, were found in 69 and 35 complete CRs, respectively. Both poly-A and poly-T elements simultaneously detected in the CRs of 31 Galerucinae species, including 21 species from the tribe Galerucini and 10 from the tribe Alticini (Figure 5). The poly-A and poly-T are considered to be the signal motifs for initiating mitogenome transcription and are commonly observed in insects (Liang et al., 2022).
In this study, we analyzed the evolutionary patterns of CR of the subfamily Galerucinae for the first time. As a novel molecular marker, the CR exhibits characteristics that offer significant potential for resolving the phylogenetic problems within the subfamily Galerucinae. The “problematic” genera Sangariola and Phygasia exhibited higher AT content compared to Luperomorpha, Hespera, Mandarella, Laotzeus, Nonarthra and Acrocrypta. This finding aligns with the observed trend of AT content between the Alticini and Galerucini tribes, thereby supporting the classification of these “problematic” genera. Furthermore, our results showed that the CRs of most Galerucinae species contained tandem repeats and the poly-A motifs, whereas fewer species contained poly-T motifs. These structural features were unique to each Galerucinae species, and varied significantly between tribes and even within genera. This result was also found in the CRs of other insects, with differences in the number and size of tandem repeats, even for different taxa that were closely related (Li and Liang, 2018; Huang et al., 2023a). By investigating the structural features of the CRs within the phylogenetic framework of Galerucinae, we found that species with TRs > 500 bp were more numerous in Galerucini than in Alticini. No tandem repeats greater than 100 bp in length were detected in the Blepharida group, whereas these tandem repeats were observed in the Nisotra group, which is a closely related sister clade to the Blepharida group. Similarly, poly-A motifs were found in CRs of Chabria and Sphaeroderma groups, but only poly-T motifs were found in the Lanka group, which forms a sister clade to the Chabria + Sphaeroderma groups. The diversity in length and structure organization of the CR was attributed to variations in specific structural elements, which enriched our understanding of the differences in CR structural organization within the economically significant insect groups. Despite our research currently being limited to the genetic level in examining the evolutionary features of CR, our discoveries still underscore the rich molecular diversity present within the subfamily Galerucinae. To gain a more comprehensive understanding, additional experiments are essential to elucidate the specific biological roles of the different elements within the CR.
3.6 Divergence time estimation
Divergence time estimates from MCMCTree are summarized in Figure 6. Based on three calibration nodes, the initial divergences within the Galerucinae were predicted to have occurred during the Middle Cretaceous period (102.69 Ma, 95%HPD: 100.34-105.23 Ma), which is very close to a previous analysis conducted by Nie et al. (2021). Our fossil-calibrated Chronogram also suggests a similar Middle Cretaceous origin of Alticini (96.56 Ma, 95%HPD: 92.65-99.88 Ma) and Galerucini (98.72 Ma, 95%HPD: 98.18-99.37 Ma), which are in line with a prior study (Nie et al., 2021). We found the main groups of Galerucinae diverged and occurred during the period from Middle Cretaceous to Middle Paleogene, indicating this period may serve as an important temporal interval for the diversification of Galerucinae. Flowing plants (angiosperms) diversified quickly during the Cretaceous period and the coordination of diversification between angiosperms and phytophagous beetles have been extensive proved (Nie et al., 2021; Zhang et al., 2018). Therefore, we speculate the extraordinary diversity of Galerucinae may be attributed to co-evolution with angiosperms. However, the studies regarding divergence time estimation within the Galerucinae are still limited hinders further comparison with other results. Based on mitogenomic data, we have provided an initial framework for exploring the internal evolutionary history of Galerucinae.
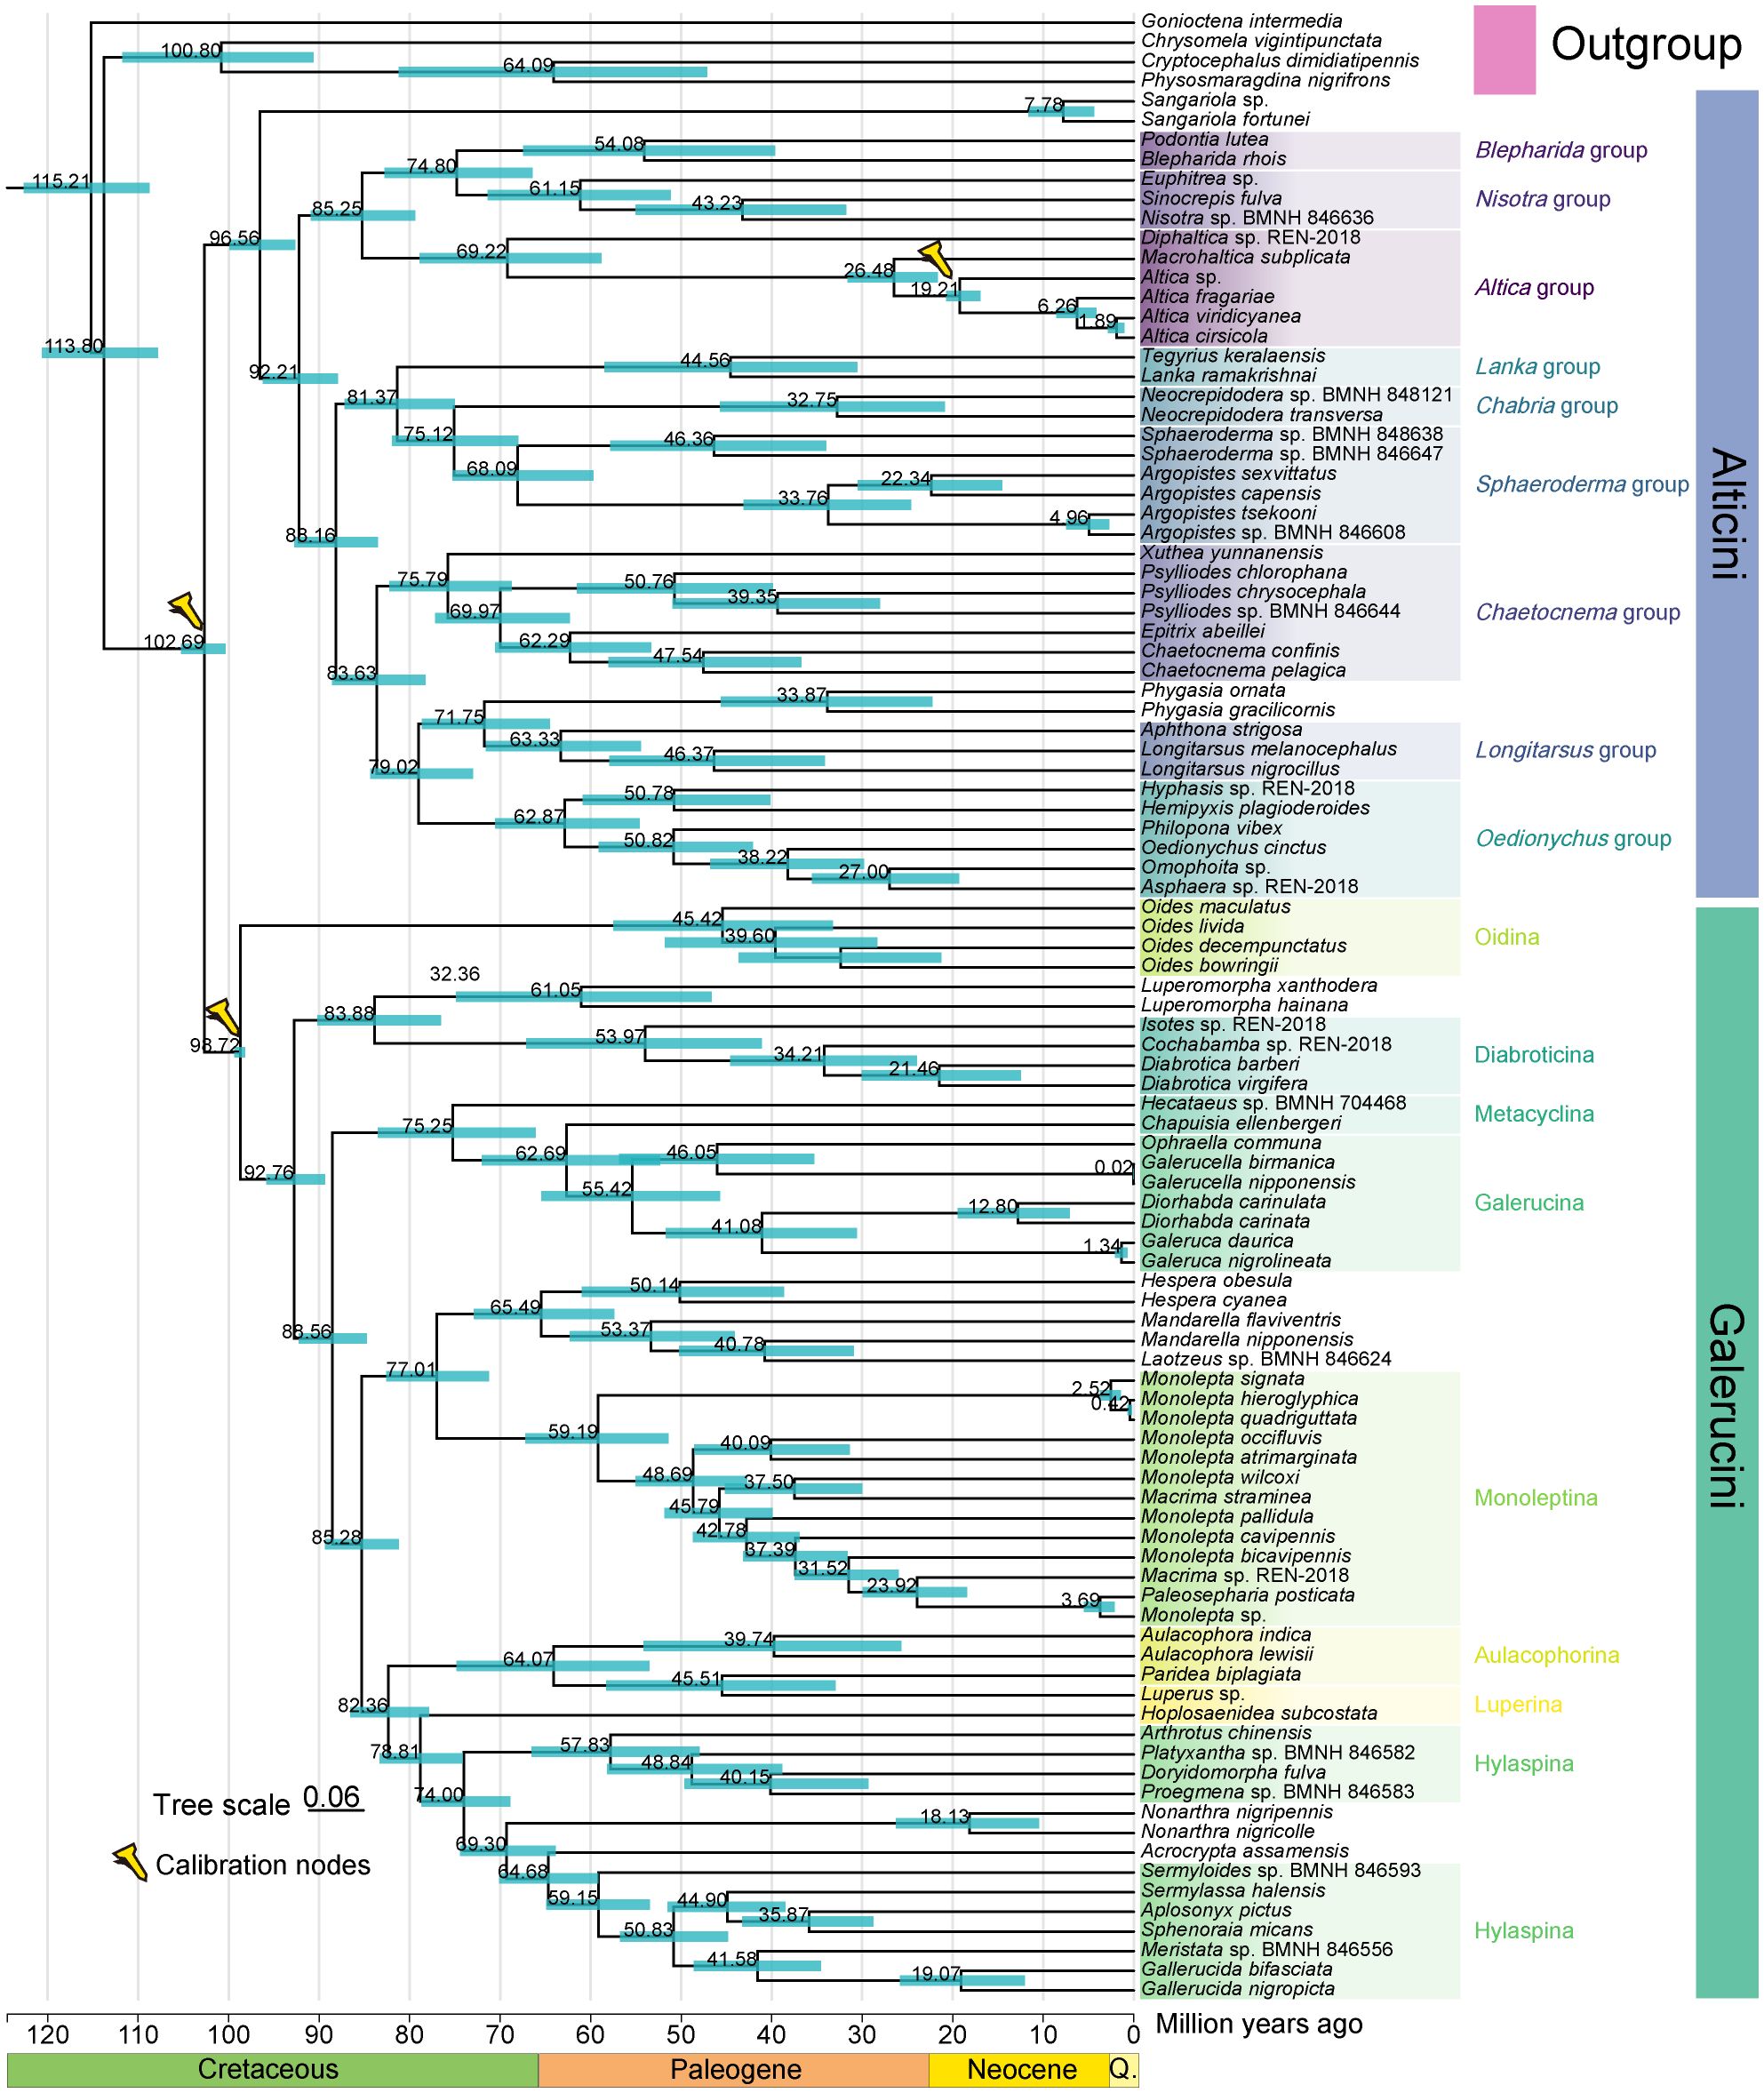
Figure 6. Time-calibrated phylogeny for Galerucinae. Divergence times were inferred in MCMCTree with three fossil calibration points. The tree topology is based on the results of the ML analysis and PCGRNA dataset. Nodes on the chronogram represent means of the probability distributions for node ages with time intervals for 95% probability of actual age represented as blue horizontal bars. Q. represents Quaternary.
Data availability statement
The datasets presented in this study can be found in online repositories. The names of the repository/repositories and accession number(s) can be found in the article/Supplementary Material.
Author contributions
SX: Conceptualization, Data curation, Formal analysis, Methodology, Writing – original draft, Writing – review & editing. PM: Conceptualization, Data curation, Formal analysis, Writing – original draft. QL: Data curation, Formal analysis, Writing – original draft. FS: Data curation, Formal analysis, Writing – review & editing. HY: Data curation, Formal analysis, Writing – original draft. ZX: Conceptualization, Funding acquisition, Project administration, Resources, Writing – original draft. WH: Conceptualization, Data curation, Supervision, Writing – original draft, Writing – review & editing.
Funding
The author(s) declare that financial support was received for the research and/or publication of this article. This study was supported by the China National Tobacco Corporation of Science and Technology Major Project (110202101049(LS-09)) and the Key Project of Science and Technology Plan of Yunnan Company of China National Tobacco Corporation (2022530000241019).
Acknowledgments
The authors thank the reviewers for their valuable comments. We are very grateful to Rui-E Nie from College of Life Sciences, Anhui Normal University for her identification of the specimens. Their computational resources were supported by the High-performance Computing Platform of China Agricultural University.
Conflict of interest
Author PM was employed by the company Henan Province Tobacco Company. Author HY was employed by the company Yunnan Tobacco Company.
The remaining authors declare that the research was conducted in the absence of any commercial or financial relationships that could be constructed as a potential conflict of interest.
Publisher’s note
All claims expressed in this article are solely those of the authors and do not necessarily represent those of their affiliated organizations, or those of the publisher, the editors and the reviewers. Any product that may be evaluated in this article, or claim that may be made by its manufacturer, is not guaranteed or endorsed by the publisher.
Supplementary material
The Supplementary Material for this article can be found online at: https://www.frontiersin.org/articles/10.3389/fevo.2025.1495703/full#supplementary-material
References
Abascal F., Zardoya R., Telford M. J. (2010). TranslatorX: multiple alignment of nucleotide sequences guided by amino acid translations. Nucleic Acids Res. 38, W7–W13. doi: 10.1093/nar/gkq291
Benson G. (1999). Tandem repeats finder: a program to analyze DNA sequences. Nucleic Acids Res. 27, 573–580. doi: 10.1093/nar/27.2.573
Boore J. L. (1999). Animal mitochondrial genomes. Nucleic Acids Res. 27, 1767–1780. doi: 10.1093/nar/27.8.1767
Bouchard P., Bousquet Y., Davies A., Alonso-Zarazaga M., Lawrence J., Lyal C., et al. (2011). Family-group names in coleoptera (Insecta). ZooKeys 88, 1–972. doi: 10.3897/zookeys.88.807
Bunnige M., Hilker M., Dobler S. (2008). Convergent evolution of chemical defence in Galerucine larvae. Biol. J. Linn. Soc 93, 165–175. doi: 10.1111/j.1095-8312.2007.00912.x
Cameron S. L. (2014). Insect mitochondrial genomics: implications for evolution and phylogeny. Annu. Rev. Entomol. 59, 95–117. doi: 10.1146/annurev-ento-011613-162007
Clary D. O., Wolstenholme D. R. (1985). The mitochondrial DNA molecular of Drosophila yakuba: nucleotide sequence, gene organization, and genetic code. J. Mol. Evol. 22, 252–271. doi: 10.1007/BF02099755
Dong Z., Wang Y., Li C., Li L., Men X., Reddy G. V. P. (2021). Mitochondrial DNA as a molecular marker in insect ecology: current status and future prospects. Ann. Entomol. Soc Am. 114, 470–476. doi: 10.1093/aesa/saab020
Douglas H. B., Konstantinov A. S., Brunke A. J., Moseyko A. G., Chapados J. T., Eyres J., et al. (2023). Phylogeny of the flea beetles (Galerucinae: Alticini) and the position of Aulacothorax elucidated through anchored phylogenomics (Coleoptera: Chrysomelidae: Alticini). Syst. Entomol. 48, 361–386. doi: 10.1111/syen.12582
Du Z., Hasegawa H., Cooley J., Simon C., Yoshimura J., Cai W., et al. (2019). Mitochondrial genomics reveals shared phylogeographic patterns and demographic history among three periodical cicada species groups. Mol. Biol. Evol. 36, 1187–1200. doi: 10.1093/molbev/msz051/5372347
Eben A., Espinosa de los Monteros A. (2015). Trophic interaction network and the evolutionary history of Diabroticina beetles (Chrysomelidae: Galerucinae). J. Appl. Entomol. 139, 468–477. doi: 10.1111/jen.12239
Furth D. G., Suzuki K. (1994). “Character correlation studies of problematic genera of Alticinae in relation to Galerucinae (Coleoptera: Chrysomelidae),” in Proceedings of the third international symposium on the Chrysomelidae (Backhuys Publishers, Leiden, Beijing), 1116–1135.
Ge D., Chesters D., Gómez-Zurita J., Zhang L., Yang X., Vogler A. P. (2011). Anti-predator defence drives parallel morphological evolution in flea beetles. Proc. R. Soc B 278, 2133–2141. doi: 10.1098/rspb.2010.1500
Ge D., Gómez-Zurita J., Chesters D., Yang X., Vogler A. P. (2012). Suprageneric systematics of flea beetles (Chrysomelidae: Alticinae) inferred from multilocus sequence data. Mol. Phylogenet. Evol. 62, 793–805. doi: 10.1016/j.ympev.2011.11.028
Gillespie J. J., Kjer K. M., Riley E., Tallamy D. (2004). “The Evolutionary of cucurbitacin pharmacology in rootworms: insight from Luporini paraphyly,” in New developments in the biology of chrysomelidae. Eds. Jolivet P., Santiago-Baly J. A., Schmitt M.. (Leiden: Brill Press), 37–57.
Guo Q., Huang W., Sang W., Chen X., Wang X. (2023). Characterization, comparative analyses, and phylogenetic implications of mitochondrial genomes among bark and ambrosia beetles (Coleoptera: Curculionidae, Scolytinae). Front. Ecol. Evol. 11. doi: 10.3389/fevo.2023.1191446
Huang W., Zhang C., Zhang T., Xu Y., Xu S., Tian L., et al. (2023a). Features and evolution of control regions in leafroller moths (Lepidoptera: Tortricidae) inferred from mitochondrial genomes and phylogeny. Int. J. Biol. Macromol. 236, 123928. doi: 10.1016/j.ijbiomac.2023.123928
Huang W., Zhao T., Fan M., Duan Y., Tian L., Li H., et al. (2025). Phylogenetic relationships and divergence times of Odonata inferred from mitochondrial genome. iScience 28, 111806. doi: 10.1016/j.isci.2025.111806
Huang W., Zhu P., Wen M., Li Z., Yang X., Huang H., et al. (2023b). Comparative and phylogenetic analyses of mitochondrial genomes in Elateridae (Coleoptera: Elateroidea). Arch. Insect Biochem. 114, e22058. doi: 10.1002/arch.22058
Ji H., Xu X., Jin X., Yin H., Luo J., Liu G., et al. (2019). Using high-resolution annotation of insect mitochondrial DNA to decipher tandem repeats in the control region. RNA Biol. 16, 830–837. doi: 10.1080/15476286.2019.1591035
Katoh K., Standley D. M. (2013). MAFFT multiple sequence alignment software version 7: improvements in performance and usability. Mol. Biol. Evol. 30, 772–780. doi: 10.1093/molbev/mst010
Kearse M., Moir R., Wilson A., Stones-Havas S., Cheung M., Sturrock S., et al. (2012). Geneious Basic: an integrated and extendable desktop software platform for the organization and analysis of sequence data. Bioinformatics 28, 1647–1649. doi: 10.1093/bioinformatics/bts199
Konstantinov A. S., Vandenberg N. J. (1996). Handbook of Palearctic flea beetles (Coleoptera: Chrysomelidae: Alticinae). Cont. Entomol. Int. 1, 1–439.
Kumar S., Stecher G., Tamura K. (2016). MEGA7: molecular evolutionary genetics analysis version 7.0 for bigger datasets. Mol. Biol. Evol. 33, 1870–1874. doi: 10.1093/molbev/msw054
Lartillot N., Philippe H. (2004). A Bayesian mixture model for across-site heterogeneities in the amino-acid replacement process. Mol. Biol. Evol. 21, 1095–1109. doi: 10.1093/molbev/msh112
Lartillot N., Rodrigue N., Stubbs D., Richer J. (2013). PhyloBayes MPI: phylogenetic reconstruction with infinite mixtures of profiles in a parallel environment. Syst. Biol. 62, 611–615. doi: 10.5061/dryad.c459h
Laslett D., Canbäck B. (2008). ARWEN: a program to detect tRNA genes in metazoan mitochondrial nucleotide sequences. Bioinformatics 24, 172–175. doi: 10.1093/bioinformatics/btm573
Li K., Liang A. (2018). Hemiptera mitochondrial control region: new sights into the structural organization, phylogenetic utility, and roles of tandem repetitions of the noncoding segment. Int. J. Mol. Sci. 19, 1292. doi: 10.3390/ijms19051292
Li J., Yan B., He H., Xu X., Ruan Y., Yang M. (2023). Characterization of the complete mitochondrial genome of a flea beetle Luperomorpha xanthodera (Coleoptera: Chrysomelidae: Galerucinae) and phylogenetic analysis. Genes 14, 414. doi: 10.3390/genes14020414
Liang G., Mi D., Chang J., On Yau T., Xu G., Ruan J., et al. (2022). Precise annotation of Drosophila mitochondrial genomes leads to insights into AT-rich regions. Mitochondrion 65, 145–149. doi: 10.1016/j.mito.2022.06.006
Lingafelter S. W., Konstantinov A. S. (1999). The monophyly and relative rank of alticine and galerucine leaf beetles: a cladistic analysis using adult morphological characters (Coleoptera: Chrysomelidae). Scandinavian Entomol. 30, 397–416. doi: 10.1163/187631200x00525
Liu Q., Zhu P., Xu S., Yang C., Song F., Meng Y., et al. (2025). Comparative mitogenomes and phylogenetic analyses of Coccinellidae (Coleoptera: Coccinelloidea). Ecol. Evol. 15, e71053. doi: 10.1002/ece3.71053
Lorenz R., Bernhart S., Siederdissen C. H. Z., Tafer H., Flamm C., Stadler P., et al. (2011). ViennaRNA package 2.0. Algorithms. Mol. Biol. 6, 26. doi: 10.1186/1748-7188-6-26
Lowe T., Eddy S. (1997). tRNAscan-SE: a program for improved detection of transfer RNA genes in genomic sequence. Nucleic Acids Res. 25, 955–964. doi: 10.1093/nar/25.5.955
Meng G., Li Y., Yang C., Liu S. (2019). MitoZ: a toolkit for animal mitochondrial genome assembly, annotation and visualization. Nucleic Acids Res. 47, e63. doi: 10.1093/nar/gkz173
Nie R. E., Breeschoten T., Timmermans M. J. T. N., Nadein K., Xue H. J., Bai M., et al. (2018). The phylogeny of Galerucinae (Coleoptera: Chrysomelidae) and the performance of mitochondrial genomes in phylogenetic inference compared to nuclear rRNA genes. Cladistics 34, 113–130. doi: 10.1111/cla.12196
Nie R. E., Vogler A. P., Yang X., Lin M. (2021). Higher-level phylogeny of longhorn beetles (Coleoptera: Chrysomeloidea) inferred from mitochondrial genomes. Syst. Entomol. 46, 56–70. doi: 10.1111/syen.12447
Oliveira M. T., Azeredo-Espin A. M. L., Lessinger A. C. (2007). The mitochondrial DNA control region of Muscidae flies: evolution and structural conservation in a Dipteran context. J. Mol. Evol. 64, 519–527. doi: 10.1007/s00239-006-0099-6
Peng Y., Leung H. C. M., Yiu S. M., Chin F. Y. L. (2012). IDBA-UD: a de novo assembler for single-cell and metagenomic sequencing data with highly uneven depth. Bioinformatics 28, 1420–1428. doi: 10.1093/bioinformatics/bts174
Perna N., Kocher T. (1995). Patterns of nucleotide composition at fourfold degenerate sites of animal mitochondrial genomes. J. Mol. Evol. 41, 353–358. doi: 10.1007/bf00186547
Rambaut A., Drummond A. J., Xie D., Baele G., Suchard M. A. (2018). Posterior summarization in Bayesian phylogenetics using tracer 1.7. Syst. Biol. 67, 901–904. doi: 10.1093/sysbio/syy032
Salvi D., D’Alessandro P., Biondi M. (2019). Host plant associations in Western Palaearctic Longitarsus flea beetles (Chrysomelidae, Galerucinae, Alticini): a preliminary phylogenetic assessment. ZooKeys 856, 101–114. doi: 10.3897/zookeys.856.32430
Schmieder R., Edwards R. (2011). Quality control and preprocessing of metagenomic datasets. Bioinformatics 27, 863–864. doi: 10.1093/bioinformatics/btr026
Schoohoven L., Loon J. V., Dicke M. (2005). Insect-plant biology. 2nd ed (New York: Oxford University Press), 2421.
Seeno T., Wilcox J. A. (1982). Leaf beetle genera (Coleoptera: Chrysomelidae). Entomography 1, 1–221. doi: 10.5555/19860533037
Stewart J. B., Beckenbach A. T. (2009). Characterization of mature mitochondrial transcripts in Drosophila, and the implications for the tRNA punctuation model in arthropods. Gene 445, 49–57. doi: 10.1016/j.gene.2009.06.006
Tavare S. (1986). Some probabilistic and statistical problems in the analysis of DNA sequences. Lect. Math. Life Sci. 17, 57–86.
Trifinopoulos J., Nguyen L. T., von Haeseler A., Minh B. Q. (2016). W-IQ-TREE: a fast online phylogenetic tool for maximum likelihood analysis. Nucleic Acids Res. 44, W232–W235. doi: 10.1093/nar/gkw256
Vila M., Björklund M. (2004). The utility of the neglected mitochondrial control region for evolutionary studies in Lepidoptera (Insecta). J. Mol. Evol. 58, 280–290. doi: 10.1007/s00239-003-2550-2
Wang Y., Wang L., Yang J., Qin X. (2019). The complete mitochondrial genome of Monolepta occifuvis Gressitt & Kimoto (Coleoptera: Chrysomelidae: Galerucinae). Mitochondrial DNA B 4, 1654–1655. doi: 10.1080/23802359.2019.1604188
Xu S., Duan Y., Ma L., Song F., Tian L., Cai W., et al. (2023a). Full-Length transcriptome profiling of Coridius chinensis mitochondrial genome reveals the transcription of genes with ancestral arrangement in insects. Genes 14, 225. doi: 10.3390/genes14010225
Xu S., Li W., Liu Q., Wang Y., Li X., Duan X., et al. (2023b). The mitochondrial genome of Binodoxys acalephae (Hymenoptera: Braconidae) with unique gene rearrangement and phylogenetic implications. Mol. Biol. Rep. 50, 2641–2649. doi: 10.1007/s11033-022-08232-0
Xu S., Wu Y., Liu Y., Zhao P., Chen Z., Song F., et al. (2021). Comparative mitogenomics and phylogenetic analyses of Pentatomoidea (Hemiptera: Heteroptera). Genes 12, 1306. doi: 10.3390/genes12091306
Yang Z. (2007). PAML 4: phylogenetic analysis by maximum likelihood. Mol. Biol. Evol. 24, 1586–1591. doi: 10.1093/molbev/msm088
Zhang S., Che L., Li Y., Liang D., Pang H., Ślipiński A., et al. (2018). Evolutionary history of Coleoptera revealed by extensive sampling of genes and species. Nat. Commun. 9, 205–215. doi: 10.1038/s41467-017-02644-4
Zhang D. X., Szymura J. M., Hewitt G. M. (1995). Evolution and structural conservation of the control region of insect mitochondrial DNA. J. Mol. Evol. 40, 382–391. doi: 10.1007/bf00164024
Zhao T., Lin Z., Yang H., Song F., Xia Z., Huang W. (2025). Evolutionary history and divergence times of Tettigoniidae (Orthoptera) inferred from mitochondrial phylogenomics. Front. Genet. 16. doi: 10.3389/fgene.2025.1495754
Keywords: Coleoptera, Galerucinae, mitochondrial genome, control region, phylogeny, divergence time
Citation: Xu S, Miao P, Liu Q, Song F, Yang H, Xia Z and Huang W (2025) Comparative analysis of five mitochondrial genomes of the subfamily Galerucinae (Coleoptera: Chrysomelidae) and evolution of control regions inferred from phylogeny. Front. Ecol. Evol. 13:1495703. doi: 10.3389/fevo.2025.1495703
Received: 13 September 2024; Accepted: 07 April 2025;
Published: 28 April 2025.
Edited by:
Federico Plazzi, University of Bologna, ItalyReviewed by:
Andrea Luchetti, University of Bologna, ItalyVictor Hugo Valiati, University of the Rio dos Sinos Valley, Brazil
Copyright © 2025 Xu, Miao, Liu, Song, Yang, Xia and Huang. This is an open-access article distributed under the terms of the Creative Commons Attribution License (CC BY). The use, distribution or reproduction in other forums is permitted, provided the original author(s) and the copyright owner(s) are credited and that the original publication in this journal is cited, in accordance with accepted academic practice. No use, distribution or reproduction is permitted which does not comply with these terms.
*Correspondence: Zhenyuan Xia, NjQ4Nzc4NjUwQHFxLmNvbQ==; Weidong Huang, d2RoNjQzNEAxNjMuY29t
†These authors have contributed equally to this work