 Carina M. Kusaka
 Shawn Stephensen2
 James T. Peterson
 Melanie J. Davis
- 1Department of Fisheries, Wildlife, and Conservation Sciences, Oregon State University, Corvallis, OR, United States
- 2Oregon Coast National Wildlife Refuge Complex, U.S. Fish and Wildlife Service, Newport, OR, United States
- 3U.S. Geological Survey, Oregon Cooperative Fish and Wildlife Research Unit, Corvallis, OR, United States
Seabirds are among the most threatened birds globally, with the loss or deterioration of coastal breeding habitats posing a severe threat. Natural and anthropogenic disturbances substantially influence coastal ecosystems through erosion and vegetation loss, altering habitat for the wildlife species that depend on them. In addition to these disturbances, oceanographic processes may play an important role in shaping the vegetation at breeding habitats; however, there is limited information on how vegetative conditions for burrow nesting seabirds have changed over time, and whether these changes are related to specific oceanographic or climatic factors. The Oregon Coast National Wildlife Refuge Complex, USA (NWRC) is home to a diverse suite of 1.3 million nesting seabirds from 14 species, which provide valuable ecological, economic, and cultural services, including nutrient transfer to terrestrial habitats and ecotourism for local communities. Over the last 30 years, populations of several burrow nesting seabird species including tufted puffin (Fratercula cirrhata) and rhinoceros auklet (Cerorhinca monocerata), which breed on offshore islands, have sharply declined along the Oregon Coast. To better understand the potential factors driving these declines, we conducted a spatiotemporal analysis of an aspect of burrow nesting seabird habitat, vegetation cover, within the Oregon Coast NWRC. Specifically, we quantified vegetative cover on 16 islands from 1992 to 2022 using a combination of empirical data, historical aerial photography (1992–2005), and aerial photography from the National Agriculture Imagery Program (2005–2022). Results showed cyclical fluctuations in vegetation cover coast-wide, which were closely related to large scale oceanographic oscillations. Specifically, vegetation cover was negatively correlated with the winter Pacific Decadal Oscillation and positively correlated with the spring El Nino Southern Oscillation. We did not directly compare seabird population trends to vegetation trends; however, quantifying these long-term changes in vegetation at breeding habitats can contribute to our comprehensive understanding of the myriad factors influencing seabird population dynamics and conservation.
1 Introduction
Natural and anthropogenic disturbances substantially influence coastal ecosystems through processes such as erosion and vegetation loss, altering habitat for the wildlife species that depend on them (Gracia et al., 2018; Reed et al., 2022). Seabirds are among the most threatened birds globally (Dias et al., 2019), with the loss or deterioration of coastal breeding habitats posing a severe threat (Croxall et al., 2012). Climate change may exacerbate these threats by intensifying habitat loss. For example, hotter air temperatures can lead to higher evaporative demand, soil moisture depletion, and vegetation die-off (Bramwell and Caujapé-Castells, 2011). At the same time, sea level rise and increased coastal inundation from stronger, more frequent storms are expected to increase erosion and wind-driven desiccation at vulnerable seabird nesting sites (Croxall et al., 2012; Curtis et al., 2021; Young et al., 2012). For burrow-nesting seabirds, decreased vegetation cover can lead to depleted nesting materials, increased soil erosion, reduced protection from predators, and lower chick survival during heavy rainfall (Bried et al., 2009; Demongin et al., 2010). Vegetation cover also offers protection against wind and solar radiation (Schaaf et al., 2018). Quantifying the vegetative characteristics at breeding seabird colonies, mapping areas of loss or gain, and linking them to long-term climate conditions is therefore a critical conservation research priority.
In addition to climate-mediated disturbance, a growing body of literature recognizes the important role that oceanographic processes play in influencing coastal vegetation (Black, 2009; Galeano et al., 2017). Coastal upwelling in the California Current Ecosystem (CCE) brings cold, nutrient-rich water to the surface, altering coastal microclimates, fog formation, and moisture availability in terrestrial habitats (Diffenbaugh et al., 2004; Xiu et al., 2018). Thus, upwelling may indirectly influence plant growth at seabird breeding sites. Large-scale oceanic-atmospheric processes such as the Pacific Decadal Oscillation (PDO), North Pacific Gyre Oscillation (NPGO), and El Niño Southern Oscillation (ENSO) also influence the CCE’s regional conditions by modulating humidity, air and ocean temperatures, and precipitation (Yeh et al., 2015). Positive PDO phases are characterized by anomalously warm sea-surface temperatures (SST), warm air temperatures, and dry periods over the Pacific Northwest mainland of the U.S (Mantua and Hare, 2002). Conversely, negative phases of the PDO are associated with cool and wet conditions. Positive ENSO phases (i.e., El Niño) are associated with anomalously warm SSTs, and drier and warmer conditions in the Pacific Northwest in winter and spring (Barnard et al., 2017; Chavez et al., 2002; McPhaden et al., 2006), while negative ENSO phases (i.e., La Niña) bring cooler sea-surface temperatures, increased winter precipitation, and more frequent storms (Bertrand et al., 2020). The positive phase of NPGO is characterized by the upwelling of cold, nutrient-rich water, which can be associated with changes in wind stress (Di Lorenzo et al., 2008), air temperature, and humidity (Park et al., 2017; Song et al., 2023). Previous research has established that these oceanic processes influence terrestrial vegetation growth; however, the direction and magnitude of these relationships are species dependent and can vary regionally (Black, 2009; Black et al., 2018), emphasizing the need for place-based research to inform management.
The high productivity and biological diversity of the CCE supports millions of resident and migratory seabirds along the Pacific flyway, offering secure environments for breeding and roosting (Parrish et al., 2007; Yen et al., 2006). The islands off the Oregon Coast exemplify breeding habitat within the CCE that are at risk of vegetation loss. These offshore islands are home to a diverse suite of 1.3 million nesting seabirds from 14 species (Naughton et al., 2007), which provide valuable ecological, economic, and cultural services, including nutrient transfer to terrestrial habitats and ecotourism for local communities (Signa et al., 2021). The Oregon Coast National Wildlife Refuge Complex (NWRC) has documented declines for multiple burrowing seabird populations and breeding colonies since 1988, including rhinoceros auklets (Cerorhinca monocerata), Cassin’s auklets (Ptychoramphus aleuticus), and fork-tailed storm petrels (Hydrobates furcatus) (Naughton et al., 2007; USFWS, 2009). Populations of tufted puffin (Fratercula cirrhata) have declined more than 90% over the past four decades—both along the Oregon Coast and within the larger CCE—contributing to their designation as a species of greatest conservation need in Oregon and endangered in Washington State (Hart et al., 2018; U.S. Fish and Wildlife Service, 2020). Although Leach’s storm petrels (Hydrobates leucorhous) are among the most common breeding seabirds on the Oregon Coast, infrequent surveys have made their population trends unclear (Orben et al., 2019). Poor breeding site conditions are a potential cause of decline for burrow-nesting seabirds; however, there is little quantitative evidence to support this assumption, leaving the full extent of breeding habitat’s influence on seabird populations unknown (U.S. Fish and Wildlife Service, 2020). Given recognized declines in burrow-nesting seabirds, knowledge gaps regarding the driving factors, and limited resources, local managers face uncertainty in prioritizing conservation actions for maximum positive impact. Long-term monitoring and spatial data collection are essential to track habitat change over time, identify key environmental drivers, and inform targeted management strategies that support seabird conservation.
Alongside factors such as climate variability, geographic features, and socio-ecological conditions, vegetation cover is widely recognized as a fundamental aspect of habitat suitability for burrow nesting seabirds. Vegetation plays a key role in stabilizing soil required for burrow structure (Shuford and Gardali, 2008). When vegetation is lost or degraded, soil becomes vulnerable to leaching and erosion, especially during winter storms, rendering sites unfavorable for birds (Norman, 1970; Cadiou et al., 2010). Burrowing seabirds in the CCE can be broadly grouped into storm petrels (Hydrobates spp.) and alcids (e.g., tufted puffins and auklets) (USFWS, 2005). Storm petrels often breed on densely vegetated islands, excavating earthen burrows in soil beneath vegetation (Harris, 1974; MacKinnon, 1989; Pollard, 2008). Burrow density in storm petrels has been shown to increase with vegetation cover, while higher rates of burrow collapse are observed where vegetation is reduced (Cadiou et al., 2010; Stokes et al., 2021). Similarly, previous research has emphasized the importance of steep, vegetated slopes for nesting alcids (Richardson, 1961; Boone, 1985; Piatt et al., 1997), though tufted puffin are flexible to nest in rocky crevices in the absence of vegetation (S. Stephensen, pers. comm). Although seabird burrowing density may vary among vegetation types (e.g., herbaceous, grasses, woody) (Bancroft et al., 2005; Pearson et al., 2009), the historical data available limited our analysis to vegetation cover, rather than plant community composition.
In coastal island ecosystems, aerial photography and other remotely sensed data sets offer more robust spatial documentation over field data, particularly in areas that are physically inaccessible due to steep, rugged terrain. Aerial photography provides a cost-effective, non-invasive, and detailed method for assessing habitat change over large spatial and temporal scales (Long and Skewes, 1994; Robbins, 1997; Verhoeven et al., 2013). However, although it is widely accessible and affordable, aerial imagery is often limited by coarse spatial resolution (e.g., 0.5–10 meters), making it challenging to analyze smaller-scale habitat features. Incorporating ground truth data is often necessary to capture detailed landcover change (Nagai et al., 2020). Nevertheless, advances in image analysis techniques have enhanced the utility of historical imagery (Morgan et al., 2010), enabling long-term assessments of landcover change. Time-series analyses provide insight into a landscape’s historical context and the frequency and duration of mechanisms driving change (Gómez et al., 2016; Käyhkö and Skånes, 2006). Thus, a combination of aerial imagery and field observation to quantify landcover change over time and understand underlying ecological processes can help natural resource managers make informed decisions.
The goal of this research was to examine how an aspect of burrow-nesting seabird breeding habitat, vegetation cover, has changed on the Oregon Coast over time and whether these changes are related to climatic and oceanographic factors. Specifically, we quantified vegetation change using historical aerial images (1992–2005), multispectral aerial imagery from the National Agriculture Imagery Program (NAIP) (2005–2022), and contemporary field-based habitat surveys. We then related vegetation change to climatic and oceanographic factors accounting for marine-driven processes, seasonal weather, and coastal upwelling. Although the influence of large-scale oceanographic fluctuations on seabirds through changes in marine food web dynamics is well-documented (Gibson et al., 2023; Schmidt et al., 2014), this is the first study to examine the potential effects on Oregon’s island vegetation. We hypothesized that vegetation cover decreased at seabird breeding sites over the past 30 years due to an increase in the frequency and intensity of heat extremes and an increase in storm surge events (Masson-Delmotte et al., 2021). Precipitation directly alters soil water availability, altering plant growth, especially during the spring “green-up” phase (Piao et al., 2019), while hotter summer air temperatures can contribute to vegetative stress and die-off (Peterson et al., 2014). Thus, we expected low spring precipitation and high summer temperatures to be the factors most strongly correlated with decreased vegetation cover. In contrast, we anticipated that marine-driven processes and coastal upwelling would have an indirect and lesser effect on vegetation change. Understanding these long-term shifts in seabird breeding habitat—along with the climatic and oceanographic drivers that may influence them—will inform habitat restoration efforts, invasive species control, and other adaptive management strategies.
2 Methods
2.1 Study area
The Oregon Islands National Wildlife Refuge is located off the coast of Oregon, USA and includes 1,853 rocks, reefs, islands, and headlands that stretch from Tillamook Head south to the California border, totaling 240 hectares. North of Tillamook Head, the Three Arch Rocks National Wildlife Refuge encompasses 6.1 hectares of islands off the coast of Oceanside, Oregon, USA. The Oregon Islands and Three Arch Rocks National Wildlife Refuges will hereafter be referred to as the Oregon Coast National Wildlife Refuge Complex (Oregon Coast NWRC). The Oregon Coast NWRC is a designated Wilderness Area managed by the U.S. Fish and Wildlife Service.
The islands within the Oregon Coast NWRC support diverse plant communities, including both native and invasive species. Dominant native vegetation types include coastal prairie-grassland and riparian shrub communities, such as native beachgrass grassland dominated by American dunegrass (Leymus mollis), saltgrass (Distichlis spicata), and Pacific reedgrass (Calamagrostis nutkaensis)/low shrub associations. Other common assemblages include rush (Juncus breweri) stands, mixed short shrub/herb/grass communities, and stonecrop dominated areas (Bilderback and Bilderback, 2010). Due to logistical constraints, comprehensive vegetation surveys have been limited; however, the single conducted study reports between 27 and 47 plant species per island (Bilderback and Bilderback, 2010). Invasive species are common, with the most widespread being sea fig (Carpobrotus chilensis), wild radish (Raphanus raphanistrum), New Zealand spinach (Tetragonia tetragonioides), and tansy ragwort (Jacobaea vulgaris) (Ball and Olthof, 2022).
Within the refuge, 47 offshore islands were historically (1979–1988) occupied by tufted puffin, many of which were also occupied by other burrow-nesters such as rhinoceros auklets, Cassin’s auklet, fork-tailed storm petrels, and Leach’s storm petrels (Naughton et al., 2007). Because we were interested in assessing vegetation trends, we excluded islands that lacked vegetation. Vegetation presence was determined by assessing high-resolution aerial imagery from U.S. Fish and Wildlife Service helicopter surveys (2012–2021). This reduced the set to 31 islands. To ensure geographic representation, islands were classified as “northern” (located north of 44° latitude) or “southern” (south of 44° latitude). This distinction reflects previously-documented differences in seabird species community composition and abundance between the north and south coast regions (Naughton et al., 2007). We first selected the seven islands that were easily accessible in the field to include in the study. From the remaining islands, we randomly selected sites to achieve a balanced sample of eight northern and eight southern islands. The extent of our study was comprised of these 16 historically occupied, vegetated islands across the Oregon Coast NWRC.
2.2 Retrieval and pre-processing of remote sensing data
The first task for assessing vegetation change at burrow-nesting seabird habitats was to acquire and process data from multiple sources for a single, unified analysis (Supplementary Figure S1). We obtained NAIP orthoimagery with a spatial resolution of 0.6-1.0 m ground sample distance from U.S. Geological Survey Earth Explorer (https://earthexplorer.usgs.gov/). The images from 2005, 2009, 2011, 2012, 2014, 2016, 2020, and 2022 were acquired during the agricultural growing season (June–August; leaf-on) (Supplementary Table S2). The 2018 image, from the Oregon Statewide Imagery Program (OSIP), was derived at 0.305 m resolution from the Oregon Spatial Data Library (https://spatialdata.oregonexplorer.info). All 16 islands were included in the spatial extent of NAIP and OSIP, with at least three-band—blue (B; 450-510nm), green (G; 530–590 nm), and red (R; 640–670 nm)—imagery. NAIP and OSIP imagery acquired after 2009 are four-band, including near infrared (NIR; 750-2500nm); however, we excluded the NIR band from this classification to maintain consistency with historical imagery, which only contains RGB bands. The data were georeferenced prior to distribution, obtained with minimal cloud cover, and geometrically and radiometrically corrected by the data vendor prior to delivery to minimize differences between acquisition dates. Due to this preparation, we omitted additional geometric or radiometric normalization. We downloaded data in MrSID™ (.sid) format, allowing significant file compression with minimal to no degradation in image quality. For each available year, the full NAIP county mosaics were downloaded for all seven Oregon Coast counties: Clatsop, Tillamook, Lincoln, Lane, Douglas, Coos, and Curry.
We downloaded individual historical aerial images from the Earth Explorer database for all 16 sites as.tif files (Supplementary Table S2). Historical images were acquired by the U.S. Bureau of Land Management (BLM) from 1992 to 2002 at 1000 dpi resolution with a scale of 1:12,000, and photos were selected based on the available imagery acquired during the summer season (May–August). We deliberately selected photos acquired during the summer to identify areas with deciduous vegetation during the time of year when burrow-nesting seabirds are selecting and utilizing breeding habitat. Therefore, phenological differences between seasons were minimized when making comparisons with NAIP and OSIP imagery. Each historical image was georeferenced manually in ERDAS Imagine® 2023 (version 16.8, Hexagon Geospatial, Norcross, GA, USA). This allowed us to geocode each photo with a map projection so that it could be displayed with other spatial data, and ensured overlap of islands across years. We used an image-to-image registration process (Everitt et al., 2008), with all years geometrically corrected to the OSIP 2018 scene due to its high spatial resolution (0.305 m).
All images were imported into ArcGIS Pro (Version 3.1.2, Esri Inc., 2023) and projected to the spatial reference coordinate system EPSG: 2993, NAD 1983 (HARN) Oregon Lambert Conformal Conic (Intl. m.). To facilitate comparison between years, images were resampled to a spatial resolution equivalent to that of the image with the lowest spatial resolution (1 m by 1 m per pixel). We hand-digitized the land-water boundary along each island. To account for changing tides, and therefore changing boundaries, we compared photographs from all years at each site to identify the photograph with the highest tides. The selected photograph served as the base map for digitizing the island boundary, thereby excluding water from the analysis. We decided that the loss of minor sections of the island boundary, often submerged by tides, was negligible, as burrow-nesting seabird habitats were not situated within the low-elevation rocky intertidal zone. Finally, NAIP, OSIP, and historical images were clipped to the polygon boundaries of each island using the “Extract by Mask” tool (Figure 1). We ensured each image had precisely the same number of pixels across years by using the “Snap Raster” option within the tool. All tool and computer setting specifications were kept consistent throughout the process.
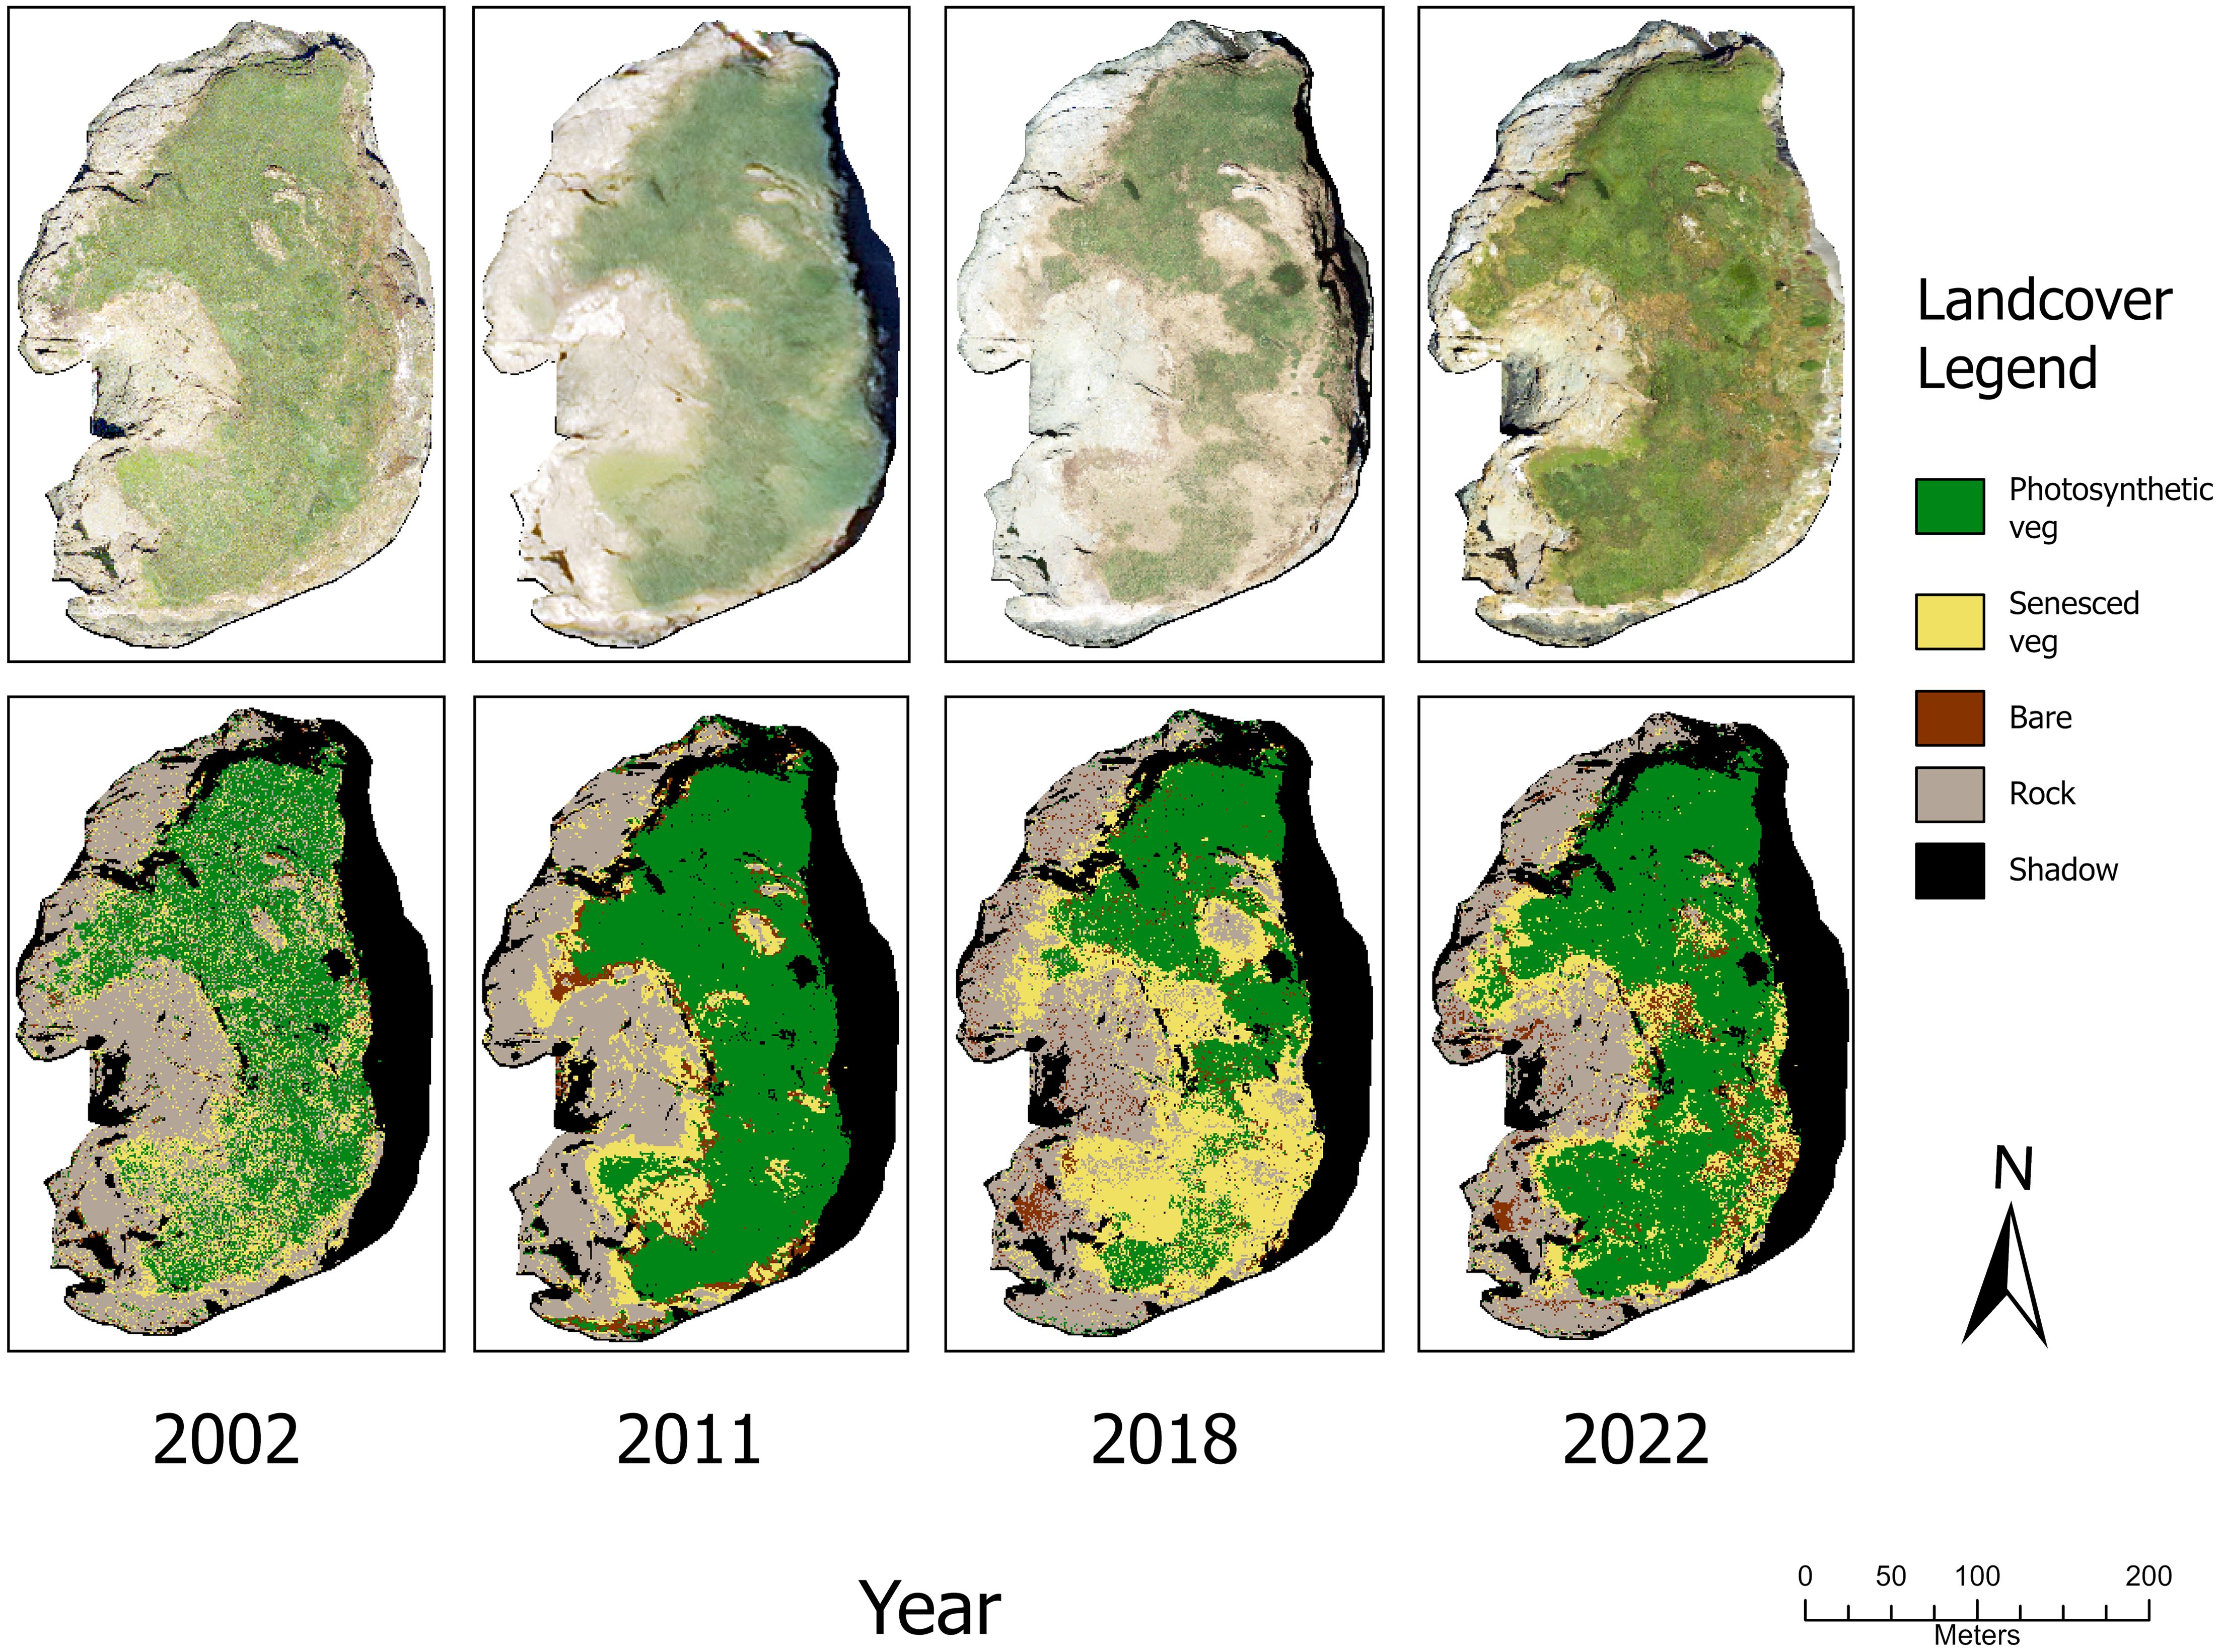
Figure 1. (Top row) Aerial photos at Goat Island, after pre-processing steps were completed. Photograph from 2002 was derived from historical BLM imagery, 2011 and 2022 were retrieved from NAIP, and the 2018 scene was retrieved from OSIP. (Bottom row) Results of random forest classification procedure on aerial photos of Goat Island in 2002, 2011, 2018, and 2022.
2.3 Field study: ground collection of vegetation data
We conducted field sampling efforts from July 20, 2022 to August 12, 2022 to ground truth at sites on the Oregon Coast NWRC. Field sampled ground truth data were later used in combination with pseudo sampled points to train and validate landcover classification models (methods described in detail below). Field data on islands were collected for the four dominant landcover classes: photosynthetic vegetation, senesced vegetation, rock, and bare ground. We characterized rock as exposed, immobile bedrock, while bare ground referred to unvegetated, loose soil. Ground-level habitat data were collected on the following seven islands: Goat Island, Hunters Island, Whaleshead Cove (West Rock), Saddle Rock, North Crook Point Rock, Chief’s Island, and Gull Rock (Figure 2, Supplementary Table S1). We selected this subset of islands within the study area because they were the only ones safely accessible. Sampling frequency was dependent on the weather, wind, and ocean conditions to safely travel to sites by boat or by foot.
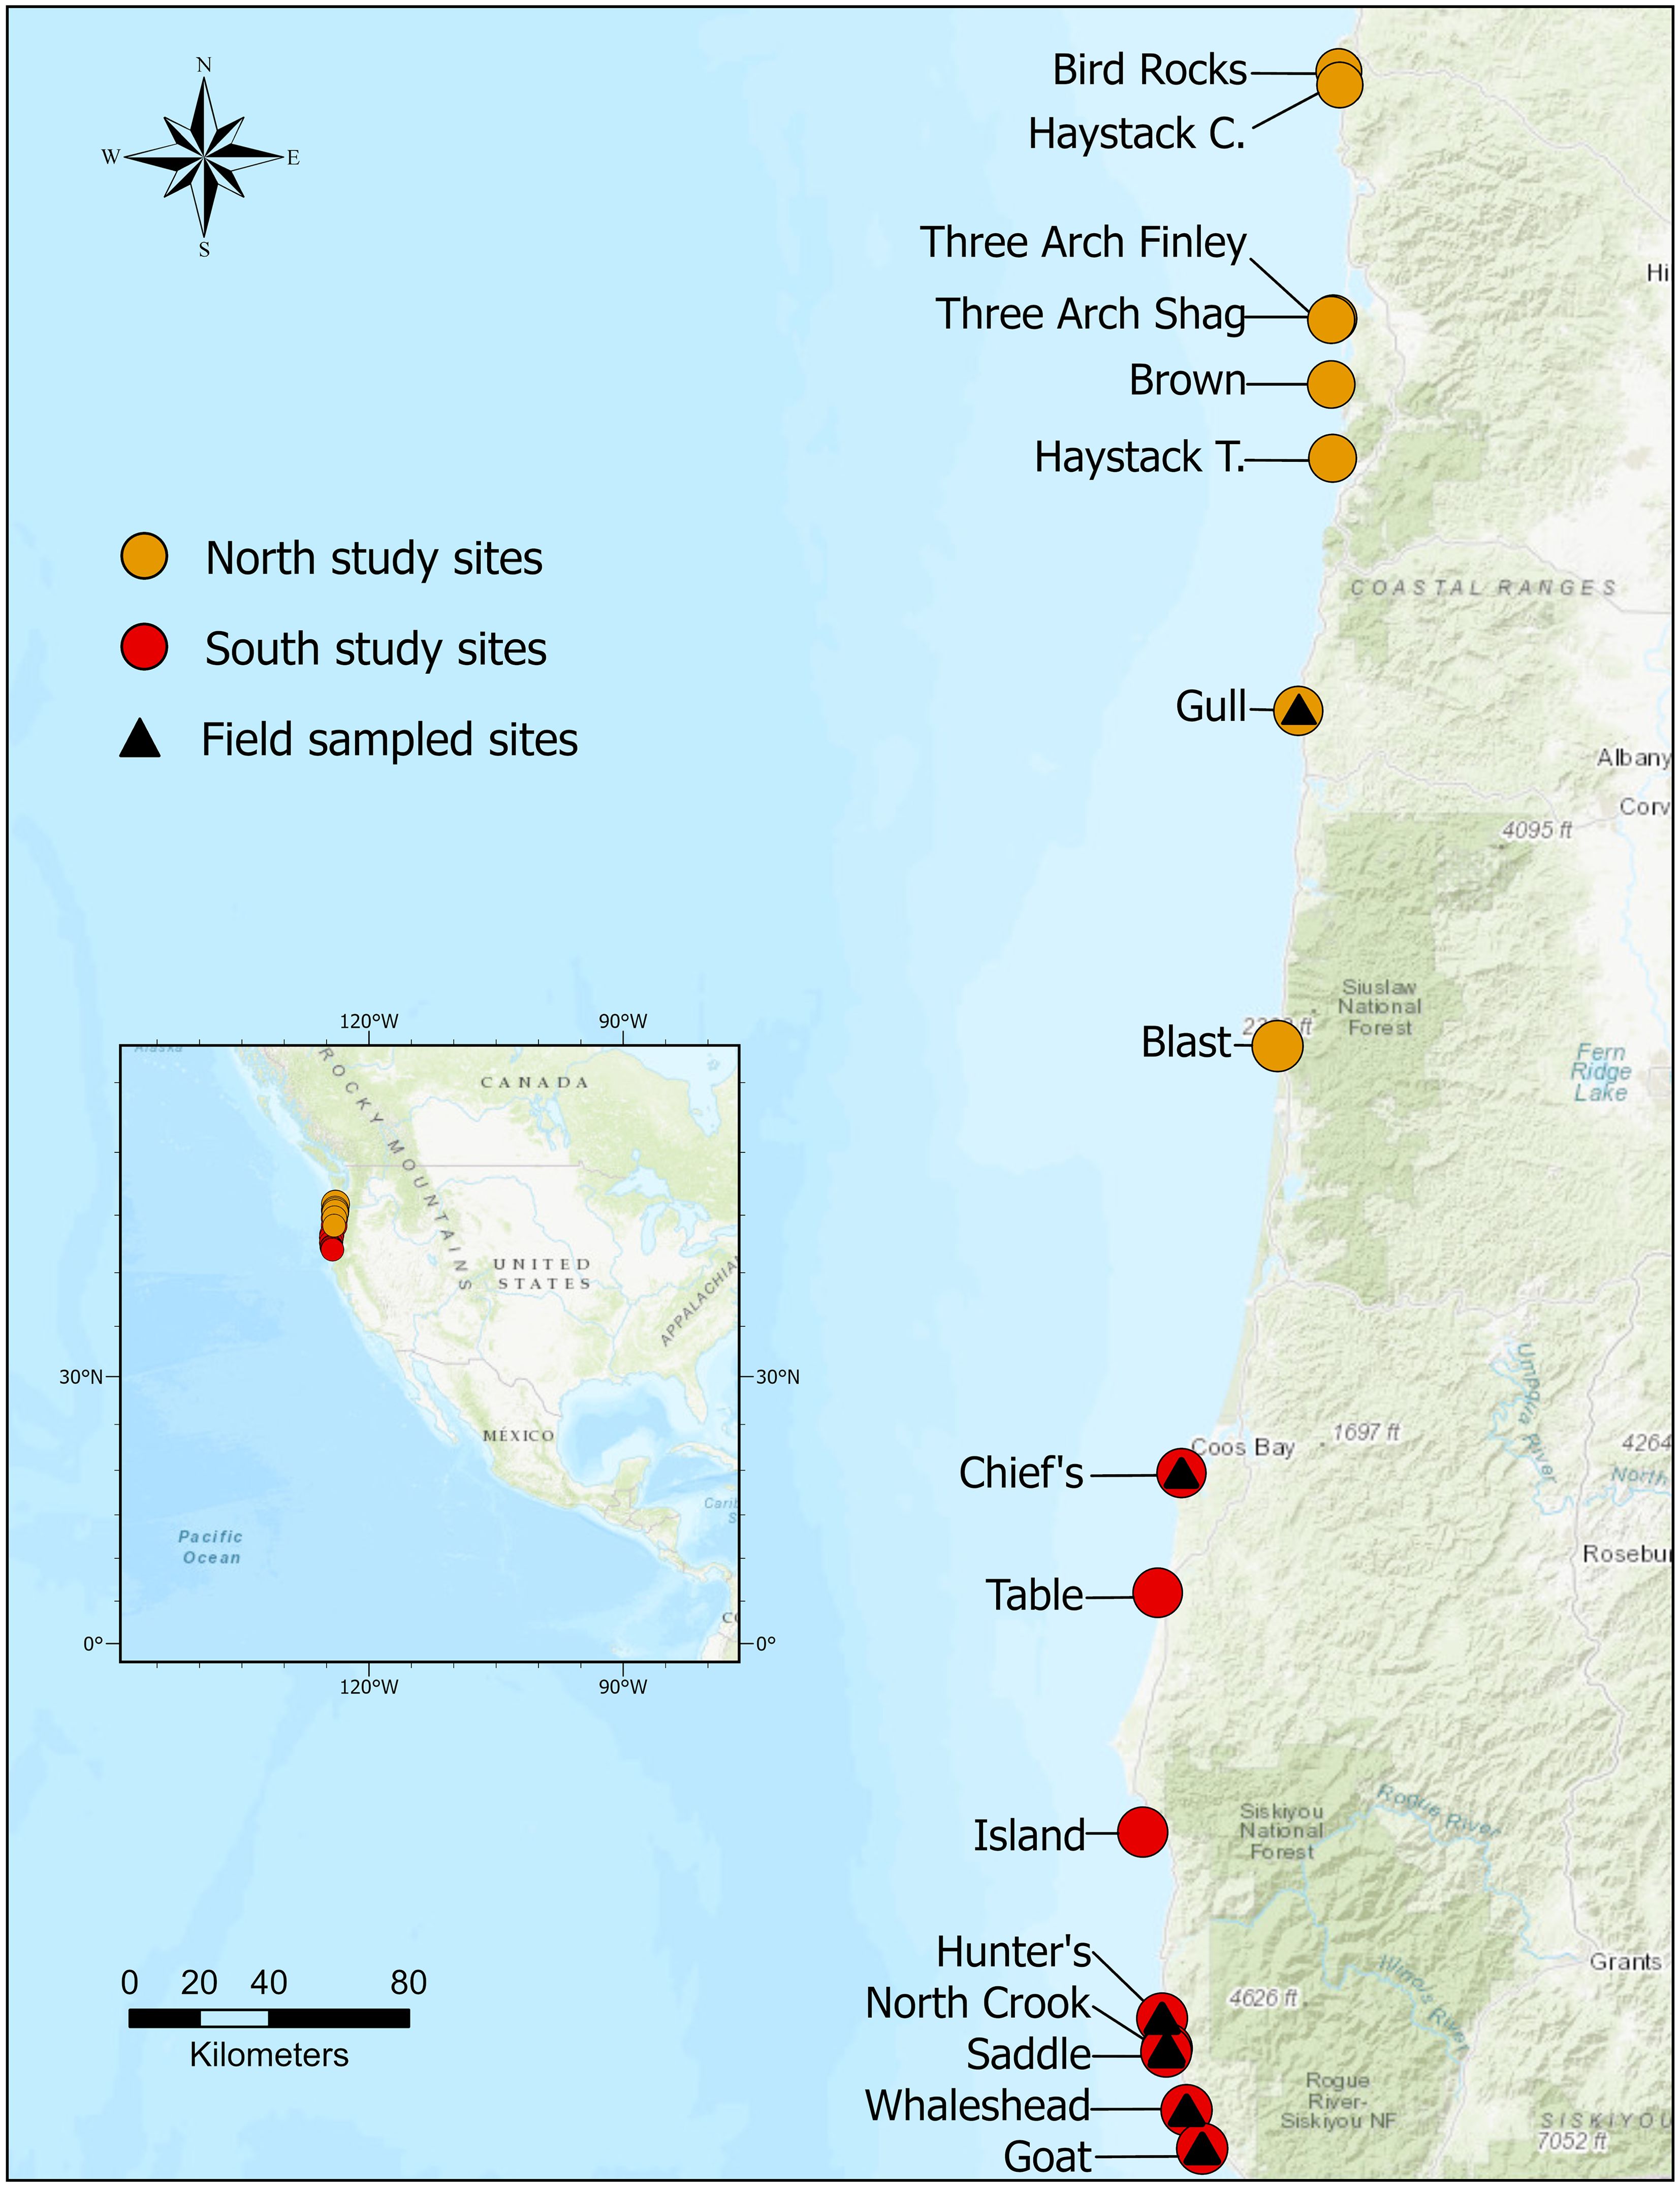
Figure 2. Distribution of northern and southern study sites within the Oregon Coast National Wildlife Refuge Complex. The points denote the locations of individual study sites. Triangles represent a subset of study sites sampled in the field during Summer 2022.
We conducted ground-based habitat sampling along line transects. We established transects starting from the corner of the island nearest our ascent, placing them parallel to the islands’ length, and used a 1 m x 1 m polyvinyl chloride pipe quadrat to sample along the transect. Island sizes ranged from approximately 0.8 to 7.7 hectares. On smaller islands (less than 1.9 hectares in size), quadrats were positioned at 5-meter intervals along the line transect. For larger islands (greater than 1.9 hectares), quadrats were spaced every 10 meters to increase habitat coverage. Rising tides limited our available window for data collection. In some cases, our team had approximately one hour to scale the steep sides of the island, set up equipment, collect data, and descend the island before the route to the boat became submerged. Due to these logistical challenges, the total number of quadrat samples ranged from 20 to 50 per island.
The following data were collected in each quadrat sample: height of tallest vegetation (cm), slope, location, elevation, and percent cover of dominant landcover classes. We visually estimated the percentage of ground covered by each landcover type within a quadrat. For photosynthetic and senesced vegetation, all parts of the plant contributed to the percentage of landcover, including stems and foliage. Slope was measured using a clinometer at the center of the quadrat, as close to the bare ground as possible. At the center of each quadrat sample, we recorded location and elevation using a real time kinematic global positioning system (RTK GPS) to obtain high resolution topography data with vertical accuracy within ± 2 cm. Benchmarks for the RTK GPS were taken at established on-shore benchmark stations nearest to the islands before and after surveys were completed to ensure vertical accuracy within ±3 cm.
2.4 Supervised classification procedure
Random forest (RF) algorithm is a widely used classifier which uses training data to create a collection of classification trees and derive predictions based on the mean response of the constructed trees (Breiman, 2001). Previous studies have reported that RF classifiers were fast, successfully handled multicollinearity, performed well with multi-source datasets, outperformed other classification methods when applied to fine-scale imagery, and produced highly accurate results (Belgiu and Drăguţ, 2016; Correll et al., 2019).
All pre-processed photos were imported into the Google Earth Engine platform as GeoTIFF assets and underwent an image analysis classification procedure using the RF algorithm within Google Earth Engine (Gorelick et al., 2017). We created pseudo-sampling points (i.e., points derived from photos) for each of the land cover categories, sampling from every photo. We used the general guideline that the sample size for each class should be approximately 10 to 30 times the number of bands (Qiu et al., 2019; Van Niel et al., 2005). An additional landcover class was added to the original list to account for areas in the imagery covered by shadow. Pixels were categorized into land cover classes through visual interpretation, manually assigning each category a numerical value (1–5) for classification (Bwangoy et al., 2010; Phan et al., 2020; Sousa et al., 2020). We separated photosynthetic from senescent vegetation due to their distinct spectral signatures. Photosynthetic vegetation represents actively photosynthesizing plant matter, reflecting higher values in the green band, whereas senescent, dried vegetation shows higher red reflectance. Separating these classes in a fractional cover analysis can often reduce spectral noise and decrease misclassification (Xie et al., 2008; Guerschman et al., 2009). We created an independent sample dataset for each photo due to the diversity in spatial and temporal images. For the 2022 photos, we combined the pseudo-sampled points with ground-truth data collected in the field in 2022 for each island. Red, green, and blue spectral values were extracted for all points.
The combined dataset, including both pseudo sampled and ground truth points, was randomly partitioned, allocating 20% of the points into a “testing data” group and 80% of the points into a “training data” group. The training group was input into the RF classifier to define the most efficient set of rules in the classification trees. The RF classifier was trained using 100 classification trees (ntree = 100) based on the recommendations of previous studies (Cánovas-García et al., 2017; Ghimire et al., 2012; Phan et al., 2020). Once the RF model was trained, we used it to classify the remaining pixels in the photo. Pixels classified as “Shadow” were merged from all years to create one combined shadow mask for each island. The shadow mask was then applied to each photo of the island to standardize the analytical area (Figure 1). We calculated the measures of classification accuracy for each image: overall classification accuracy, Kappa coefficient of agreement, and user’s and producer’s accuracy. User’s and producer’s accuracy provided further insights into the reliability of how well the RF model performed. User’s accuracy measures the probability that a pixel classified as a specific landcover type actually belongs to that class in reality. Producer’s accuracy indicates the proportion of correct predictions made by the model using the training data. Therefore, user’s accuracy provides information on the reliability of the model for classifying new areas, and producer’s accuracy provides insight into how well a landcover class has been classified. Overall accuracy quantifies the ability of the model to correctly classify a pixel, regardless of class. The Kappa coefficient of agreement measures model performance, considering the agreement occurring by chance of using random classifier (Cohen, 1960).
The percentage cover for each landcover class was calculated by dividing the number of pixels in a given class by the total number of pixels in the image. These steps were repeated for each year of available imagery for each island. Finally, we calculated the measures of classification accuracy—producer’s accuracy, user’s accuracy, overall accuracy, and the kappa statistic—for the entire image set of 136 photos. This allowed us to determine the range, mean and standard deviation of the different measures of accuracy.
2.5 Dynamic factor analysis
We used a dynamic factor analysis (DFA) to characterize coast-wide vegetation trends for the 30-year time series using the Multivariate Autoregressive State-Space (“MARSS”) package (Holmes et al., 2024) in R statistical software (Version 4.3.2, R Core Team, 2023). DFA is a dimension reduction method that models multivariate time series data, aiming to estimate underlying common patterns, and allows scientists to make inferences about ecological trends that are not directly observable (Holmes et al., 2012; Ward et al., 2022; Zuur et al., 2003). A notable advantage of this approach is that DFA is robust for data sets that have missing observations and that include observations from multiple sources (Aguilera et al., 2016; Durbin and Koopman, 2012).
We employed DFA to identify and characterize the underlying patterns in vegetation cover on the focal islands along the Oregon Coast over a 30-year period (1992-2022). Our analysis consisted of two separate DFA procedures, both examining coast-wide vegetation patterns using data from all 16 islands. The first DFA procedure focused on the percent cover of photosynthetic vegetation. In this analysis, each observation represented the percentage of photosynthetic vegetation cover on a specific island at a given time step, with all 16 islands contributing to the coast-wide assessment. The second DFA procedure examined the percent cover of total vegetation, combining both photosynthetic and senesced vegetation. Similar to the first procedure, each observation in this analysis represented the percentage of total vegetation cover on a specific island at a given time step, using all 16 islands to capture coast-wide trends. For DFA models, we used a diagonal and equal error structure and tested one hidden trend (Holmes et al., 2012).
We separated photosynthetic from total vegetation in our analyses to better characterize vegetation patterns and their relationships with climate drivers. Photosynthetic vegetation reflects green biomass that maintains dense root networks, contributes directly to soil stability, and serves as an indicator of soil moisture (Xu and Zhou, 2011; Peng et al., 2024; Lann et al., 2024). In contrast, senesced vegetation that persists for extended periods may signal plant stress and limited moisture availability, offering reduced soil stabilization and increased vulnerability to erosion (Cutler et al., 2023; Yang et al., 2023; Antonietta et al., 2024). Soil moisture and compaction can influence Leach’s Storm Petrel burrow site selection, stability, and excavation (Hoeg and Shutler, 2023). While drier, less compact soils may be easier to excavate, excessively dry soils are prone to collapse or poor drainage, especially during storms. By distinguishing these vegetation components, we aimed to evaluate whether climate drivers differentially influenced photosynthetic and total vegetation cover, providing more nuanced insights, and identifying areas at risk of long-term vegetative loss.
The DFA framework models observed data as latent trends, which are represented as a random walk with associated error (Zuur et al., 2003). It consists of a process model and an observation model, where observations are combinations of hidden trends and factor loadings. The factor loadings matrix quantifies each latent trend’s influence on the observed time series (Holmes et al., 2014; Zuur et al., 2003). The larger the positive loading, the more closely the latent trend is represented by an observed time series, and factor loadings ≥ |0.2| are generally considered strong (Tam et al., 2013). Observation and process error terms assume a multivariate normal distribution with a mean of zero. A Kalman filter estimates hidden trends and computes the likelihood of the data given the parameter estimates. Estimated trends, factor loadings, and fitted values are unitless (Zuur et al., 2003). To meet model assumptions, response variables were standardized with a mean of zero and variance of one. We assessed model precision by calculating the standard errors and the root mean squared error (RMSE) across samples, while model bias was estimated as the mean difference between observed and predicted values.
2.6 Environmental predictors
In the dynamic CCE, marine and terrestrial processes are interconnected through atmospheric pathways. For instance, variability in marine sea-surface temperature and water vapor can influence atmospheric humidity, affecting moisture availability for terrestrial vegetation (Lewis et al., 2003; Reimer et al., 2015). We were therefore interested in multiple marine-driven processes that could potentially impact coastal vegetation cover, including the winter NPGO, winter PDO, and spring Multivariate ENSO Index (MEI). Precipitation and temperature regimes in coastal island vegetation communities can alter a plant population’s abundance, growth, survival, and reproduction, thus altering overall plant cover (Dicken et al., 1961; Barbour et al., 1985; Garner et al., 2015; EcoAdapt, 2021). Specifically, spring precipitation and summer temperature were expected to influence coastal vegetation cover (Hatfield and Prueger, 2015; Mote and Salathe Jr., 2010). Coastal upwelling in the CCE brings cold, nutrient-rich water to the surface, altering coastal microclimates, including fog regimes and moisture availability in terrestrial habitats (Dye et al., 2024; Samelson et al., 2021), which may influence plant growth. Accordingly, we included two coastal upwelling indices as predictor variables: the summer Coastal Upwelling Transport Index (CUTI) and winter Biological Effective Upwelling Transport Index (BEUTI) (Supplementary Table S8).
To examine the relative influence of climatic and oceanographic conditions on vegetation trends, we fitted models with predictor variables that were expected to influence total and photosynthetic vegetation cover over a 30-year period. We included predictor variables in the candidate models to test the relation of vegetation to 1) marine-drive processes, 2) seasonal weather, and 3) coastal upwelling. Although variables can be incorporated directly in the DFA, the variable effects are applied to the observation rather than the process model. As an alternative, we used generalized linear mixed modeling regression with a template model builder (“glmmTMB”) to examine the relationship between the vegetation trends and environmental predictors (Brooks et al., 2017). We incorporated a first-order autoregressive (AR1) error structure to account for temporal autocorrelation.
The response variables—the raw percent cover of photosynthetic and total vegetation over a 30-year period (1992–2022) at seabird breeding sites—were logit transformed prior to analysis to normalize the data and account for the bounded nature of proportions when modeling with Gaussian distributions in GLMMs. Environmental predictor data were retrieved from various sources (Supplementary Table S3) and standardized so that parameters corresponded to a one standard deviation change in the predictor variables. Pearson correlations were run on all pairs of predictor variables prior to modeling and only uncorrelated predictor variables (r2 < 0.70) with the strongest hypothesized ecological relevance were included in the candidate models (Supplementary Table S8).
We used an information-theoretic approach (Burnham and Anderson, 2002), to evaluate the relative plausibility of generalized linear mixed models relating variables to vegetation trends. We used “site” as our random effect, with an AR1 temporal correlation structure to account for non-independence of repeated measurements at the same sites over time. We constructed candidate models with predictors representing different hypotheses and evaluated model fit by calculating Akaike’s Information Critera (AIC; Akaike, 1998) with the small-sample bias adjustment (AICc; Hurvich and Tsai, 1989). Akaike weights (Burnham and Anderson, 2002) were used to compare models, with the best-fitting model having the highest weight. We assessed the relative reliability of models by calculating 90% confidence intervals and standard errors of parameter estimates.
3 Results
3.1 Supervised classification
For the RF analysis, we classified NAIP and historical imagery for 16 islands, resulting in an image set of 136 photos (Supplementary Tables S4–S6). Overall accuracy ranged from 76.4% to 100%, with a mean of 89.7%, and the Kappa coefficient of agreement ranged from 0.647 to 1.0, with a mean of 0.85 (Supplementary Table S4). The mean producer accuracy across the image set was 89.7% and the mean user accuracy was 90.4%. The close alignment between these two metrics indicates a well-balanced classifier, correctly identifying each class (producer accuracy) while maintaining reliability of class predictions (user accuracy). On average, photosynthetic vegetation was classified with the highest accuracy, with a mean producer accuracy of 89.7% and a user’s accuracy of 90.4% (Supplementary Table S5). Rock was classified with the next highest accuracy across the image set, followed by bare ground (Supplementary Table S5). The lowest classification accuracy was observed in senesced vegetation, with a producer accuracy of 76.8%, and a user accuracy of 81.9%, indicating the classifier had the most difficulty in differentiating senesced vegetation from the other classes.
The percentage of photosynthetic vegetation across islands and through time ranged from 0% to 66% (Figure 3, Supplementary Figure S2). Six out of the 16 islands recorded their highest levels of photosynthetic vegetation in 2012, all on the South Coast. Goat Island had the highest percentage at 66% in 2012, followed by North Crook Point Rock with 59% in 2012, and Whaleshead West with 54% in 1997. The range of senesced vegetation across islands was 0% to 39% percent. Bare soil ranged from 0% to 26%, with Blast Rock having the highest percentage of bare soil. Exposed rock ranged from 19% to 100%. Gull Rock, comprised mainly of exposed rock, consistently had the least vegetation, with a range of 0% to 4% over the 30-year study period.
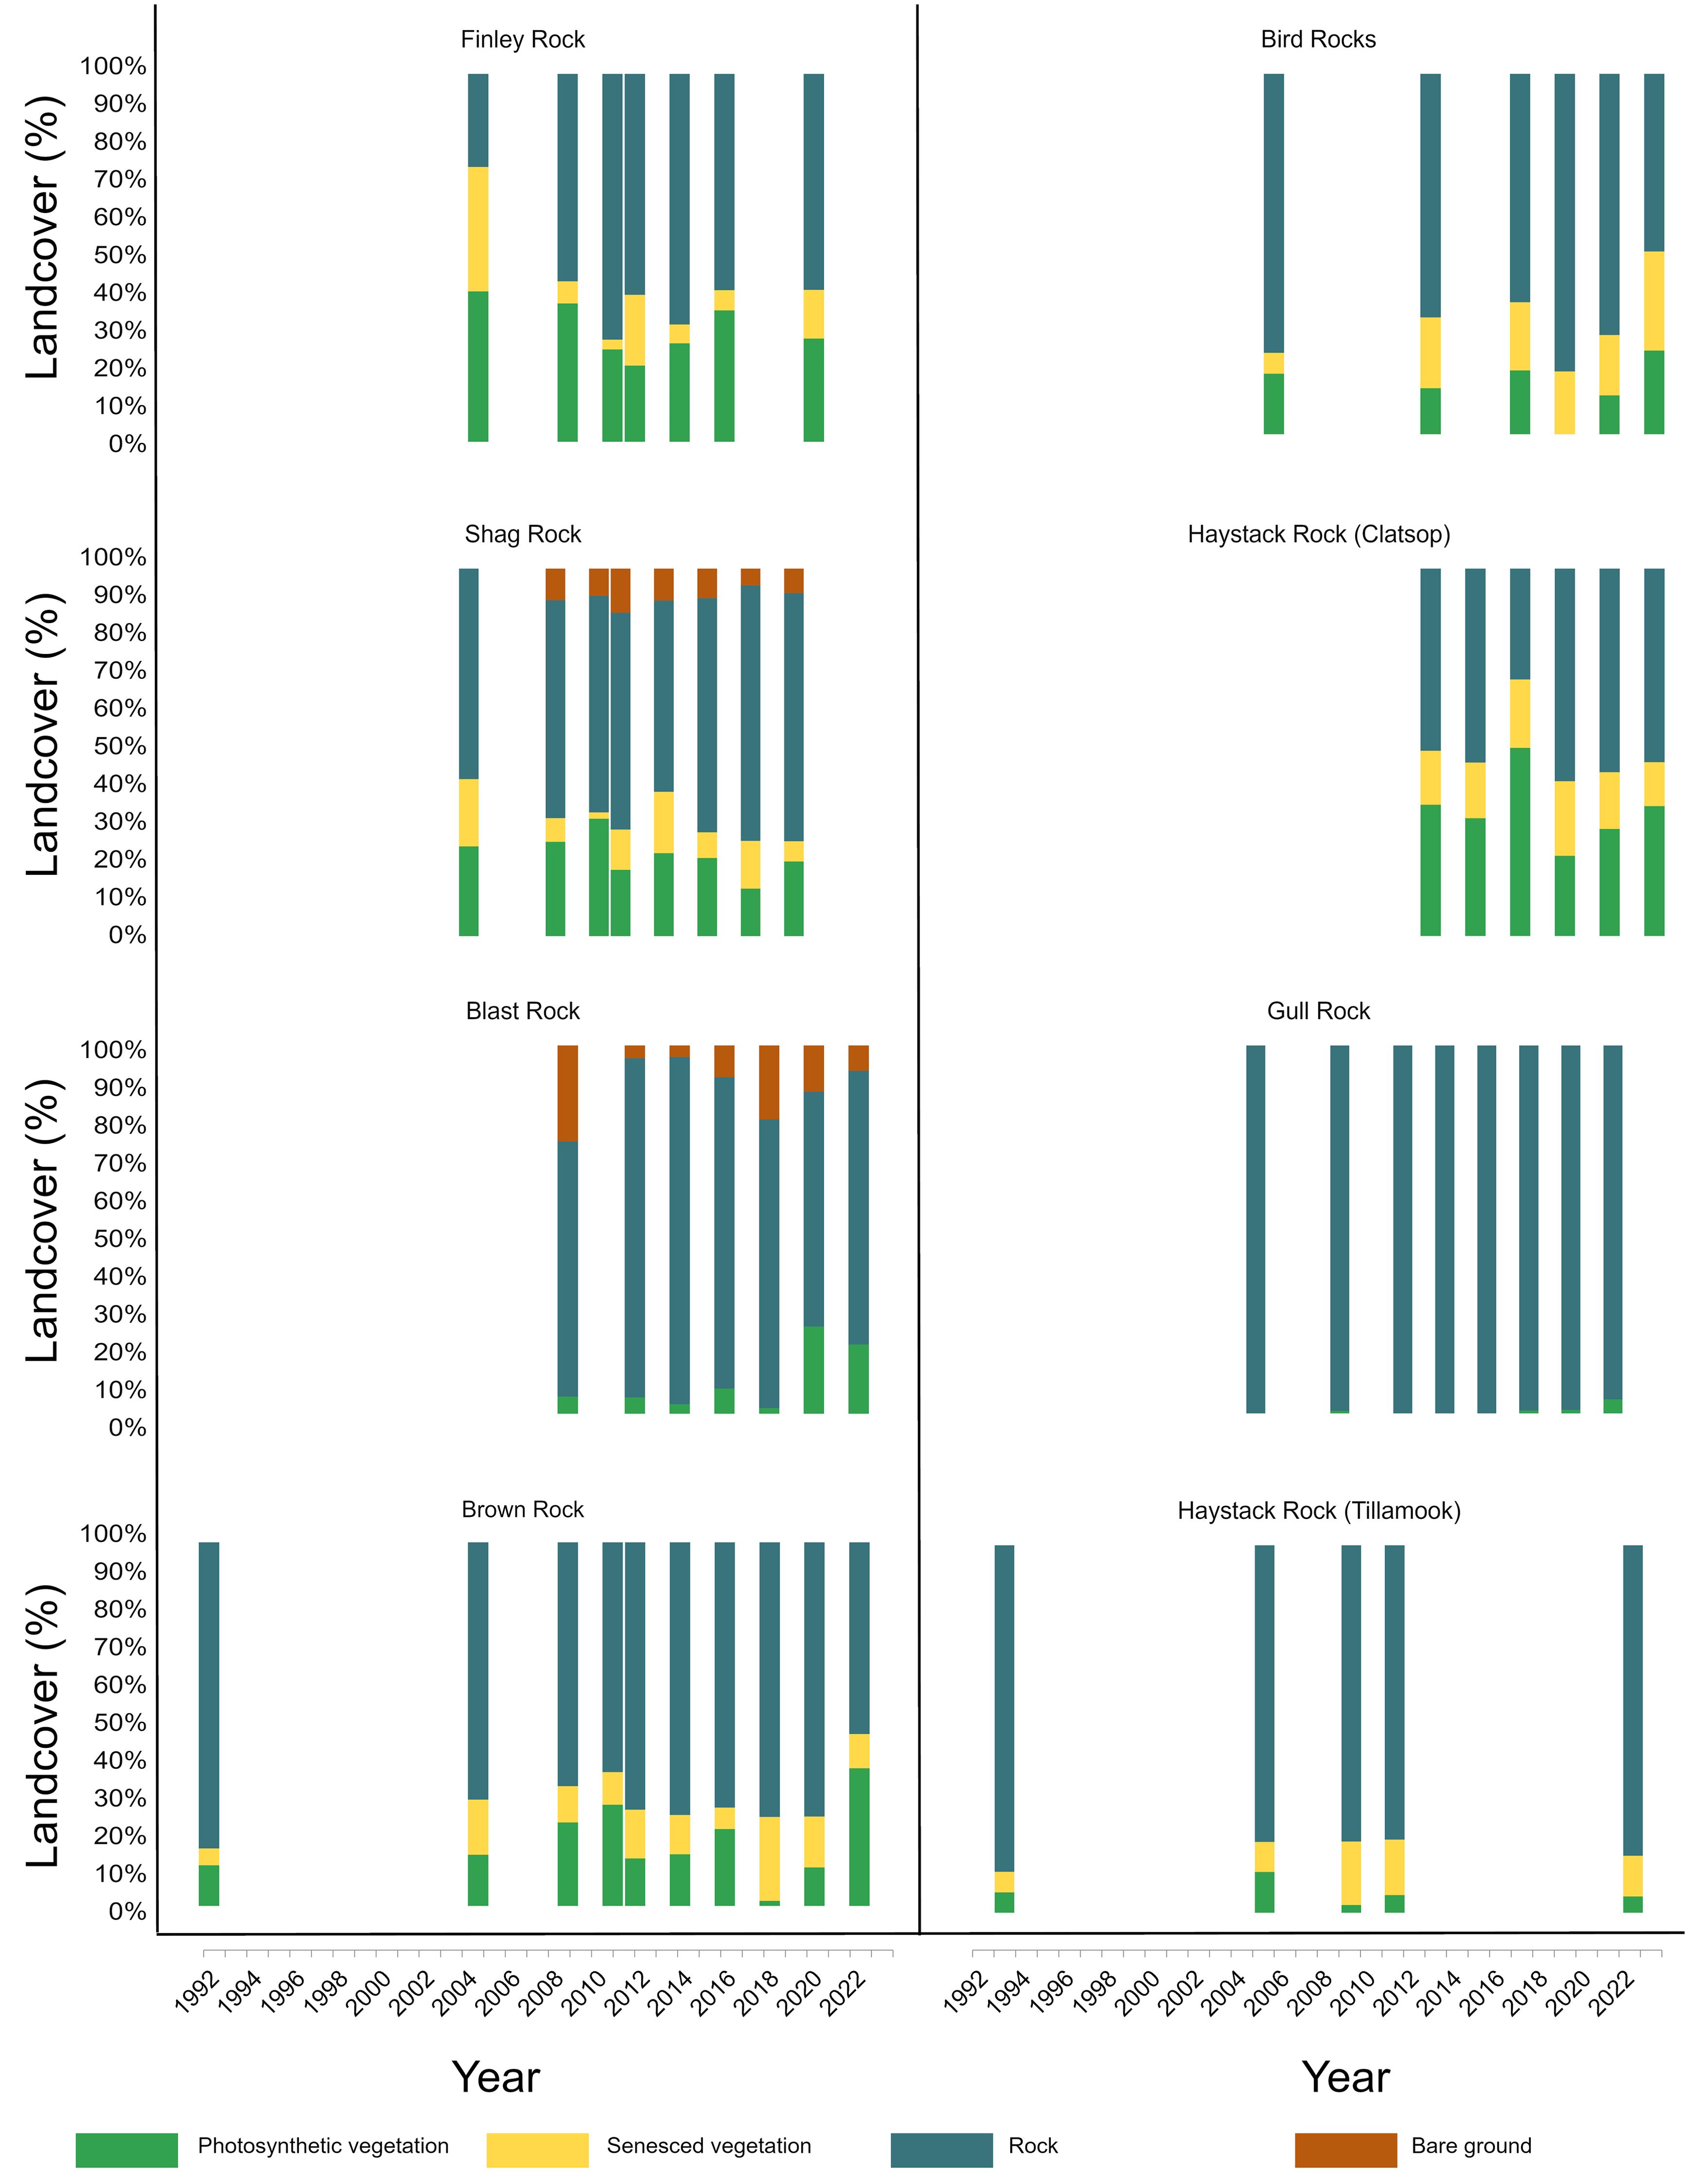
Figure 3. Stacked bar chart displaying landcover percentages at 16 seabird breeding sites from 1992 to 2022. Each bar represents the proportional distribution of landcover types, including photosynthetic vegetation, senesced vegetation, bare ground, and rock.
3.2 Dynamic factor analysis
Our analysis revealed that both photosynthetic and total vegetation trends exhibited cyclical fluctuations with periods of approximately 10–14 years on a coast-wide scale. Both trends illustrated declines from 2012 to 2018, and moderately steep declines from 1997 to 2005 (Figure 4). Additionally, both vegetation trends displayed similar peaks in 1997 and 2012. While photosynthetic vegetation was characterized by a more jagged trendline, indicating short-term fluctuations, compared to the smoother, gradual slopes of the total vegetation trend, these differences were subtle and showed overlapping standard errors. In the results of the photosynthetic vegetation DFA, factor loadings were moderate to strongly positive for 14 of the 16 islands, indicating that vegetation trends on most individual islands were consistent and closely aligned with the coast-wide trend (Figure 4). However, two islands—Haystack Rock (Tillamook) and Finley Rock—exhibited negative loadings on the trend. For the total vegetation DFA, 12 of the 16 islands displayed positive but weak loadings, signifying the vegetation dynamics of each island aligned modestly with the coast-wide trend. Finley Rock, Shag Rock, Haystack Rock (Clatsop), and Island Rock were the negative outliers, although their loadings were moderate to weak (–0.37, –0.01, –0.03, and –0.10, respectively). The mean error indicated the DFA models were relatively unbiased, with a mean error of 0.034 for total vegetation, and mean error of 0.049 for photosynthetic vegetation. The total vegetation trend appeared to be more precise than for photosynthetic vegetation, with RMSE values of 0.487 and 1.101, respectively.
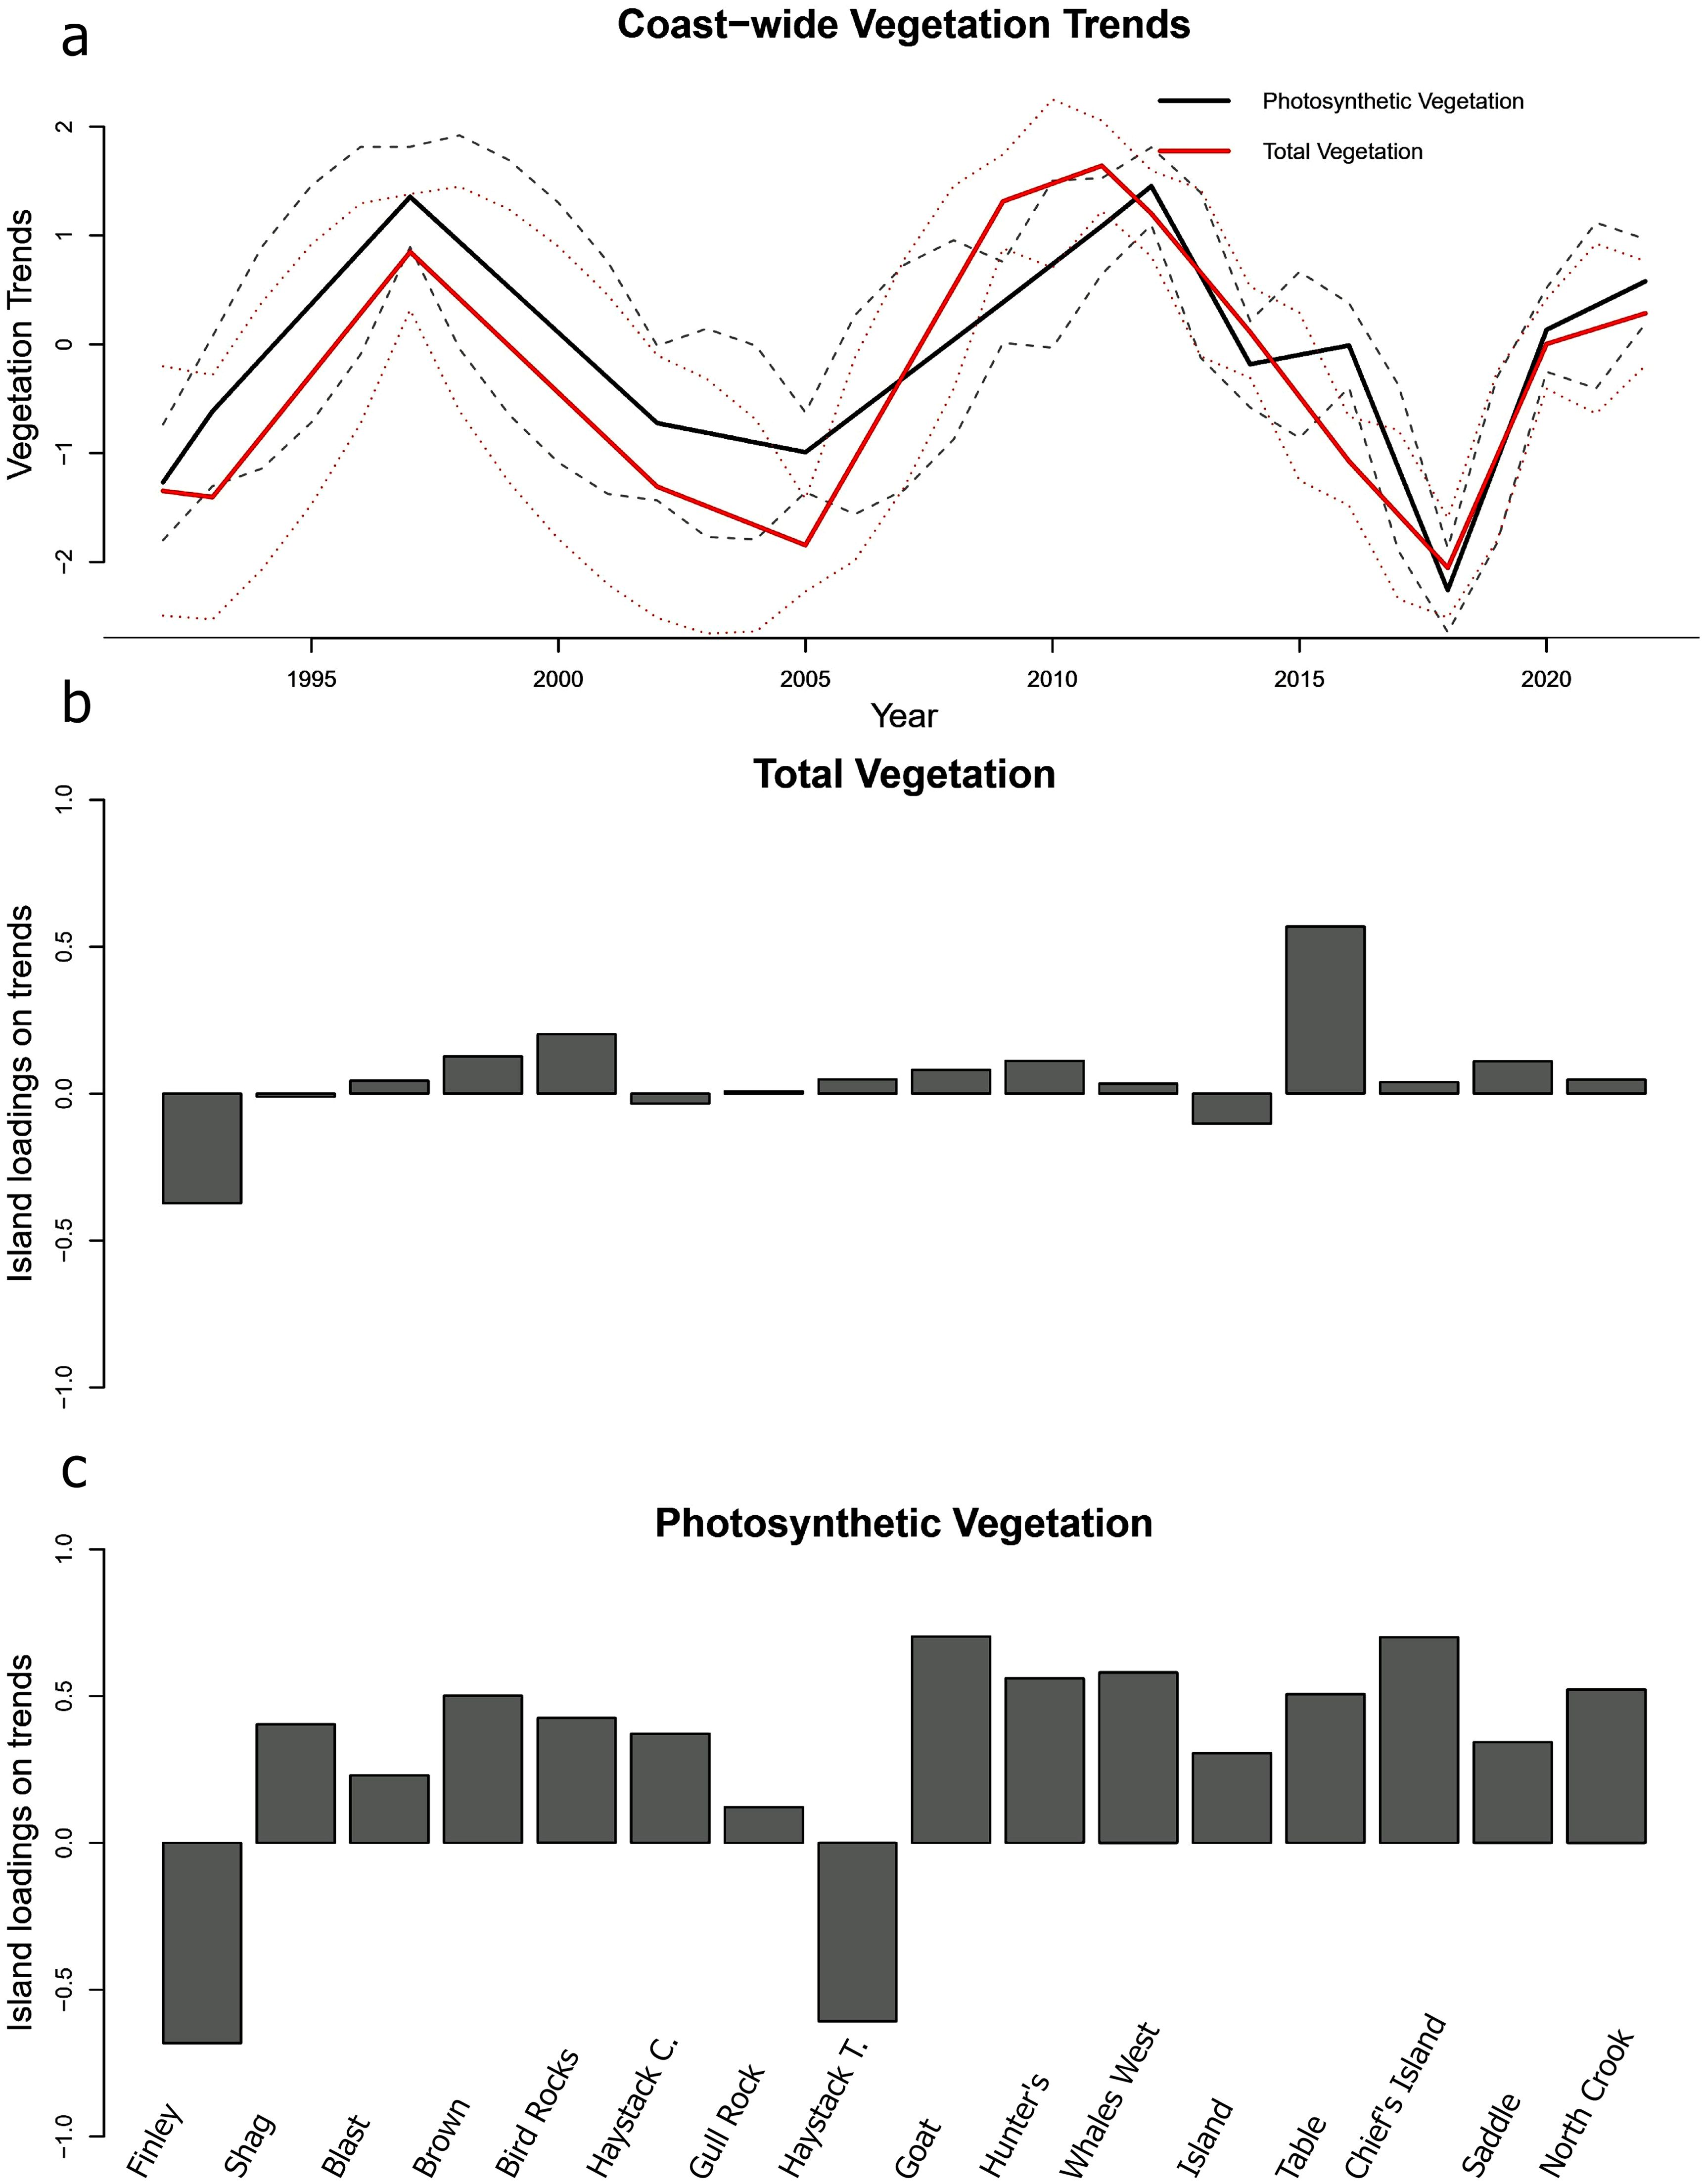
Figure 4. (a) Standardized photosynthetic and total vegetation trends at seabird breeding habitat for the Oregon Coast from 1992 to 2022. Lines indicate the estimated states, and dashed lines indicate the standard errors from Dynamic Factor Analysis. (b, c) Factor loadings for the estimated coast-wide vegetation trends at seabird breeding sites, representing the strength to which each island is represented by the trends. Factor loadings are unitless.
3.3 Environmental predictors
We assessed the correlation between coast-wide averages of climatic and marine conditions (precipitation, temperature, PDO, NPGO, CUTI, BEUTI, and MEI) and the percent cover of photosynthetic and total vegetation (i.e., the trend output from the DFA). Seasonal variables extracted for the Oregon Coast represented a wide range of values over the 30-year period (Supplementary Table S7). An examination of the residuals from the global model indicated that it adequately fit the data and had no obvious outliers. Consequently, we assumed that the model fit was adequate for all candidate models.
The most plausible generalized linear mixed effects model for total vegetation retained Winter NPGO, Winter PDO, and Spring MEI (Table 1). Within the best fit model, Winter PDO appeared to have the greatest influence and was negatively related to the percent cover of total vegetation (Table 2). Spring MEI and Winter NPGO were weakly correlated to the percent cover of total vegetation; however, the confidence intervals contained zero, so the precise nature of the relationship could not be determined.
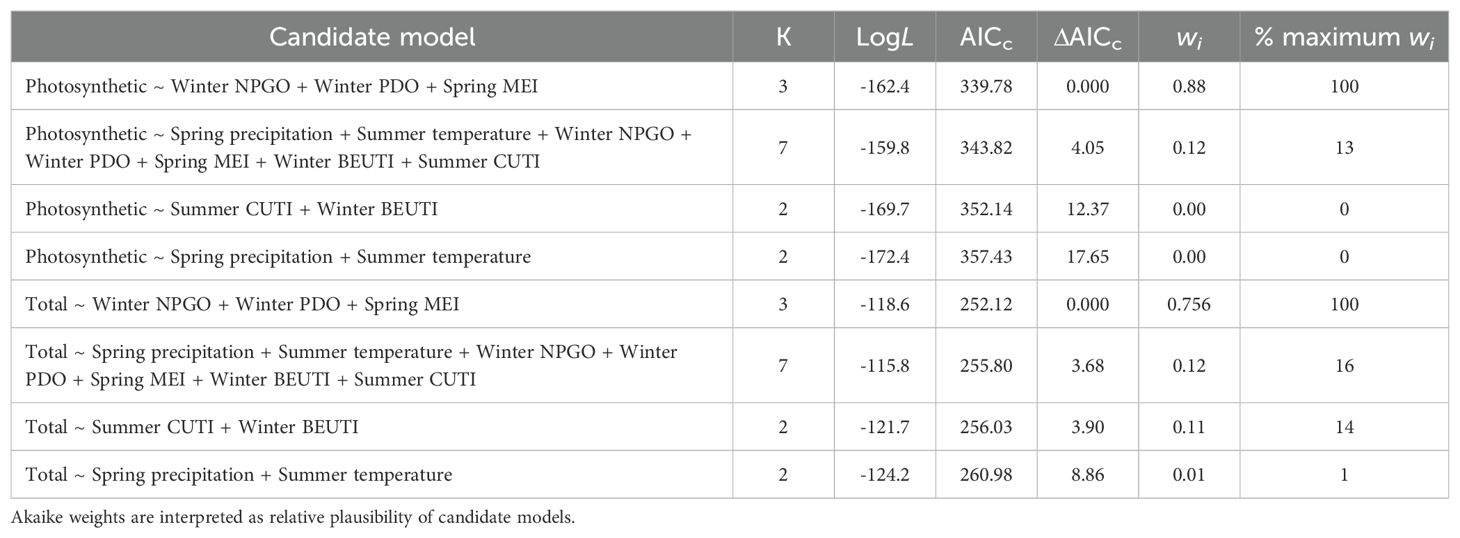
Table 1. Predictor variables, number of parameters (K), log-likelihood (LogL), AICc, ΔAICc, and Akaike weights (w) for the set of candidate models (i) for predicting total and photosynthetic vegetation trends on the Oregon Coast islands.
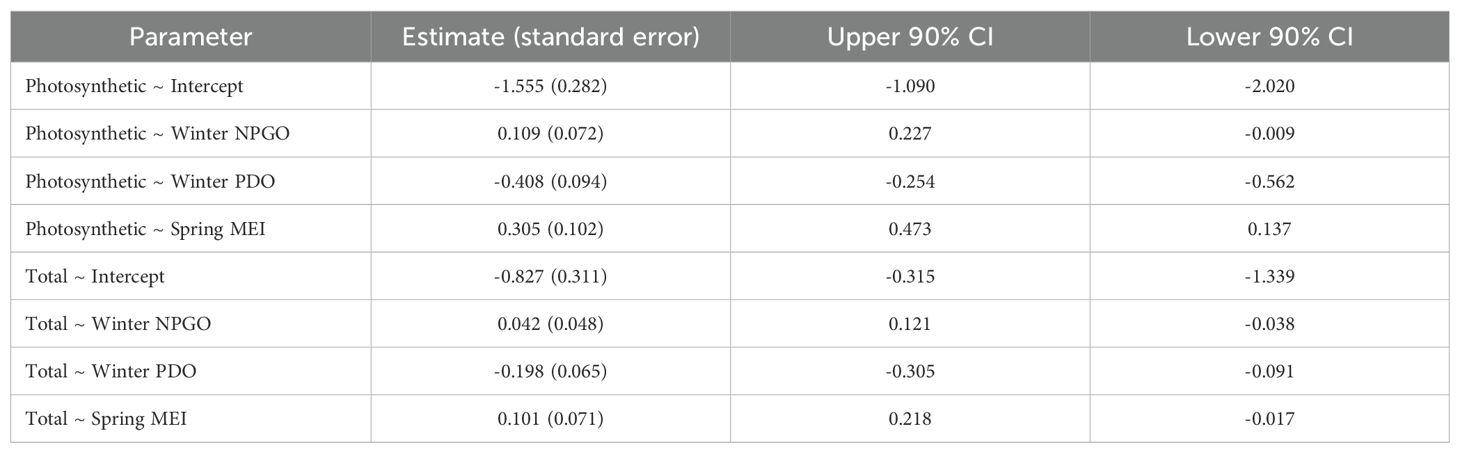
Table 2. Results for the best fit generalized linear mixed model of total and photosynthetic vegetation.
The results from the generalized linear mixed effects model of photosynthetic vegetation showed that the most plausible model contained Winter NPGO, Winter PDO, and Spring MEI (Table 1). Within the best fit model, a significant negative correlation was found between Winter PDO and the percent cover of photosynthetic vegetation (Table 2, Figure 5). In contrast, there was a significant positive correlation between Spring MEI and the percent cover of photosynthetic vegetation. For the remaining predictor, Winter NPGO, confidence intervals contained zero, so the evidence was not precise and inconclusive.
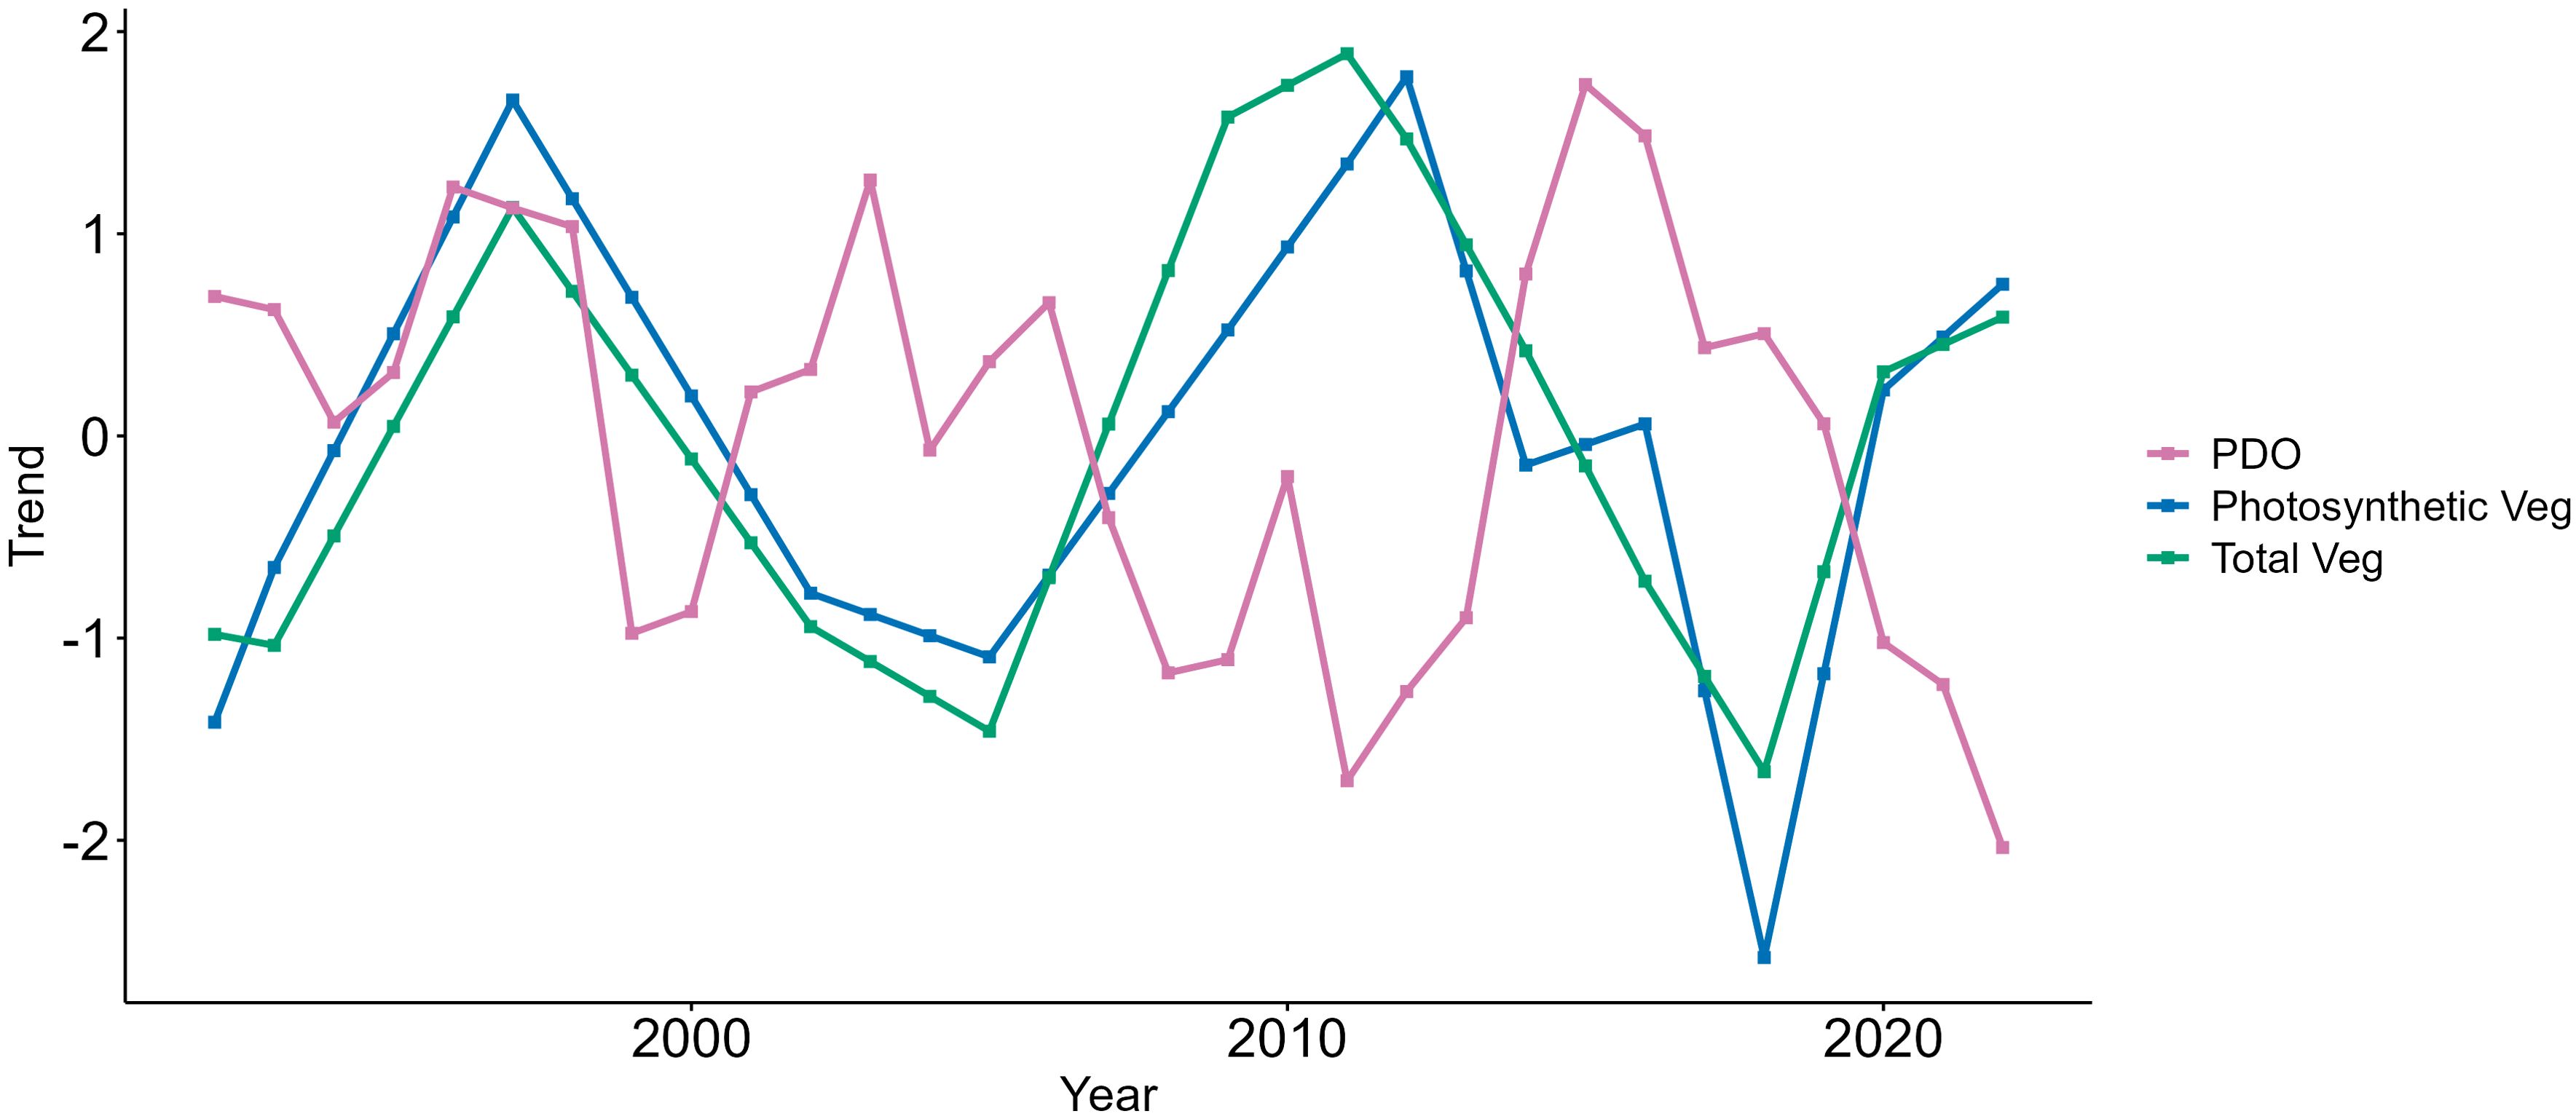
Figure 5. For seabird breeding sites along the Oregon Coast, total and photosynthetic vegetation trends were negatively correlated with the Pacific Decadal Oscillation (PDO). Trends and environmental variables were standardized prior to analysis.
4 Discussion
This study suggests that large scale oceanographic oscillations influence seabird breeding habitats by linking ocean conditions to terrestrial vegetation change. While it is well established that seabirds are affected by large-scale oceanographic fluctuations due to changes in marine food web dynamics (Edwards and Richardson, 2004; Gaston et al., 2009; Gibson et al., 2023; Schmidt et al., 2014), the effects of these oscillations on vegetation at breeding habitats within Oregon islands have not previously been explored. Our study presents evidence of cyclical vegetation change at seabird colonies along the Oregon Coast from 1992 to 2022. Specifically, we found that long-term trends in vegetation cover correlated with large-scale oceanographic oscillations. The best-fit models for photosynthetic and total vegetation retained Winter PDO, Winter NPGO, and Spring MEI. Vegetation cover was negatively correlated with Winter PDO, and positively correlated with Winter NPGO and Spring MEI, though the confidence intervals for Winter NPGO overlapped zero, making the strength of that relationship uncertain. These findings highlight the importance of considering both oceanic and terrestrial conditions when assessing the effects of natural disturbance on seabirds.
One of the goals of this study was to examine how vegetation cover at seabird breeding sites in Oregon changed from 1992 to 2022. The RF classification procedure captured spatiotemporal variability in vegetation within and among the 16 islands. These variations may be influenced by differences in vegetation communities and topography (Bilderback and Bilderback, 2010), varying degrees of soil erosion (Ball and Olthof, 2022), and differences in the abundance of roosting seabirds, all of which may affect vegetation cover. This information can help practitioners prioritize conservation actions, such as planting soil-stabilizing native species or implementing artificial seabird burrows, particularly on islands vulnerable to vegetation loss. Prior to this study, evidence of historical vegetation change on the Oregon Coast was largely anecdotal. By quantifying past and present vegetation trends, this time series analysis provides a baseline for refuge managers to assess where, how, and when vegetation has changed—comparisons that will become increasingly valuable as climate conditions intensify.
On a coast-wide scale, the DFA revealed 10- to 14-year cyclical fluctuations in photosynthetic and total vegetation cover, with positive factor loadings for most of the 16 sites, indicating this trend effectively captured the underlying pattern across the islands. Although this 30-year study represents only a snapshot of longer-term patterns, the vegetation fluctuations observed here align with Stein et al. (2021), who identified significant 14- to 19-year oscillatory patterns in plant water stress for Pacific Northwest coastal vegetation over a 137-year period. This periodicity closely aligns with PDO phases, demonstrating long-term connections between land and sea. Burrow-nesting seabirds on the Oregon islands, such as storm petrel and alcids, have lifespans of 20 to 30 years (Morse and Buchheister, 1977; Hipfner et al., 2019), meaning these vegetation fluctuations may occur one to three times in an individual bird’s lifetime. While linking vegetation change at breeding colonies to seabird survival is beyond the scope of this study, further research would benefit from exploring how long-term vegetation patterns influence multi-generational seabird survival.
Both coast-wide vegetation trends declined sharply after 2012, reaching their lowest points in 2018. This finding aligns with local biologists’ observations of significant vegetation declines during this period. Notably, this decline coincided with the most intense marine heatwave (MHW) ever recorded in the northeast Pacific Ocean, which occurred from January 2014 to August 2016 (Bond et al., 2015; Di Lorenzo and Mantua, 2016; Gentemann et al., 2017). MHWs in the northeast Pacific Ocean are associated with high atmospheric pressure, reduced cloud cover, and suppressed surface wind speeds, which create hot, dry conditions (Di Lorenzo and Mantua, 2016; Holbrook et al., 2020), likely contributing to vegetation stress. These marine-terrestrial links between vegetation and SST are well supported in the literature (Arjasakusuma et al., 2020; Kim et al., 2021; Pereira et al., 2017; Yan et al., 2018). Similar relationships have been documented over longer time scales; Palmer et al. (2023) found that warm SSTs were associated with warm, dry conditions in the Pacific Northwest during the early Holocene, while cooler SSTs in the middle Holocene coincided with wetter conditions and increased vegetative biomass. Given the expected intensification of MHWs with ongoing climate change (Di Lorenzo and Mantua, 2016; Frölicher et al., 2018; Roop et al., 2020), further research is needed to investigate the links between extreme ocean warming events and vegetation loss along the Oregon Coast.
The second part of our study examined the relative influence of climatic variables on vegetation trends over a 30-year period. Our results indicated that winter PDO was strongly and inversely related to total and photosynthetic vegetation cover, with increased vegetation during cool, wet PDO phases and decreased vegetation in warm, dry PDO phases. These findings align with the existing literature on PDO-vegetation dynamics, though effects vary regionally (Berkelhammer, 2019; Guan et al., 2012; Stein et al., 2021; Trouet and Taylor, 2010; Wharton et al., 2009). For example, northern CCE chronologies show a positive correlation between tree growth and PDO, while southern chronologies show a negative correlation (Black, 2009). Similarly, low-elevation Pacific Northwest forests experience increased vegetation growth during cool PDO phases (Stein et al., 2021). PDO directly influences precipitation, wind patterns, temperature, and SSTs, which in turn affect marine fog formation, cloud cover, convective storms, and atmospheric humidity (Berkelhammer, 2019; Persson et al., 2005; Reimer et al., 2015). Stein et al. (2021) found that prolonged plant water stress coincided with PDO-associated shifts in humidity and evapotranspiration, suggesting that cool and wet PDO phases may promote vegetation growth. However, further research is needed to clarify the mechanisms driving PDO-vegetation interactions across different systems.
Our study also found a positive relationship between the warm spring ENSO phase and increased photosynthetic vegetation, consistent with Woodward et al. (2008), who reported greater terrestrial vegetation productivity in the Pacific Northwest during warm ENSO phases. Additionally, warm ENSO phases have been associated with an earlier growing season, leading to earlier leaf emergence and increased spring “green up” (Black et al., 2000; Woodward et al., 2008). Longer growing seasons during El Niño years increase net primary production (Dannenberg et al., 2015), which may explain the observed increase in photosynthetic vegetation.
We found contrasting relationships between vegetation trends and warm phases of ENSO and PDO, likely due to their temporal scales and geographic influence. PDO operates on decadal timescales and has stronger effects in the north Pacific (Mantua and Hare, 2002), whereas ENSO cycles typically occur every 2–7 years and primarily impact equatorial regions (McPhaden et al., 2006). Our findings show that warm ENSO phases are positively correlated with photosynthetic vegetation but not total vegetation cover, suggesting short-term effects. Warm ENSO phases may enhance photosynthetic vegetation in the short term, whereas sustained warm PDO phases may lead to long-term vegetative stress and die-off. Separating photosynthetic and total vegetation in this analysis allowed us to assess whether climate drivers influenced actively growing vegetation differently from total cover, offering insight into short-term versus longer-term vegetation persistence.
Contrary to expectations, average spring precipitation was not significantly correlated with vegetation trends. In the moisture-rich, fog-dense, maritime environment of the Pacific Northwest, vegetation growth may be more influenced by fog, humidity, and wind (Chen et al., 2016; Dong et al., 2019). This suggests that, in coastal environments, indirect moisture mechanisms play a larger role in shaping vegetation dynamics than precipitation levels alone. It is worth noting that considerable variation exists among plant growth habits; herbaceous plants may be more sensitive to year-to-year fluctuations in environmental conditions than longer-lived shrubs (Compagnoni et al., 2021).
While this study focused on vegetation cover due to limitations in the resolution of historical imagery, it is important to recognize that not all vegetation confers the same ecological value for burrow-nesting seabirds. Plant communities, not just cover, influence habitat suitability, with preferences varying among bird species. Auklets, for instance, tend to nest in higher densities in native grass-dominated areas, closer to water and avoid habitats dominated by trees and shrubs (Osborne, 1973; Shuford and Gardali, 2008; Pearson et al., 2009). Storm petrels have also shown preferences for specific plant communities, including grasses and coastal brush fields over woody forested areas (Harris, 1974; d’Entremont et al., 2020; Stokes et al., 2021). Some researchers hypothesize that native perennial grasses, with their rhizomatous root structure, provide greater soil stability than invasive annuals, reducing the risk of burrow collapse (Osborne, 1973; Bancroft et al., 2005; Shuford and Gardali, 2008). Thus, while vegetation cover is a useful coarse indicator, it does not fully reflect habitat suitability among islands if the composition is shifting away from preferred plant species. Further research using species-specific classification could help identify which habitat characteristics are preferred among bird species, most resilient to fluctuations, and contribute to soil stabilization for burrow nesting seabirds.
Beyond its implications for seabird habitat in Oregon, this study provides valuable insights for offshore island management. National Wildlife Refuges throughout the Pacific Northwest are managed to protect habitat for burrow-nesting seabirds such as tufted puffins, rhinoceros auklets, Cassin’s auklets, Leach’s storm petrels, and fork-tailed storm petrels. Managers across the CCE face challenges similar to those in Oregon, including steep, rocky, and often inaccessible terrain on oceanic islands (Mills et al., 2005). This study demonstrates a cost-effective and practical method for evaluating long-term habitat change by integrating field data and aerial imagery. The RF classification of 136 images proved highly accurate for categorizing island land cover types; however, it is important to acknowledge the inherent uncertainty introduced by using historical and NAIP imagery in the RF analysis. Although we restricted our analysis to photographs taken during the summer months, minor temporal differences in image acquisition across years (e.g., May versus July) can lead to discrepancies in vegetation cover calculations. Additionally, variations in weather conditions, acquisition angles, and time of day can affect the spectral signatures of the photos, potentially impacting analytical accuracy. Future studies could improve classification accuracy by using imagery collected under consistent temporal and weather conditions whenever possible. While spatiotemporal changes in vegetation cover may indicate shifts in habitat characteristics, we acknowledge this study does not directly test whether those changes translate to differences in habitat suitability or seabird population performance. Future research is needed to directly establish specific relationships between vegetation composition and seabird breeding success. Nevertheless, the methods described here have the potential to substantially enhance the remote monitoring and management efforts for seabird colonies, offering benefits applicable to sensitive habitats in the Pacific Region and beyond.
While habitat management is a powerful conservation tool, a comprehensive understanding of the myriad factors influencing seabird population dynamics is necessary to effectively protect seabirds and their critical habitats. This study provides foundational habitat information, but vegetation in terrestrial habitat is just one component of the complex system impacting seabird survival. Prior research has shown that prey quality in the CCE declines during specific PDO and ENSO phases, leading to reduced seabird productivity (Ainley and Hyrenbach, 2010; Hipfner et al., 2020). If these oscillations also degrade vegetation in breeding habitat during the same periods, their negative effects on seabirds may be compounded. Additional research is needed to develop a more complete understanding of the interactions between breeding habitat, terrestrial and marine climatic conditions, and human-related disturbances. Future studies integrating these factors will allow managers to better assess the dynamics shaping seabird survival and reproduction in the CCE.
Data availability statement
The raw data supporting the conclusions of this article will be made available by the authors, without undue reservation.
Author contributions
CK: Conceptualization, Data curation, Formal Analysis, Funding acquisition, Investigation, Methodology, Project administration, Resources, Software, Validation, Visualization, Writing – original draft, Writing – review & editing. SS: Conceptualization, Data curation, Investigation, Resources, Writing – original draft, Writing – review & editing. JP: Conceptualization, Data curation, Formal Analysis, Funding acquisition, Investigation, Methodology, Project administration, Resources, Software, Supervision, Validation, Visualization, Writing – original draft, Writing – review & editing. MD: Conceptualization, Data curation, Formal Analysis, Funding acquisition, Investigation, Methodology, Project administration, Resources, Software, Supervision, Validation, Visualization, Writing – original draft, Writing – review & editing.
Funding
The author(s) declare that financial support was received for the research and/or publication of this article. Funding for this study was provided by the U.S. Fish and Wildlife Service Science Applications Program, U.S. Fish and Wildlife Refuges Program, U.S. Fish and Wildlife Seabirds Program, and U.S. Geological Survey Science Support Program.
Acknowledgments
We thank Kate Iaquinto and Alex Cook with the Oregon Coast National Wildlife Refuge Complex, Jamon Van Den Hoek and Don Lyons for offering their valuable insights throughout the project. The authors would also like to thank the Confederated Tribes of the Coos, Lower Umpqua, and Siuslaw Indians for their support and assistance in accessing Chief’s Island for data collection.
Conflict of interest
The authors declare that the research was conducted in the absence of any commercial or financial relationships that could be construed as a potential conflict of interest.
Generative AI statement
The author(s) declare that no Generative AI was used in the creation of this manuscript.
Publisher’s note
All claims expressed in this article are solely those of the authors and do not necessarily represent those of their affiliated organizations, or those of the publisher, the editors and the reviewers. Any product that may be evaluated in this article, or claim that may be made by its manufacturer, is not guaranteed or endorsed by the publisher.
Author disclaimer
Any use of trade, firm, or product names is for descriptive purposes only and does not imply endorsement by the U.S. Government.
Supplementary material
The Supplementary Material for this article can be found online at: https://www.frontiersin.org/articles/10.3389/fevo.2025.1589794/full#supplementary-material
References
Aguilera R., Livingstone D. M., Marcé R., Jennings E., Piera J., and Adrian R. (2016). Using dynamic factor analysis to show how sampling resolution and data gaps affect the recognition of patterns in limnological time series. Inland Waters 6, 284–294. doi: 10.1080/IW-6.3.948
Ainley D. G. and Hyrenbach K. D. (2010). Top-down and bottom-up factors affecting seabird population trends in the California current system, (1985–2006). Prog. Oceanogr. 84, 242–254. doi: 10.1016/j.pocean.2009.10.001
Akaike H. (1998). “Information theory and an extension of the maximum likelihood principle,” in Selected Papers of Hirotugu Akaike. Eds. Parzen E., Tanabe K., and Kitagawa G. (Springer, New York, NY), 199–213. doi: 10.1007/978-1-4612-1694-0_15
Antonietta M., Martinez D., and Guiamet J. J. (2024). Delayed senescence and crop performance under stress: always a functional couple? J. Exp. Bot. 75, 4244–4257. doi: 10.1093/jxb/erae174
Arjasakusuma S., Mutaqin B. W., Sekaranom A. B., and Marfai M. A. (2020). Sensitivity of remote sensing-based vegetation proxies to climate and sea surface temperature variabilities in Australia and parts of Southeast Asia. Int. J. Remote Sens. 41, 8631–8653. doi: 10.1080/01431161.2020.1782509
Ball M. and Olthof K. (2022). Aerial invasive plant inventory of select islands of the Oregon Islands National Wildlife Refuge (Wildlands Conservation Science LLC).
Bancroft W. J., Roberts J. D., and Garkaklis M. J. (2005). Burrow entrance attrition rate in Wedge-tailed Shearwater Puffinus pacificus colonies on Rottnest Island, Western Australia. Mar. Ornithol. 33, 23–26. doi: 10.5038/2074-1235.33.1.637
Barbour M., DeJong T. M., and Pavlik B. M. (1985). “Marine beach and dune plant communities,” in Physiological ecology of North American plant communities. Eds. Chabot B. F. and Mooney H. A. (Chapman and Hall, New York, NY), 296–322.
Barnard P. L., Hoover D., Hubbard D. M., Snyder A., Ludka B. C., Allan J., et al. (2017). Extreme oceanographic forcing and coastal response due to the 2015–2016 El Niño. Nat. Commun. 8, 14365. doi: 10.1038/ncomms14365
Belgiu M. and Drăguţ L. (2016). Random forest in remote sensing: a review of applications and future directions. ISPRS J. Photogramm. Remote Sens. 114, 24–31. doi: 10.1016/j.isprsjprs.2016.01.011
Berkelhammer M. (2019). Synchronous modes of terrestrial and marine productivity in the North Pacific. Front. Earth Sci. 7. doi: 10.3389/feart.2019.00073
Bertrand A., Lengaigne M., Takahashi K., Avadi A., Poulain F., and Harrod C. (2020). El Niño Southern Oscillation (ENSO) effects on fisheries and aquaculture. FAO Fisheries and Aquaculture Technical Paper 660. Food and Agriculture Organization of the United Nations, Rome. doi: 10.4060/ca8348en
Bilderback D. and Bilderback D. (2010). The flora of seven southern islands and rocks of the Oregon Island Nation Wildlife Refuge. Unpublished report (Newport, Oregon: U.S. Fish and Wildlife Service Oregon Coast National Wildlife Refuge Complex).
Black B. A. (2009). Climate-driven synchrony across tree, bivalve, and rockfish growth-increment chronologies of the northeast Pacific. Mar. Ecol. Prog. Ser. 378, 37–46. doi: 10.3354/meps07854
Black T. A., Chen W. J., Barr A. G., Arain M. A., Chen Z., Nesic Z., et al. (2000). Increased carbon sequestration by a boreal deciduous forest in years with a warm spring. Geophys. Res. Lett. 27, 1271–1274. doi: 10.1029/1999GL011234
Black B. A., van der Sleen P., Di Lorenzo E., Griffin D., Sydeman W. J., Dunham J. B., et al. (2018). Rising synchrony controls western North American ecosystems. Global Change Biol. 24, 2305–2314. doi: 10.1111/gcb.14128
Bond N. A., Cronin M. F., Freeland H., and Mantua N. (2015). Causes and impacts of the 2014 warm anomaly in the NE Pacific. Geophys. Res. Lett. 42, 3414–3420. doi: 10.1002/2015GL063306
Boone D. L. (1985). Breeding biology and early life history of the Tufted Puffin (Fratercula cirrhata). Ph.D. dissertation (Corvallis, OR: Oregon State University), 46 p.
Bramwell D. and Caujapé-Castells J. (2011). The biology of island floras (Cambridge University Press).
Bried J., Magalhaes M. C., Bolton M., Neves V. C., Bell E., Pereira J. C., et al. (2009). Seabird habitat restoration on Praia Islet, Azores Archipelago. Ecol. Restor. 27, 27–36. doi: 10.3368/er.27.1.27
Brooks M. E., Kristensen K., van Benthem K. J., Magnusson A., Berg C. W., Nielsen A., et al. (2017). glmmTMB balances speed and flexibility among packages for zero-inflated generalized linear mixed modeling. R J. 9, 378–400. doi: 10.32614/RJ-2017-066
Burnham K. P. and Anderson D. R. (Eds.) (2002). Advanced issues and deeper insights, in: Model selection and multimodel inference: a practical information-theoretic approach (New York, NY: Springer), 267–351. doi: 10.1007/978-0-387-22456-5_6
Bwangoy J.-R. B., Hansen M. C., Roy D. P., Grandi G. D., and Justice C. O. (2010). Wetland mapping in the Congo Basin using optical and radar remotely sensed data and derived topographical indices. Remote Sens. Environ. 114, 73–86. doi: 10.1016/j.rse.2009.08.004
Cadiou B., Bioret F., and Chenesseau D. (2010). Response of breeding European Storm Petrels Hydrobates pelagicus to habitat change. J. Ornithol. 151, 317–327. doi: 10.1007/s10336-009-0458-3
Cánovas-García F., Alonso-Sarría F., Gomariz-Castillo F., and Oñate-Valdivieso F. (2017). Modification of the random forest algorithm to avoid statistical dependence problems when classifying remote sensing imagery. Comput. Geosci. 103, 1–11. doi: 10.1016/j.cageo.2017.02.012
Chavez F. P., Pennington J. T., Castro C. G., Ryan J. P., Michisaki R. P., Schlining B., et al. (2002). Biological and chemical consequences of the 1997–1998 El Niño in central California waters. Prog. Oceanogr. 54, 205–232. doi: 10.1016/S0079-6611(02)00050-2
Chen B., Xu G., Coops N. C., Ciais P., and Myneni R. B. (2016). Satellite-observed changes in terrestrial vegetation growth trends across the Asia-Pacific region associated with land cover and climate from 1982 to 2011. Int. J. Digital Earth 9, 1055–1076. doi: 10.1080/17538947.2016.1180549
Cohen J. (1960). A coefficient of agreement for nominal scales. Educ. psychol. Meas. 20, 37–44. doi: 10.1177/001316446002000104
Compagnoni A., Levin S., Childs D. Z., Harpole S., Paniw M., Römer G., et al. (2021). Herbaceous perennial plants with short generation time have stronger responses to climate anomalies than those with longer generation time. Nat. Commun. 12, 1824. doi: 10.1038/s41467-021-22092-1
Correll M. D., Hantson W., Hodgman T. P., Cline B. B., Elphick C. S., Gregory Shriver W., et al. (2019). Fine-scale mapping of coastal plant communities in the northeastern USA. Wetlands 39, 17–28. doi: 10.1007/s13157-018-1028-3
Croxall J. P., Butchart S. H. M., Lascelles B., Stattersfield A. J., Sullivan B., Symes A., et al. (2012). Seabird conservation status, threats and priority actions: a global assessment. Bird Conserv. Int. 22, 1–34. doi: 10.1017/S0959270912000020
Curtis J. R., Robinson W. D., Rompré G., Moore R. P., and McCune B. (2021). Erosion of tropical bird diversity over a century is influenced by abundance, diet and subtle climatic tolerances. Sci. Rep. 11, 10045. doi: 10.1038/s41598-021-89496-7
Cutler N. A., Kodl G., Streeter R. T., Thompson P. I. J., and Dugmore A. J. (2023). Soil moisture, stressed vegetation and the spatial structure of soil erosion in a high latitude rangeland. Eur. J. Soil Sci. 74, e13393. doi: 10.1111/ejss.13393
d’Entremont K. J. N., Minich Zitske L., Gladwell A. J., Elliott N. K., Mauck R. A., and Ronconi R. A. (2020). Breeding population decline and associations with nest site use of Leach’s Storm-Petrels on Kent Island, New Brunswick from 2001 to 2018. Avian Conserv. Ecol. 15, 11. doi: 10.5751/ACE-01526-150111
Dannenberg M. P., Song C., Hwang T., and Wise E. K. (2015). Empirical evidence of El Niño–Southern Oscillation influence on land surface phenology and productivity in the western United States. Remote Sens. Environ. 159, 167–180. doi: 10.1016/j.rse.2014.11.026
Demongin L., Poisbleau M., Strange I. J., and Quillfeldt P. (2010). Effects of severe rains on the mortality of southern rockhopper penguin (Eudyptes chrysocome) chicks and its impact on breeding success. Ornitol. Neotrop. 21, 439–443. Available online at: https://digitalcommons.usf.edu/ornitologia_neotropical/vol21/iss3/11.
Dias M. P., Martin R., Pearmain E. J., Burfield I. J., Small C., Phillips R. A., et al. (2019). Threats to seabirds: a global assessment. Biol. Conserv. 237, 525–537. doi: 10.1016/j.biocon.2019.06.033
Dicken S. N., Hanneson B., and Johannessen C. L. (1961). Some recent physical changes of the Oregon coast (Eugene: Department of Geography, University of Oregon).
Diffenbaugh N. S., Snyder M. A., and Sloan L. C. (2004). Could CO2-induced land-cover feedbacks alter near-shore upwelling regimes? Proc. Natl. Acad. Sci. 101, 27–32. doi: 10.1073/pnas.0305746101
Di Lorenzo E. and Mantua N. (2016). Multi-year persistence of the 2014/15 North Pacific marine heatwave. Nat. Climate Change 6, 1042–1047. doi: 10.1038/nclimate3082
Di Lorenzo E., Schneider N., Cobb K. M., Franks P. J. S., Chhak K., Miller A. J., et al. (2008). North Pacific Gyre Oscillation links ocean climate and ecosystem change. Geophys. Res. Lett. 35, L08607. doi: 10.1029/2007GL032838
Dong C., MacDonald G. M., Willis K., Gillespie T. W., Okin G. S., and Williams A. P. (2019). Vegetation responses to 2012–2016 drought in Northern and Southern California. Geophys. Res. Lett. 46, 3810–3821. doi: 10.1029/2019GL082137
Durbin J. and Koopman S. J. (2012). Time series analysis by state space methods (Oxford University Press).
Dye A., Rauschenbach S., de Szoeke S., Igel A. L., Jin Y., Kim J. B., et al. (2024). Fog in western coastal ecosystems: inter-disciplinary challenges and opportunities with example concepts from the Pacific Northwest, USA. Front. Environ. Sci. 12. doi: 10.3389/fenvs.2024.1488401
EcoAdapt (2021). Coastal Dunes, Wet Meadows, and Prairie: Climate Change Vulnerability Assessment Summary for the Santa Cruz Mountains Climate Adaptation Project. Version 1.0 (Bainbridge Island, WA: EcoAdapt).
Edwards M. and Richardson A. J. (2004). Impact of climate change on marine pelagic phenology and trophic mismatch. Nature 430, 881–884. doi: 10.1038/nature02808
Everitt J. H., Yang C., Sriharan S., and Judd F. W. (2008). Using high resolution satellite imagery to map black mangrove on the Texas Gulf Coast. J. Coast. Res. 24, 1582–1586. doi: 10.2112/07-0987.1
Frölicher T. L., Fischer E. M., and Gruber N. (2018). Marine heatwaves under global warming. Nature 560, 360–364. doi: 10.1038/s41586-018-0383-9
Galeano A., Urrego L. E., Botero V., and Bernal G. (2017). Mangrove resilience to climate extreme events in a Colombian Caribbean Island. Wetlands Ecol. Manage. 25, 743–760. doi: 10.1007/s11273-017-9548-9
Garner K. L., Chang M. Y., Fulda M. T., Berlin J. A., Freed R. E., Soo-Hoo M. M., et al. (2015). Impacts of sea level rise and climate change on coastal plant species in the central California coast. PeerJ 3, e958. doi: 10.7717/peerj.958
Gaston A. J., Bertram D. F., Boyne A. W., Chardine J. W., Davoren G., Diamond A. W., et al. (2009). Changes in Canadian seabird populations and ecology since 1970 in relation to changes in oceanography and food webs. Environ. Rev. 17, 267–286. doi: 10.1139/A09-013
Gentemann C. L., Fewings M. R., and García‐Reyes M. (2017). Satellite sea surface temperatures along the West Coast of the United States during the 2014–2016 northeast Pacific marine heat wave. Geophys. Res. Lett. 44, 312–319. doi: 10.1002/2016GL071039
Ghimire B., Rogan J., Galiano V. R., Panday P., and Neeti N. (2012). An evaluation of bagging, boosting, and random forests for land-cover classification in Cape Cod, Massachusetts, USA. GIScience Remote Sens. 49, 623–643. doi: 10.2747/1548-1603.49.5.623
Gibson D., Riecke T. V., Catlin D. H., Hunt K. L., Weithman C. E., Koons D. N., et al. (2023). Climate change and commercial fishing practices codetermine survival of a long-lived seabird. Global Change Biol. 29, 324–340. doi: 10.1111/gcb.16482
Gómez C., White J. C., and Wulder M. A. (2016). Optical remotely sensed time series data for land cover classification: a review. ISPRS J. Photogramm. Remote Sens. 116, 55–72. doi: 10.1016/j.isprsjprs.2016.03.008
Gorelick N., Hancher M., Dixon M., Ilyushchenko S., Thau D., and Moore R. (2017). Google Earth Engine: planetary-scale geospatial analysis for everyone. Remote Sens. Environ. 202, 18–27. doi: 10.1016/j.rse.2017.06.031
Gracia A., Rangel-Buitrago N., Oakley J. A., and Williams A. T. (2018). Use of ecosystems in coastal erosion management. Ocean Coast. Manage. 156, 277–289. doi: 10.1016/j.ocecoaman.2017.07.009
Guan B. T., Wright W. E., Chung C.-H., and Chang S.-T. (2012). ENSO and PDO strongly influence Taiwan spruce height growth. For. Ecol. Manage. 267, 50–57. doi: 10.1016/j.foreco.2011.11.028
Guerschman J. P., Hill M. J., Renzullo L. J., Barrett D. J., Marks A. S., and Botha E. J. (2009). Estimating fractional cover of photosynthetic vegetation, non-photosynthetic vegetation and bare soil in the Australian tropical savanna region upscaling the EO-1 Hyperion and MODIS sensors. Remote Sens. Environ. 113, 928–945. doi: 10.1016/j.rse.2009.01.006
Harris S. W. (1974). Status, chronology, and ecology of nesting storm petrels in northwestern California. Condor 76, 249–261. doi: 10.2307/1366725
Hart C. J., Kelly R. P., and Pearson S. F. (2018). Will the California Current lose its nesting Tufted Puffins? PeerJ 6, e4519. doi: 10.7717/peerj.4519
Hatfield J. L. and Prueger J. H. (2015). Temperature extremes: Effect on plant growth and development. Weather Climate Extremes 10, 4–10. doi: 10.1016/j.wace.2015.08.001
Hipfner J. M., Galbraith M., Bertram D. F., and Green D. J. (2020). Basin-scale oceanographic processes, zooplankton community structure, and diet and reproduction of a sentinel North Pacific seabird over a 22-year period. Prog. Oceanogr. 182, 102290. doi: 10.1016/j.pocean.2020.102290
Hipfner J. M., Shervill D., Domalik A. D., Bertram D. F., Lemon M. J. F., Rodway M. S., et al. (2019). Longevity in the Rhinoceros Auklet Cerorhinca monocerata and a comparison with other species of Alcidae. Mar. Ornithol. 47, 223–227.
Hoeg R. and Shutler D. (2023). Soil moisture associations with burrow occupancy and reproductive success of Leach’s Storm-Petrels. J. Field Ornithol. 94, 17. doi: 10.5751/JFO-00339-940317
Holbrook N. J., Sen Gupta A., Oliver E. C. J., Hobday A. J., Benthuysen J. A., Scannell H. A., et al. (2020). Keeping pace with marine heatwaves. Nat. Rev. Earth Environ. 1, 482–493. doi: 10.1038/s43017-020-0068-4
Holmes E. E., Ward E. J., and Scheuerell M. D. (2014). Analysis of multivariate time-series using the MARSS package. NOAA Fisheries Northwest Fisheries Sci. Center 2725, 98112. doi: 10.5281/zenodo.5781847
Holmes E. E., Ward E. J., Scheuerell M. D., and Wills K. (2024). MARSS: multivariate autoregressive state-space modeling. R package version 3.11.9. Available online at: https://CRAN.R-project.org/package=MARSS (Accessed January 15, 2024).
Holmes E. E., Ward E. J., and Wills K. (2012). MARSS: multivariate autoregressive state-space models for analyzing time-series data. R J. 4, 11. doi: 10.32614/RJ-2012-002
Hurvich C. M. and Tsai C.-L. (1989). Regression and time series model selection in small samples. Biometrika 76, 297–307. doi: 10.1093/biomet/76.2.297
Käyhkö N. and Skånes H. (2006). Change trajectories and key biotopes—assessing landscape dynamics and sustainability. Landscape Urban Plann. 75, 300–321. doi: 10.1016/j.landurbplan.2005.02.011
Kim I.-W., Stuecker M. F., Timmermann A., Zeller E., Kug J.-S., Park S.-W., et al. (2021). Tropical Indo-Pacific SST influences on vegetation variability in eastern Africa. Sci. Rep. 11, 10462. doi: 10.1038/s41598-021-89824-x
Lann T., Bao H., Lan H., Zheng H., Yan C., and Peng J. (2024). Hydro-mechanical effects of vegetation on slope stability: A review. Sci. Total Environ. 926, 171691. doi: 10.1016/j.scitotenv.2024.171691
Lewis J., Koracin D., Rabin R., and Businger J. (2003). Sea fog off the California coast: viewed in the context of transient weather systems. J. Geophys. Res.: Atmos. 108, 4457. doi: 10.1029/2002JD002833
Long B. and Skewes T. (1994). “GIS and remote sensing improves mangrove mapping”. in Proceedings of the 7th Australian Remote Sensing Conference, 545–550. (Melbourne: ARSC).
MacKinnon C. M. (1989). Population size, habitat preferences and breeding ecology of the Leach's storm-petrel Oceanodroma leucorhoa, Vieillot, on Bon Portage Island, Nova Scotia. (M.Sc. thesis). Wolfville, NS: Acadia University.
Mantua N. J. and Hare S. R. (2002). The pacific decadal oscillation. J. Oceanogr. 58, 35–44. doi: 10.1023/A:1015820616384
Masson-Delmotte V. P., Zhai P., Pirani S. L., Connors C., Péan S., Berger N., et al. (2021). “IPCC 2021: summary for policymakers,” in Climate change 2021: the physical science basis. Contribution of Working Group I to the Sixth Assessment Report of the Intergovernmental Panel on Climate Change. 2 (1), 2391. (Cambridge University Press).
McPhaden M. J., Zebiak S. E., and Glantz M. H. (2006). ENSO as an integrating concept in Earth Science. Science 314, 1740–1745. doi: 10.1126/science.1132588
Mills K. L., Sydeman W. J., and Hodum P. J. (Eds.) (2005). The California Current marine bird conservation plan, v. 1 (Stinson Beach, CA: PRBO Conservation Science).
Morgan J. L., Gergel S. E., and Coops N. C. (2010). Aerial photography: a rapidly evolving tool for ecological management. BioScience 60, 47–59. doi: 10.1525/bio.2010.60.1.9
Morse D. H., and Buchheister C. W. (1977). Age and survival of breeding Leach's Storm-Petrels in Maine. Bird-Banding 48, 341–349.
Mote P. W. and Salathé E. P. Jr. (2010). Future climate in the Pacific Northwest. Clim. Change 102, 29–50. doi: 10.1007/s10584-010-9848-z
Nagai S., Nasahara K. N., Akitsu T. K., Saitoh T. M., and Muraoka H. (2020). Importance of the collection of abundant ground-truth data for accurate detection of spatial and temporal variability of vegetation by satellite remote sensing, in: Biogeochemical cycles. Am. Geophys. Union (AGU), 223–244. doi: 10.1002/9781119413332.ch11
Naughton M. B., Pitkin D. S., Lowe R. W., So K. J., and Strong C. S. (2007). Catalog of Oregon seabird colonies (Washington, D.C: U.S. Fish and Wildlife Service, Biological Technical Publication FWS/BTP-R1009-2007).
Norman F. I. (1970). Ecological effects of Rabbit reduction on Rabbit Island, Wilsons Promontory, Victoria. Proc. R. Soc. Victoria 83, 235–252.
Orben R. A., Fleishman A. B., Borker A. L., Bridgeland W., Gladics A. J., Porquez J., et al. (2019). Comparing imaging, acoustics, and radar to monitor Leach’s storm-petrel colonies. PeerJ 7, e6721. doi: 10.7717/peerj.6721
Osborne T. O.. (1973). Recent nesting of the rhinoceros auklet in California. Condor 75, 17. doi: 10.2307/1366565
Palmer H. M., Vriesman V. P., Livsey C. M., Fish C. R., and Hill T. M. (2023). Holocene climate and oceanography of the coastal Western United States and California Current System. Clim. Past 19, 199–232. doi: 10.5194/cp-19-199-2023
Park J.-H., An S.-I., and Kug J.-S. (2017). Interannual variability of western North Pacific SST anomalies and its impact on North Pacific and North America. Climate Dyn. 49, 3787–3798. doi: 10.1007/s00382-017-3538-8
Parrish J., Bond N., Nevins H., Mantua N., Loeffel R., Peterson W., et al. (2007). Beached birds and physical forcing in the California Current System. Mar. Ecol. Prog. Ser. 352, 275–288. doi: 10.3354/meps07077
Pearson S. F., Hodum P. J., Schrimpf M., Dolliver J., Good T. P., and Parrish J. K. (2009). Rhinoceros Auklet (Cerorhinca monocerata) burrow counts, burrow density, occupancy rates, and associated habitat variables on Protection Island, Washington: 2008 research progress report (Olympia, WA: Washington Department of Fish and Wildlife, Wildlife Science Division).
Peng J., Tang J., Xie S., Wang Y., Liao J., Chen C., et al. (2024). Evidence for the acclimation of ecosystem photosynthesis to soil moisture. Nat. Commun. 15, 9795. doi: 10.1038/s41467-024-54156-7
Pereira M. P. S., Costa M. H., Justino F., and Malhado A. C. M. (2017). Response of South American terrestrial ecosystems to future patterns of sea surface temperature. Adv. Meteorol. 2017, 2149479. doi: 10.1155/2017/2149479
Persson P. O. G., Neiman P. J., Walter B., Bao J.-W., and Ralph F. M. (2005). Contributions from California coastal-zone surface fluxes to heavy coastal precipitation: a CALJET case study during the strong El Niño of 1998 (Boston, MA: American Meteorological Society). doi: 10.1175/MWR2910.1
Peterson D. W., Kerns B. K., and Dodson E. K. (2014). Climate change effects on vegetation in the Pacific Northwest: a review and synthesis of the scientific literature and simulation model projections (No. PNW-GTR-900) (Portland, OR: U.S. Department of Agriculture, Forest Service, Pacific Northwest Research Station). doi: 10.2737/PNW-GTR-900
Phan T. N., Kuch V., and Lehnert L. W. (2020). Land cover classification using Google Earth Engine and random forest classifier—the role of image composition. Remote Sens. 12, 2411. doi: 10.3390/rs12152411
Piao S., Liu Q., Chen A., Janssens I. A., Fu Y., Dai J., et al. (2019). Plant phenology and global climate change: current progresses and challenges. Global Change Biol. 25, 1922–1940. doi: 10.1111/gcb.14619
Piatt J. F., Roby D. D., Henkel L., and Neuman K. (1997). Habitat use, diet and breeding biology of Tufted Puffins in Prince William Sound, Alaska. Northwestern Nat. 78, 102–109. doi: 10.2307/3536864
Pollard A. M. (2008). The effects of mammalian predators on a southern Oregon colony of Leach’s storm-petrels (Oceanodroma leucorhoa). Ph.D. dissertation (Eugene, OR: University of Oregon).
Qiu X., Sha D., and Meng X. (2019). Optimal methodology for detecting land cover change in a forestry, lakeside environment using NAIP imagery. Int. J. Appl. Geospatial Res. 10, 31–53. doi: 10.4018/IJAGR.2019010102
R Core Team. (2023). R: a language and environment for statistical computing. Version 4.3.2. Vienna, Austria: R Foundation for Statistical Computing. Available online at: https://www.r-project.org/.
Reed D. C., Schmitt R. J., Burd A. B., Burkepile D. E., Kominoski J. S., McGlathery K. J., et al. (2022). Responses of coastal ecosystems to climate change: insights from long-term ecological research. BioScience 72, 871–888. doi: 10.1093/biosci/biac006
Reimer J. J., Vargas R., Rivas D., Gaxiola-Castro G., Hernandez-Ayon J. M., and Lara-Lara R. (2015). Sea surface temperature influence on terrestrial gross primary production along the Southern California Current. PloS One 10, e0125177. doi: 10.1371/journal.pone.0125177
Richardson F. (1961). Breeding biology of the rhinoceros auklet on Protection Island, Washington. Condor 63, 456–473. doi: 10.2307/1365465
Robbins B. D. (1997). Quantifying temporal change in seagrass areal coverage: the use of GIS and low resolution aerial photography. Aquat. Bot. 58, 259–267. doi: 10.1016/S0304-3770(97)00039-9
Roop H. A., Mauger G. S., Morgan H., Snover A. K., and Krosby M. (2020). Shifting snowlines and shorelines: the Intergovernmental Panel on Climate Change's Special Report on the Ocean and Cryosphere and implications for Washington State. Climate Impacts Group, University of Washington. doi: 10.6069/KTVN-WY66
Samelson R. M., Szoeke S. P. de., Skyllingstad E. D., Barbour P. L., and Durski S. M. (2021). Fog and low-level stratus in coupled ocean–atmosphere simulations of the northern California Current System upwelling season. Monthly Weather Rev. 149, 1593–1617. doi: 10.1175/MWR-D-20-0169.1
Schaaf A. A., García C. G., Puechagut P. B., Silvetti L. E., Tallei E., Ortis F., et al. (2018). Effect of geographical latitude and sun exposure on Rufous Hornero (Furnarius rufus) nest orientation. J. Ornithol. 159, 967–974. doi: 10.1007/s10336-018-1569-5
Schmidt A. E., Botsford L. W., Eadie J. M., Bradley R. W., Lorenzo E. D., and Jahncke J. (2014). Non-stationary seabird responses reveal shifting ENSO dynamics in the northeast Pacific. Mar. Ecol. Prog. Ser. 499, 249–258. doi: 10.3354/meps10629
Shuford W. D. and Gardali T. (Eds.) (2008). California Bird Species of Special Concern: A ranked assessment of species, subspecies, and distinct populations of birds of immediate conservation concern in California. Studies of Western Birds 1 (Sacramento: Western Field Ornithologists, Camarillo, California, and California Department of Fish and Game).
Signa G., Mazzola A., and Vizzini S. (2021). Seabird influence on ecological processes in coastal marine ecosystems: an overlooked role? A critical review. Estuar. Coast. Shelf Sci. 250, 107164. doi: 10.1016/j.ecss.2020.107164
Song J., Klotzbach P. J., Dai Y., and Duan Y. (2023). Decadal changes in rapid intensification of western North Pacific tropical cyclones modulated by the North Pacific Gyre Oscillation. Environ. Res. Commun. 5, 071005. doi: 10.1088/2515-7620/ace762
Sousa C., Fatoyinbo L., Neigh C., Boucka F., Angoue V., and Larsen T. (2020). Cloud-computing and machine learning in support of country-level land cover and ecosystem extent mapping in Liberia and Gabon. PloS One 15, e0227438. doi: 10.1371/journal.pone.0227438
Stein R. A., Sheldon N. D., and Smith S. Y. (2021). Pacific Northwest plants record multiannual atmosphere–ocean circulation patterns. J. Geophys. Res.: Atmos. 126, e2021JD035454. doi: 10.1029/2021JD035454
Stokes A. W., Catry P., Matthiopoulos J., Boldenow M., Clark T. J., Guest A., et al. (2021). Combining survey and remotely sensed environmental data to estimate the habitat associations, abundance and distribution of breeding thin-billed prions Pachyptila belcheri and Wilson’s storm-petrels Oceanites oceanicus on a South Atlantic tussac island. Polar Biol. 44, 809–821. doi: 10.1007/s00300-021-02818-8
Tam Y.-K., Ni I.-H., Yau C., Yan M.-Y., Chan W.-S., Chan S.-M., et al. (2013). Tracking the changes of a fish community following a megascale reclamation and ensuing mitigation measures. ICES J. Mar. Sci. 70, 1206–1219. doi: 10.1093/icesjms/fst046
Trouet V. and Taylor A. H. (2010). Multi-century variability in the Pacific North American circulation pattern reconstructed from tree rings. Climate Dyn. 35, 953–963. doi: 10.1007/s00382-009-0605-9
U.S. Fish and Wildlife Service (2005). Regional Seabird Conservation Plan, Pacific Region (Portland, Oregon: U.S. Fish and Wildlife Service, Migratory Birds and Habitat Programs, Pacific Region).
U.S. Fish and Wildlife Service (2009). Oregon Islands, Three Arch Rocks, and Cape Meares National Wildlife Refuges, comprehensive conservation plan and wilderness stewardship plan (Newport, Oregon: Oregon Coast National Wildlife Refuge Complex).
U.S. Fish and Wildlife Service (2020). Species status assessment report for the Tufted Puffin (Fratercula cirrhata), Version 1.0 (Anchorage, Alaska: Anchorage Fish and Wildlife Office).
Van Niel T. G., McVicar T. R., and Datt B. (2005). On the relationship between training sample size and data dimensionality: Monte Carlo analysis of broadband multi-temporal classification. Remote Sens. Environ. 98, 468–480. doi: 10.1016/j.rse.2005.08.011
Verhoeven G., Sevara C., Karel W., Ressl C., Doneus M., and Briese C. (2013). “Undistorting the past: new techniques for orthorectification of archaeological aerial frame imagery,” in Good practice in archaeological diagnostics: non-invasive survey of complex archaeological sites. Eds. Corsi C., Slapšak B., and Vermeulen F. (Springer International Publishing, Cham), 31–67. doi: 10.1007/978-3-319-01784-6_3
Ward E. J., Anderson S. C., Hunsicker M. E., and Litzow M. A. (2022). Smoothed dynamic factor analysis for identifying trends in multivariate time series. Methods Ecol. Evol. 13, 908–918. doi: 10.1111/2041-210X.13788
Wharton S., Chasmer L., Falk M., and Paw U K. T. (2009). Strong links between teleconnections and ecosystem exchange found at a Pacific Northwest old-growth forest from flux tower and MODIS EVI data. Global Change Biol. 15, 2187–2205. doi: 10.1111/j.1365-2486.2009.01952.x
Woodward F. I., Lomas M. R., and Quaife T. (2008). Global responses of terrestrial productivity to contemporary climatic oscillations. Philos. Trans. R. Soc. B 363, 2779–2785. doi: 10.1098/rstb.2008.0017
Xie Y., Sha Z., and Yu M. (2008). Remote sensing imagery in vegetation mapping: a review. J. Plant Ecol. 1, 9–23. doi: 10.1093/jpe/rtm005
Xiu P., Chai F., Curchitser E. N., and Castruccio F. S. (2018). Future changes in coastal upwelling ecosystems with global warming: the case of the California Current System. Sci. Rep. 8, 2866. doi: 10.1038/s41598-018-21247-7
Xu Z. and Zhou G. (2011). Responses of photosynthetic capacity to soil moisture gradient in perennial rhizome grass and perennial bunchgrass. BMC Plant Biol. 11, 21. doi: 10.1186/1471-2229-11-21
Yan H., Sun N., Wigmosta M., Skaggs R., Hou Z., and Leung R. (2018). Next-generation intensity-duration-frequency curves for hydrologic design in snow-dominated environments. Water Resour. Res. 54, 1093–1108. doi: 10.1002/2017WR021290
Yang J., Medlyn B. E., Barton C. V. M., Churchill A. C., De Kauwe M. G., Jiang M., et al. (2023). Green-up and brown-down: Modelling grassland foliage phenology responses to soil moisture availability. Agric. For. Meteorol. 328, 109252. doi: 10.1016/j.agrformet.2022.109252
Yeh S. W., Wang X., Wang C. Z., and Dewitte B. (2015). On the relationship between the North Pacific climate variability and the central Pacific El Niño. J. Clim. 28, 663–677. doi: 10.1175/JCLI-D-14-00137.1
Yen P. P. W., Sydeman W. J., Bograd S. J., and Hyrenbach K. D. (2006). Spring-time distributions of migratory marine birds in the southern California Current: oceanic eddy associations and coastal habitat hotspots over 17 years. Deep Sea Res. Part II: Topical Stud. Oceanogr. 53, 399–418. doi: 10.1016/j.dsr2.2006.01.013
Young L., Suryan R. M., Duffy D., and Sydeman W. J. (2012). Climate change and seabirds of the California current and Pacific Islands ecosystems: observed and potential impacts and management implications. Report to the US Fish and Wildlife Service, Region 1.
Keywords: random forest, time series analysis, habitat classification, seabirds, coastal ecosystems, vegetation cover
Citation: Kusaka CM, Stephensen S, Peterson JT and Davis MJ (2025) Evidence for marine-driven, cyclical fluctuations in burrow-nesting seabird habitat on the Oregon Coast. Front. Ecol. Evol. 13:1589794. doi: 10.3389/fevo.2025.1589794
Received: 08 March 2025; Accepted: 18 July 2025;
Published: 01 August 2025.
Edited by:
Kathryn C. Baer, Forest Service (USDA), United StatesReviewed by:
José Pedro Granadeiro, University of Lisbon, PortugalPeter Convey, British Antarctic Survey (BAS), United Kingdom
Copyright © 2025 Kusaka, Stephensen, Peterson and Davis. This is an open-access article distributed under the terms of the Creative Commons Attribution License (CC BY). The use, distribution or reproduction in other forums is permitted, provided the original author(s) and the copyright owner(s) are credited and that the original publication in this journal is cited, in accordance with accepted academic practice. No use, distribution or reproduction is permitted which does not comply with these terms.
*Correspondence: Carina M. Kusaka, Y2FyaW5hLmt1c2FrYUBvcmVnb25zdGF0ZS5lZHU=