 Markus Pfenninger1,2*
 Liam Langan1
 Barbara Feldmeyer1
 Barbara Fussi3Janik Hoffmann1Jessica Hetzer1Muhidin Šeho3Karl-Heinz Mellert3Thomas Hickler1,4
- 1Senckenberg Biodiversity and Climate Research Centre, Frankfurt, Germany
- 2Johannes Gutenberg Universitat Mainz Institut fur Organismische und Molekulare Evolutionsbiologie, Mainz, Germany
- 3Bayerischen Amts fur Waldgenetik, Teisendorf, Germany
- 4Goethe-Universitat Frankfurt am Main, Frankfurt, Germany
Current climate change species response models usually do not include evolution. We integrated remote sensing with population genomics to improve phenotypic response prediction to drought stress in the key forest tree species European beech (Fagus sylvatica L.). We used whole-genome sequencing of pooled DNA from natural stands along an ecological gradient from humid-cold to warm-dry climate. We phenotyped stands for leaf area index (LAI) and moisture stress index (MSI) for the period 2016-2022. We predicted this data with matching meteorological data and a newly developed genomic population prediction score in a Generalised Linear Model. Model selection showed that the addition of genomic prediction decisively increased the explanatory power. We then predicted the response of beech to future climate change under evolutionary adaptation scenarios. A moderate climate change scenario would allow persistence of adapted beech forests, but not worst-case scenarios. Our approach can thus guide mitigation measures, such as allowing natural selection or proactive evolutionary management.
Introduction
While the anthropogenic greenhouse gas emission driving global warming continues more or less unabated (Friedlingstein et al., 2022), our understanding of climate change impacts on biodiversity and how to potentially mitigate its consequences, is not keeping pace (Jaureguiberry et al., 2022). However, accurately predicting the outcomes of climate change for ecological keystone species, including evolutionary processes, is especially important because entire ecosystems and the benefits they provide to humanity rely on their persistence.
The European beech, Fagus sylvatica L., is playing a significant ecological role as beech forests provide a habitat for over 6,000 plant and animal species (Brunet et al., 2010; Dorow et al., 2010). Beyond the key position in European woodland ecosystems, the importance of beech for ecosystem services, the economy and society can hardly be overestimated (Elsasser et al., 2021). Therefore, ancient and primeval beech forests of Europe are listed as UNESCO world heritage (Heim et al., 2018). Its distribution is mainly limited by water availability, as the tree cannot tolerate extended wet or dry conditions (Sutmöller et al., 2008). Recent drought years have had a severe impact on the beech trees in Germany (Paar et al., 2019), severely damaging or killing locally up to 7% of trees. As previously shown (Bressem, 2008), it was primarily medium to old-aged beeches that were affected by drought stress. However, this mortality might occur only many years after the actual drought event (Leuschner, 2020). Accordingly, the German forest inventory data shows continuously increasing beech mortality, while mortality of most other assessed tree species has been declining again. However, local populations vary in tolerance to drought (Harter et al., 2015; Bolte et al., 2016), and the impact on individual tree vitality depends at least partially on their genomic composition (Pfenninger et al., 2021). Because prolonged drought periods are predicted for the decades to come (Christensen et al., 2007), the species may severely suffer under future climatic conditions (Sutmöller et al., 2008). Accurate predictions of climate change impacts on beech forests are therefore urgently needed for the development of efficient mitigation strategies.
Several recent contributions identified evolutionary genomics as a fast and efficient approach for accurate predictions of climate change impacts on species (Waldvogel et al., 2020). These approaches suggest mainly genomic environmental associations (GEA) to identify genetic variation associated with environmental gradients and then predict either their spatial shifts or (mal)adaptation (Capblancq et al., 2020). These approaches rely on two crucial assumptions. First, it is supposed that a linear or continuous relation between the frequency of the genetic variants underlying the trait and the selectively relevant environmental variation exists (Zheng et al., 2020). However, it has recently been shown that the variants underlying a continuous, additive, quantitative polygenic trait need not follow a clinal pattern (Lotterhos, 2022). This is the case even if the trait perfectly co-varies with the selectively relevant environmental gradient, because intermediate phenotypes of even moderately polygenic traits can arise from thousands of different genotypes. Consequently, the expectation of continuous allele frequencies along environmental gradients may lead to the identification of false positives (Lotterhos, 2022). As most traits have a polygenic basis (Mathieson, 2021), this finding appears to be a serious challenge for GEA.
The second critical assumption is that the populations screened are locally adapted to their position on the environmental gradient (Capblancq et al., 2020). This assumption may be violated, because anthropogenic climate change is ongoing, and depending on evolutionary potential, life-span etc., the populations currently assessed may already be mal-adapted (Brady et al., 2019). This could be especially true for species living long enough to actually experiencing climate change instead of weather dynamics. A lack of local adaptation may arise from the partial management many species of human interest, like forest trees or otherwise exploited species, are subjected. Local populations could thus have been restocked, planted, selectively harvested or otherwise managed, not allowing them to adapt to local conditions (Frank et al., 2017). This could be particularly relevant for beeches, as many current forests in Europe have emerged from afforestation (Brunet et al., 2012).
The prediction of climate change responses of key phenotypic traits may be an alternative approach. The variation in most quantitative traits has both an environmental and a genetic component (Walsh and Lynch, 2018). If the genetic basis of the trait is known, a validated polygenic or genomic prediction score composed of the weighted sum of associated alleles can be calculated from the respective multilocus genotype at the identified trait loci (Dudbridge, 2013). If estimates of a phenotypic reaction norm and a genomic prediction score are available, prediction of the trait response under not yet observed environmental conditions should be possible (Arnold et al., 2019).
We propose here a climate change prediction approach for F. sylvatica based on genomic prediction (GP) of drought resistance as a key phenotypic trait drawing on the recent identification of the genomic basis of drought resistance in beech (Pfenninger et al., 2021). We extend the genotype-based GP model to population allele frequency data. We include relevant weather observations for the period 2016–2022 as environmental data to validate the model and explain observed phenotypic data from genotyped beech stands obtained by remote sensing for 15 beech populations across Germany. This validated model was then used to predict drought response to future climate scenarios under three different evolutionary adaptation scenarios, i) no adaptation at all, ii) observed rate of adaptation among growth classes and iii) evolution of maximum observed drought resistance (Supplementary Figure 1).
Results
Long-term climate and weather
Long-term climate data (1970 – 2000 (Fick and Hijmans, 2017)) during the vegetation period (Apr - Sep) ordinated the sampling sites (Table 1, Figure 1A) along two supported axes in a PCA. PCA1 (69.7% of variance) opposed warmer and cooler sites, while PCA2 (17.6%) distinguished between wet and dry sites (Figure 1B). Since the difference in precipitation was not substantial among the warmer sites, we applied PCA1 as predictor for summer drought risk and thus local adaptation.
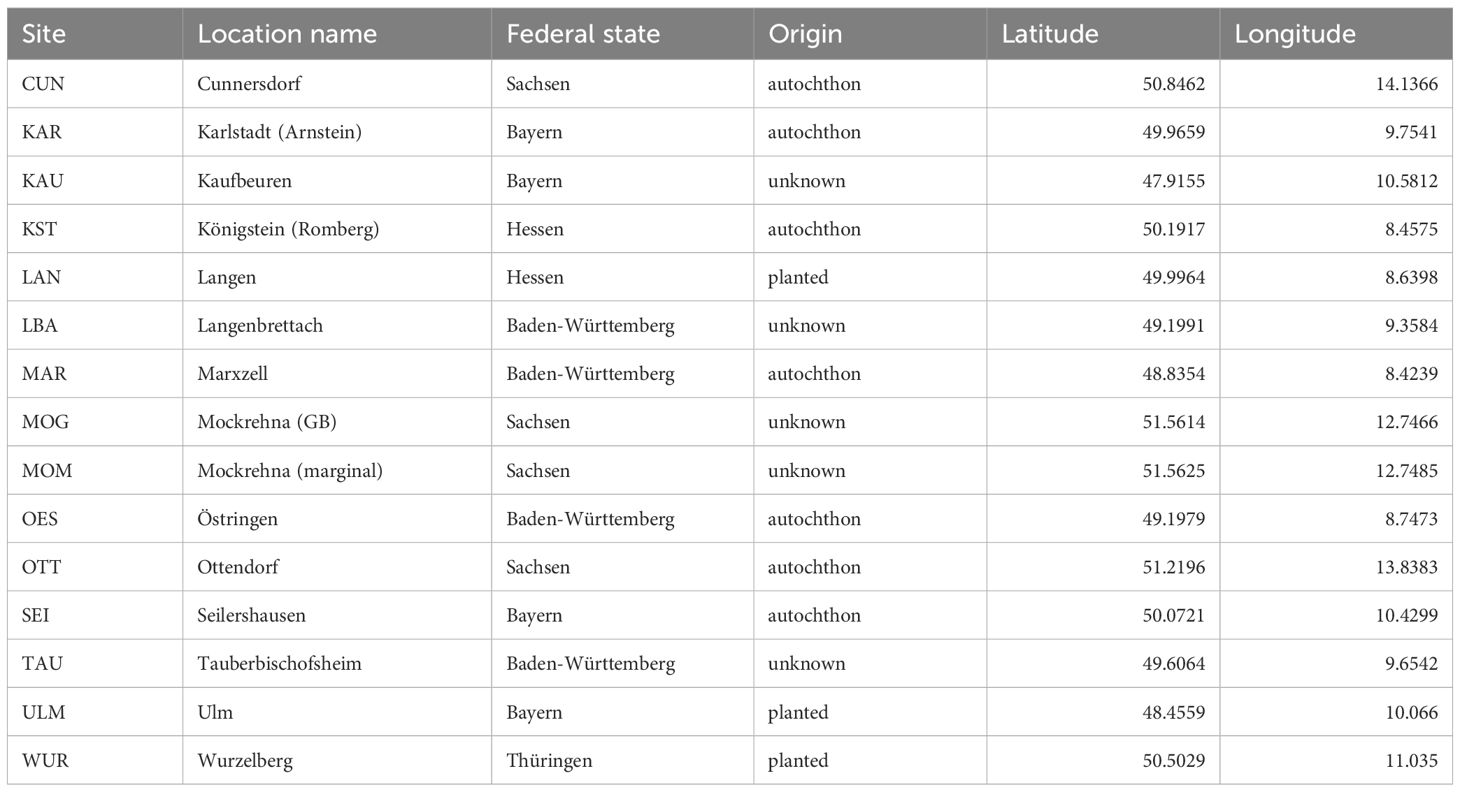
Table 1. Sampling sites.
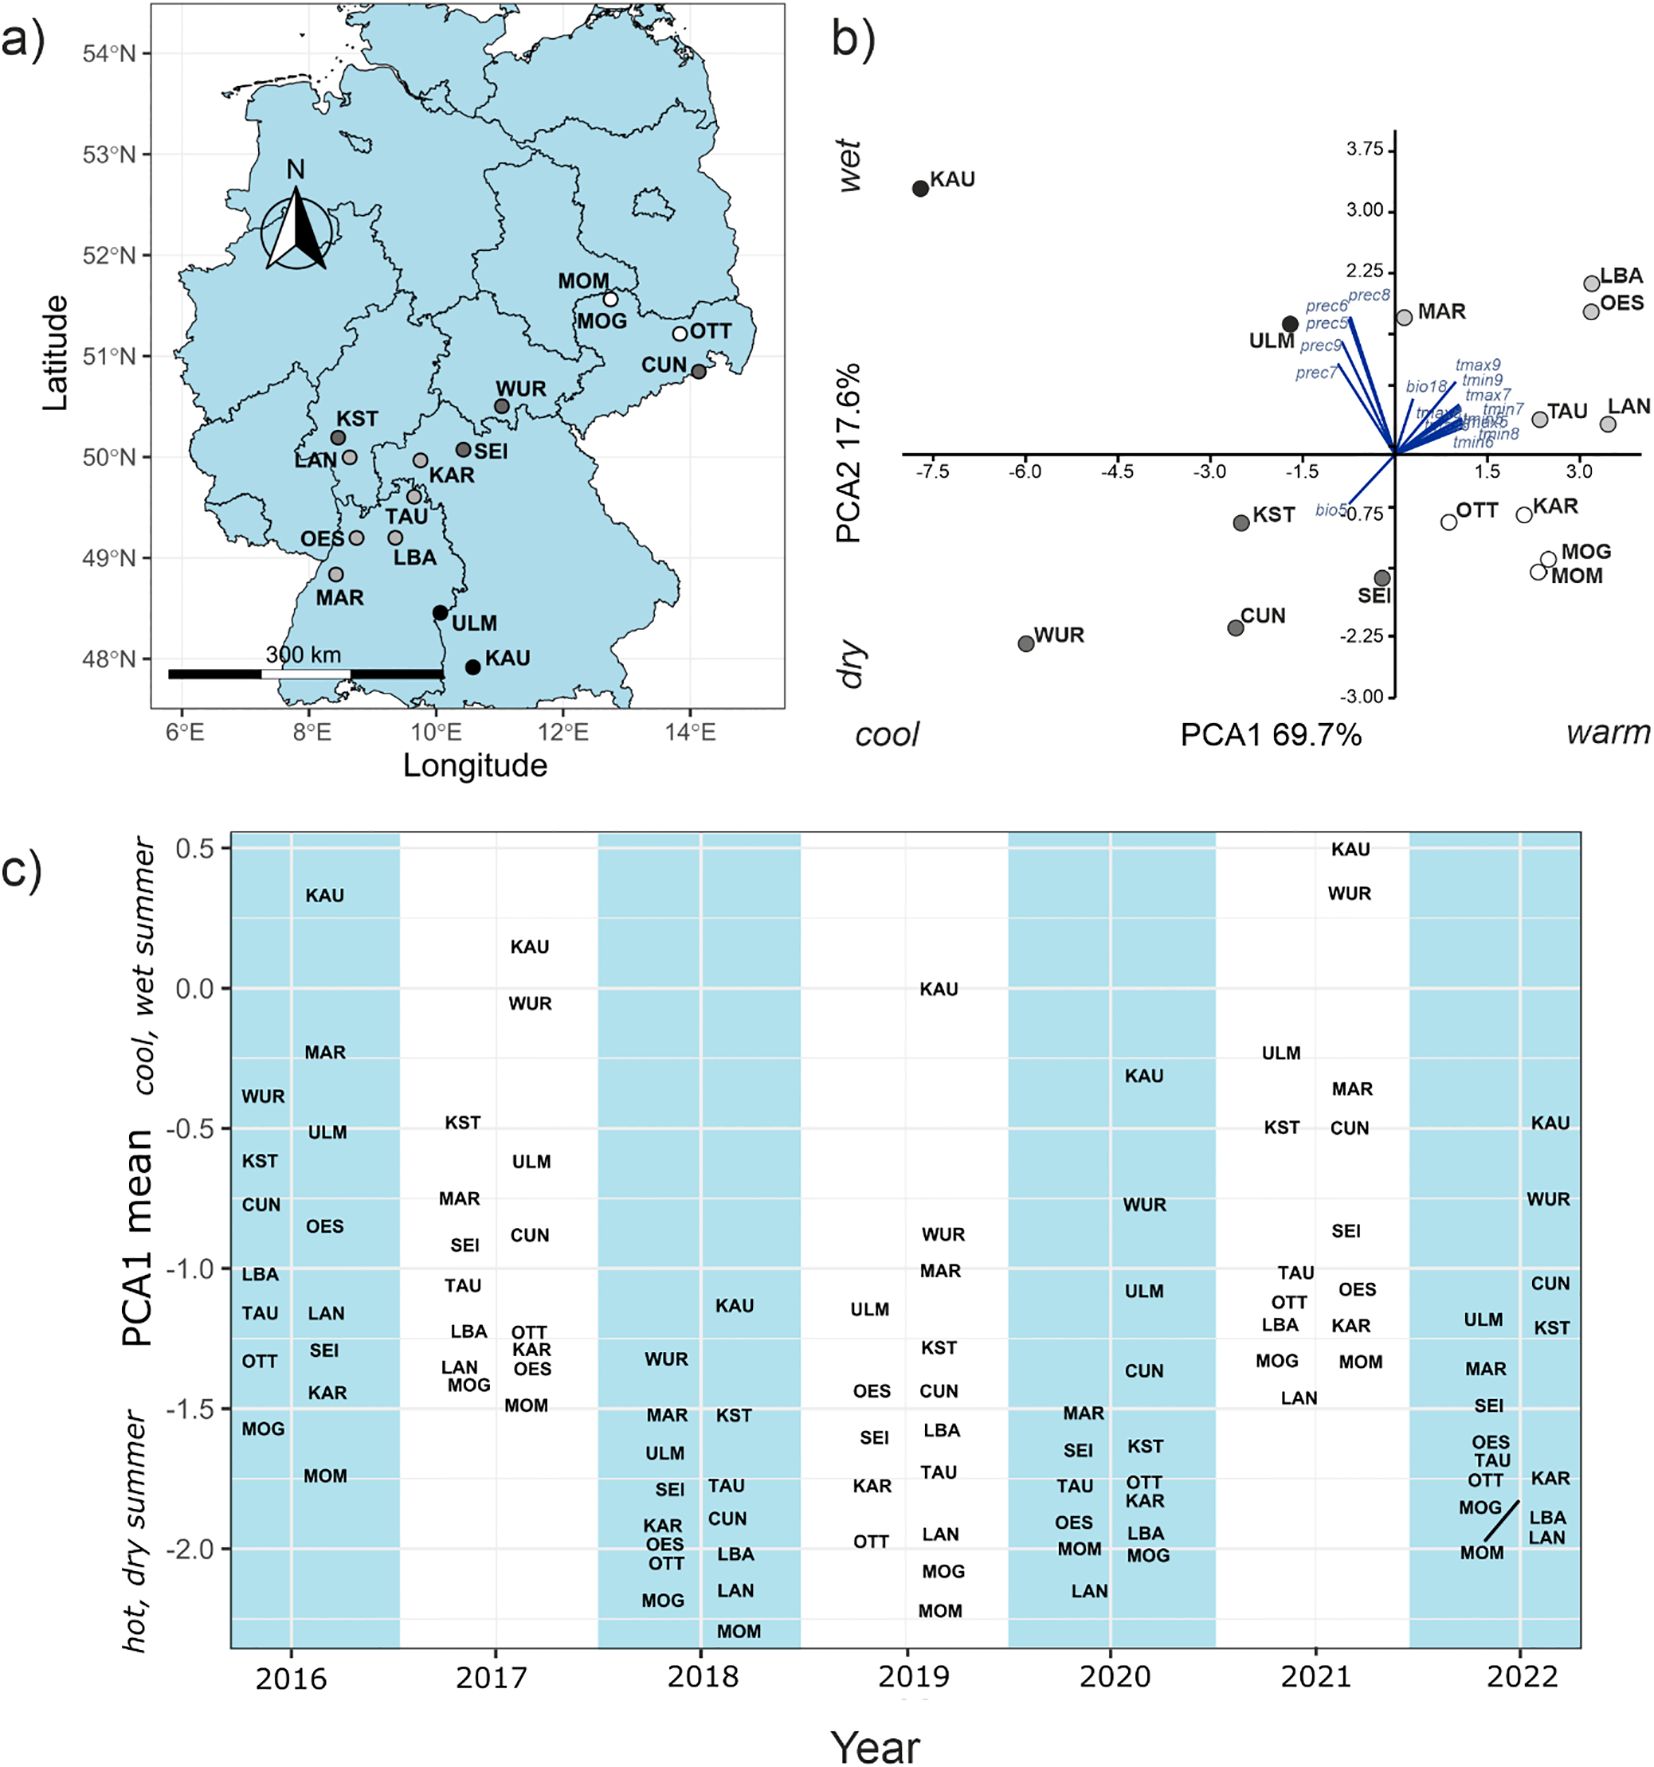
Figure 1. (A) Geographic distribution of sampling sites the shading indicates the position of the sampling site on the climate gradient shown in (B) PCA of long-term climatic data during the vegetation period for the sampling sites. Contributing vectors of the climate variables (prec = precipitation, temp = temperature in the respective months, bio = BioClim variable) (C) Annual means of PCA-scores on meteorological data during the vegetation period (May-Sep) for the sampling sites for each year 2016-2022. Higher values indicate cooler and moister years.
Weather data from German Weather Service (DWD) varied strongly during the observation period (2016-2022) from year to year and from site to site, as the plot of the annual PCA1 site score means (89% of variation) showed (Figure 1C). The summers of 2016, 2017 and 2021 were relatively cool and wet, resembled much more the long-term climate 1970–2000 period, and therefore served as baseline in analyses. The vegetation periods in the years 2018, 2019, 2020 and 2022 were in comparison characterised by unusual drought, i.e. higher temperatures and less precipitation.
Genetic variation and population structure
We obtained a mean sequencing coverage of 40X from 15 population pools with 48 canopy forming individuals each, i.e. 720 individuals. We scored about 2.6 million high-quality SNPs. Mean nucleotide diversity π within sites was 0.0080 (s.d. 0.0007) corresponding to one SNP per 125 base pairs. Mean theta Θ was 0.0086 (s.d. 0.0008). Assuming a seed-to-seed mutation rate in the order of 2 x 10⁻⁹ gave an estimated effective population size Ne of about 106. Mean FST of all pairwise comparisons in 33,768 1kb windows was 0.039 (s.d. 0.009). This was in the range of different age classes within two of the sites (LAN and KST, Figure 2A). Correlating the genome-wide mean FST among sampling sites with the geographic distance yielded no indication for isolation-by-distance (Mantel’s test r = -0.11, p = 0.786, Figure 2B).
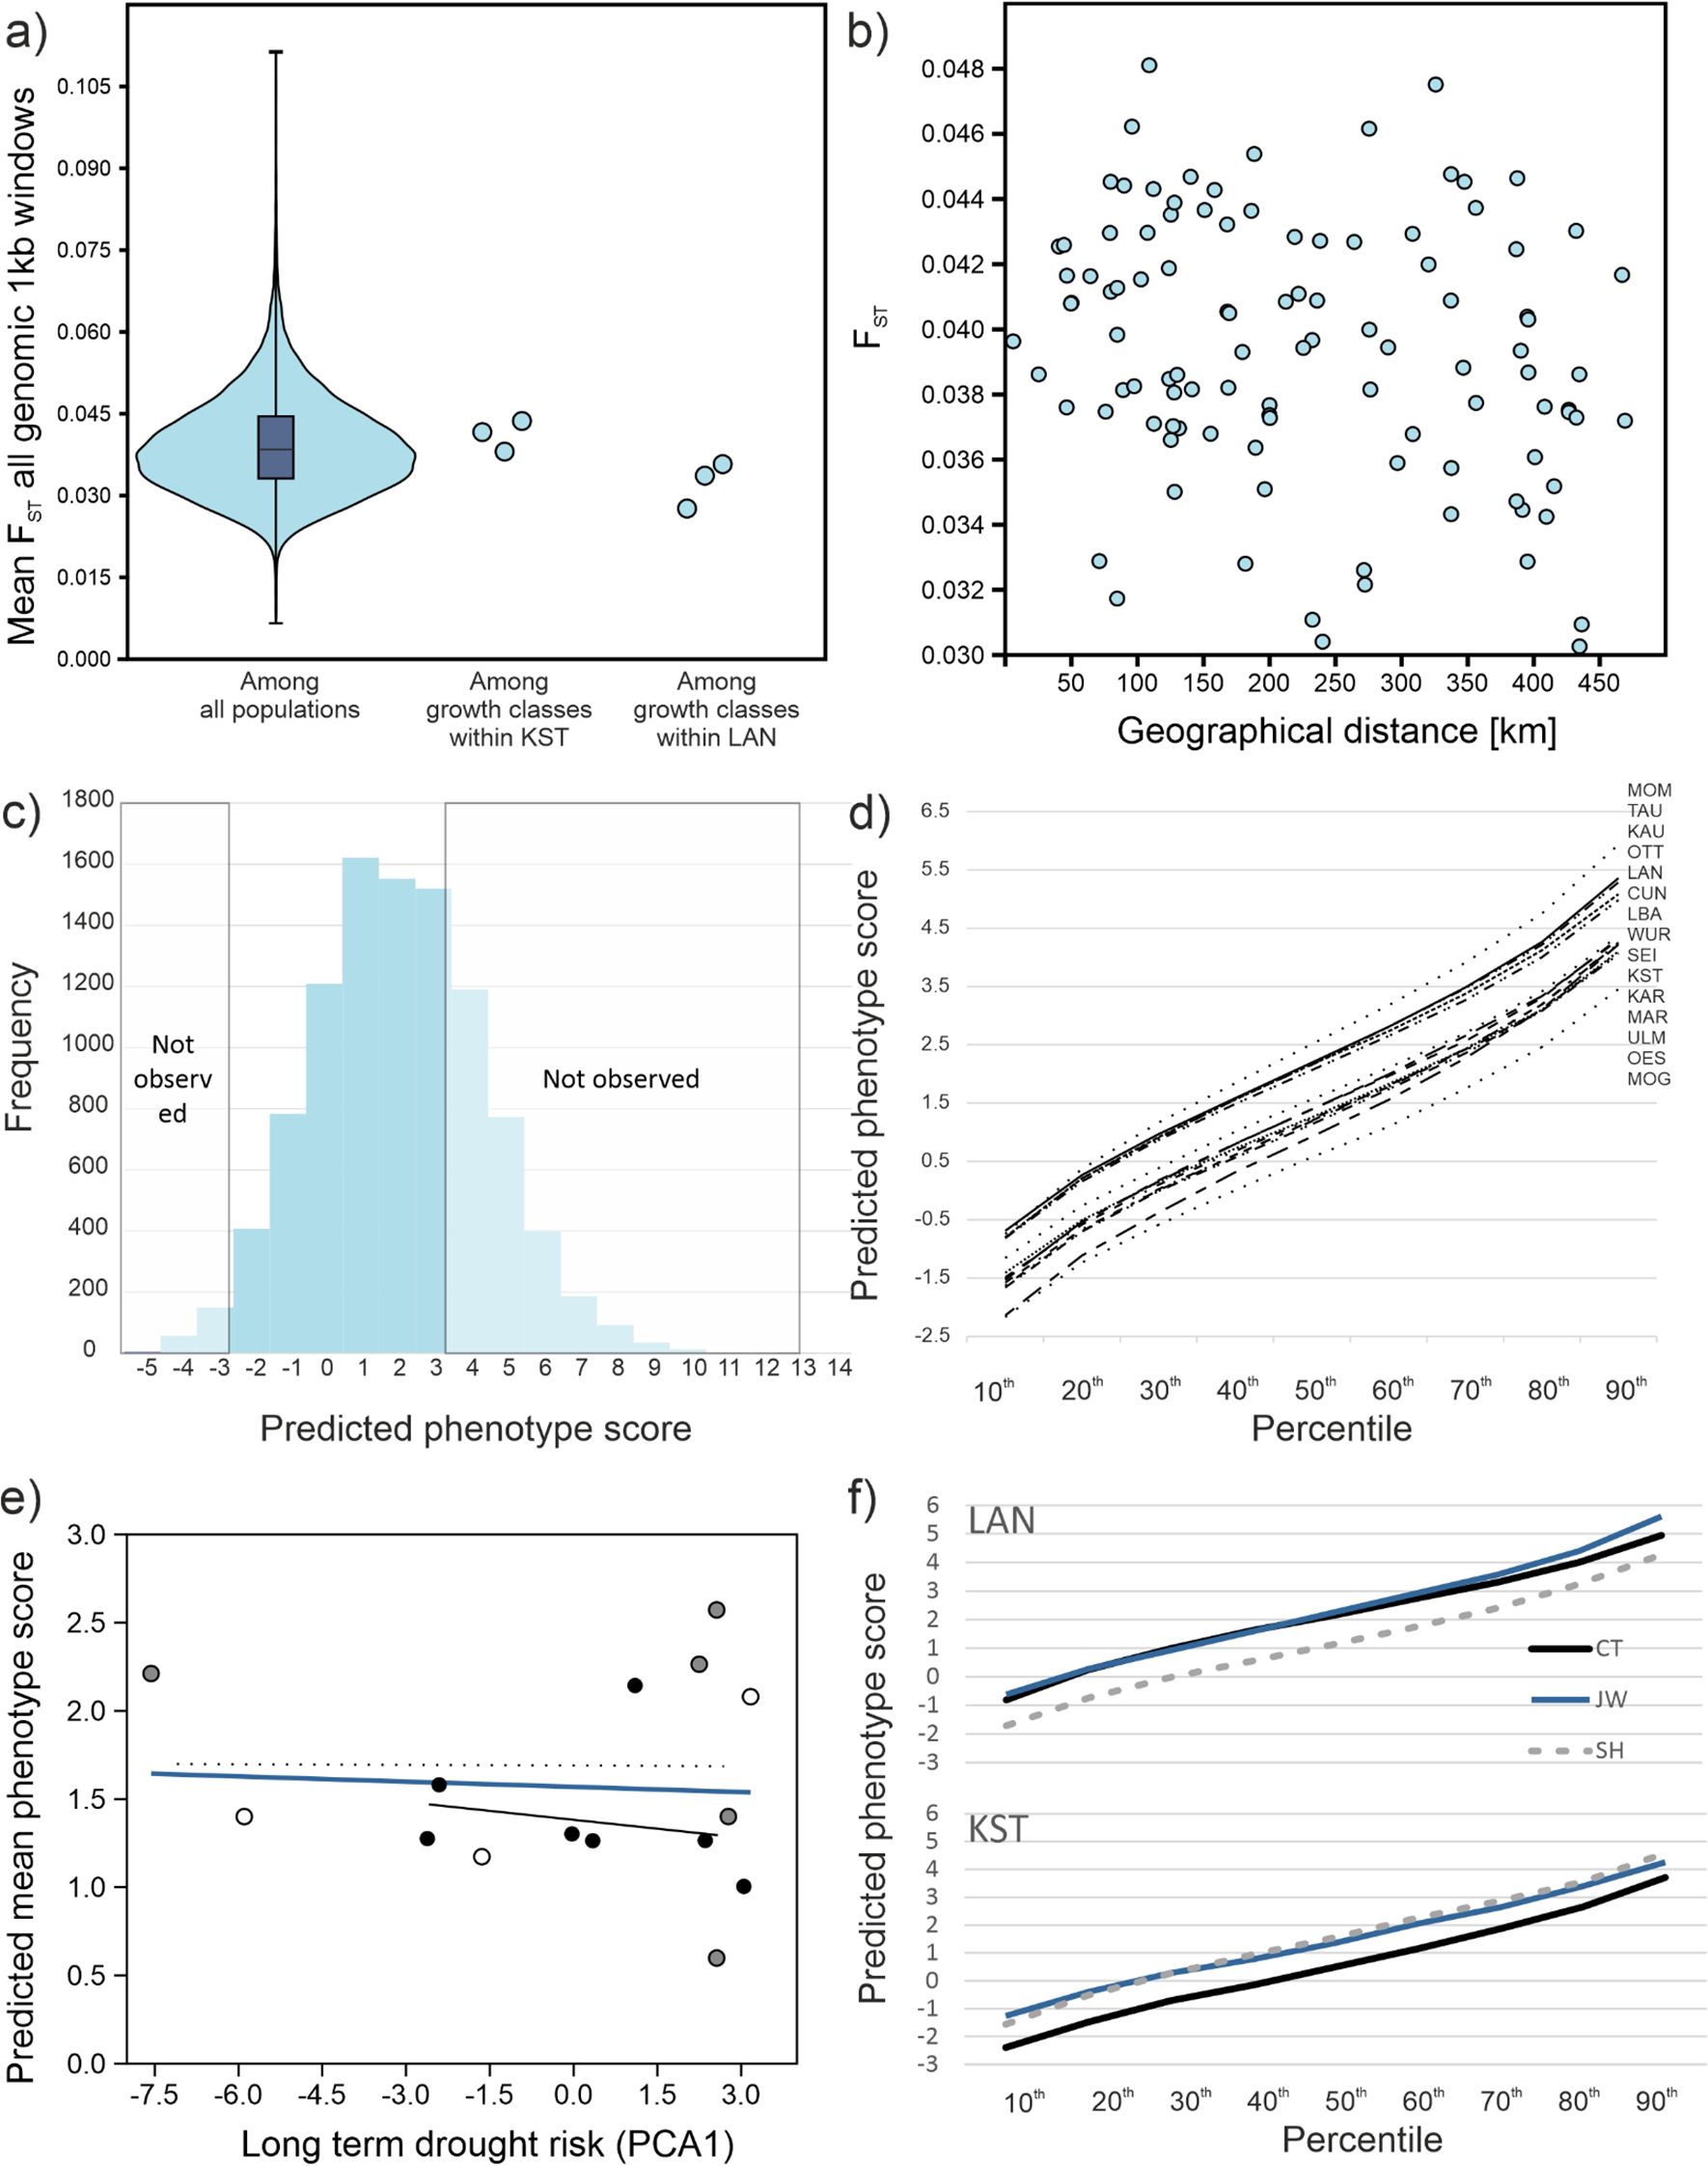
Figure 2. Population genomics and genomic prediction results. (A) Violin plot of distribution of all site pairwise FSTs, compared to the FSTs among growth classes at the sites KST and LAN. (B) Site pairwise FSTs against geographical distance between them. Mantel’s test showed no significant relation between FSTs and geographical distance (r = -0.226, p = 0.34). (C) Frequency distribution of predicted phenotype scores of 10,000 simulated individuals from overall allele frequencies at 46 predictive loci. Individuals with predicted phenotype scores below -2.83 and above 3.3 (within dashed rectangles) were not observed in nature. (D) Cumulated percentile distributions for genomically predicted phenotype distributions of the canopy forming beeches at the sampling site. Lower values indicate a larger proportion of drought resistant phenotypes. (E) Plot of long-term drought risk against PDPS. The blue line represents the overall linear regression, the black line the relation for autochthonous stands (black points) only, the dashed line for planted (white points) and unknown (grey points). (F) Comparison of predicted phenotype distributions among growth classes at the sites LAN (above) and KST (below). The black lines indicate canopy forming trees (CT), the grey dashed lines established trees not yet reaching the canopy (SH) and the blue line undergrowth below 1 m height (JW).
Genomically predicted population phenotypes
We used estimated allele frequencies with the genotypic prediction weight matrix of 46 trait associated SNP loci (Pfenninger et al., 2021) to predict the phenotypes of 10,000 individuals from their simulated genotypes. The predicted drought phenotype score (termed PDPS hereafter) ranged from 0.599 (MOG) to 2.572 (MOM) with an average of 1.569 (s.d. 0.555, Figure 2D, Supplementary Figure 2). Distributions for all assayed sites were more or less normally distributed, which made the mean a useful statistic. Assuming that individuals with a phenotypic score of zero or less are resistant to drought conditions, the expected proportion of non-susceptible trees ranged from 25 – 45%, with a mean of 32.8%. The PDPS distribution based on the mean allele frequencies over all sites had a mean of 1.556 (s.d. 2.359) and ranged from -7.02 to 13.43. The realized predicted scores of 200 phenotyped and genotyped individuals (Pfenninger et al., 2021) showed that scores below -2.83 and above 3.3 were not observed in the natural sample (Figure 2C).
Three of the 46 predictive loci showed a significant correlation (r > 0.5) of allele frequencies with either PDPS or drought risk score (Supplementary Figure 3). However, 445 out of 29,774 (1.5%) randomly chosen, highly differentiated (minimum allele frequency difference of 0.6 between two or more sites), unlinked SNPs showed a correlation of r >= 0.5 with the environmental gradient and were thus potential false positives.
Local adaptation to drought risk
There was no correlation between PDPS and the long-term summer drought risk at the sites (r = 0.085, p = 0.93, Figure 2E). PDPS at the autochthonous stands alone did also not conform to expectations of local adaptation (Figure 2E). The patterns of PDPS distributions among growth classes differed. At the LAN site, the youngest (JW) growth class and the oldest class, the canopy forming trees (CT) showed very similar distributions except for the most drought-susceptible trees. The intermediate (SH) class had much more drought resistant predicted phenotypes. Its PDPS was one unit or 0.41 Haldanes (a shift in population mean expressed in standard deviations) smaller (Figure 2F). At the KST site, the CT class was the most drought resistant, while the younger classes showed more susceptible phenotype distributions. Over all classes, PDPS level at the KST site suggested a higher predicted drought resistance (Figure 2F).
Results from remote sensing
Remote sensing yielded 955 measurements of canopy leaf area index (LAI) and moisture stress index (MSI) in the vegetation periods 2016–2022 for the 15 sites (~9 observations per year and site). The overall observed mean LAI was 2.66 (s.d. 0.50) with a range from 1.28 to 4.80 and 0.67 (s.d. 0.07, range 0.29 – 1.02) for MSI. The means per vegetation period differed systematically among years and among sites for both parameters (Figures 3A, B). Within each year, mean LAI tended to decline over the vegetation period, independent of weather conditions (mean decrease between maximum and minimum = 0.98, s.d. = 0.51, Figure 3C). An increasing, but weaker trend was observed in MSI means (Figure 3D).
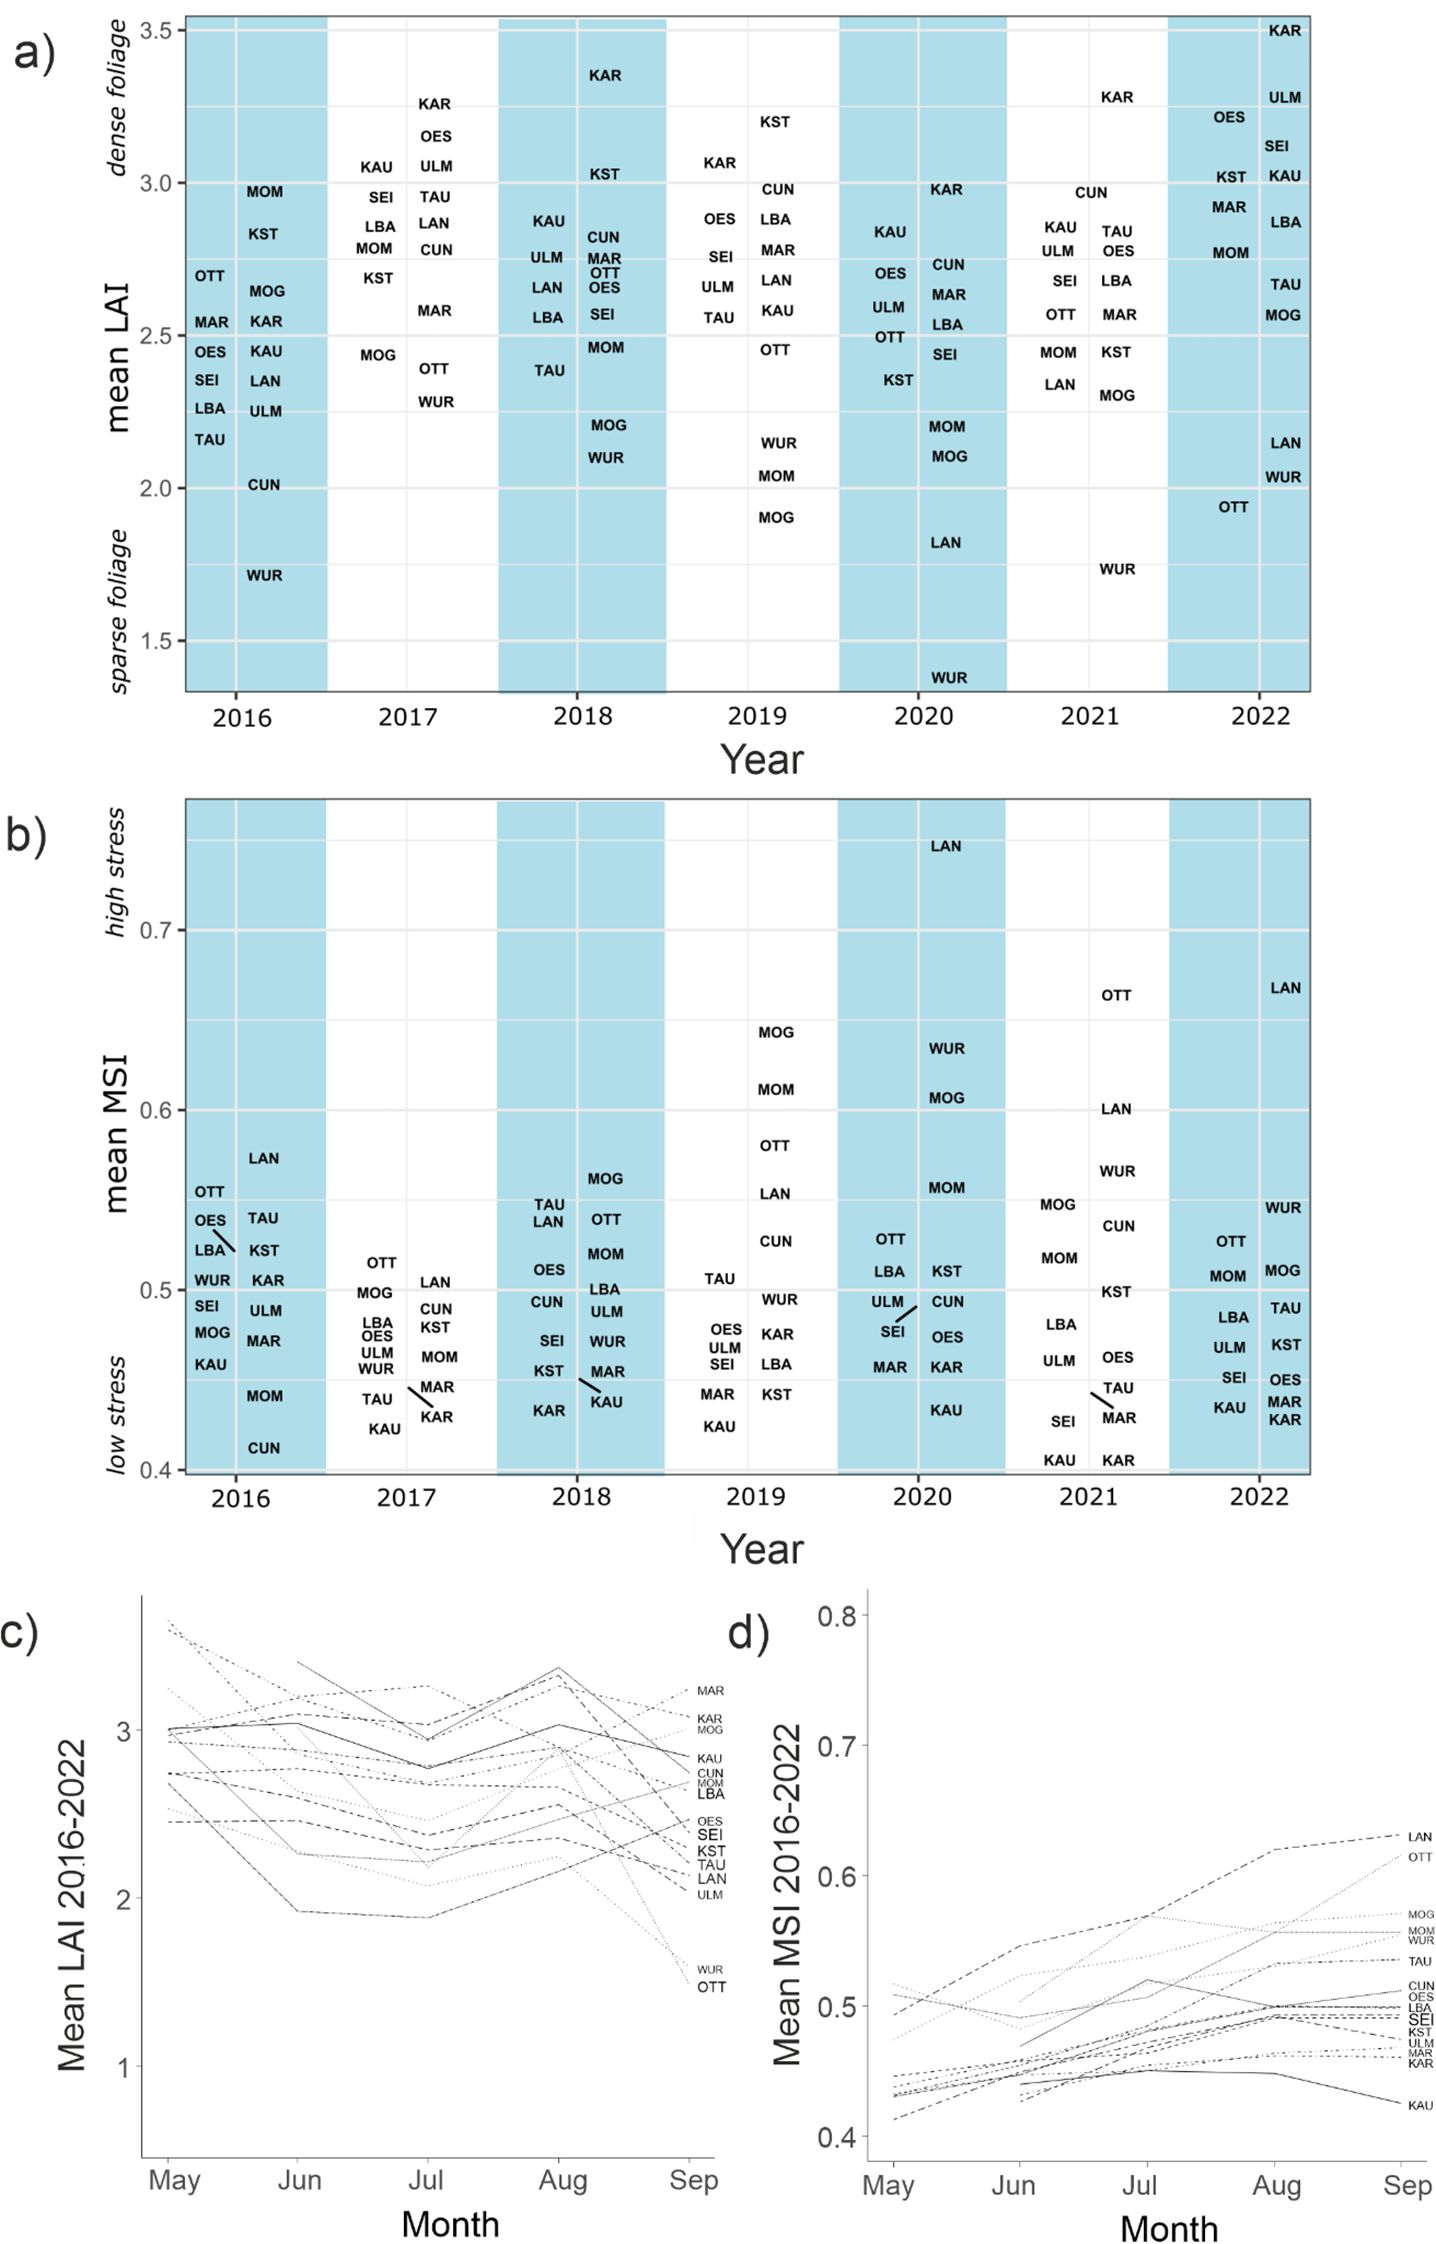
Figure 3. (A) Stand-wide mean Leaf Area Index (LAI) data from Sentinel2 satellites during the vegetation period for the sampling sites in the observation period 2016-2022. Higher values indicate denser foliage. (B) likewise for Moisture Stress Index (MSI). Higher values indicate more water stress. (C) Mean temporal trajectory of LAI from May to September during the period 2016-2022. (D) Likewise for MSI.
During 2016 and 2017, serving as non-drought baseline, the 1% quantile LAI for all individual pixels was 1.4, suggesting that values below this threshold were likely drought induced. Over the observation period, almost a third of pixels (0.328, s.d. 0.321) at all sites showed LAI < 1.4 at least once. The sites were highly differentially impacted (range 0.02 (KST) to 0.93 (WUR)). For pixels which showed an LAI of less than 1.4 for two or more years in a row, an MSI of 1.2 or more was measured in the first year, suggesting that this threshold induced long-term damage.
Inference of fitness-relevant drought stress response thresholds
Satellite images and spatial projections of LAI and MSI revealed that the response of beech trees to the same drought conditions differed strongly within sites (Figures 4A–C). While the majority of pixels were not drought affected, retaining high LAI and low MSI values, few strongly affected trees over-proportionally influenced respective stand means.
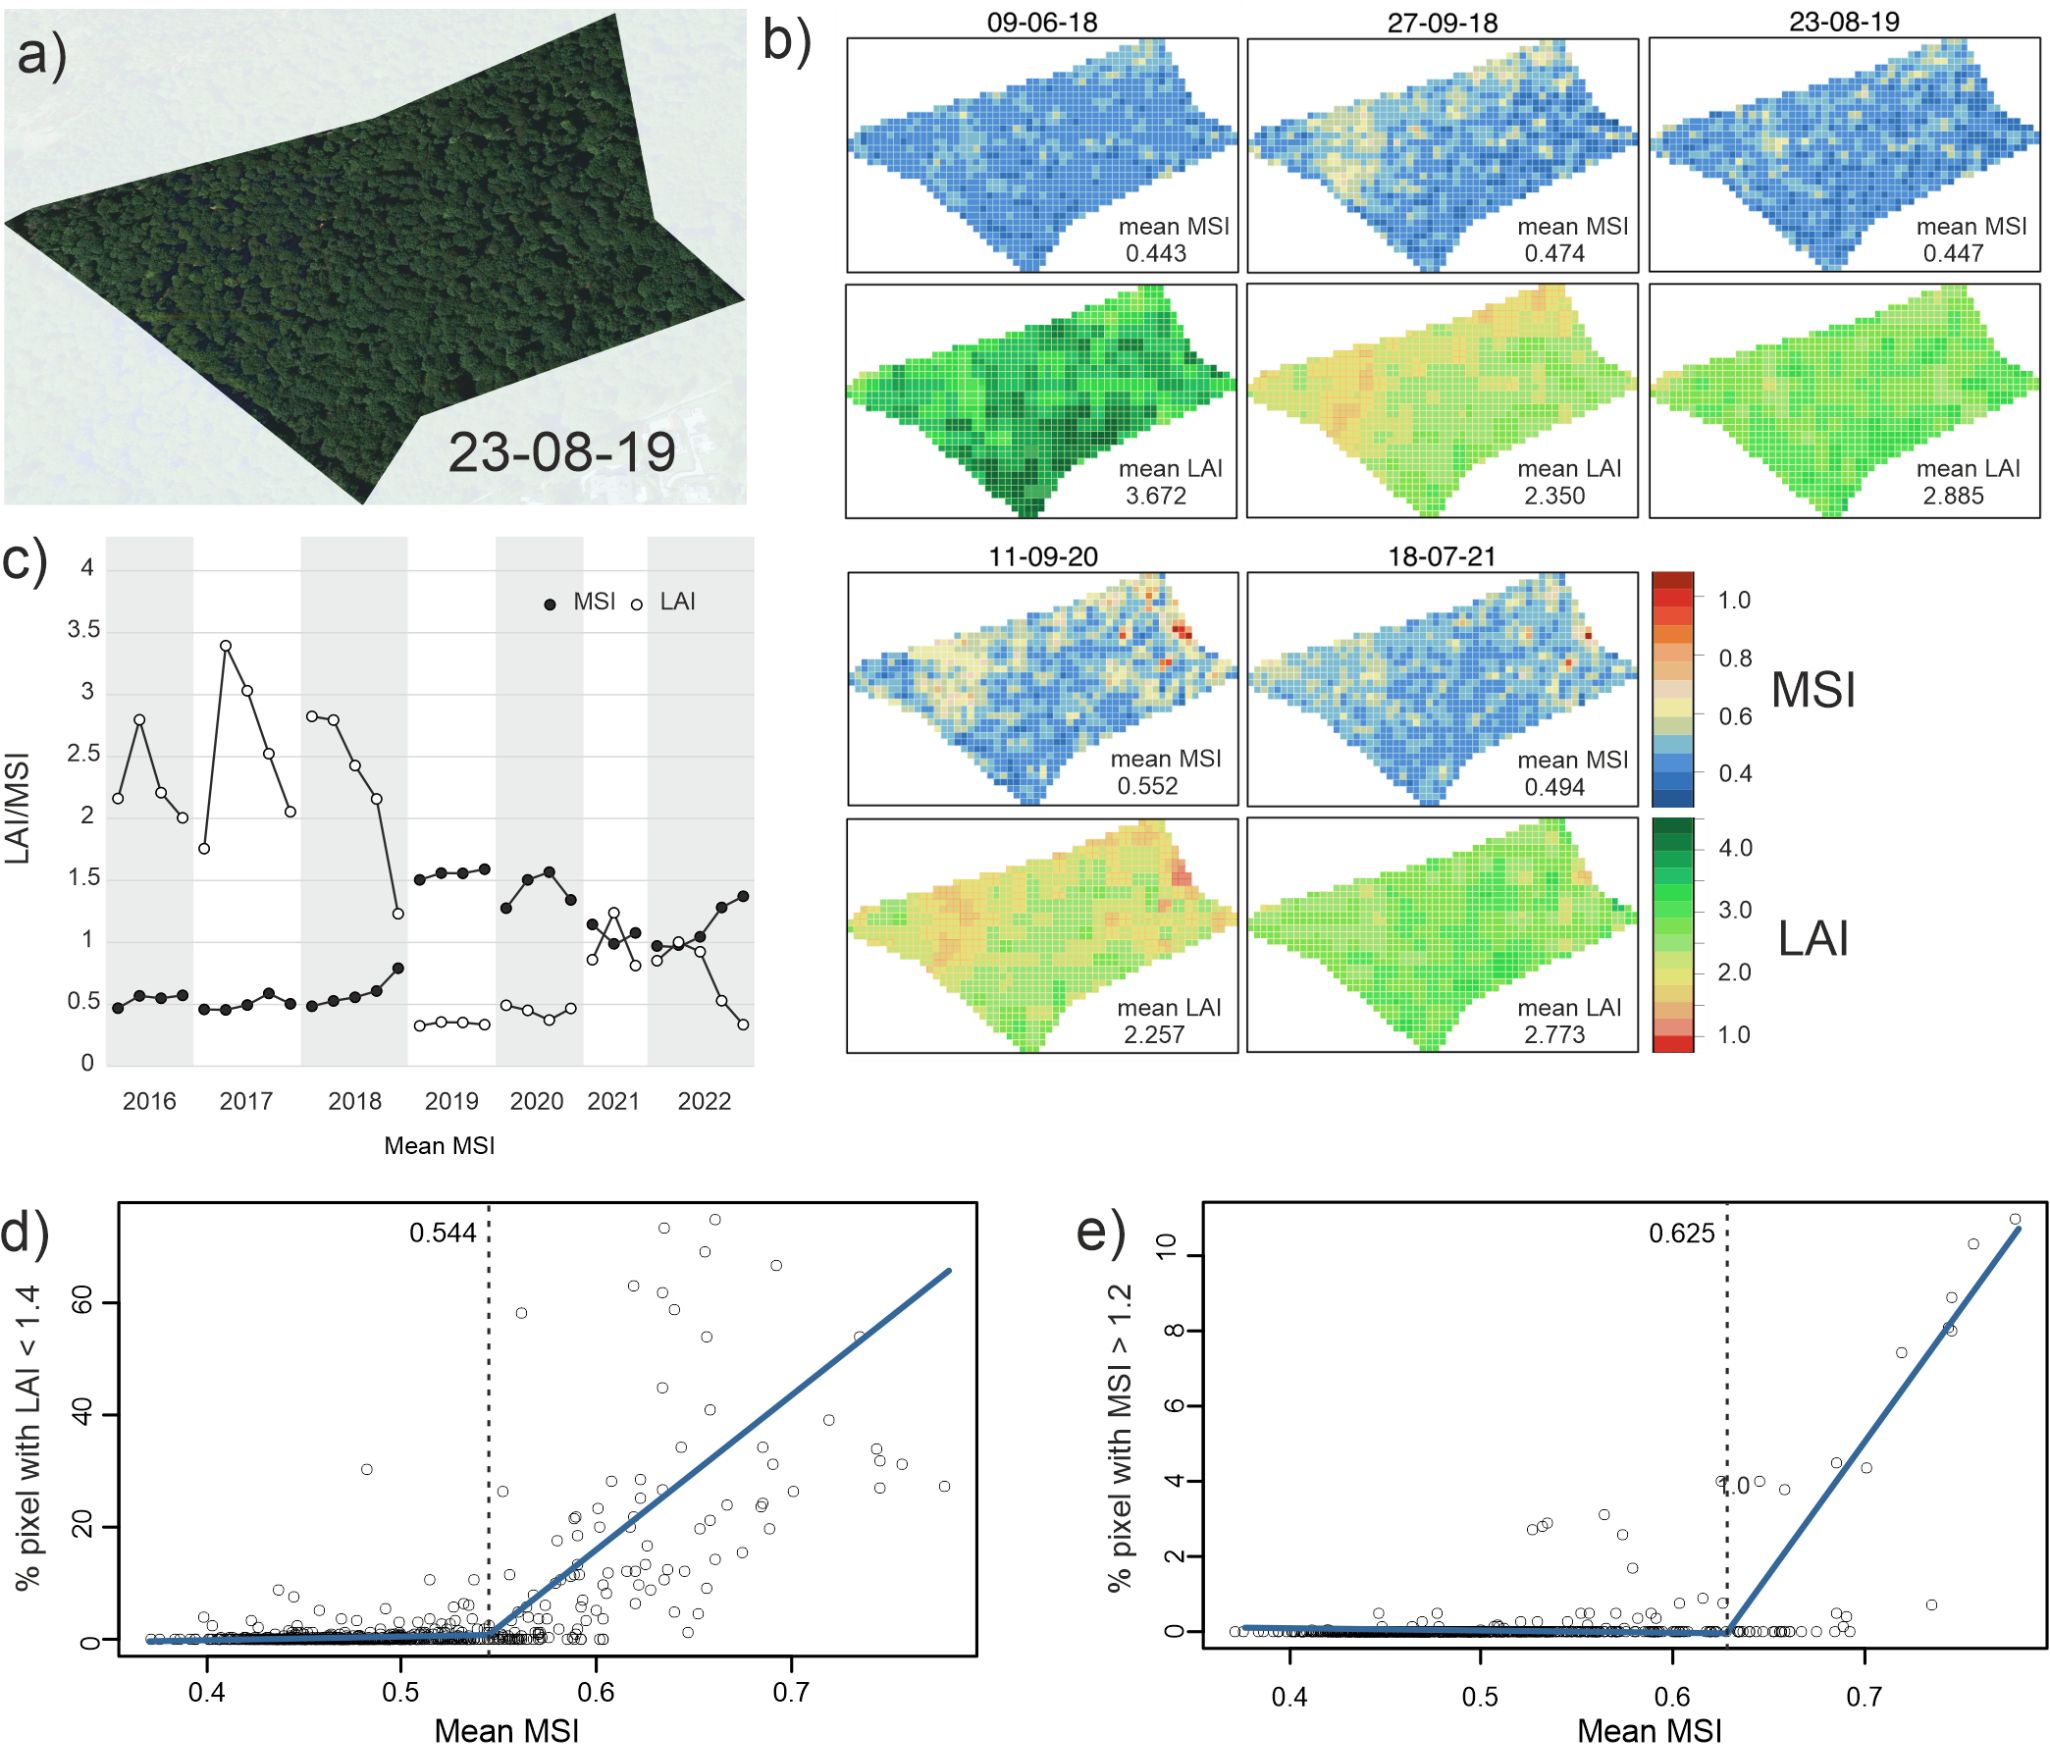
Figure 4. Damage threshold inference. (A) High resolution satellite image of an exemplary site (KST) (B) Spatial visualization of MSI (above) and LAI (below) at KST in pixels of 10 x 10 m for a number of chosen dates. (C) Exemplary temporal trajectory of LAI (white) and MSI (black) of a single pixel at site LAN. LAI and MSI became correlated only after the 2018 drought. (D) Plot of stand-wide mean MSIs against the proportion of pixels in all stands with a LAI below 1.4. Values below this threshold indicate drought-induced leaf-loss. The blue line indicates the best fit of a segmented regression, the dashed line shows the inferred break-point (0.544). (E) Plot of stand-wide mean MSIs against the proportion of pixels in all stands with a MSI above 1.2. Above this value, long-term leaf-loss occurs in the respective pixels. The blue line indicates the best fit of a segmented regression, the dashed line shows the inferred break-point (0.625).
The temporal trajectory of an exemplary single pixel showed that MSI remained about constant in 2016 and 2017 (non-drought baseline), as well as in early 2018 (Figure 4C). During the same period, LAI varied independently of MSI according to the seasonal pattern (Figure 4C). However, as MSI rose over a certain threshold during the 2018 drought, MSI and LAI started to covary (Figures 4C, D).
Plotting the percentage of pixels with LAI < 1.4 against mean MSI revealed a significant change in slope (Figure 4D). Segmented regression provided a significantly better fit to the data than a linear model (t = 30.496, d.f. = 876, p < 2.2 x 10⁻¹⁶). At 0.544 (s.e. 0.005), the slope estimate increased from 5.1 (s.e. 6.9) to 214 (s.e. 10.1). A mean MSI threshold of 0.625 marked the onset of longer lasting drought damages (%pixels with MSI > 1.2, Figure 4E). Below this threshold, the slope was -0.44 (s.e. 0.41), above 51.8 (s.e. 2.22, slope change t = - 5.464, d.f. = 718 p < 6.4 x 10⁻⁸).
Model selection of phenotypic drought response model
A GLM with the explanatory variables soil moisture, mean daily temperature in the month of observation, mean daily maximum temperature and the day of the year provided the best model fit for both response variables (LAI, MSI) with an ΔAIC of more than 10 units compared to the next best model (Table 2). However, calculating variance inflation factor indicated high collinearity between the temperature variables. This may lead to unreliable coefficient estimates, but does not compromise the predictive power as main purpose of the model (Kim, 2019). Adding PDPS as a variable explained the variance in LAI moderately better (ΔAIC = -3.63, Table 2). Environmental variables cumulatively explained 67.1% of variance, genomic prediction 11.4%, while 21.5% remained unexplained. For MSI, inclusion of PDPS made the model decisively better (ΔAIC = -11.2, Table 2). Genomic prediction explained 14.8%, while environmental variables accounted for 65.9%, leaving 19.3% unexplained. Of this residual variation, 29.5% (= 5.7% of total variance) was explained by fixed differences among sampling sites (ANOVA: F = 14.89, p = < 0.001). Since the inclusion of statistical genomic prediction improved model fit much more for MSI, we concentrated on this parameter for future prediction.
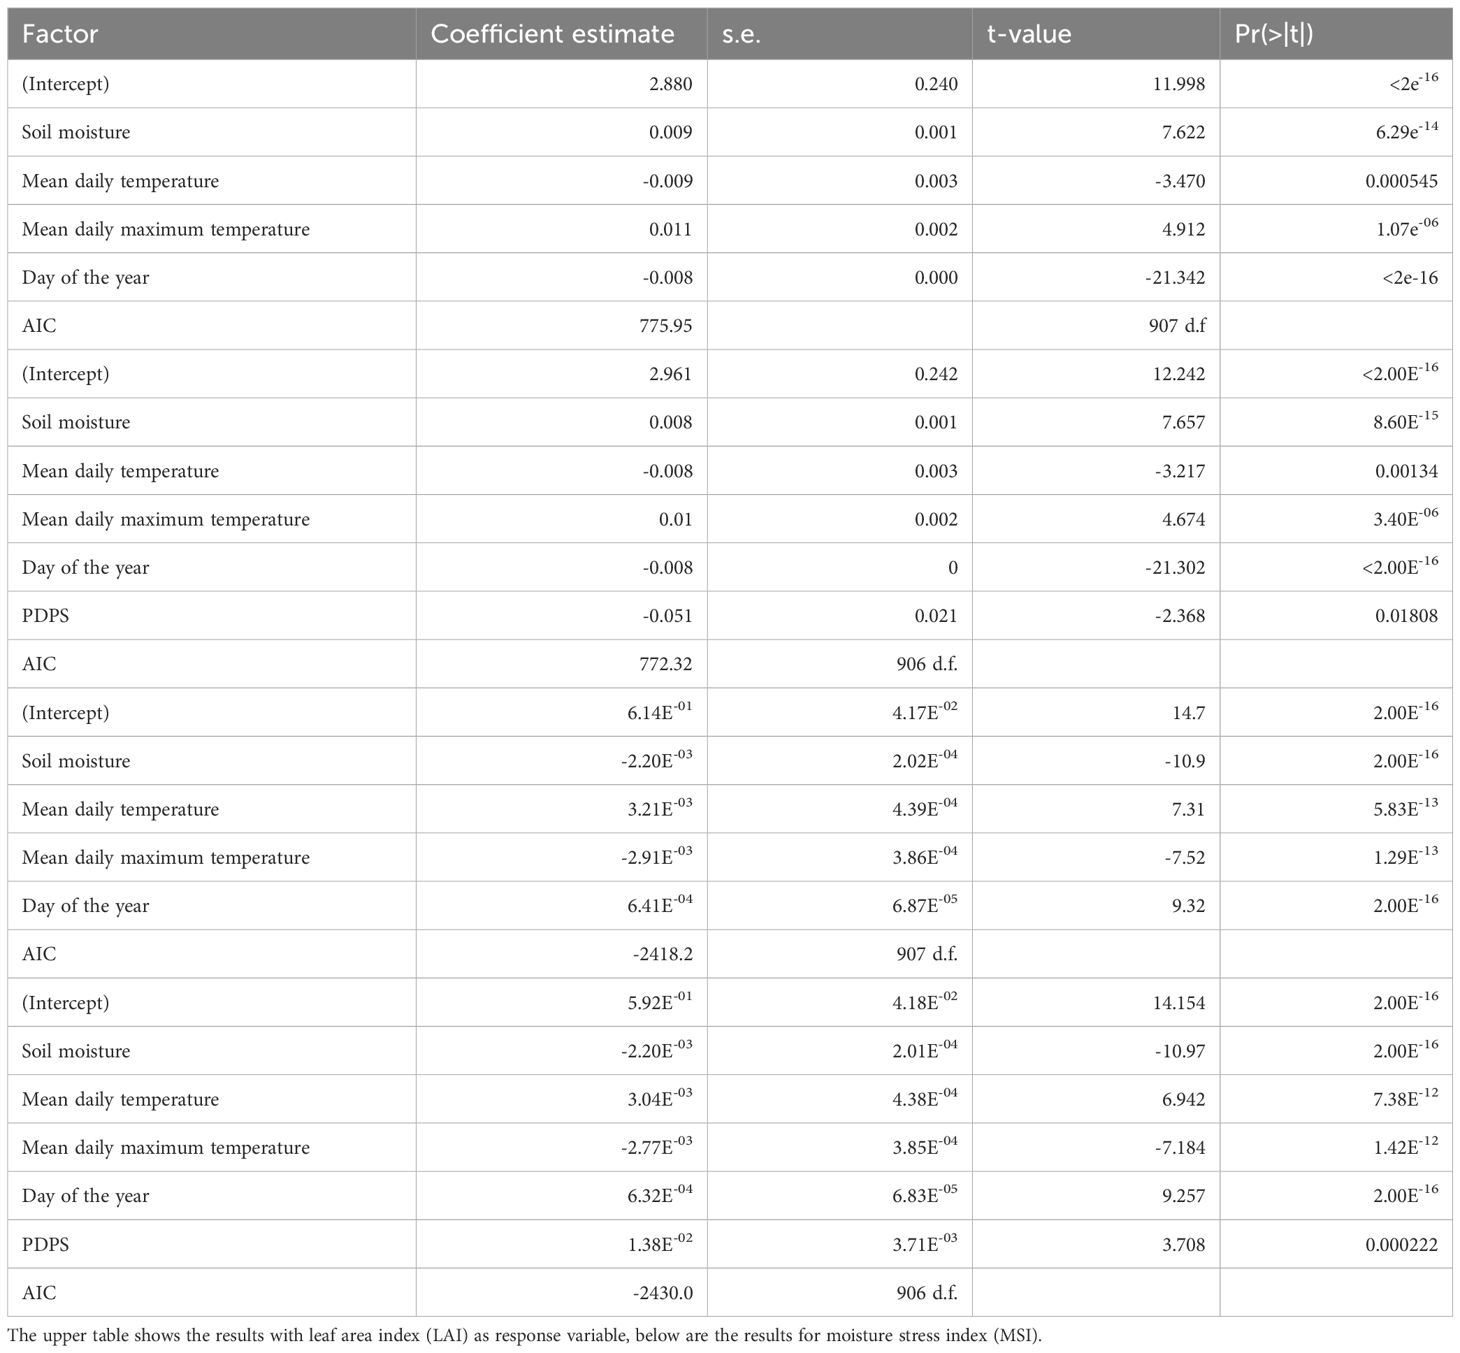
Table 2. Model selection results.
Predicted drought phenotype response to future climate scenarios
We assumed that populations are adapted to climate conditions, if lasting damaging levels of moisture stress are not regularly surpassed, as was the case for beech until a few years ago. With no adaptation (PDPS unchanged) the long-term damage mean MSI threshold values of 0.625 will be regularly surpassed in the RCP 4.5 scenario for the decades 2041–2050 and 2091-2100 (Figure 5). Under adaptation scenarios corresponding to i) an observed rate of phenotypic change (PDPS one unit lower) and ii) evolution to the level of the currently best adapted site (PDPS 0.599 at all sites), the expected climate conditions will not exceed the population’s drought tolerance (Figure 5). No adaptation scenario tested will likely allow persistence under the RCP 8.5 scenario (Supplementary Figure 4). The critical moisture stress threshold will be exceeded in any case in every year at all sites even in the decade 2041-2050.
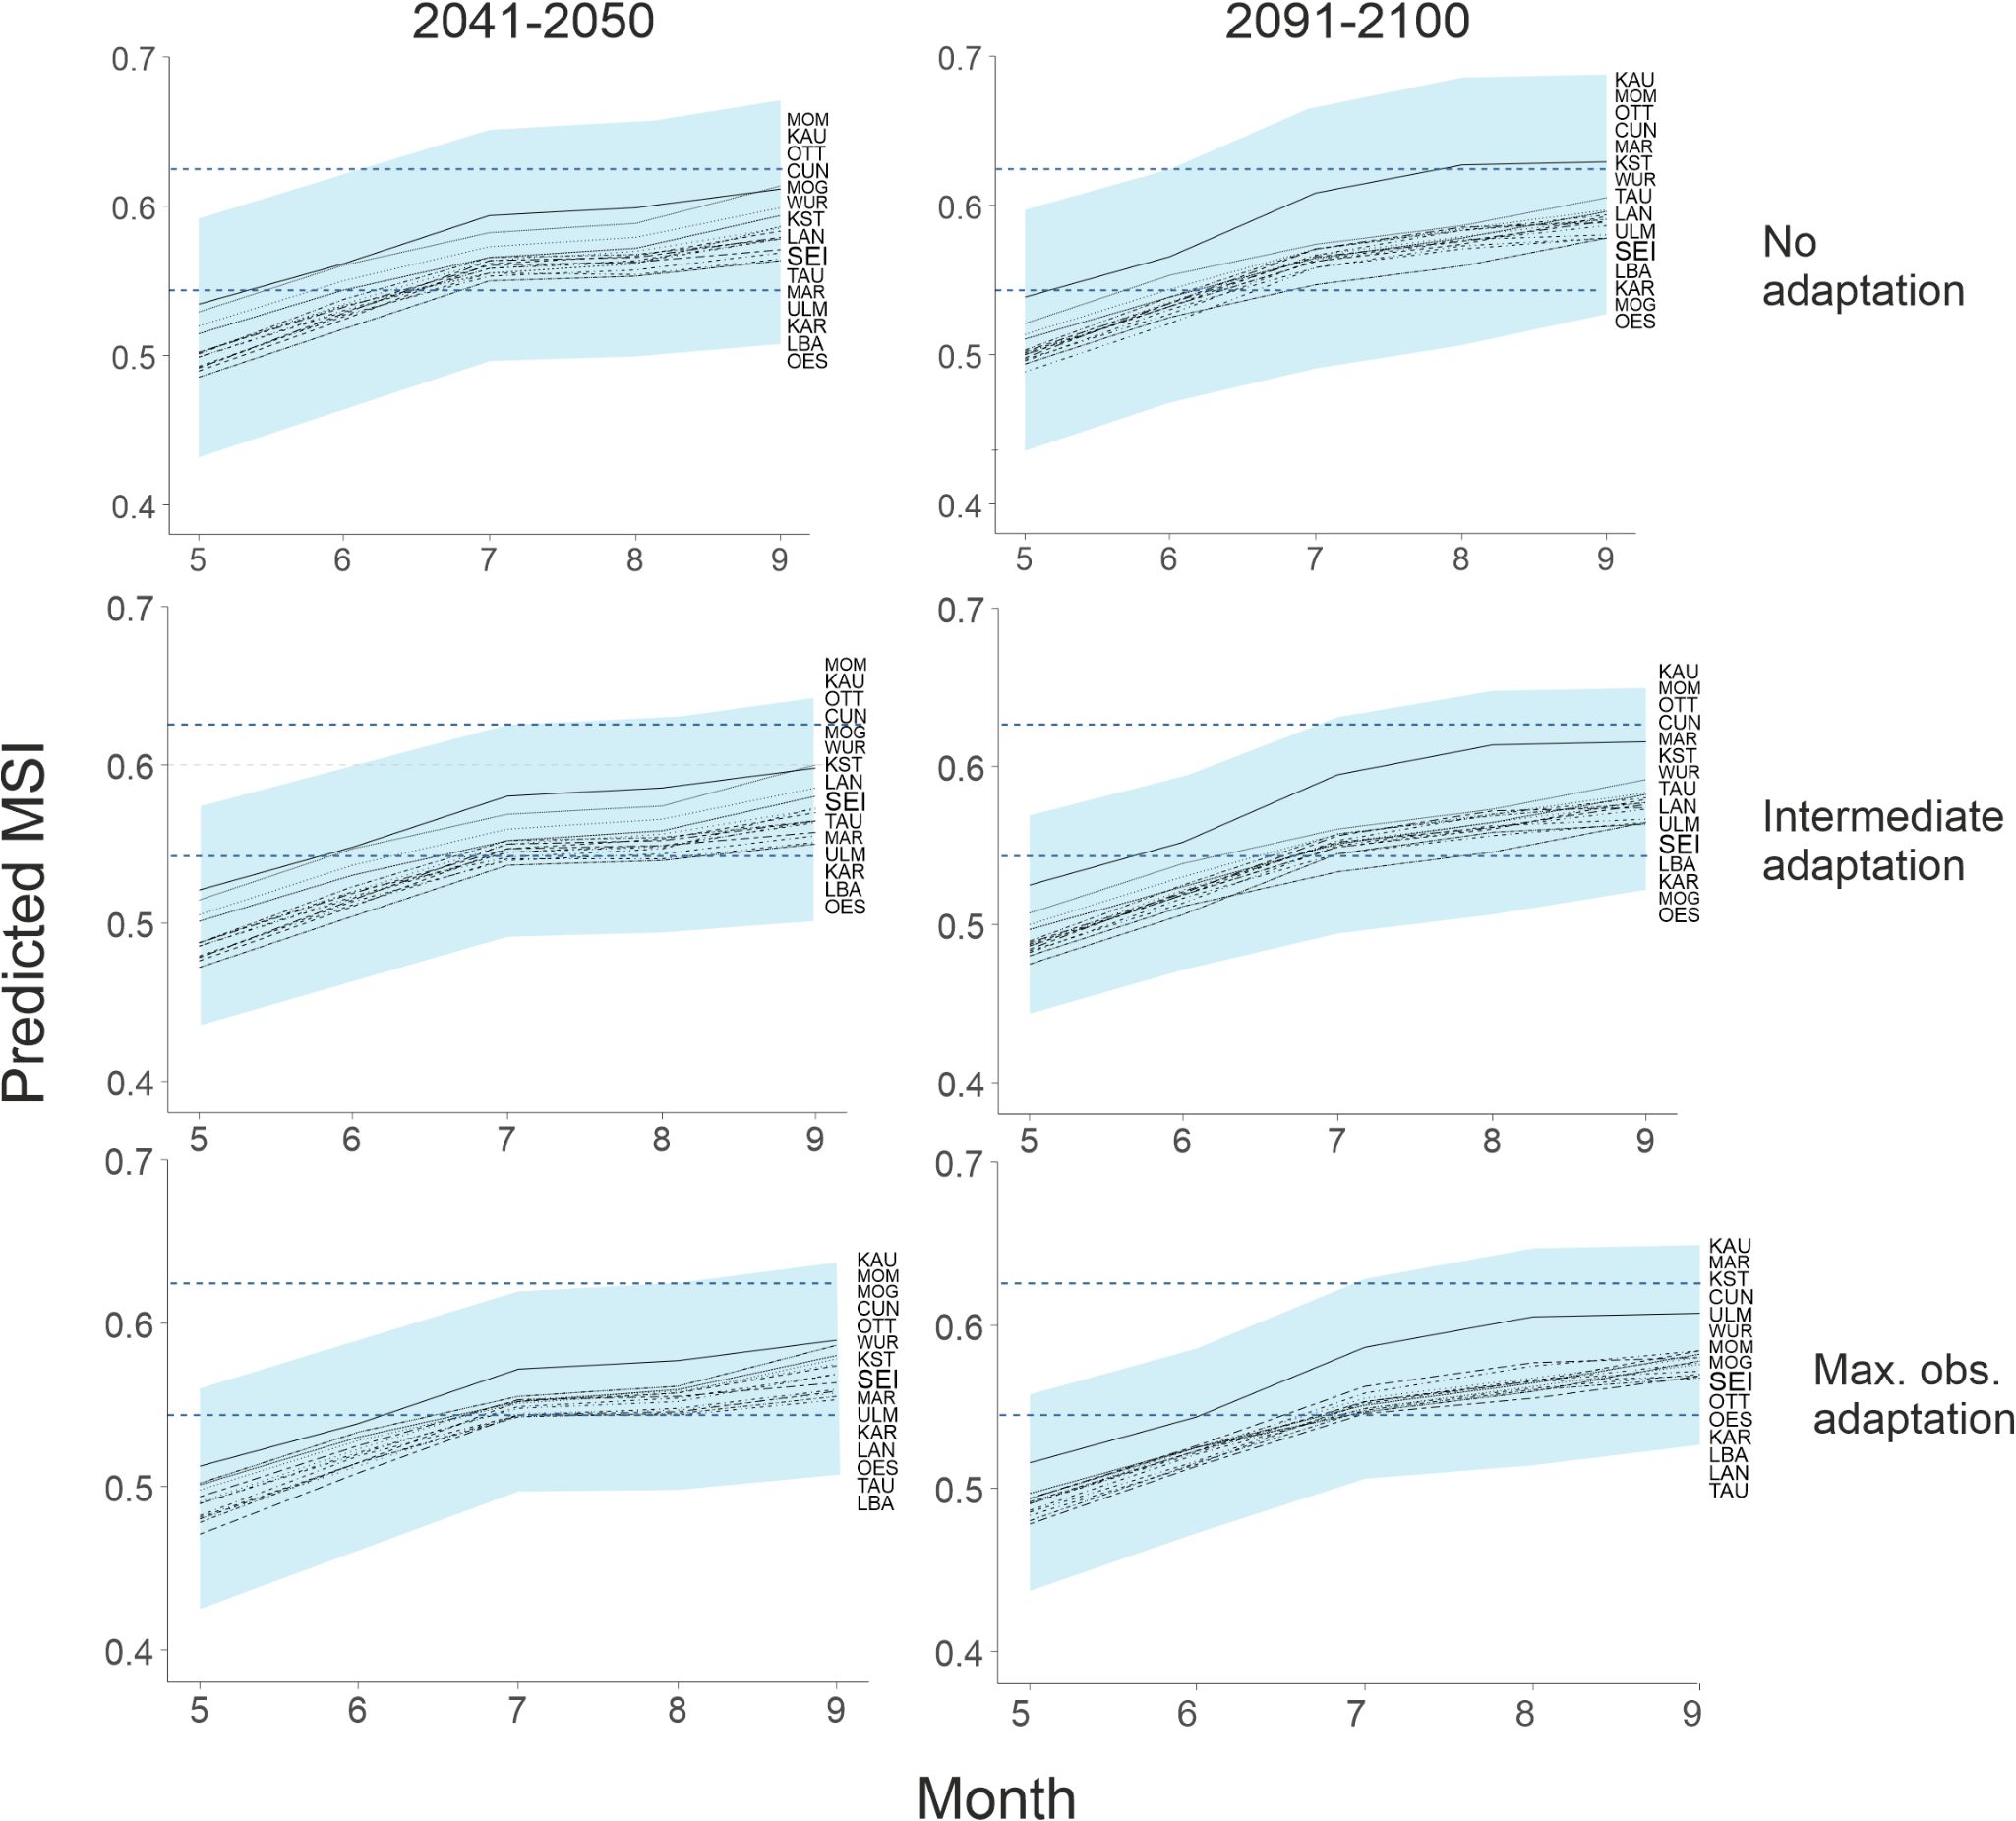
Figure 5. Predicted decadal mean MSI during the vegetation period (May-Sep) for future (2041–2050 and 2091-2100) climate scenario RCP 4.5 for all sites. The shaded area covers two standard deviations of the predicted weather variance and thus the expected inter-annual variation for the MSI range. The lower dashed blue line shows the stand mean MSI above which drought damage in leaf-cover can be observed. The upper dashed blue line indicates the lower mean MSI threshold for serious, long lasting damage of beech trees.
Discussion
In this study, we integrated meteorological data, remote sensing and population genomics to predict the phenotypic response of European beech (F. sylvatica) forest tree stands to current and future climate dynamics. Our results show that their persistence under moderate climate change scenarios is possible if beech forests evolve based on existing genetic variation.
A validated genomic prediction model for the phenotypic drought response of beech individuals existed from a previous study, allowing the calculation of a continuous expected drought response score from the underlying multilocus genotype at associated loci (Pfenninger et al., 2021). The current, population-based context required its extension to entire populations. As in the calculation of expected heterozygosity (Fisher, 1923), estimated allele frequencies gained from the PoolSeq approach at predictive loci permitted calculation of a distribution of expected multilocus genotypes. The locus weighing vector derived from the individual genomic prediction model was then used to translate this distribution of multilocus genotypes into a distribution of predicted phenotypes. As with expected heterozygosity, this is technically the expected phenotype distribution in the zygotes of the next generation, but should also reflect the characteristics of the current population. However, the estimates are based on genetic variants that govern the phenotypic differences among individuals, which may thus not account entirely for differences among populations (Pfenninger, 2025).
We compared the expected phenotype distribution derived from the allele frequencies over all stands with the range of actually observed values of trees in nature (Pfenninger et al., 2021) to infer the processes underlying phenotypic evolution. The expected phenotype score distribution based on allele frequencies was wider than the observed range in the field. In particular individuals with increased drought susceptibility were missing in field individuals, suggesting stabilising selection on this trait (Zhang and Hill, 2005). Since the alleles associated with the drought susceptible phenotype were often potential loss-of-function mutations (Pfenninger et al., 2021), individuals with too many of them and thus high score values likely died before reaching maturity.
The predicted genetic component of phenotypic drought response varied substantially among stands. The observed PDPS ranged over almost two units; the largest difference was observed in the two most closely neighbouring stands, MOG and MOM. To illustrate the meaning of this difference, the expected proportion of trees not susceptible to drought ranged from 25 – 45%. As these simulated phenotype distributions are also an estimate of the expected progeny, the results showed that even at the currently worst genetically prepared site, a significant proportion of drought-resistant phenotypes should occur in the next generations under natural stand development conditions. The partially large difference in PDPS among age classes (e.g. 1 unit or 0.41 Haldanes in the SH-class at LAN) suggested that a substantial shift in trait mean and thus better coping with future conditions is possible within a few decades, potentially as a result of ongoing natural selection. Overall, the results indicate that there is abundant standing genetic variation at the relevant loci at all sites. It thus seems likely that there is ample evolutionary potential for adaptation to more drought-resistant stands, especially considering the large number of offspring available for selection.
We could not detect any notable population structure among the F. sylvatica stands in the surveyed area. While the estimated mean FST of 0.039 was in the range of previous estimates (Postolache et al., 2021; Lazic et al., 2024; Pfenninger et al., 2025), this value is likely in part due to sampling variance and thus an overestimate as the comparison with the differentiation among growth classes within stands showed (Figure 4). As the effective population size in F. sylvatica is large, drift should be negligible among contemporary generations (Charlesworth, 2009). The observed level of genetic differentiation within stands is therefore mainly driven by sampling variance, i.e. the limited number of individuals used to obtain the estimate (Meirmans and Hedrick, 2011). All stands sampled thus likely belong to the same, rather weakly structured population. Absence of isolation-by-distance supported this view. Reasons for this lacking population structure, also observed in other studies on beech (Magri et al., 2006), are likely wind pollination (Wang, 2004), partially over large distances (Belmonte et al., 2008), but also management practices that included long-range seedling and seed exchange, contributing to genetic homogenisation (Antonucci et al., 2021; Kembrytė et al., 2021).
The effective absence of population structure, high genetic diversity, wind pollination by many partners over large spatial ranges, and extremely high number of offspring assure that most genetic diversity in F. sylvatica should be practically present everywhere all of the time. Low LD and high recombination rate quickly reshuffle beneficial (and deleterious) mutations by recombination in the many offspring. Intense demographic reduction from seed to seed (von Oheimb et al., 2005; Trotsiuk et al., 2012) with equally intense competition for light and space (Piutti and Cescatti, 1997) will likely allow only individuals best coping with local conditions to reach canopy height and therefore permit swift adaptation in many independent trait dimensions simultaneously and, at the same time, ensure efficient removal of deleterious variation. One should therefore expect effective adaptation to the local conditions (Kawecki and Ebert, 2004) in beech, as is expected for other forest tree species (Savolainen and Pyhäjärvi, 2007).
Despite these excellent preconditions, no local adaptation to drought risk was detectable in F. sylvatica. Neither the allele frequencies at underlying loci nor PDPS correlated with long term climate conditions predicting drought risk (Supplementary Figure 3). This could have two, mutually non-exclusive reasons. First, it is only in recent years that summer drought conditions may have regularly exceeded the limits of the phenotypic reaction norms allowing F. sylvatica to cope with environmental dynamics without loss of fitness. Given the multi-decadal generation time in beech, the period during which the increasingly changing selective climate regime is in effect has been too short for the canopy forming trees to adapt accordingly. Most of these beeches were already mature trees during the climate reference period 1970-2000. The climate during their youth and establishment phase was in most cases cooler and moister than this reference period (Pfenninger et al., 2021). Even though serious drought years occurred occasionally (e.g. 1976), the current accumulation of these events is without precedent in recent beech generations. Moreover, a longer, stable, much cooler and wetter climate period, the Little Ice Age, lasting several beech generations (Lamb, 1972), has likely shaped recent beech evolution (Campbell and McAndrews, 1993), having rendered the population probably evolutionary unprepared for the current conditions. Second, many of the current canopy forming beeches were actively planted and raised in the past. This may have consequences for their evolution and adaptive capacity for several reasons (Finkeldey and Ziehe, 2004). At planted stands, the seedlings were raised under highly favourable conditions in tree nurseries, thus avoiding environmental selection during germination and initial, rather susceptible, growth stages. The beechnuts for nurseries were in most cases gained from a limited number of mother trees, which limits their genetic variability. The mother-trees usually grow at highly favourable sites, i.e. under rather relaxed selection. The number of seedlings planted is close to the final number of adult trees the area can support, which means that these individuals avoid the fierce interindividual competition during natural regrowth. In summary, the crown trees of planted stands derive from a limited number mother trees that were themselves not adapted to the local conditions of the planting site (Konnert and Haverkamp, 2016) and seedlings were randomly chosen with regard to the local conditions and shielded from selection in their early development (Brang et al., 2016). This practice applies not only of F. sylvatica but many more forest species. Compared to autochthonous stands with natural regrowth, they are therefore likely much less adapted to the local conditions and genetically less variable (Żukowska et al., 2023).
Our results showed that both crucial assumptions for GEA - a linear relation between relevant genetic and environmental/phenotypical variation and local adaptation - were not met in the present case. On the contrary, the search for the correlation of allele frequencies with either environmental or phenotypic variation likely would have produced much more false positives than truly associated loci, thus confirming recent findings (Lotterhos, 2022). Also the assumption of local adaptation may not be taken for granted without proper validation (Capblancq et al., 2020, see above). The framework introduced here could provide a feasible alternative to the currently favoured approaches. Phenotypic trait models such as the proposed one have the advantage that they can be validated with contemporarily observed data in space and/or time.
Remote sensing offers an opportunity for objective, comparable long-term surveys of large geographical areas that would not be realisable otherwise. The satellite observations of beech stands were particularly valuable because they are a long-term measurement of reactions to environmental change and thus represent phenotypic reaction norms as a basis for modelling environmentally driven responses (Arnold et al., 2019). Remote sensing observations of the stands, with each pixel likely corresponding to the canopy of individual trees, revealed a high spatial variability of response to the same weather conditions. This pattern was corroborated by previous visual observations of drought damaged trees often neighbouring apparently vital ones in forests (Pfenninger et al., 2021) and high interindividual variability in drought response in beech (Zang et al., 2014). Moreover, validation studies showed a reasonable to good accuracy of satellite derived MSI estimates in comparison to ground-truth data (Ayres et al., 2021; Kostić et al., 2021), even though canopy-level indices estimate may not quantify physiological stress of the entire tree. For useful evaluation of predictions under future climate scenarios, it was therefore necessary to find empirical threshold values of stand-wide mean MSI above which severe damage for parts of the trees occurs. Examining the temporal trajectories of individual pixels with large variance in LAI at sites with known damages by the 2018/19 droughts (e.g. LAN) suggested the existence of such thresholds (Figures 4D, E).
LAI values below 1.4 were almost never observed in any broad-leaf pixel in the non-drought baseline years 2016 and 2017. The percentage of pixels in a stand with values below this threshold appeared therefore to be a good indicator for the extent of drought-induced wilting or leaf-loss. Similar to the exemplary single pixel response (Figure 4C), LAI did not react to changes in MSI below a certain, site-independent threshold (0.544). Only above this value, moisture stress increasingly induced measurable leaf-damage. This suggests that this threshold is the phenotypic reaction norm limit to water stress in the surveyed beech population. While the vitality loss caused by mean MSI above 0.544 was reversible, values above 0.625 caused legacy effects that lasted over at least two years. Whether these legacy effects are reversible or were caused by partial canopy dieback or the entire tree, could not be inferred. Long-term vitality loss might be related to hydraulic system damage. Even though early leaf senescence in F. sylvatica is thought to protect the hydraulic system, loss of hydraulic conductance has been observed in the wake of the 2018 drought (Schuldt et al., 2020).
Despite the partial drought-induced vitality loss in the years after 2018 (Schuldt et al., 2020), the overall vitality status of surveyed F. sylvatica stands was mixed. LAI dropped below the critical damage threshold of 1.4 in up to 60% of the area at some sites during some observations and in one particularly drought-affected stand (LAN), more than 10% of the area was damaged for a longer period of time (Figure 4. However, a rather surprising result was that two-thirds of the total stand areas were never seriously affected by drought stress throughout the observation period, i.e. never had MSI values above 0.544.
Our approach was empirically confirmed by the fact that addition of PDPS explained the phenotypic variance in drought stress, measured as either LAI or MSI, significantly better than environmental variation alone. The genetic component explained with 11.4% (LAI), respectively 14.8% (MSI) a substantial part of the phenotypic variance. It should be noted, though, that the results presented here depend rather on loci identified from inter-individual phenotypic differences. A recently introduced approach relying on the differences in population means might highlight different loci (Pfenninger, 2025). Only a small amount of variation (5.7%) was explained by other systematic differences among the sampling sites. Unmeasured environmental differences among sites like e.g. soil composition, geological substratum or biotic interactions (Leuschner, 2020) were therefore of minor importance for the phenotypic drought stress response. However, extending the approach to other stress responses and their interactions could provide a more comprehensive picture of beech forest resilience.
Mean moisture stress experienced by the stands was mainly driven by the meteorological conditions, but the genetic component of the phenotype also played a substantial role. PDPS reflects the population mean of the trait accurately enough to allow for efficient modelling the trait response to experienced weather conditions. This extension of genomic prediction to the logistically and economically efficient PoolSeq approach could be a major step forward for its use in climate change genomics (Waldvogel et al., 2020).
Since moisture stress is the cause for changes in LAI under drought conditions (Leuschner, 2020) and environmental and genomic variation explained mean MSI better than mean LAI, we used MSI for predictive modelling. We used our validated model to predict the phenotypic response to drought to future climate scenarios. The choice of climate models, however, was restricted to those for which soil moisture as predicted parameter was available (RCP 4.5 and 8.5). We could show that already moderate, probably realistic rates of evolutionary adaptation based on standing genetic variation might be enough for most F. sylvatica stands to cope with a optimistic climate change scenario such as RCP 4.5.
However, even though drought response is certainly crucial, other fitness-relevant traits, like e.g. phenology are also affected by the ongoing climate change (Pfenninger et al., 2025). For a comprehensive assessment of the future development of beech forests, it will therefore be necessary to investigate these properties in a similar framework. But if both the tolerance limits and the evolutionary potential of drought resistance are likely to be exceeded in the future, as e.g. under the RCP 8.5 scenario, local extinction of the species is highly probable. Even though this worst-case scenario is not very likely to describe the future climate trajectory accurately, the threat of losing one of Europe’s most iconic ecosystem keystone species if the greenhouse gas emissions continue at the current rate should be motivation enough to act swiftly.
Persistence of beech forest in the study area under RCP4.5 and disappearance under RCP8.5 is consistent with results obtained with other methods. Buras and Menzel (Buras and Menzel, 2019) combined an analysis of climate analogues with national forest inventory data, also using CMIP5 climate scenario data, but a larger set of Global Climate Models (GCMs). They found a decrease in relative abundance probability of F. sylvatica under RCP4.5 towards the end of the century and the disappearance of F. sylvatica in most of our study area under RCP 8.5 (Figure 2 (Buras and Menzel, 2019)). Baumbach et al. (Baumbach et al., 2019) showed that future predictions from species distribution models for F. sylvatica across Germany also vary substantially between climate models (for the same RCP (Mauri et al., 2022)).
This study shows that the resistance of beech stands to drought is to a substantial part dependent on its genetic composition. It also shows that there is ample standing genetic variation for this trait at all sites investigated and therefore in the largely unstructured population as a whole. This suggests that natural selection by natural regrowth may be sufficient to maintain F. sylvatica as forest species in Central Europe, at least under moderate climate change scenarios. Given the huge number of offspring and the independence of traits predicted by short LD, it should be possible to satisfy both the needs of timber production as well as preservation of the ecological function of beech. Increasing summer drought is consistently projected for the study region across climate models and greenhouse gas scenarios. Selecting for drought tolerance is thus most likely as beneficial as inevitable, at least in the dryer parts of the study region. Whether assisted migration of potentially better adapted southern beech populations will provide additional advantages remains to be seen (Wallingford et al., 2020), but might be beneficiary for timber production (Aitken and Whitlock, 2013). As detailed, approaches to replace native tree species with supposedly better adapted introduced species (Pötzelsberger et al., 2020), however, could be premature as they could become disastrous for established ecosystems (Liebhold et al., 2017).
Under moderate climate change scenarios natural selection might act fast enough, but appropriately targeted studies and simulation models will be needed to confirm a sufficient evolutionary speed of different management practices. The other, probably even more important condition is that forest management retains or introduces the currently already widespread practice of natural regeneration to ensure a wide genetic basis allowing natural selection to work (Antonucci et al., 2021). An option to enhance this natural selection in beech would be what we would like to term “Evolutionary Management”. The guiding principle here is to remove drought susceptible individuals as soon as possible or during regular thinning from the population to avoid their reproduction. Such informed selective logging could be performed as part of the normal intense management of beeches aimed at supporting the most vital and productive trees (Röhrig et al., 2020). Given that drought susceptibility has a genetic basis, selective logging would increase the proportion of drought resistant genotypes in the current and thereby also in the coming generations. In view of the low LD; high offspring number and high genetic diversity in the species, we do not foresee any trade-offs of such a practise with the capability for adaptation of the local population to other environmentally or economically relevant dimensions. While genomic prediction on individual trees would be feasible in principle, it would be costly and logistically challenging. However, we have shown here that it is possible to identify heritably drought-sensitive patches in the stands with remote sensing early on as they respond more strongly to drought. Once it becomes possible to automatically separate and reliably identify individual trees from remote sensing data, drought susceptible trees could be removed selectively, even before they lose their economic value.
Rapid and widespread abiotic and biotic anthropogenically-driven changes of the earth system are occurring and will continue (IPCC, 2023). In response to these changes, tools that enable fast and targeted management are required to maintain ecosystems. By coupling phenotyping with genomic and environmental data in key-trait focused phenotype models, we create a powerful and cost-effective tool with multiple potential applications. This approach is likely not only applicable to most tree species but has the potential to be extended to other ecosystem-shaping species. Given the increasing availability of genomic data, large scale phenotyping is becoming more and more the limiting factor. We imagine that remote-sensing of important phenotypic traits, basically available for every part of the world, is feasible for many plant species, in particular in conjunction with population scale analysis methods that do not require resolution on an individual scale (Pfenninger, 2025; Pfenninger et al., 2025).
Such models integrating genomic, environmental, and phenotypic data could be used to anticipate climate change impacts on forests, pinpoint resilient forest stands, or speed the identification of less resilient stands allowing early intervention or proactive management; such approaches are increasingly used in forest management (e.g. Feng et al., 2024; Sandercock et al., 2024). Moreover, such approaches can be combined with advanced technologies such as artificial intelligence or machine learning to enhance predictive capabilities and develop near real-time adaptive management strategies (Jetz et al., 2019) that could enhance ecosystem resilience and maintenance of biodiversity under changing environmental conditions.
Materials and methods
Sampled Fagus sylvatica sites
The sites selected for this study were in many regards typical for German beech forests (Leuschner et al., 2017). They comprised a large ecological amplitude with regard to long term conditions. Within the range from humid-cold to warm-dry climatic conditions important demographic and genetic processes in beech forests are taking place (Fady et al., 2016). Therefore, the aim of selection and stratification was to cover the climatic spectrum of forested areas in central and southern Germany to a large extent. For the characterisation of the climatic niche, we used the climatic marginality towards the rear edge (Mellert et al., 2016), i.e. the dry and warm border of species distributions (Hampe and Petit, 2005). A simple temperature increase scenario (+2.5°C) was applied to estimate the site conditions to be expected in the future. The predicted climate was then divided into an optimal, intermediate, and marginal zone. Within the warm-dry zone we selected one stand on average soil condition (fresh water regime according to (Standortskartierung, 2016)) and one stand with unfavorable water regime (future rear-edge). Besides the climate, the nutrient regime (acidic, intermediate and basic soil) of the stands was taken into account. For each of the resulting 12 combinations, we established at least one representative site in a mature stand (minimum mean age of 70 years). As beech forest types in Germany are most frequent on acidic or intermediate soils (Wellbrock et al., 2016; Leuschner et al., 2017), these two strata were occupied by two stands (optimal/acidic: CUN, LAN; optimal/intermediate: ULM, WUR, Table 1). The more intensively studied stands KST and LAN are located at the edges of the climatic range at the warm-dry (marginal) and humid-cold (optimal) zones, respectively. All study sites were established in stands where beech had a share of at least 75% of the total stand basal area. Forest stands with a history of frequent or heavy thinning were avoided to minimize potential management effects. All selected stands were larger than 4.5 ha. Thanks to the stratification scheme the full spectrum of beech forests with respect to climate and soil nutrient regime could be covered. The site condition of the most frequent beech forest types (Wellbrock et al., 2016) were represented by two stands each. According to the Ellenberg Quotient (EQ) 4 sites are situated in the range (EQ 10-20) with beech forests having only low proportions of other tree species, 11 in the range (EQ > 20) where beech is usually admixed with other species, mostly oak. However, by including warm-dry sites on basic soils we also consider the range of a rarer type of beech forests containing a large biodiversity (Leuschner et al., 2017). The chosen stands comprised often unknown management histories with a mix of autochthonous and afforested sites which is typical for beech forests in Germany (Leuschner et al., 2017).
Information on stand histories, in particular whether they were actively planted or arose from natural regrowth (termed “autochthonous”) was obtained either by forest inventories (“Revierbücher”) or directly from foresters responsible for the site. Per site, we sampled 48 canopy-forming trees of at least 70 years of age in a distance of 30 m to avoid the inclusion of closely related individuals. For the sites KST and LAN, two additional pools of 48 individuals from younger growth classes were sampled. The first class were trees below 1 m height (JW), the second established trees of 20–40 cm stem diameter in breast-height and not reaching the canopy (SH). Growth classes should roughly correspond to age, but since growth in beech can be stalled by diminished light under a closed canopy, growth classes give a more accurate assessment of the time it will minimally take to become the reproducing cohort.
Construction of population pools, sequencing, population structure and genetic diversity
From each tree 1–2 buds or 3–4 leave discs of 0.5 mm diameter (approx. 50 mg of fresh plant material) were dried in Silicagel prior to homogenization. DNA was extracted using an inhouse protocol. We constructed DNA pools per population using the same DNA quantity per individual beech. DNA concentration was measured using a Quantus fluorometer (Promega). Library preparation and 150bp paired-end sequencing with 450bp insert was conducted at Novogene.
Reads were trimmed using Trimmomatic v.0.39 (Bolger et al., 2014) and quality controlled with FastQC v.0.11.9 (Andrews, 2010). We used BWA mem v.0.7.17 (Li and Durbin, 2009) to map the reads onto the newest version of the beech reference genome (Mishra et al., 2018, 2021) and Samtools v.1.10 (Li et al., 2009) to convert, sort and pile up the bam files. Duplicates were marked and removed with Picard v.2.20.8 (https://github.com/broadinstitute/picard). PoPoolation2 v.2.201 (Kofler et al., 2011b) pipeline was used to remove indels, and calculated allele frequencies for every position and pairwise FSTs in non-overlapping 1kb windows. Theta and nucleotide diversity was estimated in the same windows with PoPoolation1 v.1.2.2 (Kofler et al., 2011a). We considered only sites within a coverage range of 15-50X.
Environmental data
To assess climatic differences among sites, we extracted long-term climatic data from Worldclim 2.1 data for the period between 1970–2000 with a resolution of 30 sec (Fick and Hijmans, 2017) for each sampling site using DIVA-GIS 7.5 (Hijmans et al., 2012). All temperature and precipitation parameters, including the BioClim parameters bio5 and bio18 were used. We summarised the data for the core vegetation period of beech at the sampling sites between May and September in a Principal Component Analysis (PCA).
Meteorological data on the actual weather conditions at the sampling sites during the core vegetation period between May and September was obtained for the years 2016 to 2022 from the DWD (Deutscher Wetterdienst) data portal at https://cdc.dwd.de/portal/202209231028/searchview. We used monthly grid data in a resolution of 1 x 1 km of the following nine parameters: mean air temperature, means of daily air temperature maxima and minima, sum of potential and real evapotranspiration, number of hot days (maximum >= 30°C), number of summer days (maximum >= 25°C), drought index according to de Martonne and medium soil moisture under grass and sandy loam. We summarised the data in a PCA.
Genomic prediction from PoolSeq data
A recent article (Pfenninger et al., 2021) showed that individual genotypes at a selection of unlinked loci related to drought resistance can be successfully used to predict the respective phenotype of the tree based on a continuous phenotypic score in response to drought stress. Here we have extended this genomic prediction approach to PoolSeq data. In PoolSeq data, the information on individual genotypes in a population is lost in favour of precise allele frequency estimates (Czech et al., 2022). To take advantage of the existing genomic prediction framework, we used these allele frequency estimates at loci with high predictive power to simulate a large number of possible genotypes under the assumption of random mating within the population. We used the allele frequency information of 46 loci with high predictive power in linear discriminant analysis and the resulting weighting vector for each locus (Supplementary Table 1). For each sampling site, we simulated 10,000 individual genotypes. We then calculated the distribution of expected phenotype scores for each sampled population. This score is positive for susceptible phenotypes and negative for resistant ones. As the resulting distributions were approximately normally distributed, we used the mean as genomic predictor score of the population phenotype distribution of drought resistance (Population Drought Phenotype Score, PDPS hereafter). The calculations of PDPS were performed with a custom Python script.
Inference of local adaptation
If the populations at the sampling site were adapted to local drought conditions, we expected PDPS to be related to the long-term drought risk during the vegetation period. We therefore correlated the PCA1 of the long-term summer climate conditions (see above) to the PDPS of each site. To see whether the management history of the stands could have influenced the results, we fitted linear models to i) autochthonous stands and ii) stands known to be planted and of unknown origin separately. We also compared predicted phenotype score distributions among age classes at the sites KST and LAN.
Remote sensing data
We focused on two remote sensing measurements of canopy features. Leaf Area Index (LAI; leaf area per ground area) and the Moisture Stress Index (MSI), that a priori seemed to best reflect the phenotype scored for genomic association (apparent vitality, respective loss of canopy leaves (Pfenninger et al., 2021)). Generally, the remote sensing values of LAI and MSI do not correspond directly to the canopy’s chemical, physical and biological characteristics but rather to the electromagnetic signal these produce. LAI is dimensionless and measures the covering of the ground area with leaves. The overlap of leaves can lead to a coverage of up to 16 under dense forest canopies (Brown et al., 2021). In beech forests, it ranges usually between 6 and 8. Remote sensing systems are not capable of capturing the heterogeneity in leaf distribution across forest canopies caused by this overlap. In this regard, retrieval methods commonly assume a simplified homogeneous canopy structure that makes the sensor actually measure a so-called ‘effective LAI’. It is described as the value that would induce the same remote sensing signal as the real LAI under the assumption of a random leaf distribution and is therefore inherently smaller (Chen et al., 2005).
In this study, we derived canopy LAI products of 10 m spatial resolution from atmospherically corrected Level-2 images acquired by the Multispectral Instrument on-board the ESA’s Sentinel-2 twin satellites. These products were accessed in the Sentinel Hub Earth Observation Browser (EO-Browser; https://www.sentinel-hub.com/explore/eobrowser/) for cloudless scenes during the growing season (May-Sep) from 2016 to 2022 using evaluation scripts. It allows the user to utilize the Sentinel-2 Level 2 Prototype Processor (SL2P) that is implemented in the Sentinel Application Platform (SNAP) software. The SL2P is an algorithm that enables the retrieval of vegetation biophysical variables from Level 2 optical satellite imagery. It is composed of artificial neural networks (ANNs) that were trained with simulations from the Leaf Optical Properties Spectra (PROSPECT) and Scattering by Arbitrarily Inclined Leaves (4SAIL) models. The ANNs are applied to top of canopy reflectance pixel values from nine bands between wavelength 560nm and 2190nm. In addition to the spectral information, acquisition geometry parameters (cosine of sun zenith angle, view zenith angle, relative azimuth angle) are being fed to the model (Weiß and Fincke, 2022). For the year 2016, canopy LAI products were generated using the same algorithm in SNAP based on Level-2A Sentinel-2 images accessed via the Copernicus Data and Exploitation Platform (CODE-DE).
MSI is, contrary to the LAI, an at-sensor parameter that is calculated as the ratio in near-infrared absorption at wavelength 819nm and 1599nm, and thus technically independent from LAI estimates. This ratio is a good indicator of water stress in plants, because the absorption of leaves in the vegetation cover at 1599 nm is positively correlated with their water content, while absorption at 819 nm remains almost unaffected. While usually ranging between 0.4 and 2.0, higher values are associated with greater water stress (Hunt and Rock, 1989). In alignment to the retrieval of LAI, MSI was computed in the EO-Browser from images unaffected by cloud cover within the period of 2017 and 2021 over each study site by using an evaluation script that contains the respective index formula. For the year 2016, the MSI products were generated in QuantumGIS (QGIS) based on Level-2 imagery accessed from the CODE-DE platform.
Damage threshold inference
Drought-induced leaf loss and thus decreased vigour is preceded by water (shortage) stress (Leuschner, 2020). To find empirical stand-wise mean MSI thresholds above which detectable drought-induced vitality degradation by leaf loss in at least some of the trees occurred, we first determined i) the 1% quantile of the minimum annual canopy LAI in the non-drought years 2016 and 2017 for each pixel at all sites, i.e. a lower limit for the normal LAI over the vegetation period (LAItres) and ii) the mean maximum annual MSI for a pixel after which the above LAItres threshold was undercut for at least two years; i.e. that was followed by substantial, lasting leaf-loss (MSItres). We then determined for all observation days and all stands the percentage of pixels that had values below LAItres or above MSItres, respectively. These values were then regressed against the corresponding mean MSI of the entire stand. Threshold values were estimated from these plots by segmented regression (Muggeo et al., 2014).
Model selection
To infer whether genomic prediction contributes significantly to the explanation of variance in LAI and MSI, we used general linear modelling (GLM) in a model selection approach. Using the nine meteorological variables listed above, we fitted GLMs to all possible parameter combinations and compared the associated Akaike information criteria (AIC). We considered the model with the lowest AIC to be the best model. We then added the PDPS as a further explanatory variable and calculated AIC for resulting models as well. All calculations were performed in R v4.2.2 (R Core Team, 2013).
Prediction of phenotypic reactions in future climate scenarios
Future climate conditions for each study site were derived from climate projections of the Climate Model Intercomparison Project 5 (CMIP5) that were bias-corrected and provided by the ISIMIP Fast Track Initiative. The datasets consist of five Global Climate Models (GCMs; HadGEM2-ES, IPSL-CM5A-LR, MIROC-ESM-CHEM, GFDL-ESM2M, and NorESM1-M) from which we calculated the assembled mean. We focused on two representative concentration pathways (RCP 4.5 and RCP 8.5). For each pathway and study site, we used time-series of daily mean air temperature and daily maximum air temperature for the next century from the ISIMIP data set, subset and aggregated to decadal means.
As a proxy for water stress, we used future projections of site-specific soil moisture given by an open-access dataset of future soil moisture index (Rakovec et al., 2021) based on simulations from the mesoscale Hydrologic Model (mHM; (Samaniego et al., 2010; Kumar et al., 2013)), which was also calculated using the ISIMIP Fast Track. Again, soil moisture index was provided as five realisations, which were then aggregated to the ensemble mean. Finally, the soil moisture index of RCP 4.5 and RCP 8.5 were subset and aggregated to decadal means as the future temperature data.
Introducing evolution in phenotypic prediction
We assumed three evolutionary adaptation scenarios: 1) No adaptation at all. This would correspond to a management shielding the stands completely from selection, e.g. by planting and raising random seedlings. 2) Intermediate adaptation. The PDPS of each site was diminished by the largest observed difference between two growth classes at the same site (ΔPDPS between JW and CT at the LAN site). Assuming that this difference was caused by natural selection due to the LAN site being one of the driest and warmest sites in the long term (Figure 1B), it would correspond to a natural adaptation rate that can be achieved within a few decades. 3) Maximum observed adaptation. In this scenario, we assumed that all sites evolve to the lowest PDPS observed. Given the genetic variation present in the surveyed F. sylvatica stands, more extreme PDPS and thus better drought adapted populations are theoretically possible, but it is uncertain whether such values are associated with trade-offs.
We used the decadal means for the two climate scenarios and the two periods to predict the MSI for each month in the vegetation period for each site. To account for the interannual variance in predicted weather conditions, we calculated a corridor of two standard deviations for the respectively most extreme sites. We considered a population to be considerably well adapted to the predicted future conditions, if these margins, implying longer lasting damages, were not regularly surpassed.
Data availability statement
Historical long-term climatic data from WorldClim database version 2.1 can be downloaded from https://www.worldclim.org/data/worldclim21.html, meteorological data from DWD can be accessed from https://cdc.dwd.de/portal/202209231028/searchview. Sentinel-2 surface reflectance data can be downloaded via the Sentinel hub services platform (https://apps.sentinel-hub.com/eo-browser/) and CODE-DE (https://finder.code-de.org/). Genomic data was archived at ENA https://www.ebi.ac.uk/ena/browser/home under the project accession number PRJEB60881. Data used for preparation of figures and Supplementary Information including Python scripts can be found at https://doi.org/10.5281/zenodo.17417201.
Author contributions
MP: Conceptualization, Data curation, Formal Analysis, Funding acquisition, Investigation, Methodology, Project administration, Resources, Software, Supervision, Validation, Visualization, Writing – original draft. LL: Conceptualization, Writing – review & editing. BFe: Data curation, Investigation, Methodology, Writing – review & editing. BFu: Resources, Writing – review & editing. JHo: Data curation, Methodology, Software, Writing – review & editing. JHe: Data curation, Writing – review & editing, Investigation, Methodology. MŠ: Writing – review & editing, Funding acquisition, Resources. K-HM: Funding acquisition, Resources, Writing – review & editing. TH: Resources, Writing – review & editing, Conceptualization, Supervision.
Funding
The author(s) declare that financial support was received for the research and/or publication of this article. This study was partially funded by the Federal Ministry of Food and Agriculture and the Federal Ministry for the Environment, Nature Conservation, Nuclear Safety and Consumer Protection based on a resolution of the German Bundestag (project number 28W-B-4-058-01) and the Bavarian Office for Forest Genetics. Funding was contributed by the Hessisches Landesamt für Umwelt, Naturschutz und Geologie (HLNUG) in the framework of the FAST-Project.
Acknowledgments
We thank Renan Granado Chavez for his translation of the genome versions.
Conflict of interest
The authors declare that the research was conducted in the absence of any commercial or financial relationships that could be construed as a potential conflict of interest.
Generative AI statement
The author(s) declare that no Generative AI was used in the creation of this manuscript.
Any alternative text (alt text) provided alongside figures in this article has been generated by Frontiers with the support of artificial intelligence and reasonable efforts have been made to ensure accuracy, including review by the authors wherever possible. If you identify any issues, please contact us.
Publisher’s note
All claims expressed in this article are solely those of the authors and do not necessarily represent those of their affiliated organizations, or those of the publisher, the editors and the reviewers. Any product that may be evaluated in this article, or claim that may be made by its manufacturer, is not guaranteed or endorsed by the publisher.
Supplementary material
The Supplementary Material for this article can be found online at: https://www.frontiersin.org/articles/10.3389/fevo.2025.1704275/full#supplementary-material
References
Aitken S. N. and Whitlock M. C. (2013). Assisted gene flow to facilitate local adaptation to climate change. Annu. Rev. ecology evolution systematics 44, 367–388. doi: 10.1146/annurev-ecolsys-110512-135747
Andrews S. (2010). FastQC-A Quality Control application for FastQ files (Babraham, UK: Babraham Bioinformatics).
Antonucci S., Santopuoli G., Marchetti M., Tognetti R., Chiavetta U., and Garfì V. (2021). What is known about the management of european beech forests facing climate change? A Review. Curr. Forestry Rep. 7, 321–333. doi: 10.1007/s40725-021-00149-4
Arnold P. A., Kruuk L. E., and Nicotra A. B. (2019). How to analyse plant phenotypic plasticity in response to a changing climate. New Phytol. 222, 1235–1241. doi: 10.1111/nph.15656
Ayres E., Colliander A., Cosh M. H., Roberti J. A., Simkin S., and Genazzio M. A. (2021). Validation of SMAP soil moisture at terrestrial national ecological observatory network (NEON) sites show potential for soil moisture retrieval in forested areas. IEEE J. selected topics Appl. Earth observations Remote Sens. 14, 10903–10918. doi: 10.1109/JSTARS.2021.3121206
Baumbach L., Niamir A., Hickler T., and Yousefpour R. (2019). Regional adaptation of European beech (Fagus sylvatica) to drought in Central European conditions considering environmental suitability and economic implications. Regional Environ. Change 19, 1159–1174. doi: 10.1007/s10113-019-01472-0
Belmonte J., Alarcón M., Avila A., Scialabba E., and Pino D. (2008). Long-range transport of beech (Fagus sylvatica L.) pollen to Catalonia (north-eastern Spain). Int. J. Biometeorology 52, 675–687. doi: 10.1007/s00484-008-0160-9
Bolger A. M., Lohse M., and Usadel B. (2014). Trimmomatic: a flexible trimmer for Illumina sequence data. Bioinformatics 30, 2114–2120. doi: 10.1093/bioinformatics/btu170
Bolte A., Czajkowski T., Cocozza C., Tognetti R., De Miguel M., Pšidová E., et al. (2016). Desiccation and mortality dynamics in seedlings of different European beech (Fagus sylvatica L.) populations under extreme drought conditions. Front. Plant Sci. 7, 751.
Brady S. P., Bolnick D. I., Angert A. L., Gonzalez A., Barrett R. D., Crispo E., et al. (2019). Causes of maladaptation. Evolutionary Appl. 12, 1229–1242. doi: 10.1111/eva.12844
Brang P., Küchli C., Schwitter R., Bugmann H., and Ammann P. (2016). Waldbauliche Strategien im Klimawandel. Wald im Klimawandel. Grundlagen für Adaptationsstrategien, 341–364.
Bressem U. (2008). Komplexe Erkrankungen an Buche. Complex diseases in beech. Ergebnisse angewandter Forschung zur Buche 3, 87.
Brown L. A., Fernandes R., Djamai N., Meier C., Gobron N., Morris H., et al. (2021). Validation of baseline and modified Sentinel-2 Level 2 Prototype Processor leaf area index retrievals over the United States. ISPRS J. Photogrammetry Remote Sens. 175, 71–87. doi: 10.1016/j.isprsjprs.2021.02.020
Brunet J., Felton A., and Lindbladh M. (2012). From wooded pasture to timber production–Changes in a European beech (Fagus sylvatica) forest landscape between 1840 and 2010. Scandinavian J. For. Res. 27, 245–254. doi: 10.1080/02827581.2011.633548
Brunet J., Fritz Ö., and Richnau G. (2010). Biodiversity in European beech forests-a review with recommendations for sustainable forest management. Ecol. Bulletins, 77–94.
Buras A. and Menzel A. (2019). Projecting tree species composition changes of European forests for 2061–2090 under RCP 4.5 and RCP 8.5 scenarios. Front. Plant Sci. 9, 1986. doi: 10.3389/fpls.2018.01986
Campbell I. D. and McAndrews J. H. (1993). Forest disequilibrium caused by rapid Little Ice Age cooling. Nature 366, 336–338. doi: 10.1038/366336a0
Capblancq T., Fitzpatrick M. C., Bay R. A., Exposito-Alonso M., and Keller S. R. (2020). Genomic prediction of (mal) adaptation across current and future climatic landscapes. Annu. Rev. Ecology Evolution Systematics 51, 245–269. doi: 10.1146/annurev-ecolsys-020720-042553
Charlesworth B. (2009). Effective population size and patterns of molecular evolution and variation. Nat. Rev. Genet. 10, 195–205. doi: 10.1038/nrg2526
Chen J. M., Menges C. H., and Leblanc S. G. (2005). Global mapping of foliage clumping index using multi-angular satellite data. Remote Sens. Environ. 97, 447–457. doi: 10.1016/j.rse.2005.05.003
Czech L., Peng Y., Spence J. P., Lang P. L., Bellagio T., Hildebrandt J., et al. (2022). Monitoring rapid evolution of plant populations at scale with Pool-Sequencing. BioRxiv, 2022–2002.
Dorow W. H., Blick T., and Kopelke J.-P. (2010). Zoologische Forschung in hessischen Naturwaldreservaten–Exemplarische Ergebnisse und Perspektiven. Forstarchiv 81, 61–68.
Dudbridge F. (2013). Power and predictive accuracy of polygenic risk scores. PloS Genet. 9, e1003348. doi: 10.1371/journal.pgen.1003348
Elsasser P., Altenbrunn K., Köthke M., Lorenz M., and Meyerhoff J. (2021). Spatial distribution of forest ecosystem service benefits in Germany: A multiple benefit-transfer model. Forests 12, 169. doi: 10.3390/f12020169
Fady B., Aravanopoulos F. A., Alizoti P., Mátyás C., von Wühlisch G., Westergren M., et al. (2016). Evolution-based approach needed for the conservation and silviculture of peripheral forest tree populations. For. Ecol. Manage. 375, 66–75. doi: 10.1016/j.foreco.2016.05.015
Feng J., Dan X., Cui Y., Gong Y., Peng M., Sang Y., et al. (2024). Integrating evolutionary genomics of forest trees to inform future tree breeding amid rapid climate change. Plant Commun. 5. doi: 10.1016/j.xplc.2024.101044
Fick S. E. and Hijmans R. J. (2017). WorldClim 2: new 1-km spatial resolution climate surfaces for global land areas. Int. J. Climatol 37, 4302–4315. doi: 10.1002/joc.5086
Finkeldey R. and Ziehe M. (2004). Genetic implications of silvicultural regimes. For. Ecol. Manage. 197, 231–244. doi: 10.1016/j.foreco.2004.05.036
Fisher R. A. (1923). XXI.—On the dominance ratio. Proc. R. Soc. Edinburgh 42, 321–341. doi: 10.1017/S0370164600023993
Frank A., Howe G. T., Sperisen C., Brang P., Clair J. B. S., Schmatz D. R., et al. (2017). Risk of genetic maladaptation due to climate change in three major European tree species. Global Change Biol. 23, 5358–5371. doi: 10.1111/gcb.13802
Friedlingstein P., Jones M. W., O’Sullivan M., Andrew R. M., Bakker D. C., Hauck J., et al. (2022). Global carbon budget 2021. Earth System Sci. Data 14, 1917–2005. doi: 10.5194/essd-14-1917-2022
Hampe A. and Petit R. J. (2005). Conserving biodiversity under climate change: the rear edge matters. Ecol. Lett. 8, 461–467. doi: 10.1111/j.1461-0248.2005.00739.x
Harter D. E., Nagy L., Backhaus S., Beierkuhnlein C., Fussi B., Huber G., et al. (2015). A comparison of genetic diversity and phenotypic plasticity among European Beech (Fagus sylvatica L.) populations from Bulgaria and Germany under drought and temperature manipulation. Int. J. Plant Sci. 176, 232–244. doi: 10.1086/679349
Heim J., Krott M., and Böcher M. (2018). Nomination and inscription of the “Ancient Beech Forests of Germany” as natural World Heritage: multi-level governance between science and politics. Int. Environ. Agreements: Politics Law Econ 18, 599–617. doi: 10.1007/s10784-018-9407-z
Hijmans R. J., Guarino L., and Mathur P. (2012). DIVA-GIS. Version 7.5. A geographic information system for the analysis of species distribution data. Bioinformatics 19.
Hunt E. R. Jr. and Rock B. N. (1989). Detection of changes in leaf water content using near-and middle-infrared reflectances. Remote Sens. Environ. 30, 43–54.
IPCC. (2023). Climate Change 2023: Synthesis Report. Contribution of Working Groups I, II and III to the Sixth Assessment Report of the Intergovernmental Panel on Climate Change [Core Writing Team, H. Lee and J. Romero (eds.)]. IPCC, Geneva, Switzerland, pp. 35-115, doi: HYPERLINK "https://dx.doi.org/10.59327/IPCC/AR6-9789291691647"10.59327/IPCC/AR6-9789291691647.
Jaureguiberry P., Titeux N., Wiemers M., Bowler D. E., Coscieme L., Golden A. S., et al. (2022). The direct drivers of recent global anthropogenic biodiversity loss. Sci. Adv. 8, eabm9982. doi: 10.1126/sciadv.abm9982
Jetz W., McGeoch M. A., Guralnick R., Ferrier S., Beck J., Costello M. J., et al. (2019). Essential biodiversity variables for mapping and monitoring species populations. Nat. Ecol. Evol. 3, 539–551. doi: 10.1038/s41559-019-0826-1
Kawecki T. J. and Ebert D. (2004). Conceptual issues in local adaptation. Ecol. Lett. 7, 1225–1241. doi: 10.1111/j.1461-0248.2004.00684.x
Kembrytė R., Danusevičius D., Buchovska J., Baliuckas V., Kavaliauskas D., Fussi B., et al. (2021). DNA-based tracking of historical introductions of forest trees: The case of European beech (Fagus sylvatica L.) in Lithuania. Eur. J. For. Res. 140, 435–449. doi: 10.1007/s10342-020-01341-0
Kim J. H. (2019). Multicollinearity and misleading statistical results. Korean J. anesthesiology 72, 558–569. doi: 10.4097/kja.19087
Kofler R., Orozco-terWengel P., De Maio N., Pandey R. V., Nolte V., Futschik A., et al. (2011a). PoPoolation: a toolbox for population genetic analysis of next generation sequencing data from pooled individuals. PloS One 6, e15925. doi: 10.1371/journal.pone.0015925
Kofler R., Pandey R. V., and Schlötterer C. (2011b). PoPoolation2: identifying differentiation between populations using sequencing of pooled DNA samples (Pool-Seq). Bioinformatics 27, 3435–3436. doi: 10.1093/bioinformatics/btr589
Konnert M. and Haverkamp M. (2016). Gebietsheimische Gehölze im Spannungsfeld zwischen Forstwirtschaft und Naturschutz. Thünen Rep. 45, 5.
Kostić S., Wagner W., Orlović S., Levanič T., Zlatanov T., Goršić E., et al. (2021). Different tree-ring width sensitivities to satellite-based soil moisture from dry, moderate and wet pedunculate oak (Quercus robur L.) stands across a southeastern distribution margin. Sci. total Environ. 800, 149536.
Kumar R., Samaniego L., and Attinger S. (2013). Implications of distributed hydrologic model parameterization on water fluxes at multiple scales and locations. Water Resour. Res. 49, 360–379. doi: 10.1029/2012WR012195
Lamb H. H. (1972). The cold little ice age of about 1550 to 1800. Climate: present, past and future.
Lazic D., Geßner C., Liepe K. J., Lesur-Kupin I., Mader M., Blanc-Jolivet C., et al. (2024). Genomic variation of European beech reveals signals of local adaptation despite high levels of phenotypic plasticity. Nat. Commun. 15, 8553. doi: 10.1038/s41467-024-52933-y
Leuschner C. (2020). Drought response of European beech (Fagus sylvatica L.)—A review. Perspect. Plant Ecology Evol. Systematics 47, 125576. doi: 10.1016/j.ppees.2020.125576
Leuschner C., Ellenberg H., Leuschner C., and Ellenberg H. (2017). Beech and mixed beech forests. Ecol. Cent. Eur. Forests: Vegetation Ecol. Cent. Europe I, 351–441. doi: 10.1007/978-3-319-43042-3
Li H. and Durbin R. (2009). Fast and accurate short read alignment with Burrows–Wheeler transform. bioinformatics 25, 1754–1760. doi: 10.1093/bioinformatics/btp324
Li H., Handsaker B., Wysoker A., Fennell T., Ruan J., Homer N., et al. (2009). The sequence alignment/map format and SAMtools. Bioinformatics 25, 2078–2079. doi: 10.1093/bioinformatics/btp352
Liebhold A. M., Brockerhoff E. G., Kalisz S., Nuñez M. A., Wardle D. A., and Wingfield M. J. (2017). Biological invasions in forest ecosystems. Biol. Invasions 19, 3437–3458. doi: 10.1007/s10530-017-1458-5
Lotterhos K. E. (2022). Does the paradigm of genotype-environment associations need to be re-assessed? The paradox of adaptive phenotypic clines with non-clinal patterns in causal alleles. bioRxiv, 2022–2008.
Magri D., Vendramin G. G., Comps B., Dupanloup I., Geburek T., Gömöry D., et al. (2006). A new scenario for the Quaternary history of European beech populations: palaeobotanical evidence and genetic consequences. New Phytol. 171, 199–221. doi: 10.1111/j.1469-8137.2006.01740.x
Mathieson I. (2021). The omnigenic model and polygenic prediction of complex traits. Am. J. Hum. Genet. 108, 1558–1563. doi: 10.1016/j.ajhg.2021.07.003
Mauri A., Girardello M., Strona G., Beck P. S., Forzieri G., Caudullo G., et al. (2022). EU-Trees4F, a dataset on the future distribution of European tree species. Sci. Data 9, 37.
Meirmans P. G. and Hedrick P. W. (2011). Assessing population structure: FST and related measures. Mol. Ecol. Resour. 11, 5–18. doi: 10.1111/j.1755-0998.2010.02927.x
Mellert K. H., Ewald J., Hornstein D., Dorado-Liñán I., Jantsch M., Taeger S., et al. (2016). Climatic marginality: a new metric for the susceptibility of tree species to warming exemplified by Fagus sylvatica (L.) and Ellenberg’s quotient. Eur. J. For. Res. 135, 137–152. doi: 10.1007/s10342-015-0924-9
Mishra B., Gupta D. K., Pfenninger M., Hickler T., Langer E., Nam B., et al. (2018). A reference genome of the European beech (Fagus sylvatica L.). Gigascience 7, giy063. doi: 10.1093/gigascience/giy063
Mishra B., Ulaszewski B., Meger J., Aury J.-M., Bodénès C., Lesur-Kupin I., et al. (2021). A chromosome-level genome assembly of the european beech (Fagus sylvatica) reveals anomalies for organelle DNA integration, repeat content and distribution of SNPs. Front. Genet. 12, 691058. doi: 10.3389/fgene.2021.691058
Muggeo V. M., Atkins D. C., Gallop R. J., and Dimidjian S. (2014). Segmented mixed models with random changepoints: a maximum likelihood approach with application to treatment for depression study. Stat. Model. 14, 293–313. doi: 10.1177/1471082X13504721
Paar U., Dammann I., Weimar J., Spielmann M., and Eichhorn J. (2019). Paar: waldzustandsbericht hessen 2019 (Nordwestdeutsche Forstliche Versuchsanstalt). Available online at: www.umwelt.hessen.de (Accessed March 25, 2023).
Pfenninger M. (2025). On the potential for GWAS with phenotypic population means and allele-frequency data (popGWAS). Peer Community J. 5, e40. doi: 10.24072/pcjournal.544
Pfenninger M., Langan L., Feldmeyer B., Eberhardt L., Reuss F., Hoffmann J., et al. (2025). Predicting forest tree leaf phenology under climate change using satellite monitoring and population-based GWAS. Global Change Biol. 31. doi: 10.1111/gcb.70484
Pfenninger M., Reuss F., Kiebler A., Schönnenbeck P., Caliendo C., Gerber S., et al. (2021). Genomic basis for drought resistance in European beech forests threatened by climate change. Elife 10, e65532. doi: 10.7554/eLife.65532.sa2
Piutti E. and Cescatti A. (1997). A quantitative analysis of the interactions between climatic response and intraspecific competition in European beech. Can. J. For. Res. 27, 277–284. doi: 10.1139/x96-176
Postolache D., Oddou-Muratorio S., Vajana E., Bagnoli F., Guichoux E., Hampe A., et al. (2021). Genetic signatures of divergent selection in European beech (Fagus sylvatica L.) are associated with the variation in temperature and precipitation across its distribution range. Mol. Ecol. 30, 5029–5047. doi: 10.1111/mec.16115
Pötzelsberger E., Spiecker H., Neophytou C., Mohren F., Gazda A., and Hasenauer H. (2020). Growing non-native trees in European forests brings benefits and opportunities but also has its risks and limits. Curr. Forestry Rep. 6, 339–353. doi: 10.1007/s40725-020-00129-0
Rakovec O., Samaniego L., Hari V., Markonis Y., Moravec V., Thober S., et al. (2021). Soil moisture drought reconstruction across Europe since 1766. doi: 10.5281/zenodo.5801249
Röhrig E., Bartsch N., and von Lüpke B. (2020). Waldbau auf ökologischer Grundlage. (Berlin: UTB GmbH).
Samaniego L., Kumar R., and Attinger S. (2010). Multiscale parameter regionalization of a grid-based hydrologic model at the mesoscale. Water Resour. Res. 46. doi: 10.1029/2008WR007327
Sandercock A. M., Westbrook J. W., Zhang Q., and Holliday J. A. (2024). A genome-guided strategy for climate resilience in American chestnut restoration populations. Proc. Natl. Acad. Sci. U.S.A. 121, e2403505121. doi: 10.1073/pnas.2403505121
Savolainen O. and Pyhäjärvi T. (2007). Genomic diversity in forest trees. Curr. Opin. Plant Biol. 10, 162–167. doi: 10.1016/j.pbi.2007.01.011
Schuldt B., Buras A., Arend M., Vitasse Y., Beierkuhnlein C., Damm A., et al. (2020). A first assessment of the impact of the extreme 2018 summer drought on Central European forests. Basic Appl. Ecol. 45, 86–103. doi: 10.1016/j.baae.2020.04.003
Sutmöller J., Spellmann H., Fiebiger C., and Albert M. (2008). Der Klimawandel und seine Auswirkungen auf die Buchenwälder in Deutschland The effects of climate change on beech forests in Germany. Ergeb. Angew. Forsch. Buche 3, 135.
Trotsiuk V., Hobi M. L., and Commarmot B. (2012). Age structure and disturbance dynamics of the relic virgin beech forest Uholka (Ukrainian Carpathians). For. Ecol. Manage. 265, 181–190. doi: 10.1016/j.foreco.2011.10.042
von Oheimb G., Westphal C., Tempel H., and Härdtle W. (2005). Structural pattern of a near-natural beech forest (Fagus sylvatica)(Serrahn, North-east Germany). For. Ecol. Manage. 212, 253–263. doi: 10.1016/j.foreco.2005.03.033
Waldvogel A.-M., Feldmeyer B., Rolshausen G., Exposito-Alonso M., Rellstab C., Kofler R., et al. (2020). Evolutionary genomics can improve prediction of species’ responses to climate change. Evol. Lett. 4, 4–18. doi: 10.1002/evl3.154
Wallingford P. D., Morelli T. L., Allen J. M., Beaury E. M., Blumenthal D. M., Bradley B. A., et al. (2020). Adjusting the lens of invasion biology to focus on the impacts of climate-driven range shifts. Nat. Climate Change 10, 398–405. doi: 10.1038/s41558-020-0768-2
Walsh B. and Lynch M. (2018). Evolution and selection of quantitative traits. (Oxford: Oxford University Press).
Wang K. S. (2004). Gene flow in European beech (Fagus sylvatica L.). Genetica 122, 105–113. doi: 10.1023/B:GENE.0000040999.07339.d4
Weiß T. and Fincke T. (2022). SenSARP: A pipeline to pre-process Sentinel-1 SLC data by using ESA SNAP Sentinel-1 Toolbox. J. Open Source Software 7, 3337. doi: 10.21105/joss.03337
Wellbrock N., Bolte A., and Flessa H. (2016). Dynamics and spatial patterns of forestry in Germany. Results of soil condition survey in the forest 2006 to 2008. Thünen Rep. 43.
Zang C., Hartl-Meier C., Dittmar C., Rothe A., and Menzel A. (2014). Patterns of drought tolerance in major European temperate forest trees: climatic drivers and levels of variability. Global Change Biol. 20, 3767–3779. doi: 10.1111/gcb.12637
Zhang X.-S. and Hill W. G. (2005). Genetic variability under mutation selection balance. Trends Ecol. Evol. 20, 468–470. doi: 10.1016/j.tree.2005.06.010
Zheng Y., Chen Z., Pearson T., Zhao J., Hu H., and Prosperi M. (2020). Design and methodology challenges of environment-wide association studies: A systematic review. Environ. Res. 183, 109275. doi: 10.1016/j.envres.2020.109275
Keywords: PoolSeq, sentinel, evolutionary rescue, forest resilience, conservation genetics, landscape genomics
Citation: Pfenninger M, Langan L, Feldmeyer B, Fussi B, Hoffmann J, Hetzer J, Šeho M, Mellert K-H and Hickler T (2025) Phenotypic drought stress prediction of European beech (Fagus sylvatica) by genomic prediction and remote sensing. Front. Ecol. Evol. 13:1704275. doi: 10.3389/fevo.2025.1704275
Received: 12 September 2025; Accepted: 31 October 2025;
Published: 20 November 2025.
Edited by:
Yi Xu, Chinese Academy of Tropical Agricultural Sciences, ChinaReviewed by:
Momina Hussain, National Institute for Biotechnology and Genetic Engineering, PakistanUsman Ali, Hunan University, China
Copyright © 2025 Pfenninger, Langan, Feldmeyer, Fussi, Hoffmann, Hetzer, Šeho, Mellert and Hickler. This is an open-access article distributed under the terms of the Creative Commons Attribution License (CC BY). The use, distribution or reproduction in other forums is permitted, provided the original author(s) and the copyright owner(s) are credited and that the original publication in this journal is cited, in accordance with accepted academic practice. No use, distribution or reproduction is permitted which does not comply with these terms.
*Correspondence: Markus Pfenninger, bWFya3VzLnBmZW5uaW5nZXJAc2VuY2tlbmJlcmcuZGU=