 Daisuke P. Yamaguchi1Dai Mishima2Kozue Nakamura2Junji Sano2,3
 Tatsuro Nakaji4
 Tsutom Hiura4
 Kouki Hikosaka1*
- 1Graduate School of Life Sciences, Tohoku University, Sendai, Japan
- 2Faculty of Agriculture, Field Science Center, Tottori University Forests, Tottori University, Tottori, Japan
- 3Institute of Forest Education, Fujisawa, Japan
- 4Tomakomai Research Station, Field Science Center for Northern Biosphere, Hokkaido University, Tomakomai, Japan
As temperature dependence in many biological processes is generally a bell-shaped curve, warming may be benefitial at cooler climate but deterimental at warmer climate. Although warming responses are expected to vary between different temperature regimes even in the same species, such variations are poorly understood. We established open-top canopy chambers, in which average daytime leaf temperature was increased by ca. 1.0°C, at the canopy top of Quercus serrata in a deciduous forest in high (HL) and low (LL) latitude sites and studied temperature dependence of photosynthesis in the leaves across seasons. In control leaves, photosynthetic rates were higher in LL than in HL. Reponse to warming was different between HL and LL; an increase in growth temperature increased photosynthetic rates at higher leaf temperatures in HL but decreased in LL. Lower photosynthetic rate in the warming treatment in LL was partly explained by lower leaf mass per area and leaf nitrogen content per unit leaf area. Optimal temperature that maximizes photosynthetic rate (Topt) linearly increased with increasing growth temperature (GT) in HL, whereas it was saturating against GT in LL, suggesting that Topt in Q. serrata has an upper limit. The variation in Topt was explained by the activation energy of the maximum carboxylation rate (EaV). Our results suggest an upper limit in temperature acclimation of photosynthesis, which may be one of the determinants of southern limitation of the distribution.
Introduction
Global warming is expected to influence plant gas exchange characteristics, which in turn results in vegetation feedback to global climate (Stinziano et al., 2018). Temperature dependence of the CO2 assimilation rate, which is one of the most important components for the vegetation-climate feedback, changes within a species depending on growth conditions and varies among species (Berry and Björkman, 1980; Atkin and Tjoelker, 2003; Yamori et al., 2014). Such variations and the involved mechanisms are not yet fully understood, which remain one of major uncertainties in simulating future ecosystem functions and global climate.
It has been known that the optimal temperature that maximizes the photosynthetic rate (Topt) increases with growth temperature (GT) (Berry and Björkman, 1980). A meta-analysis by Yamori et al. (2014) showed that the slope of the relationship between Topt and GT is largely common across most of C3 species, but there were many exceptional cases showing no or negative correlation between Topt and GT (e.g., Dillaway and Kruger, 2010; Chi et al., 2013; Crous et al., 2013; Aspinwall et al., 2017). Not only Topt but also the sharpness (kurtosis) of temperature response parabola is often influenced by GT. Gunderson et al. (2010) found that the sharpness of the temperature dependence of photosynthesis increased with increasing GT, and the sensitivity of the sharpness to GT varied among 5 tree species. Variations in temperature responses of photosynthetic characteristics have also been found among warming experiments for field-grown plants; some studies have found that warmed plants have higher photosynthetic rates and higher Topt (Gunderson et al., 2000, 2010; Zhou et al., 2007; Niu et al., 2008; Sendall et al., 2015; Yamaguchi et al., 2016), whereas others did not find significant differences (Bronson and Gower, 2010; Chi et al., 2013). Warming effect on the sharpness of temperature dependence of photosynthesis also varied among species (Sendall et al., 2015).
The influence of warming on plant functions is not straightforward. In general, temperature dependence in many biological processes including photosynthesis is a non-linear, bell-shaped curve in which the rate is highest at intermediate temperature but lower at higher and lower temperatures. Therefore, warming responses are expected to vary between different temperature regimes even in the same species; warming may be beneficial in plants in cooler habitats, whereas further warming may be stressful in warmer habitats. In addition, a genetically functional differentiation often occurs among populations within a species. So far, several studies have demonstrated that GT response in temperature dependence of photosynthesis has genetic variations. Slatyer (1977) showed that Eucalyptus pausiflora originated from high altitude had a lower Topt than that from low altitude even when grown at the same temperature. Similarly, Robakowski et al. (2012) reported that Acer rubrum and Quercus rubra originated from high latitude (HL) ecotype had a lower Topt than those form low latitude (LL) ecotype. Ishikawa et al. (2007) found that HL ecotype of Plantago asiatica had a similar Topt but flatter temperature dependence of photosynthesis than LL ecotype.
Considering the above two factors, it is expected that warming responses may be different depending on the habitat temperature. However, there seems no study that conducted warming experiments on leaf photosynthetic traits of the same species grown at natural fields differing in habitat temperature. In our previous study, we performed a warming experiment for canopy leaves of Quercus serrata using open-top canopy chambers (OTCC) (Yamaguchi et al., 2016). We found that the optimal temperature of photosynthesis linearly increased with GT. This experiment was performed in a site near the northern limitation of Q. serrata (Figure S1; HL). In the present study, we conducted the same experiment in a southern site, which is close to the southern limitation of Q. serrata distribution (Figure S1; LL). The mean annual temperature is 3.6°C higher in LL than in HL. We performed gas exchange measurements in HL and LL sites at different seasons for 2 years and tested whether photosynthetic response to GT is the same between the two sites.
We addressed following questions. (i) Does temperature dependence of photosynthesis differ between high and low latitude plants? (ii) Does the warming response in temperature dependence of photosynthesis differ between high and low latitude plants? (iii) If different, what biochemical mechanisms are involved in the difference? According to the biochemical model of Farquhar et al. (1980), photosynthetic rate is limited either by ribulose 1,5-bisphosphate (RuBP) carboxylation or by RuBP regeneration, which have different temperature and carbon dioxide (CO2) dependence from each other. Thus, changes in the temperature dependence of photosynthesis are attributable to changes in (a) temperature dependence of the maximum rate of RuBP carboxylation (Vcmax), (b) temperature dependence of the maximum rate of electron transport (Jmax), which represents RuBP regeneration capacity, (c) the balance between Vcmax and Jmax and/or (d) CO2 concentration at the site of RuBP carboxylation (Ci) (Hikosaka et al., 2006).
Materials and Methods
Plant Material and Study Site
Quercus serrata Thunb. ex Murray is a widely distributed tree species throughout the cool and warm temperate zone of the Japan and the Korean Peninsula. (latitude range: 31°-43°; Figure S1). This species is known to have a genetic variation along latitude (Kitamura et al., 2017). Q. serrata communities are mostly secondary forests, but they also occur in natural habitats (Suzuki, 2001). The experiment was conducted at two sites: the Tomakomai Experimental Forest of Hokkaido University (42°40′ N, 141°36′ E, Elev. 60 m) and the Hiruzen Experimental Forest of Tottori University (35°17′ N, 133°35′ E, Elev. 700 m). Hereafter, these sites are referred to as high and low latitude sites (HL and LL), respectively. The mean annual temperature (1981-2010) in the nearest metrological station to HL and LL is 7.6 and 11.2°C and the annual precipitation is 1197.9 and 2011 mm, respectively. The natural vegetation at HL site is dominated by deciduous tree species such as Acer, Cercidiphyllum, Ostrya, Prunus, and Quercus species (Hiura, 2001). The vegetation at LL site is a monospecific stand of Q. settara that naturally developed after artificial burning.
Experimental Design
We used three mature trees of Q. serrata in each site. Mean diameter at breast height, tree height and age of the studied tree were 33.2 cm, 16.4 m, and ca. 60 years in HL and 29.4 cm, 20.2 m and 77 years in LL, respectively. The scaffold towers that had similar height as the studied trees were constructed surrounding them in each site. On the top branch of these trees (15–17 m and 19–21 m in HL and LL, respectively), open-top canopy chambers (OTCC) were installed (one OTCC per one tree) in October and November 2010 at HL and LL site, respectively; the side of a large branch was enclosed in a 1.8 × 1.8 × 1.8 m acryl box with transmittance of 95 and 93% at HL and LL site, respectively (Nakamura and Sano, 2015; Yamaguchi et al., 2016; Figure S2). The bottom of the OTCCs were covered with work platforms except for the doorway. We choose a control branch (outside of OTCC), which was at least 2 m apart from the OTCC, for each individual tree. The environment of the control branch was similar to that of the branch in the OTCC in each tree except that it was not surrounded by acrylic walls (see Yamaguchi et al., 2016). The canopy air temperatures inside and outside the OTCCs were monitored with temperature loggers (TidbiT v2 Temp logger UTBI-001, Onset Corp., Bourne, MA, USA). Leaf temperatures were measured with an infrared thermometer (Type 505, Konica Minolta, Tokyo, Japan) in the OTCCs and those in controls every hour during gas exchange measurements. We estimated daytime leaf temperature using meteorological data and measured leaf temperature by regression analysis. Transmittance spectrum of the acryl board used for OTCC, wind speed, air carbon dioxide concentration and water vapor deficit inside and outside of the OTCCs in HL are shown in Yamaguchi et al. (2016). Although we did not evaluate these environmental variables for OTCCs in LL, we regarded that the influences of OTCCs were similar between the two sites.
Gas Exchange Measurements
We performed gas exchange measurements for the fully expanded leaves that were exposed to direct sunlight in OTCCs and those on control branches of the same trees with LI-6400, using an LED light source (LI-6400-02B, LI-COR) and a dual Peltier device to regulate photosynthetic photon flux density (PPFD) and temperature in the chamber (3 × 2 cm). Measurements were made on different seasons for 2 years in each site; five times in each of 2011 and 2012 at HL (22–26 June, 18–21 July, 22–27 August, 19–25 September and 17–20 October 2011, and on 19–26 June, 21–27 July, 20–30 August, 20–28 September and 16–26 October 2012), and two times in 2012 and three times in 2013 at LL (29 June−10 July and 2–9 August 2012, and on 30 June−10 July, 26 August−6 September and 27 October−2 November 2013) (note that the measurements overlaps only in 2012, though we performed the measurements for 2 years in each site). Measurements were performed at various leaf temperatures (see Table S1 for the temperature range, which was different depending on the season) and three CO2 concentrations (200, 400, and 1,000 μmol CO2 mol−1) under a PPFD of 1,000 μmol m−2 s−1. We performed continuous measurements along the naturally increasing temperature gradient during the day. For each temperature and each CO2 concentration, four leaves per OTCC or control branch were used for the measurement (total 12 leaves per condition). Vapor pressure deficit was <1.8 kPa at 10–25°C and was <2.4 kPa at 30–35°C. Leaf respiration rate in the dark (Rdark) was determined at an ambient CO2 concentration (400 μmol CO2 mol−1). After the measurements, three leaf discs of 1 cm diameter were punched from each of the studied leaves, oven dried at 60°C for >72 h and analyzed with an NC analyzer (Vario EL-III, Elementar, Jena, Germany). Data of HL are identical to those shown in Yamaguchi et al. (2016).
Models
The optimal temperature that maximizes photosynthetic rate (Topt) was obtained by non-linear regression of a quadratic function (Säll and Pettersson, 1994) on the temperature response data:
where A(T) is the photosynthetic rate measured at leaf temperature T in Celsius, and Amax is the rate at Topt. The sharpness of the parabola is described by the parameter b. A smaller b describes a relatively flat curve, while a larger b describes a sharp curve.
We used the biochemical model of Farquhar et al. (1980). The RuBP carboxylation-limited rate of photosynthesis (Ac) is expressed as follows:
where Kc and Ko are the Michaelis–Menten constants of Rubisco (RuBP carboxylase/oxygenase) for CO2 and O2, respectively; Ci and O are the intercellular concentrations of CO2 and O2, respectively; Γ* is the CO2 compensation point in the absence of day respiration and Rd is the rate of day respiration. The RuBP-limited rate of photosynthesis (Ar) is expressed as follows:
The temperature dependence of the parameter values was fitted using the Arrhenius model:
where f (25) is the value of f at 25°C, Ea is the activation energy of f, R is the universal gas constant (8.314 J mol−1 K−1) and Tk is leaf temperature in Kelvin (Hikosaka et al., 2006). The temperature dependence of Ci was expressed as a linear function:
where a and c are regression coefficients.
Rate of day respiration was assumed to be 0.4 of Rdark (Villar et al., 1995). Values of Kc, Ko and Γ* were calculated using the Arrhenius mode (Equation 4) according to Harley and Tenhunen (1991) assuming that the mesophyll conductance was infinite; therefore, Vcmax and Jmax were calculated as apparent values. We obtained values of apparent Vcmax and Jmax at each leaf temperature with Equation (2) using Ac and Ci determined in 200 μmol CO2 mol−1 at the leaf temperature and with Equation (3) using Ar and Ci determined in 1,000 μmol CO2 mol−1 at the leaf temperature, respectively (i.e., “one-point method”). We found that the calculated Ac values at an ambient CO2 calculated from the Vcmax, which was estimated from the A value at 200 μmol CO2 mol−1, were strongly correlated with the values of A measured at the ambient CO2 and fell on the 1: 1 line (Yamaguchi et al., 2016), suggesting that the estimated Vcmax values were reliable. Although care should be taken whether the one-point method is valid across species and treatments, De Kauwe et al. (2016) showed that the one-point method successfully predicts Vcmax values using global dataset of A-Ci response (564 species from 46 field sites, covering a range of plant functional types), suggesting that this method prvides robust value of Vcmax in C3 plants irrespective of species and growth conditions.
Simulations were performed to assess the effect of variation in EaV on the temperature dependence of photosynthesis. We calculated Ac values with various EaV values and leaf temperatures keeping other variables constant obtained from the control leaves in August 2012 at LL. Then Equation (1) was fitted to the temperature dependence of Ac and the b value was obtained.
Statistical Analysis
All statistical analyses were performed with R 2.15.1 (R Development Core Team, 2012). Sample size of variables obtained at a single temperature (e.g., A at 20°C) was 240 (4 leaves × 2 treatments × 3 trees × 10 months) for HL and 120 (4 leaves × 2 treatments × 3 trees × 5 months) for LL. The temperature dependence of the parameters (activation energy of Vcmax, Jmax and dark respiration (EaV, EaJ, and EaR, respectively), c, Amax, b, and Topt) was fitted for pooled data from 3 trees in each month (i.e., the sample size was 20 and 10 for HL and LL, respectively) with linear (Equation 5) and nonlinear (Equations 1 and 4) mixed models with individual trees as a random effect using the lmer (package lme4) and nlme (package nlme) functions.
We performed analysis of deviance to test the effect of sites, months, OTCC experiment (treatment) and their interactions as a fixed effect, and individual trees as a random effect on the leaf characteristics determined at a single temperature. Analysis of variance (ANOVA) was used to test the effect on temperature-dependence parameters with ANOVA without replication (i.e., no random effect). Data of different years were pooled. Values were log-transformed when the distribution was deviated from the normal distribution.
To test the effect of site and warming on leaf characteristics (leaf mass per area, LMA; leaf nitrogen concentration per mass, Nmass; leaf nitrogen concentration per area, Narea), we applied multiple comparison tests (Tukey's test) using the glht function in the multicomp package. We incorporated the individual trees as a random factor.
We performed regression analyses to analyze the relationships between gas exchange characteristics (EaV, EaJ, EaR, c, Amax, b, and Topt) and GT. There was a tendency that the gas exchange parameters in HL site were linearly related to GT (Yamaguchi et al., 2016), but the relationships were not clear in LL. Therefore, first we applied linear regression analyses for HL. We calculated various types of GTs: daily mean, daytime mean (PPFD > 0 μmol m−2 s−1), midday mean (PPFD > 500 μmol m−2 s−1), night time mean (PPFD = 0 μmol m−2 s−1), daily maximum and daily minimum temperatures over 5 or 10 days prior to measurement. The best GT for each gas exchange parameter was selected based on the r2 value for the correlations (see Yamaguchi et al., 2016). We assumed that the same GT is the best predictor for respective parameter also in LL. Linear, polynomial and logistic equations were tested and the equation with the lowest Akaike information criterion (AIC) was selected for each parameter.
Results
Growth Temperature
Growth temperature was different between HL and LL; monthly average leaf temperature in 2012 tended to be higher in LL than in HL (Table 1). Leaf temperature increased from June to August, and decreased after August in both sites. The OTCC treatment successfully increased average air temperatures in both sites, and the increment tended to be greater in LL; on average from June to October in 2012, daytime temperature and daily maximum temperature were increased by 0.5 and 0.9°C in HL, and 0.7 and 1.7°C in LL, respectively. Average leaf temperatures were also higher in the OTCCs than in the control, and the increment tended to be greater in LL; daytime temperature and daily maximum temperature were increased by 1.0 and 1.6 in HL, and 1.3 and 2.5°C in LL, respectively (Figure S3).
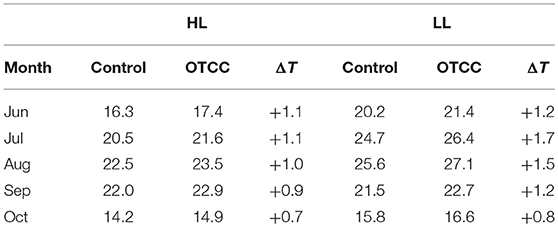
Table 1. Monthly average of daytime leaf temperature (°C; photosynthetic photon flux density > 0 μmol m−2 s−1) in control and open-top canopy chamber (OTCC) branches in high (HL) and low (LL) latitude site in 2012.
Effects of Latitude and Warming Treatment on Leaf Traits
LMA and Narea were not significantly different between the sites and there were significant effects of warming treatment and the site × treatment interaction; LMA and Narea did not respond to warming in HL, but significantly decreased in LL (Figures 1A,C; Table S2). Nmass was not different between sites and not affected by warming in both sites (Figure 1B; Table S2).
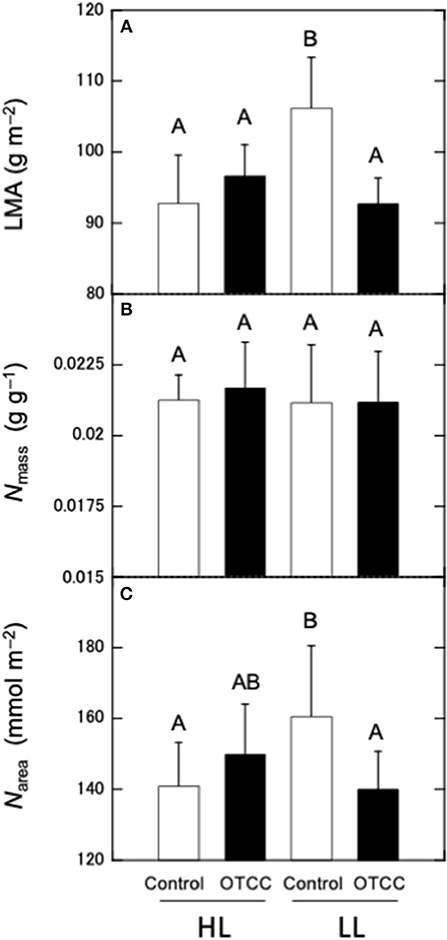
Figure 1. Effects of warming on (A) leaf mass per area (LMA), (B) nitrogen concentration per mass (Nmass), and (C) nitrogen concentration per area (Narea) in canopy leaves of Quercus serrata at high (HL) and low (LL) latitudinal sites. Measurements were made in August 2012. Leaves were exposed to either naturally changing temperature conditions (control; open boxes) or experimental warming with OTCC (open-top canopy chamber; closed boxes) (simple means ± standard deviation, n = 12). Different letters indicates significant differences at P < 0.05 by Tukey's test, where individual trees are incorporated as a random factor.
CO2 assimilation rates increased in early growing season and decreased in autumn (Table 2; Table S3). CO2 assimilation rate at 20°C (A20) was higher in LL than in HL (Table 2; Table S3). It was affected not by warming but by the site × warming interaction; warming had no clear influence on A20 in HL but tended to decrease A20 in LL (Table 2; Figure S2; Table S3). A25 in control leaves also tended to be higher in LL than in HL (Table 2; Table S3). It was significantly affected by warming, and the effect was different between the sites (Table 2); A25 increased with warming in HL, but decreased in LL (Figure 2; Table S3).
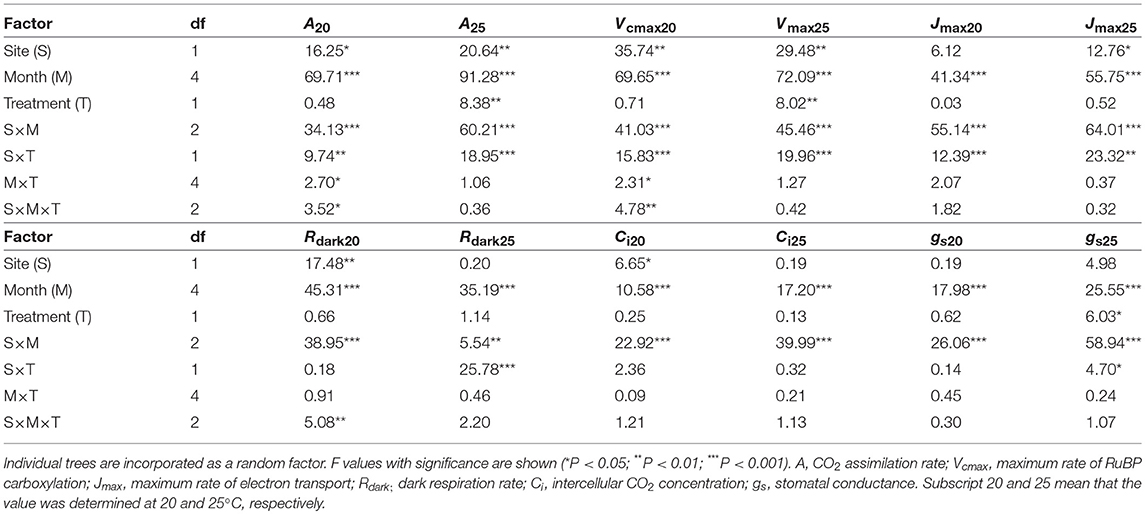
Table 2. Summary of three-way analysis of deviance for the effects of latitude, month, warming treatment and their interactions on leaf characteristics.
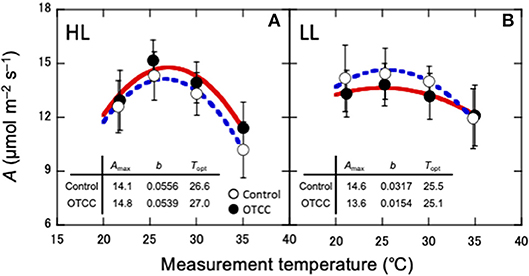
Figure 2. Temperature dependence of CO2 assimilation rate (A) in canopy leaves of Quercus serrata at high (A, HL) and low (B, LL) latitude sites. Measurements were made in August 2012. Leaves were exposed to either naturally changing temperature conditions (control; open circles with broken line) or experimental warming with open-top canopy chambers (OTCC; closed circles with solid line) (means ± standard deviation, n = 12). CO2 assimilation rate was fitted with Equation 1. Amax, CO2 assimilation rate at optimum temperature (μmolm−2s−1); b, spread of temperature response parabola, Topt, optimal temperature that maximizes photosynthetic rate (°C).
The optimal temperature (Topt) was not significantly different between the sites but increased by warming in both sites (Table 3; Table S4). The assimilation rate at the Topt (Amax) in control leaves was significantly higher in LL than in HL (Table 3; Table S4). Warming increased Amax in HL, but decreased in LL (Table 3; Table S4). The sharpness of temperature response of parabola (b) did not have clear response to site, month and warming treatment, except for a significant response to the site × month interaction (Table 3; Table S4).
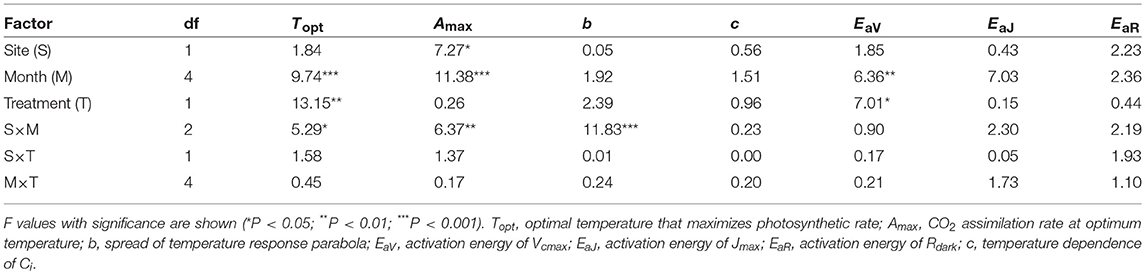
Table 3. Summary of three-way ANOVA without replication for the effects of latitude, month, warming treatment and their interactions on leaf characteristics.
The apparent maximum RuBP carboxylation rate at 20°C (Vcmax20) and that at 25°C (Vcmax25) were higher in LL than in HL (Table 2; Table S5). Vcmax20 was not affected by warming, whereas Vcmax25 was significantly affected. There was a significant effect of the site × treatment interaction on Vcmax; Vcmax25 was increased by warming in HL, but decreased in LL (Table 2; Table S5). The apparent maximum electron transport rates at 20°C (Jmax20) in control leaves did not differ between the sites, whereas Jmax25 was higher in LL than in HL (Table 2; Table S6). There was a significant effect of the site × treatment interaction on Jmax20 and Jmax25; warming had no clear effects on Jmax in HL, whereas it tended to decrease Jmax in LL (Table 2; Table S6). The dark respiration rate at 20°C (Rdark20) was higher in LL than in HL, whereas that at 25°C (Rdark25) was not significantly different between the sites (Table 2; Table S7). Warming treatment had no influence on Rdark20, whereas it slightly increased Rdark25 in HL but decreased in LL (Table 2; Table S7). The intercellular CO2 concentration at 20°C (Ci20) was lower in LL than in HL, whereas there was no clear difference in Ci25 between the sites (Table 2; Table S8). Ci was not affected by warming (Table 2; Table S8). Stomatal conductances were influenced by month and the interaction of site and month (Table 2; Table S9).
Apparent Vcmax, Jmax and Rdark increased exponentially with increasing temperature without obvious deactivation at higher temperatures, and the Arrhenius model fit well (Figures 3A–D). Ci values decreased linearly with increasing temperature (Figures 3E,F). The activation energy of apparent Vcmax (EaV), the slope of the curve, was not different between the sites and was significantly increased by warming treatment (Table 3; Figures 3A,B; Table S10). There were no clear effects of the site, month and warming treatment on the activation energy of apparent Jmax (EaJ) and the activation energy of Rdark (EaR) (Table 3; Figures 3C,D; Table S10). There was no significant effect of the site, month and warming treatment on the slope of Ci on growth temperature (c) (Table 3; Table S10).
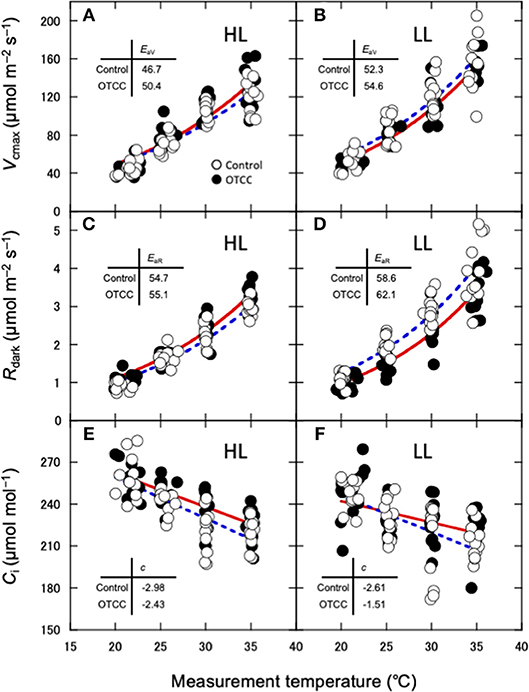
Figure 3. Temperature dependence of the apparent maximum carboxylation rate (Vcmax) (A,B), dark respiration rate (Rdark) (C,D) and interceller CO2 concentration (E,F) in canopy leaves of Quercus serrata at high (A,C,E; HL) and low (B,D,F; LL) latitude sites. Measurements were made in August 2012. Leaves were exposed to either naturally changing temperature conditions (control; open circles with broken line) or experimental warming with open-top chambers (OTCC; closed circles with solid line). EaV, activation energy of Vcmax (kJ mol−1); EaR, activation energy of Rdark (kJ mol−1); c, temperature dependence of Ci. a, c and e are redrawn from Yamaguchi et al. (2016) with modifications.
The Relationship Between Photosynthetic Traits and Growth Temperature
As shown in Yamaguchi et al. (2016), Topt was linearly correlated with leaf temperature in HL (Figure 4A). On the other hand, Topt in LL increased when GT was low, but did not change when GT was high (Figure 4B). Amax in HL also increased with GT, whereas Amax in LL did not increase at higher GT (Figures S4A). The sharpness of temperature response of parabola (b) was not significantly correlated with any GT in HL (Figure 4C). b in LL showed a parabolic curve against GT, where b value was low at low and high GTs (Figure 4D).
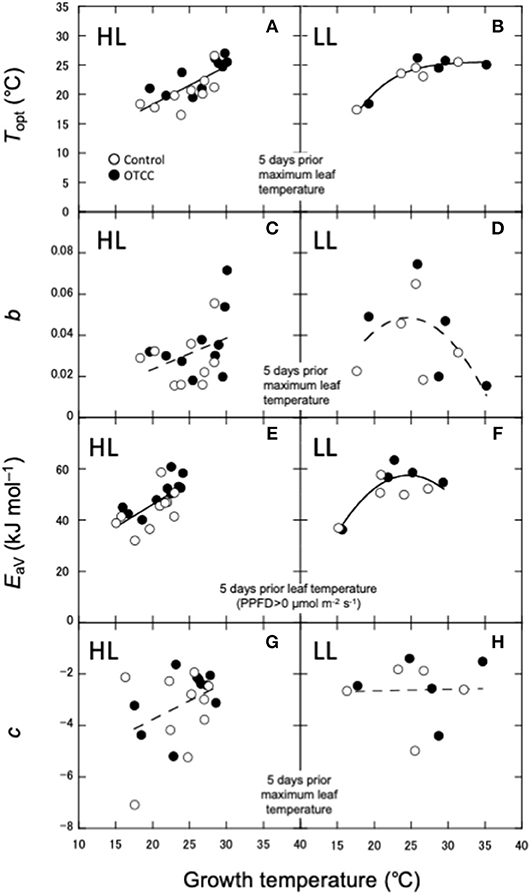
Figure 4. Relationships between photosynthetic characteristics and growth temperature (GT). (A,B) Optimal temperature that maximizes photosynthetic rate (Topt); (C,D) spread of temperature response parabola (b); (E,F) activation energy of apparent Vcmax (EaV); (G,H) temperature dependence of Ci (c). HL, high latitude; LL, low latitude. The best GT for each parameter is selected based on the r2 value for the correlations in HL (A,C,E,G). The same GT is used as a predictor for respective parameter in LL (B,D,F,H). For LL, Linear, polynomial and logistic equations are tested and the equation with the lowest AIC is selected. (A,E) are redrawn from Yamaguchi et al. (2016) with modifications.
EaV was linearly correlated with GT in HL (Figure 4E), whereas in LL, it increased with GT when GT was low, but not changed when GT was high (Figure 4F). EaJ was not significantly correlated with any GT in HL (Figure S4C), whereas it significantly decreased with increasing GT in LL (Figure S4D). Activation energy of Rdark was negatively correlated with daily minimum air temperature in HL (Figure S4E), whereas it was lowest in middle GT and higher at high and low GTs in LL (Figure S4F). c was also not significantly correlated with any GT in both HL and LL (Figures 4G,H).
Mechanisms Involved in the Variation in Temperature Dependence of Photosynthesis
We performed regression analysis to find a responsible mechanism for variations in the parameters of temperature dependence of photosynthesis. Topt was linearly correlated with EaV (Table 4; Figure 5B). As expected, Amax was strongly correlated with Vcmax and Jmax and the strongest correlation was found with Vcmax20 (Table 4; Figure 5A). The sharpness of temperature response of parabola (b) was weakly but significantly correlated with EaV (Table 4; Figure 5C).
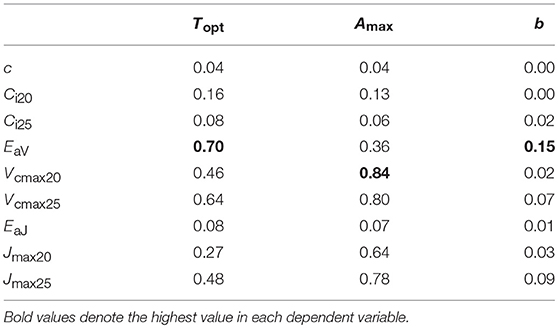
Table 4. Determination coefficient (r2) of regression for parameters of temperature dependence of photosynthesis on biochemical parameters.
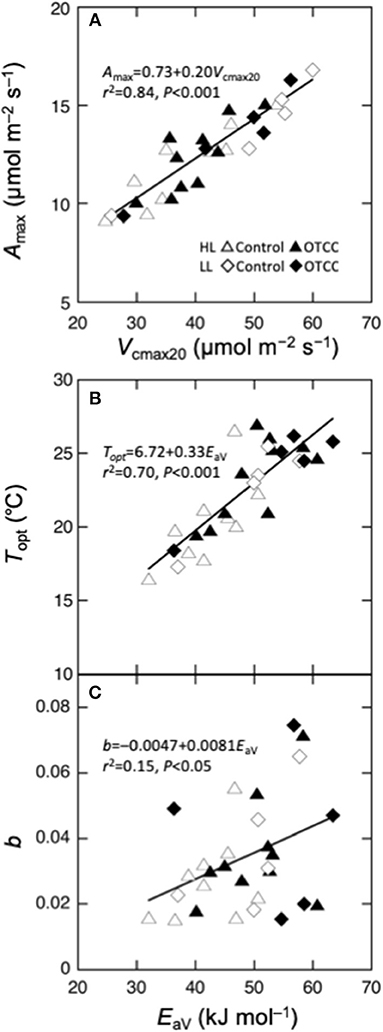
Figure 5. Parameters of temperature dependence of photosynthesis as a function of biochemical parameters. (A) Maximal photosynthetic rate (Amax) at the optimal temperature vs. the maximal carboxylation rate at 20°C (Vcmax20), (B) optimal temperature that maximizes photosynthetic rate (Topt) vs. activation energy of apparent Vcmax (EaV); (C) spread of temperature response parabola (b) vs. EaV. Curvilinear is the linear regression for all data points.
Discussion
We found that there were differences in leaf traits and their responses to growth temperature in canopy leaves of Q. serrata between the latitude sites. Photosynthetic rates in control leaves were higher in LL than in HL. An increase in growth temperature both by seasonal change and by warming treatment increased photosynthetic rates at higher leaf temperature in HL but slightly decreased in LL. These results indicate that the effect of an increased temperature on plant photosynthetic activity is not straightforward.
Higher photosynthetic rates in control leaves in LL than those in HL are partly attributable to larger investment of nitrogen in leaves. Although Nmass did not differ between the sites, LMA was greater in LL, leading to a higher Narea (Figure 1). As a large fraction of leaf N is allocated to Rubisco (Evans, 1989; Hikosaka, 2004), control leaves in LL might have a large amount of Rubisco per leaf area, leading to higher photosynthetic rates. Lowered photosynthetic rates by warming treatment in LL leaves are also explained by alteration in nitrogen investment; warmed leaves had lower LMA and Narea, leading to a decrease in rubisco content and Vcmax. On the other hand, increased photosynthetic rates by warming treatment in HL were not accompanied by an increase in LMA and Narea. Since A20 and Vcmax20 were not increased by warming treatment in HL, an increase in photosynthetic rates at higher temperature is attributable to changes in temperature dependence of photosynthesis rather than the amount of the photosynthetic apparatus. An increase in EaV (temperature dependence of Vcmax) is responsible for this increment.
One of the most interesting results in the present study is the difference in the GT dependence of Topt between the latitudes; Topt linearly increased with increasing GT in HL whereas it was saturating against GT in LL (Figures 4A,B). When the analysis of covariance (ANCOVA) was applied to the relationship between Topt and GT when the data was limited to the range of GT found in HL, there was no difference both in the slope and the intercept of the regression line between the two sites (P > 0.05), suggesting that the difference is not ascribed to the genetic difference between the ecotypes. This result thus suggests that Topt has an upper limit. Although positive correlation between Topt and GT has been observed commonly across many plant species (Yamori et al., 2014), there have been many exceptional observations showing no relation between Topt and GT (e.g., Dillaway and Kruger, 2010; Chi et al., 2013; Crous et al., 2013; Aspinwall et al., 2017). The present results suggest that such uncoupling of Topt and GT occurs even in a species of which Topt can respond to GT.
The decrease in leaf carbon and nitrogen investment at warming treatment and the saturation of Topt at higher GT found in LL leaves suggest that acclimation ability to high temperatures is limited in Q. serrata. Therefore, further warming in LL site may be relatively disadvantageous for photosynthetic activity in Q. serrata compared with species adapted to higher temperatures. In fact, our LL site was close to the southern limit of natural distribution of Q. serrata (Figure S1). Our study suggests that the ability of temperature acclimation of photosynthesis can be one of determinants of species distribution.
The Topt was strongly related with EaV (Figure 5B), suggesting that EaV was the most responsible factor for the variation in Topt. This is consistent with the simulation of the biochemical model of photosynthesis (Hikosaka et al., 2006; Figure S5). Similarly to Topt, EaV had a saturating dependence on GT (Figures 4E,F). Although previous studies have shown that the relationship between EaV and GT is commonly positive across various C3 species (Hikosaka et al., 2006, 2007; Kumarathunge et al., 2019), the present study suggests that the changes in EaV also have an upper limit in temperature acclimation.
Several studies have indicated that the sharpness (kurtosis) of temperature response curve of photosynthesis differs depending on growth condition or on species (Gunderson et al., 2010; Sendall et al., 2015). We also observed variation in the sharpness (b) among leaves, though we could not find the environmental cue that brings about such variation. Underlying mechanisms involved in the variation in the sharpness have been discussed in relation to Rubisco activation state, which often decreases at higher temperature in some species (Salvucci and Crafts-Brandner, 2004; Yamori et al., 2006). However, in the present study, Vcmax exponentially increased with increasing leaf temperature without apparent inactivation at high temperatures, implying that Rubisco activation state might not be the major cause. We found that the sharpness was weakly but significantly related to EaV. In Figure S5, we performed a simple simulation where EaV was variable with other parameters constant. An increase in EaV sharpens the temperature dependence curve when the EaV value is lower than 50 kJ mol−1 (Figure S5B). Therefore, the part of the variation in b can be explained in the changes in EaV. However, the most of the variation in b cannot be explained by EaV, suggesting that other factors might be responsible. Unfortunately, we could not find significant effect of other biochemical variables in single (Table 4) and multiple regression analyses (data not shown). The sharpness of the curve may be influenced by complicated changes in biochemical variables.
Phenotypic difference is caused by environmental and/or genetic differences. In our study, phenotypic differences are considered to be caused by environmental factors other than temperature, because warming treatment had an opposite influence on leaf traits to the latitudinal influence as mentioned above. Net radiation and humidity are known to vary along latitude, which might affect leaf traits and resource allocation (Nabeshima et al., 2018). Genetic variation is also likely, because Q. serrata is known to have a genetic differentiation along latitude (Kitamura et al., 2017). However, it is difficult to distinguish genetic and environmental contribution to the phenotypic variation in the field. Further study using common-garden and/or transfer experiment is needed to elucidate it.
We applied warming treatment not to the whole tree but only to a branch. In general, leaf traits are plastically acclimated to their respective environment (e.g., Hikosaka et al., 1994; Hikosaka, 1996), but they may be affected by conditions experienced by other leaves (e.g., Hikosaka et al., 2010; Yoshimura, 2010). Therefore, there is a possibility that the results are not the same when the whole plant is warmed. However, in our study, such effects might be negligible because temperature difference between the control and OTCC was small relative to ambient temperature gradients within forest canopies.
In summary, our results strongly suggest that there is an upper limit in temperature acclimation of photosynthesis. Consequently, warming treatment has different influences on photosynthesis between latitudinal sites; warming increased assimilation rates at high temperatures in HL but decreased in LL. Such a within-species variation in temperature response is not necessarily consistent with recent review articles discussing that temperature acclimation in photosynthesis is largely common among C3 species (Hikosaka et al., 2006; Kattge and Knorr, 2007; Yamori et al., 2014; Kumarathunge et al., 2019), suggesting that our understanding of photosynthetic acclimation is still limited. As photosynthetic gas exchange is one of important drivers of carbon cycle and global warming, accurate knowledge on temperature response of photosynthesis is indispensable for forecasting of global climate. Further studies are necessary to reduce uncertainties on temperature responses in photosynthesis.
Author Contributions
DY and KH planned the experiments. TH, TN, and JS established the OTCC. DY performed the experiments. TH, TN, JS, DM, and KN helped the experiments. DY analyzed the data. DY and KH wrote the paper with comments from other authors.
Funding
This study was supported in part by KAKENHI (Nos. 17H03727, 21248017, 25660113, 25291095, 25440230).
Conflict of Interest Statement
The authors declare that the research was conducted in the absence of any commercial or financial relationships that could be construed as a potential conflict of interest.
Acknowledgments
We thank staffs of Hiruzen Forest, Tottori University and Tomakomai Experimental Forest, Hokkaido University.
Supplementary Material
The Supplementary Material for this article can be found online at: https://www.frontiersin.org/articles/10.3389/ffgc.2019.00019/full#supplementary-material
References
Aspinwall, M. J., Vårhammar, A., Blackman, C. J., Tjoelker, M. G., Ahrens, C., Byrne, M., et al. (2017). Adaptation and acclimation both influence photosynthetic and respiratory temperature response in Corymbia calophylla. Tree Physiol. 37,1095–1112. doi: 10.1093/treephys/tpx047
Atkin, O. K., and Tjoelker, M. G. (2003). Thermal acclimation and the dynamic response of plant respiration to temperature. Trends Plant Sci. 8, 343–351. doi: 10.1016/S1360-1385(03)00136-5
Berry, J., and Björkman, O. (1980). Photosynthetic response and adaptation to temperature in higher plants. Annu. Rev. Plant Physiol. 31, 491–543. doi: 10.1146/annurev.pp.31.060180.002423
Bronson, D. R., and Gower, S. T. (2010). Ecosystem warming does not affect photosynthesis or aboveground autotrophic respiration for boreal black spruce. Tree Physiol. 30, 441–449. doi: 10.1093/treephys/tpq001
Chi, Y., Xu, M., Shen, R., Yang, Q., Huang, B., and Wan, S. (2013). Acclimation of foliar respiration and photosynthesis in response to experimental warming in a temperate steppe in northern China. PLoS ONE 8:e56482. doi: 10.1371/journal.pone.0056482
Crous, K. Y., Quentin, A. G., Lin, Y. S., Medlyn, B. E., Williams, D. G., Barton, C. V. M., et al. (2013). Photosynthesis of temperate Eucalyptus globulus trees outside their native range has limited adjustment to elevated CO2 and climate warming. Glob. Chang. Biol. 19, 3790–3807. doi: 10.1111/gcb.12314
De Kauwe, M. G., Lin, Y. S., Wright, I. J., Medlyn, B. E., Crous, K. Y., Ellsworth, D. S., et al. (2016). A test of the ‘one-point method' for estimating maximum carboxylation capacity from field-measured, light-saturated photosynthesis. New Phytol. 210, 1130–1144. doi: 10.1111/nph.13815
Dillaway, D. N., and Kruger, E. L. (2010). Thermal acclimation of photosynthesis: a comparison of boreal and temperate tree species along a latitudinal transect. Plant Cell Environ. 33, 888–899. doi: 10.1111/j.1365-3040.2010.02114.x
Evans, J. R. (1989). Photosynthesis and nitrogen relationships in leaves of C3 plants. Oecologia 78, 9–19. doi: 10.1007/BF00377192
Farquhar, G. D., von Caemmerer, S., and Berry, J. A. (1980). A biochemical model of photosynthetic CO2 assimilation in leaves of C3 species. Planta 149, 78–90. doi: 10.1007/BF00386231
Gunderson, C. A., Norby, R. J., and Wullschleger, S. D. (2000). Acclimation of photosynthesis and respiration to simulated climatic warming inn northern and southern populations of Acer saccharum: laboratory and field evidence. Tree Physiol. 20, 87–96. doi: 10.1093/treephys/20.2.87
Gunderson, C. A., O'Hara, K. H., Campion, C. M., Walker, A. V., and Edwards, N. T. (2010). Thermal plasticity of photosynthesis: the role of acclimation in forest responses to a warming climate. Glob. Chang. Biol. 16, 2272–2286. doi: 10.1111/j.1365-2486.2009.02090.x
Harley, P. C., and Tenhunen, J. D. (1991). “Modeling the photosynthetic response of C3 leaves to environmental factors,” in Modeling Crop Photosynthesis-From Biochemistry to Canopy, eds K. J. Boote and R. S. Loomis (Madison, WI: CSSA), 17–40.
Hikosaka, K. (1996). Effects of leaf age, nitrogen nutrition and photon flux density on the organization of the photosynthetic apparatus in leaves of a vine (Ipomoea tricolor Cav.) grown horizontally to avoid mutual shading of leaves. Planta 198, 144–150. doi: 10.1007/BF00197597
Hikosaka, K. (2004). Interspecific difference in the photosynthesis-nitrogen relationship: patterns, physiological causes, and ecological importance J. Plant Res. 117, 481–494. doi: 10.1007/s10265-004-0174-2
Hikosaka, K., Ishikawa, K., Borjigidai, A., Muller, O., and Onoda, Y. (2006). Temperature acclimation of photosynthesis: mechanisms involved in the changes in temperature dependence of photosynthetic rate. J. Exp. Bot. 57, 291–302. doi: 10.1093/jxb/erj049
Hikosaka, K., Kawauchi, Y., and Kurosawa, T. (2010). Why does Viola hondoensis (Violaceae) shed its winter leaves in spring? Amer. J. Bot. 97, 1944–1950. doi: 10.3732/ajb.1000045
Hikosaka, K., Nabeshima, E., and Hiura, T. (2007). Seasonal changes in temperature response of photosynthesis in canopy leaves of Quercus crispula in a cool-temperate forest. Tree Physiol. 27, 1035–1041. doi: 10.1093/treephys/27.7.1035
Hikosaka, K., Terashima, I., and Katoh, S. (1994). Effects of leaf age, nitrogen nutrition and photon flux density on the distribution of nitrogen among leaves of a vine (Ipomoea tricolor Cav.) grown horizontally to avoid mutual shading of leaves. Oecologia 97, 451–457. doi: 10.1007/BF00325881
Hiura, T. (2001). Stochasticity of species assemblage of canopy trees and understory plants in a temperate secondary forest created by major disturbances. Ecol Res. 16, 887–893. doi: 10.1046/j.1440-1703.2001.00449.x
Ishikawa, K., Onoda, Y., and Hikosaka, K. (2007). Intraspecific variation in temperature dependence of gas exchange characteristics of Plantago asiatica ecotypes from different temperature regimes. New Phytol. 176, 356–364. doi: 10.1111/j.1469-8137.2007.02186.x
Kattge, J., and Knorr, W. (2007). Temperature acclimation in a biochemical model of photosynthesis: a reanalysis of data from 36 species. Plant Cell Environ. 30, 1176–1190. doi: 10.1111/j.1365-3040.2007.01690.x
Kitamura, K., Namikawa, K., Kawahara, T., Matsumoto, A., and Jose-Maldia, L. S. (2017). Genetic structure of remnant Quercus serrata populations at the northernmost limit of their distribution in Japan. Acta Phytotax. Geobot. 68, 1–15. doi: 10.18942/apg.201617
Kumarathunge, D. P., Medlyn, B. E., Drake, J. E., Tjoelker, M. G., Aspinwall, M. J., Battaglia, M. B., et al. (2019). Acclimation and adaptation components of the temperature dependence of plant photosynthesis at the global scale. New Phytol. 222, 768–784. doi: 10.1111/nph.15668
Nabeshima, E., Nakatsuka, T., Kagawa, A., Hiura, T., and Funada, R. (2018). Seasonal changes of δD and δ18O in tree-ring cellulose of Quercus crispula suggest a change in post-photosynthetic processes during earlywood growth. Tree Physiol. 38, 1829–1840. doi: 10.1093/treephys/tpy068
Nakamura, K., and Sano, J. (2015). Effect of the warming experiment using open chambers on the production of the konara oak (Quercus serrata). Jpn. J. Ecol. 65, 227–240. doi: 10.18960/seitai.63.1_1
Niu, S., Li, Z., Xia, J., Han, Y., Wu, M., and Wan, S. (2008). Climatic warming changes plant photosynthesis and its temperature dependence in a temperate steppe of northern China. Environ. Exp. Bot. 63, 91–101. doi: 10.1016/j.envexpbot.2007.10.016
R Development Core Team (2012). R: A Language and Environment for Statistical Computing. Vienna: R Foundation for Statistical Computing.
Robakowski, P., Li, Y., and Reich, P. B. (2012). Local ecotypic and species range-related adaptation influence photosynthetic temperature optima in deciduous broadleaved trees. Plant Ecol. 213, 113–125. doi: 10.1007/s11258-011-0011-3
Säll, T., and Pettersson, P. (1994). A model of photosynthetic acclimation as a special case of reaction norms. J. Theor. Biol. 166, 1–8. doi: 10.1006/jtbi.1994.1001
Salvucci, M. E., and Crafts-Brandner, S. J. (2004). Relationship between the heat tolerance of photosynthesis and the thermal stability of rubisco activase in plants from contrasting thermal environments. Plant Physiol. 134, 1460–1470. doi: 10.1104/pp.103.038323
Sendall, K. M., Reich, P. B., Zhao, C., Jihua, H., Wei, X. O., Stefanski, A., et al. (2015). Acclimation of photosynthetic temperature optima of temperate and boreal tree species in response to experimental forest warming. Glob. Chang. Biol. 21, 1342–1357. doi: 10.1111/gcb.12781
Slatyer, R. O. (1977). Altitudinal variation in the photosynthetic characteristics of snow gum, Eucalyptus pauciflora sieb. ex spreng. III. Temperature response of material grown in contrasting thermal environments. Aust. J. Plant Physiol. 4, 301–312. doi: 10.1071/PP9770301
Stinziano, J. R., Way, D. A., and Bauerle, W. L. (2018). Improving models of photosynthetic thermal acclimation: which parameters are most important and how many should be modified? Grob. Change. Biol. 24, 1580–1598. doi: 10.1111/gcb.13924
Suzuki, S. (2001). A phytosociological classification system of Quercus serrata forests in Japan. Veg. Sci. 18, 61–74. doi: 10.15031/vegsci.18.61
Villar, R., Held, A. A., and Merino, J. (1995). Dark leaf respiration in light and darkness of an evergreen and a deciduous plant species. Plant Physiol. 105, 167–172. doi: 10.1104/pp.105.1.167
Yamaguchi, D. P., Nakaji, T., Hiura, T., and Hikosaka, K. (2016). Effects of seasonal change and experimental warming on the temperature dependence of photosynthesis in the canopy leaves of Quercus serrata. Tree Physiol. 36, 1283–1295. doi: 10.1093/treephys/tpw021
Yamori, W., Hikosaka, K., and Way, D. A. (2014). Temperature response of photosynthesis in C3, C4, and CAM plants: temperature acclimation and temperature adaptation. Photosynth. Res. 119, 101–117. doi: 10.1007/s11120-013-9874-6
Yamori, W., Suzuki, K., Noguchi, K., Nakai, M., and Terashima, I. (2006). Effects of Rubisco kinetics and Rubisco activation state on the temperature dependence of the photosynthetic rate in spinach leaves from contrasting growth temperatures. Plant Cell. Environ. 29, 1659–1670. doi: 10.1111/j.1365-3040.2006.01550.x
Yoshimura, K. (2010). Irradiance heterogeneity within crown affects photosynthetic capacity and nitrogen distribution of leaves in Cedrela sinensis. Plant Cell Environ. 33, 750–758. doi: 10.1111/j.1365-3040.2009.02100.x
Keywords: activation energy of carboxylation, open top chamber, optimal temperature of photosynthesis, photosynthetic acclimation, species distribution, temperature dependence of photosynthesis, warming experiment
Citation: Yamaguchi DP, Mishima D, Nakamura K, Sano J, Nakaji T, Hiura T and Hikosaka K (2019) Limitation in the Photosynthetic Acclimation to High Temperature in Canopy Leaves of Quercus serrata. Front. For. Glob. Change 2:19. doi: 10.3389/ffgc.2019.00019
Received: 04 November 2018; Accepted: 24 April 2019;
Published: 14 May 2019.
Edited by:
Martijn Slot, Smithsonian Tropical Research Institute (SI), PanamaReviewed by:
Josef Urban, Mendel University in Brno, CzechiaUrsula M. Ruiz Vera, University of Illinois at Urbana-Champaign, United States
Copyright © 2019 Yamaguchi, Mishima, Nakamura, Sano, Nakaji, Hiura and Hikosaka. This is an open-access article distributed under the terms of the Creative Commons Attribution License (CC BY). The use, distribution or reproduction in other forums is permitted, provided the original author(s) and the copyright owner(s) are credited and that the original publication in this journal is cited, in accordance with accepted academic practice. No use, distribution or reproduction is permitted which does not comply with these terms.
*Correspondence: Kouki Hikosaka, aGlrb3Nha2FAbS50b2hva3UuYWMuanA=