 Jessica C. A. Baker
 Dominick V. Spracklen
- School of Earth and Environment, Institute for Climate and Atmospheric Science, University of Leeds, Leeds, United Kingdom
Tropical forests have an important regulating influence on local and regional climate, through modulating the exchange of moisture and energy between the land and the atmosphere. Deforestation disrupts this exchange, though the climatic consequences of progressive, patch-scale deforestation of formerly intact forested landscapes have not previously been assessed. Remote sensing datasets of land surface and atmospheric variables were used to compare the climate responses of Amazon forests that lost their intact status between 2000 and 2013. Clear gradients in environmental change with increasing disturbance were observed. Leaf area index (LAI) showed progressively stronger reductions as forest loss increased, with evapotranspiration (ET) showing a comparative decline. These changes in LAI and ET were related to changes in temperature (T), with increased warming as deforestation increased. Severe deforestation of intact Amazon forest, defined as areas where canopy cover was reduced below 70%, was shown to have increased daytime land surface T by 0.44°C over the study period. Differences between intact and disturbed forests were most pronounced during the dry season, with severely deforested areas warming as much as 1.5°C. Maintenance of canopy cover was identified as an important factor in minimizing the impacts of disturbance. Overall, the results highlight the climate benefits provided by intact tropical forests, providing further evidence that protecting intact forests is of utmost importance.
Introduction
Tropical rainforests moderate the flux of energy and water between the land and the atmosphere, and affect atmospheric chemistry through the exchange of trace gases (Silva Dias et al., 2002). Tall rainforest trees provide a physical connection between deep soil layers and heights up to 40 m above the Earth's surface (Simard et al., 2011). In the Amazon, tropical forest has an important and complex role governing local and regional climate (see Marengo et al., 2018 and references therein). At the local scale, evaporating moisture affects the partitioning of radiation between sensible and latent heat (the Bowen ratio), leading to a cooling and moistening of the boundary layer (Da Rocha et al., 2004; Bonan, 2008). At larger spatial scales, the “cascade” of water vapor propagating across the basin drives regional rainfall and provides a buffer against the damaging effects of drought, with forests in the southern Amazon a particularly important source of re-evaporated water for sustaining forest biomes further downwind (Zemp et al., 2014; Staal et al., 2018).
Almost 1 million km2 of Amazon forest has already been deforested, representing nearly a fifth of its original extent (Davidson et al., 2012; Nobre et al., 2016). Most of the deforestation has occurred along the southern margins of the basin, in the so-called “arc of deforestation” (Malhi et al., 2008). The implementation of a satellite monitoring program in Brazil [Projeto de Monitoramento do Desmatamento na Amazônia Legal por Satélite (PRODES)], saw a marked reduction in annual deforestation rates over the Brazilian legal Amazon from 2004 to 2012, since which time the clearance rate has remained comparatively stable, though evidence suggests that it has begun to rise again in recent years (INPE, 2019). However, a new study has shown that PRODES, which only considers primary forest removal and excludes small-scale (<6.25 ha) patches from its definition of deforestation, may have been underestimating recent deforestation by as much as a factor of two. Kalamandeen et al. (2018) showed that small-scale forest loss accounted for approximately 40% of deforestation across the entire Amazon from 2001 to 2014, and had a strong positive trend over this period. This rise in low-density forest loss just as large-scale forest clearance events appeared to be coming under control, illustrates the growing threat of small-scale deforestation to Amazon ecosystems.
In addition to perturbing the global carbon balance (Pan et al., 2011; Baccini et al., 2012), removal of tropical forest has consequences for local and regional climate, and can even drive temperature and precipitation changes outside of the tropics (see D'almeida et al., 2007; Davidson et al., 2012; Lawrence and Vandecar, 2014). Much understanding has come from experiments with regional or general circulation models, with simulations revealing the climate consequences of forest clearance in the model world (D'almeida et al., 2007; Sampaio et al., 2007; Costa and Pires, 2010; Medvigy et al., 2011, 2013; Swann et al., 2015). A meta-analysis of 44 modeling studies found a negative linear relationship between Amazon deforestation extent and basin-wide rainfall (Spracklen et al., 2015), though many of the studies analyzed had highly idealized deforestation scenarios, such as 100% forest removal. Trajectory-based analyses have also shown that deforestation is likely to exacerbate the effects of droughts in the Amazon, through a reduction in atmospheric moisture transport from deforested areas to regions downwind (Spracklen et al., 2012; Bagley et al., 2014).
Site-level studies have provided valuable data on the impacts of Amazon forest clearance on the local microclimate. Net surface radiation is lower over cleared areas, due to a combination of higher albedo, and greater outgoing longwave radiation compared with forests (Bastable et al., 1993; Gash and Nobre, 1997). However, despite a lower energy balance, station data show deforested sites may be up to 2°C warmer than adjacent forested areas, and show higher diurnal and seasonal temperature variability (Von Randow et al., 2004; Dubreuil et al., 2012). This is due to differences in evapotranspiration (ET): eddy covariance flux tower measurements from pasture and forest sites in the southern Amazon revealed lower ET and higher sensible heating over the pasture site throughout the year (Von Randow et al., 2004). Differences were greatest during the dry season (June–August) as forests were able to access and transpire deep groundwater, unlike short-rooted pasture vegetation.
Remote sensing techniques have made it possible to analyse the environmental impacts of deforestation over larger spatial scales. Studies using satellite ET observations to evaluate the effects of deforestation in the Brazilian Cerrado (Spera et al., 2016), and the Brazilian Amazon (Lathuillière et al., 2012; Silvério et al., 2015), all found strong hydrological responses to land cover change. High ET fluxes over continuous forest in the Xingu Indigenous Park of southern Amazonia resulted in it being 1.9°C cooler than the surrounding patchwork agricultural landscape (Silvério et al., 2015). At the pantropical scale, Alkama and Cescatti (2016) used satellite temperature retrievals to show that, in line with ground-based measurements, diurnal temperature variability increased by approximately 2°C following clearance of tropical forest. The authors also showed land surface temperature to be more sensitive to forest cover loss than air temperature, which showed approximately two thirds of the sensitivity. Impacts on rainfall may depend on the scale of deforestation. Some remote sensing studies have observed increased rainfall over patches of forest loss (Negri et al., 2004; Chagnon and Bras, 2005; Funatsu et al., 2012), particularly within a few kilometers of forest edges (Knox et al., 2010), though larger-scale deforestation reduces moisture recycling and thus has a negative effect on rainfall (see Spracklen et al., 2018 and references therein).
Over the past decade, researchers and conservationists have used satellite data to map intact forests across the globe (Potapov et al., 2008, 2017). Intact forests were defined as forests with no remotely-detectable signs of anthropogenic disturbance, with forests assumed to be intact unless evidence to the contrary was found. One caveat of this approach is that selective logging and small-scale disturbances, which are difficult to observe remotely, could be overlooked, causing a possible overestimation of “intact” status (Potapov et al., 2008). In a recent review, Watson et al. (2018) summarized the myriad benefits and services that intact forest ecosystems provide, including regulating weather on local and regional scales, mitigating climate change, contributing to the conservation of biodiversity, improving air quality, and helping to preserve indigenous cultures. In the tropics, only 20% of all forested areas are classified as intact, a fraction that is diminishing as humans continue to encroach further into pristine ecosystems (Potapov et al., 2017). Protected areas can help prevent deforestation in the Amazon (Soares-Filho et al., 2010; Spracklen et al., 2015), but face a variety of legal threats (Nogueira et al., 2018). Together with the rise in small-scale disturbances in the region documented by Kalamandeen et al. (2018), this shows that there is a growing need to evaluate the climate impacts of deforesting intact forests in the Amazon.
This study seeks to quantify the climatic value of intact tropical forests in the Amazon, and evaluate the biophysical changes that occur during progressive, patch-scale deforestation of larger forested landscapes. Forest change datasets were used in conjunction with remote sensing observations of the land surface and the atmosphere to identify local environmental changes over areas that were differentially impacted by anthropogenic disturbance between 2000 and 2013.
Materials and Methods
Classification of Forest Disturbance Categories
To evaluate the biophysical consequences of deforesting intact Amazon forest between 2001 and 2013, forest pixels were classified into four categories that were designed to represent increasing levels of anthropogenic disturbance. This approach utilized two global forest datasets: the Intact Forest Landscapes (IFL) product, which maps forests that have no remotely-detectable signs of human impact (Potapov et al., 2017), and the Global Forest Change (GFC) version 1.6 product, which records forest cover change over time (Hansen et al., 2013). The IFL shapefiles for 2000 and 2013 were used in this study (IFL_2000 and IFL_2013), along with the following GFC layers: tree canopy cover for year 2000 (treecover2000) and year of forest cover loss (loss year).
The 2000 and 2013 IFL shapefiles were rasterised to 0.05° spatial resolution in order to match the grids of the climate data used in the analysis. This was performed using the Geospatial Data Abstraction software Library Python package (GDAL/OGR contributors, 2018). Pixels were classified as “intact” if the center of the pixel fell within the IFL polygon and non-intact if the pixel center fell outside the polygon. Pixels that were classified as intact but had tree cover changes >5% were excluded from the analysis (<2% of IF pixels), as it is likely these were misclassified as a result of the rasterization process.
The GFC datasets were first used at their original resolution (approximately 30 × 30 m at the Equator) to calculate a tree cover dataset for the year 2013 (treecover2013). For this, the treeCover2000 dataset was masked to remove pixels where deforestation had occurred up to and including the year 2013 (determined using the loss year dataset). The GFC data layers treecover2000 and treecover2013 were then resampled to 0.05° by finding the mean tree cover across all 30 m-resolution pixels within each 0.05° grid cell.
Next, the GFC datasets were used to derive forest masks for use in the classification procedure. A 70% tree-cover threshold was chosen to distinguish between land areas classified as forest and non-forest. The treecover2000 and treecover2013 datasets (each at 0.05°) were then used to create forest masks for 2000 and 2013 by selecting all pixels where tree cover exceeded 70% in those years (forestcover2000 and forestcover2013). Our results were found to be robust across a gradient of other canopy cover thresholds (Figure S1).
Amazon forest pixels were divided into four categories representing a gradient in the extent of disturbance that occurred between 2000 and 2013 (Table 1). The analysis was constrained to the Amazon evergreen broadleaf forest biome, as defined by the Collection 5 (C5) Moderate Resolution Imaging Spectroradiometer (MODIS) land cover classification product (MCD12C1) for the year 2001 (Friedl et al., 2010). Boolean logic was applied to identify pixels in each category. First, intact forest (IF) pixels were identified using the 2013 IFL dataset. IF pixels represent undisturbed or pristine forests that did not experience any remotely-detectable disturbance over the period analyzed and were thus considered the control group. The other three categories represent the “disturbance categories,” and include forests that have lost their intact status, either prior to, or over the course of, the analysis period. The non-intact forest (NIF) category contained pixels that were not classified as intact in 2000, but had >70% tree canopy cover in 2000 and were still forests (>70% tree cover) in 2013. The third and fourth categories were forests that lost their intact status between 2000 and 2013. If tree cover was ≥70% in 2013 then pixels were classified as having experienced “moderate,” patch-scale deforestation, while pixels where tree cover fell below the 70% threshold were categorized as having experienced “severe” deforestation. For pixels in both of these categories, landscapes of intact forest with high canopy cover in 2000 were transformed to a patchwork of forested and deforested areas by 2013, with categories differing only in the size and extent of the deforested patches.
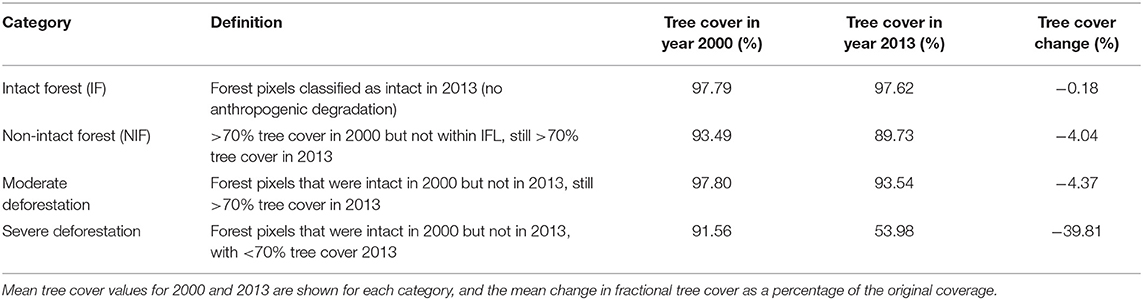
Table 1. Forest disturbance categories used in this study.
The spatial distributions of intact forest, non-intact forest, and previously intact forest areas that experienced either “moderate” or “severe” deforestation between 2000 and 2013, are shown in Figure 1A. Non-intact forests are fairly widely distributed across the Amazon, but tend to follow the contours of rivers and other water courses. This is related to the IFL mapping approach, which excludes forests within 1 km of navigable rivers, as these are more accessible to humans and thus more likely to have experienced disturbance than inaccessible inland forests (Potapov et al., 2017). Most of the forests that lost their intact status over the analysis period (orange and magenta areas in Figure 1) are in the southern Amazon, with a few patches of moderate deforestation over the Guiana Shield in the northeast. Deforestation primarily occurred along the margins of non-intact forest areas, indicating an expansion of human-impacted forest landscapes along disturbance frontiers.
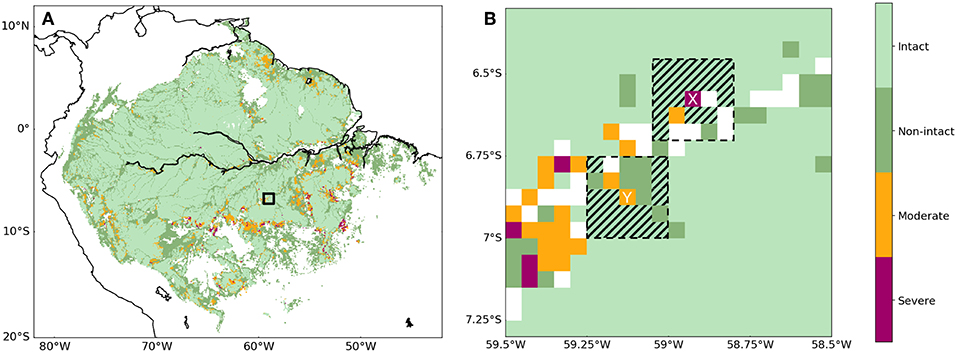
Figure 1. (A) Map showing the distribution of intact forest (pale green), non-intact forest (sage green), moderately deforested (orange), and severely deforested (magenta) pixels across the Amazon evergreen broadleaf forest biome at 0.05° × 0.05° resolution. The black box indicates the region shown in (B). (B) Illustration of the moving-window analysis used in this study. Each pixel in each disturbance category (non-intact, moderate, and severe) was placed at the center of a 5 × 5-pixel grid box. For the biophysical variable of interest, change over the central pixel (e.g., the “severe deforestation” pixel marked “X,” or the “moderate deforestation” pixel marked “Y”), was compared with the mean change over surrounding intact forest (hatched pixels).
Remote Sensing Datasets
The environmental impact of intact forest disturbance was assessed using remote sensing datasets of the land surface and the atmosphere (Table 2). Leaf area index (LAI), evapotranspiration (ET), land surface temperature (T) and precipitation (P) datasets were analyzed over the period 2001–2013.
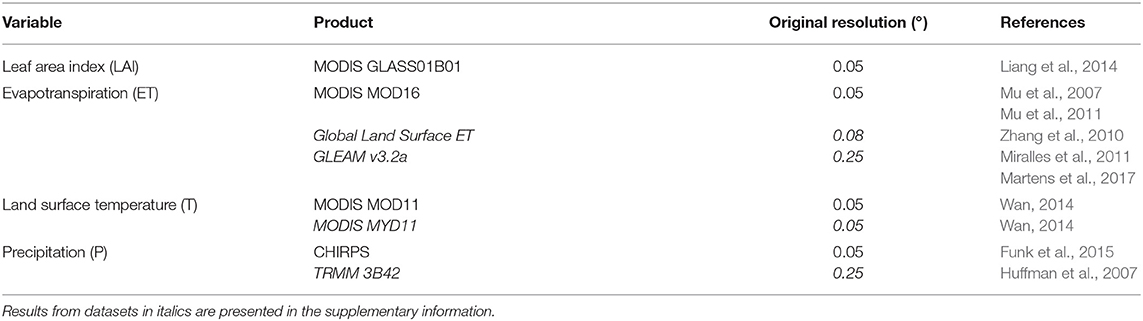
Table 2. Details of the remote sensing observations used in this study.
LAI data were retrieved from the monthly GLASS01B01 0.05° product, which is based on MODIS reflectance from 2001–2014 (Liang et al., 2014). For ET, we used the Level 3, gap-filled 0.05° C5 MOD16 MODIS product provided by the Numerical Terradynamic Simulation Group (NTSG) at the University of Montana (Mu et al., 2007, 2011), regridded from 8-day to monthly resolution. Since previous work has highlighted differences in remote sensing ET products over the Amazon, and warned against using any one data product in isolation (Miralles et al., 2016), monthly ET estimates were additionally obtained from the 8-km Global Land Surface Evapotranspiration (GLS-ET) product (Zhang et al., 2010), also distributed by NTSG, and the 0.25° × 0.25° Global Land Evaporation Amsterdam Model (GLEAM) version 3.2a dataset (Miralles et al., 2011; Martens et al., 2017). The MODIS ET and GLS-ET products were derived using variations of the Penman-Monteith equation (Monteith, 1965), although the remote sensing and reanalysis input datasets for the two products are different. Meanwhile, the GLEAM ET estimates are founded on the Priestley-Taylor approach for estimating ET (Priestley and Taylor, 1972). GLS-ET and GLEAM were analysed at 0.25° resolution and results are shown in the Supplementary Material (Figures S2 and S3).
T data were taken from the monthly 0.05° × 0.05° C6 Terra MODIS (MOD11) land surface T product (Wan, 2014). The Terra satellite has a local daytime overpass time of 10:30 a.m. We used the MOD11 Terra product because of the longer time record compared to the MYD11 Aqua satellite product (data available from 2000 vs. 2002 for Terra and Aqua, respectively). Repeating the analysis using the Aqua product yielded similar results (Figure S4). The 0.05°-resolution Climate Hazards Group InfraRed Precipitation with Station data (CHIRPS) dataset, which merges spaceborne and ground-based measurements to estimate P (Funk et al., 2015), was also downloaded. CHIRPS is based on the Tropical Rainfall Measuring Mission (TRMM) Multi-Satellite Precipitation Analysis (TMPA) version 7 product (Huffman et al., 2007), which was used to calibrate a longer timeseries of thermal infrared observations of cold cloud duration to estimate P from 1981–present. In addition to CHIRPS, 3-h TRMM P data were retrieved from the 3B42 version 7 product, in order to test the diurnal P response to deforestation. High-resolution LAI, ET, T, and P data were regridded to 0.25° using an area-weighted regridding scheme (Python package Iris: https://scitools.org.uk/iris/docs/latest/index.html) to test the influence of spatial scale on our results. Finally, topography data from the Global Land One-km Base Elevation Project (GLOBE) (Hastings and Dunbar, 1998) were resampled to 0.05° to match the climate datasets.
Statistical Analysis
For each biophysical variable (LAI, ET, T, and P), multi-year composites were created by finding the annual mean across the first three years of the analysis period (2001–2003) and across the last three years (2011–2013). Change (Δ) in each variable was then determined by differencing the 2001–2003 composite from the 2011–2013 composite. This approach removed some of the influence of interannual climate variability from the datasets and was therefore expected to make the Δ estimates more robust. Maps showing the mean annual change (Δannual) over the Amazon for each variable are presented in the Supplementary Material (Figure S5). In addition, deforestation responses were evaluated at the monthly timescale by differencing the seasonal climatologies for 2011–2013 and 2001–2003. For P data only, the annual and monthly-scale analyses were repeated using data from the southern (5–20°S) and northern (5°S−10°N) regions of the Amazon separately, to account for spatial variation in precipitation seasonality. Changes in the mean diurnal P cycle were also computed, using the same multi-year composites, also analyzing data from the south and north Amazon separately. Finally, to compare the climate impacts of deforestation between the wet and dry seasons, annual mean Δ values for all variables were determined using the three wettest and three driest months in each year, calculated on a per pixel basis using seasonal P data from CHIRPS (Δwet and Δdry).
As can be seen in Figure 1A, forests that lost their “intact” classification between 2001 and 2013 are not randomly distributed in space, but show spatial clustering, particularly along the southern margins of the Amazon. This tendency for nearby pixels to have more similar characteristics than distant pixels is known as positive spatial autocorrelation (SAC). In order to relate the biophysical changes detectable from remote sensing to changes in forest cover in a robust way, SAC must be taken into consideration. To remove the influence of SAC, we used a moving-window analysis to compare environmental changes over pixels in each of the disturbance categories with changes observed over nearby IF. For each of the categories (Table 1), a 5 × 5-pixel grid box was centered on each pixel in turn, and the change value for that pixel was compared with the mean change over all IF pixels within the grid box (Figure 1B). For the 0.05°-resolution analysis, this meant comparing against IF pixels within a radius of approximately 10 km (2 × 0.05° grid cells), while for the 0.25° resolution analysis it meant comparing IF pixels within approximately 50 km (2 × 0.25° grid cells). This meant that pixels in each disturbance group were matched with a set of neighboring IF pixels, ensuring that all comparisons were made between geographically-close impacted and non-impacted forests (see Table S1 for the number of pixels included in each group). Pixels that had no IF within the grid box to compare against were excluded from the analysis. Mean Δ values of the paired datasets were compared using a Student's t-test, to test the statistical significance of any observed differences.
Finally, Δ values for each environmental variable were related to reductions in canopy cover following loss of intact status. For this, the treecover2000 and treecover2013 datasets were used to calculate the fractional tree cover change over the analysis period [(Δtree_cover = (treecover2013–treecover2000)/treecover2000]. For all formerly intact forest pixels that experienced deforestation over the analysis period (i.e., pixels in the “moderate” and “severe” disturbance categories combined), ΔLAI, ΔET, ΔT and ΔP values were binned by Δtree_cover, using a bin width of 2.5%, and discarding bins with fewer than five data points. The analysis was applied to Δannual, Δwet and Δdry values to compare responses across different climatic conditions.
Results
Differences between intact and human-impacted forests were found for three out of the four land-surface and atmospheric variables examined. Annual mean ΔLAI, ΔET, and ΔT showed significant differences from the changes observed over intact forests for all disturbance categories (Figure 2), while ΔP showed no significant responses (Figure 2D, Figure S6). The strongest differences in ΔLAI, ΔET, and ΔT were evident over pixels that saw the most extensive land-cover changes from 2001 to 2013 – those in the “severe” category, where deforestation reduced tree cover to below 70%. Forests that lost their intact status but maintained at least 70% tree cover, and forests that had lost their intact status prior to 2000 (NIF pixels), also showed stronger changes in LAI, ET, and T compared with forests that remained intact. Biophysical responses across pixels in these two categories were of a similar magnitude, consistent with tree cover reductions of approximately 5% in each case (Table 1).
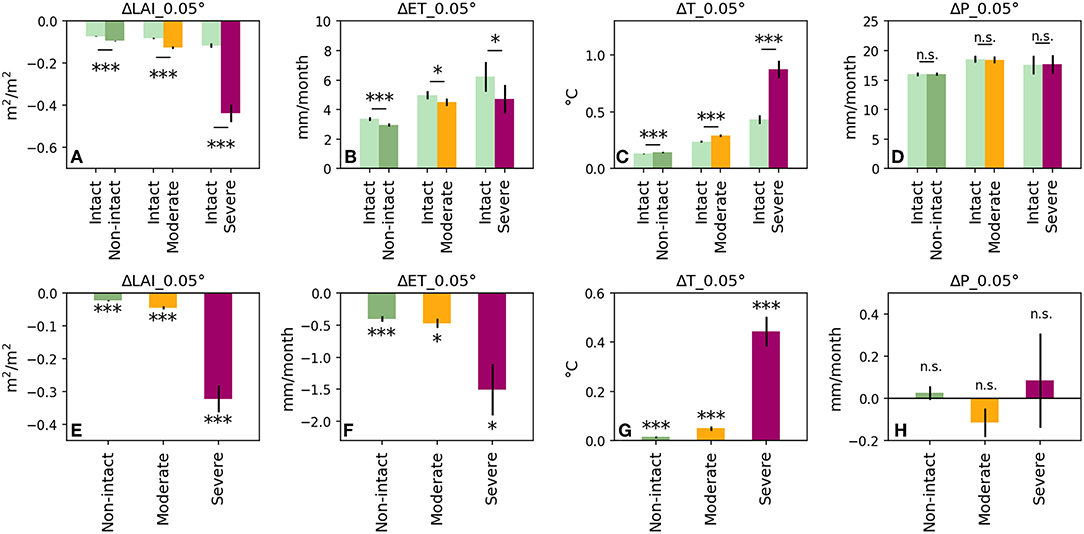
Figure 2. (A–D) Absolute changes in annual mean 0.05° remotely-sensed leaf area index (A), evapotranspiration (B), daytime land surface temperature (C), and precipitation (D), averaged over pixels in each disturbance category and the corresponding neighboring intact forest (see Figure 1B), for the period 2001–2013. (E–H) As in A–E, but with values expressed relative to the changes observed over nearby intact forest. Error bars show the 95% confidence intervals. Asterisks indicate the significance of the differences, calculated using the Student's t-test (*p < 0.05, ***p < 0.001, n.s. = not significant).
LAI, ET, and T showed clear response gradients with increasing forest disturbance (Figures 2, 3). Forest pixels in all categories showed absolute declines in LAI, including forests classified as intact in 2013 (Figure 2A). Relative ΔLAI values were all negative, and reduced progressively with increasing forest disturbance (Figure 2B). The observed pattern of LAI reductions was consistent with our independently-defined disturbance categories (Table 1), providing verification that they represented a true impact gradient. NIF pixels showed the smallest LAI response as these areas were degraded from intact to non-intact forest prior to the analysis period, whereas pixels in the other two categories lost their intact classification between 2001 and 2013. Even over “severe” deforestation pixels, the size of the LAI response is still relatively modest, with a mean reduction of 0.44 ± 0.04 m2m−2 (mean ± 95% confidence interval [CI]). However, the variance within each category is large, as can be seen in Figure 3. It must also be noted that satellite LAI tends to saturate over dense broadleaf canopies (Myneni et al., 2002), and thus reductions in LAI above the saturation threshold may not be detected, which could partly explain the small magnitude of the mean response.
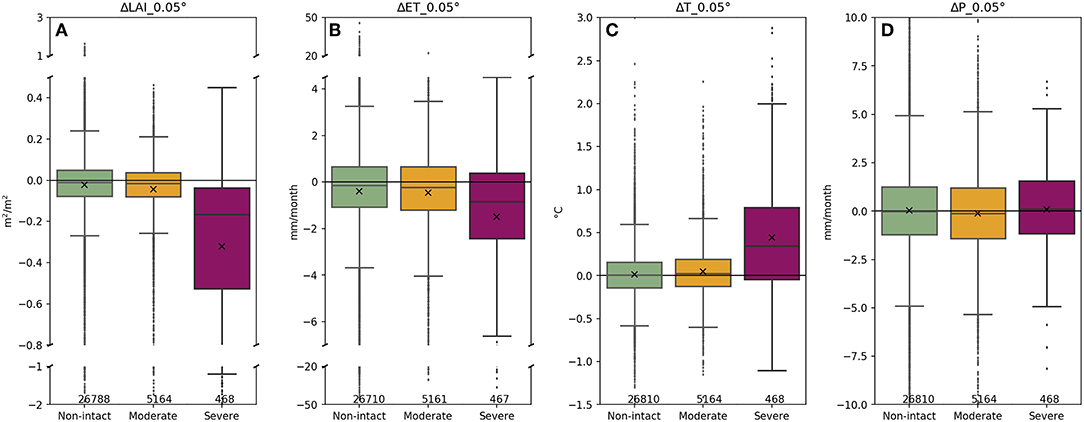
Figure 3. Changes in annual mean 0.05° remotely-sensed leaf area index (A), evapotranspiration (B), daytime land surface temperature (C) and precipitation (D), averaged over pixels in each disturbance category, and expressed relative to the changes observed over neighboring intact forest, for the period 2001–2013. The boxes in each panel represent the quartiles of each dataset, mean values are marked with an “x,” and values along the lower axis indicate the number of data points.
ΔET becomes more negative as forests become more heavily deforested, following the same trend as ΔLAI. The MODIS ET dataset is computed using MODIS LAI as an input, so the two variables cannot be considered fully independent. However, since absolute changes in LAI and ET showed opposite signs (Figures 2A,B), we do not think our results were strongly biased by the relationship between the datasets. The maximum relative change in mean annual ET was over intact forests that saw “severe” deforestation (−1.5 ± 0.4 mm month−1, Figure 2F). Similar trends were found for all three of the remote sensing ET products analyzed, though not all responses were significant for the lower resolution datasets (Figure S2). Nonetheless, the consistency in trends provides a good indication that the relationship between ET and tropical forest disturbance is robust. Absolute change values varied slightly between ET products, with MODIS, and GLS-ET showing ET increases across all forest change categories, while GLEAM showed declines (Figure 2, Figures S2a,b). These differences highlight the necessity of comparing results across multiple satellite ET products.
Most of the Amazon basin showed a warming trend over the analysis timeframe (Figure S5c), though disturbed forests warmed significantly more than neighboring intact forests (Figures 2C,G). As with LAI and ET, the magnitude of the ΔT response increased with increasing disturbance. Non-intact forests and forests affected by “moderate” or “severe” deforestation respectively warmed 0.014 ± 0.003, 0.050 ± 0.008, and 0.44 ± 0.06°C more between 2001 and 2013 than nearby forests that remained intact. For regions in the “severe” category, warming was double that observed over surrounding intact forests (Figure 2C). The mean elevation of pixels in each degradation category was calculated to test for potential biases that might influence the ΔT results. Pixels in the “non-intact” and “moderate” categories were found to be at significantly lower elevation than IF pixels (NIF = −33.3 ± 1.8 m, p < 0.001, and “moderate” = ± 3.3 m, p < 0.01). Since warming rates generally increase with altitude (Vuille et al., 2003; Bradley et al., 2006), stronger warming over the lower elevation forests could mean that elevational differences are masking some of the effect of disturbance on ΔT in these two categories. Although, since the differences that were observed were <50 m, and no significant differences were observed for “severe” deforestation areas, elevation is unlikely to have had a substantial impact on the findings presented here.
We tested the sensitivity of our analysis to the spatial resolution and to satellite overpass time. Repeating our analysis at a coarser resolution of 0.25° yielded similar results (Figure S7), with disturbed forests warming significantly more than respective nearby intact forests (p < 0.001). Relative change values were higher, since the 5 × 5 grid box used to pair degraded and intact forest pixels covered a larger area (approximately 125 × 125 km), and thus T values were compared across larger distances. The reductions in LAI and ET with increasing disturbance showed similar trends to those observed at 0.05° (Figures S7a,b), though for the 0.25° ET analysis responses were not statistically significant. Mean annual P showed no response to forest disturbance at either resolution (Figure 2D, Figure S7d).
We repeated our analysis with MYD11 T data from Aqua, which has a local daytime crossing time of 1:30 p.m. compared to 10:30 a.m. for Terra. Consistently, we found more warming over pixels in all disturbance categories compared to IF (Figure S4), with the strongest mean T response over “severe” deforestation pixels (0.55 ± 0.05°C). This Δ value is higher than that for MOD11 (0.44 ± 0.06°C), despite a slightly shorter data record for Aqua (MYD11 Δ values were calculated from 2003 to 2013), suggesting the midday warming response is stronger than that in the morning. Variation in the diurnal T response to deforestation was also tested using night-time T data from the Terra and Aqua satellites, which have local evening overpass times of 10:30 p.m. and 1:30 a.m. respectively. Both datasets showed a modest night-time cooling response over regions where intact forest was severely deforested (−0.1 ± 0.03°C for MOD11 and −0.07 ± 0.03°C for MYD11, Figure S8).
Seasonal variations in environmental response to disturbance were evaluated. ΔLAI, ΔET, and ΔT showed a clear seasonal signal in relative differences between intact and disturbed forests (Figure 4). Seasonality increased with increasing forest disturbance, with “severe” deforestation pixels showing the highest intra-annual variability. Differences were greatest toward the end of the Amazon dry season and lower during the wetter months. In August and September, heavily disturbed forests warmed by as much as 0.75 ± 0.1°C more than nearby intact forests (Figure 4C). Meanwhile, P responses to deforestation, which were evaluated over the northern and southern Amazon separately due to spatial differences in P seasonality, showed limited monthly variability (Figure S9). Furthermore, the differences between the forest disturbance categories were much less distinct for ΔP than for the other variables analyzed. Changes in the diurnal P cycle were also examined, though no clear responses to forest degradation were detected (Figures S10, S11).
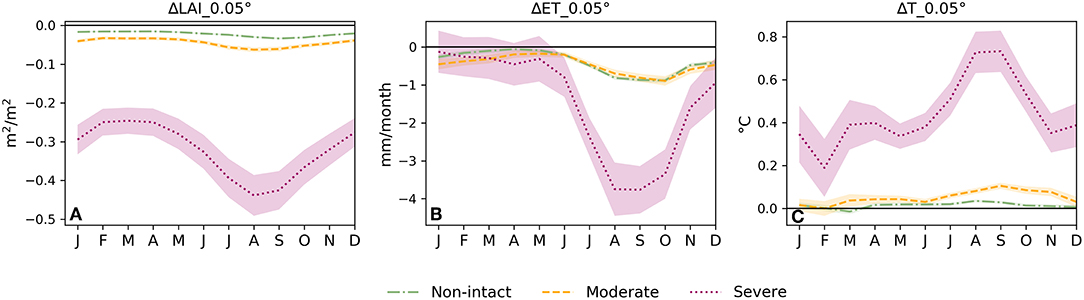
Figure 4. Monthly changes in 0.05° remotely-sensed leaf area index (A), evapotranspiration (B), and daytime land surface temperature (C), averaged over pixels in each disturbance category, and expressed relative to the changes observed over neighboring intact forest, for the period 2001–2013. Shading shows the 95% confidence intervals.
Finally, climate responses following loss of intact status were related to fractional canopy-cover loss. ΔLAI, ΔET, and ΔT were roughly proportional to the reduction in tree cover, while ΔP showed no relationship with colocalized canopy cover reductions (Figure 5). LAI, ET, and T showed small responses to disturbance where canopy-cover changes were small, and progressively larger responses with increasing canopy loss. Stronger responses were observed during dry months and weaker responses during wet months, in line with the monthly-scale analysis (Figure 4). Pixels where tree cover declined by more than 60% showed up to 1.5°C more warming in the driest three months of the year (Figure 5c). This result highlights the need to limit canopy destruction for tropical forests to be able to buffer the impacts of climate change.
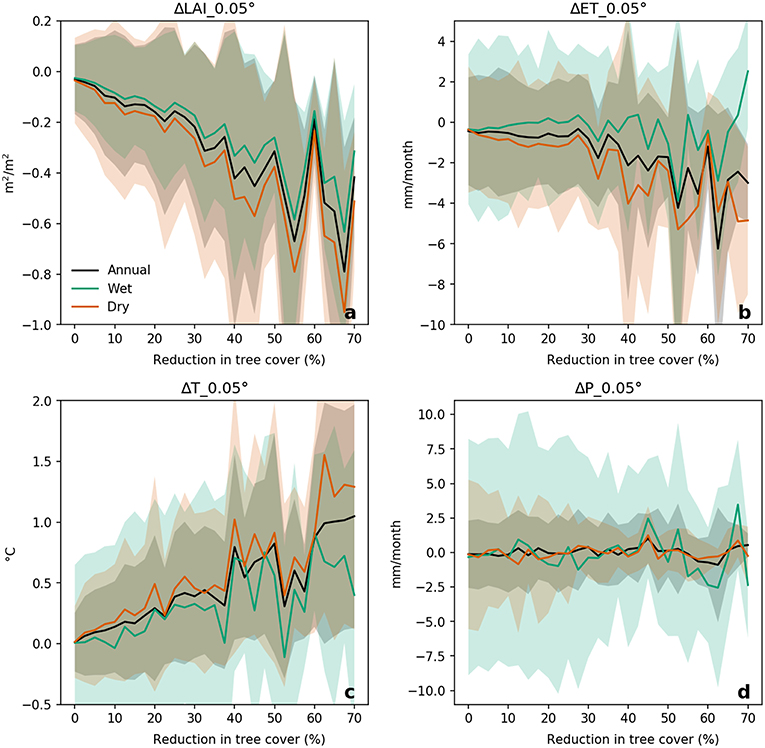
Figure 5. Changes in annual mean, wet season (data from wettest 3 months, calculated per pixel) and dry season (driest 3 months, calculated per pixel) 0.05° remotely-sensed leaf area index (a), evapotranspiration (b), daytime land surface temperature (c), and precipitation (d), in response to reduction in tree cover. Data come from all forest pixels that lost their intact status between 2000 and 2013. Values are expressed relative to the changes observed over neighboring intact forest, for the period 2001–2013.
Discussion
The aim of this research was to quantify the climatic value of intact tropical forest in the Amazon. Following several recent studies that used satellite data to examine the biophysical impacts of deforestation (e.g., Alkama and Cescatti, 2016; Li et al., 2016; Schultz et al., 2017), our analysis focused on detecting the subtler changes that occur when tropical forest transitions from an intact state to a non-intact state. To achieve this, we used remote sensing observations to evaluate the environmental consequences of progressive forest disturbance over a large spatial scale.
The IFL product classifies intact forests as areas with no remotely-detectable signs of human activity (Potapov et al., 2017). This definition could mean areas of forest with selective logging or sub-canopy disturbance could potentially be misclassified as intact. In comparisons between intact and disturbed forest, overestimation of intactness may have led to a slight underestimation in the biophysical responses to disturbance shown here (Figures 2, 3). However, given that climate impacts were small when declines in tree cover were close to zero (Figure 5), potential overestimation of IFLs is unlikely to have substantially influenced our results. Meanwhile, where canopy loss did occur, such as the small (<5%) decreases over the non-intact and “moderate” disturbance categories (Table 1), ET and T showed significant responses relative to nearby intact forest (Figure 2). This is consistent with work showing that relatively subtle disturbance rates (5–10% canopy reduction) can result in remotely detectable changes in Amazon forest functioning (Koltunov et al., 2009). Another study, based on flux tower measurements, reported reductions in carbon, water and energy exchange that were directly proportional to canopy loss following reduced-impact logging of an old-growth Amazon forest, though these effects were found to be only transient (Miller et al., 2011). Overall, the results presented here demonstrate that the climate benefits provided by intact tropical forests are inherently related to the intactness of canopy cover, suggesting the IFL methodology provides an adequate method of classifying intactness from a climate perspective.
Our results revealed distinct gradients in environmental change with increasing forest disturbance. As deforestation increased, LAI and ET both showed declines relative to neighboring intact forest (Figures 2, 3, Table 1). These results are consistent with each other, since ecosystem ET has previously been shown to scale with LAI (Zhang et al., 2016), and there were no significant P responses that might have modulated the ET response (Figures 2D,H). Tropical broadleaf forests have some of the highest LAI of all land cover types (Bruijnzeel et al., 2011), with values up to five times higher than measured over crops or pastures (Gash and Nobre, 1997; Zhu et al., 2013; Yan et al., 2016). The fall in LAI accompanying loss of intact status reduces the efficiency of ET, since there is a smaller surface area for transpiration, or for rainfall interception and subsequent evaporation (Spracklen et al., 2018). In addition, the removal of deep-rooted forest trees stems the flow of deep soil water to the atmosphere, further contributing to ET reductions (Von Randow et al., 2004; Davin and De Noblet-Ducoudré, 2010). Indeed, declines in average root depth and thus ET were thought to explain why even low levels of selective logging resulted in seasonal reductions in greenness over forests in Brazil (Koltunov et al., 2009). The results presented here confirm that even relatively minor disturbance can impact forest hydrological functioning.
The increase in surface ΔT with increasing disturbance is consistent with the declines in ΔLAI and ΔET (Figure 2). Both modeling (Davin and De Noblet-Ducoudré, 2010), and observational (Zhang et al., 2014; Silvério et al., 2015; Alkama and Cescatti, 2016; Li et al., 2016) studies agree that although the T response to deforestation varies with latitude due to variable influences on the surface energy budget (Duveiller et al., 2018), in the tropics deforestation leads to a net daytime warming. This is due to a combination of reduced ET efficiency and lower surface roughness. Lower ET reduces latent heat fluxes, while a smoother surface inhibits the turbulent transfer of energy from the land to the atmosphere, both of which result in stronger warming at the land surface (Davin and De Noblet-Ducoudré, 2010; Li et al., 2016). This contrasts with the T response to deforestation at higher latitudes, where the increase in albedo following forest clearance leads to a net cooling effect (Li et al., 2016; Schultz et al., 2017). Our estimate of the surface warming due to Amazon deforestation (0.44°C from 2001 to 2013, which equates to 0.34°C decade−1) is based on simple differencing of multi-year T composites, but is comparable with that estimated by Li et al. (2016), who used a regression approach to calculate pantropical T trends over a similar timeframe (0.28°C decade−1 for 2003–2013). The weak night-time cooling also observed over deforested areas in this study (e.g., −0.1 ± 0.03°C for MOD11, Figure S8) is consistent with previous work showing deforestation causes a small negative night-time T response in the tropics, and a stronger negative night-time T response at higher latitudes (Schultz et al., 2017). The cooling is due to a reduction in forest-generated turbulence, which brings warmer air to the surface at night, and the lower thermal storage capacity of open areas compared with forests. Finally, this study only considered local surface warming, though a recent modeling study showed that the non-local cooling impacts of deforestation caused by changes in albedo and large-scale circulation could dominate the T response at the global scale (Winckler et al., 2019).
Previous work has highlighted the climatic resilience of intact forest (Huete et al., 2006; Malhi et al., 2008), and the results presented here provide further evidence of this. Non-intact forests warmed 11% more than neighboring intact forest (0.014°C from 2001 to 2003; Figure 2G), which could have implications for drought-sensitive species at the limit of their biogeographic range (Esquivel-Muelbert et al., 2017). The climate impacts of deforestation could be particularly consequential during periods of prolonged drying, such as occur during an El Niño. It should be noted that land surface T, as used in this study, may be up to 50% more sensitive to changes in forest cover than air T (Alkama and Cescatti, 2016). Therefore, perceived T changes in response to disturbance may be slightly lower than those shown in Figure 2. Radiometric surface T can be measured remotely by satellites, while air T products are based on ground-based station measurements that may not be available over some regions of remote tropical forest (e.g., Heft-Neal et al., 2017), and are thus unlikely to co-locate with areas of forest loss. In a recent study, Winckler et al. (2019) reviewed the differing responses of these two T metrics to deforestation in climate models. They concluded that surface T is particularly important for understanding surface energy budgets and thus land-atmosphere interactions, while 2–m air temperature might have greater ecological relevance. Overall, the results shown here emphasize that non-intact forests warm more, and thus might be less able to buffer the effects of climate change, compared to forests that have been unimpacted by anthropogenic disturbance.
In this study, we identified forests as areas within the MODIS evergreen broadleaf forest classification with tree canopy cover above a threshold of 70%. Following this, we distinguished between areas of “moderate” deforestation, which experienced tree losses and LAI declines but where canopy cover remained above 70%, and areas of “severe” deforestation, where tree removal resulted in canopy cover declining below 70%. Much lower canopy thresholds have been used to define forests, such as the much-criticized United Nations Framework Convention on Climate Change definition, which specified a tree cover threshold of just 10–30% (UNFCCC, 2002; Sasaki and Putz, 2009; Putz and Redford, 2010), or the Food and Agricultural Organization threshold of 40% tree cover for closed canopy forests (FAO, 2001). However, the Amazon intact forest pixels in this study had a mean tree cover of more than 97% (Table 1), thus a higher canopy threshold was deemed appropriate. Lowering (raising) the threshold effectively raises (lowers) the amount of deforestation required before a pixel is considered “deforested,” thus giving a stronger (weaker) warming response. However, in general our results were shown to be robust to threshold variation (Figure S1).
We found conversion of intact forest and increasing forest loss had no discernible impact on annual mean P at the local scale across Amazonia (Figures 2–4), and little effect on seasonal or diurnal P cycles over the northern or southern Amazon (Figures S9–S11). Previous studies, focusing on deforestation in Rondônia in the southern Amazon, found forest removal resulted in local increases in rainfall and a possible shift toward more afternoon convection (Negri et al., 2004), or a redistribution of rainfall in space (Khanna et al., 2017). Deforestation may reduce downwind rainfall through reductions in ET and reduced atmospheric moisture transport (Spracklen et al., 2012). Modeling studies also suggest that regional-scale land-use change will reduce rainfall at the regional scale (Spracklen and Garcia-Carreras, 2015; Alves et al., 2017). However, such remote impacts are not easily evaluated through an examination of co-located land-use and climate changes, and any spatial offset in the P impacts of deforestation wouldn't be detected through the methodology applied here. Further work should focus on evaluating P responses to disturbance at different spatial scales, and comparing impacts across the tropics.
Finally, seasonal variations in ΔLAI, ΔET, and ΔT were shown to increase along the degradation gradient (Figure 4), with the most pronounced differences at the end of the dry season. Responses to canopy cover change were also enhanced during the driest part of the year, with deforestation causing warming of up to 1.5°C over areas with high tree cover loss (Figure 5c). Only the deepest-rooted trees can maintain ET during the dry season, as they can access deep soil water that remains unavailable to shorter-rooted pasture vegetation (Von Randow et al., 2004; Davin and De Noblet-Ducoudré, 2010). It follows, therefore, that removal of trees causes the strongest changes at the end of the dry season, when soil water would be at its most depleted. It has been suggested that ET fluxes at the end of the dry season may play a role in triggering the onset of the wet season, through increasing the humidity and buoyancy of air, and thus making conditions more favorable for atmospheric convection (Fu and Li, 2004; Myneni et al., 2007; Wright et al., 2017). Deforestation disrupts this process, with reduction in dry season ET possibly contributing to an observed lengthening of the Amazon dry season over recent decades, as has been suggested from observational (Fu et al., 2013) and modeling (Alves et al., 2017) studies. Increased temperatures have also been linked to greater fire occurrence in the Amazon (Aragão et al., 2018; Lima et al., 2018), making degraded forests more susceptible to dry season burning. Altogether, the results presented here indicate that deforestation disrupts normal forest functioning, particularly during the dry season when vegetation is already at its most vulnerable.
Summary
In this study, we used forest change datasets and remote sensing observations to evaluate the climatic consequences of disturbing intact Amazon forests. We found a clear signal of stronger T increases over more disturbed forests, corresponding to reductions in LAI and ET, while mean annual P showed no significant response to deforestation at the scale of our analysis. Deforestation of intact forests to below 70% tree cover was shown to have caused 0.44°C of annual warming between 2001 and 2013. Differences between intact and disturbed forests were most pronounced during the driest part of the year, when T increases of up to 1.5°C were observed. The climatic stability of intact tropical forests was closely related to preservation of tree coverage, highlighting the importance of minimizing canopy loss to limit changes in forest-climate interactions. Overall, our results illustrate the climate benefits provided by intact forests, strengthening the argument that intact forests are a vital component of the Amazon climate system and should be a conservation priority.
Author Contributions
JB and DS were involved in designing the study, shaping the research, and discussing and interpreting results. JB performed the analysis and wrote the manuscript with input from DS.
Conflict of Interest Statement
The authors declare that the research was conducted in the absence of any commercial or financial relationships that could be construed as a potential conflict of interest.
Acknowledgments
The authors are grateful to the producers of the forest change and climate datasets for making their products freely and publicly available, without which this work would not have been possible. The research has been supported by funding from the Natural Environment Research Council (grant NE/J009822/1) and the Newton Fund through the Met Office Climate Science for Service Partnership Brazil (CSSP Brazil). DS acknowledges a Philip Leverhulme Prize.
Supplementary Material
The Supplementary Material for this article can be found online at: https://www.frontiersin.org/articles/10.3389/ffgc.2019.00047/full#supplementary-material
References
Alkama, R., and Cescatti, A. (2016). Biophysical climate impacts of recent changes in global forest cover. Science 351, 600–604. doi: 10.1126/science.aac8083
Alves, L. M., Marengo, J. A., Fu, R., and Bombardi, R. J. (2017). Sensitivity of Amazon regional climate to deforestation. Am. J. Climate Change 6, 75–98. doi: 10.4236/ajcc.2017.61005
Aragão, L. E. O. C., Anderson, L. O., Fonseca, M. G., Rosan, T. M., Vedovato, L. B., Wagner, F. H., et al. (2018). 21st Century drought-related fires counteract the decline of Amazon deforestation carbon emissions. Nat. Commun. 9:536. doi: 10.1038/s41467-017-02771-y
Baccini, A., Goetz, S. J., Walker, W. S., Laporte, N. T., Sun, M., Sulla-Menashe, D., et al. (2012). Estimated carbon dioxide emissions from tropical deforestation improved by carbon-density maps. Nat. Clim. Chang. 2, 182–185. doi: 10.1038/nclimate1354
Bagley, J. E., Desai, A. R., Harding, K. J., Snyder, P. K., and Foley, J. A. (2014). Drought and deforestation: has land cover change influenced recent precipitation extremes in the Amazon? J. Clim. 27, 345–361. doi: 10.1175/JCLI-D-12-00369.1
Bastable, H. G., Shuttleworth, W. J., Dallarosa, R. L. G., Fisch, G., and Nobre, C. A. (1993). Observations of climate, albedo, and surface radiation over cleared and undisturbed amazonian forest. Int. J. Climatol. 13, 783–796. doi: 10.1002/joc.3370130706
Bonan, G. B. (2008). Forests and climate change: forcings, feedbacks, and the climate benefits of forests. Science 320, 1444–1449. doi: 10.1126/science.1155121
Bradley, R. S., Vuille, M., Diaz, H. F., and Vergara, W. (2006). Threats to water supplies in the tropical Andes. Science 312, 1755–1756. doi: 10.1126/science.1128087
Bruijnzeel, L., Mulligan, M., and Scatena, F. N. (2011). Hydrometeorology of tropical montane cloud forests: emerging patterns. Hydrol. Process. 25, 465–498. doi: 10.1002/hyp.7974
Chagnon, F. J. F., and Bras, R. L. (2005). Contemporary climate change in the Amazon. Geophys. Res. Lett. 32:L13703. doi: 10.1029/2005GL022722
Costa, M. H., and Pires, G. F. (2010). Effects of Amazon and central Brazil deforestation scenarios on the duration of the dry season in the arc of deforestation. Int. J. Climatol. 30, 1970–1979. doi: 10.1002/joc.2048
Da Rocha, H. R., Goulden, M. L., Miller, S. D., Menton, M. C., Pinto, L. D. V. O., De Freitas, H. C., et al. (2004). Seasonality of water and heat fluxes over a tropical forest in eastern Amazonia. Ecol. Appl. 14, 22–32. doi: 10.1890/02-6001
D'almeida, C., Vörösmarty, C. J., Hurtt, G. C., Marengo, J. A., Dingman, S. L., and Keim, B. D. (2007). The effects of deforestation on the hydrological cycle in Amazonia: a review on scale and resolution. Int. J. Climatol. 27, 633–647. doi: 10.1002/joc.1475
Davidson, E. A., De Araujo, A. C., Artaxo, P., Balch, J. K., Brown, I. F. C., Coe, M. T., et al. (2012). The Amazon basin in transition. Nature 481, 321–328. doi: 10.1038/nature10717
Davin, E. L., and De Noblet-Ducoudré, N. (2010). Climatic impact of global-scale deforestation: radiative versus nonradiative processes. J. Clim. 23, 97–112. doi: 10.1175/2009JCLI3102.1
Dubreuil, V., Debortoli, N., Funatsu, B., Nédélec, V., and Durieux, L. (2012). Impact of land-cover change in the Southern Amazonia climate: a case study for the region of Alta Floresta, Mato Grosso, Brazil. Environ. Monit. Assess. 184, 877–891. doi: 10.1007/s10661-011-2006-x
Duveiller, G., Hooker, J., and Cescatti, A. (2018). The mark of vegetation change on Earth's surface energy balance. Nat. Commun. 9:679. doi: 10.1038/s41467-017-02810-8
Esquivel-Muelbert, A., Galbraith, D., Dexter, K. G., Baker, T. R., Lewis, S. L., Meir, P., et al. (2017). Biogeographic distributions of neotropical trees reflect their directly measured drought tolerances. Sci. Rep. 7:8334. doi: 10.1038/s41598-017-08105-8
FAO (2001). Global Forest Resources Assessment 2000. FAO Forestry Paper No. 140. UN Food and Agriculture Organization, Rome.
Friedl, M. A., Sulla-Menashe, D., Tan, B., Schneider, A., Ramankutty, N., Sibley, A., et al. (2010). MODIS collection 5 global land cover: algorithm refinements and characterization of new datasets. Remote Sens. Environ. 114, 168–182. doi: 10.1016/j.rse.2009.08.016
Fu, R., and Li, W. (2004). The influence of the land surface on the transition from dry to wet season in Amazonia. Theoretical Appl. Climatol. 78, 97–110. doi: 10.1007/s00704-004-0046-7
Fu, R., Yin, L., Li, W., Arias, P. A., Dickinson, R. E., Huang, L., et al. (2013). Increased dry-season length over southern Amazonia in recent decades and its implication for future climate projection. Proc. Natl. Acad. Sci. U.S.A. 110, 18110–18115. doi: 10.1073/pnas.1302584110
Funatsu, B. M., Dubreuil, V., Claud, C., Arvor, D., and Gan, M. A. (2012). Convective activity in Mato Grosso state (Brazil) from microwave satellite observations: comparisons between AMSU and TRMM data sets. J. Geophys. Res. Atmos. 117. doi: 10.1029/2011JD017259
Funk, C., Peterson, P., Landsfeld, M., Pedreros, D., Verdin, J., Shukla, S., et al. (2015). The climate hazards infrared precipitation with stations—a new environmental record for monitoring extremes. Sci. Data 2:150066. doi: 10.1038/sdata.2015.66
Gash, J. H. C., and Nobre, C. A. (1997). Climatic effects of amazonian deforestation: some results from ABRACOS. Bull. Am. Meteorol. Soc. 78, 823–830. doi: 10.1175/1520-0477(1997)078<0823:CEOADS>2.0.CO;2
GDAL/OGR contributors (2018). GDAL/OGR Geospatial Data Abstraction software Library. Open Source Geospatial Foundation. Available online at: http://gdal.org (accessed August 1, 2018).
Hansen, M. C., Potapov, P. V., Moore, R., Hancher, M., Turubanova, S. A., Tyukavina, A., et al. (2013). High-resolution global maps of 21st-century forest cover change. Science 342, 850–853. doi: 10.1126/science.1244693
Hastings, D. A., and Dunbar, P. (1998). Development & assessment of the global land one-km base elevation digital elevation model (GLOBE). Int. Soc. Photo. Remote Sens. 4, 218–221.
Heft-Neal, S., Lobell, D. B., and Burke, M. (2017). Using remotely sensed temperature to estimate climate response functions. Environ. Res. Lett. 12:014013. doi: 10.1088/1748-9326/aa5463
Huete, A. R., Didan, K., Shimabukuro, Y. E., Ratana, P., Saleska, S. R., Hutyra, L. R., et al. (2006). Amazon rainforests green-up with sunlight in dry season. Geophys. Res. Lett. 33:L06405. doi: 10.1029/2005GL025583
Huffman, G. J., Bolvin, D. T., Nelkin, E. J., Wolff, D. B., Adler, R. F., Gu, G., et al. (2007). The TRMM multisatellite precipitation analysis (TMPA): quasi-global, multiyear, combined-sensor precipitation estimates at fine scales. J. Hydrometeorol. 8, 38–55. doi: 10.1175/JHM560.1
INPE (2019). INPE consolida 7.536 km2 de desmatamento na Amazônia em 2018. Technical Report, Instituto Nacional de Pesquisas Espaciais. Available online at: http://www.obt.inpe.br/OBT/noticias/inpe-consolida-7-536-km2-de-desmatamento-na-amazonia-em-2018 (accessed July 1 2019).
Kalamandeen, M., Gloor, E., Mitchard, E., Quincey, D., Ziv, G., Spracklen, D., et al. (2018). Pervasive rise of small-scale deforestation in Amazonia. Sci. Rep. 8:1600. doi: 10.1038/s41598-018-19358-2
Khanna, J., Medvigy, D., Fueglistaler, S., and Walko, R. (2017). Regional dry-season climate changes due to three decades of Amazonian deforestation. Nat. Clim. Chang. 7:200. doi: 10.1038/nclimate3226
Knox, R., Bisht, G., Wang, J., and Bras, R. (2010). Precipitation variability over the forest-to-nonforest transition in southwestern Amazonia. J. Clim. 24, 2368–2377. doi: 10.1175/2010JCLI3815.1
Koltunov, A., Ustin, S. L., Asner, G. P., and Fung, I. (2009). Selective logging changes forest phenology in the Brazilian Amazon: evidence from MODIS image time series analysis. Remote Sens. Environ. 113, 2431–2440. doi: 10.1016/j.rse.2009.07.005
Lathuillière, M. J., Johnson, M. S., and Donner, S. D. (2012). Water use by terrestrial ecosystems: temporal variability in rainforest and agricultural contributions to evapotranspiration in Mato Grosso, Brazil. Environ. Res. Lett. 7, 1–12. doi: 10.1088/1748-9326/7/2/024024
Lawrence, D., and Vandecar, K. (2014). Effects of tropical deforestation on climate and agriculture. Nat. Clim. Chang. 5:27. doi: 10.1038/nclimate2430
Li, Y., Zhao, M., Mildrexler, D. J., Motesharrei, S., Mu, Q., Kalnay, E., et al. (2016). Potential and actual impacts of deforestation and afforestation on land surface temperature. J. Geophys. Res. Atmos. 121, 14372–14386. doi: 10.1002/2016JD024969
Liang, S., Zhang, X., Xiao, Z., Cheng, J., Liu, Q., and Zhao, X. (2014). Global LAnd Surface Satellite (GLASS) Products: Algorithms, Validation and Analysis. Ney York, NY: Springer.
Lima, C. H. R., Aghakouchak, A., and Randerson, J. T. (2018). Unraveling the role of temperature and rainfall on active fires in the Brazilian Amazon using a nonlinear poisson model. J. Geophys. Res. Biogeosci. 123, 117–128. doi: 10.1002/2017JG003836
Malhi, Y., Roberts, J. T., Betts, R. A., Killeen, T. J., Li, W., and Nobre, C. A. (2008). Climate change, deforestation, and the fate of the Amazon. Science 319, 169–172. doi: 10.1126/science.1146961
Marengo, J. A., Souza, C. M., Thonicke, K., Burton, C., Halladay, K., Betts, R. A., et al. (2018). Changes in climate and land use over the Amazon region: current and future variability and trends. Front. Earth Sci. 6:228. doi: 10.3389/feart.2018.00228
Martens, B., Miralles, D. G., Lievens, H., Van Der Schalie, R., De Jeu, R. A., Fernández-Prieto, D., et al. (2017). GLEAM v3: satellite-based land evaporation and root-zone soil moisture. Geosci. Model Develop. 10:1903. doi: 10.5194/gmd-10-1903-2017
Medvigy, D., Walko, R. L., and Avissar, R. (2011). Effects of deforestation on spatiotemporal distributions of precipitation in South America. J. Clim. 24, 2147–2163. doi: 10.1175/2010JCLI3882.1
Medvigy, D., Walko, R. L., Otte, M. J., and Avissar, R. (2013). Simulated changes in northwest U.S. climate in response to Amazon deforestation. J. Climate 26, 9115–9136. doi: 10.1175/JCLI-D-12-00775.1
Miller, S. D., Goulden, M. L., Hutyra, L. R., Keller, M., Saleska, S. R., Wofsy, S. C., et al. (2011). Reduced impact logging minimally alters tropical rainforest carbon and energy exchange. Proc. Natl. Acad. Sci. U.S.A. 108, 19431–19435. doi: 10.1073/pnas.1105068108
Miralles, D. G., Holmes, T. R. H., De Jeu, R. A. M., Gash, J. H., Meesters, A. G. C. A., et al. (2011). Global land-surface evaporation estimated from satellite-based observations. Hydrol. Earth Syst. Sci. 15, 453–469. doi: 10.5194/hess-15-453-2011
Miralles, D. G., Jiménez, C., Jung, M., Michel, D., Ershadi, A., Mccabe, M. F., et al. (2016). The WACMOS-ET project – Part 2: evaluation of global terrestrial evaporation data sets. Hydrol. Earth Syst. Sci. 20, 823–842. doi: 10.5194/hess-20-823-2016
Monteith, J. (1965). Evaporation and environment. the state and movement of water in living organisms. Symp. Soc. Exp. Biol. 19, 205–234.
Mu, Q., Heinsch, F. A., Zhao, M., and Running, S. W. (2007). Development of a global evapotranspiration algorithm based on MODIS and global meteorology data. Remote Sens. Environ. 111, 519–536. doi: 10.1016/j.rse.2007.04.015
Mu, Q., Zhao, M., and Running, S. W. (2011). Improvements to a MODIS global terrestrial evapotranspiration algorithm. Remote Sens. Environ. 115, 1781–1800. doi: 10.1016/j.rse.2011.02.019
Myneni, R., Hoffman, S., Knyazikhin, Y., Privette, J., Glassy, J., Tian, Y., et al. (2002). Global products of vegetation leaf area and fraction absorbed PAR from year one of MODIS data. Remote Sens. Environ. 83, 214–231. doi: 10.1016/S0034-4257(02)00074-3
Myneni, R. B., Yang, W., Nemani, R. R., Huete, A. R., Dickinson, R. E., Knyazikhin, Y., et al. (2007). Large seasonal swings in leaf area of Amazon rainforests. Proc. Natl. Acad. Sci. U.S.A. 104, 4820–4823. doi: 10.1073/pnas.0611338104
Negri, A. J., Adler, R. F., Xu, L., and Surratt, J. (2004). The impact of amazonian deforestation on dry season rainfall. J. Clim. 17, 1306–1319. doi: 10.1175/1520-0442(2004)017<1306:TIOADO>2.0.CO;2
Nobre, C. A., Sampaio, G., Borma, L. S., Castilla-Rubio, J. C., Silva, J. S., and Cardoso, M. (2016). Land-use and climate change risks in the Amazon and the need of a novel sustainable development paradigm. Proc. Natl. Acad. Sci. U.S.A. 113, 10759–10768. doi: 10.1073/pnas.1605516113
Nogueira, E. M., Yanai, A. M., De Vasconcelos, S. S., De Alencastro Graça, P. M. L., and Fearnside, P. M. (2018). Brazil's Amazonian protected areas as a bulwark against regional climate change. Reg. Environ. Change 18, 573–579. doi: 10.1007/s10113-017-1209-2
Pan, Y., Birdsey, R. A., Fang, J., Houghton, R., Kauppi, P. E., Kurz, W. A., et al. (2011). A large and persistent carbon sink in the world's forests. Science 333, 988–993. doi: 10.1126/science.1201609
Potapov, P., Hansen, M. C., Laestadius, L., Turubanova, S., Yaroshenko, A., Thies, C., et al. (2017). The last frontiers of wilderness: tracking loss of intact forest landscapes from 2000 to 2013. Sci. Adv. 3:e1600821. doi: 10.1126/sciadv.1600821
Potapov, P., Yaroshenko, A., Turubanova, S., Dubinin, M., Laestadius, L., Thies, C., et al. (2008). Mapping the World's intact forest landscapes by remote sensing. Ecol. Soc. 13:51. doi: 10.5751/ES-02670-130251
Priestley, C., and Taylor, R. (1972). On the assessment of surface heat flux and evaporation using large-scale parameters. Monthly Weather Rev. 100, 81–92. doi: 10.1175/1520-0493(1972)100<0081:OTAOSH>2.3.CO;2
Putz, F. E., and Redford, K. H. (2010). The importance of defining ‘forest': tropical forest degradation, deforestation, long-term phase shifts, and further transitions. Biotropica 42, 10–20. doi: 10.1111/j.1744-7429.2009.00567.x
Sampaio, G., Nobre, C., Costa, M. H., Satyamurty, P., Soares-Filho, B. S., and Cardoso, M. (2007). Regional climate change over eastern Amazonia caused by pasture and soybean cropland expansion. Geophys. Res. Lett. 34:L17709. doi: 10.1029/2007GL030612
Sasaki, N., and Putz, F. E. (2009). Critical need for new definitions of “forest” and “forest degradation” in global climate change agreements. Conserv. Lett. 2, 226–232. doi: 10.1111/j.1755-263X.2009.00067.x
Schultz, N. M., Lawrence, P. J., and Lee, X. (2017). Global satellite data highlights the diurnal asymmetry of the surface temperature response to deforestation. J. Geophys. Res. Biogeosci. 122, 903–917. doi: 10.1002/2016JG003653
Silva Dias, M. A, F., Rutledge, S., Kabat, P., Silva Dias, P. L., Nobre, C., Fisch, G., et al. (2002). Cloud and rain processes in a biosphere-atmosphere interaction context in the Amazon region. J. Geophys. Res. Atmos. 107, 1–18. doi: 10.1029/2001JD000335
Silvério, D. V., Brando, P. M., Macedo, M. N., Beck, P. S., Bustamante, M., and Coe, M. T. (2015). Agricultural expansion dominates climate changes in southeastern Amazonia: the overlooked non-GHG forcing. Environ. Res. Lett. 10:104015. doi: 10.1088/1748-9326/10/10/104015
Simard, M., Pinto, N., Fisher, J. B., and Baccini, A. (2011). Mapping forest canopy height globally with spaceborne lidar. J. Geophys. Res. 116:G04021. doi: 10.1029/2011JG001708
Soares-Filho, B., Moutinho, P., Nepstad, D., Anderson, A., Rodrigues, H., Garcia, R., et al. (2010). Role of Brazilian Amazon protected areas in climate change mitigation. Proc. Natl. Acad. Sci. U.S.A. 107, 10821–10826. doi: 10.1073/pnas.0913048107
Spera, S. A., Galford, G. L., Coe, M. T., Macedo, M. N., and Mustard, J. F. (2016). Land-use change affects water recycling in Brazil's last agricultural frontier. Glob. Chang. Biol. 22, 3405–3413. doi: 10.1111/gcb.13298
Spracklen, B., Kalamandeen, M., Galbraith, D., Gloor, E., and Spracklen, D. V. (2015). A global analysis of deforestation in moist tropical forest protected areas. PLoS ONE 10:e0143886. doi: 10.1371/journal.pone.0143886
Spracklen, D. V., Arnold, S. R., and Taylor, C. M. (2012). Observations of increased tropical rainfall preceded by air passage over forests. Nature 489, 282–285. doi: 10.1038/nature11390
Spracklen, D. V., Baker, J. C. A., Garcia-Carreras, L., and Marsham, J. (2018). The effects of tropical vegetation on rainfall. Annu. Rev. Environ. Res. 43, 14.1–14.26. doi: 10.1146/annurev-environ-102017-030136
Spracklen, D. V., and Garcia-Carreras, L. (2015). The impact of Amazonian deforestation on Amazon basin rainfall. Geophys. Res. Lett. 42, 9546–9552. doi: 10.1002/2015GL066063
Staal, A., Tuinenburg, O. A., Bosmans, J. H. C., Holmgren, M., Van Nes, E. H., Scheffer, M., et al. (2018). Forest-rainfall cascades buffer against drought across the Amazon. Nat. Clim. Chang. 8, 539–543. doi: 10.1038/s41558-018-0177-y
Swann, A. L. S., Longo, M., Knox, R. G., Lee, E., and Moorcroft, P. R. (2015). Future deforestation in the Amazon and consequences for South American climate. Agri. Forest Meteorol. 214–215, 12–24. doi: 10.1016/j.agrformet.2015.07.006
UNFCCC (2002). Report of the Conference of the Parties on its seventh session, held at Marrakesh from 29 October to 10 November 2001. FCCC/CP/2001/13/Add.1, UNFCCC, Marrakesh, Morocco, 2001. Available: https://unfccc.int/resource/docs/cop7/13a01.pdf.
Von Randow, C., Manzi, A. O., Kruijt, B., De Oliveira, P. J., Zanchi, F. B., Silva, R. L., et al. (2004). Comparative measurements and seasonal variations in energy and carbon exchange over forest and pasture in South West Amazonia. Theoret. Appl. Climatol. 78, 5–26. doi: 10.1007/s00704-004-0041-z
Vuille, M., Bradley, R. S., Werner, M., and Keimig, F. (2003). “20th century climate change in the tropical andes: observations and model results,” in Climate Variability and Change in High Elevation Regions: Past, Present & Future, ed H. F. Diaz (Dordrecht: Springer Netherlands).
Wan, Z. (2014). New refinements and validation of the collection-6 MODIS land-surface temperature/emissivity product. Remote Sens. Environ. 140, 36–45. doi: 10.1016/j.rse.2013.08.027
Watson, J. E. M., Evans, T., Venter, O., Williams, B., Tulloch, A., Stewart, C., et al. (2018). The exceptional value of intact forest ecosystems. Nat. Ecol. Evolut. 2, 599–610. doi: 10.1038/s41559-018-0490-x
Winckler, J., Lejeune, Q., Reick, C. H., and Pongratz, J. (2019). Nonlocal effects dominate the global mean surface temperature response to the biogeophysical effects of deforestation. Geophys. Res. Lett. 46, 745–755. doi: 10.1029/2018GL080211
Winckler, J., Reick, C. H., Luyssaert, S., Cescatti, A., Stoy, P. C., Lejeune, Q., et al. (2019). Different response of surface temperature and air temperature to deforestation in climate models. Earth Syst. Dynam. 10, 473–484. doi: 10.5194/esd-10-473-2019
Wright, J. S., Fu, R., Worden, J. R., Chakraborty, S., Clinton, N. E., Risi, C., et al. (2017). Rainforest-initiated wet season onset over the southern Amazon. Proc. Natl. Acad. Sci. U.S.A. 114, 8481–8486. doi: 10.1073/pnas.1621516114
Yan, K., Park, T., Yan, G., Chen, C., Yang, B., Liu, Z., et al. (2016). Evaluation of MODIS LAI/FPAR product collection 6. part 1: consistency and improvements. Remote Sensing 8, 1–16. doi: 10.3390/rs8050359
Zemp, D., Schleussner, C.-F., Barbosa, H., Van Der Ent, R., Donges, J. F., Heinke, J., et al. (2014). On the importance of cascading moisture recycling in South America. Atmos. Chem. Phys. 14, 13337–13359. doi: 10.5194/acp-14-13337-2014
Zhang, K., Kimball, J. S., Nemani, R. R., and Running, S. W. (2010). A continuous satellite-derived global record of land surface evapotranspiration from 1983 to 2006. Water Resour. Res. 46:21. doi: 10.1029/2009WR008800
Zhang, M., Lee, X., Yu, G., Han, S., Wang, H., Yan, J., et al. (2014). Response of surface air temperature to small-scale land clearing across latitudes. Environ. Res. Lett. 9:034002. doi: 10.1088/1748-9326/9/3/034002
Zhang, Y., Peña-Arancibia, J. L., Mcvicar, T. R., Chiew, F. H. S., Vaze, J., Liu, C., et al. (2016). Multi-decadal trends in global terrestrial evapotranspiration and its components. Sci. Rep. 6:19124. doi: 10.1038/srep19124
Zhu, Z., Bi, J., Pan, Y., Ganguly, S., Anav, A., Xu, L., et al. (2013). Global data sets of vegetation leaf area index (LAI)3g and fraction of photosynthetically active radiation (FPAR)3g derived from global inventory modeling and mapping studies (GIMMS) normalized difference vegetation index (NDVI3g) for the period 1981 to 2011. Remote Sensing 5:927. doi: 10.3390/rs5020927
Keywords: intact forest landscapes, deforestation, leaf area index, evapotranspiration, temperature, precipitation
Citation: Baker JCA and Spracklen DV (2019) Climate Benefits of Intact Amazon Forests and the Biophysical Consequences of Disturbance. Front. For. Glob. Change 2:47. doi: 10.3389/ffgc.2019.00047
Received: 14 December 2018; Accepted: 08 August 2019;
Published: 30 August 2019.
Edited by:
Yadvinder Malhi, University of Oxford, United KingdomReviewed by:
Jose A. Marengo, Centro Nacional de Monitoramento e Alertas de Desastres Naturais (CEMADEN), BrazilSami Walid Rifai, Environmental Change Institute, University of Oxford, United Kingdom
Copyright © 2019 Baker and Spracklen. This is an open-access article distributed under the terms of the Creative Commons Attribution License (CC BY). The use, distribution or reproduction in other forums is permitted, provided the original author(s) and the copyright owner(s) are credited and that the original publication in this journal is cited, in accordance with accepted academic practice. No use, distribution or reproduction is permitted which does not comply with these terms.
*Correspondence: Jessica C. A. Baker, ai5jLmJha2VyQGxlZWRzLmFjLnVr