 Ji Qi
Ji Qi Daniel Markewitz
 Mary Anne McGuire1
 Lisa Samuelson
 Eric Ward
- 1Warnell School of Forestry and Natural Resources, University of Georgia, Athens, GA, United States
- 2The Jones Center at Ichauway, Newton, GA, United States
- 3School of Forestry and Wildlife Sciences, Auburn University, Auburn, AL, United States
- 4U. S. Geological Survey, Wetland and Aquatic Research Center, Lafayette, LA, United States
- 5Department of Forestry and Environmental Resources, North Carolina State University, Raleigh, NC, United States
Forests in the Southeast USA are predicted to experience a moderate decrease in precipitation inputs over this century that may result in soil water deficiency during the growing season. The potential impact of a drier climate on the productivity of managed loblolly pine (Pinus taeda L.) plantations in the Southeast USA is uncertain. Access to water reserves in deep soil during drought periods may help buffer these forests from the effects of water deficits. To better understand the potential impact of drought on deep soil water, we studied the combined effects of throughfall reduction and fertilization on soil water usage in a clay rich Piedmont Ultisol to a depth of 3 m. In a 6-year-old loblolly pine plantation, we applied a throughfall reduction treatment (ambient vs. ~30% throughfall reduction) and a fertilization treatment (no fertilization vs. fertilization). Over 28 months, throughfall reduction lowered soil moisture for all depths and differences were significant in the surface soils (0–0.3 m) (1.2–3.6%) and deep soils (below 2 m) (2.6–3.6%). Fertilization also lowered soil moisture for all depths and differences were significant at 0.3–0.6 m (2.9%) and 1.94–3.06 m (4.5%). Fertilization when combined with the throughfall reduction treatment significantly decreased soil water at 0.1–0.9 m depth. Soils of all depths were rarely depleted of plant available water with the exception of 0–0.1 m, mainly during the growing season. Under throughfall reduction treatment, soil below 0.9 m consistently accounted for more than half of the change in plant available water during months when transpiration exceeded precipitation. When considering the whole soil profile in this clay rich Ultisol, soil water storage buffered transpirational demand in the face of decreasing throughfall input.
Introduction
Deep root (>1 m) water uptake can be important for forest ecosystems during drought (Nepstad et al., 1994; Fensham and Fairfax, 2007; Padilla and Pugnaire, 2007; Maeght et al., 2013). Drought stresses plants and lowers productivity (Borken and Matzner, 2009) and access to deep water reserves can buffer plants from these stresses (Belk et al., 2007). Predicting plant responses to a changing climate requires an understanding of deep soil water access under drought conditions.
Forests in the Southeast USA are predicted to experience more variable precipitation over this century with up to three times more extreme daily precipitation events (a daily amount that occurs once in 20 years) (Meehl et al., 2007; Kunkel et al., 2013), and a 2.5% or more per decade decrease in water yield (Sun, 2013). Uncertainty in future precipitation patterns still remains because the Southeast is straddled in the transition zone between the Northeast with projected wetter conditions and the Southwest with projected drier conditions (Kunkel et al., 2013). Variable precipitation could result in soil drying during the growing season, a critical period for plant growth (Teskey and Sheriff, 1996). Positive relationships between rooting depth and resistance to drought have been demonstrated (Fensham and Fairfax, 2007; Padilla and Pugnaire, 2007). For example, in Brazilian Amazonian forests, about half of the closed forests rely on water extracted by deep roots to maintain evergreen canopies during the dry season (Nepstad et al., 1994). In a similar Amazonian forest, it was estimated that soil water at the 2.5–5.5 m depth contributed ~20% of water demand and the 5.5–11.5 m depth contributed ~10% (Markewitz et al., 2010). A global review of 565 root profiles, across 15 terrestrial biomes, indicated that soil depths of 0.4, 0.7, and 1.1 m correspond to cumulative root biomass proportions of 80, 90, and 95%, respectively (Schenk and Jackson, 2002). As such, studying water uptake by deep roots is critical to increase our understanding of plant water uptake and soil water availability under changing climate (Harper and Tibbett, 2013; Maeght et al., 2013).
Understanding the impact of a potentially drier climate is particularly important in managed loblolly pine (Pinus taeda L.) forests in the Southeast USA, which are the most intensively managed and fastest growing commercial pine species in the region covering ~20 million hectares (Fox et al., 2007). However, loblolly pine is not highly drought tolerant so is uncommon on the driest soil types (e.g., Quartzipsamments). Low soil water availability has been shown to reduce net photosynthesis (Wertin et al., 2010), decrease both above and below ground growth, and shift root distribution of loblolly pine (Torreano and Morris, 1998). Depending on stand structure and climate, mid-rotation loblolly pine stands in Georgia use ~300–650 mm of water per year (Bartkowiak et al., 2015). Six hundred and fifty mm represents about 55% of the rain this region receives (1,109 mm, 30-year average) (http://www.ncdc.noaa.gov). During the growing season, loblolly pine relies on soil water storage as transpiration often exceeds precipitation (McNulty et al., 1996).
Fertilization is often combined with other management practices in loblolly pine plantations and significantly improves productivity (Jokela et al., 1991; Kyle et al., 2005; Fox et al., 2007). Although fertilization can increase productivity (Fox et al., 2007), when combined with low soil water availability stands may exhibit little response to fertilization (Tang et al., 2004; Goldstein et al., 2013). This research is part of a recent region wide (Florida, Georgia, Oklahoma, Virginia) loblolly pine fertilization x throughfall reduction experiment that specifically addressed the interaction effects of fertilization and decreased water availability on loblolly pine (Will et al., 2015). A few published papers from this region wide research have examined the combined effects of fertilization and decreased water availability (Samuelson et al., 2014, 2018; Bartkowiak et al., 2015; Ward et al., 2015; Maggard et al., 2016, 2017). Previous results have demonstrated that fertilization may intensify the impact of drought (Bartkowiak et al., 2015; Ward et al., 2015). Responses, however, have been site and soil specific and only the Georgia site has reported on soil moisture content below 60 cm (Qi et al., 2018b).
In this research we report on how drought and fertilization affect soil hydrological processes to a depth of 3 m. Here we report on our empirical measurements during 28 months of this experiment while our previous work focused on model simulations (Qi et al., 2018b). Predicting how these loblolly pine forests might respond to drought is critical for understanding how forests might be altered under a changing climate. This research was designed to test these hypotheses: (1) throughfall reduction treatment will reduce soil moisture for the whole soil profile, and when combined with fertilization the soil moisture reduction will be greater than throughfall reduction or fertilization alone; (2) under throughfall reduction treatment, soil moisture storage change will be greater in deep soil when compared with ambient throughfall, and when combined with fertilization the soil moisture change will be greater than throughfall reduction or fertilization alone.
Methods
Site Descriptions
The experiment was established in a loblolly pine plantation in Taliaferro County, Georgia owned by Plum Creek Timber Company. The study site is at an elevation of 152 m with latitude 33°37′32.61″ N and longitude 82°47′56.54″ W. This site was clear-cut in 2004 and both chemical and mechanical site preparation were applied in 2005. This included an aerial application of Velpar ULW herbicide (5.97 kg/ha), debris management, and combination plowing. In 2006, bare root seedlings (seed orchard mix) were hand planted at 1,544 trees/ha. Herbaceous weed control was applied banded at ~220 ml/ha of Oust Extra in 2006. Refer to Will et al. (2015) for more details.
The soils of this research site are a Cecil-Lloyd complex. The Lloyd series is a fine, kaolinitic, thermic Rhodic Kanhapludult, while the Cecil series is a fine, kaolinitic, thermic Typic Kanhapludult. The Rhodic designation indicates an influence of mafic parent material on soil color. These soils are typical in the region. These soil series descriptions are based on USDA-NRCS Soil Survey Division (https://soilseries.sc.egov.usda.gov).
The 30-year (1983–2012) average annual precipitation is 1,119 mm and the 30-year (1983–2012) average daily maximum and minimum temperature is 22.7 and 10.1°C (http://www.ncdc.noaa.gov). During the study period, monthly Palmer Drought Severity Index indicated mild drought from June 2014 to June 2015 ranging from -1.00 to -1.99 and moderate drought for July 2015 with values ranging from -2.00 to -2.99 (http://www.ncdc.noaa.gov/temp-and-precip/drought/historical-palmers/psi/201303-201507).
Experimental Design
The treatment area for each plot was 34 × 28 m with a 21 × 14 m measurement area in the center and a 6 m untreated buffer area between each treatment area. Throughfall exclusion structures (Figure 1) were installed to reduce throughfall by 30%, which is at the extreme end of predictions for precipitation reduction associated with climate change for the region (Collins et al., 2013; Walsh et al., 2014). Furthermore, because most planted pine forests are nutrient limited and nutrient management is widespread, it is important to examine the interaction of throughfall exclusion treatment with an imposed nutritional gradient. This study was designed as a 2x2 factorial experiment with four blocks and the following treatments were assigned randomly: Control (C)–no treatment; Fertilization (F)–fertilizer additions to achieve “optimum” nutrition; Throughfall reduction (D)–troughs installed in understory to divert 30% of throughfall off of the plot (Figure 1); Fertilization and throughfall reduction (FD)–combined fertilization and throughfall reduction treatments (Figure 2) (PINEMAP 2013). Blocks were established by grouping plots with similar tree height (6.34 ± 0.58 m average at time of treatment initiation) and basal area (8.79 ± 1.58 m2/ha average at time of treatment initiation) (Will et al., 2015). The fertilizer rates were 224 kg/ha N, 28 kg/ha P, 56 kg/ha K and a micro-nutrient mix at the rate of 22.4 kg/ha containing 6% S, 5% B, 2% Cu, 6% Mn, and 5% Zn (Southeast Mix, Cameron Chemicals, Inc., Virginia Beach, VA, USA) evenly broadcast by hand to ensure even distribution.
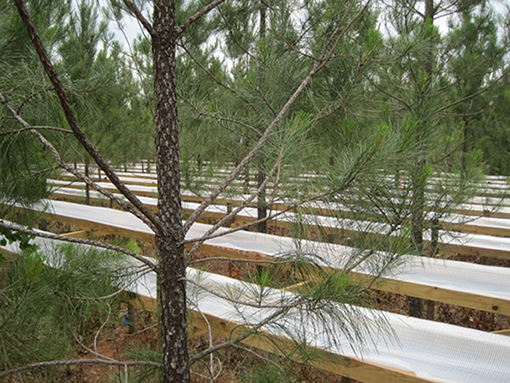
Figure 1. Throughfall reduction structure covering 30% of the plot area with troughs to capture and funnel throughfall away from the plots. Taliaferro County, Georgia in 2012 when loblolly pines were 6 years old. Data collection period was May 2013 to August 2015.
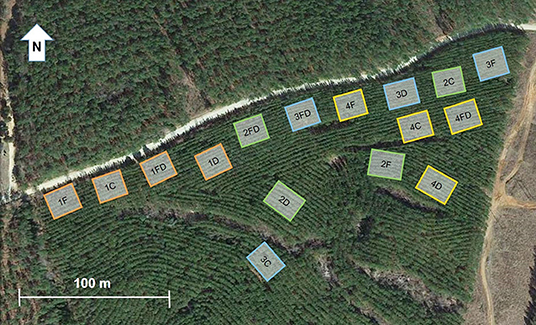
Figure 2. Map of experimental treatments and blocks located in Taliaferro County, Georgia. Four treatments were randomly assigned in each of the four blocks: control (C), fertilization (F), throughfall reduction (D) and combined treatment of FD. Fertilizer additions included N, P, K and micronutrients and throughfall reduction diverted 30% of throughfall off of the plot. Blocks were established by grouping plots with similar tree height (6.34 ± 0.58 m average at time of treatment initiation in 2012) and basal area (8.79 ± 1.58 m2/ha average at time of treatment initiation).
The throughfall reduction structures were made of plastic troughs and were installed between tree rows in the forest understory starting May 2012 (Figure 1). These troughs covered 30% of the plot area to capture ~30% of incoming throughfall and channeled the water to outside of the experimental treatment areas. The 30% covered area does not necessarily exactly equal a 30% reduction in throughfall, although similar designs have been effectively applied for exclusion experiments (Hanson et al., 1998; Nepstad et al., 2002). In addition, large lengths of trough have been demonstrated to be most effective in reducing error in estimates of throughfall volume <5% or ~4 cm in this location (Zimmermann et al., 2010). Stemflow is another potential source of error but as a proportion of precipitation in pine plantations is generally <10% (Swank, 1972) and often ranged from 5 to <1% or ~2 cm (Abrahamson et al., 1998; Zarnoch et al., 2002; Bryant et al., 2005). Currently there is little evidence supporting the influence of stemflow on deep soil water (Levia and Germer, 2015). For example, in a desert shrubland, stemflow generated preferential flow along roots, however, this preferential flow did not reach beyond 40 cm in the soil (Jian et al., 2014). Vertical infiltration of preferential flow along roots was hampered due to low hydraulic conductivity of clay rich soil in a European beech stand (Schwärzel et al., 2012). Considering the small amount of stemflow and the clay rich Ultisol, stemflow impact on deep soil was deemed minimal at this study site. Studies at this location and other companion sites using the same trough structure to reduce throughfall have already demonstrated impacts on soil moisture and plant water usage responses such as transpiration (Samuelson et al., 2014, 2018; Ward et al., 2015; Maggard et al., 2016, 2017; Wightman et al., 2016). Finally, using the same experiment site, a study modeling the effect of changing precipitation inputs on deep soil water utilization was able to calibrate and validate water balances using the same field measurements (Qi et al., 2018a).
Soil Texture and Chemical Analysis
One soil profile was sampled to 3 m in the middle of each plot. Soils were collected in eight depths: 0–0.1, 0.1–0.2, 0.2–0.5, 0.5–1.0, 1.0–1.5, 1.5–2.0, 2.0–2.5 and 2.5–3.0 m. All samples were air-dried and homogenized by sieving through a 2 mm screen. A subsample was analyzed in replicate for soil texture, pH, total carbon and nitrogen. Textural analysis followed Gee and Or (2002) and soil water pH tests followed the method of Thomas (1996) with a 1:1 soil:water ratio. For carbon and nitrogen analysis samples were further oven-dried at 65°C and ball mill ground. Total carbon and nitrogen were analyzed on a CE Elantech NC 2100 Soil Analyzer (CE Elantech Inc., Lakewood, NJ) using the Dumas method as described in Bremner (1996).
Soil Moisture Measurements
At the approximate center of the plot, sets of 6.5 mm diameter welding rods were installed within tree rows (in all plots), between tree rows (in all plots), and under throughfall reduction structures (only in D and FD plots) to cover these 4 depth increments: 0–0.1, 0–0.3, 0–0.6, and 0–0.9 m. These rods were used for soil moisture measurements and were left exposed at the surface for later reading (Greco and Guida, 2008). In addition, using these same welding rods, 0.12-m rods were constructed with coaxial cable and epoxy (Evett and Ruthardt, 2005) and installed at 1.94–2.06 m (centered at 2 m) and 2.94–3.06 m (centered at 3 m) depths with the cable exposed at the surface. Soil volumetric water content (VWC) was measured by attaching a Riser Bond Model 1205CXA Coaxial Metallic Time Domain Reflectometer (TDR) (Radiodetection, Raymond, Maine) to the rods or coaxial cable with alligator clips. The wave forms were measured to estimate VWC. Soil moisture probes were measured approximately monthly from May 2013 to August 2015. The surface soil moisture measurements were later partitioned into separate depths: 0–0.1, 0.1–0.3, 0.3–0.6, and 0.6–0.9 m, using:
where De [L] is depth of water equivalent, θi and Di are the VWCs and layer thicknesses, respectively, of each layer (Radcliffe and Šimunek, 2010).
To better capture the soil moisture changes during the growing season, in March 2014 logging TDR probes (CS655 0.12 m Soil Water Content Reflectometer, Campbell Scientific, Inc., Logan, Utah) were installed vertically at 0.54–0.66 m at the approximate center of each plot in blocks 2 and 4 (total of eight probes). They were programmed to collect data every 30 min from March 2014 to October 2015. These data were logged automatically (CR23X, Campbell Scientific, Inc., Logan, Utah), then downloaded and averaged by day from March 2014 to August 2015.
Plant Available Water
To calculate plant available water (PAW), soil water retention curves were determined using Tempe cells (SoilMoisture Equipment Corp., Santa Barbara, CA) and a WP4C Dewpoint PotentialMeter (Decagon Devices. Inc., Pullman, WA). Core samples were collected in each plot at 0–75 mm and 100–175 mm. Core samples were also collected at 0.5, 1.0, 1.5, 2.0, 2.5, and 3.0 m from the walls of two soil pits dug on site.
Tempe cells were used for <1 MPa and WP4C Dewpoint PotentialMeter was used for >1 MPa. Results from both measurements were then combined to form soil water retention curve equations following Van Genuchten (1980):
where α [L−1], n [–], and m [–] are fitting parameters, h is pressure [L] and Se(h) [–] is the effective soil water saturation calculated following Van Genuchten (1980):
where θ is the VWC, θs is the saturated VWC and θr is the residual VWC, defined as the VWC where hydraulic conductivity approaches zero (Van Genuchten, 1980). PAW (θPAW) was calculated as the amount of soil water held at tensions between -0.01 and -1.5 MPa (θwp), determined from soil moisture retention curves. The PAW of each soil layer was calculated using:
where θ of 0–0.1, 0.1–0.3, 0.3–0.6, and 0.6–0.9 m soils were measured as noted above; θ of 0.9–2 m were averaged between VWC measurements at 0.6–0.9 and 2 m; and θ of 2–3 m were averaged between VWC measurements at 2 and 3 m. The PAWs of 0–0.1, 0.1–0.3, 0.3–0.6, 0.6–0.9, 0.9–2.0, and 2.0–3.0 m were calculated approximately monthly from May 2013 to August 2015.
Precipitation and Transpiration
Precipitation records were obtained from six weather stations located within 90 km of the research site (www.georgiaweather.net). Due to the lack of any one weather station being in extremely close proximity, the mean precipitation between six locations from March 2013 to August 2015 were used to estimate the water balance during the experiment (Figure 3). Transpiration on a ground area basis was calculated by averaging sap flow (kg/min) across sample tress in a treatment plot, dividing by measurement plot area, and multiplying by the ratio of sapwood area to the average sapwood area of sap flow trees measured at diameter at breast height in November 2012. The sap flow measurements and scaling approaches were detailed in Bartkowiak et al. (2015). Data collected in 2013 were previously reported in Bartkowiak et al. (2015). In 2014, sap flux was collected and scaled similarly with the addition of gap filling of missing data using methods described by Bell et al. (2015) (Figure 3).
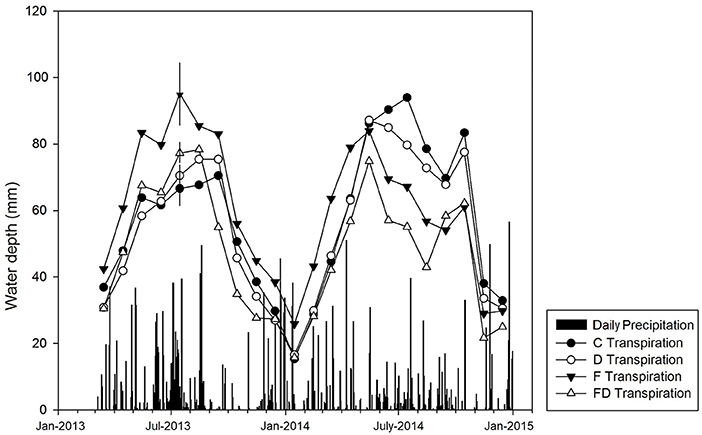
Figure 3. Daily precipitation (black bars) and monthly transpiration in treatments of control (C), fertilization (F), throughfall reduction (D), and combined treatment of FD in a loblolly pine plantation in Taliaferro County, Georgia for the period of March 2013 to December 2014. Error bars (±1 SE, n = 4) shown only for July 2013 transpiration to maintain clarity. The transpiration was determined from sap flux measurements and scaling approaches detailed in Bartkowiak et al. (2015).
Statistical Analysis
Soil VWC data of different depths (0–0.1, 0.1–0.3, 0.3–0.6, 0.6–0.9, 1.94–2.06, and 2.94–3.06 m) were tested for main and interactive treatment effects of fertilization and throughfall reduction (α = 0.05). Among 5,185 data points, there were 62 VWC measurements below zero, ~1% of the total data collected. These data points were not included in data analysis. The experimental unit of replication was the plot. Block was treated as a random factor. Between rows, within row, and under trough positions (within unit repeated measurements) were averaged to represent plot level VWC. These data were analyzed using a mixed effect, repeated measures model with date as the repeated factor. Tukey's significance test at the level of α = 0.05 was used to separate treatment effect on VWCs at the same depth. The SAS statistical package (SAS Institute Inc., Cary, North Carolina) was used for all data analyses.
Results
Soil Physical and Chemical Properties
Soils of all depths were acidic, with pH ranging from 5.2 to 5.8. Mean carbon concentrations ranged from 1.92% in 0-0.1 m and decreased with depth to ~0.5% below 1 m. Mean nitrogen concentrations were 0.1% at the surface and decreased to 0–0.01% below 1 m.
The clay content ranged from 24–47%, with lowest clay contents in the 0–0.1 and 2.5–3.0 m layers, while 0.2–2.5 m soils had >40% clay throughout (Figure 4). Wilting point VWCs (θwp) ranged from 10–19% (Figure 4). In correspondence with clay contents, θwp were highest in the middle of the soil profile but decreased toward the surface and the bottom of the profile (Figure 4).
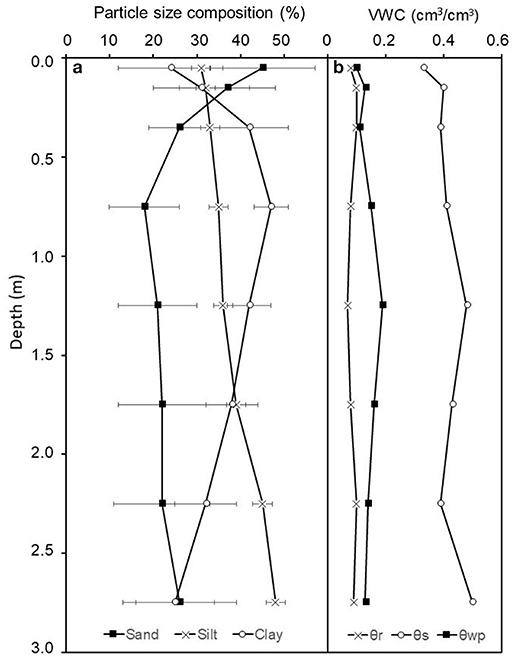
Figure 4. (a) Soil sand, silt, and clay percentage for all treatment plots at Taliaferro County, Georgia. Values are mean ±1 SE (n = 16). (b) Soil water retention curve parameters for 0–0.1 and 0.1–0.2 m, eight samples were collected and data points from all eight samples were used to create one soil water retention curve, and for soils below 0.2 m, two samples were collected. Samples were collected in August 2013. Where θr is the residual volumetric water content, θs is the saturated volumetric water content, and θwp is the volumetric water content at −1.5 MPa, determined from soil moisture retention curves.
Volumetric Water Content
Soil Volumetric Water Contents (VWC, data could be found in Supplementary Material) were generally higher during winters and lower during summers (Figure 5), and the effect of time was significant (p < 0.0001 for all depths). This was more obvious in surface soils, while deep soil VWC varied proportionally less over the observed time. There were no significant time by treatment interactions for any depth (p value ranged from 0.4–0.9).
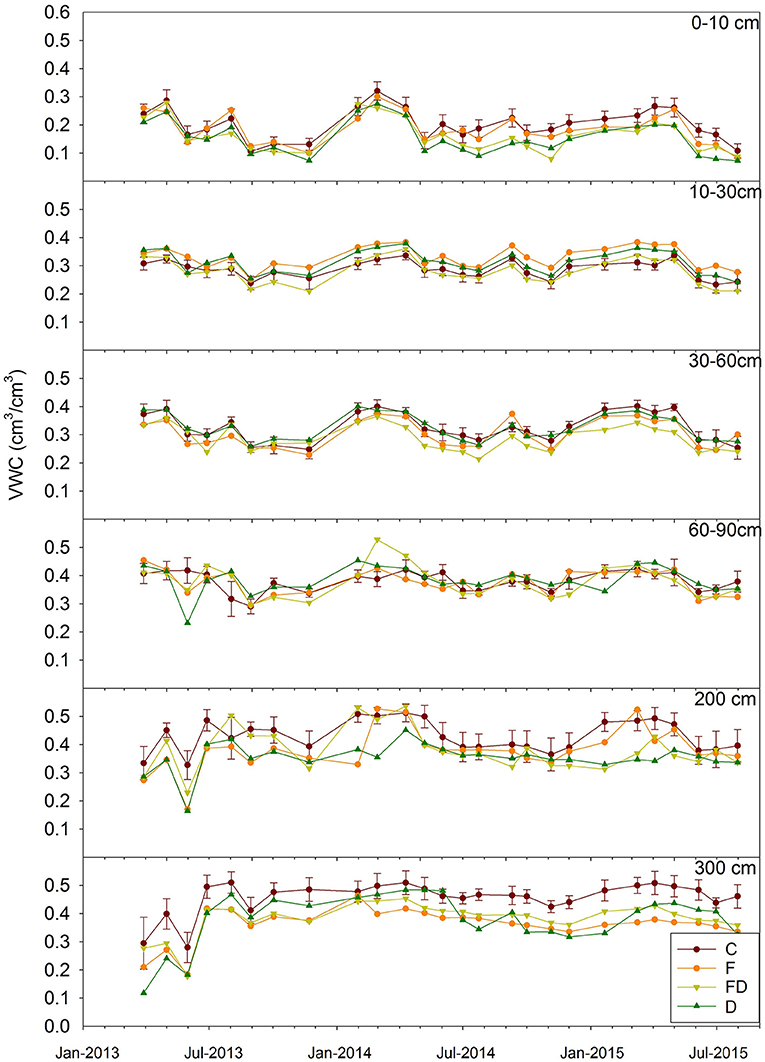
Figure 5. Mean soil volumetric water content (VWC) of six depths for March 2013 to July 2015. Treatments are control (C), fertilization (F), throughfall reduction (D), and combined treatment of FD. Bars representing ±1 SE are given only for C to maintain clarity (n = 4).
The main effect of fertilization was reduced VWC for all depths (Table 1). The effect was more prominent below 0.3 m with 1.3–4.5% lower VWC in fertilized plots. The differences were significant within the 0.3–0.6 m depth increment (2.9%, p < 0.0001) and 2.94–3.06 m increment (4.5%, p < 0.0001). Surface soil moisture was only 0.4–0.5% lower in the fertilized plots, and these differences were not significant.
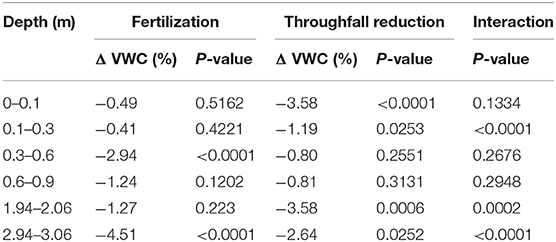
Table 1. Treatment effects of fertilization, throughfall reduction, and their interaction (n = 4) on soil volumetric water content (VWC), and %VWC change.
The main effect of throughfall reduction treatment was also lowered soil moisture for all depths, ranging from 0.8 to 3.6% VWC (Table 1). The differences were significant for surface soils, 0–0.1 (p < 0.0001) and 0.1–0.3 m (p = 0.0253), with 3.6 and 1.2% lower VWC, respectively. Differences from 0.3–0.6 to 0.6–0.9 m were not significantly different. Deep soils did differ, 1.94–2.06 m (p = 0.0006) and 2.94–3.06 m (p = 0.0252) had significantly lower VWC, with 3.6 and 2.6% lower VWC, respectively.
The interaction effect of fertilization and throughfall reduction was significant at 0.1–0.3 m (p < 0.0001), 1.94–2.06 m (p = 0.0002), and 2.94–3.06 m (p < 0.0001) soils (Table 1). In these cases, throughfall reduction without fertilization (i.e., C vs. D) significantly lowered soil moisture while the effect of throughfall reduction with fertilization (i.e., F vs. FD) was not significant. For example, for soils at 1.96–2.04 m depth, without throughfall reduction, fertilization significantly reduced soil moisture (i.e., C vs. F); while with throughfall reduction fertilization didn't have a significant effect on soil moisture (i.e., D vs. FD) (Figure 6).
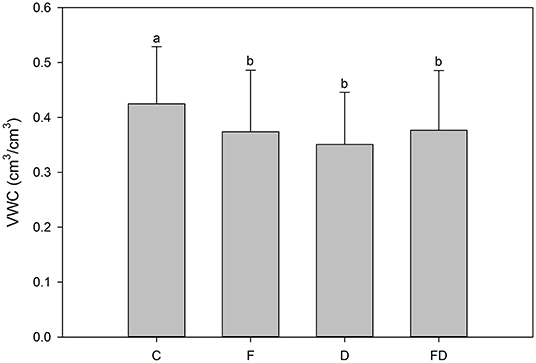
Figure 6. Treatment [control (C), fertilization (F), throughfall reduction (D), and FD] effects on volumetric water content (VWC) of 1.94–2.06 m soils. Bars represent the means of VWC (over the period of March 2013 to July 2015) and error bars represent ±1 SE (n = 108). Letters indicating differences for Tukey's significance test at the level of α = 0.05 were used to separate treatment effect on VWC.
Water Balance
Plant available water (PAW) varied with season. In general, plots with FD treatment had the lowest PAW, while C had the highest (Figure 7). Soils of all depths were never depleted of PAW, except for the 0–0.1 m soils under D, F, and FD treatments. Among these soils, there was no PAW in 0–0.1 m soil under D treatments for 6 months, 4 months for FD plots, and 2 months for F plots (mainly being depleted during the growing season) (Figure 7).
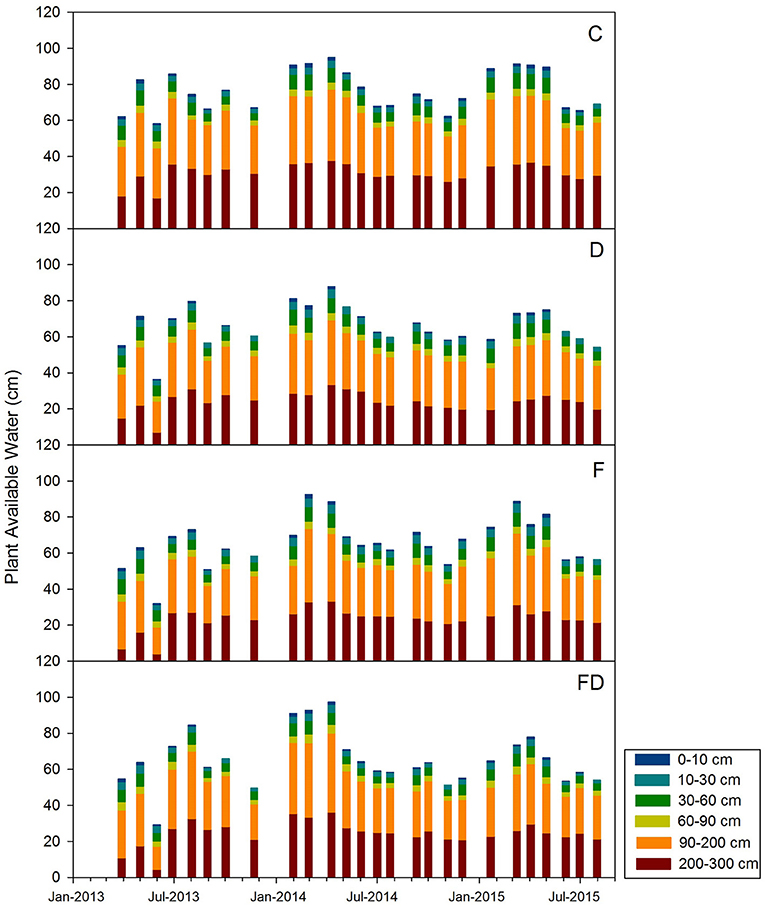
Figure 7. Seasonal trends in plant available water for control (C), fertilization (F), throughfall reduction (D) and combined treatment of FD for March 2013 to July 2015. Stacked bars represent plant available water storage of 0–0.1, 0.1–0.3, 0.3–0.6, 0.6–0.9, 0.9–2.0, and 2.0–3.0 m.
Transpiration exceeded precipitation for 4–8 months in the growing seasons during the experimental period, with D plots having the longest duration of precipitation deficit (May– October 2014). Soil water storage change over time showed similar trends as precipitation-transpiration, often being negative during the growing season and positive during winter. Plots under FD treatment experienced the longest time period (11 months) with the total ΔPAW <0, while C plots had the shortest time (8 months) (Figure 8).
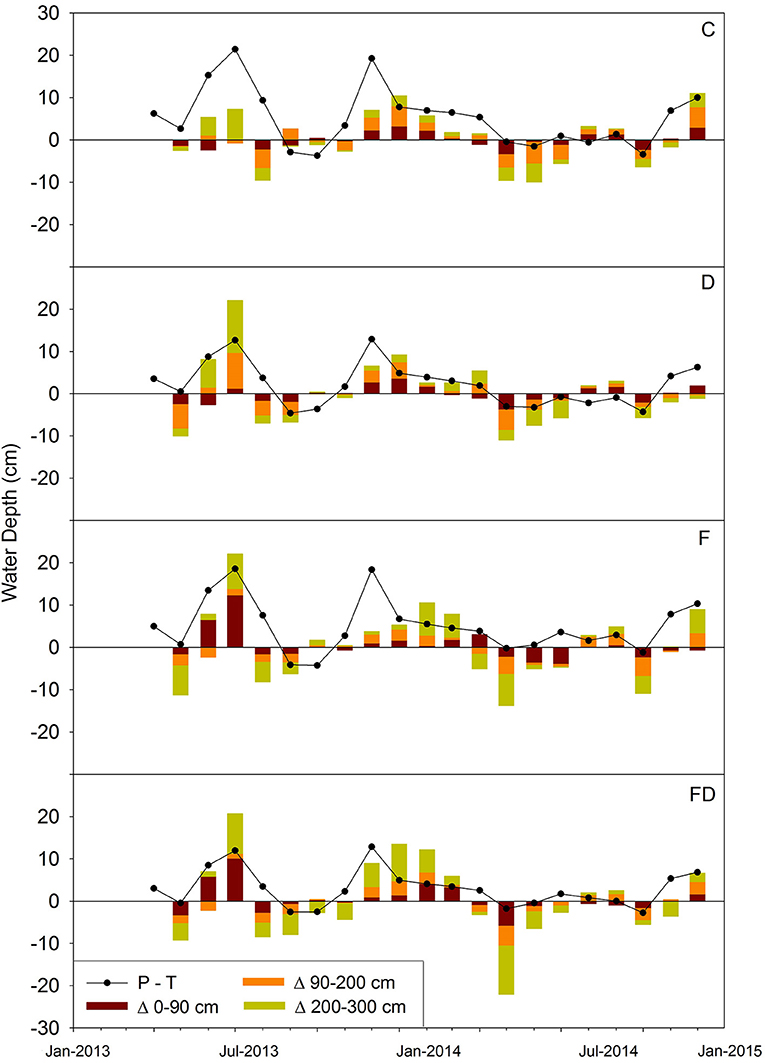
Figure 8. Water mass balance for April 2013 to December 2014. Solid lines are water depth of precipitation—transpiration (P-T). Stacked bars are plant available water storage change by depth. Error bars representing ±1 SE were too small to show (n = 4). Treatments are control (C), fertilization (F), throughfall reduction (D), and combined treatment of FD.
During the months that transpiration exceeded precipitation, the contribution of soil below 0.9 m to ΔPAW varied widely: 1.0–7.2 cm in C plots, 1.0–7.5 cm in D, 0.1–10.3 cm in F, and 0.4–19.0 cm in FD (Figure 8). The FD soils below 90 cm contributed the highest amount of water (19.0 cm), which occurred in May 2014. During this month, VWC at 2 m changed from 54.6 to 39.7%, accounting for 78% of the total ΔPAW. The highest proportion of soil water from below 0.9 m that contributed to total ΔPAW for any month was 98%, which occurred in plots under FD treatment during November 2013 (Figure 8). Overall, D plots had a consistently large proportion (62–81%) of total ΔPAW coming from soils below 0.9 m, while the proportions varied widely under other treatments (C: 40–86%, F: 18–81%, and FD: 11–98%) (Figure 8).
Growing Season Analysis
The VWC data collected by dataloggers every 30 min followed the same trend as VWC measured monthly (Figure 9). Soil VWCs were generally higher during winters and lower during summers. These higher temporal resolution data better captured daily variability in VWC. Soils under all four treatments experienced a similar increase and decrease in VWC, with smaller daily variances for D and FD soils.
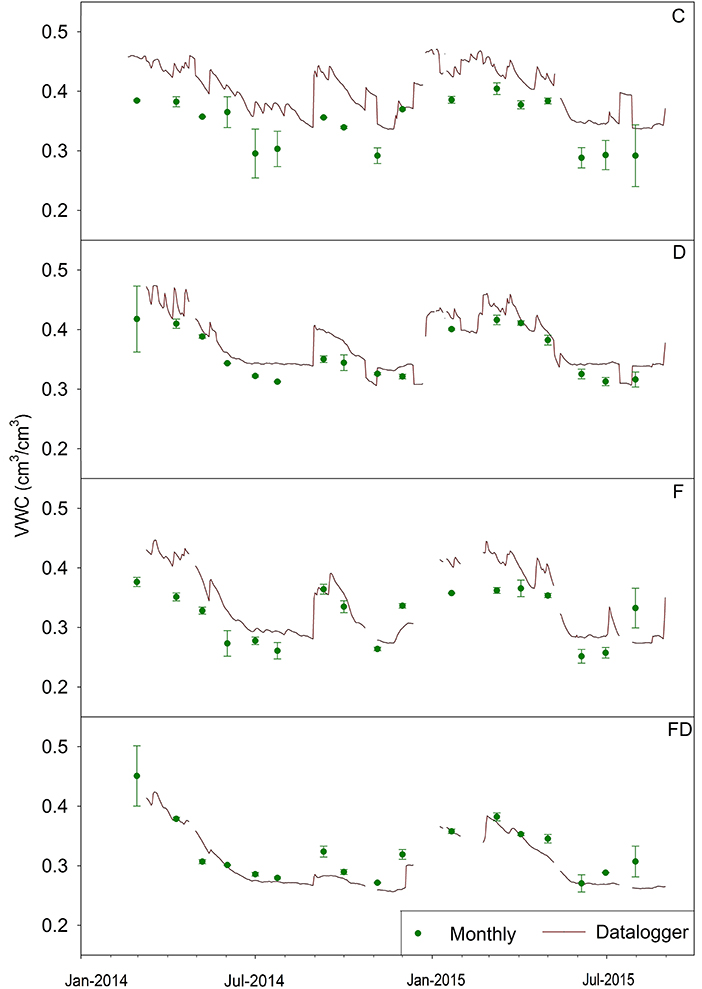
Figure 9. Average daily soil volumetric water content (VWC) at 0.6 m based on 30-min readings of soil moisture probes (red line) and monthly point samples of VWC (mean ± 1 SE) (n = 4). Treatments are control (C), fertilization (F), throughfall reduction (D), and combined treatment of FD.
Discussion
We hypothesized that throughfall reduction would reduce soil moisture for the whole soil profile, and when combined with fertilization the reduction in soil moisture would be greater than with throughfall reduction or fertilization alone. Under the treatment of throughfall reduction, there was lower soil moisture throughout the whole soil profile relative to the ambient throughfall plots, with both surface (0–0.3 m) and deep (2–3 m) soils having significantly lower soil moisture (Table 1 and Figure 5). In the surface, lower soil moisture might be explained by lower throughfall inputs and high fine root biomass that would increase root water uptake. In 0.3–2.0 m soils, the absence of significant effects might be attributed to the high clay content, which requires a large water content difference to induce a relatively small change in water potential that may not have been statistically detectable (Figure 4). In deep soil horizons, lower soil moisture could be caused by higher root water uptake or continued soil drainage. The absence of VWC values above θs (Figure 4), however, suggests limited potential for drainage and therefore, lower VWC in 2–3 m soils are likely caused by higher root water uptake (the presence of roots in deep soil was reported in Qi et al., 2018a).
Fertilized plots also had consistently lower soil moisture than unfertilized plots. In a study conducted on the same research site in 2013, fertilization significantly increased leaf area index (Bartkowiak et al., 2015). Higher leaf area index could result in more canopy interception and thus reduced throughfall input. Another possible explanation is that lower VWC under fertilization was caused by higher root water uptake to meet canopy transpirational demand. In 2013, transpirational demand in fertilizer treatments (64.9 ± 5.5 cm year−1) was not significantly greater than non-fertilized (58.0 ± 4.0 cm year−1) (Bartkowiak et al., 2015). The soil moisture differences between fertilized and unfertilized plots were especially prominent below 0.3 m, with significant differences at 0.3–0.6 m and 2.94–3.06 m (Table 1 and Figure 5). Finally, under FD treatment VWC was significantly lower in the 0.1–0.9 m depths (Figure 5). These results do indicate some increased drying (lower VWC) of the surface under FD (0.1–0.9 m) compared to D (0–0.3 m). On a water content basis, in the upper 0.9 m this translated into a greater depletion of 2.38 cm of PAW in FD compared to D. The depletion in the upper 0.9 m compromised ~80% of the depletion over the entire 3 m in FD.
Our second hypothesis addressed deep soil moisture, proposing that under throughfall reduction treatment, ΔPAW would be greater in deep soil when compared with ambient throughfall, and when combined with fertilization the change in deep soil moisture would be greater than throughfall reduction or fertilization alone. We found consistently greater ΔPAW below 0.9 m under throughfall reduction treatment compared to ambient throughfall. During months when transpiration > precipitation, 0–0.9 m soil rarely (5 of the 37 months) contributed more than half of total ΔPAW. In D plots, soils below 0.9 m consistently contributed more than half of ΔPAW, while the proportion varied widely in ambient throughfall soils (18–86%) (Figure 7). Under FD treatment, soils below 0.9 m contributed 98% of ΔPAW during November 2013, which is the maximum percent contribution throughout all months of the experiment under all treatments.
Within the soils of the current study site, even though we excluded ~30% of throughfall, which is at the extreme end of predictions for precipitation reduction associated with climate change for the region (Collins et al., 2013; Walsh et al., 2014), there was enough PAW to support transpiration. Within all the treatments, soils of all depths were rarely depleted of PAW (i.e., below θwp), with the exception of the 0–0.1 m that was dry mainly during the growing season (Figure 7). Variation in water use as a loblolly pine plantation ages may impact these observations (Domec et al., 2012). When comparing two plantations in sandy soils in the lower coastal plain of North Carolina, transpiration of a 5-year-old stand was 125–290 mm less than a 19-year-old stand. At the 19-year-old site, <20% of water was stored in the top 30 cm of soil and soil at 60–140 cm depth contributed a larger amount of water to transpiration relative to 10–60 cm soils during dry periods (Domec et al., 2012). A modeling study manipulating precipitation inputs to a pine stand showed that when annual precipitation input was reduced more than 30%, plants required stored soil water to satisfy transpirational demands and the contribution of deep soil water to transpiration increased as precipitation declined (Qi et al., 2018a). Considering the uncertainty in climate change, deep soil water could play a more vital role to buffer the effects of drought as stands age.
The observed changes in VWC did not result in reduction of growth (Bartkowiak et al., 2015) or transpiration (Figure 3) under the D treatment during the 2013 growing season. However, 2013 had 27% higher precipitation than the 30-year average in this area (http://www.ncdc.noaa.gov). Decreased soil moisture in the F treatment similarly did not have a significant effect on transpiration in 2013 despite increased leaf area due to fertilization. The combined FD treatment did decrease transpiration per ha from 62 to 47 mm/month, but this was not coincident with a significant decrease in aboveground growth (Bartkowiak et al., 2015). By 2015 and 2016, a small decline in height and volume increment was observed under throughfall reduction (Samuelson et al., 2018). The results presented here, however, suggest that, at least, during the 2013 and 2014 growing season soil moisture under throughfall reduction with or without fertilization was sufficient to sustain growth.
Three additional study sites using the same fertilization and throughfall reduction treatment methods were direct companions to this site in Georgia. One companion experiment in a 13-year-old loblolly pine plantation in Florida (30°12′22″ N, 83°52′12″ W) showed similar results with no impact of throughfall reduction (D) on forest productivity or water relations (Wightman et al., 2016). The lack of response at this site was attributed to abundant rainfall and the ability of trees to access a shallow water table (1–2 m depth). In fact, the fertilizer only treatment increased monthly transpiration by 17% in the spring of 2013 and transpiration was not significantly different among treatments during the rest of the year (Wightman et al., 2016). These results suggested that given higher than average precipitation or access to a shallow water table, a ~30% throughfall reduction may not lower soil moisture enough to stress trees in physiologically significant ways. A second companion research site in a 13-year-old plantation in Virginia (37°27′37″ N, 78°39′50″ W) provided some contrasting results. At this location the throughfall reduction treatment lowered transpiration by 19% during the growing season even when the annual precipitation was 9% higher than the 30-year mean in the research area. Under fertilization, transpiration also declined by 13% during the growing season and under FD transpiration decreased by 29%. Under neither treatment, however, was growth reduced (Ward et al., 2015). Finally, in the Oklahoma site (34°1′47″ N, 94°49′23″ W) between ages 5–7 throughfall reduction in 2013 reduced whole tree water use by 20% and in 2014 by 5% (Maggard et al., 2016, 2017). This reduction reduced stem volume growth by ~15%. In contrast, fertilization increased stem volume growth by 11% partly by increasing water use efficiency (i.e., stem growth per unit water transpiration). In fact, in all locations growth was enhanced with fertilization even when fertilization was provided under throughfall exclusion (Bracho et al., 2018).
These contrasting results from the Georgia, Florida, Virginia, and Oklahoma studies highlight the critical role of soils in understanding pine plantation responses to drought combined with fertilization in the Southeast USA. The soil in the Georgia site is a very deep (>3 m) and well drained Kanhapludult with >30% clay from 0.10–2.5 m. These clays are accessible to plants (i.e., rootable) and at saturation may contain up to 0.8 m of PAW. Although at this site, after 3 years of exclusion some impacts on growth were evident (Samuelson et al., 2018). In Florida, soils are a complex of Spodosols and Alfisols with all being somewhat poorly drained and possessing a thick cap of fine sand (Qi et al., 2018b). All these Florida soils, however, also possess a high water table. As such, outside of consecutive years of severe drought we would expect little water limitation at these sites and no impacts on growth were evident (Wightman et al., 2016). At the Virginia site soil is a Hapludult with a silt loam overlying a silty clay loam subsoil but is shallow (~1.5 m) to a paralithic contact (i.e., weathered rock). Soils at the Virginia site are limited in both the depth of rooting and the soil moisture storage capacity. Stands at this site had lower tree densities then the other locations and, although no treatment effects on growth were measured stand productivity was lower at this location (Ward et al., 2015; Bracho et al., 2018). Finally, in Oklahoma, soils are a deep, well-drained Paleudult, although are bisequel such that at ~80 cm the subsoil texture and structure changes, which may limit rooting depth in this younger aged stand. Oklahoma is also the western edge of the range of loblolly pine in the USA experiencing higher growing season temperatures and vapor pressure deficits than the rest of the southeastern USA creating a region more apt to experience water stress. Throughfall exclusion reduced growth at this location (Maggard et al., 2017). Overall, the soil conditions at these four sites provide unique rooting environments and supplies of PAW, thus different reactions to throughfall reduction x fertilization should be expected.
The ability of pine stands at the Georgia site to sustain transpiration despite decreased water input (Bartkowiak et al., 2015) may have trickledown effects on other key ecosystem services such as providing a stable water source under a future drier climate (Sun and Liu, 2013). The highest observed transpiration across all treatments was ~700 mm/year (Figure 3), while the 30-year average precipitation is ~1,120 mm (www.ncdc.noaa.gov). Assuming 30% precipitation reduction, drainage or water yield might decline from 420 to 80 mm impacting drainage to groundwater recharge or limiting stream flows.
The uptake of deep soil water by the root system has been indicated to be sufficient to maintain transpiration in several other forest ecosystems, including a temperate Eucalyptus forest, a tropical wet/dry savanna in Australia (Leuning et al., 2005), scrub oak and pine flatwoods ecosystems in Florida (Bracho et al., 2008), and Amazonian evergreen forests and nearby pasture ecosystems (Nepstad et al., 1994; Markewitz et al., 2010). The results from this current research specifically demonstrate the importance of deep soil water in maintaining transpiration in loblolly pine plantations on deep clay rich Ultisols in the Southeast USA, especially in the face of a changing climate.
Conclusion
Throughfall reduction and fertilization both lowered soil moisture for all depths (0–3 m) and the combined treatment yielded lower soil moisture than either treatment alone. Even with ~30% throughfall reduction, soils of all depths were rarely depleted of plant available water, with the exception of the top 10 cm of soil during the growing season. During the months that transpiration exceeded precipitation (i.e., when plant root uptake is depleting plant available water in soil), soil below 0.9 m always contributed to the observed change in plant available water storage. Under throughfall reduction treatment, soil below 0.9 m consistently accounted for more than half of the change in plant available water storage. In this 3 m deep, clay rich Piedmont soil under ~30% throughfall reduction, soil water storage was able to satisfy plant demand for transpiration. Within Southeast USA loblolly pine plantations, deep soil water (>0.9 m) will be important in maintaining transpiration on deep, clay rich Ultisols.
Data Availability Statement
Soil volumetric water content data can be found in Supplementary Material. Other datasets generated for this study are available on request to the corresponding author.
Author Contributions
JQ and DM led the research design and implementation, analysis, and manuscript writing. MM contributed to the research implementation and manuscript writing. LS and EW contributed to the research design and manuscript writing.
Funding
This research was supported by the Pine Integrated Network: Education, Mitigation, and Adaptation project (PINEMAP) funded by the United States Department of Agriculture National Institute of Food and Agriculture Award #2011-68002-30185.
Disclaimer
Any use of trade, firm, or product names is for descriptive purposes only and does not imply endorsement by the U.S. Government.
Conflict of Interest
The authors declare that the research was conducted in the absence of any commercial or financial relationships that could be construed as a potential conflict of interest.
Acknowledgments
The authors would like to thank Madison Akers, Dr. Lawrence Morris, and Dr. Robert Teskey for their intellectual and labor input. Thanks to Plum Creek Timber Co. for providing property access.
Supplementary Material
The Supplementary Material for this article can be found online at: https://www.frontiersin.org/articles/10.3389/ffgc.2019.00093/full#supplementary-material
References
Abrahamson, D. A., Dougherty, P. M., and Zarnoch, S. J. (1998). Hydrological components of a young loblolly pine plantation on a sandy soil with estimates of water use and loss. Water Resour. Res. 34, 3503–3513. doi: 10.1029/98WR02363
Bartkowiak, S. M., Samuelson, L. J., McGuire, M. A., and Teskey, R. O. (2015). Fertilization increases sensitivity of canopy stomatal conductance and transpiration to throughfall reduction in an 8-year-old loblolly pine plantation. For. Ecol. Manag. 354, 87–96. doi: 10.1016/j.foreco.2015.06.033
Belk, E. L., Markewitz, D., Rasmussen, T. C., Maklouf Carvalho, E. J., Nepstad, D. C., and Davidson, E. A. (2007). Modeling the effects of throughfall reduction on soil water content in a Brazilian Oxisol under a moist tropical forest. Water Resour. Res. 43:14. doi: 10.1029/2006WR005493
Bell, D. M., Ward, E. J., Oishi, A. C., Oren, R., Flikkema, P. G., and Clarke, J. S. (2015). A state-space modeling approach to estimating canopy conductance and associated uncertainties from sap flux density data. Tree Physiol. 35, 792–802. doi: 10.1093/treephys/tpv041
Borken, W., and Matzner, E. (2009). Reappraisal of drying and wetting effects on C and N mineralization and fluxes in soils. Glob. Change Biol. 15, 808–824. doi: 10.1111/j.1365-2486.2008.01681.x
Bracho, R., Powell, T. L., Dore, S., Li, J., Hinkle, C. R., and Drake, B. G. (2008). Environmental and biological controls on water and energy exchange in Florida scrub oak and pine flatwoods ecosystems. J. Geophys. Res. Biogeosci. 113:G02004. doi: 10.1029/2007JG000469
Bracho, R., Vogel, J. G., Will, R. E., Noormets, A., Samuelson, L. J., Jokela, E. J., et al. (2018). Carbon accumulation in loblolly pine plantations is increased by fertilization across a soil moisture availability gradient. Forest Ecol. Manag. 424, 39–52. doi: 10.1016/j.foreco.2018.04.029
Bremner, J. M. (1996). Nitrogen - total. Methods of Soil Analysis Part 3—Chem. Methods sssabookseries, 1085–1121.
Bryant, M. L., Bhat, S., and Jacobs, J. M. (2005). Measurements and modeling of throughfall variability for five forest communities in the southeastern US. J. Hydrol. 312, 95–108. doi: 10.1016/j.jhydrol.2005.02.012
Collins, M., Knutti, R., Arblaster, J., Dufresne, J.-L., Fichefet, T., Friedlingstein, P., Gao, X., et al. (2013). “Long-term climate change: projections, commitments and irreversibility,” in Climate Change 2013: The Physical Science Basis. Contribution of Working Group I to the Fifth Assessment Report of the Intergovernmental Panel on Climate Change, eds T. F. Stocker, D. Qin, G.-K. Plattner, M. Tignor, S. K. Allen, J. Boschung, et al. (Cambridge; New York, NY: Cambridge University Press), 1029–1136.
Domec, J. C., Sun, G., Noormets, A., Gavazzi, M. J., Treasure, E. A., Cohen, E., et al. (2012). A comparison of three methods to estimate evapotranspiration in two contrasting loblolly pine plantations: age-related changes in water use and drought sensitivity of evapotranspiration components. For. Sci. 58, 497–512. doi: 10.5849/forsci.11-051
Evett, S. R., and Ruthardt, B. B. (2005). A primer on TDR probe construction. Agricultural Research Service, United States Department of Agriculture. Available online at: http://www.cprl.ars.usda.gov/TDR/MAKE_TDR_PRB.PDF.
Fensham, R. J., and Fairfax, R. J. (2007). Drought-related tree death of savanna eucalypts: species susceptibility, soil conditions and root architecture. J. Veg. Sci. 18, 71–80. doi: 10.1111/j.1654-1103.2007.tb02517.x
Fox, T. R., Jokela, E. J., and Allen, H. L. (2007). The development of pine plantation silviculture in the southern United States. J. For. 105, 337–347. doi: 10.1093/jof/105.7.337
Gee, G. W., and Or, D. (2002). “2.4 Particle-size analysis,” in Methods of Soil Analysis, Part 4, Physical Methods, SSSA Book Series 5, eds J. H. Dane and G. C. Topp (Madison, WI: Soil Science Society of America), 255–293.
Goldstein, G., Bucci, S. J., and Scholz, F. G. (2013). Why do trees adjust water relations and hydraulic architecture in response to nutrient availability? Tree Physiol. 33, 238–240. doi: 10.1093/treephys/tpt007
Greco, R., and Guida, A. (2008). Field measurements of topsoil moisture profiles by vertical TDR probes. J. Hydrol. 348, 442–451. doi: 10.1016/j.jhydrol.2007.10.013
Hanson, P. J., Todd, D. E., Huston, M. A., Joslin, J. D., Croker, J. L., and Augé, R. M. (1998). Description and Field Performance of the Walker Branch Throughfall Displacement Experiment: 1993–1996 (No. ORNL/TM-13586). Oak Ridge National Lab., Environmental Sciences Div., Tennessee, United States.
Harper, R. J., and Tibbett, M. (2013). The hidden organic carbon in deep mineral soils. Plant Soil 368, 641–648. doi: 10.1007/s11104-013-1600-9
Jian, S., Zhao, C., Fang, S., and Yu, K. (2014). Characteristics of Caragana korshinskii and Hippophae rhamnoides stemflow and their significance in soil moisture enhancement in Loess Plateau, China. J. Arid Land 6, 105–116. doi: 10.1007/s40333-013-0189-4
Jokela, E. J., Allen, H. L., and McFee, W. W. (1991). Fertilization of southern pines at establishment. For. Regen. Man. 36, 263–277. doi: 10.1007/978-94-011-3800-0_14
Kunkel, K. E., Stevens, L. E., Stevens, S. E., Sun, L., Janssen, E., Wuebbles, D., et al. (2013). Regional Climate Trends and Scenarios for the U.S. National Climate Assessment: Part 2. Climate of the Southeast U.S. NOAA Technical Report 142-2, National Oceanic and Atmospheric Administration, National Environmental Satellite, Data, and Information Service, Washington DC.
Kyle, K. H., Andrews, L. J., Fox, T. R., Aust, W. M., Burger, J. A., and Hansen, G. H. (2005). Long-term effects of drainage, bedding, and fertilization on growth of loblolly pine (Pinus taeda L.) in the coastal plain of Virginia. South. J. Appl. For. 29, 205–214. doi: 10.1093/sjaf/29.4.205
Leuning, R., Cleugh, H. A., Zegelin, S. J., and Hughes, D. (2005). Carbon and water fluxes over a temperate Eucalyptus forest and a tropical wet/dry savanna in Australia: measurements and comparison with MODIS remote sensing estimates. Agric. For. Meteorol. 129, 151–173. doi: 10.1016/j.agrformet.2004.12.004
Levia, D. F., and Germer, S. (2015). A review of stemflow generation dynamics and stemflow-environment interactions in forests and shrublands. Rev. Geophys. 53, 673–714. doi: 10.1002/2015RG000479
Maeght, J. L., Rewald, B., and Pierret, A. (2013). How to study deep roots - and why it matters. Front. Plant Sci. 4, 1–14. doi: 10.3389/fpls.2013.00299
Maggard, A. O., Will, R. E., Wilson, D. S., Meek, C. R., and Vogel, J. G. (2016). Fertilization reduced stomatal conductance but not photosynthesis of Pinus taeda which compensated for lower water availability in regards to growth. For. Ecol. Manag. 381, 37–47. doi: 10.1016/j.foreco.2016.08.046
Maggard, A. O., Will, R. E., Wilson, D. S., Meek, C. R., and Vogel, J. G. (2017). Fertilization can compensate for decreased water availability by increasing the efficiency of stem volume production per unit of leaf area for loblolly pine (Pinus taeda) stands. Can. J. For. Res. 47, 445–457. doi: 10.1139/cjfr-2016-0422
Markewitz, D., Devine, S., Davidson, E. A., Brando, P., and Nepstad, D. C. (2010). Soil moisture depletion under simulated drought in the Amazon: impacts on deep root uptake. New Phytol. 187, 592–607. doi: 10.1111/j.1469-8137.2010.03391.x
McNulty, S. G., Vose, J. M., and Swank, W. T. (1996). Loblolly pine hydrology and productivity across the southern United States. For. Ecol. Manag. 86, 241–251. doi: 10.1016/S0378-1127(96)03744-9
Meehl, G. A., Tebaldi, C., Teng, H., and Peterson, T. C. (2007). Current future U.S. weather extremes El Nino. Geophys. Res. Lett. 34. doi: 10.1029/2007GL031027
Nepstad, D. C., Decarvalho, C. R., Davidson, E. A., Jipp, P. H., Lefebvre, P. A., Negreiros, G. H., et al. (1994). The role of deep roots in the hydrological and carbon cycles of Amazonian forests and pastures. Nature 372, 666–669. doi: 10.1038/372666a0
Nepstad, D. C., Moutinho, P., Dias-Filho, M. B., Davidson, E. A., Cardinot, G., Markewitz, D., et al. (2002). The effects of rainfall exclusion on canopy processes and biogeochemistry of an Amazon forest. J. Geophys. Res. 107, 53-1–53-18. doi: 10.1029/2001JD000360
Padilla, F. M., and Pugnaire, F. I. (2007). Rooting depth and soil moisture control Mediterranean woody seedling survival during drought. Funct. Ecol. 21, 489–495. doi: 10.1111/j.1365-2435.2007.01267.x
Qi, J., Markewitz, D., Foroughi, M., Jokela, E., Strahm, B., and Vogel, J. (2018b). Drying-wetting cycles: effect on deep soil carbon. Soil Syst. 2:3. doi: 10.3390/soils2010003
Qi, J, Markewitz, D., and Radcliffe, D. (2018a). Modelling the effect of changing precipitation inputs on deep soil water utilization. Hydrol. Processes 32, 672–686. doi: 10.1002/hyp.11452
Radcliffe, D. E., and Šimunek, J. (2010). Soil Physics With HYDRUS: Modeling and Applications. Boca Raton, FL: CRC Press.
Samuelson, L. J., Kane, M. B., Markewitz, D., Teskey, R. O., Akers, M. K., Stokes, T. A., et al. (2018). Fertilization increased leaf water use efficiency and growth of Pinus taeda subjected to five years of throughfall reduction. Can. J. For. Res. 48, 227–236. doi: 10.1139/cjfr-2017-0357
Samuelson, L. J., Pell, C. J., Stokes, T. A., Bartkowiak, S. M., Akers, M. K., Kane, M., et al. (2014). Two-year throughfall and fertilization effects on leaf physiology and growth of loblolly pine in the Georgia Piedmont. For. Ecol. Manag. 330, 29–37. doi: 10.1016/j.foreco.2014.06.030
Schenk, H. J., and Jackson, R. B. (2002). The global biogeography of roots. Ecol. Monographs 72, 311–328. doi: 10.1890/0012-9615(2002)072[0311:TGBOR]2.0.CO;2
Schwärzel, K., Ebermann, S., and Schalling, N. (2012). Evidence of double-funneling effect of beech trees by visualization of flow pathways using dye tracer. J. Hydrol. 470, 184–192. doi: 10.1016/j.jhydrol.2012.08.048
Sun, G. (2013). “Impacts of climate change and variability on water resources in the Southeast USA,” in Climate of the Southeast United States: Variability, Change, Impacts, and Vulnerability, eds K. T. Ingram, K. Dow, L. Carter, and J. Anderson (Washington, DC: Island Press/Center for Resource Economics, 210–236.
Sun, G., and Liu, Y. (2013). “Forest influences on climate and water resources at the landscape to regional scale,” in Landscape Ecology for Sustainable Environment and Culture (Dordrecht: Springer), 309–334.
Swank, W. T. (1972). Interception loss in loblolly pine stands of the South Carolina Piedmont. J. Soil Water Conserv. 27, 160–164.
Tang, Z. M., Sayer, M. A., Chambers, J. L., and Barnett, J. P. (2004). Interactive effects of fertilization and throughfall exclusion on the physiological responses and whole-tree carbon uptake of mature loblolly pine. Can. J. Bot. Rev. 82, 850–861. doi: 10.1139/b04-064
Teskey, R. O., and Sheriff, D. W. (1996). Water use by Pinus radiata trees in a plantation. Tree Physiol. 16, 273–279. doi: 10.1093/treephys/16.1-2.273
Thomas, G. W. (1996). “Soil pH and soil acidity,” Methods of Soil Analysis Part 3: Chemical Methods, SSSA Book Series 5, ed Sparks, D. L. (Madison, WI: Soil Science Society of America), 475–490.
Torreano, S. J., and Morris, L. A. (1998). Loblolly pine root growth and distribution under water stress. Soil Sci. Soc. Am. J. 62, 818–827. doi: 10.2136/sssaj1998.03615995006200030040x
Van Genuchten, M. T. (1980). A closed form equation for predicting the hydraulic conductivity of unsaturated soils. Soil Sci. Soc. Am. J. 44, 892–898. doi: 10.2136/sssaj1980.03615995004400050002x
Walsh, J., Wuebbles, D., Hayhoe, K., Kossin, J., Kunkel, K., Stephens, G., et al. (2014). “Ch. 2: Our changing climate” in Climate Change Impacts in the United States: The Third National Climate Assessment, J. M. Melillo, T. C. Richmond, and G. W. Yohe (Washington, DC: U.S. Global Change Research Program, 19–67.
Ward, E. J. J., Domec, C., Laviner, M. A., Fox, T. R., Sun, G., McNulty, S., King, J., et al. (2015). Fertilization intensifies drought stress: water use and stomatal conductance of Pinus taeda in a midrotation fertilization and throughfall reduction experiment. For. Ecol. Manag. 355, 72–82. doi: 10.1016/j.foreco.2015.04.009
Wertin, T. M., McGuire, M. A., and Teskey, R. O. (2010). The influence of elevated temperature, elevated atmospheric CO2 concentration and water stress on net photosynthesis of loblolly pine (Pinus taeda L.) at northern, central and southern sites in its native range. Glob. Change Biol. 16, 2089–2103. doi: 10.1111/j.1365-2486.2009.02053.x
Wightman, M. G., Martin, T. A., Gonzalez-Benecke, C. A., Jokela, E. J., Cropper, W. P., and Ward, E. J. Jr. (2016). Loblolly pine productivity and water relations in response to throughfall reduction and fertilizer application on a poorly drained site in Northern Florida. Forests 7:214. doi: 10.3390/f7100214
Will, R. E., Fox, T., Akers, M., Domec, J. C., Gonzalez-Benecke, C., Jokela, E. J., et al. (2015). A range-wide experiment to investigate nutrient and soil moisture interactions in loblolly pine plantations. Forests 6, 2014–2028. doi: 10.3390/f6062014
Zarnoch, S. J., Abrahamson, D. A., and Dougherty, P. M. (2002). “Sampling throughfall and stemflow in young loblolly pine plantations,” Research Paper SRS-27. Asheville, NC: US Department of Agriculture, Forest Service, Southern Research Station, 6.
Keywords: deep soil, soil moisture, drought, fertilization, loblolly pine
Citation: Qi J, Markewitz D, McGuire MA, Samuelson L and Ward E (2020) Throughfall Reduction × Fertilization: Deep Soil Water Usage in a Clay Rich Ultisol Under Loblolly Pine in the Southeast USA. Front. For. Glob. Change 2:93. doi: 10.3389/ffgc.2019.00093
Received: 30 July 2019; Accepted: 23 December 2019;
Published: 31 January 2020.
Edited by:
Christina Tague, University of California, Santa Barbara, United StatesReviewed by:
John T. Van Stan, Georgia Southern University, United StatesCate Macinnis-Ng, The University of Auckland, New Zealand
Copyright © 2020 Qi, Markewitz, McGuire, Samuelson and Ward. This is an open-access article distributed under the terms of the Creative Commons Attribution License (CC BY). The use, distribution or reproduction in other forums is permitted, provided the original author(s) and the copyright owner(s) are credited and that the original publication in this journal is cited, in accordance with accepted academic practice. No use, distribution or reproduction is permitted which does not comply with these terms.
*Correspondence: Ji Qi, amlsbC5xaUBzd2Z3bWQuc3RhdGUuZmwudXM=