 Anni Vanhatalo1
 Juho Aalto2,3
 Tommy Chan1,2
 Teemu Hölttä1
 Pasi Kolari2Kaisa Rissanen1Kourosh Kabiri1
 Heidi Hellén4
 Jaana Bäck1*
- 1Institute for Atmospheric and Earth System Sciences INAR/Forest Sciences, University of Helsinki, Helsinki, Finland
- 2Institute for Atmospheric and Earth System Sciences INAR/Physics, University of Helsinki, Helsinki, Finland
- 3SMEAR II, Hyytiälä Forestry Field Station, University of Helsinki, Helsinki, Finland
- 4Atmospheric Composition Research, Finnish Meteorological Institute, Helsinki, Finland
The volatile organic compound (VOC) fluxes of living plant compartments other than foliage are poorly known. In this paper we describe for the first time the methanol and monoterpene fluxes from living Scots pine stems in situ, over 4 years at the SMEAR II station in southern Finland. The VOC fluxes from stems were measured online with an automated chamber measurement system. Both methanol and monoterpene emissions showed strong diurnal and seasonal cycles. Methanol emission rates were highest in mid-summer, and coincided with the most intensive period of stem radial growth. Methanol emission rates correlated moderately with the xylem sap flow rate and foliage transpiration rate, which suggests that many simultaneous and overlapping processes are related to methanol transport and production in trees. Monoterpene emissions from stems were highest on the hottest summer days, but also substantial in winter during times when the temperature was above zero °C for several days. Overall, the emissions from stems constitute about 2% of the whole stand monoterpene emissions under normal, non-stressed conditions. This can be used in stand monoterpene emission models as the rough estimate of woody compartment contribution.
Introduction
Boreal forests comprise one-third of the global forest area. They are dominated by coniferous, evergreen tree species such as Pinus, Picea, Abies, and Larix with large woody stems. Woody biomass dominates in boreal forest stands over the needle biomass (e.g., Ilvesniemi et al., 2009). In a 15-year-old Scots pine stand, for example, stem wood, living and dead bark and living and dead branches together comprise 65% of the total ecosystem biomass (Helmisaari et al., 2002). Correspondingly, needles comprise only 9% of the biomass. As the forest ages, the proportion of woody tissues further increases: in a 100-year-old Scots pine forest, the proportions of the total ecosystem biomass in stems and foliage are 82 and 4%, respectively (Helmisaari et al., 2002). In Finland, the total growing stock (standing stem biomass) of the boreal forests constitutes up to 2.4 billion m3 (Peltola, 2014), of which Scots pine comprises about half.
Tree stems provide support and conductive tissues for the tree. In addition to these structural features, conifer stems are important in possessing large storages of defense compounds, mainly consisting of a complex mixture of resins that are located in specialized resin canals or ducts (e.g., Phillips and Croteau, 1999; Trapp and Croteau, 2001; Rissanen et al., 2016). One of the main defense mechanisms of conifers against herbivores and pathogens relies on volatile organic compounds (VOC), especially terpenoids in resins (Phillips and Croteau, 1999). Resins are present in both needles and woody tree tissues in ample amounts. As a rough calculation, the amount of resin in a 20-m Scots pine stem is ~3 kg, estimated from the monoterpene concentration of dry Scots pine stem wood (0.6%), and in the resin (30%) (Strömvall and Petersson, 2000). The resin amount per tree is, however, markedly higher, because needles, twigs, bark, and roots have a higher resin content than stem wood (Strömvall and Petersson, 2000). Back (2000) observed no seasonal changes in the resin content of stem resin ducts. The resin is under pressure in the ducts, and the resin pressure varies diurnally and over the growing season (Rissanen et al., 2019).
Although the volatile terpenoids form major components in resin, there has been a clear lack of knowledge concerning VOC emissions from other tree parts than foliage. Previously, there have been only few studies on VOC emissions from the woody parts of trees (e.g., Rhoades, 1990; Heijari et al., 2011; Kivimäenpää et al., 2012; Vanhatalo et al., 2015). However, emission measurements from living shoots using shoot enclosures always include emissions from some woody tissues, which contribute to both the emission rates and possibly also to the detected VOC mixtures. This may have led to an overestimation of emission rates, as they are usually reported on an enclosed leaf area or leaf mass basis, while ignoring woody tissues. In addition, part of the water-soluble VOCs emitted from foliage may have actually been produced in the woody parts (Rissanen et al., 2018), as they may have been carried to the foliage dissolved in the xylem sap in a similar way as CO2 is transported in transpiration flow (e.g., Teskey et al., 2008; Hölttä and Kolari, 2009; Bloemen et al., 2013).
In this article, we present the first multi-annual time series of pine stem VOC flux data from a boreal Scots pine forest in Finland, and discuss the factors affecting these fluxes over 4 years under field conditions. We focused on monoterpenes and methanol. Since the pine stems are rich in resins, we hypothesized that the VOC emissions from Scots pine woody compartments are significant. Based on the previous knowledge on tree branch emissions, we also anticipated that stem emissions would show considerable diurnal and seasonal variation, as well as intra-tree variation.
Materials and Methods
Measurement Site
All measurements were performed at the SMEAR II (Station for Measuring Forest Ecosystem–Atmosphere Relations, 61°51′N, 24°17′E) stand (Hari and Kulmala, 2005). The stand is dominated by >50-year-old Scots pine (Pinus sylvestris L.) trees with a mixture and undergrowth of Norway spruce [Picea abies (L.) Karst.] and deciduous tree species. There is a rather thin layer (on average only 0.5 m) of haplic podzol on top of the bedrock. The ground is mainly covered with dwarf shrubs (Vaccinium spp.) and mosses (Pleurozium spp., Dicranum spp.). The dominating trees are about 20 m high, and some stems and canopies are accessible with scaffolding towers. In 2011, the average height of Scots pine in the stand was 17.1 m and the average diameter at breast height 17.8 cm, while the total basal area of the stand was 25 m2 ha−1.
The mean annual air temperature at the site is 3.5°C, the mean air temperatures in January and July being −7.2 and 16.0°C, respectively (Pirinen et al., 2012). The growing season, defined as the period with daily mean air temperatures continuously exceeding 5°C, ranges from the end of April until mid-October. Annual precipitation is 711 mm, with highest monthly precipitation in July and August (Pirinen et al., 2012).
Enclosure Measurements
VOC emissions were measured with purpose-built dynamic enclosure systems (Figure 1). There were six stem enclosures and one branch enclosure on pine trees, and they were installed on three different pines in total. The stem and branch enclosure setup and tree parameters are presented in Table 1. The stem enclosures included a part of the stem (15–25 cm in length), whereas the branch enclosure included ca. 20 cm of an upper-canopy branch. The branch enclosure was installed on the 12th whorl from the treetop in spring 2012, at the distance of 55 cm from the stem where the enclosed branch section was about 11 years old. There were no needles inside the branch enclosure. In addition, a shoot enclosure with both the needles and wooden twig was installed at a branch tip in the uppermost whorls.
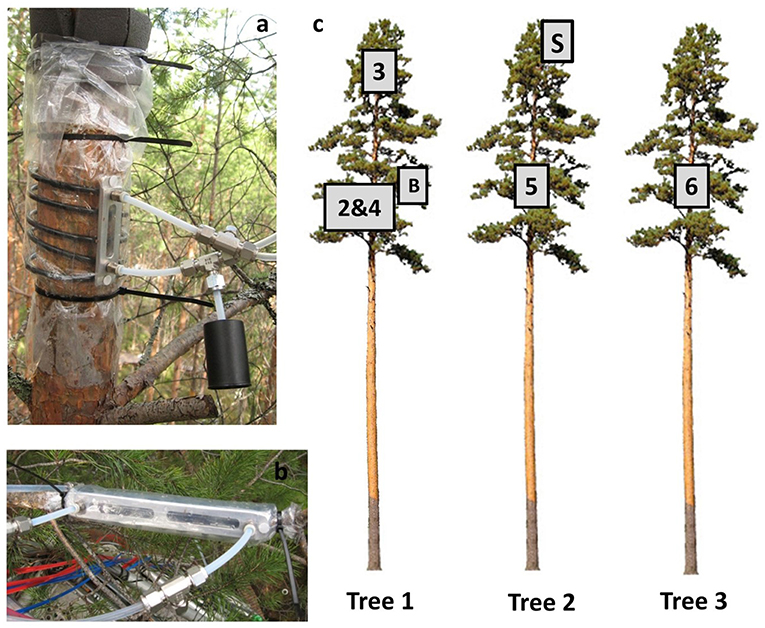
Figure 1. Stem enclosure 2 (a) and branch enclosure (b) on tree #1. Supply air enters the stem enclosure via the lower tube fitting, and sample air exits via the upper one. The overflow due to slight overpressure of the enclosure exits via a T-piece of the sample tube. (c) Shows the approximate positions of the enclosures on sampled trees. The numbers refer to those introduced in Table 1, B refers to the branch enclosure and S to the shoot enclosure.
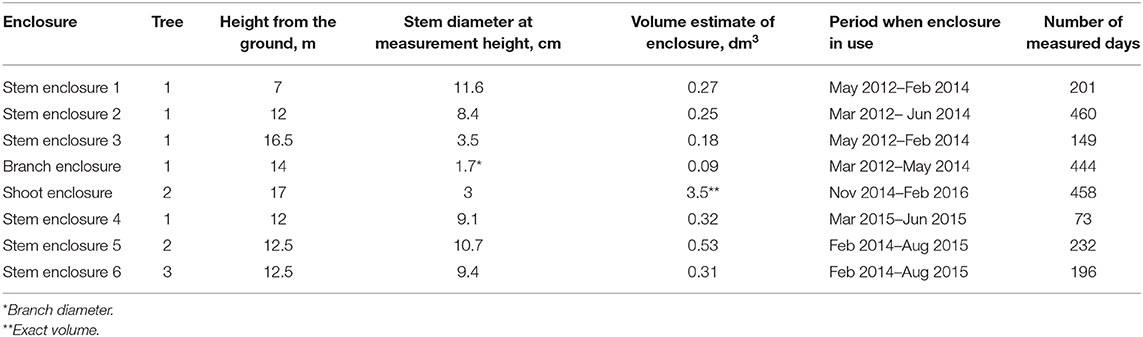
Table 1. The measurement enclosure setup.
The first stem enclosure and branch enclosure were installed on the same tree in March 2012. Later in the same spring, two more stem enclosures were installed on the same tree. They remained there until spring 2014, after which two stem enclosures were removed and two new enclosures were installed on two adjacent pines. The tree that was measured first was fitted with one additional stem enclosure in spring 2015.
Although each of the enclosures was tailored to its location on the tree, the construction of the enclosures was similar in all setups: the enclosure walls were made of transparent fluorinated ethylene propylene (FEP) foil (0.05 mm thick, Fluorplast, Maalahti, Finland) wrapped around the stem 2–3 times and tightened with binds on both ends. The vertical seal of the foil was made with FEP tape, which has silicone adhesive. A spiral of polyethylene-coated aluminum tube (Synflex, Eaton, USA) was wrapped around the stem to maintain an air space between the foil and the bark. An FEP tape-covered aluminum brace for inlet and outlet connectors was placed between the spiral and the foil to enable airtight connections to the tubing. An inlet tube was connected to the lower part of the aluminum brace to supply air into the enclosure. From the enclosure, the sample air was sucked along an FEP tube (length 64–73 m, inner diameter 4 mm) to the measurement station, where all the analysers were situated. The total sample flow rate was about 1.1 l min−1. Substituting air flow to the chambers was applied during samplings to avoid vacuum conditions inside the chambers. The air flow into the enclosure was higher than the sampled air flow (about 2 l min−1 of ambient air mixed from within- and above-canopy inlets), so that the extra air escaped, either from the overflow T-piece in the tube, or from the ends of the enclosure. Simultaneously the mixing caused by the circulating air also reduced the temperature increase during measurement. Between samplings the enclosures and sample tubes were continuously flushed with ambient air (0.3–0.5 l min−1 flow rate) to prevent CO2, H2O, and VOC accumulation. The CO2, H2O, and VOC concentrations in the substituting air were measured immediately before sampling from stem and branch enclosures. Sample flow was controlled with a mass flow controller (Brooks Instrument model 5850E, Brooks Instrument, Hatfield, Pennsylvania, USA) while the flushing flows were controlled with rotameters (Kytola Instruments, model BA-4AR, Kytola Instruments, Muurame, Finland). Both the sample and supply air tubes were heated a few degrees above ambient temperature to prevent H2O condensation on the inner surfaces.
All the inner surfaces of the system that were in contact with the sample air, except the spiral tube, were composed of FEP, PTFE (polytetrafluoroethylene), or stainless steel. These materials are commonly used in VOC measurements, as they are rather inert to most VOCs (Ortega and Helmig, 2008; Niinemets et al., 2011). In addition, they are not permeable to these gases or to CO2 or H2O. The material of the spiral tubes (Synflex) was tested and showed negligible emissions or deposition of the studied gas. In case of the compounds reported in this study, the effect of Synflex tube was >10%. Compounds having high atomic mass, such as monoterpenes, tend to show mild buffering effect immediately when in contact with Synflex, but the effect typically disappeared within couple of minutes.
The air temperatures inside the enclosures were recorded with copper-constantan thermocouples from three stem enclosures (1, 5, and 6). The ambient temperature was measured above tree canopy height with a platinum resistance thermometer (PT-100), which was protected from direct solar radiation. In general, ambient air temperature and the air temperature in the enclosures were very close to each other. The difference was largest (up to 6°C) in cases when ambient air temperature changed rapidly or when direct irradiation was pointing to the enclosure. However, the temperature difference in ambient and enclosure air was mostly >2°C (see Supplementary Figure 1).
The above-described enclosure system was utilized in the continuous gas exchange monitoring of the trees (Kolari et al., 2009). The system included a CO2 and H2O analyser (until spring 2013, URAS 4, Hartmann & Braun, Frankfurt am Main, Germany; from 2013 onwards, LI-840A, LI-COR Inc., Lincoln, NE, USA) to measure respiration and transpiration, respectively, and a VOC analyser (see below).
Online PTR-MS Sampling
The VOC measurements were conducted online with a proton transfer reaction-quadrupole mass spectrometer (PTR-Q-MS, Ionicon, Innsbruck, Austria; Hansel et al., 1995) coupled with the gas exchange measurement system described above and in more detail by Ruuskanen et al. (2005) and Aalto et al. (2014). A detailed description of the VOC measurement system and its accuracy evaluation can be found in Kolari et al. (2012). The inlet flow of the analyser was ~0.08 l min−1. During the study period signals at 8–10 different molecular masses were detected, among them methanol (m/z 33) and monoterpenes (m/z 137). Integration time for each molecular mass was 1 s, and time resolution in concentration measurement 9.5–12.5 s. The lower limit of detection depends on measured molecular mass [10−300 ppbv, Taipale et al. (2008)], but is significantly lower than the concentrations measured from enclosure headspace. Based on the assumption on 2σ total uncertainty in PTR-Q-MS concentration measurement, the average lower detection limit for monoterpene flux is 0.28 ng m−2 s−1, and for methanol ca 0.50 ng m−2 s−1. The drift tube pressure was adjusted so that it was mostly slightly above 2 mbar. The primary ion (H3O+) signal was above 1 × 10⁷ cps, typically 1.5–2.5 × 10⁷ cps. The proportion of O2+ impurity ions was mostly below 3 %. The calibration of the analyser was conducted 2–3 times a month according to the method described in Taipale et al. (2008). The calibration gas standard (Apel-Riemer Environmental Inc., USA) consisted of several compounds, including methanol and α-pinene as a representative of monoterpenes. The standard gas was diluted with zero air (produced by a ChromGas zero air generator, model 3501, Parker, Cleveland, USA).
The gas exchange rate calculation was based on a mass balance equation (Kolari et al., 2012). Under constant conditions concentrations inside chamber are in steady state before closure ends, and flux rate is solved based on sample flow rate and the concentration difference between chamber headspace and substituting air flow. There were ~24–32 measurement points per stem enclosure per day, more in winter than in summer (due to other co-occurring measurements and thus limited access to analyser lines in summertime). The occasional periods without any data were due to system maintenance or instrument malfunction.
To remove the effect of temperature on monoterpene emission rates, temperature normalization based on exponential relationship between air temperature, and recorded emission rate was applied (Guenther et al., 1993), with standard temperature 30°C and temperature sensitivity β = 0.09°C−1. Temperature normalization was applied on a monthly basis by using non-linear regression fitted with iterative least squares estimation (Matlab function nlinfit which returns also 95% confidence intervals; The MathWorks, Inc., MA, USA). Same approach was also used to illustrate the temperature dependency in monoterpene emission rates of each of the enclosures. In that case the standard emission rates were solved for the full datasets of each of the enclosures.
Other Stem Measurements
In order to connect the emissions to general tree physiological features, we measured the stem diameter changes and xylem sap flow of the pine trees. The diurnal patterns in stem radius of all trees studied were measured with linear variable displacement transducers (point dendrometers) (LVDT, model AX/5.0/S, Solartron Inc. West Sussex, UK). There were two sensors at each point on the stem: one resting against the inner bark after the outer bark had been manually removed carefully with a knife, and the other resting on a screw, which had been inserted 10 mm through the bark surface onto the xylem (see e.g., Sevanto et al., 2002 for details). Thus, the first-mentioned dendrometer measured the changes of the whole stem radial (lateral) thickness. The inner-bark thickness was calculated as the difference between the whole stem and the xylem thickness values. The distance between the sensors was about 30 mm. The sensors were installed within the living canopy >1 m from stem enclosures 2, 4, and 5.
The radial growth of the stems was modeled as described in Chan et al. (2016). Briefly, a simple hydraulic model was used to separate the water-induced signal in the inner-bark radius values from the signals caused by the growth and osmotic concentration changes. The radial changes and modeled growth increments were handled as half-hourly values in further analysis.
Xylem sap flow was measured using a Granier-type heat dissipation method (e.g., Granier, 1987). In this study, the sap flow measurement of tree #2 was utilized. The two probes for measuring the flow were installed in the stem xylem within the living canopy close to stem enclosure 5, in a similar way to Vanhatalo et al. (2015).
Parameter Estimations for Upscaling
The flux rates are given per unit of smooth bark area (ng m−2 s−1), which was calculated as the surface of a cylinder. In reality, pine bark has numerous fissures that would increase the surface area, but this area is difficult to quantify accurately. Moreover, the stem taper is negligible over the length of the enclosure, and so it was ignored.
To upscale the stem fluxes, we estimated the stem areas by using detailed sampling of separate trees in the same stand (Kabiri et al., in review). The stem area of a similar-sized pine to tree #1 was determined with below-bark diameter measurements at 48 inter-whorl heights along the stem. These measurements revealed that approximately half of the total stem area of a tree similar in size to tree #1 (~18.6 m) is below the height of 7 m, where our lowest sampling point for emissions was located. Below this height and toward the stem base, the bark becomes thicker and has more fissures. The total stem area was calculated to be 7.5 m2. This figure, however, lacks the area of branches. The LIGNUM tree architecture model (first introduced by Perttunen et al., 1996) gives a total area of 13.5 m2 for the stem and all living branches for a pine with similar dimensions. Although two different methods were used, the stem area estimates are of similar magnitude. As the density of our experimental site is about 680 trees ha−1, the estimated average total bark area of tree stems and branches is 0.8 m2 m−2 ground area. The leaf area index at the site is 3.5 m2 m−2 (Ilvesniemi et al., 2009).
Statistical Analysis
The PTR-MS data was averaged to daily means, each enclosure separately. In the case of the diurnal and annual cycles, median in together with upper and lower quartiles were applied.
To clarify the relationship between the emissions measured with stem enclosures and other stem variables, we used the tree #2 data in 2015. As the recording intervals varied between different measurements, the observations were paired to enable the calculation of Pearson's correlation coefficient. The closest observations were used in calculations, the maximum difference in timing was ca. 15 min. The correlations were calculated separately for different periods defined by tree phenology. These periods were the whole summer season (1 April−31 August), the period preceding stem tracheid growth (1 April−21 May), the tracheid enlarging period (22 May−20 August), and the period with most intensive tracheid enlarging (1–7 July). The growth phases and their timings were modeled in a similar way as presented in Schiestl-Aalto et al. (2015).
Results
Monoterpenes
Monoterpene fluxes (m/z 137 in PTR-MS data) from stems were measured continuously year-round throughout the seasons (Figure 2), and they showed clear seasonal variations. Generally, emissions were highest in the spring and summer seasons (in April–August, monthly mean emission rates were 1.6–2.4 ng m−2 s−1) and lowest in the winter (October–February, 0.3–0.7 ng m−2 s−1). However, in sunny and warm spells (>0°C) during winter months, stem monoterpene emission were also considerable, up to a similar magnitude as recorded on sunny summer days. For example, during mid-March 2015, when day temperatures were between 5 and 10°C and night temperatures were only slightly below zero, a peak in the midst of low winter monoterpene emissions was recorded (Figure 3A, daytime maximum emission rates 5–12 ng m−2 s−1). If the daily average air temperature was below 0°C and the stem was frozen, the emission rate was negligible (Figure 4A). In general, monoterpene emission rates were following the temperature exponentially, especially in summery conditions (between 5 and 30°C, Figure 5). The large deviations from the exponential relation (vertical cluster at 0–10°C in Figure 5) in spring were related to spring recovery processes and are discussed in detail in Vanhatalo et al. (2015). The highest temperature normalized (i.e., standard) emission rates were detected in late winter or during spring months (Figure 2).
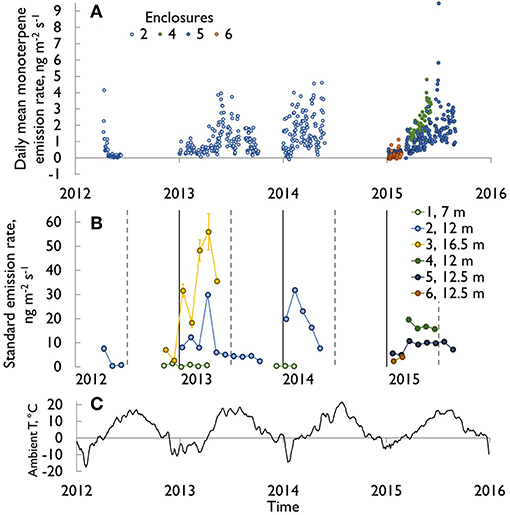
Figure 2. (A) Monoterpene emission rates (diurnal means, ng m−2 s−1) of within-canopy stem enclosures at a height of about 12 m in all studied trees during the measurement period 2012–2015. (B) The corresponding standardized monoterpene emissions (ng m−2 s−1) and their 95% confidence intervals (calculated according to Guenther et al. (1993) with Ts = 30°C and β = 0.09 K−1). Vertical solid lines indicate 1st January and dashed lines 1st July. The spring 2012 emission peak, reaching 40 ng m−2 s−1, is excluded (see Vanhatalo et al., 2015). (C) Ambient temperatures at SMEAR II station 2012–2016, 14 days running average.
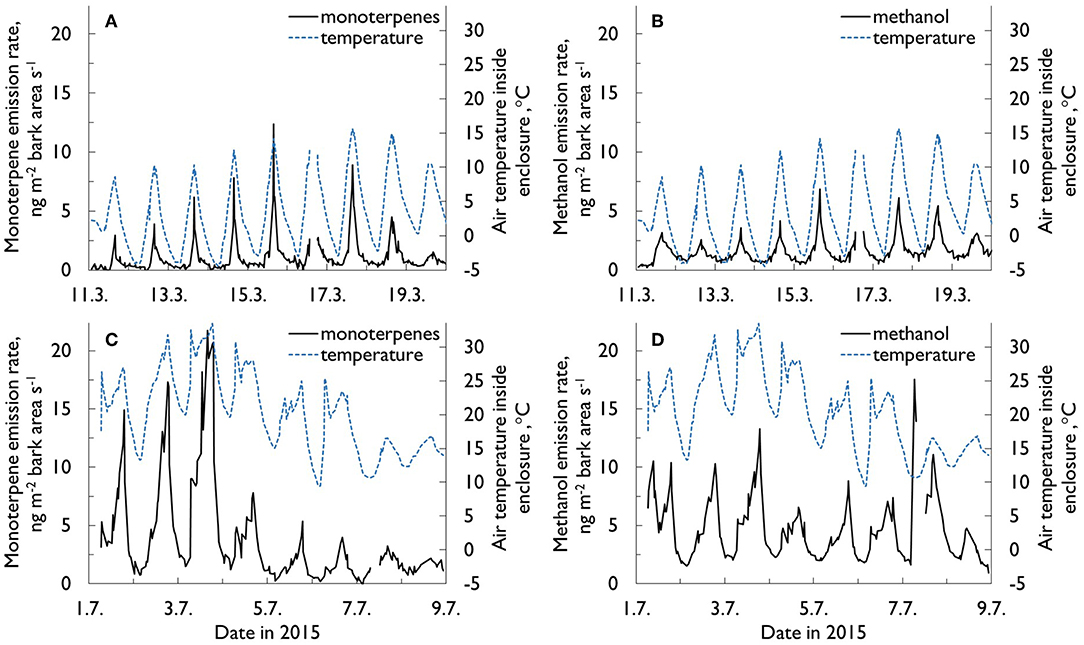
Figure 3. The monoterpene (A,C) and methanol (B,D) emission rates (ng m−2 s−1) and air temperature (°C) inside the enclosure from within-canopy stem enclosure (# 5 at 12 m) (A,C) during an exceptionally warm period in March 2015, and (B,D) a “normal” summer period in July 2015. On average, daily maximum and minimum temperatures at the site in March are 0.8°C and −7.5°C, respectively. The corresponding July temperatures are 21.6 and 10.8°C (Pirinen et al., 2012).
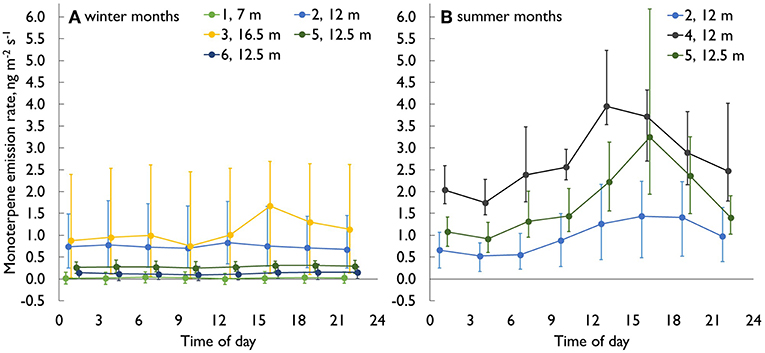
Figure 4. The diurnal monoterpene emission dynamics (median, 25 and 75% percentiles) in Scots pine stem enclosures. (A) Winter months (Dec–Feb), (B) summer months (Jun–Aug). Colors indicate different chambers at different heights, chamber numbering (see Figure 1).
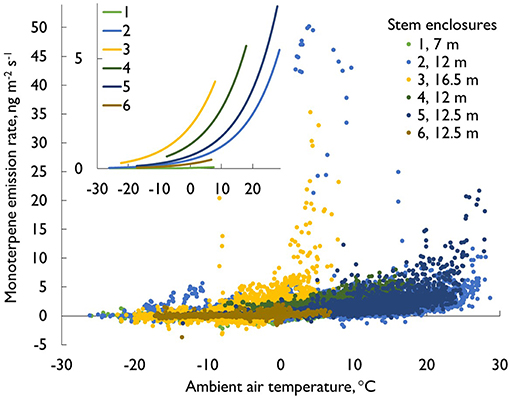
Figure 5. The monoterpene emission rates (ng m−2 s−1) from pine stems as a function of the ambient air temperature. The data originate from all six stem enclosures and cover all seasons (26 429 measurement points in total, April 2012–August 2015). The insert gives the exponential lines for each enclosure separately.
Monoterpene emission rates showed a clear diurnal cycle especially in summer (Figures 3C, 4B), with typical maxima during the afternoons and minima during the nights. The cycle followed the ambient air temperature, usually with a short time lag. The lag differed between different heights of the stem, probably due to varying stem diameter, bark thickness and the shading of the canopy. However, the relation between monoterpene emissions and temperature was complex. In some cases, the highest daily monoterpene emission rates were recorded when the temperature inside the enclosure was at its highest, whereas sometimes the temperature peaked in the early afternoon or even before noon, but the highest monoterpene emission rates were recorded only after 6 PM.
Considerable within-tree variation was recorded for monoterpenes (Figure 6). The highest emission rates calculated based on stem area were measured close to the treetop, and the emission rates decreased toward the base of the tree, being lowest in the below-canopy enclosure. For the stem enclosure inside the canopy, the emissions were between these two. In cases when the top canopy was in full irradiation in mid-winter, monoterpene emissions from the uppermost enclosures almost doubled compared to low irradiation cases, whereas same effect was not seen in case of lower parts of stem. This likely resulted from the bark surface temperature being well above air temperature at the top of the tree, while the lower stem was still shaded and frozen.
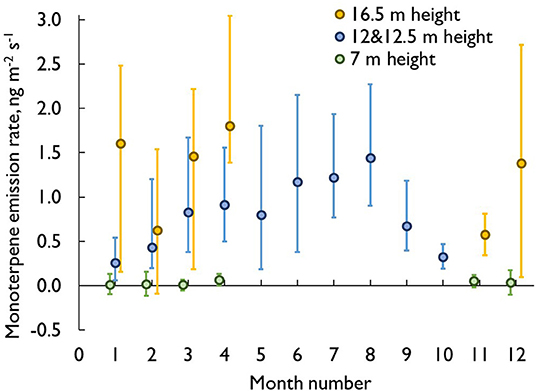
Figure 6. The monthly pattern of the vertical profile in monoterpene emission rates (ng m−2 s−1). The values are monthly medians and quartiles.
In addition to the area-based values, the emission rates were also estimated in relation to the woody biomass enclosed. The calculation was performed using the enclosure dimensions and an estimated stem density of 400 kg m−3 throughout the stem (e.g., Fries and Ericsson, 2009). The approximate biomasses (dry weight) per enclosure varied between 28 g (branch enclosure) and 1,200 g, but were mostly ca. 500 g. The ratio between enclosed biomass to enclosed surface area also varied tenfold in different parts of the stem (2.4–17.43 kg m−2). When monoterpene emissions were calculated for the stem biomass, the differences between heights decreased, but the uppermost enclosure still usually recorded the highest emission rates.
Methanol
Methanol (m/z 33 in PTR-MS data) is a water-soluble compound, which makes its continuous online measurements from biological sources rather challenging. As wet surfaces drastically affect methanol flux measurements (Laffineur et al., 2012), the methanol data presented here are limited to those cases when the relative humidity (RH) inside the enclosure was >70% once measurements had begun. The highest monthly methanol emission rates were recorded in July and August. This coincides with the stem radial growth period (Figure 7). In the winter, methanol fluxes were normally very low, but occasionally—coinciding with high monoterpene emissions—could be ca 50% of the summertime normal daily values (Figures 3B,D).
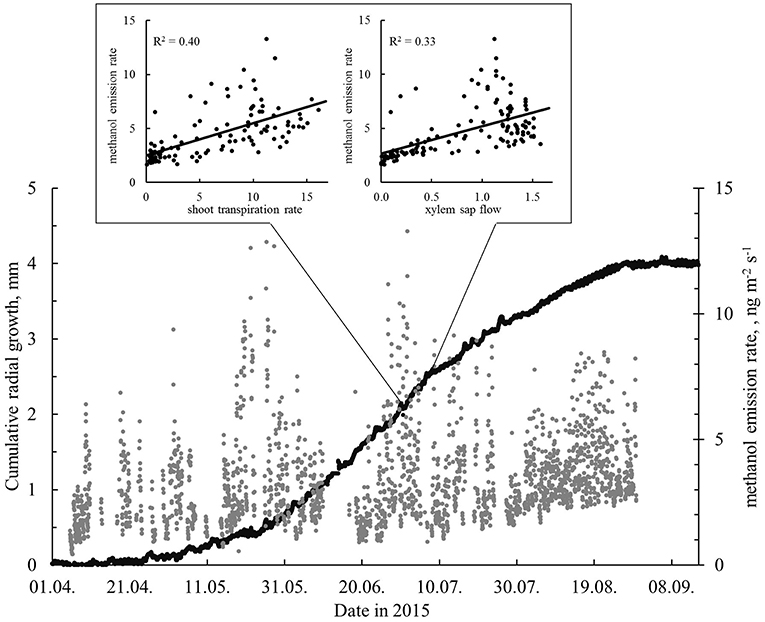
Figure 7. The cumulative modeled radial growth and methanol emission rates (ng m−2 s−1, stem enclosure 4, relative humidity of the air <70%) in April–September 2015. The inset shows the relationships between the shoot transpiration rate (mg m−2 s−1), xylem sap flow (l h−1), and the methanol emission rate (ng m−2 s−1) for the period 1–7 July with highest number of enlarging cells. All data were measured from the same tree (#2). The methanol data gap in mid-June is due to a malfunction of the measurement system.
The methanol emission rates from stems were positively correlated with the xylem sap flow rate and shoot transpiration rate in all the studied periods (correlation coefficients ranged from 0.50 to 0.61 and from 0.57 to 0.64, respectively). The highest observed correlation (0.64) was between the stem methanol emission rate and shoot transpiration rate during the most intensive growth from 1–7 July. The sap flow and shoot transpiration rates are closely linked, and the correlation coefficient between the two was 0.86 during the intensive growth period. The methanol emission rates from stems and stem radial growth rates showed only weak correlations: The correlations between methanol emission rates and xylem, inner bark and modeled radial growth for the period 1–7 July were only ranging between 0.05 and 0.19.
Emissions Based on Trunk Area
Tree dimension measurements at the same site (Kabiri et al., in review) revealed that approximately half of the total stem area of a tree similar in size to tree #1 (~18.6 m) is below the height of 7 m, where our lowest sampling point for emissions was located. Below this height and toward the stem base, the bark becomes thicker, and has more fissures. The vertical patterns of monoterpene emissions (Figure 6) clearly indicate that there is a difference of several orders of magnitude in emission rates between the lowest and highest measurement points especially in spring. As an example, during the first 2 weeks of April 2013, the mean monoterpene emission rates from the stem were 0.01, 0.5, 3.7 ng m−2 s−1 at the heights of 7, 12, and 16.5 m, respectively. Fitting a power function to the data produced Equation 1, from which the emission rates at each height could be estimated (R2 = 0.9986):
where Estem is the monoterpene emission rate (ng m−2 s−1) from stem at each height h (m).
Discussion
For the first time, VOC emissions from living tree stems were continuously measured in situ with a dynamic measurement system over several consecutive years. According to the results, stems contribute with a significant amount to the monoterpene flux at the stand level, and the stem emissions are characterized by notable temporal and spatial variability.
The stem monoterpene emission rates displayed clear diurnal patterns, which largely followed the diel cycles of temperature, as is expected from the temperature dependency of monoterpene emissions in many previous studies (Tingey et al., 1980; Juuti et al., 1990; Shao et al., 2001; Tarvainen et al., 2005; Ghirardo et al., 2010). However, a time lag between emission maxima and temperature maxima was observed, which probably reflects the slowness of the radial temperature propagation into the stem and the radial diffusion of the gases from the stem through the bark (e.g., Hölttä and Kolari, 2009). The time lag is expected to vary between different locations due to, e.g., differences in bark thickness as both thermal conduction and diffusion of gases would take longer time through a thicker bark (Rissanen et al., in review). In addition, the time lag could vary between days since both the thermal and molecular diffusion are dependent on stem and bark water content. Also direct sunlight on the stem could locally and transiently increase the stem temperature by many degrees and complicate the relation between ambient temperature and VOC emissions. The needle radii are much smaller in comparison to the stem, reducing the time lags due to both thermal and gas diffusion to a minimum, and this probably explains why needles react more rapidly to the changes. Even in full sunshine, one side of stem remains in full shade, and this is reflected in tissue temperatures.
The observed growing season monthly mean monoterpene emission rates (1.6–2.4 ng m−2 s−1) were in the same range as previously reported lower stem bark monoterpene emission rates in non-stressed conditions from mature Norway spruce (Ghimire et al., 2016) and Scots pine trees (Rissanen et al., 2016), while also considerably higher emissions have been reported e.g., from Maritime pine stems (up to 99 ng m−2 s−1; Staudt et al., 2019). Upscaling to the stand level and assuming that all stems would be of an equal size, the average monoterpene emission rate from pine stems was 6.8 mg ha−1 h−1. In comparison, the shoot monoterpene emission in the same period was on average 530 mg ha−1 h−1 (Aalto et al., 2015), and the ecosystem-level monoterpene flux about 400 mg ha−1 h−1 (Rantala et al., 2015). This comparison results in stem emissions estimates of ca. 1–2% of the stand total monoterpene emissions.
The monoterpene emission rates varied along the Scots pine stem, with the highest rates (on both a bark area and biomass basis) found in the uppermost canopy. This probably reflects the overall activity variation of the stem tissues. In the uppermost stem region, the bark is smooth, greenish and has numerous thin bark strips. Inside and below the canopy, the bark is orange or brown and has larger and loose bark strips. Under the loose strips, green inner-bark tissues (phloem) can be found. On the lower stem close to the ground, the outer bark is thick, gray and has numerous vertical cracks extending close to the inner bark.
Emission rates probably also reflect the tissue age: tissues in the upper canopy are relatively younger than those closer to the stem base. The nitrogen content of the stem increases strongly toward the upper canopy, indicating a larger proportion of living cells and higher metabolic activity there (Hölttä et al., 2013). Furthermore, there is no heartwood in the stem within the living canopy (Lintunen and Kalliokoski, 2010). At the very base of the stem, no enclosures were installed due to technical challenges, but it is likely that monoterpene emissions there are minimal due to the thick bark and relatively high proportion of heartwood. The very low monoterpene emissions from the branch were surprising, as thin branches experience recurrent bending, which might induce increased terpene synthesis and subsequent emissions. However, only one branch was measured in this study and thus definite conclusions cannot be drawn.
The origin of the compounds observed with the stem enclosures poses an interesting question. Monoterpenes probably originate from the stem section enclosed directly within the enclosure. Within the stem, large amounts of monoterpenes are stored in resin ducts and to a lesser extent in non-specific storage pools, such as cell membrane lipids. Trapp and Croteau (2001) stated that resin may flow several meters within conifer resin canals. However, this claim may hold up best when severe stem damage causes a massive resin outflow and induces the production of defense compounds. In normal, undamaged situations, viscous resin is unlikely to be transported along stem tissues, which implies that the monoterpenes observed from stem enclosures were probably synthesized and stored in the enclosed section of stem. Moreover, monoterpenes are rather water insoluble, but small amounts could possibly be transported in the xylem sap, similarly to the transportation of CO2 in xylem sap (e.g., Teskey et al., 2008; Bloemen et al., 2013).
The monoterpene emissions from the stem were rather small compared with those from photosynthesizing tissues (per unit of bark or on a foliage surface area basis, see e.g., Tarvainen et al., 2005; Hakola et al., 2006; Aalto et al., 2015). However, although monoterpene emissions from the woody compartments of Scots pines were minor at the ecosystem scale, they may dominate in some situations. For example, bark beetle attacks on conifer stems cause massive damage to resin-rich tissues and subsequent high terpene emissions (e.g., Page et al., 2012). Another extreme but common case is forestry operations such as logging, clearing, and pruning. They produce large amounts of damaged woody and foliar tissue, which emits terpenes for prolonged periods (Schade and Goldstein, 2003; Räisänen et al., 2008; Haapanala et al., 2012; Kivimäenpää et al., 2012).
The constitutive monoterpene emissions from Scots pine woody compartments serve many essential functions. Although the woody tree compartments have a thick outer surface protecting against oxidative stress (unlike in foliage, where VOCs play a key role against oxidative stress, e.g., Krupa et al., 2001; Fini et al., 2017), protection against herbivores is a probable cause for constitutive emissions. Resin deters herbivores (both vertebrate and invertebrate) by making wood and bark unpalatable, and also protects the wounds by sealing them and preventing pathogen infections. The volatile compounds of resin make the substance fluid, and when they are volatilized, the solid resin crystallizes in the wound. Despite the multitude of ecological functions of monoterpenes, the constitutive emissions may nevertheless partly reflect also accidental leakage from resin reservoirs after subtle damage. Leakages may be caused by damage due, for example, to bending of the stem in windy conditions. A small amount of damage invisible on the stem surface may be sufficient to damage the resin ducts and cause substantially increased terpene emissions.
In the case of water-soluble compounds such as methanol, transport is much more likely than with monoterpenes (see e.g., Rissanen et al., 2018, Rissanen et al., in review). The methanol emission rates from pine stems were highest during the summer. In the winter, the number of recorded measurement points was very low, not only because of the high RH inside enclosure during low temperatures, but probably also because the emissions were below the detection limits due to the lack of growth and other cellular activities (e.g., Aitken et al., 2008). The ecosystem-scale methanol fluxes are largely driven by deposition processes on wet surfaces in autumn, winter and spring (Rantala et al., 2015). The methanol emissions from buds, growing needles, and mature needles are highest in early summer, and are also notable in other seasons (Aalto et al., 2014). The correlations of stem methanol emission rates with other measured parameters in the same tree (stem diameter parameters, sap flow rate, shoot transpiration rate) were at best moderate (maximum correlation coefficient 0.64). This suggests that methanol transport and production involves several simultaneous or partly overlapping processes.
The observed methanol flux may originate directly from the tissues under the enclosure, or from the roots and the stem below the enclosure, since an increasing sap flow rate was found to increase the methanol emissions (Rissanen et al., in review). The sap flow rate in the xylem appears to affect the methanol emission from stem tissues, but there are obviously lags in methanol movement in the stem tissues, since radial diffusion from the xylem sap does not occur instantaneously. In addition, these lags may change over the summer period and/or over the diurnal cycle. For example, changes in the water content of the stem strongly affect the diffusion coefficients of gases (Sorz and Hietz, 2006), since diffusion is much faster in the air phase than in the aqueous phase. The potential sources of sap-transported methanol are the stem growth emphasized in midsummer and root growth emphasized in late summer and early autumn (e.g., Schiestl-Aalto et al., 2015), as well as forest floor litter decomposition (Warneke et al., 1999; Gray et al., 2010). It seems evident that the effects of the different sources and time lags warrant further in-depth investigation.
Conclusions
The long-term observations presented here indicate that pine stems are a dynamic source for monoterpenes and methanol to the atmosphere, not only when damaged but even under normal conditions. The emission rates are largest during the active growing season period, and follow a diurnal cycle similar to temperature. However, significant additional control of stem emissions originates from tree physiological activity, most importantly the growth of woody tissues (seasonal scale) and the water transport in xylem (diurnal scale). Our results suggest that, albeit rather small on average, accounting for the contribution of woody biomass could improve the stand emission estimates especially for methanol during the fastest growth period. Further, additional measurements would be needed to analyse the qualitative variations in stem isoprenoid emissions, and their contributions to reactivity within and above the pine stand.
Data Availability Statement
The datasets generated for this study are available on request to the corresponding author.
Author Contributions
AV designed and performed the field measurements together with KR and JA (emissions), TC (stem diameter), and KK (tree growth). AV analyzed the data and wrote the first draft of the paper. JA, TC, TH, PK, KR, KK, and HH contributed to measurements and data analysis. JB developed the idea of stem measurements and wrote the final paper. All authors contributed to writing and revising the paper.
Funding
We are grateful for the funding received from Academy of Finland Center of Excellence program (Grant No. 307331), the University of Helsinki Center for Environment HENVI, the Nordic Center of Excellence CRAICC and the University of Helsinki Doctoral program AGFOREE.
Conflict of Interest
The authors declare that the research was conducted in the absence of any commercial or financial relationships that could be construed as a potential conflict of interest.
Acknowledgments
Teemu Paljakka is acknowledged for providing sap flow data and Pauliina Schiestl-Aalto for providing modeling results for pine stem radial growth phases. The technical staff of the SMEAR II station are acknowledged for maintaining the measurement infrastructure.
Supplementary Material
The Supplementary Material for this article can be found online at: https://www.frontiersin.org/articles/10.3389/ffgc.2019.00095/full#supplementary-material
Figure S1. The comparison between incident temperature measurements in enclosure No 2 and ambient temperature at 16 m height between 2012 and 2014. Y-axis gives the proportion of measurements in each temperature difference range, indicating that most of the measurements fall into 0–2°C difference in both seasons. Daytime (PAR > 10 μmol m−2 s−1) and nighttime (PAR < 5 μmol).
References
Aalto, J., Kolari, P., Hari, P., Kerminen, V. M., Schiestl-Aalto, P., Aaltonen, H., et al. (2014). New foliage growth is a significant, unaccounted source for volatiles in boreal evergreen forests. Biogeosciences 11, 1331–1344. doi: 10.5194/bg-11-1331-2014
Aalto, J., Porcar-Castell, A., Atherton, J., Kolari, P., Pohja, T., Hari, P., et al. (2015). Onset of photosynthesis in spring speeds up monoterpene synthesis and leads to emission bursts. Plant Cell Environ. 38, 2299–2312. doi: 10.1111/pce.12550
Aitken, S. N., Yeaman, S., Holliday, J. A., Wang, T., and Curtis-McLane, S. (2008). Adaptation, migration or extirpation: climate change outcomes for tree populations. Evol. Appl. 1, 95–111. doi: 10.1111/j.1752-4571.2007.00013.x
Back, E. L. (2000). “The locations and morphology of resin components in the wood,” in Pitch Control, Wood Resin, and Deresination, eds E. L. Back and L. H Allen (Atlanta, GA: TAPPI Press, 1–35.
Bloemen, J., McGuire, M. A., Aubrey, D. P., Teskey, R. O., and Steppe, K. (2013). Transport of root-respired CO2 via the transpiration stream affects aboveground carbon assimilation and CO2 efflux in trees. N. Phytol. 197, 555–565. doi: 10.1111/j.1469-8137.2012.04366.x
Chan, T., Hölttä, T., Berninger, F., Mäkinen, H., Nöjd, P., Mencuccini, M., et al. (2016). Separating water-potential induced swelling and shrinking from measured radial stem variations reveals a cambial growth and osmotic concentration signal. Plant Cell Environ. 39, 233–244. doi: 10.1111/pce.12541
Fini, A., Cecilia Brunetti, C., Loreto, F., Centritto, M., Ferrini, F., and Tattini, M. (2017). Isoprene responses and functions in plants challenged by environmental pressures associated to climate change. Front. Plant Sci. 8:1281. doi: 10.3389/fpls.2017.01281
Fries, A., and Ericsson, T. (2009). Genetic parameters for earlywood and latewood densities and development with increasing age in Scots pine. Ann. For. Sci. 66:404. doi: 10.1051/forest/2009019
Ghimire, R. P., Kivimäenpää, M., Blomqvist, M., Holopainen, T., Lyytikäinen Saarenmaa, P., and Holopainen, J. K. (2016). Effect of bark beetle (Ips typographus L.) attack on bark VOC emissions of Norway spruce (Picea abies) trees. Atmos. Environ. 126, 145–152. doi: 10.1016/j.atmosenv.2015.11.049
Ghirardo, A., Koch, K., Taipale, R., Zimmer, I., Schnitzler, J. P., and Rinne, J. (2010). Determination of de novo and pool emissions of terpenes from four common boreal/alpine trees by 13CO2 labelling and PTR-MS analysis. Plant Cell Environ. 33, 781–792. doi: 10.1111/j.1365-3040.2009.02104.x
Granier, A. (1987). Evaluation of transpiration in a Douglas-fir stand by means of sap flow measurements. Tree Physiol. 3, 309–320. doi: 10.1093/treephys/3.4.309
Gray, C. M., Monson, R. K., and Fierer, N. (2010). Emissions of volatile organic compounds during the decomposition of plant litter. J. Geophys. Res. 115:G03015. doi: 10.1029/2010JG001291
Guenther, A. B., Zimmerman, P. R., Harley, P. C., Monson, R. K., and Fall, R. (1993). Isoprene and monoterpene emission rate variability: model evaluation and sensitivity analyses. J. Geophys. Res. 98, 12609–12627. doi: 10.1029/93JD00527
Haapanala, S., Hakola, H., Hellén, H., Vestenius, M., Levula, J., and Rinne, J. (2012). Is forest management a significant source of monoterpenes into the boreal atmosphere? Biogeosciences 9, 1291–1300. doi: 10.5194/bg-9-1291-2012
Hakola, H., Tarvainen, V., Bäck, J., Ranta, H., Bonn, B., Rinne, J, et al. (2006) Seasonal variation of mono- sesquiterpene emission rates of Scots pine. Biogeosciences 3, 93–101. doi: 10.5194/bg-3-93-2006.
Hansel, A., Jordan, A., Holzinger, R., Prazeller, P., Vogel, W., and Lindinger, W. (1995). Proton transfer reaction mass spectrometry: on-line trace gas analysis at the ppb level. Int. J. Mass. Spectrom Ion Process. 149–150, 609–619.
Hari, P., and Kulmala, M. (2005). Station for measuring ecosystem–atmosphere relations (SMEAR II). Boreal Environ. Res. 10, 315–322.
Heijari, J., Blande, J. D., and Holopainen, J. K. (2011). Feeding of large pine weevil on Scots pine stem triggers localised bark and systemic shoot emission of volatile organic compounds. Environ. Exp. Bot. 71, 390–398. doi: 10.1016/j.envexpbot.2011.02.008
Helmisaari, H.-S., Makkonen, K., Kellomäki, S., Valtonen, E., and Mälkönen, E. (2002). Below- and above-ground biomass, production and nitrogen use in Scots pine stands in eastern Finland. For. Ecol. Manage. 165, 317–326. doi: 10.1016/S0378-1127(01)00648-X
Hölttä, T., and Kolari, P. (2009). Interpretation of stem CO2 efflux measurements. Tree Physiol. 29, 1447–1456. doi: 10.1093/treephys/tpp073
Hölttä, T., Kurppa, M., and Nikinmaa, E. (2013). Scaling of xylem and phloem transport capacity and resource usage with tree size. Front. Plant Sci. 4:496. doi: 10.3389/fpls.2013.00496
Ilvesniemi, H., Levula, J., Ojansuu, R., Kolari, P., Kulmala, L., Pumpanen, J., et al. (2009). Long-term measurements of the carbon balance of a boreal Scots pine dominated forest ecosystem. Boreal Environ. Res. 14, 731–753.
Juuti, S., Arey, J., and Atkinson, R. (1990). Monoterpene emission rate measurements from a Monterey pine. J. Geophys. Res. 95, 7515–7519. doi: 10.1029/JD095iD06p07515
Kivimäenpää, M., Narantsetseg, M., Ghimire, R., Markkanen, J. M., Heijari, J., Vuorinen, M., et al. (2012). Influence of tree provenance on biogenic VOC emissions of Scots pine (Pinus sylvestris) stumps. Atmos. Environ. 60, 477–485. doi: 10.1016/j.atmosenv.2012.07.018
Kolari, P., Bäck, J., Taipale, R., Ruuskanen, T. M., Kajos, M. K., Rinne, J., et al. (2012). Evaluation of accuracy in measurements of VOC emissions with dynamic chamber system. Atmos. Environ. 62, 344–351. doi: 10.1016/j.atmosenv.2012.08.054
Kolari, P., Kulmala, L., Pumpanen, J., Launiainen, S., Ilvesniemi, H., Hari, P., et al. (2009). CO2 exchange and component CO2 fluxes of a boreal Scots pine forest. Boreal Environ. Res. 14, 761–783.
Krupa, S., Tuttle McGrath, M., Andersen, C. P., Booker, F. L., Burkey, K. O., Chappelka, A. H., et al. (2001). Ambient ozone and plant health. Plant Dis. 85, 4–12. doi: 10.1094/PDIS.2001.85.1.4
Laffineur, Q., Aubinet, M., Schoon, N., Amelynck, C., Müller, J. F., Dewulf, J., et al. (2012). Abiotic and biotic control of methanol exchanges in a temperate mixed forest. Atmos. Chem. Phys. 12, 577–590. doi: 10.5194/acp-12-577-2012
Lintunen, A., and Kalliokoski, T. (2010). The effect of tree architecture on conduit diameter and frequency from small distal roots to branch tips in Betula pendula, Picea abies and Pinus sylvestris. Tree Physiol. 30, 1433–1447. doi: 10.1093/treephys/tpq085
Niinemets, Ü., Kuhn, U., Harley, P. C., Staudt, M., Arneth, A., Cescatti, A., et al. (2011). Estimations of isoprenoid emission capacity from enclosure studies: measurements, data processing, quality and standardized measurement protocols. Biogeosciences 8, 2209–2246. doi: 10.5194/bg-8-2209-2011
Ortega, J., and Helmig, D. (2008). Approaches for quantifying reactive and low-volatility biogenic organic compound emissions by vegetation enclosure techniques – Part A. Chemosphere 72, 343–364. doi: 10.1016/j.chemosphere.2007.11.020
Page, W. G., Jenkins, M. J., and Runyon, J. B. (2012). Mountain pine beetle attack alters the chemistry and flammability of lodgepole pine foliage. Can. J. Forest Res. 42, 1631–1647. doi: 10.1139/x2012-094
Peltola, A. (Ed.). (2014). Finnish Statistical Yearbook of Forestry. Vantaa: Finnish Forest Research Institute, 428.
Perttunen, J., Sievänen, R., Nikinmaa, E., Salminen, H., Saarenmaa, H., and Väkevä, J. (1996). LIGNUM: A tree model based on simple structural units. Ann. Bot. 77, 87–98. doi: 10.1006/anbo.1996.0011
Phillips, M. A., and Croteau, R. B. (1999). Resin-based defenses in conifers. Trends Plant Sci. 4, 184–190. doi: 10.1016/S1360-1385(99)01401-6
Pirinen, P., Simola, H., Aalto, J., Kaukoranta, J. P., Karlsson, P., and Ruuhela, R. (2012). Tilastoja Suomen Ilmastosta 1981–2010. Finnish Meteorological Institute Reports 2012/1, 1–96.
Räisänen, T., Ryyppö, A., and Kellomäki, S. (2008). Impact of timber felling on the ambient monoterpene concentration of a Scots pine (Pinus sylvestris L.) forest. Atmos. Environ. 42, 6759–6766. doi: 10.1016/j.atmosenv.2008.05.035
Rantala, P., Aalto, J., Taipale, R., Ruuskanen, T. M., and Rinne, J. (2015). Annual cycle of volatile organic compound exchange between a boreal pine forest and the atmosphere. Biogeosciences 12, 5753–5770. doi: 10.5194/bg-12-5753-2015
Rhoades, D. F. (1990). Analysis of monoterpenes emitted and absorbed by undamaged boles of lodgepole pine. Phytochemistry 29, 1463–1465. doi: 10.1016/0031-9422(90)80101-L
Rissanen, K., Hölttä, T., and Bäck, J. (2018). Transpiration directly regulates the emissions of water-soluble short-chained OVOCs. Plant Cell Environ. 41, 2288–2298. doi: 10.1111/pce.13318
Rissanen, K., Hölttä, T., Barreira, L. F. M., Hyttinen, N., Kurtén, T., and Bäck, J. (2019). Temporal and spatial variation in Scots pine resin pressure and composition. Front. Forests Global Change 2:23. doi: 10.3389/ffgc.2019.00023
Rissanen, K., Hölttä, T., Vanhatalo, A., Aalto, J., Nikinmaa, E., Rita, H., et al. (2016). Diurnal patterns in Scots pine stem oleoresin pressure in a boreal forest. Plant Cell Environ. 39, 527–538. doi: 10.1111/pce.12637
Ruuskanen, T. M., Kolari, P., Bäck, J., Kulmala, M., Rinne, J., Hakola, H., et al. (2005). On-line field measurements of monoterpene emissions from Scots pine by proton transfer reaction - mass spectrometry. Boreal Environ. Res. 10, 553–567.
Schade, G. W., and Goldstein, A. H. (2003). Increase of monoterpene emissions from a pine plantation as a result of mechanical disturbances. Geophys. Res. Lett. 30, 1380. doi: 10.1029/2002GL016138
Schiestl-Aalto, P., Kulmala, L., Mäkinen, H., Nikinmaa, E., and Mäkelä, A. (2015). CASSIA – a dynamic model for predicting intra-annual sink demand and interannual growth variation in Scots pine. N. Phytol. 206, 647–659. doi: 10.1111/nph.13275
Sevanto, S., Vesala, T., Perämäki, M., and Nikinmaa, E. (2002). Time lags for xylem and stem diameter variations in a Scots pine tree. Plant Cell Environ. 25, 1071–1077. doi: 10.1046/j.1365-3040.2002.00884.x
Shao, M., Czapiewski, K. V., Heiden, A. C., Kobel, K., Komenda, M., Koppmann, R., et al. (2001). Volatile organic compound emissions from Scots pine: mechanisms and description by algorithms. J. Geophys. Res. 106, 20483–20491. doi: 10.1029/2000JD000248
Sorz, J., and Hietz, P. (2006). Gas diffusion through wood: implications for oxygen supply. Trees 20, 34–41. doi: 10.1007/s00468-005-0010-x
Staudt, M., Byron, J., Piquemal, K., and Williams, J. (2019). Compartment specific chiral pinene emissions identified in a Maritime pine forest. Sci. Total Environ. 654, 1158–1166. doi: 10.1016/j.scitotenv.2018.11.146
Strömvall, A. M., and Petersson, G. (2000). “Volatile terpenes emitted to air,” in Pitch Control, Wood Resin and Deresination, eds E. L. Back and L. H. Allen (Atlanta, GA: TAPPI Press, 77–99.
Taipale, R., Ruuskanen, T. M., Rinne, J., Kajos, M. K., Hakola, H., Pohja, T., et al. (2008). Technical note: quantitative long-term measurements of VOC concentrations by PTR-MS – measurement, calibration, and volume mixing ratio calculation methods. Atmos. Chem. Phys. 8, 6681–6698. doi: 10.5194/acp-8-6681-2008
Tarvainen, V., Hakola, H., Hellén, H., Bäck, J., Hari, P., and Kulmala, M. (2005). Temperature and light dependence of the VOC emissions of Scots pine. Atmos. Chem. Phys. 5, 989–998. doi: 10.5194/acp-5-989-2005
Teskey, R. O., Saveyn, A., Steppe, K., and McGuire, A. (2008). Origin, fate and significance of CO2 in tree stems. N. Phytol. 177, 17–32. doi: 10.1111/j.1469-8137.2007.02286.x
Tingey, D. T., Manning, M., Grothaus, L. C., and Burns, W. F. (1980). Influence of light and temperature on monoterpene emission rates from slash pine. Plant Physiol. 65, 797–801. doi: 10.1104/pp.65.5.797
Trapp, S., and Croteau, R. (2001). Defensive resin biosynthesis in conifers. Annu. Rev. Plant Physiol. Plant Mol. Biol. 52, 689–724. doi: 10.1146/annurev.arplant.52.1.689
Vanhatalo, A., Chan, T., Aalto, J., Korhonen, J. F., Kolari, P., Hölttä, T., et al. (2015). Tree water relations can trigger monoterpene emissions from Scots pine stems during spring recovery. Biogeosciences 12, 5353–5363. doi: 10.5194/bg-12-5353-2015
Warneke, C., Karl, T., Judmaier, H., Hansel, A., Jordan, A., Lindinger, W., et al. (1999). Acetone, methanol, and other partially oxidized volatile organic emissions from dead plant matter by abiological processes: significance for atmospheric HOx chemistry. Global Biogeochem. Cycles 13, 9–17. doi: 10.1029/98GB02428
Keywords: monoterpenes, methanol, tree stem, volatile emission, conifer, wood
Citation: Vanhatalo A, Aalto J, Chan T, Hölttä T, Kolari P, Rissanen K, Kabiri K, Hellén H and Bäck J (2020) Scots Pine Stems as Dynamic Sources of Monoterpene and Methanol Emissions. Front. For. Glob. Change 2:95. doi: 10.3389/ffgc.2019.00095
Received: 16 August 2019; Accepted: 27 December 2019;
Published: 28 January 2020.
Edited by:
Armin Hansel, University of Innsbruck, AustriaReviewed by:
Jürgen Kreuzwieser, University of Freiburg, GermanyAna Maria Yáñez-Serrano, Ecological and Forestry Applications Research Center (CREAF), Spain
Copyright © 2020 Vanhatalo, Aalto, Chan, Hölttä, Kolari, Rissanen, Kabiri, Hellén and Bäck. This is an open-access article distributed under the terms of the Creative Commons Attribution License (CC BY). The use, distribution or reproduction in other forums is permitted, provided the original author(s) and the copyright owner(s) are credited and that the original publication in this journal is cited, in accordance with accepted academic practice. No use, distribution or reproduction is permitted which does not comply with these terms.
*Correspondence: Jaana Bäck, amFhbmEuYmFja0BoZWxzaW5raS5maQ==