 Antonio Gazol
 Gabriel Sangüesa-Barreda
 J. Julio Camarero
- 1Instituto Pirenaico de Ecología (IPE-CSIC), Zaragoza, Spain
- 2EiFAB-iuFOR, University of Valladolid, Soria, Spain
Forest dieback is manifested as widespread loss of tree vigor, growth decline and high mortality rates. Forest dieback is becoming increasingly frequent and extended, particularly in drought-prone regions. This is the case of the south-western Spanish Pyrenees, where keystone species such as Silver fir reach their xeric and southern distribution limits. While dieback of this species has been widely documented in this area, we still lack methodologies to forecast the vulnerability of these forests in response to increasing drought stress so as to anticipate their potential dieback in the future. Here we study multiple features of Silver fir forests and trees to evaluate whether previous growth rates and their growth trends are valid predictors of forest dieback. Further, we validate our methodology revisiting two Silver fir sites sampled two decades ago. The defoliation degree was strongly related with radial growth, and growth trends differed between moderately to highly defoliated trees and non-defoliated trees. Forests showing dieback, i.e., those in which 25% of the sampled trees showed defoliation > 50%, were located at low elevation and received less rainfall in summer than forests showing no dieback. Trees showing high defoliation presented lower growth rates than non-defoliated trees. Moreover, we ratified that defoliation has increased considerably over the last two decades in one of the two revisited sites, but we were unable to accurately forecast growth trends in both sites, particularly in the site not showing dieback. The retrospective assessment of growth rates and trends offers valuable information on the vulnerability of Silver fir trees to drought. However, we are still far from being able to forecast the vulnerability of Silver fir forests to increasing drought. A systematic monitoring of growth across a wide tree-ring network of sites might provide valuable information to advance in this direction.
Introduction
Climate warming is reducing forest productivity in some drought-prone areas because rising temperatures and longer periods of water shortage lead to negative tree growth trends and predispose some species to forest dieback (Bréda et al., 2006; Allen et al., 2010, 2015). Scientific literature on forest dieback is increasing year to year, and widespread episodes are reported for both angiosperms and gymnosperms in boreal, temperate, and Mediterranean biomes (Cailleret et al., 2017; Druckenbrod et al., 2019). In the Mediterranean Basin, climate models forecast an increased aridification in spring with negative consequences for tree growth and forest productivity (Hoerling et al., 2012; Gazol et al., 2017, 2018). Warming trends will amplify evapotranspiration rates and lead to a tighter dependency of tree growth on soil water availability, particularly for those tree species that reach their southern, xeric distribution limits (rear edges) in the Iberian Peninsula (Sánchez-Salguero et al., 2017b). This is the case of Silver fir (Abies alba Mill.), a keystone montane and subalpine conifer widely distributed across Europe, where it forms productive forests very relevant for biodiversity conservation and the forestry sector (Mauri et al., 2016; Caudullo et al., 2017).
The enhanced growth and high drought resistance of this species, compared to other coexisting conifers such as Norway spruce in central and eastern Europe (cf. Vitasse et al., 2019), contrasts with its reduced growth rates and widespread dieback in some sites, mainly concentrated in the south-western Spanish Pyrenees (Camarero et al., 2011; Büntgen et al., 2014; Gazol et al., 2015, 2018). Thus, advancing the understanding of dieback patterns and processes of Silver fir near its rear edge is fundamental to understand how it will respond to further warming trends in other European regions. A recent debate based on paleoecological data concluded that under warmer conditions (+5 to 7°C in summer) the Silver fir area should not contract during the 21st century, neither in central Europe nor in the Pyrenees which represents the southern edge of the species range, as long as annual precipitation does not decline significantly (below 700–800 mm) and human disturbance (e.g., logging, browsing) is not very high (Tinner et al., 2013; Vitasse et al., 2019). However, other authors forecasted significant reductions of climate suitability of Silver fir under moderate climate warming (Maiorano et al., 2013). Nevertheless, both lines of research failed to address the effects of extreme climate events such as droughts on tree growth and performance. Here, we try to reconcile both approaches by: (i) focusing on rear-edge Pyrenean populations showing dieback in response to 20th-century hotter summer droughts, and (ii) explicitly considering historical changes in land use (e.g., logging). Recent climate warming and the changes in land use (e.g., less extensive logging; Cabrera, 2001) have contributed to promote an upward shift of Silver fir across the Pyrenees, whereas some low-elevation montane stands have shown dieback, a loss of vigor and increasing mortality (Camarero, 2017; Hernández et al., 2019).
Forest dieback is a complex phenomenon that results of the occurrence of predisposing, inciting and contributing factors that act at different spatial and temporal scales (Manion, 1981, 2003; McDowell et al., 2008). The case of Silver fir in the Spanish Pyrenees is not an exception to this, since it has been argued that past management selectively logged bigger, fast-growing trees and predisposed Silver fir populations to be particularly vulnerable to the warmer summer trends and more severe droughts observed from the 1980s onward (Camarero, 2017). During recent decades, Silver fir dieback has become a widespread phenomenon in some sites of the south-western Pyrenees with a higher prevalence in low-elevation, montane forests more severely impacted by drought (Oliva and Colinas, 2007; Camarero et al., 2011). The warming trends observed after the 1980s, and particularly a severe drought that occurred in 1985–1986, negatively impacted the growth of Pyrenean Silver fir forests by increasing evapotranspiration rates (Macias et al., 2006; Vicente-Serrano et al., 2015). Finally, acute insect outbreaks have also contributed to severe growth reductions (Camarero et al., 2003), but were not followed by dieback (Sangüesa-Barreda et al., 2015). However, it remains unclear why some Silver fir populations are more vulnerable to drought than others, and which variables can be used as early warning signals to identify and forecast forest vulnerability.
The loss of tree vigor associated with forest dieback is usually manifested as a foliage loss and growth decline (Waring, 1987; Dobbertin, 2006). Dendrochronology provides an accurate way to quantify the radial growth trends in trees at annual to seasonal resolution retrospectively (Fritts, 1976). Recent evidence suggests that forest dieback may be manifested as a loss of growth resilience capacity to extreme events and the presence of negative growth trends (Camarero et al., 2015, 2018; Cailleret et al., 2017). In fact, stand level negative growth trends can indicate a gradual loss in tree vigor and can be used as an early warning signal of tree vulnerability to drought (e.g., Camarero et al., 2015; Cailleret et al., 2019). When growth decline becomes widespread within a stand it can be indicative of increased forest vulnerability (e.g., Camarero et al., 2018). However, growth decline of a few individuals can also mean less competition for remaining trees, improving the stand performance (Sangüesa-Barreda et al., 2015). Thus, dendrochronology provides a useful tool to place in a temporal framework whether growth trends can inform on tree vulnerability and whether this vulnerability results in realized dieback at the stand level.
In this study we evaluated the structure, defoliation and radial-growth patterns and trends of Silver fir populations in the Aragón, south-western Spanish Pyrenees. We aimed to show how the retrospective observation of growth can help us to forecast forest vulnerability, and to realize whether those stands showing greater vulnerability show dieback at the present. To this end, we analyzed a complete data set obtained in 1999–2000 in 30 Silver fir forests (see Camarero et al., 2011). Two of these forests were revisited in 2019 to study their evolution 20 years later and dendrochronological methods were applied in them. We hypothesize that: (i) declining trees, i.e., those showing high defoliation, have lower growth rates than non-declining trees; (ii) the occurrence of negative growth trends as a consequence of the loss of resilience capacity to drought is more evident in defoliated trees and indicates their vulnerability to drought; and (iii) long-term negative growth trends can be used to evaluate forest dieback at the stand level.
Materials and Methods
Study Sites
We studied 30 Silver fir stands located in the southern slopes of the central and western Spanish Pyrenees (Table 1 and Figure 1). This area represents a transition point between the humid conditions frequently found in the northern slopes of the range and the drier conditions southwards and at lower elevations. In the Spanish Pyrenees, Eurosiberian plant communities dominate at high elevations and on N- or NW-oriented slopes. Mediterranean vegetation can be found at lower elevations and on S- or SE-oriented slopes (Vigo and Ninot, 1987). The climate of the studied region is continental and there is a marked longitudinal gradient caused by the influence of the Atlantic Ocean (oceanic influences) and the Mediterranean Sea (Mediterranean influences) in the western and eastern sites, respectively (Tardif et al., 2003). Accordingly, winter precipitation is higher and temperature amplitude is lower in the western than in the eastern sites of the study area, whereas summer-fall precipitation increases eastwards (Camarero et al., 2011). Thus, western sites are more sensitive to spring drought whilst late-summer drought stress mostly affects Silver fir in southern and eastern sites (Macias et al., 2006). The studied sites present calcareous and basic soils such as marls and limestones from Eocene Flysch bedrocks, which generate calcareous and basic soils of the loam-clay or loam types (Camarero et al., 2011). According to the FAO (2006) soil classification, calcic cambisols and eutric cambisols dominate in the study sites.
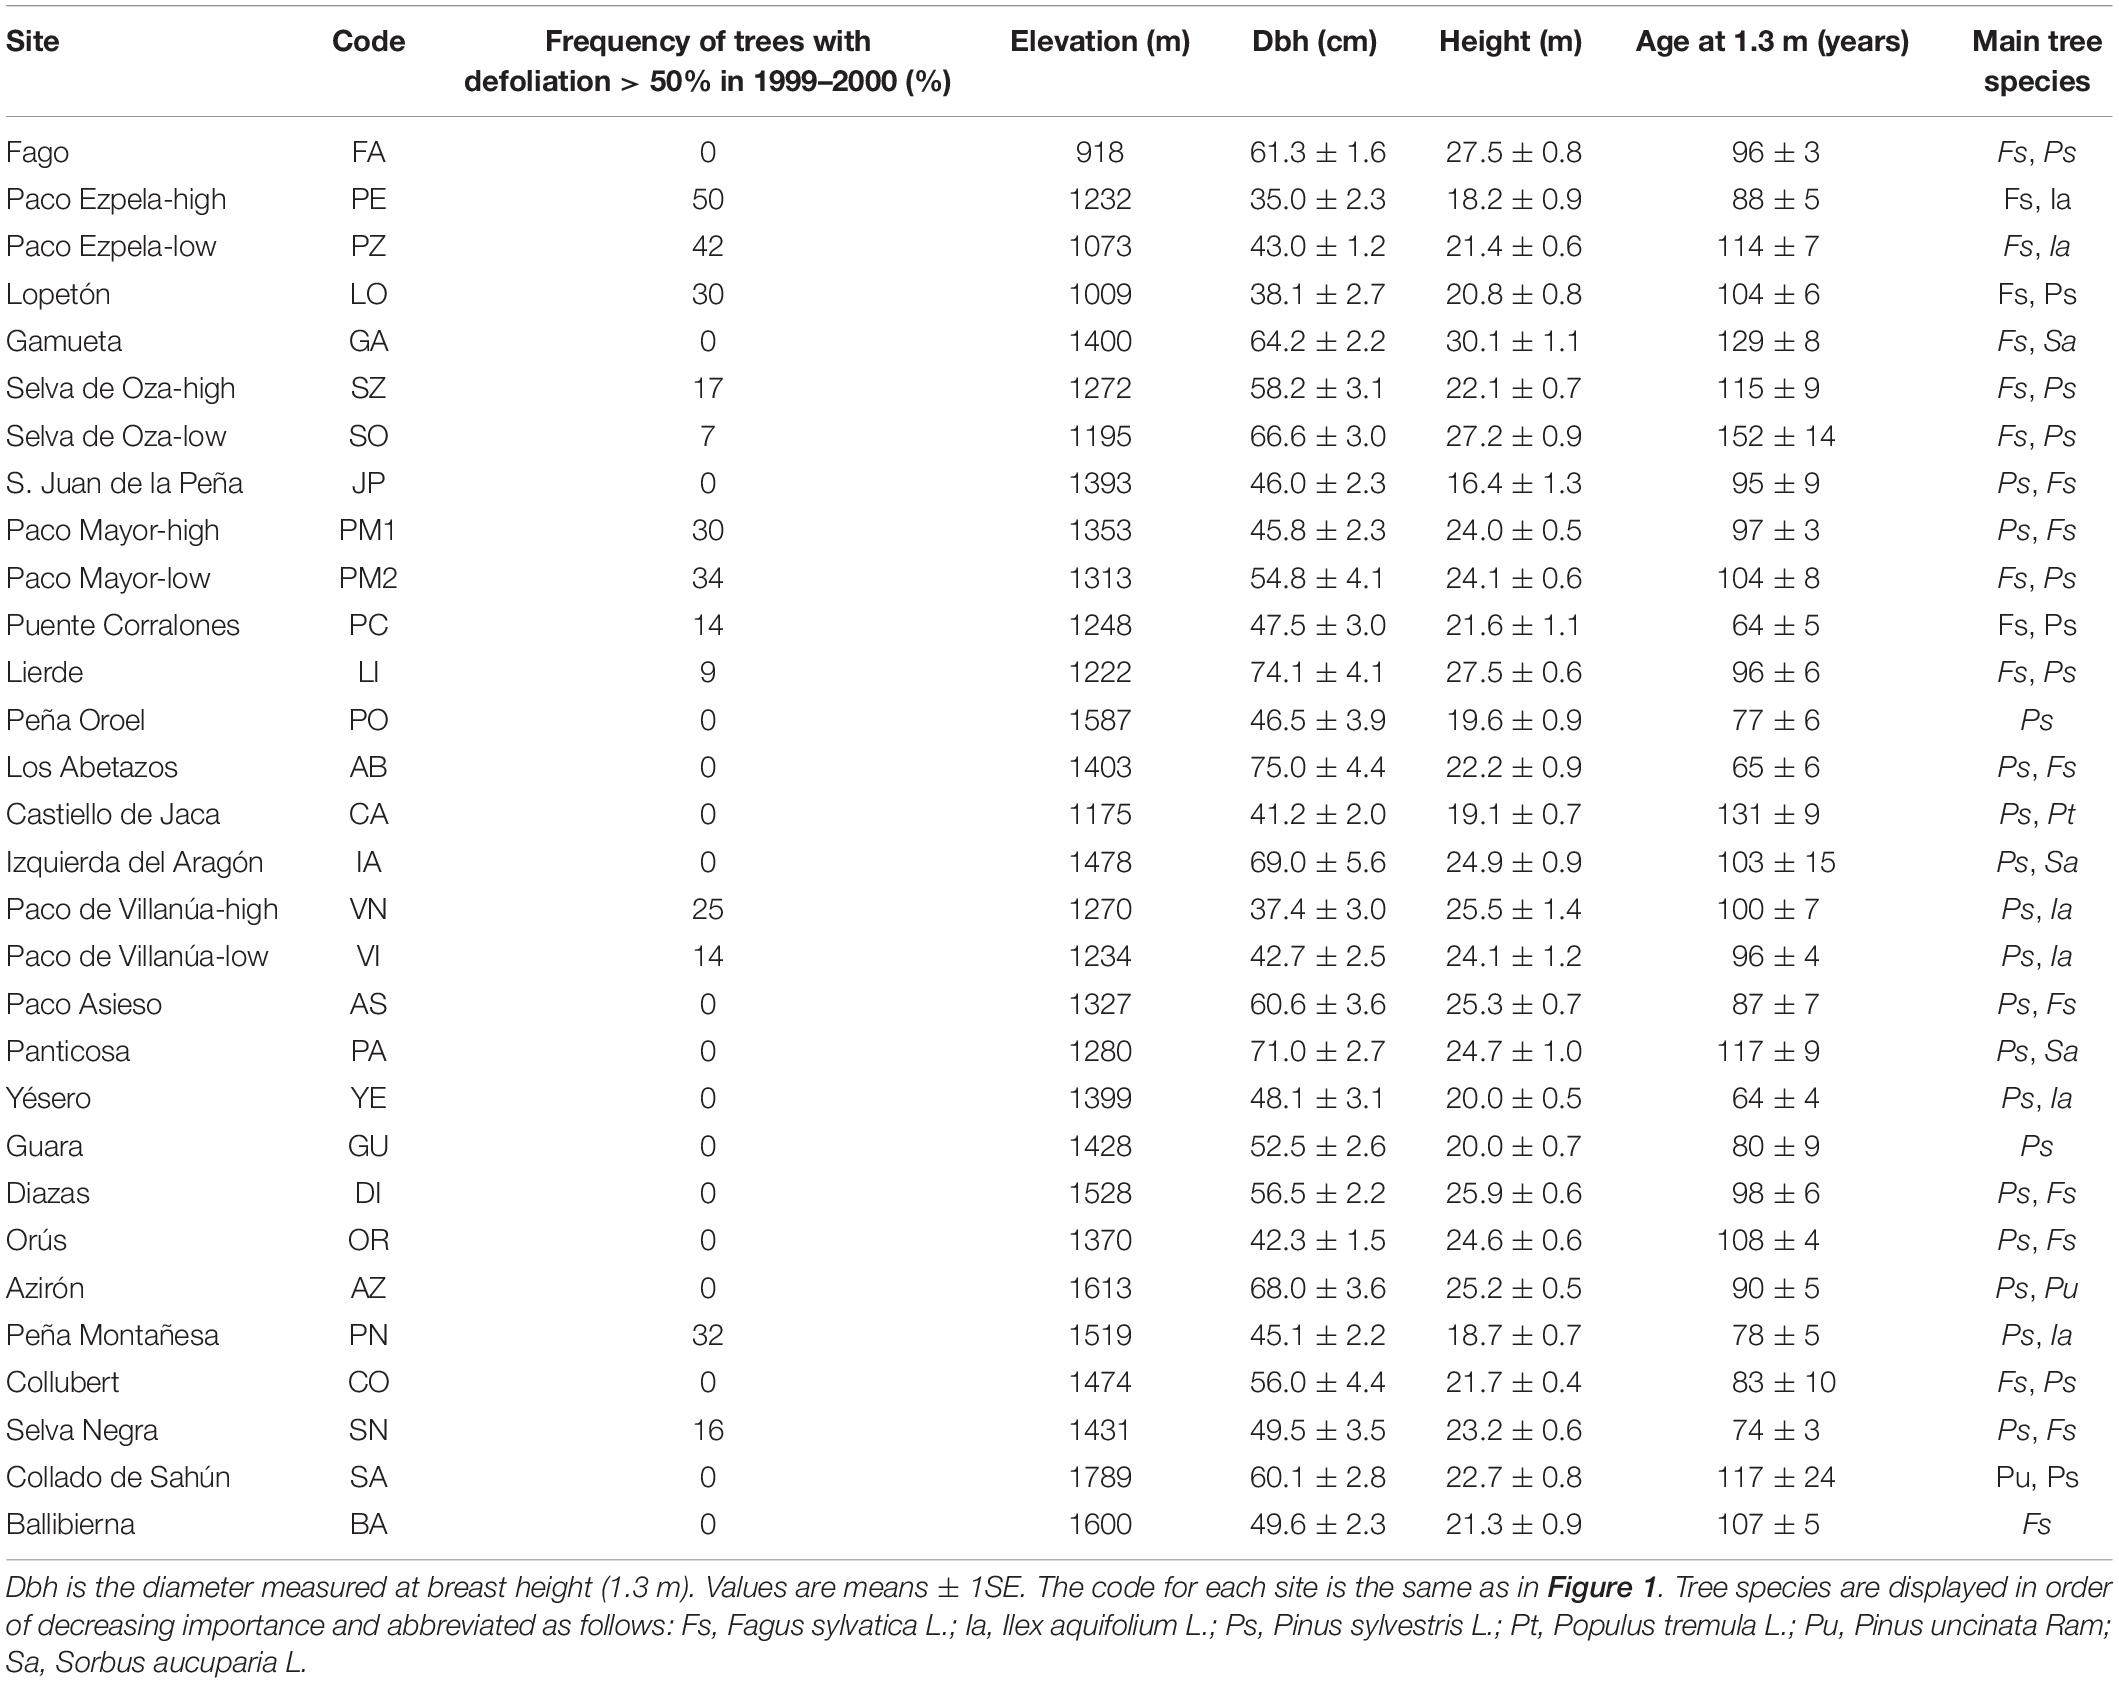
Table 1. Characteristics of the studied silver fir stands.
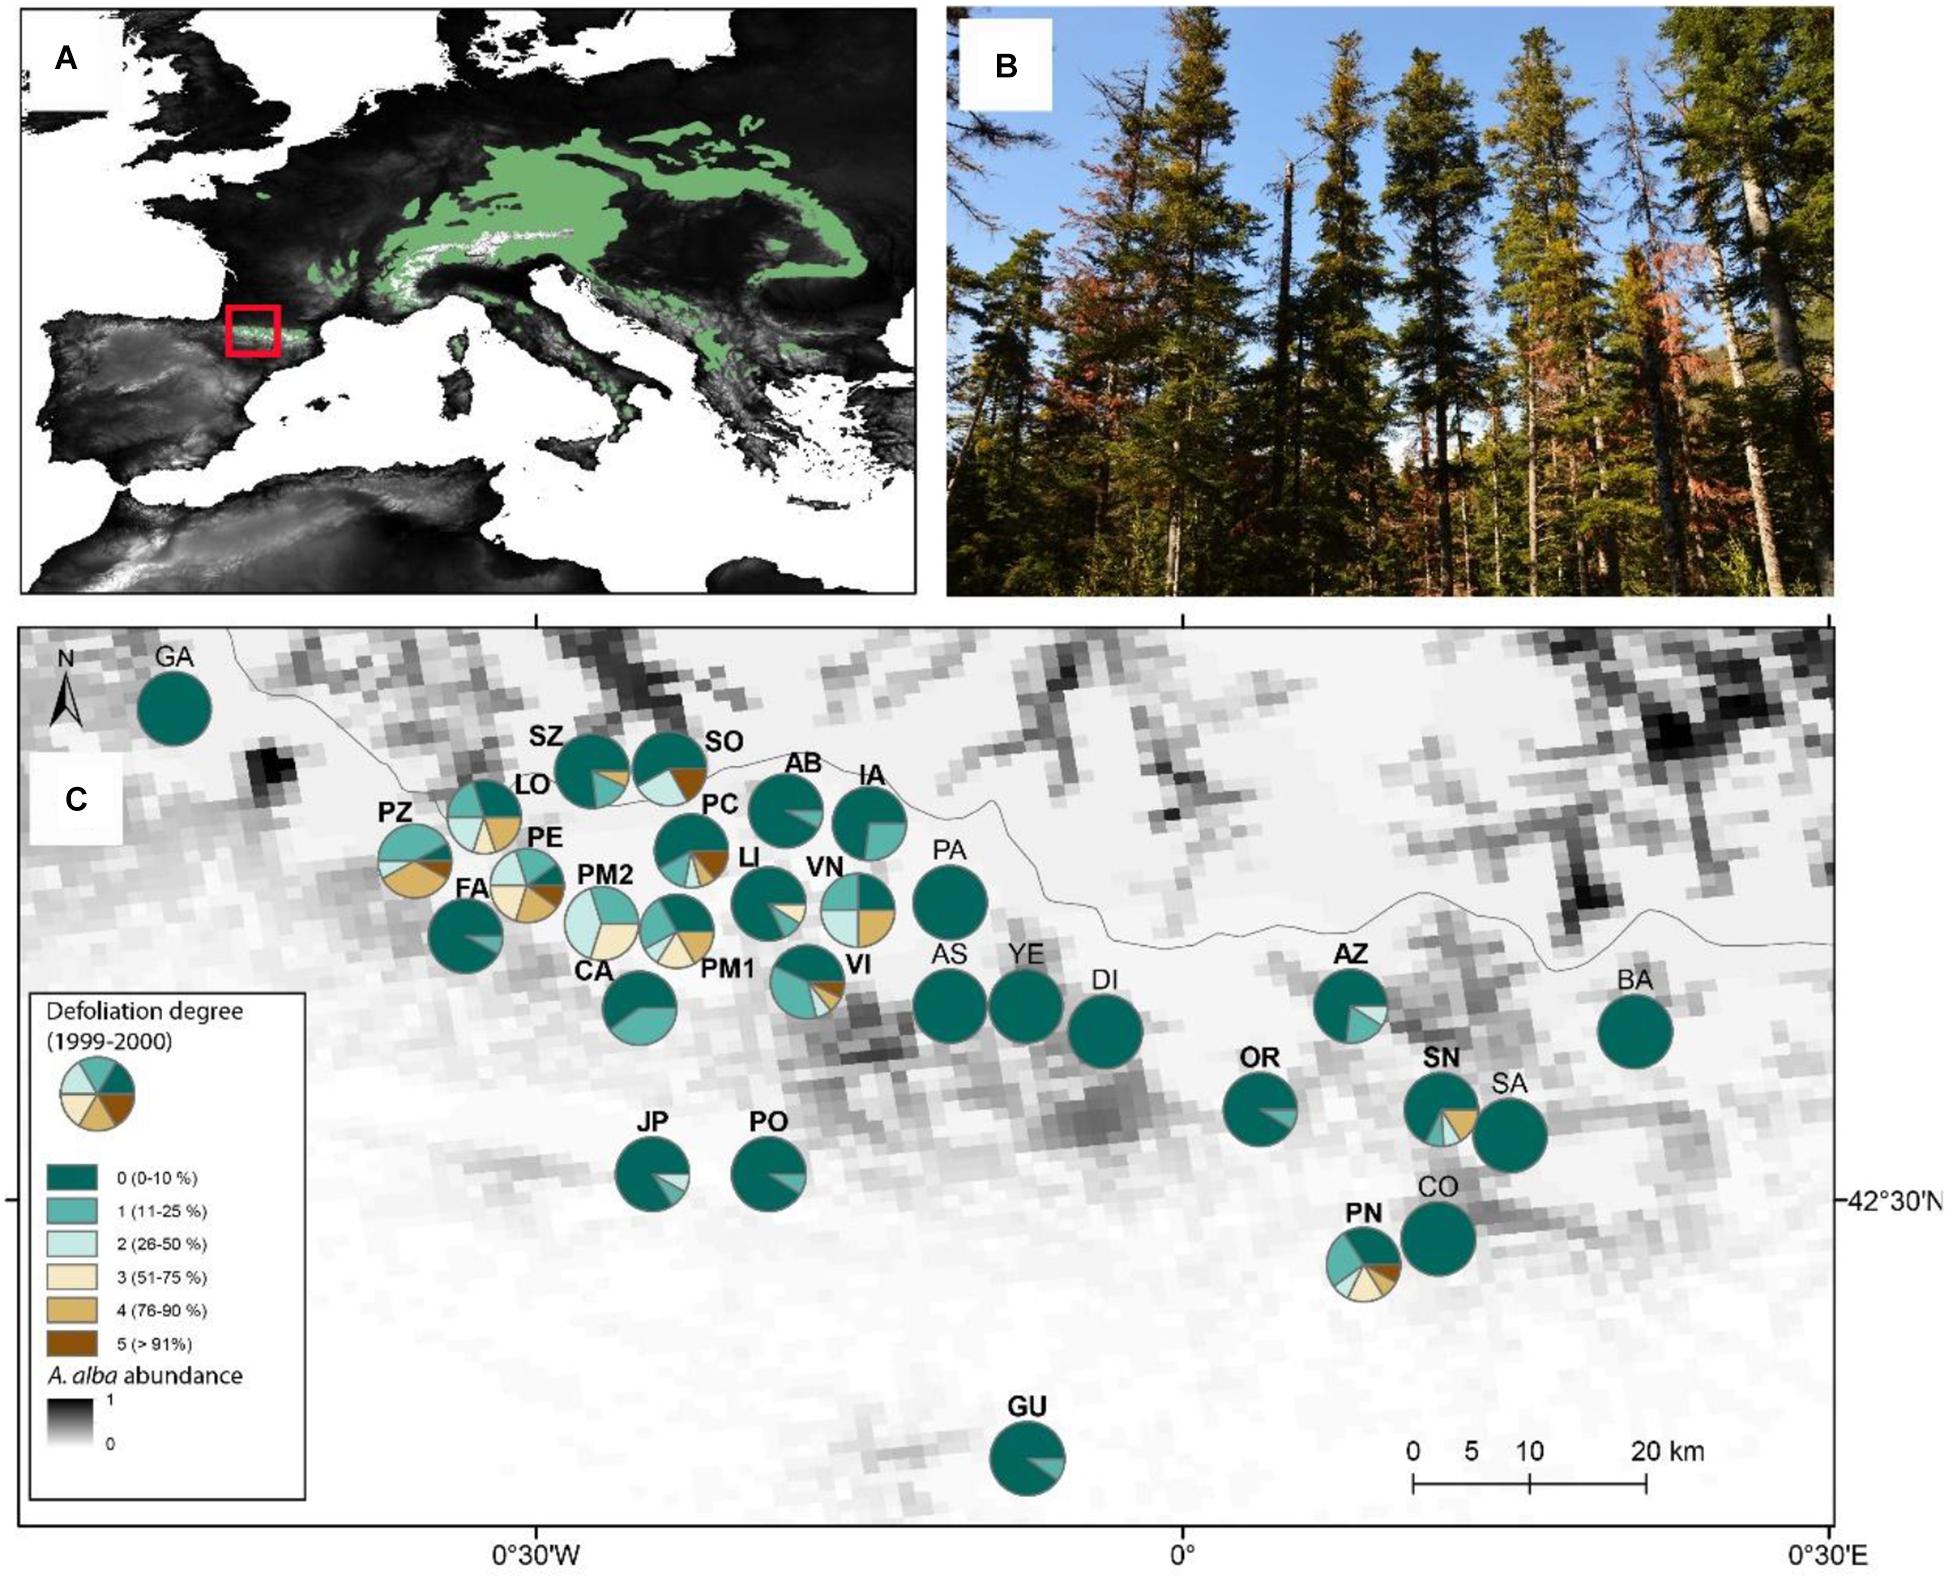
Figure 1. Study sites and sampled forests in the Aragón Pyrenees (north-eastern Spain). (A) The inset shows the distribution of Silver fir in Europe and the location of the study site (red box). The gray scale represents the elevation range, increasing the values from black to white. (B) A group of Silver fir trees showing dieback or dying in the Villanúa site (VI). (C) Sampled forests in the Aragón Pyrenes. For each sampled forest, the color portions within the circles represent the proportion of trees with varying defoliation degrees (from 0 to 5, i.e., form low to complete defoliation). Sites in bold emphasizes those showing dieback in 1999-2000, whereas the line shows the boundary between Spain and France along the Pyrenees. The distribution and abundance of Silver fir (Abies alba) in Europe and the Pyrenees (box in the Europe map) is based on the data compiled by Caudullo et al. (2017).
In the study region, Silver fir forests occur more frequently in zones where humid conditions prevail such as valley bottoms and N- and NW-oriented slopes and where deep soils exist (Ceballos and Ruiz de la Torre, 1979). There, they form dense monospecific stands or coexist with Fagus sylvatica L. and Pinus sylvestris L. (montane forests from the western and central Pyrenees) or with Pinus uncinata Ram., in the central and eastern Pyrenees (subalpine forests). The sampled sites were mostly montane forests, especially those located in the westernmost part of the study region. Only two sites were typical subalpine forests and were located in the eastern part (sites SA and BA; see Table 1). In the western study area, those sites located in Pre-Pyrenees further south (e.g., sites JP, OO, PO, and GU) showed different climatic and vegetation characteristics (e.g., co-dominance of Silver fir and P. sylvestris) than the other sites located at similar longitudes (Table 1). Silver fir forests in the Pyrenees may experience summer drought, despite receiving a total annual precipitation between ca. 900 and 2000 mm (Camarero et al., 2011). According to the Standardized Precipitation Evapotranspiration Index (SPEI; Vicente-Serrano et al., 2010), drought events (i.e., SPEI values lower than −1.25) were common in the period 1960–2020 (Supplementary Figure S1). Low SPEI values were observed for the years 1986–1987, 1989, 2005, and 2012.
Field Sampling and Climate Data
The sites were sampled between 1999 and 2000. In each forest, a 500-m long and 20-m wide belt transect (0.1 ha) was sampled oriented around the contour lines in a representative zone of the stand. Between 10 and 15 dominant and codominant individuals were selected to represent the main conditions of the stand. We measured the size (diameter at breast height; dbh) and height of each tree and measured the orientation, elevation and slope of the terrain in which the tree was located. We also estimated tree recent vigor by observing the abundance of epicormic shoots along the main stem and presence of abnormal growth in the crown apex (e.g., “stork’s nest,” dead and broken branches, defoliation); mistletoe abundance (Viscum album L.) in the crown; and cone production based on the estimated number of cone rachises observed in the uppermost crown for the 1999 and 2000 crops.
Each tree was evaluated visually to estimate the percentage of defoliation in five classes based on the percentage of crown defoliation (Müller and Stierlin, 1990): class 0, 0–10% defoliation (non-declining tree); 1, 11–25% (slight damage); 2, 26–50% (moderate damage); 3, 51–75% (severe damage); 4, 76–90% (dying tree); 5, >91% defoliation or only retaining red needles (recently dead tree). The last tree ring they formed at 1.3 m was dated before the sampling year using dendrochronological methods. In each site, we sampled as many declining trees as there were within the selected 0.1 ha belt transect based on the percentage of trees with severe defoliation (>50% crown defoliation).
In addition, we measured the number and dbh of all trees and shrubs with a height greater than 1.3 m found within a circular plot 7.62 m in radius placed around each subject tree. After that, we described the immediate neighborhood of each tree (i) as related to all its measured neighbors (j) using the Lorimer (Li) competition index (Lorimer, 1983). This index was calculated as:
The data obtained from this field sampling were also used to estimate the mean density (stems ha–1) and basal area (m2 ha–1) of Silver fir in each stand. Finally, we also estimated the richness and diversity of the main vascular, woody plant species within the circle of 7.62 m radius around each subject sampled tree and calculated the Shannon–Wiener diversity index (Magurran, 1988).
We obtained the climatic data for each stand from a 1.1 km2-gridded and homogenized database derived from the entire observational climatic data bank of the Spanish Meteorological Agency (AEMET) that covers the period 1962-2016 (Vicente-Serrano et al., 2017). Briefly, the dataset contains weekly information on temperature, precipitation and potential evapotranspiration. We also calculated the Standardized Precipitation-Evapotranspiration Index (SPEI; Vicente-Serrano et al., 2010), a drought index which accounts for temporal differences in drought severity as a function of temperature and precipitation. Particularly, we calculated the SPEI for three, 6, 9, and 12 months in June (i.e., accounting from three to 12 months before June). Negative and positive SPEI values indicate dry and moist conditions, respectively.
Finally, two sites were revisited in summer 2019 to assess their evolution over the last 20 years. In the 1999–2000 sampling campaign, four sites were classified as showing dieback because they contained 25% of trees with a defoliation degree > 50% (Camarero et al., 2011). The Ballibierna (BA) site is a subalpine forest located in the eastern Aragón Pyrenees were no signs of dieback have been documented (Table 1). In contrast, the Castiello de Jaca (CA) montane site from the western Aragón Pyrenees, where signs of severe dieback were not documented before, has experienced a notable decline over the recent decades (J. J. Camarero, personal observation). In each site, a 100-m long transect was established to quantify stand characteristics and tree growth. We used the point quarter method to estimate density and basal area (Krebs, 1999) by measuring the dbh and identifying the species of the four nearest trees in each cardinal point every 10 m along the transect. Furthermore, we selected one dominant or codominant Silver fir each 10 m for dendrochronological sampling. Thus, the dbh of a total of 44 trees was measured and 11 Silver fir trees were sampled for dendrochronological purposes in each site. For each tree we also estimated its defoliation degree using the 5-class scale explained above (Supplementary Figure S2).
Tree-Ring Analyses
To quantify the radial growth and estimate the age of each tree, 2–3 cores were taken at 1.3 m above the base using a 5-mm Pressler increment borer. Dendrochronological samples were processed following standard methodologies (Fritts, 1976). Wood samples were air dried, glued onto wooden supports and carefully sanded until tree rings were clearly visible. Then, we visually cross-dated the cores within each site by comparing their characteristic narrow rings and measured tree-ring widths with a resolution of 0.01 mm using a Lintab-TSAP measuring device (Rinntech, Heidelberg, Germany). Tree-ring cross-dating was checked using the program COFECHA (Holmes, 1983). To estimate tree age at breast height, we used a geometric method to estimate the number of missing rings between pith and first complete tree ring (Duncan, 1989).
The percentage growth change filter of Nowacki and Abrams (1997) was applied to identify abrupt growth changes (releases) for the 1950–1999 period. First, we calculated the ring-width medians of subsequent 10-year periods along all the individual growth series. Second, the percentage of positive (PGC) growth change was defined as:
Releases were defined as those years with PGC > 75% in at least two radii of each sampled tree. Finally, ring widths were converted to basal area increments (BAI, cm2 year–1) assuming a circular outline of stems (Visser, 1995) as:
where R is the radius of the tree and t is the year of tree ring formation. BAI is commonly assumed to be a more meaningful indicator of tree growth than ring width because it removes variation in radial growth attributable to increasing circumference while preserves long- and short-term changes in growth (LeBlanc et al., 1992).
Statistical Analyses
To extract the relevant information from our field tree data and determine which variables were related with forest dieback in 1999–2000, we performed a Non-metric Multidimensional Scaling (NMDS) which has been regarded as one of the most robust unconstrained ordination method in community ecology (Minchin, 1987). NMDS searches iteratively the best configuration of entities on a specified number of dimensions that minimizes the stress of this configuration. First, we standardized the tree-level data (n = 360 trees) and rescaled them to 0–1 range. Second, we obtained a matrix of dissimilarity coefficients between all pairs of trees based on the Sørensen distance (Kenkel and Orlóci, 1986). We used a Principal Component Analysis as the starting configuration for the iterative fitting procedure of the NMDS and set 100 as the maximum number of iterations. After several trials, noting the stress values obtained in the ordinations, we chose the number of dimensions equal to two to yield optimal ordinations.
The tree-based variables (units) used in the NMDS were the following: elevation (m); slope (%); northness [cosine-transformed aspect (°)]; eastness [sine-transformed aspect (°)]; terrain curvature (ordinal scale); soil type (acid = 0, basic = 1); dbh (cm); height (m); age at 1.3 m (years); height-to-dbh ratio; crown defoliation (%); apex form (ordinal scale); mistletoe abundance (ordinal scale); cone production (ordinal scale); basal area around each sampled tree of all species (BA; m2 ha–1); Lorimer competition index; tree density around each sampled tree (stems ha–1); number of releases or periods with at least 5 consecutive years showing growth changes > 75% during the past five decades; mean tree-ring widths (mm) and ring-width indices for the 1990–1994 period; summer precipitation (mm) recorded during the same 5-year period; seasonal (spring, summer, fall, and winter) percentages of total annual precipitation for that period. We evaluated the common period of maximum sample size for tree growth (1970–1999) because it included pre-decline (1970s), decline (1980s) and post-decline (1990s) decades. However, the 1990–1994 period was selected because it showed very warm and dry conditions after the dieback started in the late 1980s (Camarero, 2017). Correlations among all tree-based data were also calculated using Spearman correlation coefficient (rs). NMDS ordinations were done by using the statistical software PC-ORD 4.0 (McCune and Mefford, 1999). Values are given as means ± standard errors throughout the text.
Generalized additive mixed models (GAMMs; Wood, 2006) were applied to quantify Silver fir growth (BAI) trends and response to climate variables relevant to growth (previous September average temperature, February and April temperature in the year of growth and drought index) in 21 sites for the period 1962–1999 as a function of tree characteristics. The 3-month June SPEI (SPEI_JUN03; including April, May, and June) was included to account for the response of Silver fir growth to drought based on previous analyses (Pasho et al., 2011), the mean temperature of September in the year prior to growth and February and April in the year of growth to account for the effects on growth of: cold stress (February), the shift in the start of the growing season (April), and late-summer water deficit due to high evapotranspiration rates (September) (see Camarero, 2017). Tree and site identity were included as random factors to account for the fact that BAI data represent repeated measures over an individual and the nested structure of the data (i.e., trees sampled within stands). BAI trends were quantified by including calendar year as an explanatory variable. Since BAI trajectories can vary along time, we modeled year as a thin plate regression spline with a maximum of 4 degrees of freedom. To account for the differences in BAI trajectories and response to climate between individuals, we also tested interactions between calendar year, SPEI_JUN03, mean September, February and April temperature (T Sep, T Feb, T Apr), and defoliation class (5-point scale). Finally, to control for ontogenetic and tree-size factors, tree dbh and age were included in the fixed part of the models. BAI was log-transformed [log(x + 1)] prior to the analyses in order to achieve normality assumptions. We included a first-order autocorrelation structure (AR1) to account for dependency of the BAI in year t on the BAI of the previous year t-1. The explanatory variables were standardized by subtracting their means and dividing by their standard deviation to provide comparable coefficients across variables. To select the final model, we ranked all models based on the second-order Akaike information criterion (AICc) and selected the one showing the lowest AICc (Burnham and Anderson, 2002).
We compared the defoliation patterns and the growth in the two revisited stands (BA and CA). The Kruskal–Wallis Rank Sum Test was used to compare tree dbh and their defoliation degree between sites and sampling periods. Simple correlation analyses were used to compare BAI of trees sampled in 1999–2000 and in 2019 for the period 1965–2000. Further, we used the GAMM of BAI to project the growth of the trees into the 2001–2016 period. For this purpose, we used the data of the trees sampled in the 2019 campaign. After that, we compared the projected and the observed BAI of stands resampled in 2019.
Results
Multivariate Assessment of Defoliation and Growth Patterns
In the study area, the dieback was most intense in western, low-elevation (1000–1300 m) sites (Table 1 and Figure 1). The mean tree-ring width of sites showing dieback (2.14 ± 0.22 mm) was significantly lower (t = −2.37, P = 0.02) than that of non-declining sites (2.79 ± 0.15 mm) sites (Table 2). Similarly, the mean BAI for the period 1950–1999 was significantly lower (t = −2.72, P = 0.01) in sites showing dieback (18.44 ± 2.93 cm2) than in non-declining sites (27.91 ± 1.90 cm2) sites (Figure 2A).
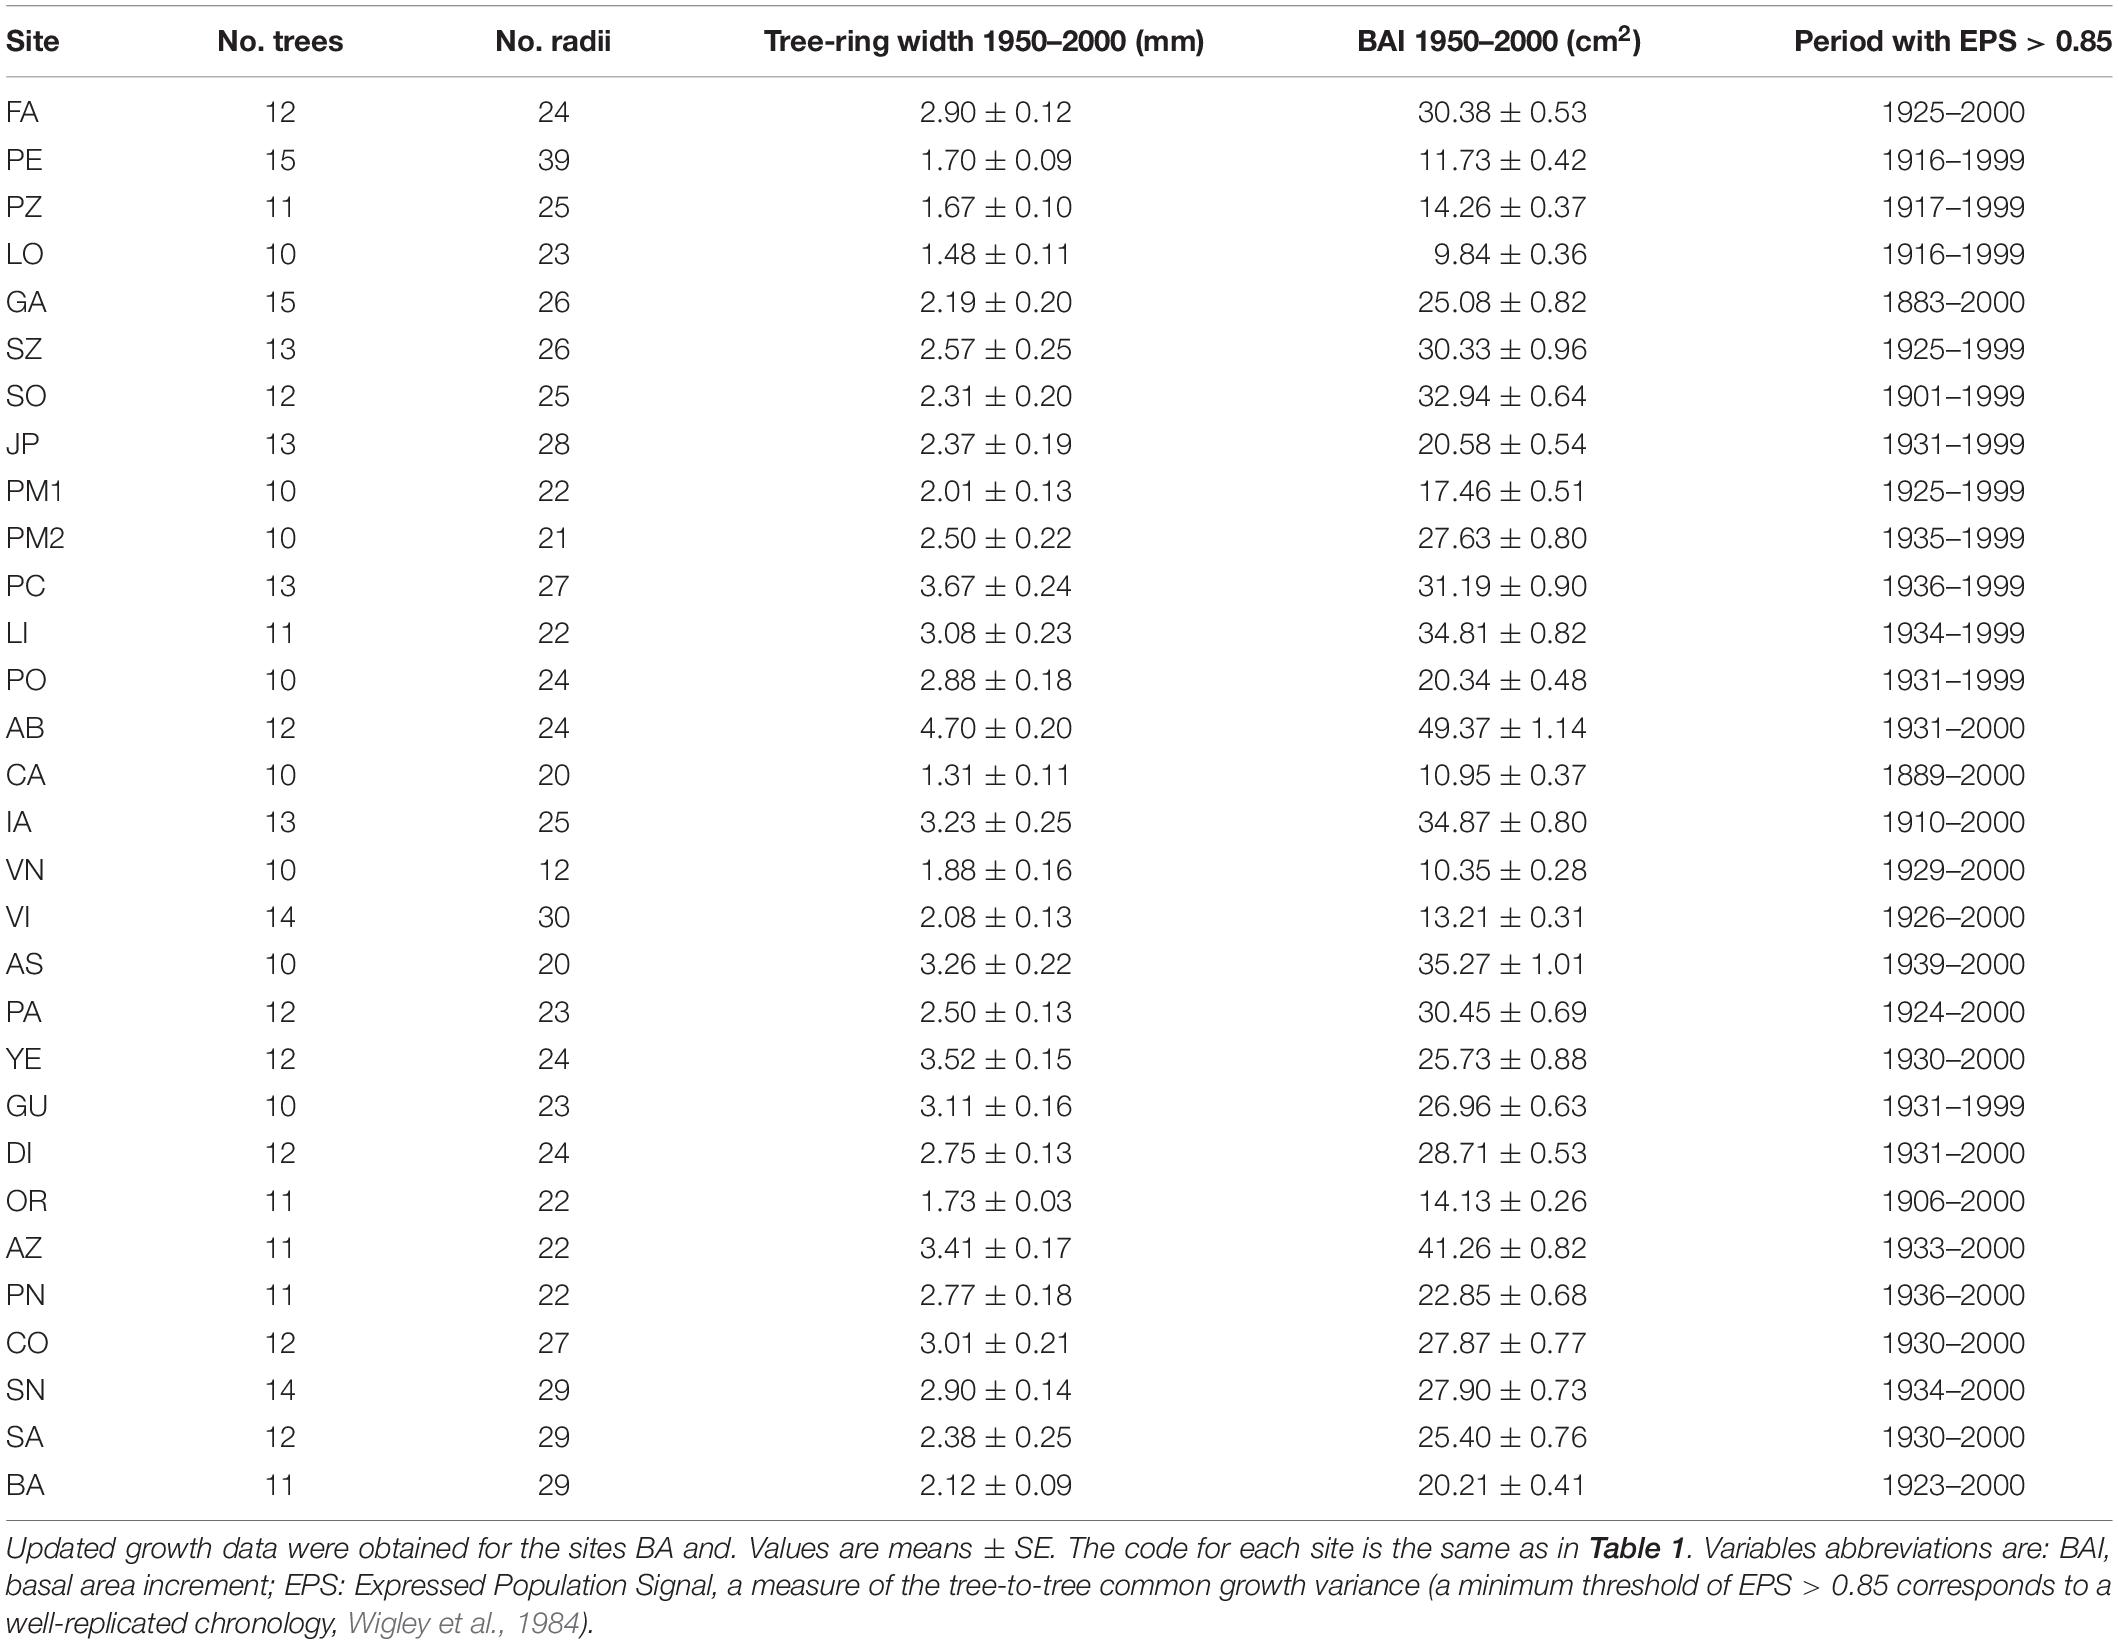
Table 2. Descriptive statistics of the tree-ring width and basal area increment series.
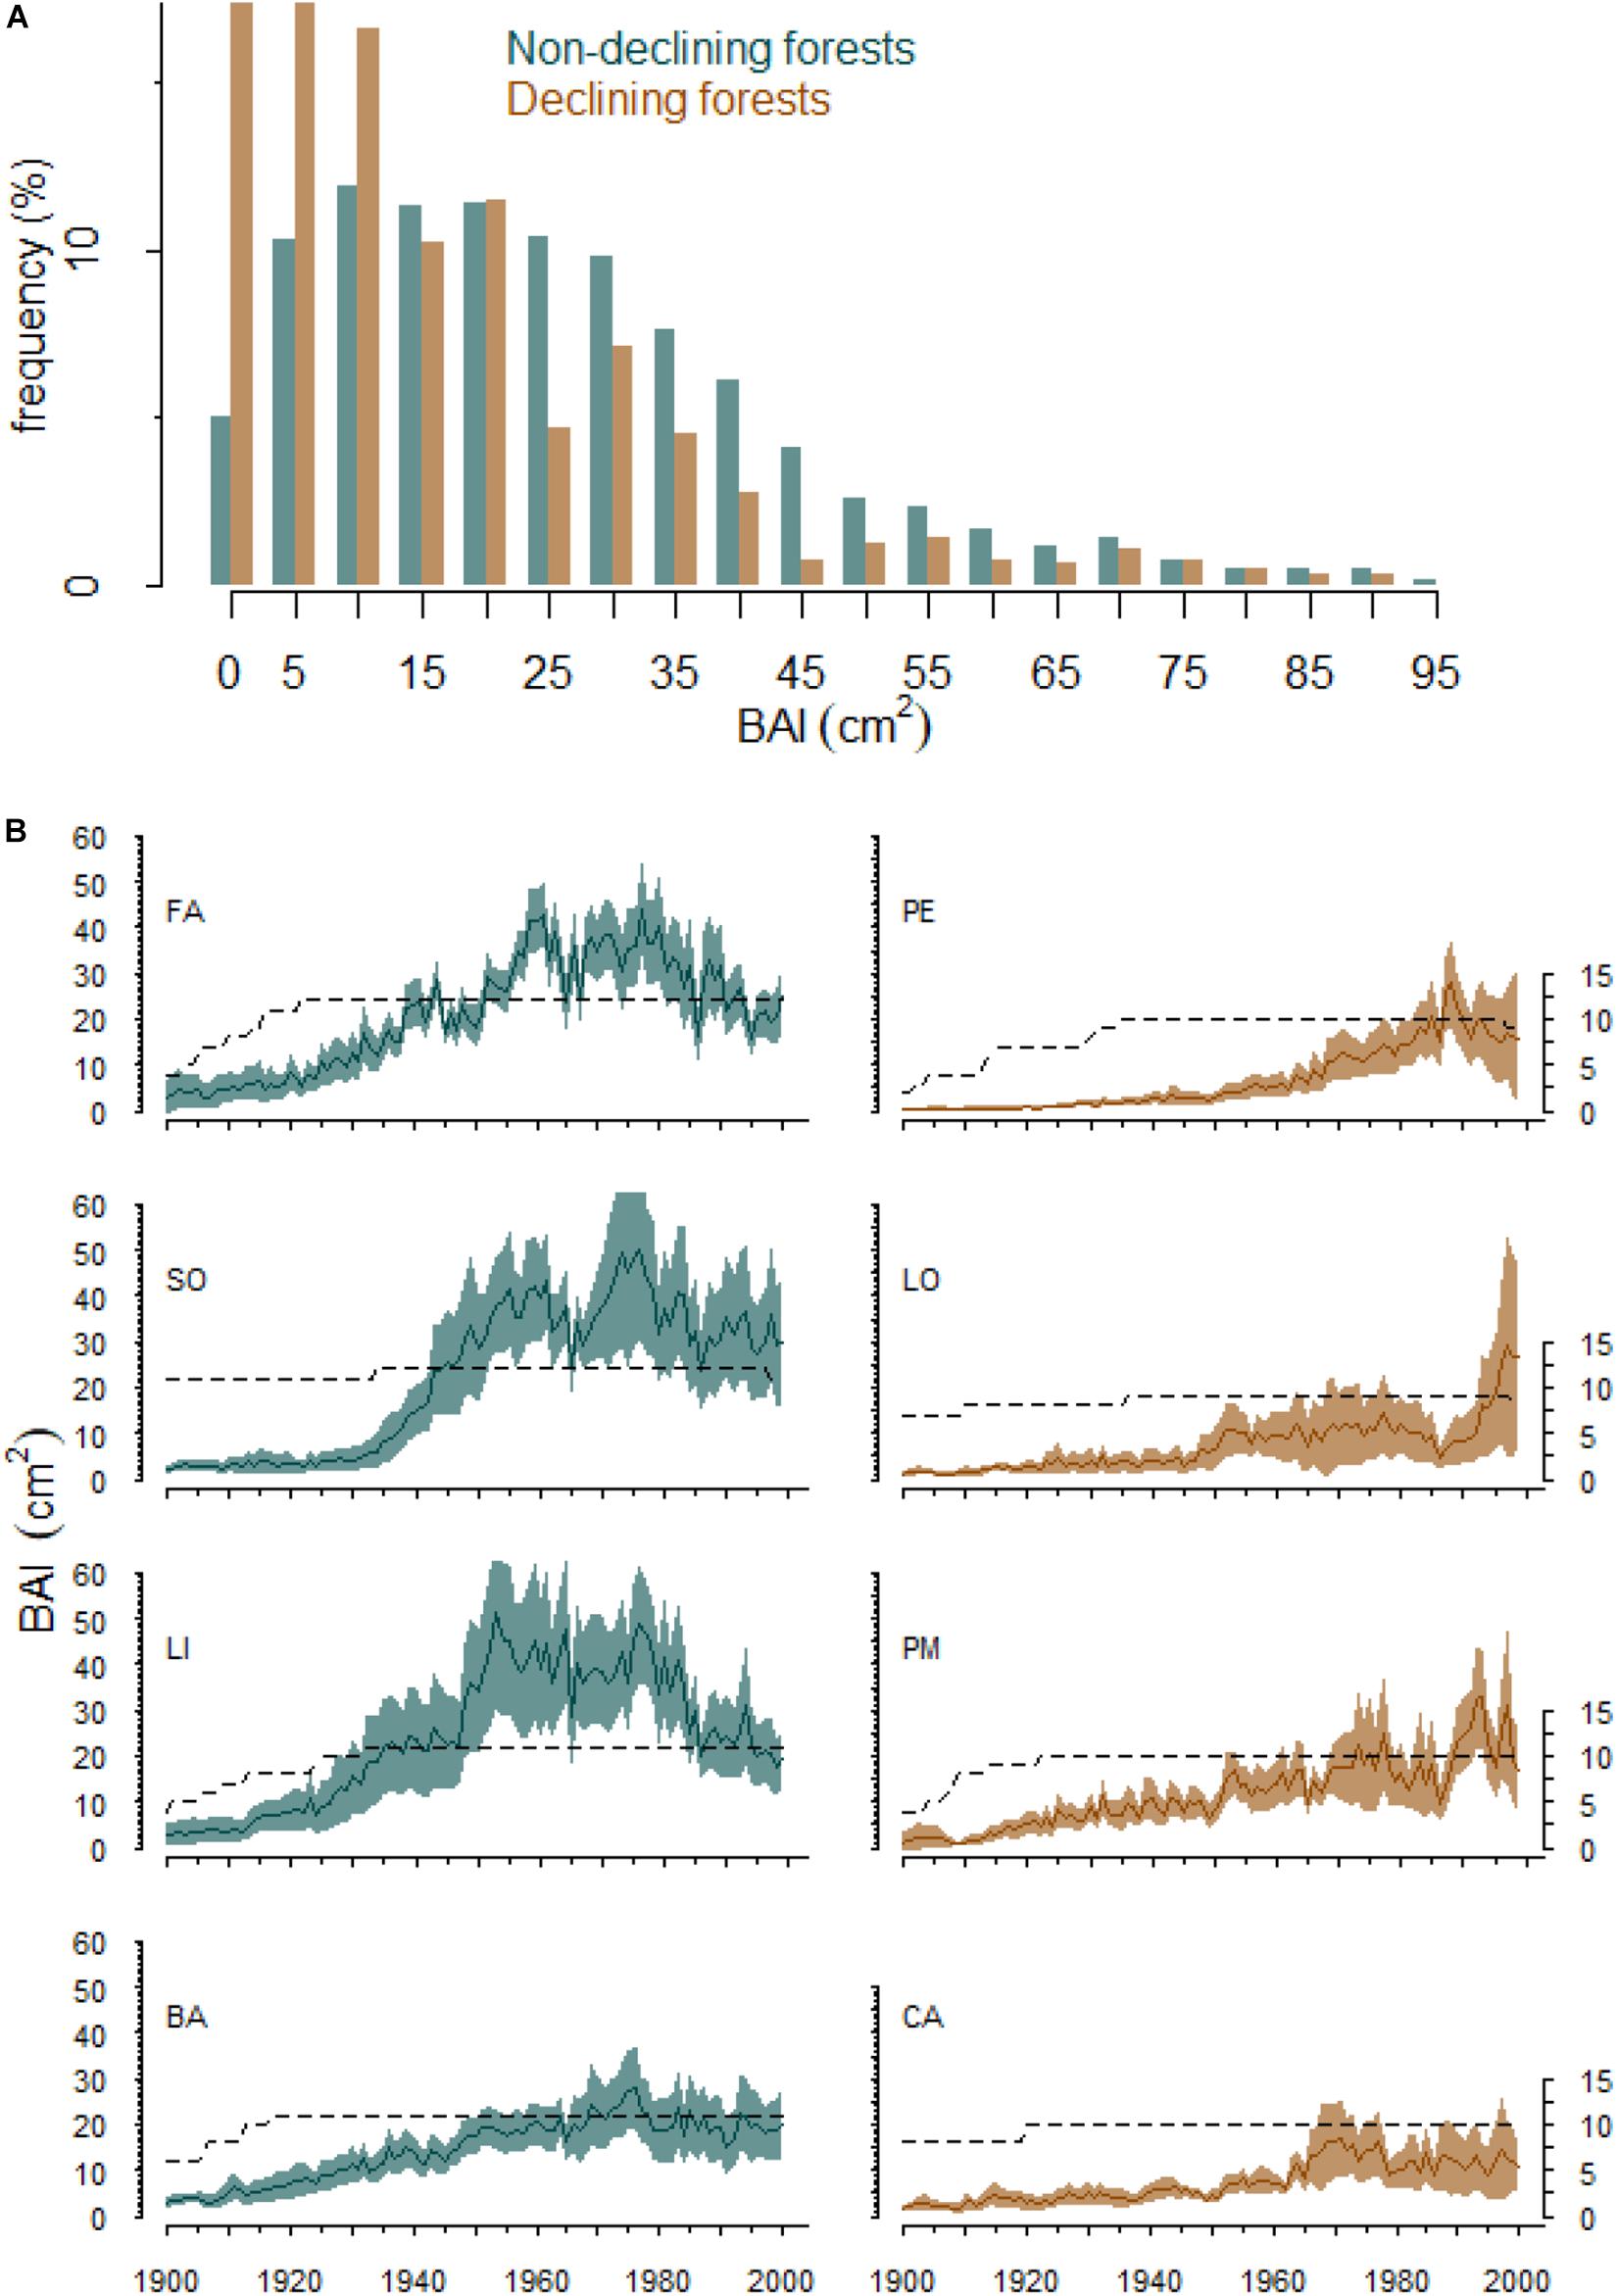
Figure 2. Growth (BAI, basal area increment) comparisons between non-declining and declining Silver fir trees (A) and trajectories of selected non-declining silver fir forests (FA, SO, LI, and BA sites) and those showing dieback (PE, LO, PM, and CA sites) (B). The dark line represents the average BAI over all the individuals sampled in the stand and the shaded areas show the 95% confidence intervals for the mean. The dashed line (secondary right y axis) represents the number of trees sampled in each stand. Blue and brown colors are used to differentiate the non-declining from declining stands showing dieback respectively.
The first and second NMDS axes accounted for a 26 and 14% of the variance in the data, respectively (Figure 3A). Tree defoliation was positively related to (in decreasing order of importance): presence of abnormal growth features in the crown apex, mistletoe abundance, winter precipitation, tree age, and the frequency of growth releases (Figure 3B). Defoliation was negatively associated with tree-ring width and summer precipitation during 1990–1994, elevation, tree dbh, summer precipitation, basal area, and cone production. A stand with a high frequency of growth releases was more likely to be more defoliated. Stands with higher summer precipitation and tree-ring width during 1990–1994 were less likely of being defoliated.
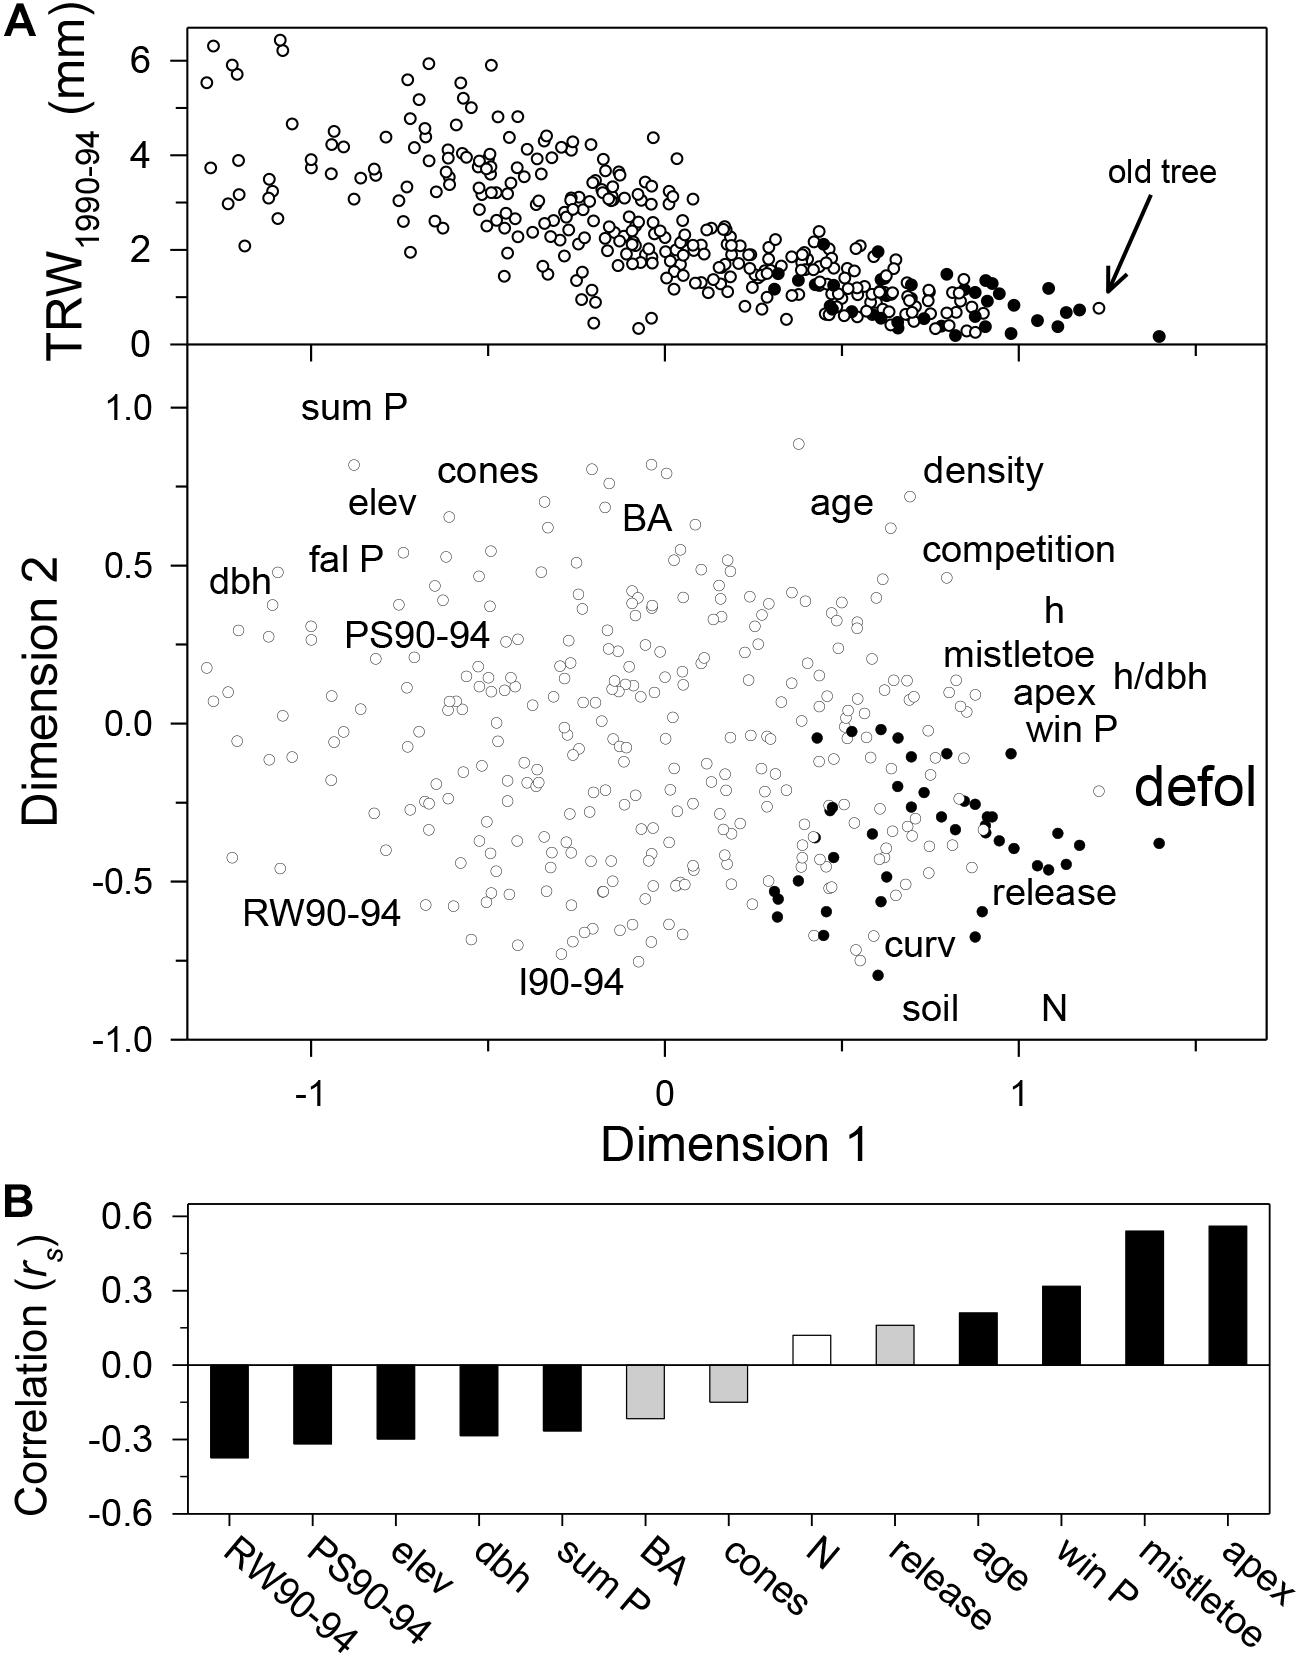
Figure 3. Main variables based on tree-level data which are related to forest decline as displayed in the ordination diagram based on the first two NMDS dimensions (A) and the ranking of those most highly related with crown defoliation (B). The lower graphs shows the Spearman correlation (rs) of tree variables and defoliation (n = 360 trees; white bar, non-significant correlation; gray bars, p < 0.05; black bars, p < 0.01). The uppermost scatter plot shows the relationship between the first NMDS axis scores and mean tree-ring width for the 1990–1994 period (note the low growth of an old but undefoliated tree indicated with the arrow). Trees are represented according to their crown defoliation (filled symbols, crown > 50% defoliation; empty symbols, crown ≤ 50% defoliation). The variables scores have been displaced to improve clarity. Variables and their abbreviations are as follows: age, estimated tree age at 1.3 m; apex, presence of abnormal growth features in the crown apex; BA, basal area in the neighborhood of each sampled tree; competition, Lorimer competition index; curv, terrain curvature; cones, cone production; dbh, stem diameter at 1.3 m; defol, crown defoliation; density, tree density; elev, elevation; mistletoe, mistletoe abundance; fal/sum/win P, percentage of total annual precipitation recorded during fall/summer/winter; h, height; h/dbh, height-to-dbh ratio; RW90-94/I90-94/, mean tree-ring width/index for the 1990–1994 period; N, northness; PS90-94, summer precipitation recorded during the 1990–1994 period; release, number of releases during the past five decades; soil, soil type (acid, basic).
Tree Growth and Response to Climate
The selected GAMM included as fixed factors thin plate regression splines for tree age, dbh and year and a linear function of SPEI_JUN03 and T Sep (Table 3, Supplementary Table S1, and Supplementary Figure S3). Further, an interaction between the spline of year and defoliation was included. These results indicate that growth trends vary with the degree of tree defoliation considerably (Figures 2, 4). The model accounted for 48% of the variation in BAI. Non-declining trees tended to present more stable BAI trajectories than declining trees (Figure 4). The effect of year in severely defoliated trees (4 and 5 classes) was clearly negative after the late 1980s (Figure 4), indicating marked growth reductions in those trees.
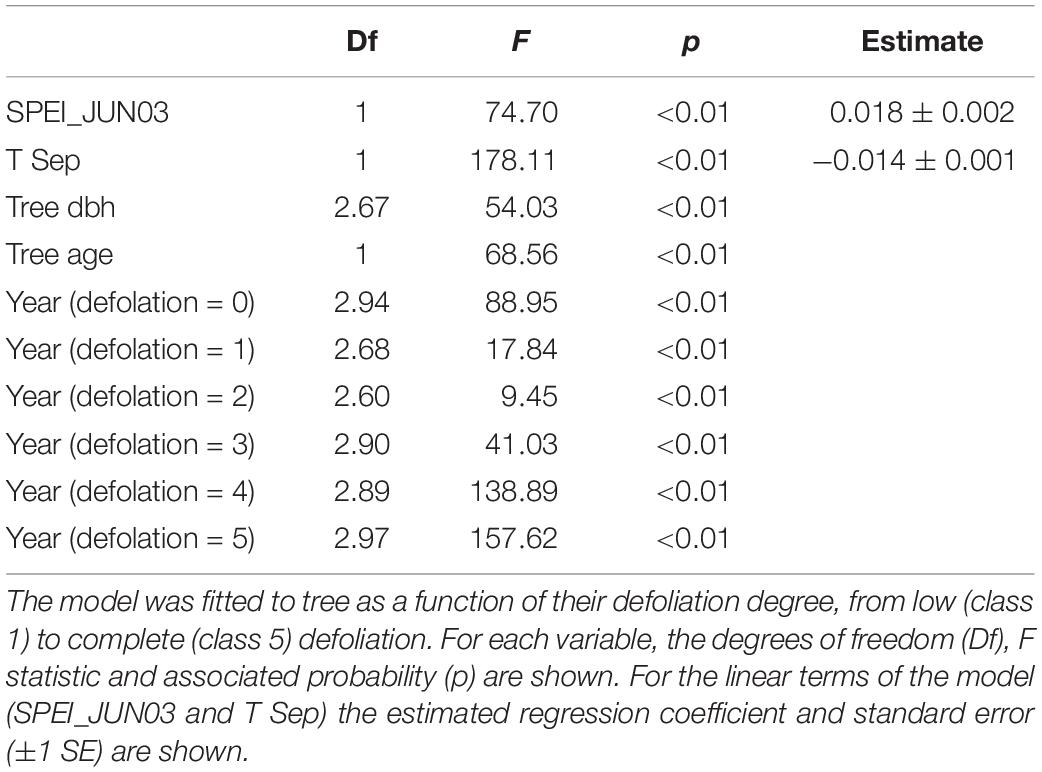
Table 3. Summary of the Generalized additive mixed model selected to predict basal area increment as a function of drought (SPEI03, 3-month long June SPEI), previous September temperature (T Sep), tree diameter at breast height (dbh) and tree age at 1.3 m.
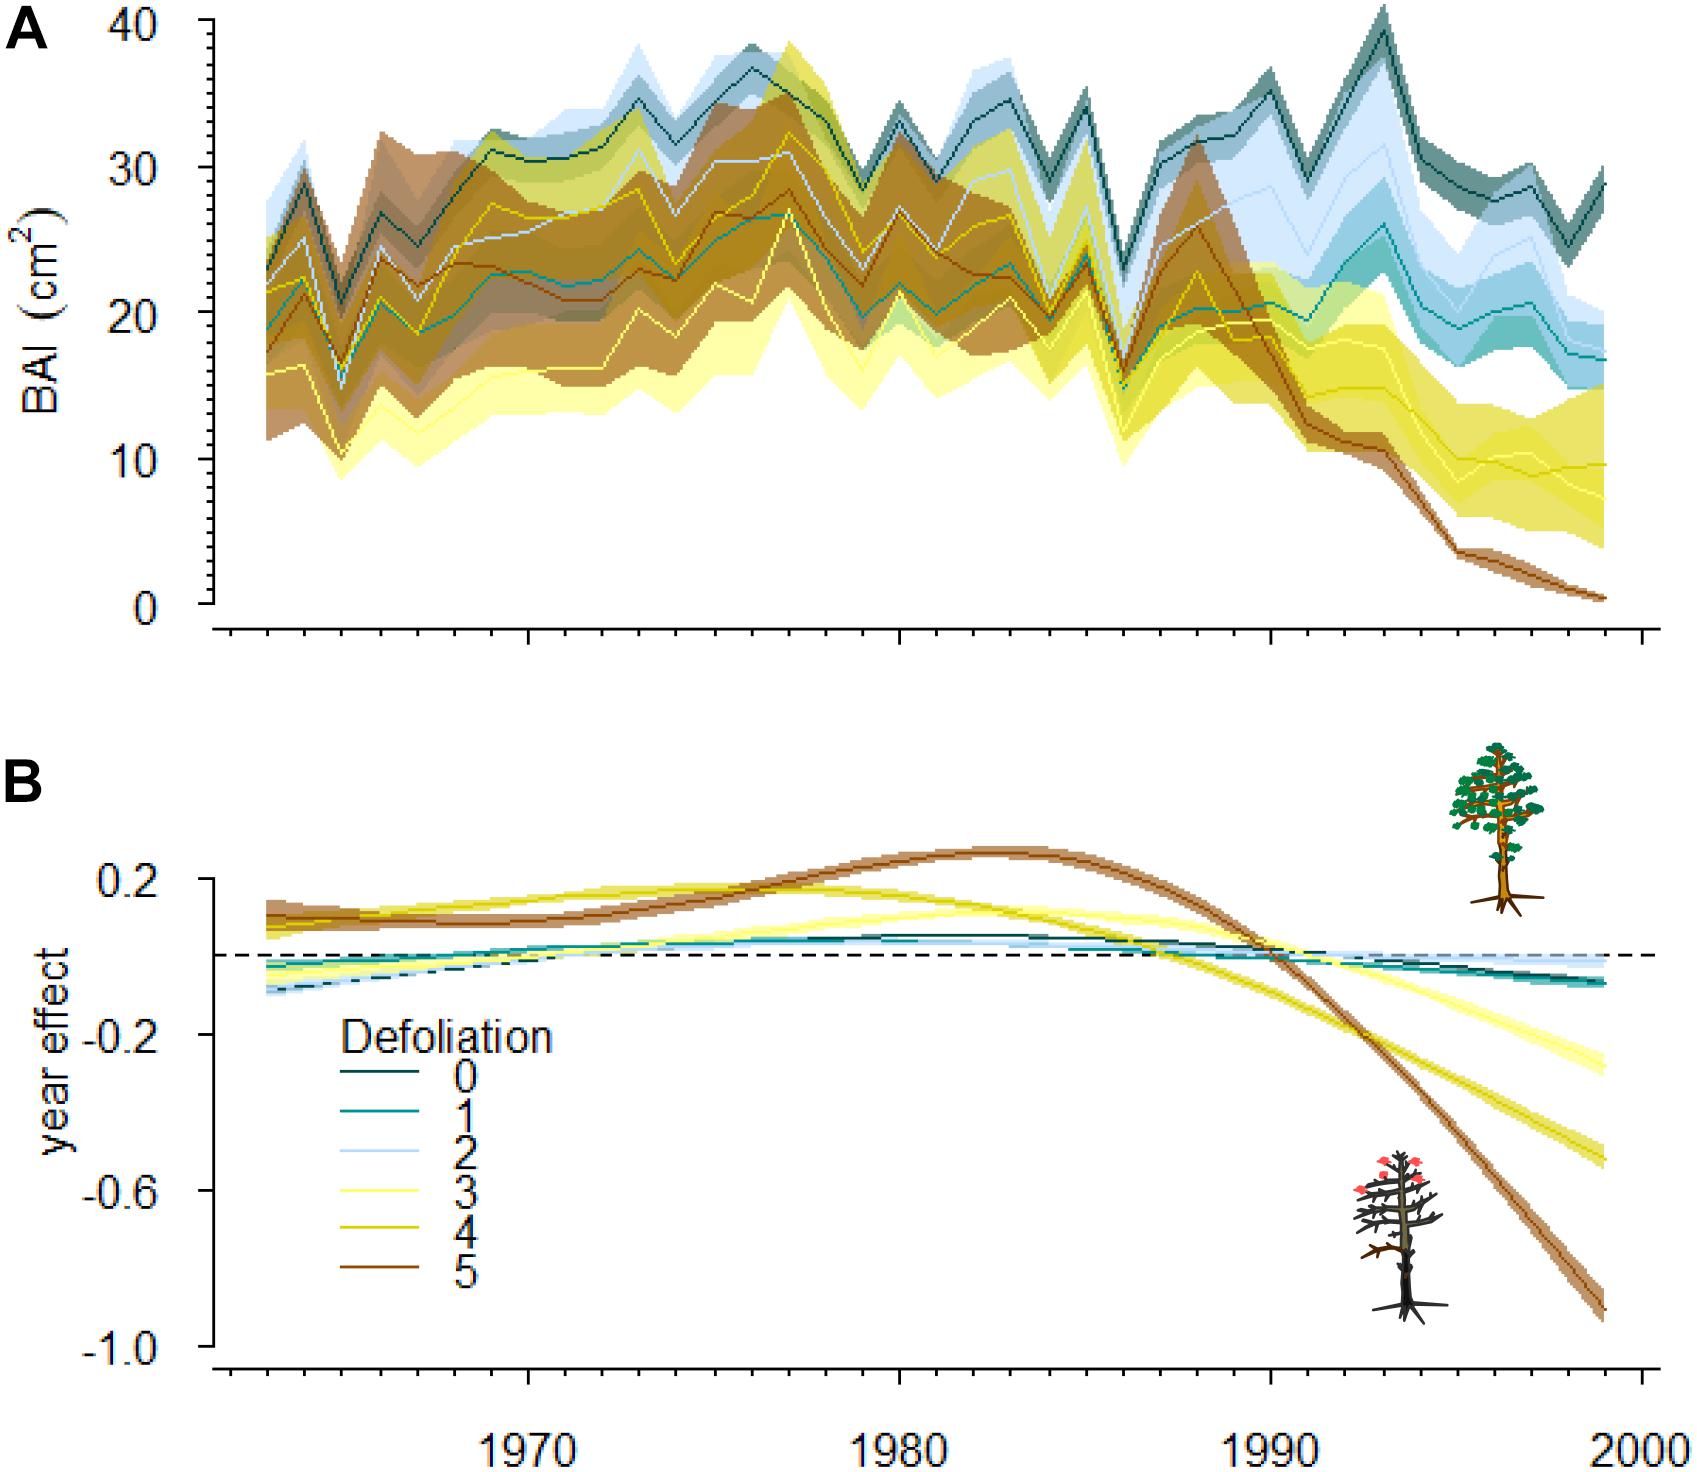
Figure 4. Observed growth trends for trees with different defoliation degree (A) and the effect of year on basal area increment (BAI) (B). The effect of year on BAI was dependent on defoliation according to the generalized additive model selected (Table 3). Different colors are used to represent the effect of year on BAI at different defoliation classes (0 to 5, from low to complete defoliation; see the tree sketches). Blue and brown colors differenciate non-declining (defoliation degree 0–2) from declining trees (3–5). Values close to zero indicate no influence of year on BAI, larger values indicate stronger effects. Shaded areas represent standard errors for the mean and the effects in (A,B) respectively.
Past and Present Forest Defoliation and Growth Trends
Dieback in the CA site has intensified over the last two decades since the percentage of trees showing complete defoliation or recently dead has increased from 0 to 21%. However, in site BA no defoliation was observed in the 1999–2000 and 2019 samplings. Consequently, no differences in defoliation degree between BA and CA were found when data from the 1999–2000 sampling was compared (χ2 = 2.02; P = 0.16). However, significant differences in defoliation between these sites were observed when data from the 2019 sampling were compared (χ2 = 14.50; P < 0.01).
The projection of BAI for the period 2000–2016 according to the GAMM fitted to the BAI of the 1999–2000 sampling data showed negative growth trends in both the CA and BA sites (Figure 5). We found a significant positive relationship between the observed and the projected BAI series for the period 2000–2016 in both CA (r = 0.36; P < 0.01) and BA (r = 0.68; P < 0.01) sites. However, we did not find significant differences at the stand level neither in CA nor in BA.
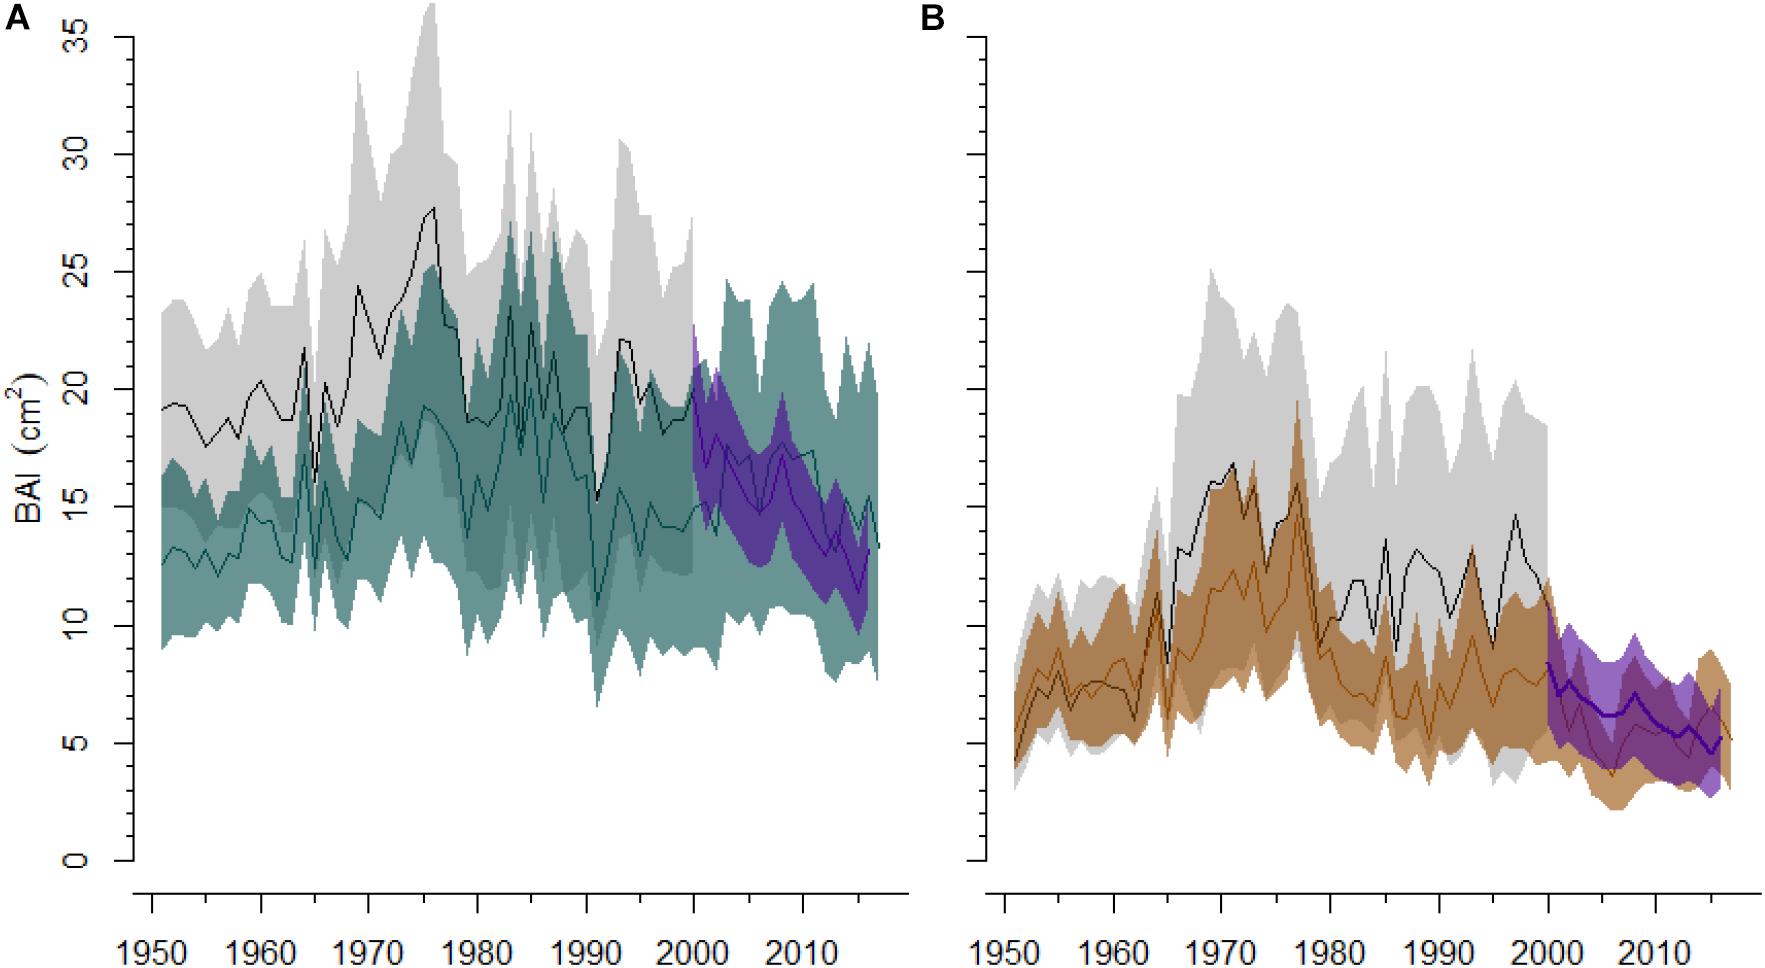
Figure 5. Past and present growth (BAI, basal area increment) trajectories in a non-declining (A, site BA) Silver fir site and a showing dieback (B, site CA). Black lines and gray areas represent the mean BAI and its 95% confidence intervals (CIs), respectively, for the trees sampled in 1999–2000. Blue and brown lines and corresponding shaded areas represent the mean BAI and 95% CIs of the trees sampled in 2019, in the non-declining and the silver fir stand showing dieback respectively. The purple line and dashed area represents the mean of the projected BAI (and 95% CIs) according to the generalized additive mixed effect model.
Discussion
We verify in this study that Silver fir dieback, manifested as severe defoliation and high mortality, is related to long-term reductions in radial-growth rates. Not surprisingly, the most defoliated trees presented lower growth rates in the last years (narrower growth rings; Figures 2A, 3B) but also displayed more negative growth trends after the 1980s (Figure 4). Thus, the retrospective quantification of growth patterns has strong potential to serve as an early warning signal of such processes (Camarero et al., 2015). According to this result, Silver firs presenting more negative growth trends within a stand should be more vulnerable than coexisting individuals. However, our models still offer poor projections of Silver fir growth trends (Figure 5), indicating that forecasting forest vulnerability as related to drought and dieback remains a more complicated issue (but see Sánchez-Salguero et al., 2017a, b). While we found a good correlation between observed and forecasted BAI values in the non-declining BA stand, the results were less robust in the CA stand showing dieback. These results emphasize that a single model of growth is not robust enough to project the strong variability in growth between trees and years. Therefore, while negative growth trends may inform about vulnerability at the tree level within stands, they do not provide a tool to forecast stand dynamics in response to recent warming. Thus, we encourage the continuous monitoring of tree defoliation and the updating of growth data in similarly vulnerable tree populations as a tool to better understand how growth trends can help us better forecast silver fir decline.
The higher defoliation found in stands showing dieback that presented lower values of summer precipitation confirms the great sensitivity of Silver fir growth to spring-summer water stress (Rolland et al., 1999; Aussenac, 2002). However, the marked sensitivity of Silver fir to drought at the Pyrenees contrasts with its capacity to tolerate drought in higher latitudes where climatic conditions are probably wetter and cooler (e.g., Gazol et al., 2015; Vitasse et al., 2019). But more importantly, the relationship found between frequent releases and the low growth rates in the stands showing dieback suggests that management history interacts with climate on determining Silver fir dieback (Becker et al., 1989; Camarero et al., 2011). Historical land-use changes have persistent effects on forest changing their structure, their long-term growth rates and even soil nutrient availability (Dupouey et al., 2002). At least two explanations can be provided to explain the feedbacks between past use and current drying trends to explain Silver fir dieback. First, past thinning was severe and selective enough to remove the largest, fast-growing trees and to leave slow-growing trees more vulnerable to drought stress (Reams and Huso, 1990; Camarero et al., 2011). This is a plausible scenario for the Spanish Pyrenees where intense logging affected many Silver fir forests during the 1950s, when a period of widespread economic autocracy occurred (Cabrera, 2001). This might indicate that tree-to-tree interactions may play a secondary role as compared to intrinsic tree factors (Linares and Camarero, 2012). Second, past logging could have enhanced the spread of fungal pathogens (e.g., Heterobasidion spp.) by forming stumps which act as infection foci (Oliva and Colinas, 2007), but this idea has not been supported by field data (Sangüesa-Barreda et al., 2015).
The results of our GAMM align with previous studies indicating that Silver fir growth responded positively to wetter spring and summer conditions and negatively to high temperatures during the autumn prior to the year of tree-ring formation. The process of Silver fir dieback in the Spanish Pyrenees probably started in response to the severe 1985–1986 drought which reduced growth in most forests (Camarero et al., 2011). This year was characterized by a reduced water availability since the beginning of the previous year and very low temperatures in April, both constraining conditions for Silver fir radial growth. Recent empirical evidence suggests that late-frost and drought events may synergistically reduce Silver fir growth (Gazol et al., 2019). The extraordinary convergence of these two extreme events can be the explanation for the widespread dieback of several populations.
Thus, the occurrence of several consecutive droughts after the early 1980s can partially explain the Silver fir dieback in low-elevation sites where drought may be more intense than in high-elevation, cool sites (Camarero et al., 2011, 2018). The consequences of drought on silver-fir growth can last for several years, leading to legacy effects (Gazol et al., 2018). In fact, long-term growth trends explain the decline of Silver fir trees better than short-term resilience indices in stands showing dieback (Camarero et al., 2018). The occurrence of these consecutive events may have hindered the capacity of trees to recover thus lowering resilience and resulting in negative growth trends (Bréda et al., 2006). These processes may explain the long-term, irreversible decrease in growth following dry periods, which may be associated to impending tree death in very defoliated trees (Camarero et al., 2015). These results indicate that negative growth trends after the occurrence of severe droughts, as those observed in severely defoliated trees (Figure 4), are reliable indicators of dieback at the tree level.
While the observation of negative growth trends and loss of resilience capacity remains straightforward, projecting growth trends into the future remains challenging. Recent studies have forecasted an increased vulnerability of Silver-fir growth variability to summer drought in the Pyrenees (Sánchez-Salguero et al., 2017b). However, these models focused on year-to-year growth variability (i.e., ring-width indexes) and thus do not inform on the potential growth trajectories and changes in forest productivity. While our models projected negative growth trends for moderately to highly defoliated trees (Figure 4), the projected BAI was markedly lower in the CA site than in the non-declining BA site (Figure 5). However, interannual growth variations did not match between observed and projected series, mainly in the stand showing dieback, pointing to the low capacity of the model to forecast Silver fir growth decline and dieback. This can be explained by two reasons. First, we proposed a single model for the growth of Silver fir across the entire study area; and so, we lost capacity to account for the great variety of local factors that can influence Silver fir growth including competition (Rolland et al., 1999). Second, we found no significant influences of the multitude of climate factors that can influence Silver fir growth. For example, we found no influences of the temperatures of current February and April that are known to influence Silver fir growth substantially (Camarero et al., 2011). The lack of influence of April temperature can be explained because its effect can be partially accounted for the drought index. Further, potential biotic interactions with other tree species (e.g., F. sylvatica) and hemi-parasitic plants (V. album) were omitted for the sake of simplicity and to avoid overfitting the model.
The sudden increase in defoliation observed in the CA site during the last two decades highlights the increasing vulnerability of the montane Silver fir forests to drought in the Pyrenees. Furthermore, this indicates that low growth rates and negative growth trends are good proxies of tree vulnerability (Camarero et al., 2018), whenever other factors are discarded or considered. For instance, outbreaks of defoliating insects cause sharp growth reductions which are reversible (Camarero et al., 2003), whilst recent and sharp growth increases (releases) after the 1980s dieback may be caused by logging of dead trees (e.g., Figure 2B, sites PE and LO) and cannot be confused with recovery trajectories. We sustain this hypothesis on the links between defoliation and growth in the fact that defoliation has increased in the CA site where growth was lower than forecasted and showed a negative growth trend (Figure 5). This highlights that the vulnerability of these forests to drought might increase in coming decades as forecasted by models solely focusing on growth variability (Sánchez-Salguero et al., 2017a, b). However, we still need to answer which forests are more vulnerable and how can we anticipate their decline. To this end, monitoring those sites that were sampled two decades ago may provide very valuable information and enhance our ability to forecast its vulnerability.
Under the high-emission pathway RCP8.5 scenario which forecasts a warming increase ranging between +1.4 and +4.8°C in 2100 (Van Vuuren et al., 2011), Ruosch et al. (2016) predicted significant losses of Silver fir cover in southern Europe, albeit they considered their predictions were not likely to occur because most of these forests are restricted to moist and cool sites at elevations above 800 m, a bioclimatic situation comparable to forests of the species in central Europe. Our results do not support their assumptions since we detected severe defoliation and mortality in some of the study stands. Such drought-induced dieback processes have been going on at least for the last two decades and call for urgent attention on potential feedbacks between global-change drivers as historical logging and recent warming trends (Camarero et al., 2011).
To conclude, monitoring and updating crown defoliation and combining those data with a retrospective quantification of radial growth in trees of different vigor (defoliation classes) are useful tools to forecast forest vulnerability in response to drought stress. We applied these ideas to the recent dieback of Silver fir forests in some Pyrenean sites. We found that: (i) declining growth patterns are good indicators of dieback in Silver fir, and (ii) revisiting study sites where dieback and defoliation had been previously monitored helps to better forecast the loss of tree vigor. Negative growth trends in defoliated individuals started years before defoliation can be observed. Thus, those individuals displaying very negative growth trends within stands can be considered vulnerable. Sites showing dieback were clustered in the western part of our study area, where summer precipitation is lower than in eastern sites, and also at lower elevations, where defoliation rates and growth decreases were lower than in sites at higher elevations and showing not dieback.
Data Availability Statement
All datasets generated for this study are included in the article/Supplementary Material.
Author Contributions
All authors developed the original idea of the study, carried out the field sampling and tree-ring measurements, and contributed to discussing and editing the final text. AG analyzed the data. GS-B made the map.
Funding
This study was supported by projects FunDiver (CGL2015-69186-C2-1-R) and FORMAL (RTI2018-096884-B-C31) from the Spanish Ministry of Science, Innovation and Universities. GS-B was supported by a Spanish Ministry of Economy, Industry and Competitiveness Postdoctoral grant (FJCI 2016-30121; FEDER funds).
Conflict of Interest
The authors declare that the research was conducted in the absence of any commercial or financial relationships that could be construed as a potential conflict of interest.
Supplementary Material
The Supplementary Material for this article can be found online at: https://www.frontiersin.org/articles/10.3389/ffgc..00036/full#supplementary-material
References
Allen, C. D., Breshears, D. D., and McDowell, N. G. (2015). On underestimation of global vulnerability to tree mortality and forest die-off from hotter drought in the Anthropocene. Ecosphere 6:129.
Allen, C. D., Macalady, A. K., Chenchouni, H., Bachelet, D., McDowell, N., Vennetier, M., et al. (2010). A global overview of drought and heat-induced tree mortality reveals emerging climate change risks for forests. For. Ecol. Manage. 259, 660–684. doi: 10.1016/j.foreco.2009.09.001
Aussenac, G. (2002). Ecology and ecophysiology of circum-Mediterranean firs in the context of climate change. Ann. For. Sci. 59, 823–832. doi: 10.1051/forest:2002080
Becker, M., Landmann, G., and Lévy, G. (1989). Silver fir decline in the Vosges mountains (France): role of climate and silviculture. Water Air Soil Pollut. 48, 77–86.
Bréda, N., Huc, R., Granier, A., and Dreyer, E. (2006). Temperate forest trees and stands under severe drought: a review of ecophysiological responses, adaptation processes and long-term consequences. Ann. For. Sci. 63, 625–644. doi: 10.1051/forest:2006042
Büntgen, U., Tegel, W., Kaplan, J. O., Schaub, M., Hagedorn, F., Bürgi, M., et al. (2014). Placing unprecedented recent fir growth in a European-wide and Holocene-long context. Front. Ecol. Environ. 12, 100–106. doi: 10.1890/130089
Burnham, K. P., and Anderson, D. R. (2002). Model Selection and Multimodel Inference: a Practical Information-Theoretic Approach, 2nd Edn. New York, NY: Springer-Verlag.
Cabrera, M. (2001). Evolución de abetares del Pirineo aragonés. Cuad. Soc. Esp. Cienc. For. 11, 43–52.
Cailleret, M., Dakos, V., Jansen, S., Robert, E. M. R., Aakala, T., Amoroso, M. M., et al. (2019). Early-warning signals of individual tree mortality based on annual radial growth. Front. Plant Sci. 9:1964. doi: 10.3389/fpls.2018.01964
Cailleret, M., Jansen, S., Robert, E. M. R., Desoto, L., Aakala, T., and Antos, J. A. (2017). A synthesis of radial growth patterns preceding tree mortality. Glob. Change Biol. 23, 1675–1690. doi: 10.1111/gcb.13535
Camarero, J. J. (2017). “The multiple factors explaining decline in mountain forests: historical logging and warming-related drought stress is causing silver-fir dieback in the Aragón Pyrenees,” in High Mountain Conservation in a Changing World, Advances in Global Change Research 62, eds J. Catalan, J. M. Ninot, M. Aniz, and M. Mercè (Berlin: Springer), 131–154. doi: 10.1007/978-3-319-55982-7_6
Camarero, J. J., Bigler, C., Linares, J. C., and Gil-Pelegrín, E. (2011). Synergistic effects of past historical logging and drought on the decline of Pyrenean silver fir forests. For. Ecol. Manag. 262, 759–769. doi: 10.1016/j.foreco.2011.05.009
Camarero, J. J., Gazol, A., Sangüesa-Barreda, G., Cantero, A., Sánchez-Salguero, R., Sánchez-Miranda, A., et al. (2018). Forest growth responses to drought at short- and long-term scales in Spain: squeezing the stress memory from tree rings. Front. Ecol. Evol. 6:9. doi: 10.3389/fevo.2018.00009
Camarero, J. J., Gazol, A., Sangüesa-Barreda, G., Oliva, J., and Vicente-Serrano, S. M. (2015). To die or not to die: early-warning signals of dieback in response to a severe drought. J. Ecol. 103, 44–57. doi: 10.1111/1365-2745.12295
Camarero, J. J., Martín-Bernal, E., and Gil-Pelegrín, E. (2003). The impact of a needleminer (Epinotia subsequana) outbreak on radial growth of silver fir (Abies alba) in the Aragón Pyrenees: a dendrochronological assessment. Dendrochronologia 21, 1–10.
Caudullo, G., Welk, E., and San-Miguel-Ayanz, J. (2017). Chorological maps for the main European woody species. Data Brief 12, 662–666. doi: 10.1016/j.dib.2017.05.007
Ceballos, L., and Ruiz de la Torre, J. (1979). Árboles y Arbustos de la España Peninsular. Madrid: ETSIM.
Dobbertin, M. (2006). Tree growth as indicator of tree vitality and of tree reaction to environmental stress: a review. Eur. J. For. Res. 125:89. doi: 10.1007/s10342-006-0110-1
Druckenbrod, D. L., Martin-Benito, D., Orwig, D. A., Neil, P., Benjamin, P., Katherine, M. R., et al. (2019). Redefining temperate forest responses to climate and disturbance in the eastern United States: new insights at the mesoscale. Glob. Ecol. Biogeogr. 28, 557–575. doi: 10.1111/geb.12876
Duncan, R. P. (1989). An evaluation of errors in tree age estimates based on increment cores in Kahikatea (Dacrycarpus dacrydioides). N. Z. Nat. Sci. 16, 31–37.
Dupouey, J. L., Dambrine, E., Laffite, J. D., and Moares, C. (2002). Irreversible impact of past land use on forest soils and biodiversity. Ecology 83, 2978–2984. doi: 10.1890/0012-9658(2002)083[2978:iioplu]2.0.co;2
FAO (2006). World Reference Base for Soils Resources. World Soil Resource Report No. 103. Rome: FAO.
Gazol, A., Camarero, J. J., Colangelo, M., De Luis, M., Martínez del Castillo, E., and Serra-Maluquer, X. (2019). Summer drought and spring frost, but not their interaction, constrain European beech and Silver fir growth in their southern distribution limits. Agric. For. Meteorol. 278:107695. doi: 10.1016/j.agrformet.2019.107695
Gazol, A., Camarero, J. J., Gutiérrez, E., Popa, I., Andreu-Hayles, L., Motta, R., et al. (2015). Distinct effects of climate warming on populations of silver fir (Abies alba) across Europe. J. Biogeogr. 42, 1150–1162. doi: 10.1111/jbi.12512
Gazol, A., Camarero, J. J., Vicente-Serrano, S. M., Sánchez-Salguero, R., Gutiérrez, E., de Luis, M., et al. (2018). Forest resilience to drought varies across biomes. Glob. Change Biol. 24, 2143–2158. doi: 10.1111/gcb.14082
Gazol, A., Ribas, M., Gutiérrez, E., and Camarero, J. J. (2017). Aleppo pine forest from across Spain show drought-induced growth decline and partial recovery. Agric. For. Meteorol. 232, 186–194. doi: 10.1016/j.agrformet.2016.08.014
Hernández, L., Camarero, J. J., Gil-Peregrín, E., Saz-Sánchez, M. A., Cañellas, I., and Montes, F. (2019). Biotic factors and increasing aridity shape the altitudinal shifts of marginal Pyrenean silver fir populations in Europe. For. Ecol. Manag. 432, 558–567. doi: 10.1016/j.foreco.2018.09.037
Hoerling, M., Eischeid, J., Perlwitz, J., Quan, X., Zhang, T., and Pegion, P. (2012). On the increased frequency of Mediterranean drought. J. Clim. 25, 2146–2161. doi: 10.1175/jcli-d-11-00296.1
Holmes, R. L. (1983). Computer-assisted quality control in tree-ring dating and measurement. Tree Ring Bull. 43, 69–78. doi: 10.1016/j.dib.2018.08.019
Kenkel, N. C., and Orlóci, L. (1986). Applying metric and nonmetric multidimensional scaling to ecological studies: some new results. Ecology 67, 919–928. doi: 10.2307/1939814
LeBlanc, D. C., Nicholas, N. S., and Zedaker, S. M. (1992). Prevalence of individual-tree growth decline in red spruce populations of the southern Appalachian Mountains. Can. J. For. Res. 22, 905–914. doi: 10.1139/x92-120
Linares, J. C., and Camarero, J. J. (2012). Silver fir defoliation likelihood is related to negative growth trends and high warming sensitivity at their southernmost distribution limit. ISRN For. 2012:437690. doi: 10.5402/2012/437690
Lorimer, C. G. (1983). Tests of age-independent competition indices for individual trees in natural hardwood stands. For. Ecol. Manag. 6, 343–360. doi: 10.1016/0378-1127(83)90042-7
Macias, M., Andreu, L., Bosch, O., Camarero, J. J., and Gutiérrez, E. (2006). Increasing aridity is enhancing silver fir (Abies alba Mill.) water stress in its south-western distribution limit. Clim. Change 79, 289–313. doi: 10.1007/s10584-006-9071-0
Magurran, A. E. (1988). Ecological Diversity and its Measurement. Princeton, NJ: Princeton University Press.
Maiorano, L., Cheddadi, R., Zimmermann, N. E., Pellissier, L., Petitpierre, B., Pottier, J., et al. (2013). Building the niche through time: using 13,000 years of data to predict the effects of climate change on three tree species in Europe. Glob. Ecol. Biogeogr. 22, 302–317. doi: 10.1111/j.1466-8238.2012.00767.x
Manion, P. D. (2003). Evolution of concepts in forest pathology. Phytopathology 93, 1052–1055. doi: 10.1094/PHYTO.2003.93.8.1052
Mauri, A., de Rigo, D., and Caudullo, G. (eds). (2016). “Abies alba in Europe: distribution, habitat, usage and threats,” in European Atlas of Forest Tree Species, (Brussels: Publication Office of the European Union), 48–49.
McCune, B., and Mefford, M. J. (1999). PC-ORD Multivariate Analysis of Ecological Data. Version 4. Gleneden Beach, OR: MJM Software Design.
McDowell, N., Pockman, W. T., Allen, C. D., David, D. B., Neil, C., Thomas, K., et al. (2008). Mechanisms of plant survival and mortality during drought: why do some plants survive while others succumb to drought? New Phytol. 178, 719–739. doi: 10.1111/j.1469-8137.2008.02436.x
Minchin, P. R. (1987). An evaluation of relative robustness of techniques for ecological ordinations. Vegetatio 71, 145–156.
Müller, E. H. R., and Stierlin, H. R. (1990). Sanasilva Tree Crown Photos with Percentages of Foliage Loss. Birmensdorf: WSL.
Nowacki, G. J., and Abrams, M. D. (1997). Radial-growth averaging criteria for reconstructing disturbance histories from presettlement-origin oaks. Ecol. Monogr. 67, 225–249. doi: 10.1890/0012-9615(1997)067[0225:rgacfr]2.0.co;2
Oliva, J., and Colinas, C. (2007). Decline of silver fir (Abies alba Mill.) stands in the Spanish Pyrenees: role of management, historic dynamics and pathogens. For. Ecol. Manag. 252, 84–97. doi: 10.1016/j.foreco.2007.06.017
Pasho, E., Camarero, J. J., de Luis, M., and Vicente-Serrano, S. M. (2011). Impacts of drought at different time scales on forest growth across a wide climatic gradient in north-eastern Spain. Agric. For. Meteorol. 151, 1800–1811. doi: 10.1016/j.agrformet.2011.07.018
Reams, G. A., and Huso, M. M. P. (1990). Stand history: an alternative explanation of red spruce radial growth reduction. Can. J. For. Res. 20, 250–253. doi: 10.1139/x90-036
Rolland, C., Michalet, R., Desplanque, C., Petetin, A., and Aime, S. (1999). Ecological requirements of Abies alba in the French Alps derived from dendro-ecological analysis. J. Veg. Sci. 10, 297–306. doi: 10.2307/3237059
Ruosch, M., Spahni, R., Joos, F., Henne, P. D., van der Knaap, W. O., and Tinner, W. (2016). Past and future evolution of Abies alba forests in Europe - comparison of a dynamic vegetation model with palaeo data and observations. Glob. Change Biol. 22, 727–740. doi: 10.1111/gcb.13075
Sánchez-Salguero, R., Camarero, J. J., Carrer, M., Gutiérrez, E., Alla, A. Q., Andreu-Hayles, L., et al. (2017a). Climate extremes and predicted warming threaten Mediterranean Holocene firs forests refugia. Proc. Natl. Acad. Sci. U.S.A. 114, E10142–E10150. doi: 10.1073/pnas.1708109114
Sánchez-Salguero, R., Camarero, J. J., Gutiérrez, E., González Rouco, F., Gazol, A., Sangüesa-Barreda, G., et al. (2017b). Assessing forest vulnerability to climate warming using a process-based model of tree growth: bad prospects for rear-edges. Glob. Change Biol. 23, 2705–2719. doi: 10.1111/gcb.13541
Sangüesa-Barreda, G., Camarero, J. J., Oliva, J., Montes, F., and Gazol, A. (2015). Past logging, drought and pathogens interact and contribute to forest dieback. Agric. For. Meteorol. 208, 85–94. doi: 10.1016/j.agrformet.2015.04.011
Tardif, J., Camarero, J. J., Ribas, M., and Gutiérrez, E. (2003). Spatiotemporal variability in tree ring growth in the Central Pyrenees: climatic and site influences. Ecol. Monogr. 73, 241–257. doi: 10.1890/0012-9615(2003)073[0241:svitgi]2.0.co;2
Tinner, W., Colombaroli, D., Heiri, O., Henne, P. D., Steinacher, M., Untenecker, J., et al. (2013). The past ecology of Abies alba provides new perspectives on future responses of silver fir forests to global warming. Ecol. Monogr. 83, 419–439. doi: 10.1890/12-2231.1
Van Vuuren, D. P., Edmonds, J., Kainuma, M., Riahi, K., Thomson, A., Hibbard, K., et al. (2011). The representative concentration pathways: an overview. Clim. Change 109, 5–31. doi: 10.1007/s10584-011-0148-z
Vicente-Serrano, S. M., Beguería, S., and López-Moreno, J. I. (2010). A multiscalar drought index sensitive to global warming: the stamdardized precipitation evapotranspiration index. J. Clim. 23, 1696–1718. doi: 10.1175/2009jcli2909.1
Vicente-Serrano, S. M., Camarero, J. J., Zabalza, J., Sangüesa-Barreda, G., López-Moreno, J. I., and Tague, C. L. (2015). Evapotranspiration deficit controls net primary production and growth of silver fir: implications for Circum-Mediterranean forests under forecasted warmer and drier conditions. Agric. For. Meteorol. 206, 45–54. doi: 10.1016/j.agrformet.2015.02.017
Vicente-Serrano, S. M., Tomas-Burguera, M., Beguería, S., Reig, F., Latorre, B., Peña-Gallardo, M., et al. (2017). A high resolution dataset of drought indices for Spain. Data 2:22. doi: 10.3390/data2030022
Vigo, J., and Ninot, J. M. (1987). “Los pirineos,” in La Vegetación de España, eds M. Peinado Lorca and S. Rivas-Martínez (Alcalá de Henares: Universidad De Alcala Servicio De Publicaciones), 351–384.
Visser, H. (1995). Note on the relation between ring widths and basal area increments. For. Sci. 41, 297–304.
Vitasse, Y., Bottero, A., Rebetez, M., Conedera, M., Augustin, S., Brang, P., et al. (2019). What is the potential of silver fir to thrive under warmer and drier climate? Eur. J. For. Res. 138, 547–560. doi: 10.1007/s10342-019-01192-4
Wigley, T. M. L., Briffa, K. R., and Jones, P. D. (1984). On the average value of correlated time series, with applications in dendroclimatology and hydrometeorology. J. Appl. Meteorol. Climatol. 23, 201–213. doi: 10.1175/1520-0450(1984)023<0201:otavoc>2.0.co;2
Keywords: Abies alba, basal area increment, defoliation, dendroecology, drought stress
Citation: Gazol A, Sangüesa-Barreda G and Camarero JJ (2020) Forecasting Forest Vulnerability to Drought in Pyrenean Silver Fir Forests Showing Dieback. Front. For. Glob. Change 3:36. doi: 10.3389/ffgc.2020.00036
Received: 16 December 2019; Accepted: 10 March 2020;
Published: 31 March 2020.
Edited by:
Teresa E. Gimeno, Basque Centre for Climate Change, SpainReviewed by:
Jose Carlos Miranda, Swiss Federal Institute for Forest, Snow and Landscape Research (WSL), SwitzerlandMatthew Vadeboncoeur, University of New Hampshire, United States
Copyright © 2020 Gazol, Sangüesa-Barreda and Camarero. This is an open-access article distributed under the terms of the Creative Commons Attribution License (CC BY). The use, distribution or reproduction in other forums is permitted, provided the original author(s) and the copyright owner(s) are credited and that the original publication in this journal is cited, in accordance with accepted academic practice. No use, distribution or reproduction is permitted which does not comply with these terms.
*Correspondence: J. Julio Camarero, ampjYW1hcmVyb0BpcGUuY3NpYy5lcw==