 Natalia Ocampo-Peñuela
 John Garcia-Ulloa*†
 Christopher D. Philipson
 Jaboury Ghazoul
- Ecosystem Management Group, Institute of Terrestrial Ecosystems, Department of Environmental Systems Science, ETH Zürich, Zurich, Switzerland
Tropical forests are undergoing drastic transformations, putting at risk the species that rely on them. On the island of Borneo, between 1973 and 2015, 50% of the forest was lost, much of this to oil palm and other industries. We explore the impacts of these four decades of forest loss on the functionally connected habitat of 245 forest birds and mammals. First, we map potential suitable habitat in 1973 and 2015 by refining reported ranges by elevation, forest cover and patch size. We find that, on average, these species have lost 28% of habitat within their ranges. We then use graph-theory connectivity models to calculate the functionally connected area for each species, according to their natal dispersal abilities. We find a mean loss of 35% in functionally connected area, revealing the often hidden impacts of deforestation. Losses in functionally connected habitat are largely driven by area of habitat loss, though maximum elevational range limit also explains some of the differences modeled across species, with lowland species being most affected. We present a vulnerability index of threat arising from loss of functionally connected habitat. The spatial distribution of vulnerability index values serves as a tool for setting conservation priorities for forest remnants on Borneo, given that most of the ranges of these species are not protected. We make recommendations for the use of connectivity models to prioritize resources for research and conservation on Borneo and other biodiversity hotspots.
Introduction
Habitat loss, fragmentation, and degradation due to agricultural expansion are the main threats to tropical ecosystems and biodiversity (Pimm and Jenkins, 2010; Haddad et al., 2015). As a result, in excess of 70% of the world’s remaining forest area lies within 1 km of an edge bordering anthropogenically modified land (Haddad et al., 2015). The resulting fragmentation and degradation effects on species and ecosystems are pervasive and far ranging (Clavel et al., 2011; Estes et al., 2011; Schnell et al., 2013; Haddad et al., 2015). This is especially relevant in biodiversity hotspots, where large concentrations of endemic species coincide with alarming rates of habitat loss (Balmford and Long, 1994; Myers et al., 2000; Jenkins et al., 2013).
Habitat loss and fragmentation also affect the functional connectivity of a landscape by reducing species movement (Fischer and Lindenmayer, 2007). Movement is modulated by the quality of the intervening habitat matrix (Renjifo, 2001), the size and distribution of remnant habitat patches (Saura et al., 2014), and the dispersal capacity of the species (Tscharntke et al., 2012). A functionally connected landscape is essential for maintaining healthy populations across generations because it provides access to resources, sustains metapopulations, and supports genetic diversity through gene flow (Templeton et al., 1990; Fahrig, 2003; Sodhi et al., 2011). Reductions in population size, dispersal of young individuals, and mobility of species in fragmented landscapes also alters ecological processes such as pollination and seed dispersal (Ghazoul, 2005; Magrach et al., 2014). Losses in ecosystem functions can imperil important animal-aided restoration efforts (Corlett, 2001; Strassburg et al., 2016) and species’ adaptability and persistence in future landscapes under climate change scenarios (Scheffers et al., 2016).
The island of Borneo is an important biodiversity hotspot (Myers et al., 2000) with large concentrations of endemic and small-ranged species, and only fifty percent of its initial forest area remaining (Gaveau et al., 2016). Continued forest clearance, mainly for plantations, presents a challenge for the long-term conservation of forest vertebrates on Borneo (Gaveau et al., 2017), which acts synergistically with threats from indiscriminate hunting and wildlife trade (Meijaard et al., 2011; Collar, 2015; Harris et al., 2017). Large-scale deforestation on this island’s lowlands has been caused by a combination of commercial logging, which facilitates access to the forest, and subsequent expansion of smallholder and industrial plantations for oil palm, pulpwood, rubber, and other commodities (Abood et al., 2015). Currently, Borneo is the world’s largest oil palm producing region with 8.3 Mha of industrial plantations (Gaveau et al., 2016), and the demand for palm oil is projected to continue to increase (Corley, 2009; Malins, 2017).
An assessment of the impact of habitat loss and fragmentation on the connectivity of forest species can contribute to regional plans for preserving the integrity of Borneo’s irreplaceable and highly threatened biodiversity. These efforts are especially important to complement conservation plans such as the “Heart of Borneo” which aims to protect the island’s highlands.
The goal of this study is to quantify and assess the impacts of forest loss over the last four decades on the habitat availability and connectivity of 245 forest vertebrates on Borneo. We modeled changes in area of habitat and functionally connected habitat availability for forest mammals and birds between 1973 and 2015. To make our outputs useful to conservation practitioners, who need detailed spatial information for the prioritization of conservation actions, we mapped concentrations of vulnerable species. The combination of connectivity modeling and conservation mapping allow us to make recommendations for the regional-scale conservation of forest vertebrates on the island of Borneo.
Materials and Methods
Study Area and Forest Maps
We used forest cover maps derived from LANDSAT satellite imagery for 1973 and 2015 (Gaveau et al., 2016) (see Gaveau et al., 2016 for methodological details) to evaluate the changes in area of habitat and functionally connected habitat availability on Borneo. Following Gaveau et al. (2016), for the purpose of these maps “forest” is determined as “a natural forest that has remained in sufficiently good condition to be seen as intact or nearly intact on LANDSAT satellite imagery – this includes old-growth and selectively logged forest, and possibly some forest mildly impacted by ground fires.” This excludes “secondary forests that regrow after forest clearance, agroforests and other planted forests”. (Gaveau et al., 2016). To date, these maps are the best available for Borneo.
Study Species
We selected forest birds and mammals based on information from the Handbook of the Birds of the World Alive (del Hoyo et al., 2015), BirdLife International’s species factsheets (BirdLife International, 2014), and the International Union for the Conservation of Nature (IUCN, 2017). The selected species were those with “forest” as their only habitat of major importance. We included species that are reported to use other suitable habitats (e.g., “plantations”), which in our analysis are considered tolerant to other land cover but dependent on forests for reproduction and survival. The latter species we treated differently during the connectivity modeling, using lower resistance values for the agricultural matrix, and thus larger habitat area than forest-restricted species (see below). We excluded introduced and long-distance migrants, as well as those species whose distribution is restricted to offshore islands. For terrestrial mammals, we excluded bats due to the lack of information on their ecological requirements and dispersal ability. All species assessments were updated as of October 2016 to include recent information on species’ natural history and threats, and their Red List status currently reflects such information (IUCN, 2017).
We selected 245 species, of which 216 were birds, and 29 mammals (Supplementary Table S1). Twenty-one additional species were ultimately excluded due to lack of data (e.g., range map and weight data), and inconsistencies in the spatial data (e.g., range data does not correspond to primary habitat areas). The list of excluded species can be found in Supplementary Table S2.
Mapping Area of Habitat
We map the “area of habitat” available for a forest vertebrate species, by refining its range map by elevation, forest cover and patch size in 1973 and 2015 (Supplementary Figure S1) following methods from Brooks et al. (2019). Species ranges were freely available from BirdLife International and Handbook of the Birds of the World (2016) for birds, and IUCN (2017) for mammals (Supplementary Figure S1A). We then selected areas of preferred elevation within the range map using a Digital Elevation Model (Jarvis et al., 2008) and the species elevational range which we obtained from the IUCN Red List website (Supplementary Figure S1B). We further refined forest habitat available within each species’ range by using 1973 and 2015 forest cover maps from Gaveau et al. (2016) (Supplementary Figures S1C,D). Finally, we excluded from the resulting area of habitat forest patches smaller than 180 ha, corresponding to a (30 m × 30 m) cell count of 2,000. Forest patches with a core area of under 200 ha have been shown to support less than 60–70% of species richness of dipterocarps, the dominant tree family in Borneo (Ghazoul, 2016), than the same area of continuous forest (Lucey et al., 2017). As such, we considered forest patches under 180 ha poor substitutes for continuous forest and, thus, unlikely to sustain long-term populations for our set of forest species. We excluded these patches as core habitat but included them as stepping stones for the connectivity modeling. Species could use these patches for movement but we suspect that they cannot sustain healthy source populations. The area of the excluded patches corresponds, on average, to 2.47% (±1.55) of the area of habitat (see below).
We recognize that range maps have errors, for instance due to distribution model uncertainties or lack of observation data. Yet, the IUCN range data is widely used for conservation priority assessments (e.g., Zhang et al., 2019). To acknowledge this source of error on our data and subsequent analyses, we downloaded all Global Biodiversity Information Facility – GBIF sightings for each species after 2000.1 We then selected species with at least 5 sightings within Borneo and calculated the percentage of sightings in all locations that were within the original range, and within the range refined by elevation. Consequently, we calculated this same percentage only for sightings in unique locations (i.e., removing multiple sightings in a same location) in an effort to curate the GBIF data. Thirty-three species (14 birds and 19 mammals) had fewer than 5 sightings within the island of Borneo on the GBIF database and were thus excluded from this analysis. On average, 82% of the total locations and 79% of unique locations fell within the original range, and 77% of all locations and 73% of unique locations coincided with the range after it was refined by elevation (Supplementary Figure S2 and Supplementary Table S3). Although better distribution models for Borneo’s species are needed, we believe the IUCN ranges provide a reasonably sound representation of current species occurrence on the island. As such, they can help us understand the general impacts of forest change on forest dependent biodiversity.
Modeling Functionally Connected Habitat
We estimated loss in functionally connected habitat availability between 1973 and 2015 for each of the selected 245 species using a graph theory model (Saura and Torne, 2009). This method considers a landscape as a network of connections between functional habitats (Urban and Keitt, 2001), and quantifies the connectivity of these habitats from the perspective of the target species by accounting for its natal dispersal ability (Saura and Torne, 2009). Natal dispersal is hereby defined as the ability of immature individuals to permanently depart their natal area in search of new sites (Studds et al., 2008). The outcome of this connectivity analysis is the Equivalent Connected Area (hereafter ECA), which indicates the effective area of habitat in the landscape that is available for a species after considering natal dispersal processes (Saura et al., 2011). For the purposes of this study, we consider habitat patches available for a species as only the forests patches within its refined range as described in the previous section. We used a variation of ECA that also accounts for the resistance of the matrix to the movement of the species. We defined the matrix as the non-forest land cover in which the forest habitat patches are embedded (see Supplementary Methods). Well-connected habitats have higher ECA values, closer to the area of habitat in the landscape. Highly fragmented landscapes with high levels of patch isolation and impermeable matrices have lower ECA values. Thus, the ECA metric provides information on the potential long-term ecological viability of a species in a particular landscape. We calculated ECA in 1973 and 2015, for each species, using the line command version of the Conefor Sensinode v2.6 software package (Saura and Torne, 2009)2. We present a detailed account of the mathematical rationale used to calculate ECA in Supplementary Methods.
For each species, we calculated the relative change in ECA (relativeΔECA), which we estimated as the change in ECA between 1973 and 2015 in relation to ECA in 1973 (ECA1973), as shown in the following expression:
Thus, relativeΔECA ranges between 0 and 1, with 1 being maximum ECA loss, and 0 being no ECA loss. We use this estimates as the basis for our analyses.
Natal Dispersal Distances
To model functional connectivity (i.e., ECA), we estimated median natal dispersal distances for each species using average body weight per species as a proxy for dispersal ability. We used this method due to the scarcity of field data for tropical species. Fewer than 5% of the species hereby included had any empirical information on natal dispersal capacity. We used the regression model presented by Sutherland et al. (2000), which models natal dispersal as a function of body weight (w): d = 2.04w∧0.67 for birds and d = 2.04w∧0.67 for mammals (with r2 = 0.72 and r2 = 0.80, respectively). The body weight values were obtained from del Hoyo et al. (2015) for birds, and from the PanTHERIA database (Jones et al., 2009) for mammals. Although for mammals models based on home range can predict dispersal distance better than through body weight alone (Bowman et al., 2002), body weight data is readily available–with a higher certainty–for all the mammal and birds species considered in this study.
To test the robustness of our connectivity model to assumptions of natal dispersal abilities, we ran a sensitivity analysis with four natal dispersal distance scenarios (described in Supplementary Table S4) following similar approaches to sensitivity analysis for species spatial needs by Wilson et al. (2010).
Matrix Resistance
We used an area-weighted measure to account for the resistance that land cover in the matrix (resistance of the matrix, RM) imposes on the movement of species between forest patches. RM was calculated for landscape windows of ∼21,000 km2, with the following expression: RM , where rk is the proportional area of the cover type k relative to the total area of the matrix within the window, and σk is the impermeability of the land-cover type k in the matrix as perceived by a species (0 ≤ σk ≤ 1). This impermeability increases with higher σk, and it is related to a higher mortality risk and/or energy expenditure when crossing non-habitat land covers. A fully impermeable land cover (σk = 1) would translate as a full barrier (i.e., infinite resistance) for species movement, whereas a more permeable one (σk < 1) would decrease movement resistance. Given the lack of species-specific data for σk, we made assumptions according to the species ecology and the context of Borneo’s landscapes. For strict forest species (i.e., species that are not reported in the IUCN data base as using non-forest habitats, including plantations), we assume an average impermeability of 0.75 (i.e., high resistance to movement) for non-habitat land cover. We assume that forest species that are reported as using oil palm or pulp plantations have less difficulty moving across these land covers. For these species, we assume an average impermeability of 0.01 (i.e., no resistance to movement) in plantations and an average impermeability of 0.75 (i.e., high resistance to movement) for open non-forest land covers. Finally, we assume that forest species that are reported as using open areas have less difficulty moving across transformed land covers. For these species, we assume an average impermeability of 0.01 (i.e., no resistance to movement) in plantations and an average impermeability of 0.25 (i.e., low resistance to movement) for open non-forest land covers (Supplementary Table S5).
Stepping-stones (i.e., small patches excluded as habitat, see above) were also included as a land-cover constituent of the matrix and assigned an average impermeability (σ) of 0.01 (i.e., no resistance to movement). Thus, large number of stepping stones in a landscape window reduced its overall RM.
We recognize that our assumptions on the degrees of tolerance to degraded habitats may entail significant uncertainties. Yet, the source of this information comes from bottom-up expert assessments compiled by the IUCN (2017). To test the effects of these assumptions in our results, we ran a sensitivity analysis for our connectivity modeling under seven additional scenarios with different values of impermeability of non-forest land covers. This included scenarios of both maximum impermeability and maximum permeability for all species in all land cover classes (Supplementary Table S5 and Supplementary Figure S4).
Factors Affecting Changes in Functionally Connected Habitat Availability
In order to understand the changes in functionally connected habitat availability, we modeled the relative connectivity loss (ECA) as a function of maximum elevational range limit, mean dispersal distance, change in area of habitat, and change in mean fractal index (patch shape) using general linear mixed-effects models (GLMMs) (Table 1). We allowed the intercepts to vary among family, as normally distributed random effects (random intercept model). All variables were standardized by centering to the mean and dividing by one standard deviation to aid model convergence (Gelman and Hill, 2006). We used a model comparison approach utilizing version 1.15.6 MuMIn package (Barton, 2019). In our model set we included models with combinations of the four main effects and all possible interactions. In order to prevent selecting overly complicated models we followed Richards (2008), and selected models that had a delta-BIC less that the delta-BIC of all its simpler models. To identify the most parsimonious of these models, we ranked them according to BIC (Schwarz, 1978) and present the estimates and normalized model likelihoods (‘Akaike weights’) from each of the seven candidate models (Supplementary Table S6. As recommended by Pinheiro and Bates (2000), we compared models that were fitted using maximum likelihood (ML), and present the most parsimonious model fit using restricted maximum likelihood (REML). All analyses were carried out in R 3.3.3 (R Core Team, 2017). GLMMs were fit using the glmer() function in version 1.1–13 of the lme4 package (Bates et al., 2016). The 95% confidence intervals (CIs) of the parameter estimates were computed using a parametric bootstrap with 1000 iterations, implemented using the bootMer() from the lme4 package.
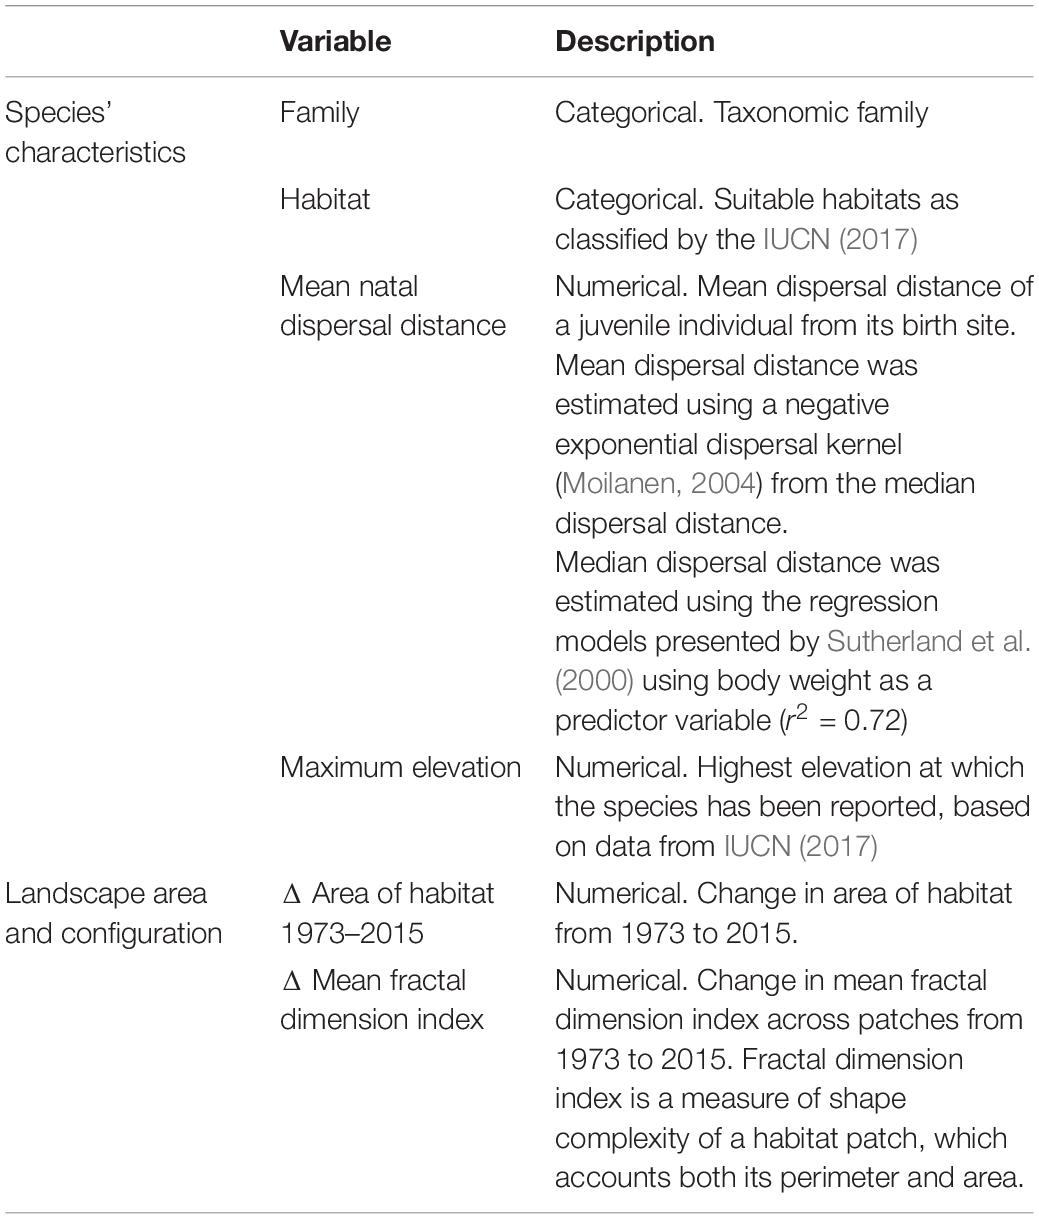
Table 1. Explanatory variables considered in the Generalized Linear Mixed Model to explain the change in Equivalent Connected Area (ECA) from 1973 to 2015 for 245 forest mammals and birds on Borneo.
Concentration of Vulnerable Species
We map the concentrations of vulnerable species on Borneo by aggregating spatial information on the ranges of the 245 forest vertebrates weighted by the relativeΔECA. Areas with higher values on the map indicate forest patches with greater concentrations of vulnerable species, and thus of conservation urgency.
In order to assess the protection of vulnerable species, we calculated the proportion of each species’ Borneo distribution that is within established protected areas. Protected areas data was taken from IUCN and UNEP-WCMC (2017), all categories of protection were included.
Results
Area of Habitat
After accounting for remaining forest cover and elevation constraints, we found that the area of habitat within the individual ranges of the 245 forest species (216 birds and 29 mammals) was greatly reduced between 1973 and 2015 (Figure 1). On average, an estimated 28.1% (±13.1) of area of habitat was lost between 1973 and 2015 across all species, with fourteen species losing over 50% of their area of habitat (Supplementary Table S1). Thirty-six of the study species are deemed threatened in categories Critically Endangered (CR: 4), Endangered (EN: 4), and Vulnerable (VU: 28) by the IUCN (IUCN, 2017) and the total loss of area of habitat within this sub-group averaged 32.8% (±10.7). The charismatic and the critically endangered Bornean Orangutan and Helmeted Hornbill lost 36 and 33% of their habitat, respectively.
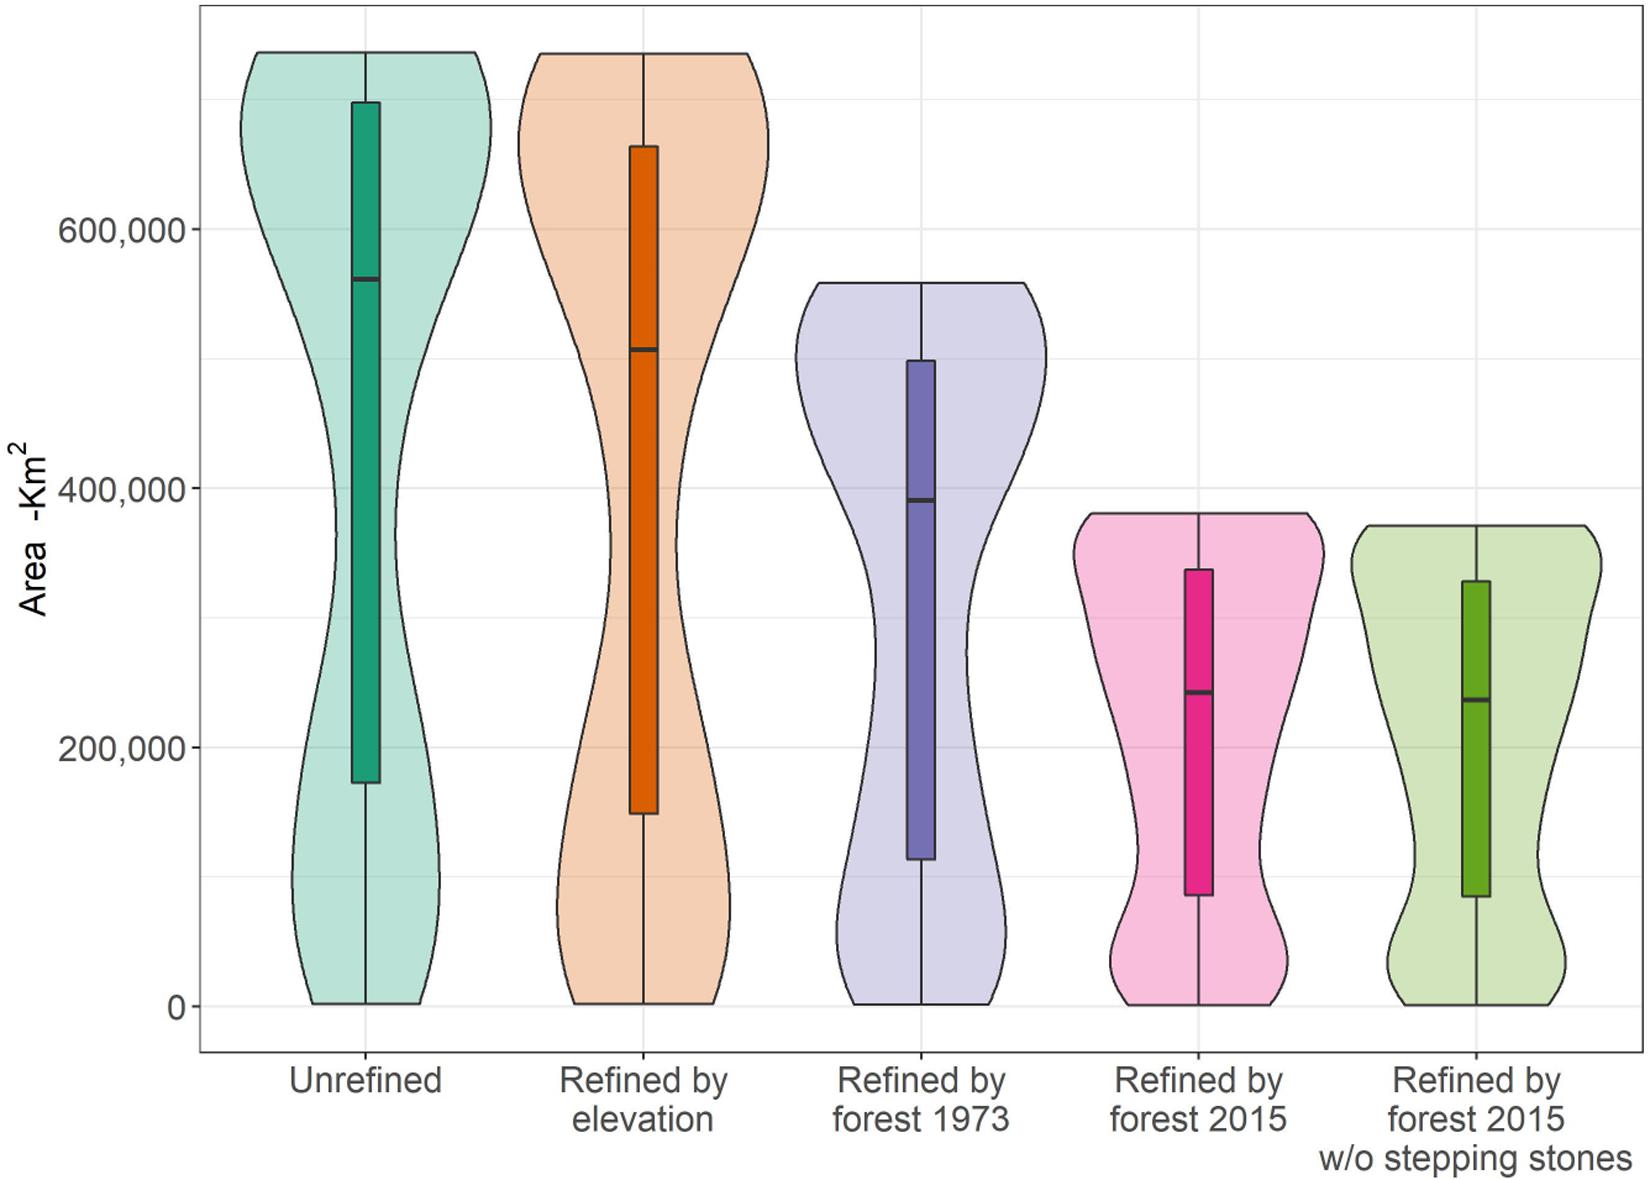
Figure 1. Boxplot showing changes in habitat area for 245 Borneo forest mammals and birds during the range refinement process starting with the unrefined range (aqua green), after refined by elevation (orange), and after further refinement by forest in 1973 (purple), and forest in 2015 (pink). Last boxplot (lime green) shows the ranges refined by forest in 2015 after removal of stepping stone patches (<1.8 km2). Each bar represents the median and distribution of range areas (in km2) throughout the refining process. Background violin plots show the detailed distribution of the data.
In general, the spatial distribution of area of habitat loss showed a clear pattern influenced by elevation (Figure 2). Mountainous areas across central Borneo, which have lower species richness, remained mostly intact over these four decades. Lowland regions, with a naturally higher species richness (Jucker et al., 2018), showed a marked change in the area of habitat as a result of widespread forest loss.
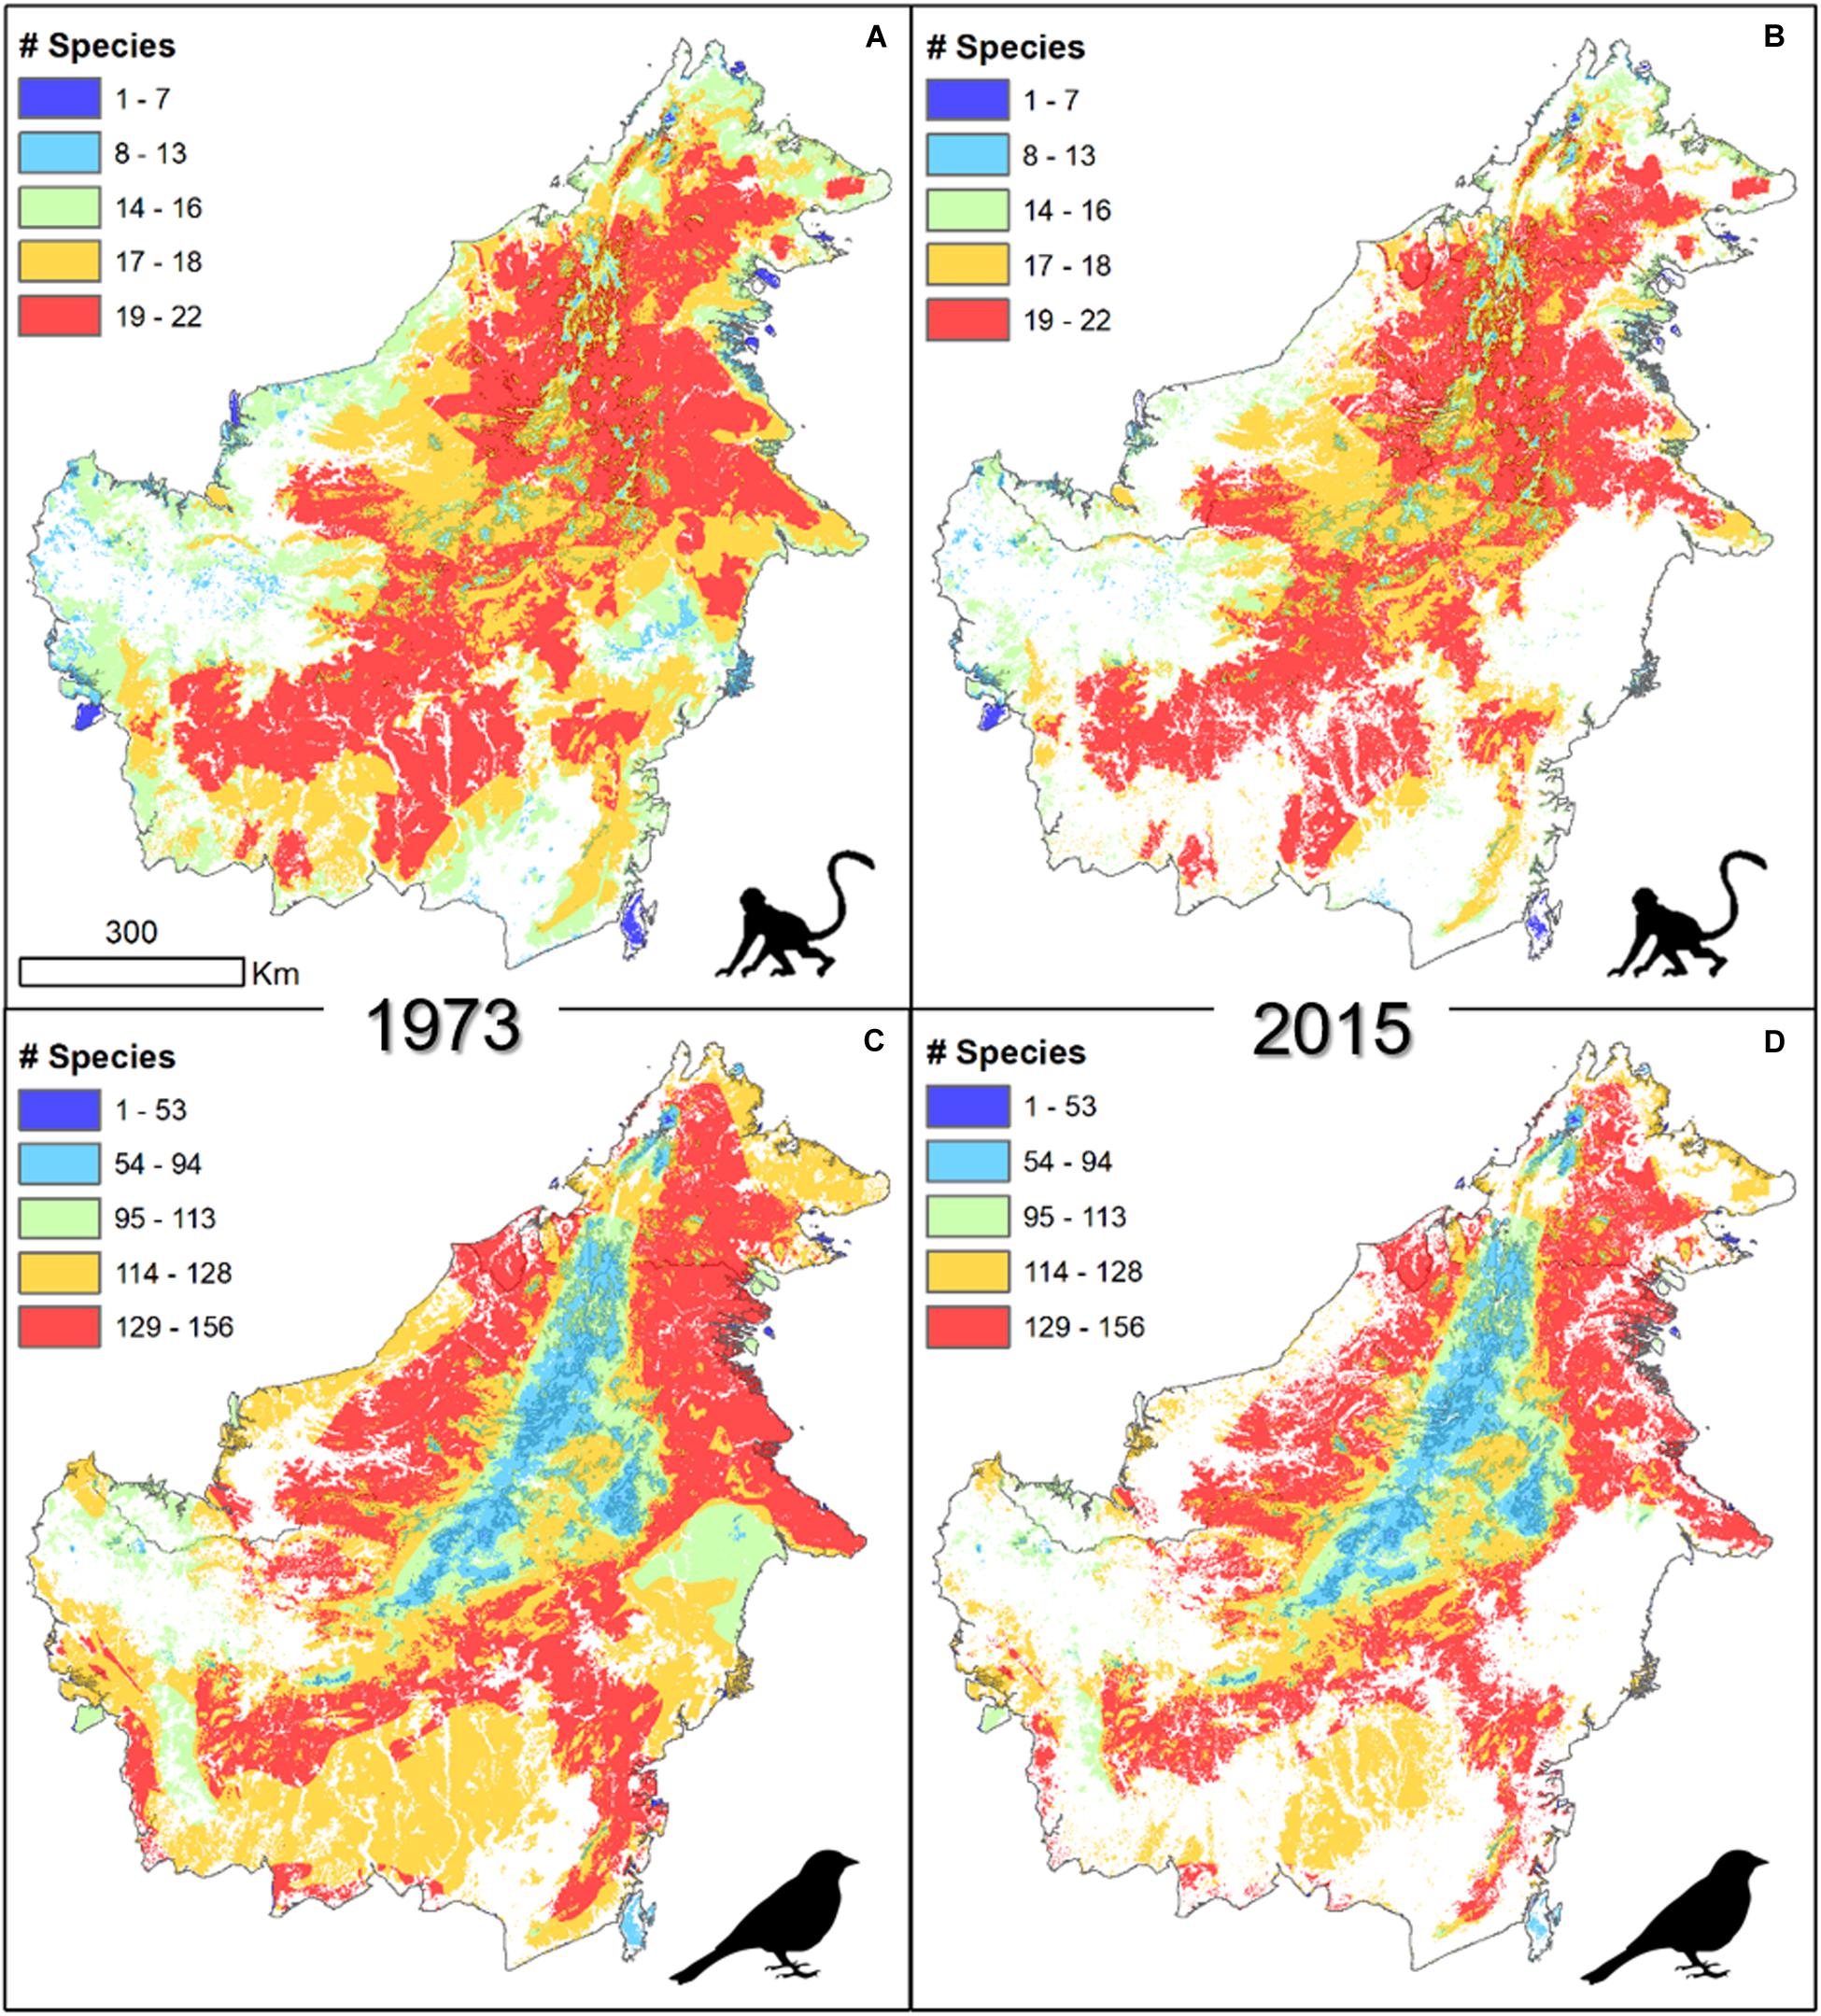
Figure 2. Concentrations of forest vertebrates on the island of Borneo in forested areas in 1973 (A,C) and 2015 (B,D) for mammals (A,B, n = 29) and birds (C,D, n = 219).
Losses in Functionally Connected Habitat
Widespread deforestation has not only resulted in significant losses in area of habitat for forest species, but also in functionally connected habitat availability as measured by the Equivalent Connected Area (ECA) (Figure 3). Results from the modeling of ECA show a statistically significant decrease between 1973 and 2015 (Student’s t-test <0.001), with an average loss of 35% (±17.2). This is an additional 7% loss to the observed area of habitat loss for all species (28.1%), corresponding to an additional average loss of 11,000 km2 of functionally connected habitat. The differences between area of habitat and ECA in 2015 became larger (approx. 38,000 km2 on average) which indicates a significant loss in connectivity in the past four decades.
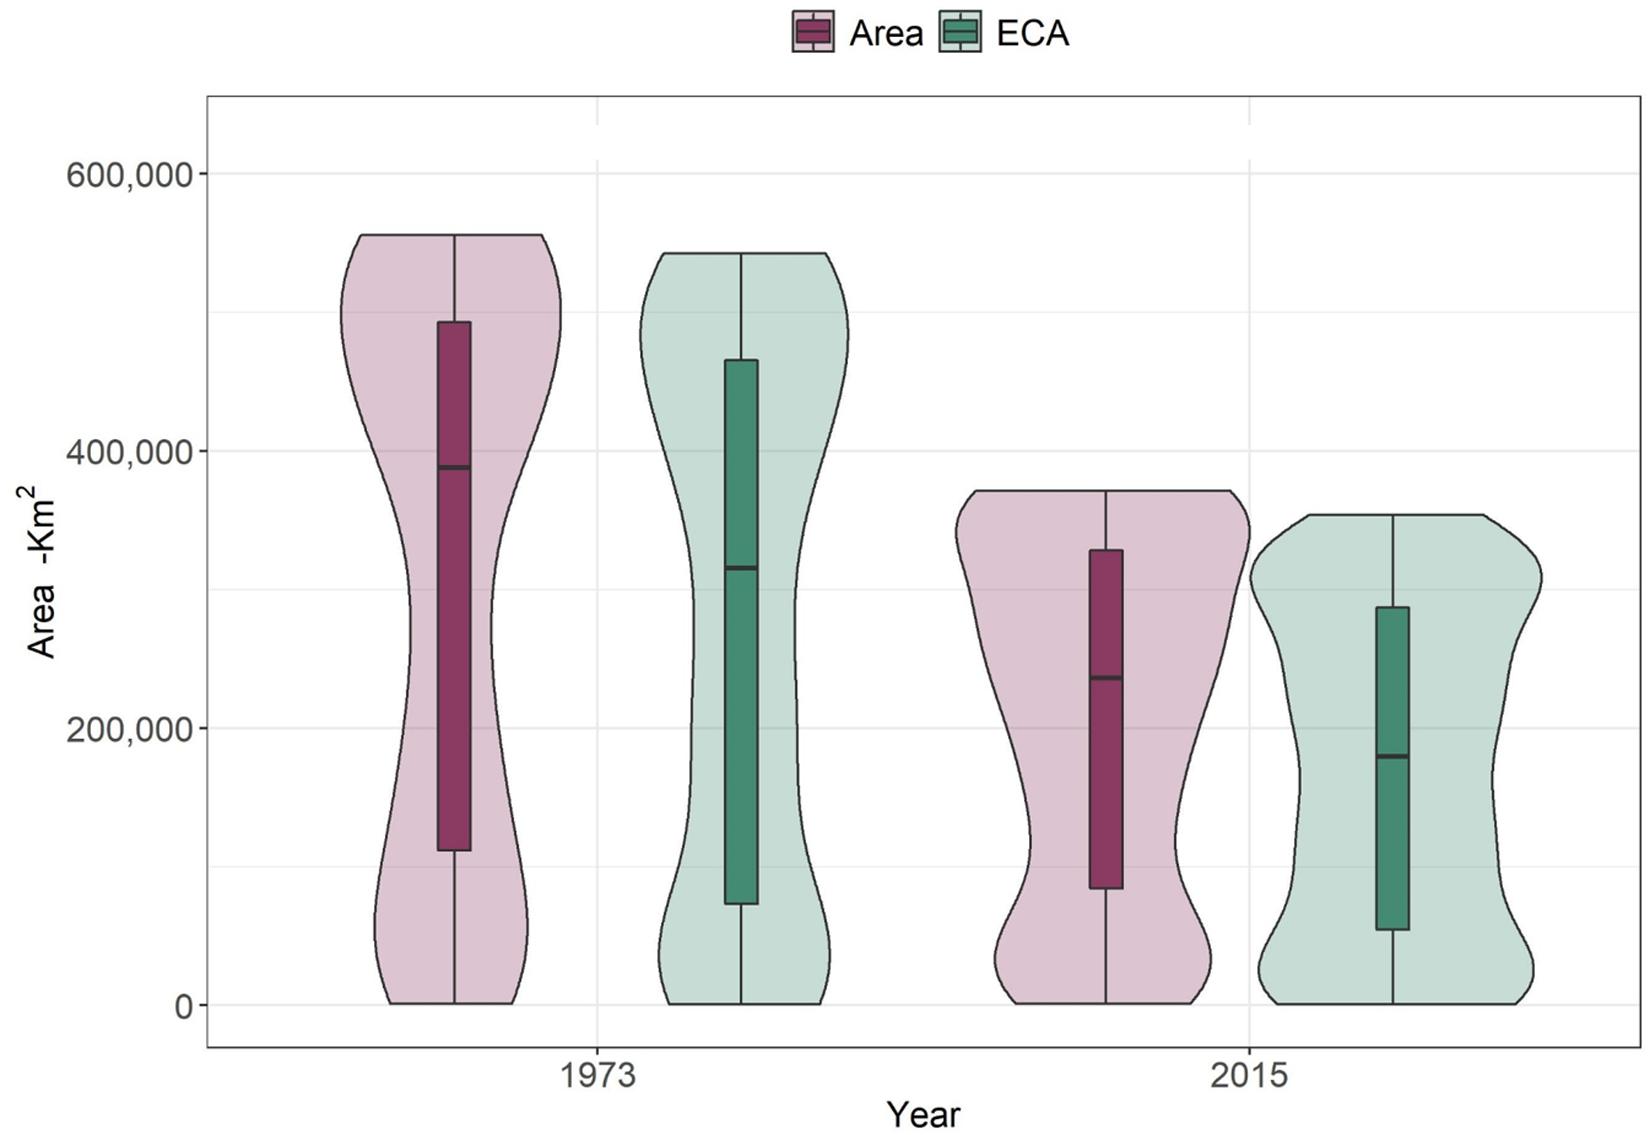
Figure 3. Changes in area of habitat (area) and Equivalent Connected Area (ECA) between 1973 and 2015 for 245 forest vertebrates (birds and mammals). Student’s t-test between area of habitat between 1973 and 2015 shows statistically significant differences (p < 0.01). The same was true for differences between ECA in 1973 and 2015 (p < 0.01).
We tested the robustness of our results to changes in the resistance to species movement imposed by the non-habitat land covers in the matrix. We evaluated seven scenarios of land-cover resistance (Supplementary Table S5), and analyzed how this affected our ECA values (i.e., results of our connectivity modeling). Our analysis revealed no statistically significant differences between land-cover resistance scenarios (ANOVA, p = 0.299), suggesting our model is robust to changes in the matrix resistance (Supplementary Figure S4). Similarly, we tested the robustness of results to changes in the dispersal distance of species (see dispersal distance scenarios in Supplementary Methods). We found that the differences between the various scenarios we tried were not statistically significant (ANOVA p > 0.1, Supplementary Figure S3).
Factors Affecting Changes in Functionally Connected Habitat (ECA)
To understand the observed variations in our results, we explored the relationship of ECA with various species characteristics and landscape area and configuration variables (Table 1). The most parsimonious model (assessed using BIC) was:
There was a strong positive effect of area of habitat change on the connectivity loss (Figure 4A, βΔ Area of habitat = 0.139; CI: 0.158–0.119, Supplementary Table S7). There was a negative effect of the maximum elevation of the species distribution on the connectivity loss (Figure 4B, β max elevation = −0.034; CI: −0.055 – −0.013, Supplementary Table S7). There was no support that connectivity loss was affected by mean fractal index change (patch shape) as the next most parsimonious model that included this term had a ΔBIC of 127.51 (Supplementary Table S6).
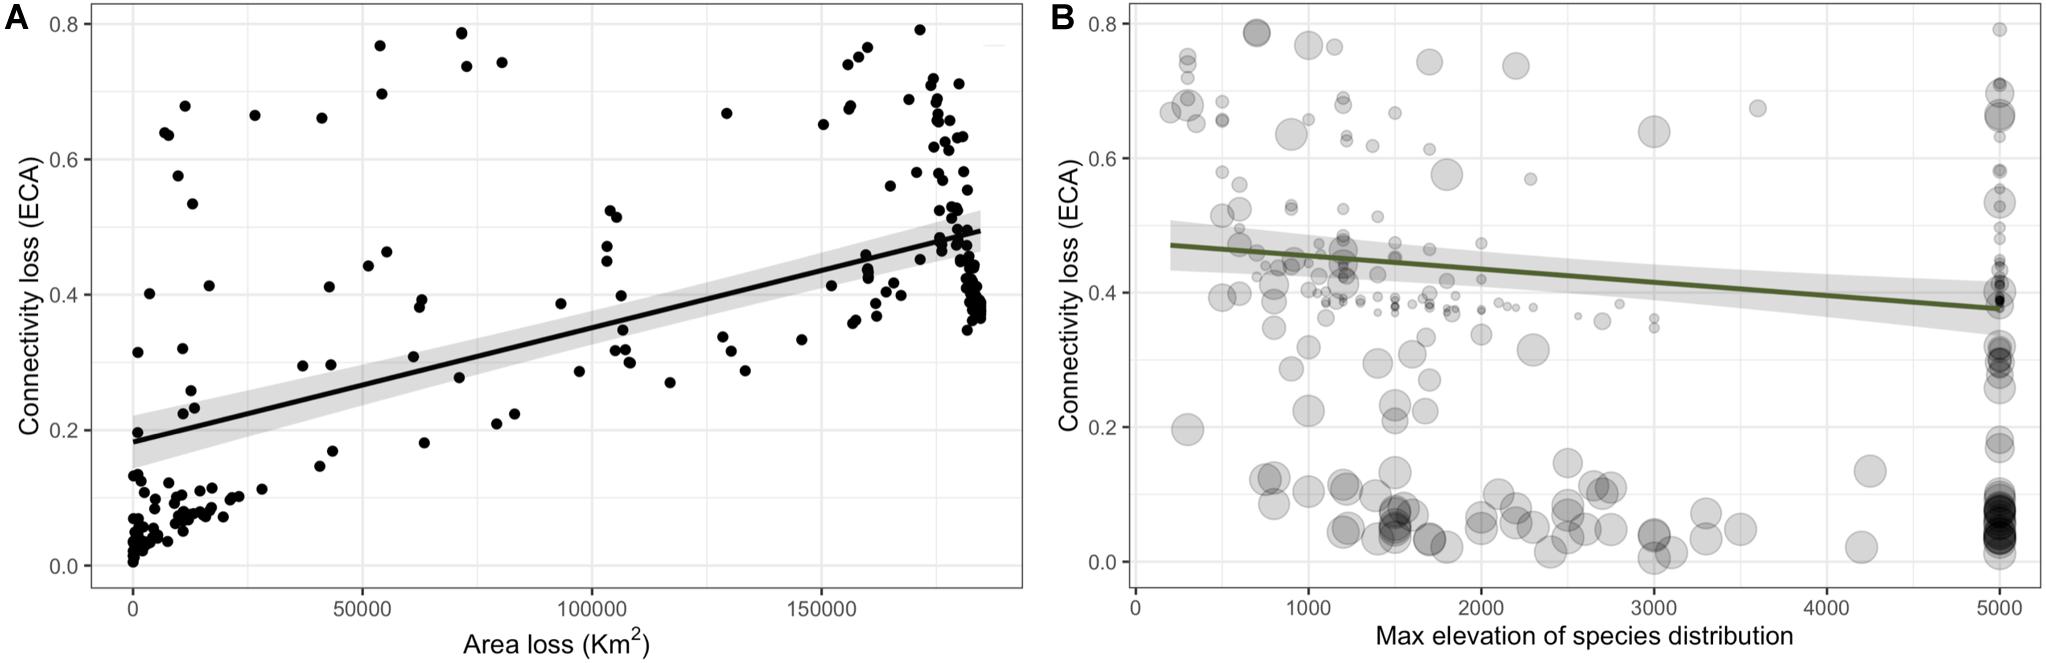
Figure 4. Connectivity loss as a function of area of habitat loss (A) and for and the maximum elevation of the species distribution (B) for 245 forest bird and mammals on Borneo. In (B) point size represents the area loss shown in panel (A).
Concentration of Vulnerable Species
To examine the potential concentration of vulnerable species on the island, we created a vulnerability index for individual species (Supplementary Table S1). The spatial aggregation of individual assessments of this index shows areas where vulnerable forest vertebrates are disproportionately concentrated (in orange-red, Figure 5A). Species with more than 10% ECA loss have <20% of their range protected (Figure 5B and Supplementary Table S1). We acknowledge that the vulnerability index, and its spatial aggregation, can be constructed and weighed in different ways. As such, we provide the components of the index for each species (Supplementary Table S1) should there be a need to rework it for particular purposes.
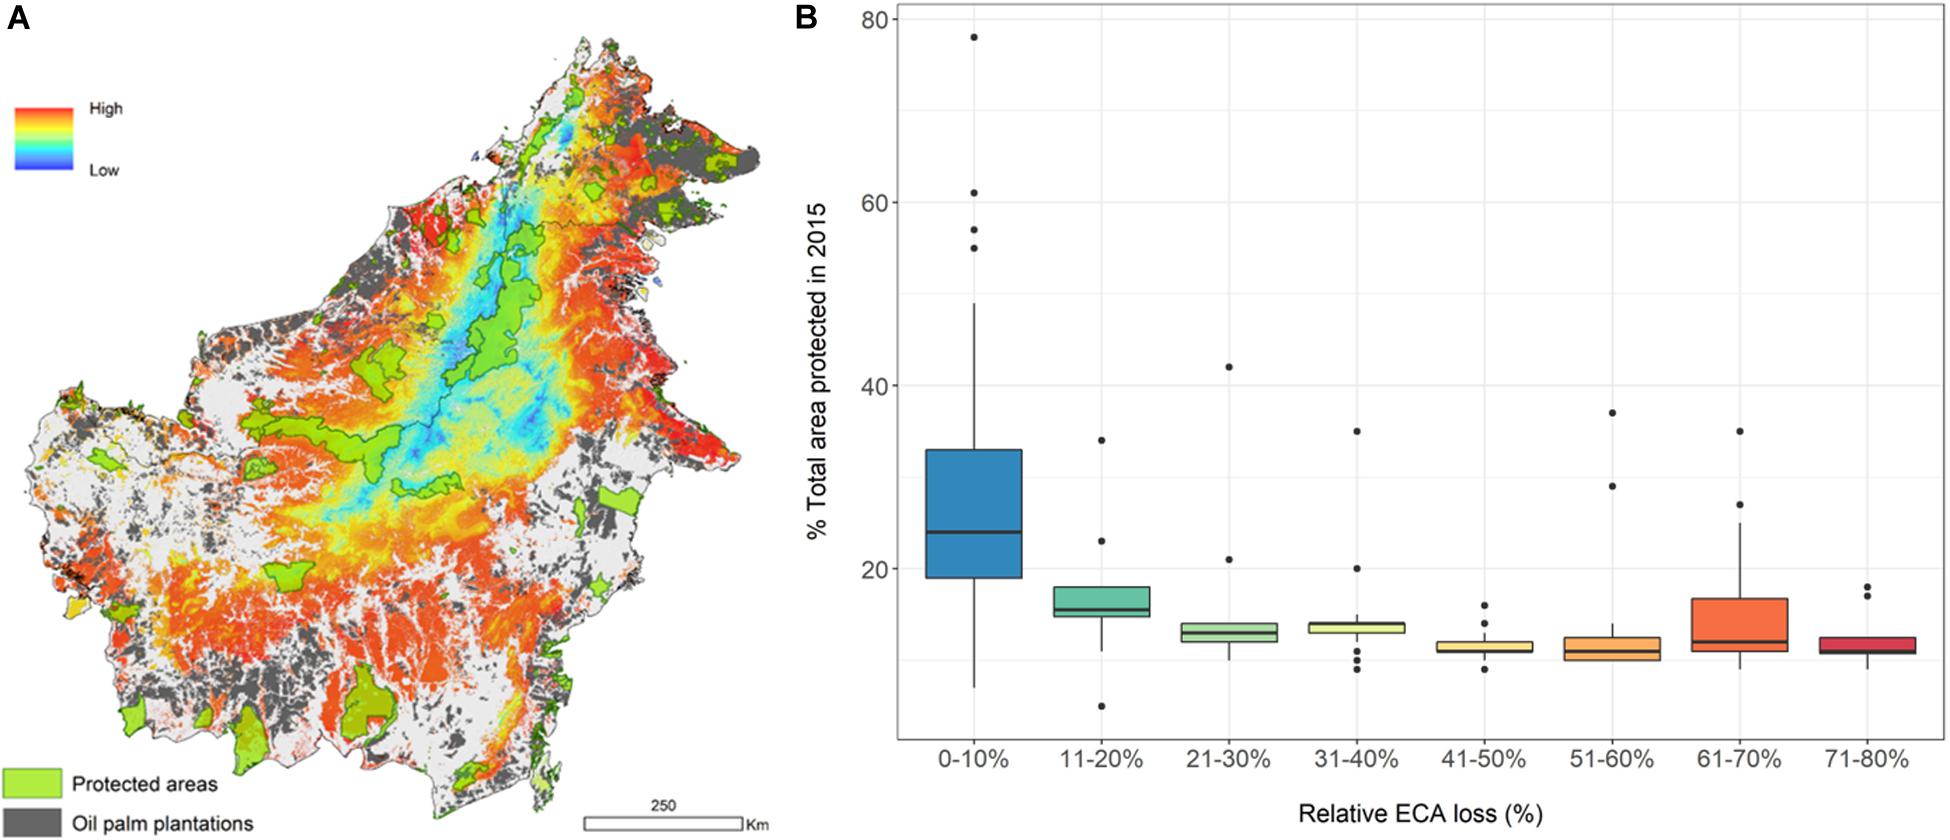
Figure 5. Concentration of vulnerable forest vertebrates constructed by assigning a value from 0 to 5 to each species range according to the percent Equivalent Connected Area (ECA) loss between 1973 and 2015 (n = 245). Loss from 0 to 0.2 = 1, loss from 0.8 to 1 = 5. Map shows spatial distribution of ECA loss-weighted species (A), and boxplot shows relationship between ECA loss and percent species’ range within totally protected areas in 2015 (B).
Discussion
Deforestation Has Resulted in High Impacts on Forest Vertebrates’ Connected Habitat
Comparison of connectivity loss between 1973 and 2015, as measured by ECA, gave evidence for a marked decrease (35% ± 17.2) in connected habitat. Although this result is not surprising, the difference between area of habitat and functionally connected habitat in 2015 is alarming (average of 38,000 km2) (Figures 2, 3). Large areas of forest were lost over these four decades and many of the remnant patches became isolated.
The negative impacts of deforestation on biodiversity on the island of Borneo are well-documented (Curran et al., 2004; Sodhi et al., 2004, 2010; Fitzherbert et al., 2008). However, the interaction between habitat fragmentation and connectivity loss in this region are poorly understood. For birds in the Sundaic region, a review of existing literature estimated that 30% of forest species are adversely affected by fragmentation (Lambert and Collar, 2002). For forest butterflies, movement across fragmented landscapes is hindered by non-forest land covers such as oil palm, which results in reduced connectivity for these species in mixed landscapes (Scriven et al., 2017).
The loss of connected area for the 245 forest birds and mammals we studied is dramatic but could be an underestimate when considering the warming climate (Chen et al., 2009) and its synergy with agricultural expansion (Brodie, 2016). Struebig et al. (2015) modeled habitat loss for mammals under different climate change scenarios and found that when adding up impacts of climate and land cover change, 11–36% of Bornean mammal species will lose ≥30% of their habitat by 2080. Additionally, most of the existing protected areas in Borneo might become too isolated to provide habitat or connectivity benefits for species that have to shift their ranges to higher elevations (Chen et al., 2011; Scriven et al., 2015). Even if there is altitudinal connectivity, the vegetation at higher elevations will not resemble lowland dipterocarp-dominated forests, and species could lag in tracking climatic envelopes (Forero-Medina et al., 2011).
Area of Habitat Loss and Maximum Elevational Limit Were the Main Drivers of Connectivity Loss
Our model showed that loss of functionally connected habitat was mainly explained by area of habitat loss, and to a lesser extent by the maximum elevational limit of the species’ distribution. This is supported by results in the islands of Southeast Asia, where deforestation alone closely predicts the number of threatened birds (Brooks et al., 1997; Koh and Ghazoul, 2010), and by a recent review that confirmed the importance of habitat amount over fragmentation based on species density studies (Watling et al., 2020). Our results therefore highlight the importance of protecting as much forest area as possible to retain functional connectivity, and this should be considered a key conservation strategy.
Maximum elevational range limit was an important predictor of connectivity loss in our model. On Borneo, deforestation has occurred mainly in the lowlands (i.e., elevations lower than 1,000 m) (Figure 2), where the commercially valuable dipterocarps dominate (Ghazoul, 2016). Conversion of primary and logged forests to agricultural plantations also follows this pattern because crops such as oil palm grows best at low elevations (Corley and Tinker, 2008). In fact, 99% of the forest loss between 1973 and 2015 occurred under 1,000 m.
Compounded Threats
We show strong losses in area of habitat and functionally connected habitat for forest vertebrates on Borneo. In addition to threats to their habitat, some of these species face pressure from hunting, poaching, and illegal pet trade (i.e., songbirds). Prominent examples of these compounded threats are the critically endangered Bornean Orangutan which is heavily hunted (Meijaard et al., 2011) and Helmeted Hornbill which is traded for the “red ivory” from its bill (Collar, 2015). Taking this into account, we could be grossly underestimating the threats to some of these Bornean vertebrates. For birds, recent assessments show increased pressure from the song-bird trade resulting in population declines and sometimes extirpation and extinction of populations and subspecies (Eaton et al., 2015).
Concentration of Vulnerable Species
The degree of protection for species that have already lost a lot of connected area is worrying for both birds and mammals. On average, species have only 17% of their ranges within protected areas, and the situation is worse for species with the highest relative ECA loss (Figure 5B). The map we present can help prioritize areas for protection, restoration, or for restricted use (e.g., low-impact selective logging), to enhance the long-term viability of these species on Borneo. New protected areas covering isolated large remnants in the lowlands may improve the status of some of the species [also see Struebig et al. (2015)]. We caution, however, that our maps do not capture species’ densities within their range. This means that we might be underestimating the level of threat in areas where populations have been reduced by poaching and hunting.
The Bornean central mountains have not, to date, been greatly affected by deforestation. These higher elevation areas have fewer vertebrate species, and lower incidence of other threats, which means that most of these species are not currently considered to be particularly vulnerable.
Can Forest Set-Asides Contribute to the Conservation of Species?
Biodiversity conservation will depend heavily on the preservation of large connected forests, but can be complemented with conservation in anthropogenic landscapes (Chazdon et al., 2009). Large areas of lowland forest in Southeast Asia have been replaced by agricultural and forestry plantations (Abood et al., 2015; Gaveau et al., 2017). Commodity certification processes have sought to promote conservation benefits within agricultural and forestry landscapes by stipulating standards for High Conservation Value (HCV) areas3 as preserved forest patches within plantations. The size and quality of these forest patches is often not sufficient to support many bird species (Edwards et al., 2010). Even so, these HCV patches might serve as stepping-stones to increase habitat connectivity for many species (Meijaard et al., 2018). Our analyses show that for stepping-stones (forest patches <1.8 km2) only 6.8% (±3.4) of the area is protected, yet these contribute to increase the functionally connected habitat. However, our results also highlight that total forest area may be the most important factor for protecting connectivity. We therefore suggest that the establishment of smaller forest remnants as set asides in transformed landscapes will only be beneficial for forest species, in combination with protecting as much forest area as possible in the landscape. It is also possible that, in the absence of large areas of forest, stepping-stones become sink populations in a metapopulational structure context, and could thus even be detrimental to regional population viability (Döbert et al., 2014). To date there has been no analysis of the conservation validity of remnant forest patches from a metapopulational context.
Importance of Prioritizing Areas for Conservation and Restoration
Borneo ranks among the most vulnerable biodiversity hotspots globally (Bellard et al., 2014). Given the increased pressure on the lowland forests of Borneo, conserving forest birds and mammals in Borneo will require a combination of preserving large remnant patches and improving the connectivity of isolated fragments in the island’s lowlands. Recent studies show that, for mammals, a small increase in protected habitat can benefit many species and enhance their connectivity in present and climate change scenarios (Struebig et al., 2015).
Restoring previously forested lands back to natural forest to increase connectivity is also becoming increasingly important for maintaining biodiversity and ecosystem functions (Tambosi et al., 2014). Understanding where restoration efforts can yield higher conservation results will be key in setting cost-effective conservation priorities for this and other endangered hotspots. Interest in investments in forest restoration provide opportunities to offer increased protection to lowland forest, but it is imperative that restoration interventions emphasize the planting and recovery of a diverse mix of native trees. Restoration of highly degraded or converted landscapes would be a slow process as species of Dipterocarpaceae are not able to establish in high light environments, and require the establishment of a canopy cover to provide the microclimate and light environment to facilitate their growth (Paine et al., 2012). The restoration of logged forest prior to conversion would be more efficient. Even under the most optimistic restoration scenarios, this process will unfold over several decades. Thus, it is particularly important to conserve remaining natural forest patches to enable extant bird and mammal species to persist over the intervening time.
Setting a Conservation Agenda
Our connectivity models provide an important input for setting research and conservation priorities on the island of Borneo. Our map of concentration of vulnerable species shows areas where protection of remnant forest patches would conserve the largest diversity of threatened birds and mammals. Our models can be readily updated as new forest cover maps and ecological studies arise, and can therefore aid in guiding evidence-based priorities and resource allocation for research and conservation on Borneo, as has been promoted elsewhere (Ocampo-Peñuela and Pimm, 2014).
Similarly, our analysis provides guidance to identify research and actions on individual species that can advance the conservation agenda in Borneo as a whole, by accounting for their differences in vulnerabilities and threats. Some species, such as the Bornean Crestless Fireback (Lophura pyronota) or the Proboscis monkey (Nasalis larvatus), have lost a very substantial part of their lowland forest habitat, and might also be vulnerable to additional pressures of climate change and hunting. They require immediate conservation attention through effective application of protected area regulations and the inclusion of their non-protected habitats under conservation designations. Other more common and widespread species, such as the Bornean Brown Barbet (Caloramphus fuliginosus), are not immediately threatened, but have nonetheless, lost a substantial part of their connected habitat (approx. 44% between 1973 and 2015), for which the conservation response should be the establishment of monitoring programs to track population trends. Further ecological studies on the distribution, habitat use, tolerance to disturbance and dispersal of these species, are needed to validate our findings and fine-tune existing conservation tools.
Recommendations to Improve Connectivity Models
The uncertainty within our models can be greatly improved as better ecological and remote sensing data becomes available. In our analysis, we use the only existing range maps for all our study species, but we acknowledge that these maps can have important omission (not showing the species in places where it is present) and commission errors (showing the species present in places where it is not) (Di Marco et al., 2017). By refining the ranges by elevation and forest, we deal with most commission errors (Ocampo-Peñuela et al., 2016), but in many cases maps will have to be updated for fixing omission errors (Ocampo-Peñuela and Pimm, 2014). Other conservation studies have used ranges from sophisticated species distribution models (Struebig et al., 2015), but these are not readily available for all species. Identifying existing habitat patches also depends largely on an accurate and updated forest cover map. Using an inaccurate forest cover map can drastically change results of extinction risk assessments and conservation priority setting exercises, as is the case for forest cover maps from Hansen et al. (2013) for Southeast Asia (Li et al., 2016). Lastly, connectivity models would greatly benefit from empirical data on natal dispersal ability across different land cover configurations (Richard and Armstrong, 2010). This is particular relevant for tropical forest, as many of the models available to understand dispersal distance have been constructed using data from species in temperate areas or that inhabit non-forest ecosystems (e.g., the Sutherland et al., 2000 body mass-natal dispersal distance regression hereby used). Recent advances in animal tracking will facilitate the gathering of such important data (Wikelski et al., 2007; Kays et al., 2015). To inform decision making processes, our results should be complemented with genetic, metapopulation and behavioral studies, as has been recently done for the Sunda Clouded Leopard (Kaszta et al., 2019). Importantly, species might modify their behavior to adapt to novel land covers (Pardo et al., 2018), increasing their affinity to modified habitats in human dominated landscapes. Such information can be incorporated in our models through changes to the resistance of the matrix as new species ecological data becomes available. Yet, we believe that this study provides much needed analysis, with the best available data, to inform on-going conservation planning in Borneo.
Conclusion
We evaluated the impacts of four decades of forest loss on Borneo on the connected habitat for 245 forest birds and mammals. We found that available functionally connected habitat was reduced by an average of 35% between 1973 and 2015, 7% higher than total area of habitat loss observed between this period. Loss of functional connectivity has been largely driven by the loss of large areas in the lowland forests of the island. Of conservation concern is the fact that many forest vertebrates are also threatened by poaching and hunting, and we found very low degrees of protection within Borneo for species that have lost significant functionally connected habitat. Future conservation strategies must focus on the protection of large forests and a network of functionally connected forest remnants. Policies for biodiversity conservation within anthropogenic landscapes should be informed by species’ dispersal requirements to guarantee the persistence of these vertebrates on the island of Borneo.
Data Availability Statement
All datasets generated for this study are included in the article/Supplementary Material.
Ethics Statement
Ethical review and approval was not required for the animal study because this is a modeling study and animals were not manipulated for such. Although it presents results on research on vertebrates, no vertebrates were used for the study. Only available data was used.
Author Contributions
NO-P and JG-U conceived the idea, performed the analyses, and wrote and edited the manuscript. IK and CP performed the analyses and wrote and edited the manuscript. JG conceived the idea and wrote and edited the manuscript.
Funding
NO-P was funded by an ETH Postdoctoral Fellowship. JG-U was funded by SNSF R4D-project Oil Palm Adaptive Landscapes (OPAL). Open access fees covered by ETH Zürich.
Conflict of Interest
The authors declare that the research was conducted in the absence of any commercial or financial relationships that could be construed as a potential conflict of interest.
Acknowledgments
We thank Dr. David Gaveau for providing the forest cover maps for Borneo used in our study. We thank Gabriela Wiederkehr, Angela Jenny, and Patrick Waeber for their help in gathering the species data for this study.
Supplementary Material
The Supplementary Material for this article can be found online at: https://www.frontiersin.org/articles/10.3389/ffgc.2020.00053/full#supplementary-material
Footnotes
- ^ www.gbif.org
- ^ http://www.conefor.org/ (accessed July 2018)
- ^ www.hcvnetwork.org
References
Abood, S. A., Lee, J. S. H., Burivalova, Z., Garcia-Ulloa, J., and Koh, L. P. (2015). Relative contributions of the logging, fiber, oil palm, and mining industries to forest loss in Indonesia. Conserv. Lett. 8, 58–67.
Bates, D., Maechler, M., Bolker, B., Walker, S., Christensen, R. H. B., Singmann, H., et al. (2016). Package “lme4”: Linear Mixed-Effects Models Using “Eigen” and S4. R package version 1.1-12.
Bellard, C., Leclerc, C., Leroy, B., Bakkenes, M., Veloz, S., Thuiller, W., et al. (2014). Biodiversity hotspots and global change. Glob. Ecol. Biogeogr. 23, 1376–1386. doi: 10.1111/geb.12228
BirdLife International and Handbook of the Birds of the World, (2016). Species Distribution Maps of the World. Available online at: http://datazone.birdlife.org/species/requestdis (accessed June 16, 2016).
Bowman, J., Jaeger, J. A., and Fahrig, L. (2002). Dispersal distance of mammals is proportional to home range size. Ecology 83, 2049–2055.
Brodie, J. F. (2016). Synergistic effects of climate change and agricultural land use on mammals. Front. Ecol. Environ. 14, 20–26. doi: 10.1073/pnas.1819027116
Brooks, T. M., Pimm, S. L., Akçakaya, H. R., Buchanan, G. M., Butchart, S. H. M., Foden, W., et al. (2019). Measuring terrestrial area of habitat (AOH) and its utility for the IUCN red list. Trends Ecol. Evol. 34, 977–986. doi: 10.1016/j.tree.2019.06.009
Brooks, T. M., Pimm, S. L., and Collar, N. J. (1997). Deforestation predicts the number of threatened birds in insular Southeast Asia. Conserv. Biol. 11, 382–394.
Chazdon, R. L., Harvey, C. A., Komar, O., Griffith, D. M., Ferguson, B. G., Martínez-Ramos, M., et al. (2009). Beyond reserves: a research agenda for conserving biodiversity in human-modified tropical landscapes. Biotropica 41, 142–153.
Chen, I. C., Hill, J. K., Ohlemüller, R., Roy, D. B., and Thomas, C. D. (2011). Rapid range shifts of species associated with high levels of climate warming. Science 333, 1024–1026. doi: 10.1126/science.1206432
Chen, I.-C., Shiu, H.-J., Benedick, S., Benedick, S., Holloway, J. D., Chey, V. K., et al. (2009). Elevation increases in moth assemblages over 42 years on a tropical mountain. Proc. Natl. Acad. Sci. U.S.A. 106, 1479–1483. doi: 10.1073/pnas.0809320106
Clavel, J., Julliard, R., and Devictor, V. (2011). Worldwide decline of specialist species: toward a global functional homogenization? Front. Ecol. Environ. 9, 222–228.
Collar, N. (2015). Helmeted Hornbills Rhinoplax vigil and the ivory trade: the crisis that came out of nowhere. Birding Asia 24, 12–17.
Corlett, R. T. (2001). “Frugivory and seed dispersal in degraded tropical east Asian landscapes,” in Seed Dispersal and Frugivory: Ecology, Evolution, and Conservation, eds D. J. Levey, W. R. Silva, and M. Galetti (Wallingford: CABI Publishing).
Curran, L. M., Trigg, S. N., Mcdonald, A. K., Astiani, D., Hardiono, Y. M., Siregar, P., et al. (2004). Lowland forest loss in protected areas of Indonesian Borneo. Science 303, 1000–1003. doi: 10.1126/science.1091714
del Hoyo, J., Elliott, A., Sargatal, J., Christie, D. A., and De Juana, E. (2015). Handbook of the Birds of the World Alive, ed. L. Editions (Barcelona: Lynx Edicions).
Di Marco, M., Watson, J. E., Possingham, H. P., and Venter, O. (2017). Limitations and trade-offs in the use of species distribution maps for protected area planning. J. Appl. Ecol. 54, 402–411.
Döbert, T. F., Webber, B. L., Barnes, A. D., Dickinson, K., Didham, R. K., Kettle, C., et al. (2014). “Forest fragmentation and biodiversity conservation in human-dominated landscapes,” in Global Forest Fragmentation, ed. C. Kettle (Wallingford: CABI), 28–49.
Eaton, J., Shepherd, C., Rheindt, F., Harris, J., Van Balen, S., Wilcove, D., et al. (2015). Trade-driven extinctions and near-extinctions of avian taxa in Sundaic Indonesia. Forktail 31, 1–12.
Edwards, D. P., Hodgson, J. A., Hamer, K. C., Mitchell, S. L., Ahmad, A. H., Cornell, S. J., et al. (2010). Wildlife-friendly oil palm plantations fail to protect biodiversity effectively. Conserv. Lett. 3, 236–242. doi: 10.1890/14-1928.1
Estes, J. A., Terborgh, J., Brashares, J. S., Power, M. E., Berger, J., Bond, W. J., et al. (2011). Trophic downgrading of planet Earth. Science 333, 301–306. doi: 10.1126/science.1205106
Fahrig, L. (2003). Effects of habitat fragmentation on biodiversity. Annu. Rev. Ecol. Evol. Syst. 34, 487–515.
Fischer, J., and Lindenmayer, D. B. (2007). Landscape modification and habitat fragmentation: a synthesis. Glob. Ecol. Biogeogr. 16, 265–280.
Fitzherbert, E. B., Struebig, M. J., Morel, A., Danielsen, F., Brühl, C. A., Donald, P. F., et al. (2008). How will oil palm expansion affect biodiversity? Trends Ecol. Evol. 23, 538–545. doi: 10.1016/j.tree.2008.06.012
Forero-Medina, G., Terborgh, J., Socolar, S. J., and Pimm, S. L. (2011). Elevational ranges of birds on a tropical montane gradient lag behind warming temperatures. PLoS One 6:e28535. doi: 10.1371/journal.pone.0028535
Gaveau, D. L., Sheil, D., Husnayaen, Salim, M. A., Arjasakusuma, S., Ancrenaz, M., et al. (2016). Rapid conversions and avoided deforestation: examining four decades of industrial plantation expansion in Borneo. Sci. Rep. 6:32017. doi: 10.1038/srep32017
Gaveau, D. L. A., Salim, M., and Arjasakusuma, S. (2017). Deforestation and Industrial Plantations Development in Borneo. Bogor: Center for International Forestry Research.
Gelman, A., and Hill, J. (2006). Data Analysis Using Regression and Multilevel/Hierarchical Models. Cambridge: Cambridge university press.
Ghazoul, J. (2005). Pollen and seed dispersal among dispersed plants. Biol. Rev. 80, 413–443. doi: 10.1017/s1464793105006731
Ghazoul, J. (2016). Dipterocarp Biology, Ecology, and Conservation. Oxford: Oxford University Press.
Haddad, N. M., Brudvig, L. A., Clobert, J., Davies, K. F., Gonzalez, A., Holt, R. D., et al. (2015). Habitat fragmentation and its lasting impact on Earth’s ecosystems. Sci. Adv. 1:e1500052. doi: 10.1126/sciadv.1500052
Hansen, M. C., Potapov, P. V., Moore, R., Hancher, M., Turubanova, S. A., Tyukavina, A., et al. (2013). High-resolution global maps of 21st-century forest cover change. Science 342, 850–853. doi: 10.1126/science.1244693
Harris, J. B. C., Tingley, M. W., Hua, F., Yong, D. L., Adeney, J. M., Lee, T. M., et al. (2017). Measuring the impact of the pet trade on Indonesian birds. Conserv. Biol. 31, 394–405. doi: 10.1111/cobi.12729
Jarvis, A., Reuter, H., Nelson, A., and Guevara, E. (2008). Hole-Filled SRTM for the Globe Version 4.
Jenkins, C. N., Pimm, S. L., and Joppa, L. N. (2013). Global patterns of terrestrial vertebrate diversity and conservation. Proc. Natl. Acad. Sci. U.S.A. 110, 2602–2610. doi: 10.1073/pnas.1302251110
Jones, K. E., Bielby, J., Cardillo, M., Fritz, S., O’Dell, J., Orme, D., et al. (2009). PanTHERIA: a species-level database of life history, ecology, and geography of extant and recently extinct mammals. Ecology 90, 2648–2648.
Jucker, T., Bongalov, B., Burslem, D. F., Nilus, R., Dalponte, M., Lewis, S. L., et al. (2018). Topography shapes the structure, composition and function of tropical forest landscapes. Ecol. Lett. 21, 989–1000. doi: 10.1111/ele.12964
Kaszta, Ż, Cushman, S. A., Hearn, A. J., Burnham, D., Macdonald, E. A., Benoit, G., et al. (2019). Integrating Sunda clouded leopard (Neofelis diardi) conservation into development and restoration planning in Sabah (Borneo). Biol. Conserv. 235, 63–76.
Kays, R., Crofoot, M. C., Jetz, W., and Wikelski, M. (2015). Terrestrial animal tracking as an eye on life and planet. Science 348:aaa2478. doi: 10.1126/science.aaa2478
Koh, L. P., and Ghazoul, J. (2010). A matrix-calibrated species-area model for predicting biodiversity losses due to land-use change. Conserv. Biol. 24, 994–1001. doi: 10.1111/j.1523-1739.2010.01464.x
Lambert, F., and Collar, N. (2002). The future for Sundaic lowland forest birds: long-term effects of commercial logging and fragmentation. Forktail 18, 127–146.
Li, B. V., Hughes, A. C., Jenkins, C. N., Ocampo-Peñuela, N., and Pimm, S. L. (2016). Remotely sensed data informs Red List evaluations and conservation priorities in Southeast Asia. PLoS One 11:e0160566. doi: 10.1371/journal.pone.0160566
Lucey, J. M., Palmer, G., Yeong, K. L., Hill, J. K., Yeong, K. L., Senior, M. J. M., et al. (2017). Reframing the evidence base for policy-relevance to increase impact: a case study on forest fragmentation in the oil palm sector. J. Appl. Ecol. 54, 731–736.
Magrach, A., Laurance, W. F., Larrinaga, A. R., and Santamaria, L. (2014). Meta-analysis of the effects of forest fragmentation on interspecific interactions. Conserv. Biol. 28, 1342–1348. doi: 10.1111/cobi.12304
Malins, C. (2017). Driving Deforestation: the Impact of Expanding Palm Oil Demand through Biofuel Policy. London: Rainforest Foundation Norway and Cerulogy.
Meijaard, E., Buchori, D., Hadiprakarsa, Y., Utami-Atmoko, S. S., Nurcahyo, A., Tjiu, A., et al. (2011). Quantifying killing of orangutans and human-orangutan conflict in Kalimantan, Indonesia. PLoS One 6:e27491. doi: 10.1371/journal.pone.0027491
Meijaard, E., Garcia-Ulloa, J., Sheil, D., Wich, S. A., Carlson, K. M., Juffe-Bignoli, D., et al. (2018). Oil Palm and Biodiversity. A Situation Analysis by the IUCN Oil Palm Task Force. Gland: IUCN.
Moilanen, A. (2004). SPOMSIM: software for stochastic patch occupancy models of metapopulation dynamics. Ecol. Modell. 179, 533–550.
Myers, N., Mittermeier, R. A., Mittermeier, C. G., Da Fonseca, G. A. B., and Kent, J. (2000). Biodiversity hotspots for conservation priorities. Nature 403, 853–858.
Ocampo-Peñuela, N., Jenkins, C. N., Vijay, V., Li, B. V., and Pimm, S. L. (2016). Incorporating explicit geospatial data shows more species at risk of extinction than the current Red List. Sci. Adv. 2:e1601367. doi: 10.1126/sciadv.1601367
Ocampo-Peñuela, N., and Pimm, S. L. (2014). Setting practical conservation priorities for birds in the western Andes of Colombia. Conserv. Biol. 28, 1260–1270. doi: 10.1111/cobi.12312
Paine, C. T., Stenflo, M., Philipson, C. D., Saner, P., Bagchi, R., Ong, R. C., et al. (2012). Differential growth responses in seedlings of ten species of Dipterocarpaceae to experimental shading and defoliation. J. Trop. Ecol. 28, 377–384.
Pardo, L. E., Campbell, M. J., Edwards, W., Clements, G. R., and Laurance, W. F. (2018). Terrestrial mammal responses to oil palm dominated landscapes in Colombia. PLoS One 13:e0197539. doi: 10.1371/journal.pone.0197539
Pimm, S. L., and Jenkins, C. N. (2010). Extinctions and the practice of preventing them. Conserv. Biol. 1, 181–198. doi: 10.1111/cobi.13425
Pinheiro, J. C., and Bates, D. M. (eds). (2000). “Linear mixed-effects models: basic concepts and examples,” in Mixed-Effects Models in S and S-Plus (New York, NY: Springer), 3–56.
R Core Team, (2017). R: A Language and Environment for Statistical Computing. Vienna: R Foundation for Statistical Computing.
Renjifo, L. M. (2001). Effect of natural and anthropogenic landscape matrices on the abundance of subandean bird species. Ecol. Appl. 11, 14–31.
Richard, Y., and Armstrong, D. P. (2010). Cost distance modelling of landscape connectivity and gap-crossing ability using radio-tracking data. J. Appl. Ecol. 47, 603–610. doi: 10.3389/fgene.2020.00307
Richards, S. A. (2008). Dealing with overdispersed count data in applied ecology. J. Appl. Ecol. 45, 218–227.
Saura, S., Bodin, Ö., Fortin, M. J., and Frair, J. (2014). EDITOR’S CHOICE: stepping stones are crucial for species’ long-distance dispersal and range expansion through habitat networks. J. Appl. Ecol. 51, 171–182.
Saura, S., Estreguil, C., Mouton, C., and Rodríguez-Freire, M. (2011). Network analysis to assess landscape connectivity trends: application to European forests (1990–2000). Ecol. Indic. 11, 407–416.
Saura, S., and Torne, J. (2009). Conefor Sensinode 2.2: a software package for quantifying the importance of habitat patches for landscape connectivity. Environ. Modell. Softw. 24, 135–139.
Scheffers, B. R., De Meester, L., Bridge, T. C. L., Hoffmann, A. A., Pandolfi, J. M., Corlett, R. T., et al. (2016). The broad footprint of climate change from genes to biomes to people. Science 354:aaf7671. doi: 10.1126/science.aaf7671
Schnell, J. K., Harris, G. M., Pimm, S. L., and Russell, G. J. (2013). Quantitative analysis of forest fragmentation in the Atlantic Forest reveals more threatened bird species than the current Red List. PLoS One 5:e65357. doi: 10.1371/journal.pone.0065357
Scriven, S. A., Beale, C. M., Benedick, S., and Hill, J. K. (2017). Barriers to dispersal of rain forest butterflies in tropical agricultural landscapes. Biotropica 49, 206–216.
Scriven, S. A., Hodgson, J. A., Mcclean, C. J., and Hill, J. K. (2015). Protected areas in Borneo may fail to conserve tropical forest biodiversity under climate change. Biol. Conserv. 184, 414–423.
Sodhi, N. S., Koh, L. P., Brook, B. W., and Ng, P. K. (2004). Southeast Asian biodiversity: an impending disaster. Trends Ecol. Evol. 19, 654–660. doi: 10.1016/j.tree.2004.09.006
Sodhi, N. S., Koh, L. P., Clements, R., Wanger, T. C., Hill, J. K., Hamer, K. C., et al. (2010). Conserving Southeast Asian forest biodiversity in human-modified landscapes. Biol. Conserv. 143, 2375–2384.
Sodhi, N. S., Sekercioglu, C. H., Barlow, J., and Robinson, S. K. (2011). Conservation of Tropical Birds. Hoboken, NJ: John Wiley & Sons.
Strassburg, B. B., Barros, F. S., Crouzeilles, R., Iribarrem, A., dos Santos, J. S., Silva, D., et al. (2016). The role of natural regeneration to ecosystem services provision and habitat availability: a case study in the Brazilian Atlantic Forest. Biotropica 48, 890–899.
Struebig, M. J., Wilting, A., Gaveau, D. L. A., Meijaard, E., Smith, R. J., Borneo Mammal Distribution Consortium, et al. (2015). Targeted conservation to safeguard a biodiversity hotspot from climate and land-cover change. Curr. Biol. 25, 372–378. doi: 10.1016/j.cub.2014.11.067
Studds, C. E., Kyser, T. K., and Marra, P. P. (2008). Natal dispersal driven by environmental conditions interacting across the annual cycle of a migratory songbird. Proc. Natl. Acad. Sci. U.S.A. 105, 2929–2933. doi: 10.1073/pnas.0710732105
Sutherland, G. D., Harestad, A. S., Price, K., and Lertzman, K. P. (2000). Scaling of natal dispersal distances in terrestrial birds and mammals. Conserv. Ecol. 4:16.
Tambosi, L. R., Martensen, A. C., Ribeiro, M. C., and Metzger, J. P. (2014). A framework to optimize biodiversity restoration efforts based on habitat amount and landscape connectivity. Restor. Ecol. 22, 169–177.
Templeton, A. R., Shaw, K., Routman, E., and Davis, S. K. (1990). The genetic consequences of habitat fragmentation. Ann. Mo. Bot. Gard. 77, 13–27. doi: 10.3389/fgene.2019.01101
Tscharntke, T., Tylianakis, J. M., Rand, T. A., Didham, R. K., Fahrig, L., Batáry, P., et al. (2012). Landscape moderation of biodiversity patterns and processes-eight hypotheses. Biol. Rev. 87, 661–685. doi: 10.1111/j.1469-185X.2011.00216.x
Urban, D., and Keitt, T. (2001). Landscape connectivity: a graph-theoretic perspective. Ecology 82, 1205–1218.
Watling, J. I., Arroyo-Rodríguez, V., Pfeifer, M., Baeten, L., Banks-Leite, C., Cisneros, L. M., et al. (2020). Support for the habitat amount hypothesis from a global synthesis of species density studies. Ecol. Lett. 23, 674–681. doi: 10.1111/ele.13471
Wikelski, M., Kays, R. W., Kasdin, N. J., Thorup, K., Smith, J. A., and Swenson, G. W. (2007). Going wild: what a global small-animal tracking system could do for experimental biologists. J. Exp. Biol. 210, 181–186. doi: 10.1242/jeb.02629
Wilson, K. A., Meijaard, E., Drummond, S., Grantham, H. S., Boitani, L., Catullo, G., et al. (2010). Conserving biodiversity in production landscapes. Ecol. Appl. 20, 1721–1732. doi: 10.1890/09-1051.1
Keywords: connectivity, equivalent connected area, fragmentation, forest patch, mammals, birds, oil palm
Citation: Ocampo-Peñuela N, Garcia-Ulloa J, Kornecki I, Philipson CD and Ghazoul J (2020) Impacts of Four Decades of Forest Loss on Vertebrate Functional Habitat on Borneo. Front. For. Glob. Change 3:53. doi: 10.3389/ffgc.2020.00053
Received: 31 May 2019; Accepted: 09 April 2020;
Published: 05 May 2020.
Edited by:
Sarah Anne-Leigh Scriven, University of York, United KingdomReviewed by:
Luke Evans, Arizona State University, United StatesSimon Mitchell, University of Kent, United Kingdom
Copyright © 2020 Ocampo-Peñuela, Garcia-Ulloa, Kornecki, Philipson and Ghazoul. This is an open-access article distributed under the terms of the Creative Commons Attribution License (CC BY). The use, distribution or reproduction in other forums is permitted, provided the original author(s) and the copyright owner(s) are credited and that the original publication in this journal is cited, in accordance with accepted academic practice. No use, distribution or reproduction is permitted which does not comply with these terms.
*Correspondence: Natalia Ocampo-Peñuela, bm9jYW1wb0BodW1ib2xkdC5vcmcuY28=; b2NhbXBvbmF0YUBnbWFpbC5jb20=; John Garcia-Ulloa, am9obi5nYXJjaWFAdXN5cy5ldGh6LmNo; am9obi5nYXJjaWEudWxsb2FAZ21haWwuY29t
†These authors have contributed equally to this work
‡Present address: Natalia Ocampo-Peñuela Instituto de Investigación de Recursos Biológicos Alexander von Humboldt. Bogotá, Colombia