 Raúl Quílez
 Luz Valbuena
 Jordi Vendrell
 Kathleen Uytewaal3
- 1Firefighting Consortium of the Valencia Region, Valencia, Spain
- 2Ecology University of Leon, Leon, Spain
- 3Pau Costa Foundation, Taradell, Spain
- 4Technosylva, La Jolla, CA, United States
In Spain, traditional forest fire management practices have been conducted for many decades, for both prevention- and extinction-oriented purposes. This management model has been forced to shift as a result of changes in fire behavior and has also been adapted to the use of new technologies. The challenge presented by wildfires is amplified due to socioeconomic changes in the last 40 years and inadequate land management in the context of climate change. The principal objective of this work is to establish the most adequate methodology to define the “propagation nodes” in a territory. To do that, the new simulation modes offered by the WildFire AnalystTM simulator (WFA) have been explored to obtain fire behavior data. Likewise, the behavior of large fires in the area has been extrapolated to future scenarios, according to forecasts of different climate change, analyzing extreme weather conditions that can occur in such scenarios (ONU, 2019). The WFA simulator (Tecnosylva, 2014) works efficiently in simulating fire, proving greatly useful in both real suppression operations and fire prevention analysis. It can very accurately generate large wildfires' main pathways without making any kind of adjustments; this is quite useful when planning operations at the head of a fire. It also allows evacuation time evaluation for a given Wildland Urban Interface zone. The area selected for this study is called Sot de Chera, in the Valencia region (Spain). The methodology employed here uses the simulation with WFA setting extreme meteorological and phenological windows associated with wind-driven fires or convection fires dominated with wind, from different starting points looking for the areas where they are grouped. In other words, it is a matter of identifying on the territory the areas where the heads of these higher-intensity fires will arrive, in order to offer realistic control possibilities to the firefighting teams. The results of the simulation identify the heads of the fires with the greatest rate of spread and intensity, exceeding suppression capabilities and efforts, allowing thus to plan for appropriate fuel management strategies to effectively manage emergency responses to fires in these areas.
Introduction
Fire preventative infrastructures emerged in Spain in response to the low-intensity fires that occurred in the 19th century, originated from burning prairies and other activities in mountain areas (Real Orden de 12 de julio de, 1858). As early as 1869, the first forest camps were created to combat summer fires (García Martino, 1869). The vision of fire prevention, in areas referred to as firebreaks, has continued to this day. Save for a few exceptions, such as the Preventive Silviculture Plan for Valencia Region (Generalitat Valenciana, 1996), fire prevention infrastructures are still being designed in a traditional manner: that is, firebreaks dimensioned for low-intensity fires, which are easily controllable with current suppression resources, but are not in line with the parameters of current high-intensity fires (Quílez Moraga, 2017). This classic perspective of the prevention means that fuel management is limited to clearing firebreaks between municipalities or maintaining the pre-existing ones. This practice does not evaluate their functionality in current forest mass, or consider meteorological or climatic conditions in which wildfires presently develop.
According to climate change models (Canadian Global Coupled Model CGCM2), when looking at the maximum temperatures and the drought coefficient (precipitation/2 times the temperature, ECHAM4 model), years like 2012 lie in the lower part of the table of expected anomalies in the 2011–2040 period. Given the situation, fires beyond the suppression capacity and mega-fires are predicted to increase greatly.
In this global change context, it is necessary to combine preventative and suppression actions in the face of the changing fire regimes, where month-to-month and year-to-year, elevated temperatures continue to break records (Fernández-Miguelañez, 2013), taking into account as the concept of fire regime the description by Keeley et al. (2009), which includes the types of fuel consumed, the frequency, the period of the fire, the intensity of the fire, and the spatial distribution of the individual fire events. The only way to reduce the impact of the expected fire regime is to modify the landscape (Castellnou et al., 2019).
Spring drought conditions, temperatures above 35°C and winds above 30–35 km/h make fire control very complicated or impossible. It is in these conditions that uncontrollable fires (Costa et al., 2011) emerged in Spain, such as the fires in Valencia in 1994 and 2012 among others, comparable in magnitude to other fires in Greece in 2007, Portugal in 2017, the Camp and Carr Fires (US) in 2018, among others.
Nowadays, when a big forest fire starts, the political and technical strategies encourage the suppression methods that deploy large amounts of means (e.g., fire trucks and aerial resources) and the usage of all kinds of technologies. These devices usually favor a reactive response to emergencies, which can, on occasion, impose risk due to organizational complexity and excessive resource use.
However, a more profound analysis of the extreme behavior of these fires is necessary at all levels, to obtain a better effectiveness of these technologies or the options that suppression tools offer.
As such, the habitual responses normally begin with an initial dispatch of means that increase according to the growth of the fire. In other circumstances, these strategies are applied regardless of the nature of the territory through which the fire spreads, along with the meteorological and climatic conditions under which it develops, often leaving the final suppression results to chance.
In addition, it is necessary to develop a new vision of wildfires that moves away from the loss of visible values (e.g., production of timber, biomass, and hunting) and focuses on the loss of ecosystem services (e.g., air quality and water quality), considering especially future scenarios of global change with impacts at a short, medium, and long term (IPCC, 2018; ONU, 2019). The new vision is directed toward land planning, integrating the current problem that fires pose.
Technical tools, as land planning models and fire modeling software, evolved very rapidly over the past few years. Concepts such as fire pathways (Minimum Travel Time, hereinafter MTT) (Finney, 2002) can prove very useful for their design. In short, this work aims to greatly reduce the uncertainty of most firefighting operations (Simons, 2013) in relation to large forest fires' spread directions.
To decrease the incertitude and focus a wildfire management in a way in which the decision making is more adequate, it is necessary to consult the knowledge gained from historical fires in a territory, and, through the support of new simulation technologies and GIS analysis, determine the areas with high potential of large wildfires propagation.
This knowledge will form the basis to develop pre-established fire suppression plans, which will provide emergency officers with a series of predetermined operational decisions under different weather windows, overall aiding to change the current reactive response to a more proactive one. The emergency officers will have technical data to support their actions, reducing the pressure on decision-making, increasing the safety of the crews involved and populations concerned, while reducing fire damage in a given region.
This is the reason why the idea of establishing, knowing, and developing the idea of the propagation nodes is posed. Propagation nodes can be defined as areas where the MTT from different fire simulations in an area accumulate under distinct meteorological conditions, with the potential to generate large wildfires (Finney, 2002). Propagation nodes differ from “critical points” defined by Costa et al. (2011) as the latter are used to locate inflection points in the behavior of specific fire patterns; they tend to be located in riverbeds and are closely linked with changes in slope, and they also differ from the Nodes Grid concept (Alcasena et al., 2018), since this attempts to quantify the cells that are burned from a given cell, while the propagation nodes attempt to identify areas where the main fire paths intersect. The former, meanwhile, are determined at a broader scale and are found in areas where large-scale surface fires propagate.
Objectives
The definition of the propagation nodes then facilitates the identification of the most appropriate areas for preventive treatments. Thus, the research proposes drafting proactive operation plans in order to anticipate the spread of fire and reduce its broad effects on the territory, while providing a safer scenario for the crews involved in wildfire control.
In this sense, the following steps aim to achieve this goal:
(1) explore the new simulation modes offered by the WildFire AnalystTM simulator (WFA) to obtain fire behavior data;
(2) take advantage of the information of the past scenarios of large fires in the area, to carry out the analysis of future forest fire scenarios, according to forecasts of different climate change, analyzing the extreme meteorological conditions that can appear in these scenarios;
(3) analyze fire behavior in these scenarios using the WFA to determine how these fires will spread.
On the basis of the information obtained on the previous points,
(4) define and establish propagation nodes, where most fires will spread under the worst weather conditions, and (5) set the basis to design fire prevention actions to limit the spread of large fires using the propagation nodes and areas of greatest interest for confinement. These will abide by the parameters of fire behavior and aim to provide safe areas to the units involved in their control.
Materials and Methods
Study Area
The used area for the development of this study located in the northeast of the province of Valencia (Figure 1) was selected: “Sot de Chera” (the central municipality in the area of study). This area constitutes a dense forest mass, limited to the south by the Utiel Requena plain and the A3 freeway, to the west by the N330 from Utiel to Sinarcas, and from there to the Benagéber swamp, to the north by the Turia riverbed, and to the east by cropland along the axis of Pedralba, Chiva. This area constitutes the southernmost tip of the Iberian System. This territory is sparsely populated and few activities center on managing the forest structure, so past fires have contributed largely to creating a continuous and homogenous landscape, as far as forest vegetation is concerned, with a surface of 103.238,45 hectares.
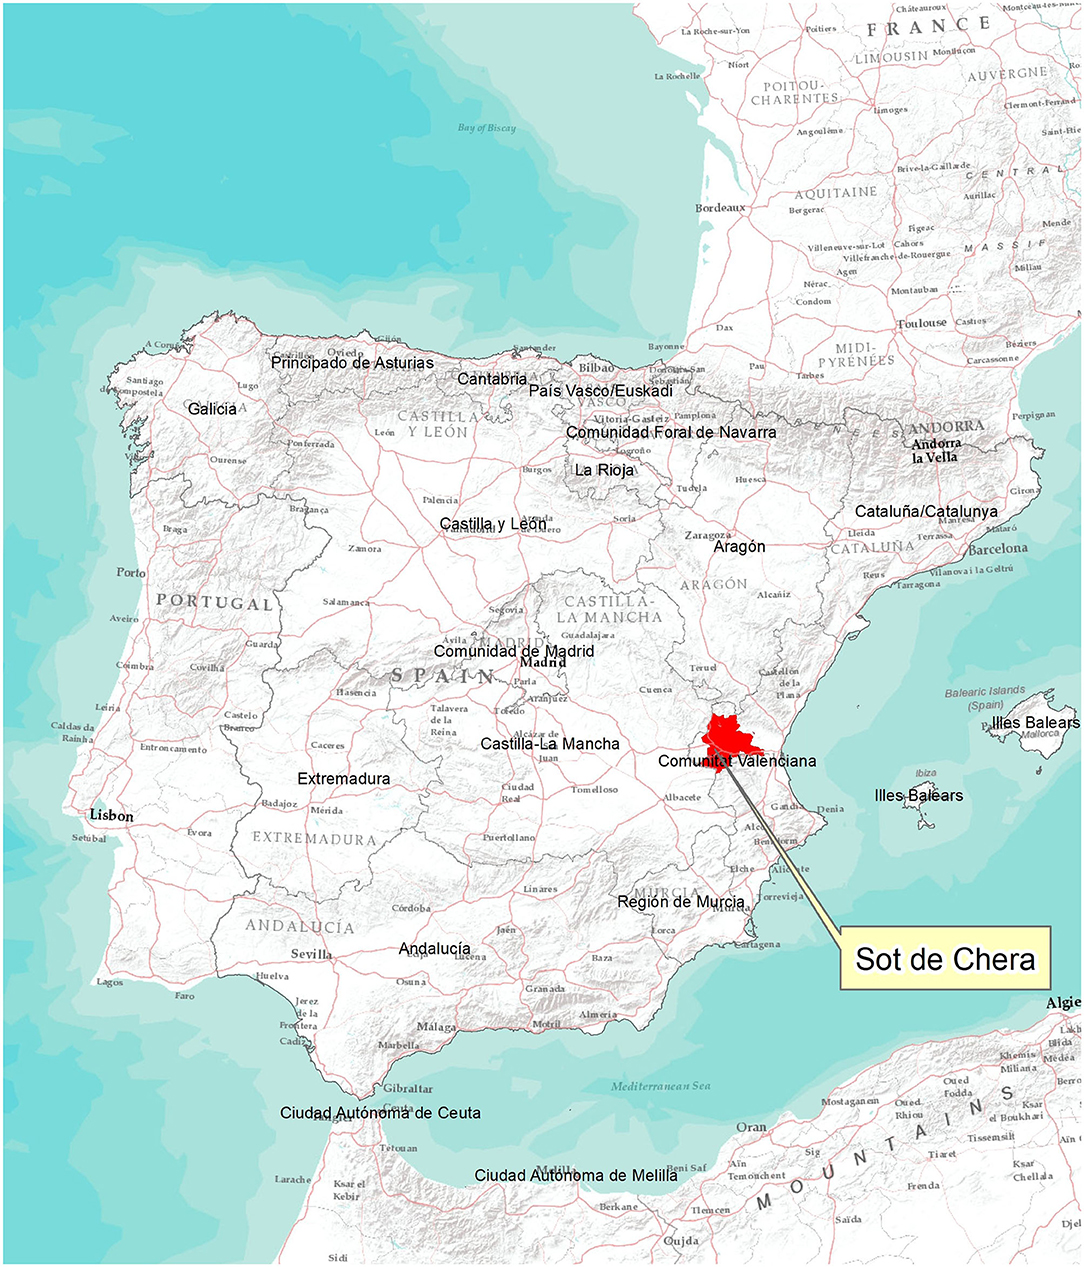
Figure 1. Location of the area of study in the east of the Iberian Peninsula. In red, Sot de la Chera wildfire; in pink, the Calderona Wildfire. Source: Modified by the author on ESRI basemap.
Choice of the Simulator
The research employs the simulation model of WFA to determine the propagation nodes. This work consulted Simons (2013) to select a fire behavior model that can be used during wildfire operations. Simons (2013) analyzes 17 simulators through an exhaustive literature review of existing material. Of these 17, a total of 12 were found with the capacity to simulate fire spread and behavior, and 11 required available input data. Additionally, only 2 of the original 17 simulators, Farsite and WFA, obtained a 4 out of 5 usability rating. Both accept data from heterogeneous spatial terrain, deploy a graphical user interface, do not require script, and have accessible manuals and tutorials. While Farsite requires much more time to develop a simulation, which makes it less operational to be used in real time emergencies, WFA performs the simulations in much less time. For this reason, WFA was the only simulator that met all the requirements from the 17 models analyzed.
The WFA simulator (Tecnosylva, 2014) works efficiently in simulating fire, proving greatly useful both in real suppression operations and fire prevention analysis (Ramirez et al., 2011; Quílez, 2016). It can very accurately generate large wildfires' main pathways without making any kind of adjustments; this is quite useful when planning operations at the head of a fire. It also allows evacuation time evaluation for a given Wildland Urban Interface zone.
Thanks to the high simulation speed and the probabilistic simulation module of WFA, the present research has created a study of the landscape and generated simulations for each point under worst possible weather conditions that can lead to large fires. The results can run through ARCGIS software, allowing the integration of all simulations. Then, the zones where these factors and MTT accumulate over the territory are obtained—defined in this work as propagation nodes. This will prove useful in various fire scenarios with different starting points.
Sound knowledge in obtaining parameters such as forest fuels, meteorology, and especially phenology is key for its use (Figure 2), although establishing MTTs in variable weather situations often does not align with reality. Prior to determining the propagation nodes, this research requires a thorough study of all variables to be introduced into WFA (Figure 1). The quality of the outputs will largely depend on the input data, holding major importance when applying the simulator to forest firefighting operations.
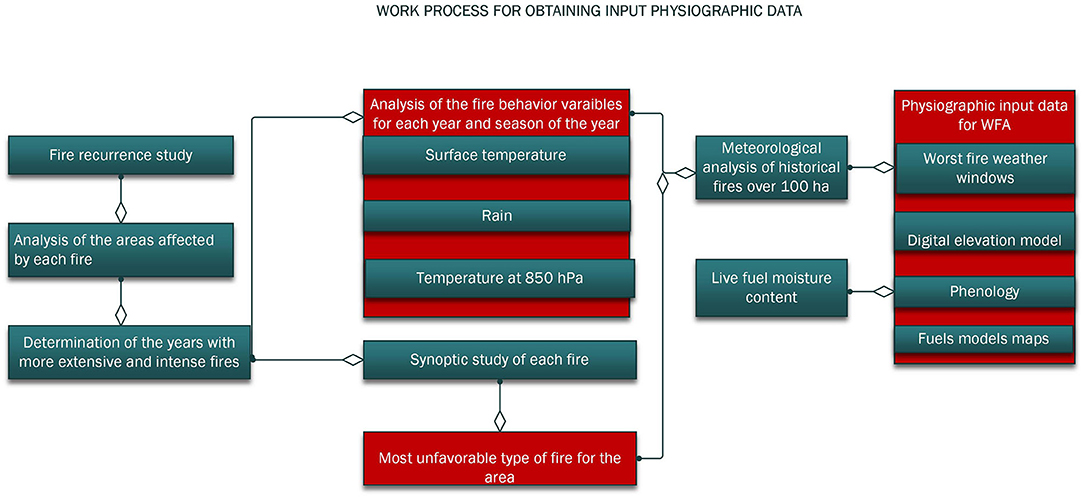
Figure 2. Block diagram used to obtain data for entry in Wildfire Analyst simulator. Source: author's image.
Calculation Location of Propagation Nodes With Wildfire Analyst
In order to carry out the MTT calculations with WFA, one must consider that the simulator works in the following way (a) to calculate the MTT of a normal simulation in the propagation module, the WFA, and (b) to calculate the propagation nodes:
a1. Calculate the number of burned cells caused by one single cell; in Figures 3A,B, an example is shown using for that the zone under study.
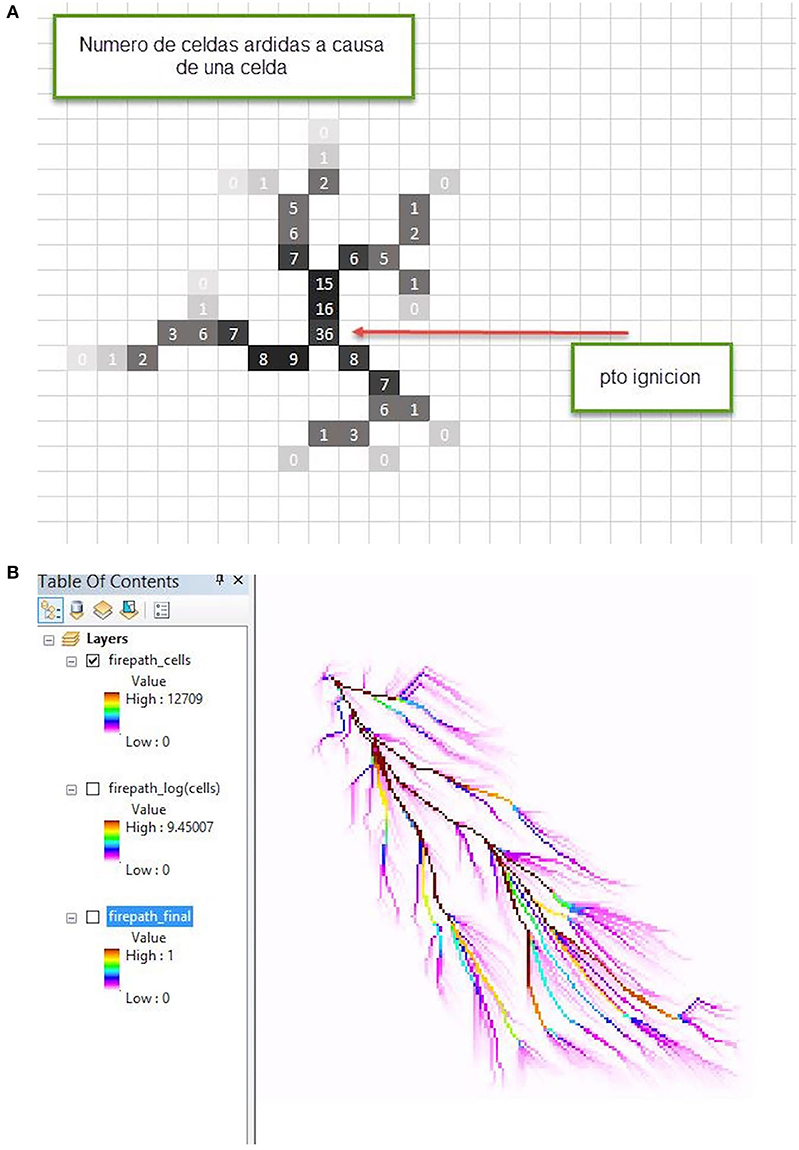
Figure 3. (A,B) Identification of number of burned cells for each ignition point. (A) Example of Huygens principles on a cell grid. (B) WFA outcome representing the Huygens principle on the MTT. Source: Tecnosylva.
a2. Calculate the logarithm of the value of the previous layer (a.1) to homogenize the data.
a3. The obtained logarithm is divided by the maximum value of the layer so that the WFA legend is always defined between 0 and 1 (this is what makes the calculation not absolute, as said before, but only relative to the simulation in question). It is actually divided by the starting point value, corresponding to the logarithm of the total number of cells burned in the fire. For a singular simulation, B is the number of total cells burned in a simulation and x(i, j) is the number of cells burned due to cell with coordinates (i, j), and then the value of the fire pathway (Firepath) over every WFA cell is:
Therefore, the true value of x(i, j) is calculated:
To carry out this process in ARCGIS, the total area of the simulation should be divided by cellsize*cellsize to know the number of cells corresponding to the area, called B, then import the layer to ARCGIS and calculate Equation (2).
The simulations done with the WFA probabilistic module differs in the results: this is because we first sum all the x(i, j) values of each simulation and then calculate and normalize the logarithm. At this point, to obtain B, we must use the acumcost layer, which gives (for each cell) the number of times that a cell has burned in a probabilistic simulations already done (N), and then Bprob is the sum of the value of all cells of the acumcost layer.
The calculation of the propagation nodes can be done as follows (Figure 4):
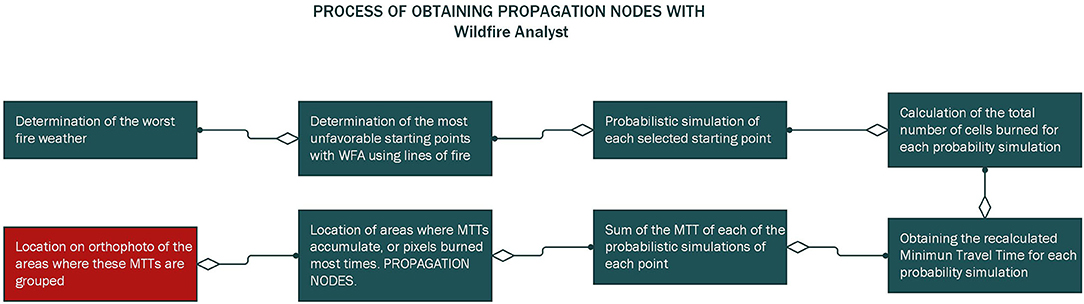
Figure 4. Process of obtaining propagation nodes with Wildfire Analyst. Source: author's image.
b1. Identify the most unfavorable weather for the area of study. The meteorological windows chosen to carry out the simulations correspond to the worst scenarios of wind fires or wind with convection in the study area, which are also quite coincident with those that in other parts of the world generate this type of fire.
To define them, the offshore character of the wind direction in the studied area must be taken into account.
Should certain doubts arise in calculating the MTT in relation to the accuracy of simulations with non-constant environmental variables, we propose performing simulations with fixed environmental conditions (except for the fuel model), for each of the most unfavorable wind orientations in each zone, although the WFA simulator allows incorporating some variability in the direction and intensity of the wind.
b2. Search for the fires' most unfavorable starting points. These can be obtained by collecting starting points from historical fires, randomly, or by determining fire ignition points that generate the major spread pathways.
For this purpose, we have used simulations of different fire fronts, locating these points through the WFA probabilistic module (100 simulations on each front). The fire fronts have been simulated on the perimeter of the study area, in full alignment (Campbell, 1995) to promote the maximum spread of fire. After locating the fire fronts' main spread pathways, the points selected were those with a value superior to 0.4 on a scale of 0 to 1 (based on expert criteria).
For this purpose, different flame fronts have been launched over the study area, from the different wind orientations more favorable for the spread of fire (offshore winds) (Forthofer et al., 2011), in full alignment (Campbell, 1995) to obtain the maximum spread of the fire. These flame fronts will launch fire paths that will agglutinate the fire paths of the fires that may originate within the analyzed territory.
To do this, simulations have been carried out with these flame fronts as the origin, with the WFA probabilistic module (100 simulations for each flame front), to identify the points where the main fire paths are generated. After locating the main routes of propagation of the fire fronts, the selected fire origin points were those that presented in the simulation a value >0.4 on a scale of 0 to 1 (according to expert criteria).
The MTT points that conjoin the main fire pathways are then analyzed using aerial photography of the area.
b3. Simulate every localized point in step b2, using the WFA probabilistic propagator. The result will be the MTT of 100 simulations per selected point, under definite and constant meteorological conditions.
Simulate each point located in step b2, using the WFA probability propagator. The result will be the MTT of 100 simulations per selected point, under meteorological conditions of wind fires and convection wind, with some variability in the wind conditions supported by WFA.
b4. Obtain the total number of cells burned from each starting point through the WFA acumcost output. This enables estimating the number of times each pixel burns on a raster of each probabilistic simulation.
b5. Obtain MTT from probabilistic simulations of each starting point from the output scemtt, recalculated to establish the real number of times that each cell burns from each starting point.
b6. Combine all MTTs of each recalculated point through the ARCGIS software in order to obtain the overall MTT of the territory, integrating the results of the different selected starting points under their respective weather conditions in full alignment.
b7. Locate the union points of these MTT, which will then be called propagation nodes.
b8. Conduct a territory analysis aiming to define the surface of large wildfires, proposing an area that will be left to burn in function of the meteorological conditions, and planning suppression operations based on the typology of these fires' spreads, maintaining the maximum safety of people implicating the deployment.
Once calculated, one can select the areas of each propagation node separately. This focus on what each node contains allows for more detailed individual analysis. For this analysis, we suggest including criteria based on pyromorphology (Castellnou et al., 2009), access points, and adjacent models (e.g., fuel models). Once selected, the information from each propagation node and its surroundings can illustrate the presence of crop zones, water points, and access points, and how to join them together to create closed polygons, all in order to decrease the spread capacity of large wildfires over the node network.
Applying the Model to the Zone Under Study
To analyze the area of Sot de Chera, a preliminary study has simulated WFA with three wind orientations in the south, west, and north areas. Those illustrate starting points that generate the greatest fire spread pathways. To locate these starting points, three different fire fronts have been launched at the beginning of the study area.
These simulations were carried out with WFA's probabilistic tool with 100 simulations for each wind orientation and fire line generated. The simulation's extension varies due to the large quantity of terrain that each simulation encompasses from each orientation. The simulations represent 10 h for southwest and northeast orientations and 15 h for westward orientations. The difference between simulation duration is given by the ellipse shape of the simulated scenario. While the largest axis requires more hours of simulation to calculate all the surface, the short axis requires less time to cover that surface.
The probabilistic simulation allows working with ranges of weather and fuel conditions. The AEMET (Spanish Meteorological Agency) provided the base for meteorological parameters used within the Plan of Preventive Silviculture Plan for Valencia Region (Generalitat Valenciana, 1996), which was adjusted according to the area's own operational experience in fire management, as far as relative moisture is concerned (Table 1).
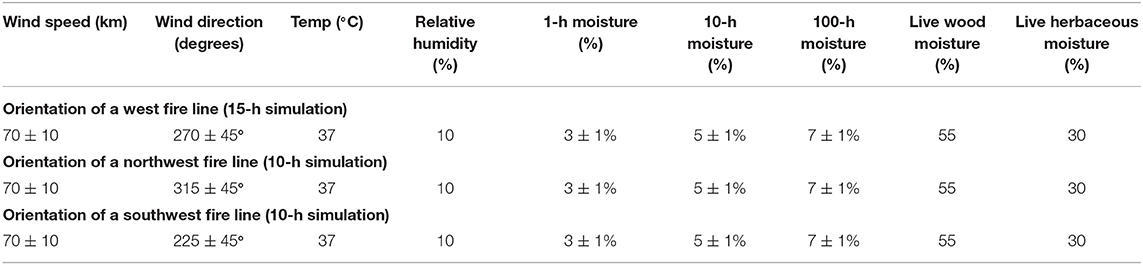
Table 1. Weather and fuel moisture variables used in the simulations for the Sot de Chera study.
This study has used Valencian fuel models (Quílez and Chinchilla, 2013), adapting existing fuel models (Scott and Burgan, 2005) to the area. The same models have served for the phenological state, modifying the PD1 model of grain fields to P1 of low pasture (assuming it has already been mowed), adjusting its period to June 1 through September 30, and demonstrating its status as “fully cured.”
The main fire front spread pathways generated by the MTTs covered most territory and from which most secondary pathways emerge (Figures 5A,B). As such, we found the MTT points that conjoin the main fire pathways; in total, the study selected 52 starting points in the Sot de Chera area. The study carried out simulations with 49 of the 52 selected points, since 3 of these points generate the same runs as their adjacent points. Specifically, the starting points eliminated were numbers 41, 44, and 47 (Figure 6).
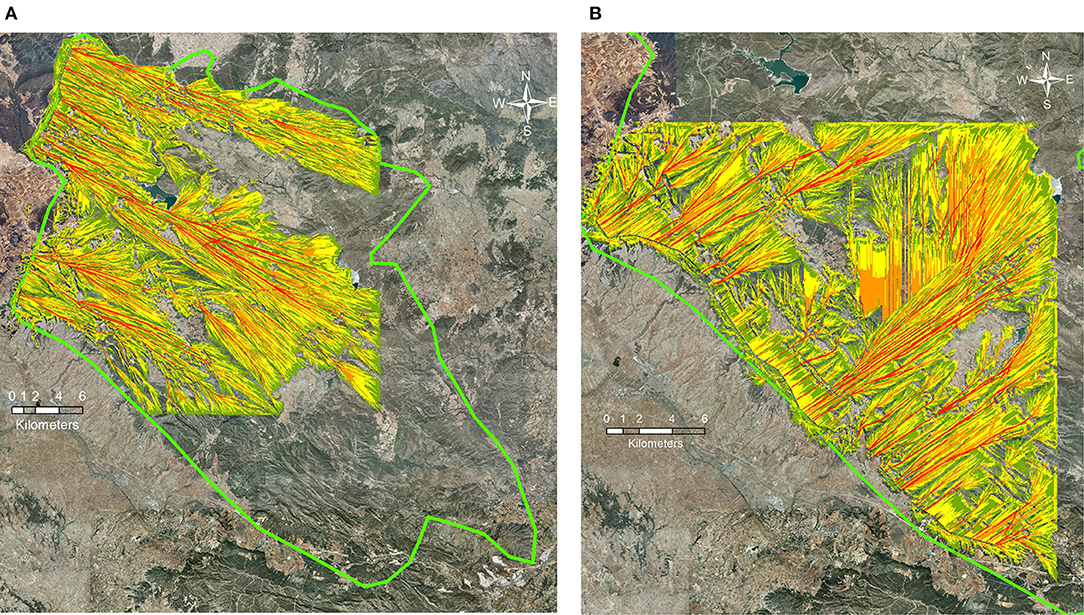
Figure 5. (A,B) Starting points selected with fully aligned fire lines in the area, west line (A) and southwest line (B). Source: Author's.
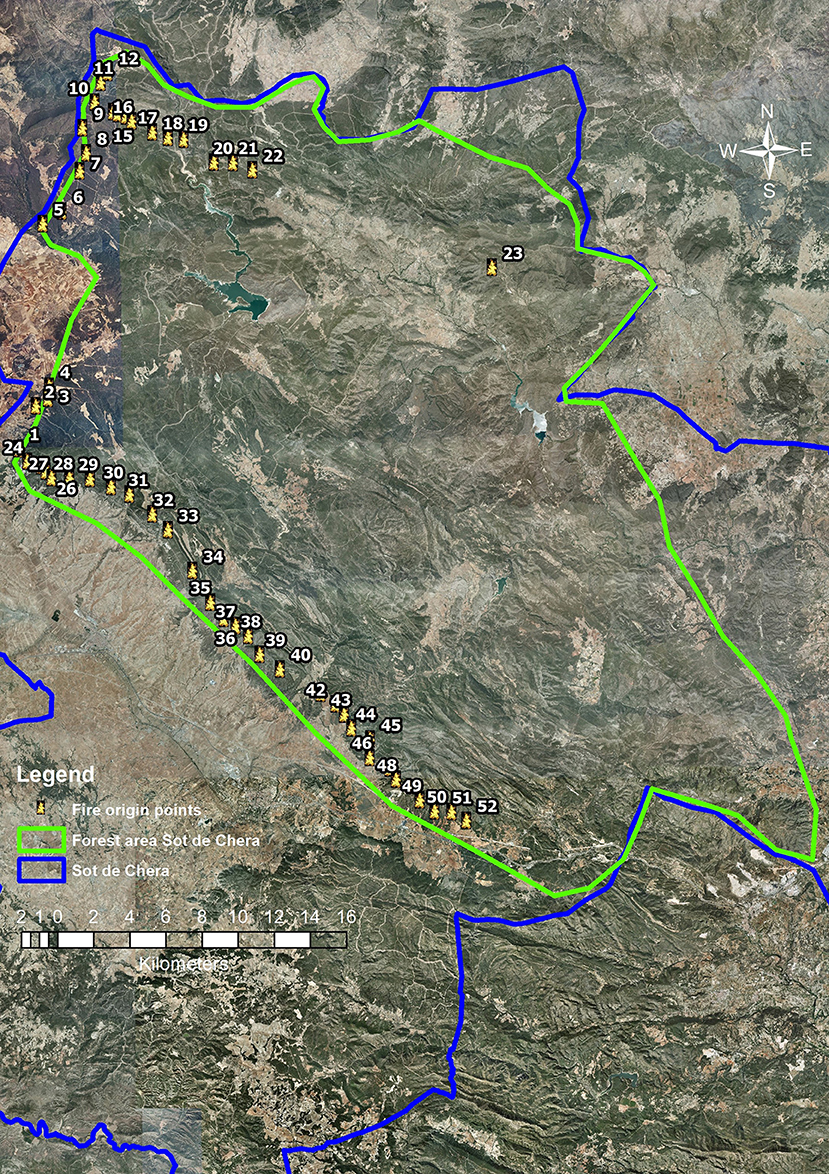
Figure 6. Starting points from selected MTT. Source: Author's.
Once 49 probabilistic simulations occurred (4,900 fire simulations of the scenario), the recalculation of each MTT value was done for each point (Figure 7A), and then conduct their total sum (Figure 7B). When calculating the sum, even if the same simulation extension with WFA is used, the simulation surface is large and the raster layers generated for each starting point will vary their coverage in the field. Otherwise, the information from the peripheral zones of each point's raster can be lost, obtaining only the sum of the central area's overlap. A priority order has been established on the cumulative MTT map, based on the number of times each pixel burns (i.e., between 1 and 17 millions of pixels in this simulations). On a scale of 1–5: 1 corresponds to pixels burned 10–17 million times, 2 corresponds to 5–10 million times, 3 corresponds to 1–5 million times, 4 corresponds to 200,000 to 1 million times, and 5 corresponds to 1–200,000 times. To obtain the final representation, the study separated those pixel values that, in raster analysis, match pixel values outside the burned zone, or those that hold a value of non-burned areas like agricultural or urban zones within the simulation. In this case study, the area is lengthened east–west, the point simulations in the west area lasted 15 h, and the points in the southern and northern areas lasted 10 h. These data are important for working with the summed data of each point's MTTs. Values up to 0.2 are represented transparently, values up to 0.4 in blue, up to 0.6 in yellow, up to 0.8 in orange, and up to 1 in red (Figure 7B).
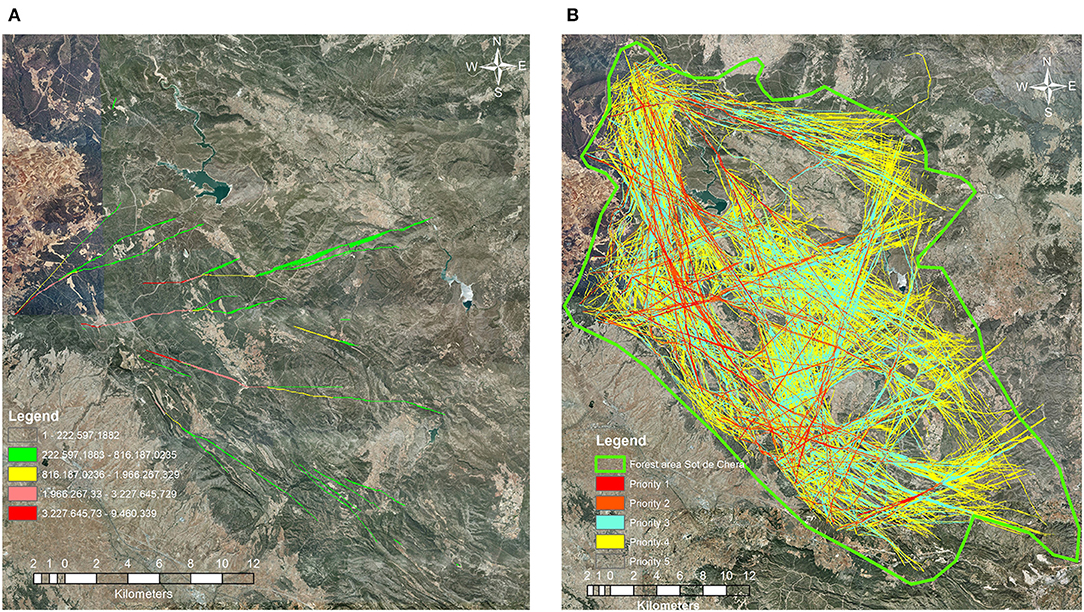
Figure 7. (A,B) Simulation outcomes. (A) Example of recalculated point 1 MTT, legend indicates times that pixel burned over the simulations created. (B) MTT reclassification for each of the 49 points. Source: Author's.
Values under 0.5 are considered not representative and they are removed from further analysis (Figures 8A,B), given that these values are generated when adding the raster layers to the GIS, and appear in the pixels that are outside the simulation area. Once values below 0.5 have been processed and removed, and the resulting values reclassified, the main propagation nodes can be analyzed. A first selection of the nodes is made, but will need a further analysis of parameters, such as terrain shape, present fuel models, distribution of agricultural areas, among others.
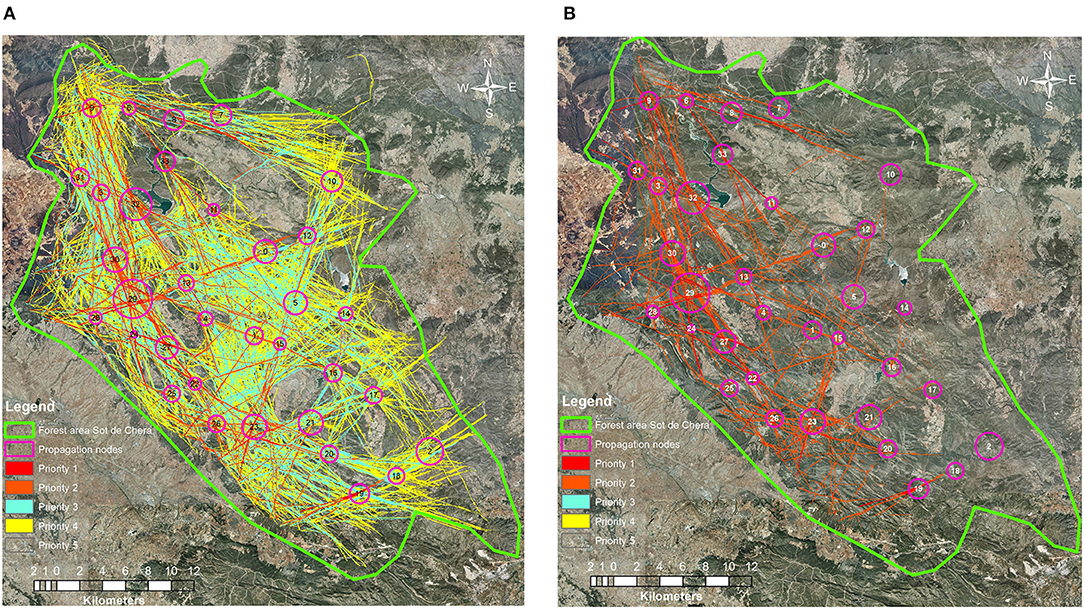
Figure 8. (A,B) Comparison of the resulting main MTT accumulation zones. (A) After eliminating the non-representative values and organized by priorities. (B) The same orthophoto, where the values of priorities 1, 2, and 3 are left. They are the ones that accumulate the most propagation pathways, and therefore where large wildfires will spread in the area. Source: Author's.
In order to determine the propagation nodes, one must bear in mind that according to the prevention regulation in the region of Valencia, preventive silviculture treatments must occupy a maximum 6% of the defensible territory's surface, according to the recommendations of the Ministry of Agriculture, Environment, Climate Change and Rural Development (Generalitat Valenciana, 1996). These treatments include all actions in the area of preventive silviculture, including any actions on the forest cover fraction or shrub vegetation. In the area chosen for this study of Sot de Chera, we have selected 34 propagation nodes with a total initial surface of 8,164.81 ha, for a total forested surface of 103,328.45 ha, where there will be an excess of 1,970.51 ha in selected areas in order to fulfill the 6% established maximum. After analyzing each propagation node, the total area selected for treatment on all nodes has reduced to 3,588.57 ha, which would then have to be recalculated once on-the-ground actions have been reconsidered (Figure 9).
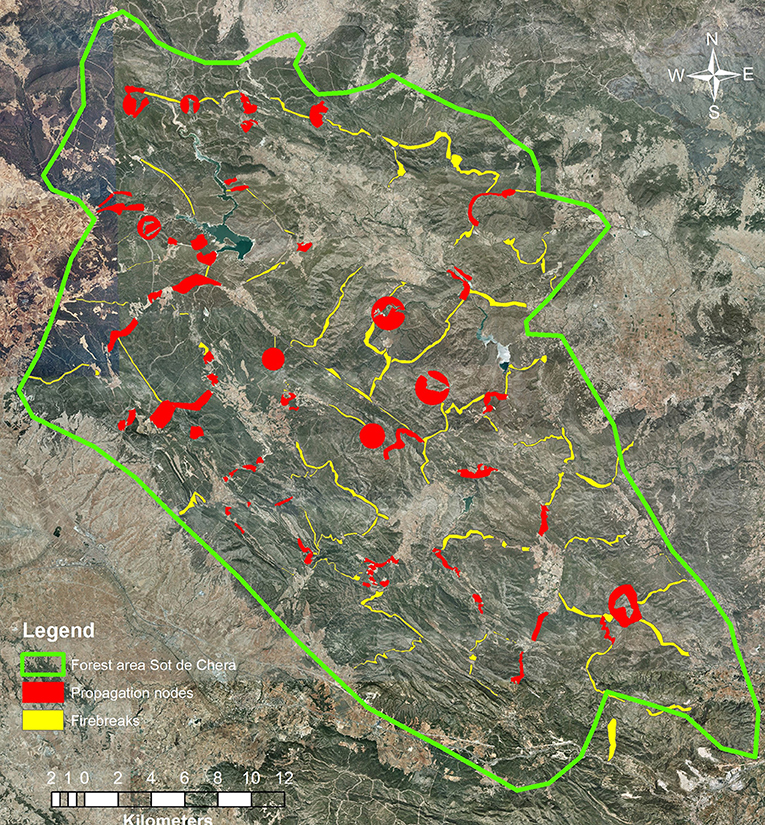
Figure 9. Location of the fire prevention treatments to be completed in the Sot de Chera area to manage propagation nodes and fuel breaks. Source: Author's.
Moreover, the Sot de Chera area has established 50 fire zones, which are perfectly delineated by the propagation nodes to slow down the potential fire heads and joined together by auxiliary buffers that allow the flanks to be managed (Figure 10).
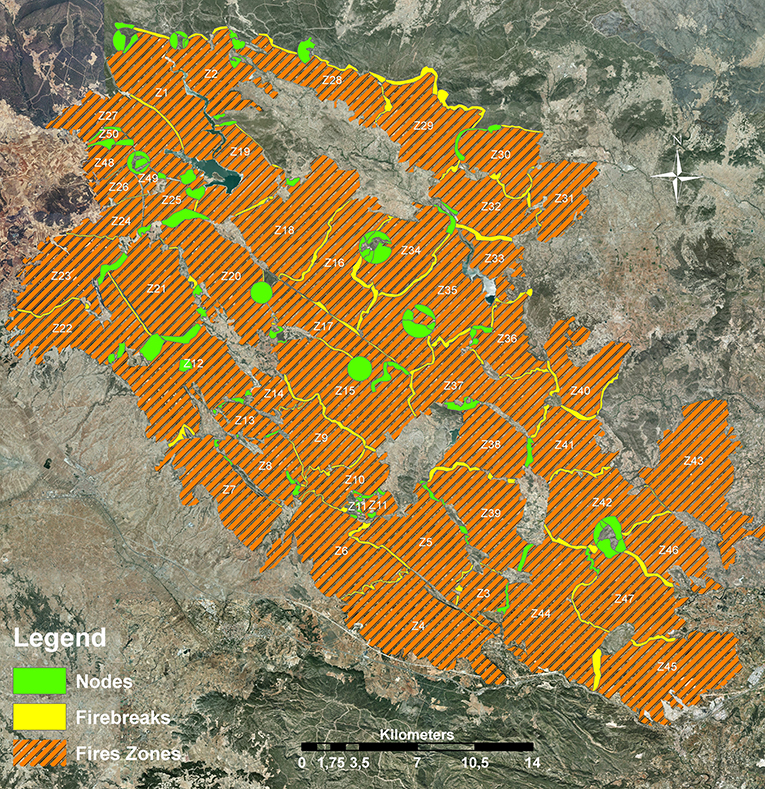
Figure 10. Fire zones in the Sot de Chera area. Source: author's image.
Discussion
Various methodologies arise when defining the most adequate areas for treatment, which consider the kind of vegetation, appropriate control of high intensity fires, and economic viability. Some focus on traditional firebreak areas (Generalitat Valenciana, 1996); other more modern approaches focus on critical points based mainly on changes of inflection in the fire alignments, closely linked to the land's topographic configuration (Costa et al., 2011; Castellnou et al., 2019) and other approaches include propagation nodes, as described in this study. This tool stands out as it describes a territory's particular fire regime and aims to locate the management areas where the principal high-intensity fire pathways accumulate, thus providing better opportunities for fire suppression.
The propagation nodes obtained through the proposed method coincide with the main spread pathways studied in historic fires (Quílez, 2015). The management in the presented nodes will be developed based on the parameters of a wind fire's spread or convection winds, which are linked to changes in weather windows over the fire's duration and which can change the type of fire. The nodes allow finding suitable places to anticipate the fire's spread beyond the suppression capacity. In order to delineate the nodes, one must take all variables of fire propagation into account and then construct them with a minimum size allowing the fire services to use them as safety zones, utilizing formulas such as those proposed by Butler (2014). Additionally, they must also connect through firebreak areas that favor firefighters' counter-fire operations and limit the effects of spreading embers (Figure 11).
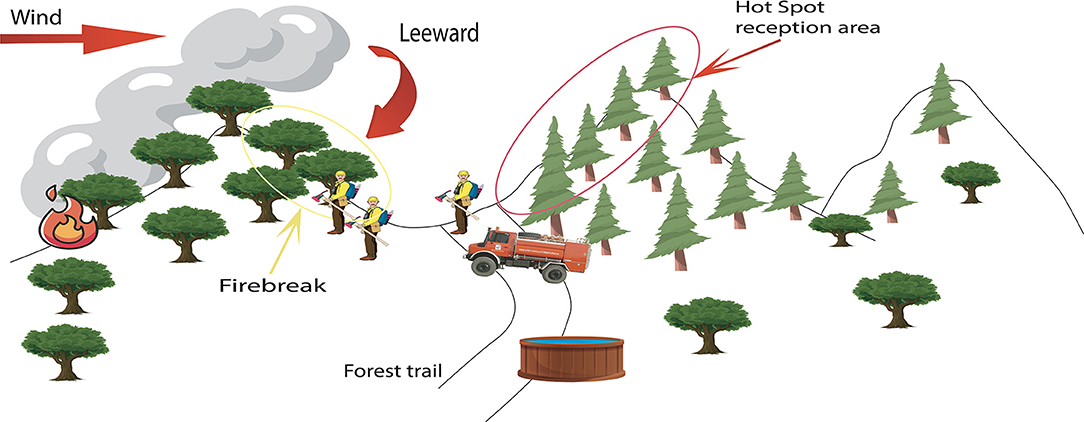
Figure 11. Scheme of preventive actions creating safe work areas to cut off advancing wind fires. Source: author's image.
Once the propagation nodes are established, one must consider their treatment according to the present fuel models, and how to maintain them economically in the long term. All treatments must correspond with the studied fire typology: in this case, wind fires. In any case, the proposed treatment areas should be classified as areas of high strategic interest for maintaining forest cover.
The study of wind fires gives an idea of what locations and preventive actions could slow or stop these fires, as they have a greater spread impact, entry into counter-wind areas, and generate secondary hotspots. Strategically locating firebreaks is critical in controlling large fires and should be designed with the fires' characteristics and typologies in mind. They must be equipped with interior communication routes (buffer zones).
Most current fire responses are reactive. In recent years, much analysis has accompanied fire suppression operations, though it mainly provides solutions to an already-active fire. Ideally, this work should focus on forecasting possible territorial fires and reducing levels of uncertainty while managing active fires in order to evolve to a more proactive extinction response.
For this, the study suggests generating pre-established firefighting plans that anticipate fires outside of suppression capacity and that align with indicated weather patterns in each case. These operative plans always take the enacting personnel's safety into account and should be simulated during trainings in the territory (Figure 12).
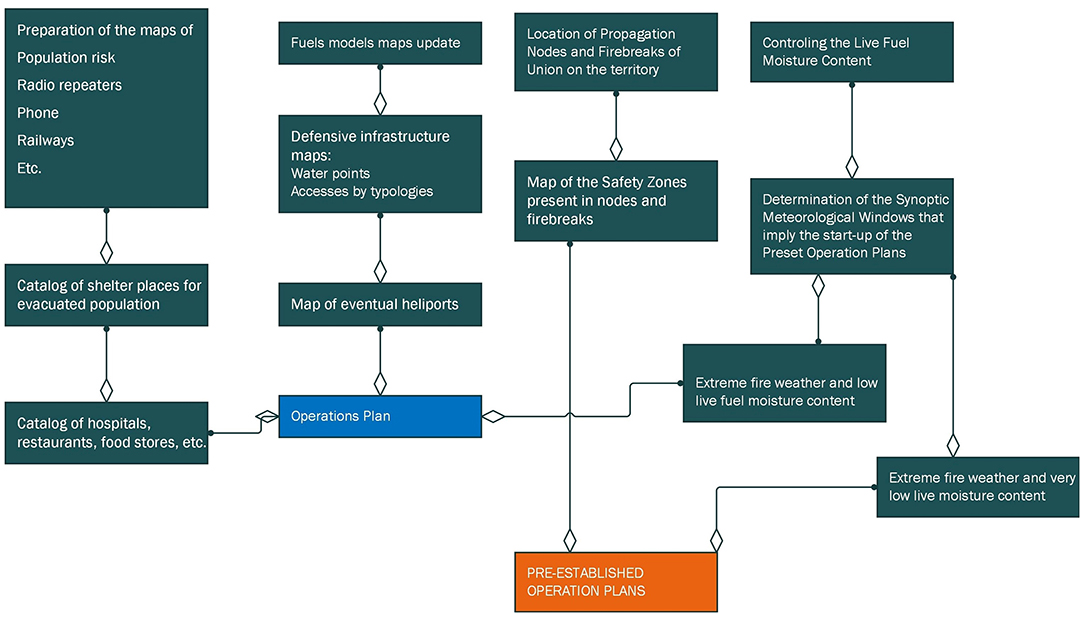
Figure 12. Procedure for plan design and application in pre-established operations. Source: author's image.
The design and implementation of nodes must be carried out while considering the behavior of the most unfavorable fire in the area (Quílez, 2015). In this case, wind fires would have the potential to generate large wildfires. According to operational expertise, this type of fire is characterized by a rapid spread, in most cases motivated by the large generation of hotspots in front of the fire head. Under extreme weather conditions, they can overwhelm the suppression capacity from the first moments, and if there is a wind change (even days later), this can foster the free progression of the fire flanks that will turn into a head fire. This is why we must consider fire behavior at the head and flanks, and through its spread via fire hotspots, all while taking the safety of the fire management crews in account as they deploy the operations. Thus, it is essential to analyze the terrain's pyromorphology, the fuel models present, the access points to each zone, and the distribution of fuels in the nodes' environment (Table 2).
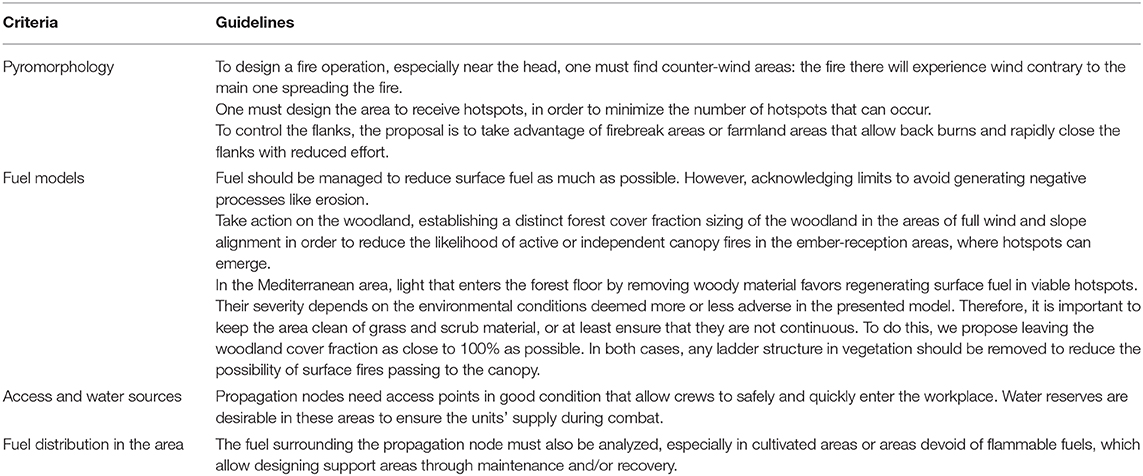
Table 2. Basic criteria used to design propagation node treatment.
Conclusions
The presented tool is the product of expert knowledge and permits both landscape and wildland fire managers to quantitatively identify treatment areas that can prevent large wildfires. This in turn creates areas where there is a discontinuity in fuel that limits the fire spread and behavior and supports suppression services to attack the fire.
Wind and wind convection fires burn the most surface in the Spanish Mediterranean arc, though in the context of climate change, an increase in the incidence of convective fires is expected.
Through available methods and tools, such as the Wildfire Analyst simulator, probabilistic simulation modules, and a subsequent GIS analysis of the simulations, managers can infer the main areas where the fire pathways accumulate under different weather conditions over a given territory, thus expanding analysis capabilities in actual fire suppression operations. The propagation nodes represent a major advance in strategic analysis for forest fire prevention, and further encourage pre-established designs for fire management operations. This contributes to reducing uncertainty while increasing safety during forest firefighting operations.
This methodology can be easily applied elsewhere. For that, it is necessary to collect the input layers required by the simulator to perform the propagation calculations. Notably, the humidity values for the live fuel have a great influence on the simulation results, which means that it is instrumental to identify reliable sources where those data can be retrieved. With the lack of those data, extreme values can be entered such as those used for this work.
Data Availability Statement
The data analyzed in this study is subject to the following licenses/restrictions: Datasets available on request. Requests to access these datasets should be directed to Raul Quilez, raulkillerm@hotmail.com.
Author Contributions
RQ and LV contributed to the conception and design of the study. JR provided support to develop the simulations. RQ performed the analysis and wrote the first draft of the manuscript. JV and KU contributed to synthesize and prepare the manuscript. All authors contributed to manuscript revision, read, and approved the submitted version.
Conflict of Interest
JR is employed by company Technosylva Inc.
The remaining authors declare that the research was conducted in the absence of any commercial or financial relationships that could be construed as a potential conflict of interest.
Acknowledgments
We thanked Jorge Suarez, Deputy Director General of the Security and Emergency Response Agency of the Generalitat Valenciana for providing the necessary information to carry out the different analysis processes; Tecnosylva and its staff, Guillermo, Nacho, and Santiago, for their technical support in resolving various doubts we encountered while carrying out this research; Núria Prat-Guitart for the suggestions on the manuscript; and the Pau Costa Foundation for supporting the publication of fire management knowledge.
References
Alcasena, F. J., Ager, A. A., Salis, M., Day, M. A., and Vega-Garcia, C. (2018). Wildfire spread, hazard and exposure metric raster grids for central Catalonia. Sci. Total Environ. 621, 872–885. doi: 10.1016/j.scitotenv.2017.11.297
Butler, B. W. (2014). Wildland firefighter safety zones: a review of past science and summary of future needs. Int. J. Wildland Fire 23, 295–308. doi: 10.1071/WF13021
Campbell, D. (1995). The Campbell Prediction System. Available online at: http://www.emxsys.com/doug/default.html (accessed April 03, 2020).
Castellnou, M., Pagés, J., Miralles, M., and Piqué, M. (2009). “Tipificación de los incendios Forestales en Cataluña. Elaboración del mapa de incendios de diseño como herramienta para la gestión forestal,” in Actas del 5° Congreso Forestal Español (Ávila).
Castellnou, M., Prat-Guitart, N., Arilla, E., Larrañaga, A., Nebot, E., Castellarnau, X., et al. (2019). Empowering strategic decision-making for wildfire management: avoiding the fear trap and creating a resilient landscape. Fire Ecol. 15:31. doi: 10.1186/s42408-019-0048-6
Costa, P., Castellnou, M., Larrañaga, A., Miralles, M., and Kraus, D. (2011). La Prevención de los Grandes Incendios Forestales adaptada al Incendio Tipo. Barcelona: Unitat Tècnica del GRAF. Departament d'Interior. Generalitat de Catalunya.
Fernández-Miguelañez, I. (2013). Evaluación de la eficacia de la prevención de incendios del aprovechamiento energético de la biomasa forestal en el macizo del Caroig (Valencia). Madrid: Trabajo fin de Master en Tecnologías de la Información Geográfica. Facultad de Geografía e Historia. Universidad Complutense de Madrid.
Finney, M. A. (2002). Fire growth using minimum travel time methods. Can. J. For. Res. 32, 1420–1424. doi: 10.1139/x02-068
Forthofer, J. M., Shannon, K. S., and Butler, B. W. (2011). “Initialization of high resolution surface wind simulations using National Weather Service (NWS) gridded data,” in 11th International Wildland Fire Safety Summit (Missoula, MT: International Association of Wildland Fire).
García Martino, F. (1869). Noticias sobre los incendios en los pinares de la Ciudad y Tierra de Soria. Revista Forestal, Económica y Agrícola. Madrid
Generalitat Valenciana (1996). Plan de Selvicultura Preventiva de Incendios de los sistemas Forestales de la Comunitat Valenciana. Conselleria de Medi Ambient. Available online at: http://www.agroambient.gva.es/documents/162905929/164277177/Plan+de+selvicultura/17516d75-afbe-4356-a414-86d25a7b3e94 (accessed April 03, 2020)
IPCC (2018). “Summary for policymakers,” in Global Warming of 1.5°C, eds V. P.Masson-Delmotte, H.-O. Zhai, D. Pörtner, J. Roberts, P. R. Skea, A. Shukla, in Press.
Keeley, J. E., Aplet, G. H., Chirstesen, N. L., Conard, S. G., Johnson, E. A., Omi, P. M., et al. (2009). Ecological foundations for fire management in North American forest and shrubland ecosystems. General Technical Report PNW-GTR-779. USDA Forest Service, Pacific Northwest Research Station, Portland, Oregon, United States. doi: 10.2737/PNW-GTR-779
ONU (2019). The Heat is on. Taking Stock of Global Climate Ambition. NDC Global Outlook Report. Bonn.
Quílez Moraga, R. (2017). “El régimen de fuego en la Comunitat Valenciana,” in 7° Congreso Forestal Español (Plasencia). Available online at: https://7cfe.congresoforestal.es/content/regimen-de-fuego-en-la-comunitat-valenciana-0 (accessed April 03, 2020).
Quílez, R. (2015). Prevención de Megaincendios Forestales mediante el diseño de Planes de Operaciones de Extinción Basados en Nodos de Propagación. Tesis doctoral. Universidad de León, León, Spain.
Quílez, R. (2016). Prevención de Megaincendios Forestales mediante el diseño de Planes de Operaciones de Extinción Basados en Nodos de Propagación. Tesis doctoral. Universidad de León, León, Spain.
Quílez, R., and Chinchilla, S. (2013). “Modelos de combustible en la provincia de Valencia,” in 6° Congreso Forestal Español (Vitoria).
Ramirez, J., Monedero, S., and Buckley, D. (2011). “New approaches in fire simulations analysis with Wildfire Analyst,” in 5th International Wildland Fire Conference (Sun City).
Scott, J., and Burgan, R. (2005). Standard Fire Behavior Fuel Models: A Comprehensive Set for Use with Rothermel's Surface Fire Spread Model. Fort Collins, CO: United States Department of Agriculture Forest Service. Rocky Mountain Research Station. Rocky Mountain Research Station GTR-153. doi: 10.2737/RMRS-GTR-153
Simons, N. E. (2013). Improving Decision Making During Wildland Fire Events. Santa Barbara, CA: San Diego State University and University of California. Available online at: https://digitallibrary.sdsu.edu/islandora/object/sdsu%3A2740 (accessed November 28, 2020).
Tecnosylva (2014). Wildfire Analyst. Available online at: http://wildfireanalyst.com/help/spanish/index.html (accessed March 30, 2020).
Keywords: prevention, fire management, fire behavior, large wildfires, climate chance
Citation: Quílez R, Valbuena L, Vendrell J, Uytewaal K and Ramirez J (2020) Establishing Propagation Nodes as a Basis for Preventing Large Wildfires: The Proposed Methodology. Front. For. Glob. Change 3:548799. doi: 10.3389/ffgc.2020.548799
Received: 03 April 2020; Accepted: 13 November 2020;
Published: 16 December 2020.
Edited by:
Michele Salis, National Research Council (CNR), ItalyReviewed by:
Owen Francis Price, University of Wollongong, AustraliaBachisio Arca, Istituto per la BioEconomia, Italy
Copyright © 2020 Quílez, Valbuena, Vendrell, Uytewaal and Ramirez. This is an open-access article distributed under the terms of the Creative Commons Attribution License (CC BY). The use, distribution or reproduction in other forums is permitted, provided the original author(s) and the copyright owner(s) are credited and that the original publication in this journal is cited, in accordance with accepted academic practice. No use, distribution or reproduction is permitted which does not comply with these terms.
*Correspondence: Raúl Quílez, cmF1bGtpbGxlcm1AaG90bWFpbC5jb20=