 Katarina Zabret
 Mojca Šraj
- Department of Environmental Civil Engineering, Faculty of Civil and Geodetic Engineering, University of Ljubljana, Ljubljana, Slovenia
The process of rainfall partitioning is usually addressed by three components: rainfall interception, throughfall and stemflow. The occurrence and proportion of stemflow depends on many complexly interconnected factors. To contribute to the interpretation of these interdependencies, the influence of rainfall event characteristics and phenoseasons on stemflow development was analyzed with a new approach. In this study we have focused on the development of stemflow during 156 rainfall events with complete time series records for a single birch tree (Betula pendula Roth.) at a study plot in the city of Ljubljana, Slovenia. For each one of the selected events, diagrams of rainfall and stemflow development during the event were prepared and grouped according to their visual similarities using hierarchical clustering. Additionally, significant meteorological characteristics were determined for each group of events. Four characteristic types of stemflow response were identified and connected to the corresponding event characteristics. Events showing negligible stemflow response to rainfall increase were characterized with rainfall amounts lower than 5 mm, high rainfall intensities, and occurrence in the leafed phenophase. A slow stemflow increase, independent of the increase of the rainfall volume in the open, was recognized for rainfall events delivering less than 20 mm of rainfall during a 5-h duration on average. The majority of these events were observed in the leafed phenophase, corresponding to higher air temperature and vapor pressure deficit. The occurrence of stemflow events, whose development followed the increase of the rainfall amount, was not dependent on the phenophase. However, during these events the average air temperature and vapor pressure deficit were lower, the rainfall amount was larger and the rainfall duration longer in comparison to the events showing independent increase with rainfall. The fourth type of response of stemflow was defined by a strong stemflow response in connection to large rainfall amounts and the longest rainfall duration, as observed for events in the leafless period. The four characteristic types of stemflow response provide additional information on the possible proportion of the rainfall reaching the ground as stemflow.
Introduction
Trees are an important part of vegetation in our environment, contributing to air quality, biodiversity, energy conservation, atmospheric CO2 reduction, aesthetics and quality of living environment (McPherson et al., 2005; Zabret and Šraj, 2019). However, trees also influence the hydrological cycle as they redistribute precipitation. Precipitation partitioning by trees is defined by three components, i.e., interception, throughfall, and stemflow. Interception is the precipitation amount that is retained on leaves and branches, eventually evaporating to the atmosphere and not reaching the ground. Throughfall is the portion of the precipitation reaching the ground underneath the tree due to dripping from the leaves or falling through the openings in the canopy, while stemflow describes the flow of the precipitation down the tree branches and stem. However, in comparison to the amount and proportions of throughfall to gross rainfall, stemflow values are minor (Šraj et al., 2008; Staelens et al., 2008; Mużyło et al., 2012; Swaffer et al., 2014; Zabret et al., 2018; Sadeghi et al., 2020).
Stemflow is the component of rainfall partitioning that contributes the lowest amounts of water to the ground. Due to its close contact with the tree surface, it is also the most challenging to measure (Levia and Germer, 2015; Sadeghi et al., 2020). Therefore, it is quite often neglected and not measured in analysis of the rainfall partitioning process (Carlyle-Moses et al., 2004; Asadian and Weiler, 2009; Sadeghi et al., 2015; Kermavnar and Vilhar, 2017). However, some studies showed that stemflow contribution is not as negligible as it seems (Xiao et al., 2000; Staelens et al., 2008; Germer et al., 2010; Schooling and Carlyle-Moses, 2015). Under certain conditions, stemflow is an important component of the water cycle and as such it should be taken into account. However, it is a very challenging task to identify the conditions under which stemflow should be treated with additional attention.
The amount of stemflow and its proportion to gross rainfall depends on various variables (Crockford and Richardson, 2000; Zabret, 2013; Levia and Germer, 2015; Zabret et al., 2018; Sadeghi et al., 2020), which are mainly characterized as biotic (tree properties) and abiotic (precipitation event characteristics or meteorological conditions). The response of stemflow depends on the combination of all the factors for which the complex interaction has been addressed by multiple researchers. A study performed by Siegert and Levia (2014) was based on long-term observations which covered a wide variety of storm events as well as two tree species with a significantly different bark morphology. It showed that meteorological conditions in combination with tree traits play a complex role in influencing the stemflow amount. The influence of rainfall characteristics according to the phenoseasons was analyzed by Mużyło et al. (2012). They showed that in the leafless period longer rainfall events resulted in larger stemflow amounts while in the leafed period the interaction between stemflow and rain event characteristics was not that explicit. A significantly higher stemflow during the leafless rather than in the leafed period was observed also in other studies (André et al., 2008; Šraj et al., 2008; Zabret et al., 2017; Zabret and Šraj, 2019). However, leaf wettability and water storage capacity are also varying with seasons (Klamareus-Iwan and Witek, 2018). Additionally, Iida et al. (2017) showed that not only the phenophase but also the length of the event and its period (i.e., the first and the second half of the event development) influenced the response of stemflow. During the first half of the event, the observed stemflow values were lower and expressed a higher correlation with rainfall than during the second half. Schooling and Carlyle-Moses (2015) carried out an extensive study measuring stemflow for multiple isolated deciduous trees and concluded that in addition to a distinctive combination of tree characteristics, inducing larger stemflow volumes, also meteorological properties of the events play a significant role. Cayuela et al. (2018) observed different stemflow dynamics between the tree species due to a complex interaction of biotic and abiotic factors, while it was more influenced by abiotic than biotic factors. The research of short-time step development of stemflow as a function of tree species and tree size was performed by Levia et al. (2010), suggesting that all three parameters, namely tree species, tree size, and meteorological conditions, have detectable effects on stemflow yield. Similarly, van Stan et al. (2014) compared the influence of rainfall event characteristics for stemflow by differently sized trees and observed that the tree size was a factor altering the relationship between stemflow and meteorological conditions. The focus on the wind characteristics influencing stemflow was done by van Stan et al. (2011), comparing stemflow generation by trees with differing crown characteristics. The fact that stemflow response cannot be solely explained by the rainfall amount was also confirmed by Park and Cameron (2008), who analyzed stemflow response according to the canopy characteristics. The largest stemflow amounts were observed for a tree species with the highest live canopy length, the largest leaf area index, and the smallest canopy openness. Additionally, smooth bark was observed not to play a significant role in this case as bark absorptivity, leaf arrangement and branch angle seem to have a larger impact. Also, Schooling and Carlyle-Moses (2015) observed the variable effect of bark relief, as it depends also on the rainfall amount and single or multi leader form of the tree stem. However, other researchers in general reported that larger values of stemflow were observed for trees with smoother bark in comparison to those with the rougher one (André et al., 2008; Šraj et al., 2008; Cayuela et al., 2018; Zabret et al., 2018; Zhang et al., 2020).
Stemflow occurrence, its amount, dynamics of flow, and response to rainfall in the open are subject to multiple factors. The influence of biotic and abiotic factors is convoluted. In addition, the factors are also interdependent. These complex interactions were addressed in multiple previous studies, taking into account different combinations of factors and presenting different viewpoints. To contribute to the understanding of this complicated process, we took advantage of the long-term and high-resolution time-step measurements of stemflow, which were analyzed applying a new approach. The development of the amount of stemflow and rainfall in the open was presented graphically as the sum of the detected amounts per event. The figures were then automatically grouped based solely on their visual similarity using the hierarchical clustering approach. Only then we identified the characteristics of the events grouped in the same cluster. With this method we aimed to provide new insight into how the stemflow is expected to develop under certain rainfall event conditions. Furthermore, we also tried to determine when it is necessary to consider stemflow in the rainfall partitioning analysis.
Materials and Methods
Study Site
The study plot is part of a small urban park in the city of Ljubljana, Slovenia. The park is located in the city’s suburb (46.04 °N, 14.49 °E) and is surrounded by a few single-story residential and public buildings. The study plot extends across a lawn with some individual trees and covers an area of approximately 600 m2. On the southern side of the plot there is a two-story building. Additional measurements of rainfall on two locations at the study plot (near the building and in the open at the northern edge of the park, 18 m apart) for a shorter time period were performed to exclude the influence of the building on rainfall. Pearson correlation coefficient for the rainfall amounts measured at both locations was equal to 0.991 and there were no statistically significant differences between the means of the two datasets (p = 0.830). However, the slope of the regression line (0.911) was statistically different than 1 (p < 0.001). This indicates that the rainfall measured at the rain gauge may be up to 9 % higher. This error may be attributed mainly to the wind conditions. Therefore, more detailed measurements focusing on wind conditions and rain distribution at the study plot should be performed to confirm this observation.
Ljubljana is located in central Slovenia, characterized by sub-alpine climate with well-defined seasons. The Köppen Climate Classification subtype for this climate is “Cfb.” The average temperature in winter is around −3°C and in summer 24°C. According to the long-term average (1986–2016), the total annual rainfall in Ljubljana is approximately 1,380 mm. The most rainfall is delivered in autumn, while the driest season is winter (ARSO, 2020).
For this study we focused on the birch tree (Betula pendula Roth.) located in the south western part of the plot. West to the studied tree there is another birch growing; however, the trees’ canopies do not overlap. The observed birch tree is 16.2 m high, it has an 18.3 cm diameter at breast height, the projected area of the tree’s canopy is 20.3 m2, and the average branch inclination is upward and equals 53.3°. The bark is smooth and quite thin (3 mm) with a storage capacity of 0.7 mm. For the birch tree, four phenoseasons are significant: leafed, leaf-fall, leafless, and leafing. During the season with a fully leafed canopy, the storage capacity of the observed tree is equal to 3.5 mm, the canopy coverage is 78.3%, and the leaf area index is 2.6.
Data
The tree’s height, the area of the projected canopy, and the branch inclination were determined from the photographs, taken at a required distance to avoid deformation of proportions. The diameter at breast height was calculated from the measured perimeter of the stem. The bark samples were extracted using a steel hole puncher. For the collected samples, the thickness and weight were measured. To determine the bark storage capacity, the samples were soaked in water for 24 h and then dried at 40°C until the weight of the samples, which was checked at half-hour intervals, stopped to decrease (Pérez-Harguindeguy et al., 2013). Phenoseasons were determined according to our observations of the numerosity of the leaves in the canopy, supported with the leaf area measurements, which were extensively performed during leafing and leaf-fall periods. The leaf area index was measured using LAI-2200c Plant Canopy Analyzer (LI-COR) following the protocol for isolated trees (Li-COR, 2015). Canopy coverage was estimated from the ratio of black to white areas on the pre-processed photographs of the tree canopy, taken vertically 1 m above the ground.
At the study plot we measured all the components of rainfall partitioning; however, only rainfall and stemflow are used in this study. These measurements have been performed since the beginning of 2014 (e.g., Zabret et al., 2017; Zabret et al., 2018; Zabret and Šraj, 2018; Zabret and Šraj, 2019). The period from 1 January 2014 to 30 September 2018 was selected for the analysis. The selected time period covers all seasons and corresponding phenoseasons, which occurred multiple times. We have selected 590 events for further analysis, excluding snow and sleet events as well as events during which the clogging of the tipping buckets was observed.
Rainfall in the open was measured using a tipping bucket rain gage with an automatic data logger (0.2 mm/tip, ONSET RG2-M, Onset HOBO Event data logger). The recorded rainfall series were divided into rainfall events, separated with at least 4-h dry periods. The length of the dry period between the events was determined according to the observations during field and previous measurements. From the recorded time series, the rainfall event duration, rainfall event intensity and the length of the dry period between the two events were calculated. For the rainfall events, which delivered less than 5 mm of rainfall in less than 2 h, additional verification of the duration and the intensity was performed using data, collected with a disdrometer (OTT Parsivel), positioned on the rooftop of a nearby building (Zabret et al., 2017).
Stemflow was collected using a rubber collar, spirally wrapped around the stem, attached with nails and packed with silicon (Figure 1). Collected water was transferred to a tipping bucket equipped with an automatic data logger (0.2 mm/tip, ONSET RG2-M, Onset HOBO Event data logger). The time series of the stemflow data was split according to the predefined rainfall events. The stemflow amount was corrected according to the canopy contribution area (Livesley et al., 2014; Siegert and Levia, 2014). The sum of stemflow (Σ SF) and rainfall amount (Σ R) per events were additionally calculated and used to determine the proportion of stemflow according to the rainfall in the open:
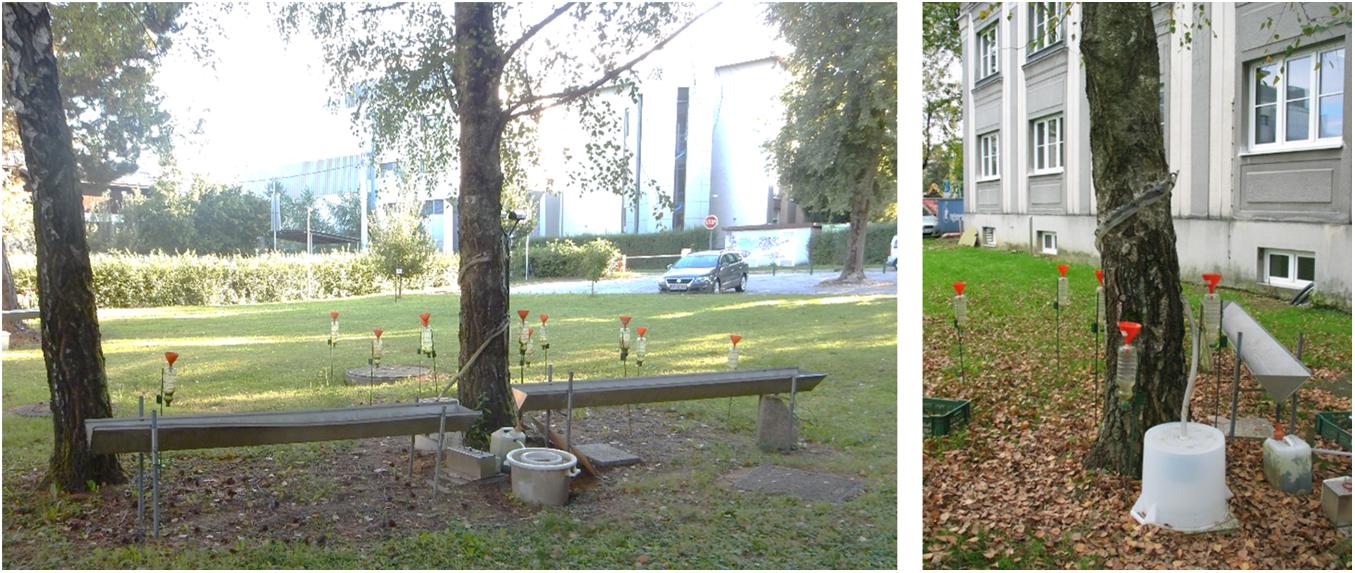
Figure 1. Study plot (left) and measurements of the stemflow at the selected birch tree (right).
Additional meteorological data were included in the analysis to describe the microclimatic conditions during the event. Data on wind speed, wind direction, air temperature, and air humidity were obtained from the meteorological station Ljubljana Bežigrad, operated by the Slovenian Environmental Agency (ARSO, 2020). According to its location in the Ljubljana basin, its data are representative for the observed location (Nadbath, 2008). Using half-hour records of the observed variables their average values during the selected rainfall events were calculated.
Methods
The influence of meteorological variables on stemflow development by birch tree was investigated using a different approach than usual. Instead of first analyzing the characteristics of the events, we graphically presented the development of rainfall and stemflow per event. Therefore, in the first step the graphical presentation of the measured rainfall and stemflow data was prepared. In the second step, we grouped the figures into clusters using hierarchical clustering, and in the third step, we analyzed the meteorological variables per events, grouped in individual cluster.
The graphical representation of the rainfall and stemflow development per event was based on the complete time series of the measured rainfall and stemflow. The raw measured time series were divided by rainfall events, separated with dry period of at least 4 h. Data were summarized in 5-min intervals and the values were plotted on the graphs, with the x-axis indicating the duration of the rainfall event in 5-min intervals and the y-axis indicating the summarized amount of rainfall or stemflow in mm (Figures 2, 4). The graphs of rainfall and stemflow development were generated using the function ggplot (Wickham et al., 2020) in R, a software environment for statistical computing and graphics (R Core Team, 2020). The values of stemflow were increased by a factor of 10 to be able to demonstrate the increase in stemflow due to its low values in comparison to rainfall. These graphs were all prepared using the same algorithm regardless of the rainfall event duration, the total amount of rainfall or stemflow. The unprocessed graphs were then used for hierarchical clustering.
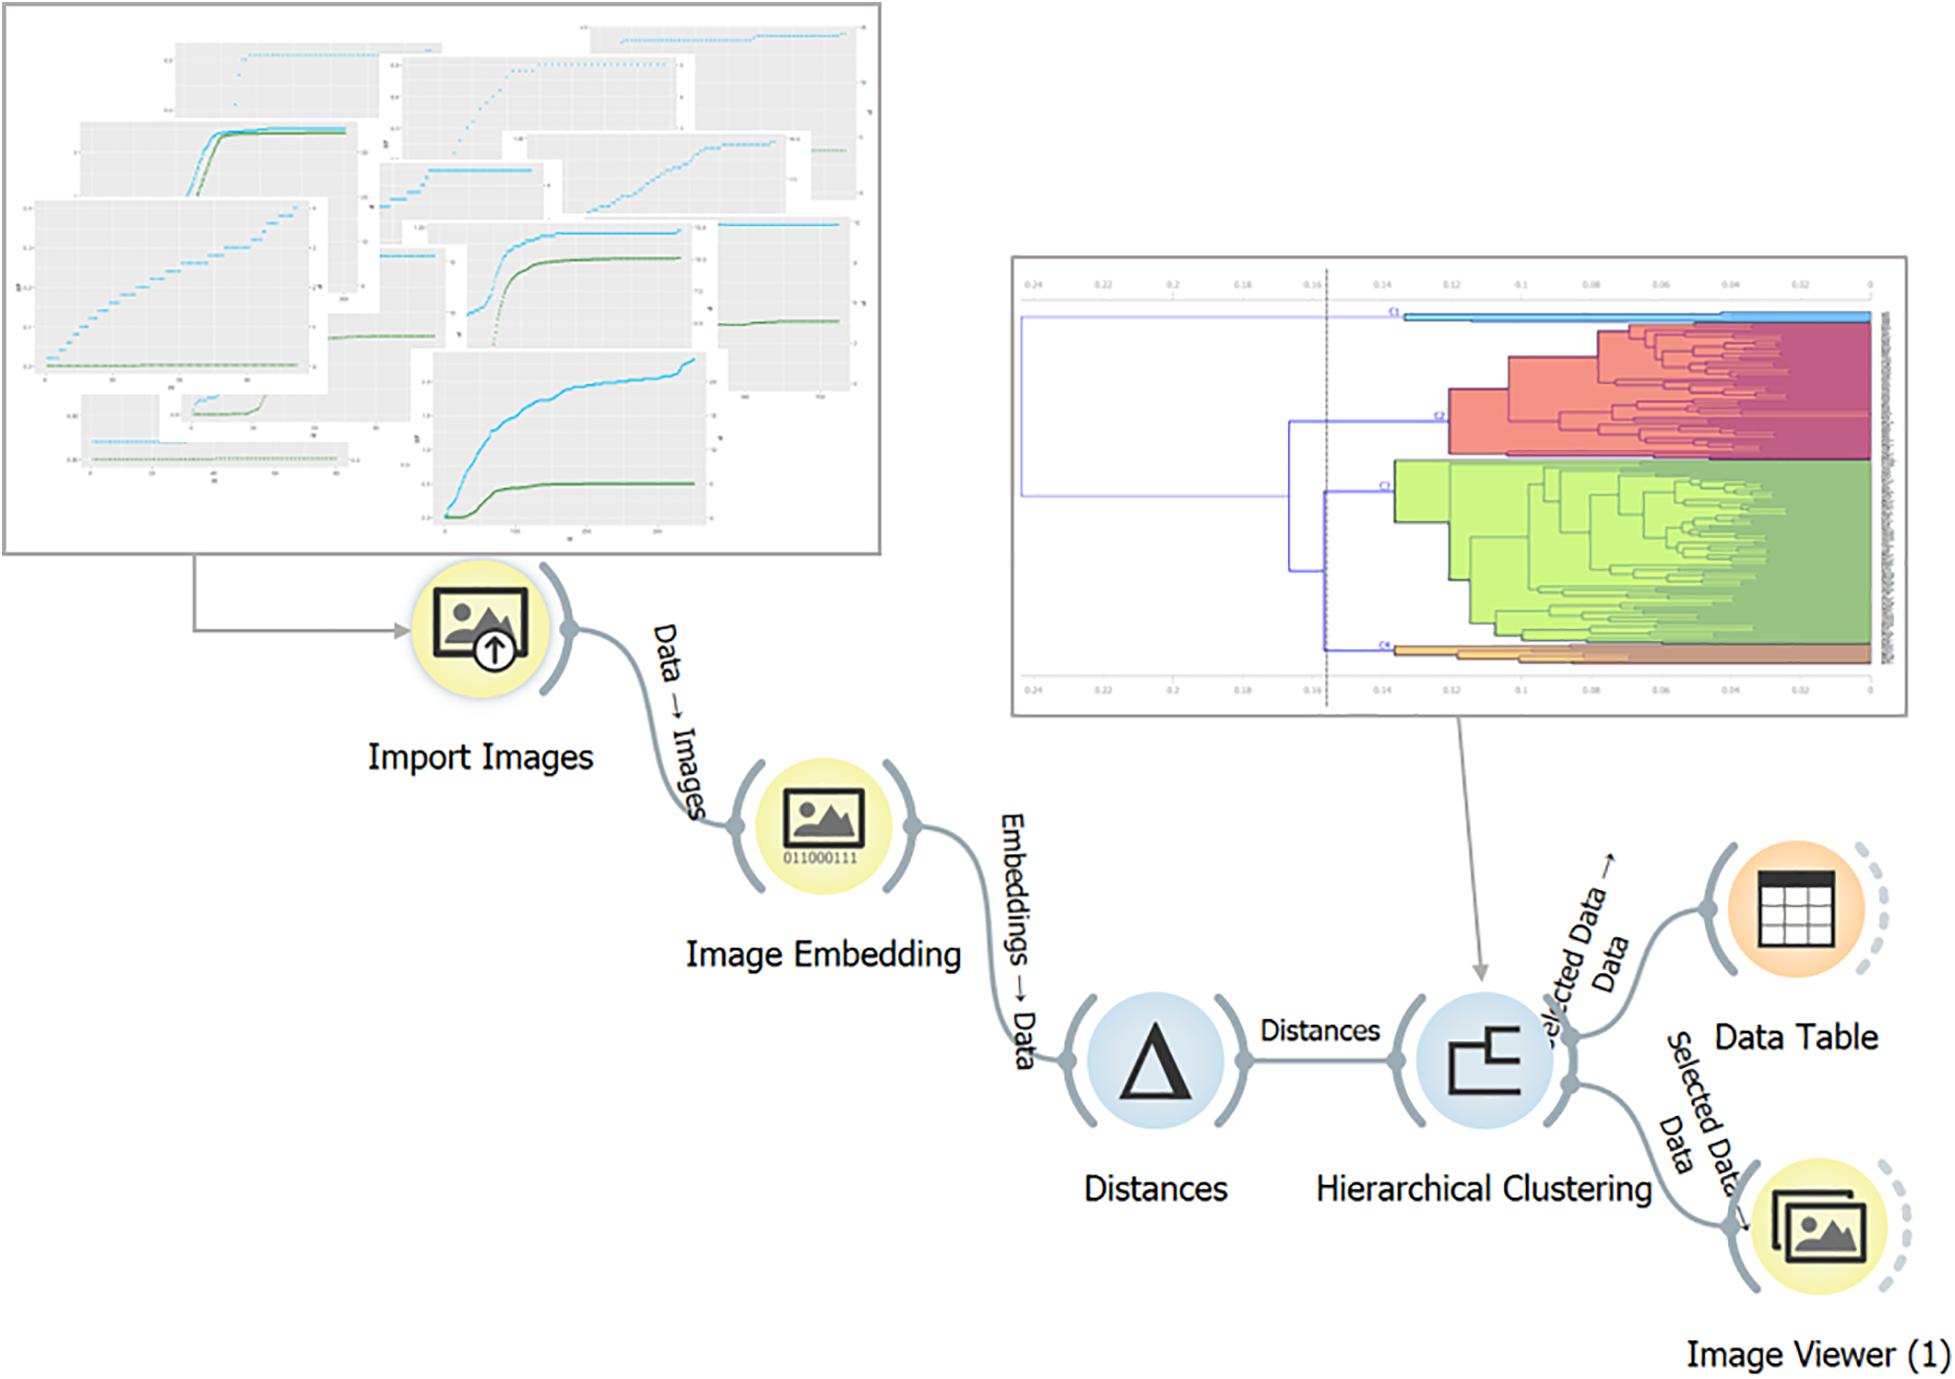
Figure 2. A flowchart of the steps for hierarchical clustering in Orange software with examples of imported images and final dendrogram with division into four clusters.
Hierarchical clustering of figures was performed in the Orange software (Demšar et al., 2013). First, the figures were transformed into a numerical format using the image embedding algorithm. Then, the Cosine metrics was applied to calculate the distances among the figures, describing their similarity (Figure 2). The figures, named by the date of the event, were grouped into the clusters according to their visual similarity, which was also taken into account in their numerical transformation and calculated using a distances metrics. According to the splitting of the dendrogram, the division of the data set into four clusters was selected, corresponding to the third row of the dendrogram or the height ratio of 64% (Figure 2).
According to the results of hierarchical clustering, the events were divided into four clusters. For each cluster, the typical response of stemflow was observed between the grouped figures (Figure 4). However, the common meteorological characteristics associated with such a response were analyzed in the third step. For the events of each cluster we determined the total rainfall amount and duration, the average rainfall intensity, the average wind speed and direction, air temperature and vapor pressure deficit, as well as the dry period duration before the event and the phenoseason in which the event was observed (Figure 5). A comparison of these characteristics per cluster was performed.
Results
General Stemflow and Rainfall Event Characteristics
In the observed period from 1 January 2014 to 30 September 2018, the 590 registered rainfall events in total delivered 6,203 mm of rainfall. Stemflow was detected during 250 rainfall events, for which the complete time series of rainfall in the open, throughfall, and stemflow were compared. Some data were recognized as clearly incorrect due to fouling of the collectors (e.g., ant infestation, clogging of inflow with leaves) and were removed from the considered data set. Therefore, 156 events with complete time series records of rainfall and stemflow were selected for the further analysis. Stemflow was detected for the events with at least 0.8 mm, while 8 mm of rainfall was needed to initiate continuous flow of stemflow.
The 156 analyzed rainfall events in total delivered 3,066.5 mm of rainfall, from 0.8 to 102 mm of rainfall per single event (Table 1). The shortest rainfall event lasted for 13 min, delivering 2 mm of rainfall, while the longest rainfall event, observed in November 2016, lasted for more than 2 days (67 h) and delivered 84 mm of rainfall. The average rainfall intensity of the analyzed events was equal to 2.4 mm/h (± 2.6 mm/h), reaching up to 13 mm/h, observed during an hour long event in the beginning of June 2016. The average air temperature was equal to 12.4°C (± 5.3°C) and the average vapor pressure deficit was equal to 0.17 kPa (± 0.16 kPa) per event. Approximately half of the events were observed during the leafed period from mid-April to mid-September, one third of the events was observed during leafless period from the late October to the end of March and the rest of the events were detected either during leafing or leaf-fall periods (Table 1).
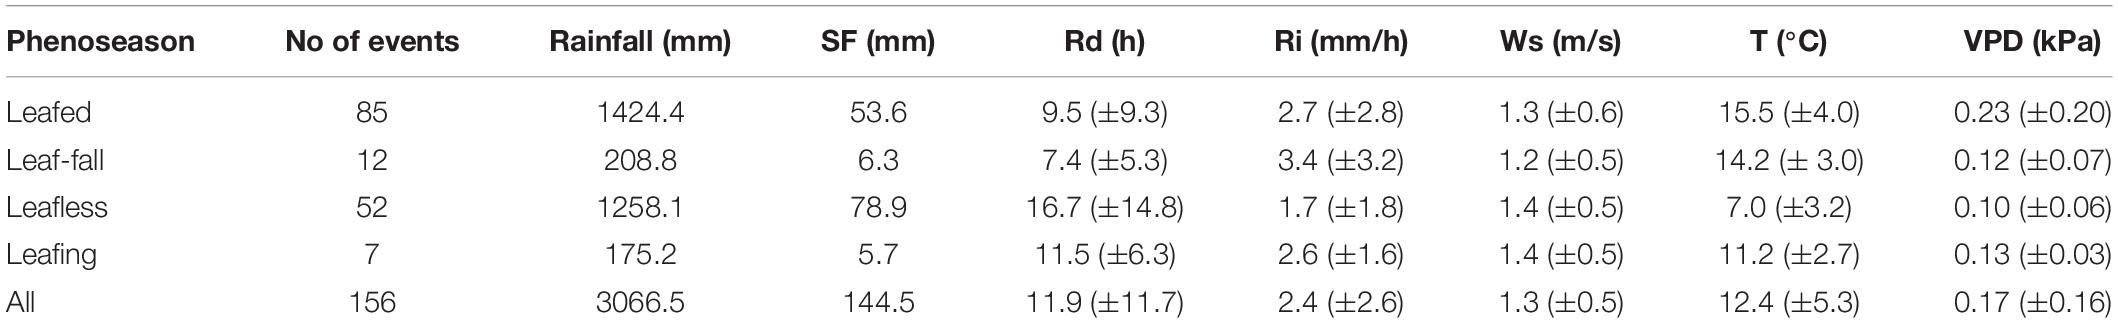
Table 1. The total rainfall and stemflow (SF) amounts and average event-based values of rainfall duration (Rd), intensity (Ri), wind speed (Ws), air temperature (T) and vapor pressure deficit (VPD) for the events during the individual phenoseasons.
Stemflow by birch tree during the analyzed events averaged to 3.0% of rainfall in the open, ranging between 0.02 and 15.57%. The stemflow data were not normally distributed as indicated by the results of histogram (skewness = 1.5 and kurtosis = 2.1) and the Shapiro-Wilk normality test (p = 9.94e-13) (van Stan and Gordon, 2018). For almost half of the considered events (45%) the observed stemflow was less than 1% of rainfall in the open, while for majority of the events (80%) stemflow accounted for less than 5% (Figure 3). Therefore, the median value of stemflow for analyzed events was equal to 1.6% of rainfall in the open. The highest values of stemflow were observed during the leafless period, 4.3% on average per event and with a median of 4.2%, resulting in total of 78.9 mm of rainfall in the open during 52 events (Table 1). During the leafing period the average stemflow per event was a bit smaller than in the leafless period, as its median was equal to 2.2%. Stemflow was on average the lowest during the leaf-fall and the leafed period, when its median was equal to 0.3 and 0.6%, respectively. In the leafed period stemflow in total contributed 53.6 mm during 85 events (Table 1). The difference between the stemflow values in leafed and leafless periods was statistically significant with p-value less than 0.001.
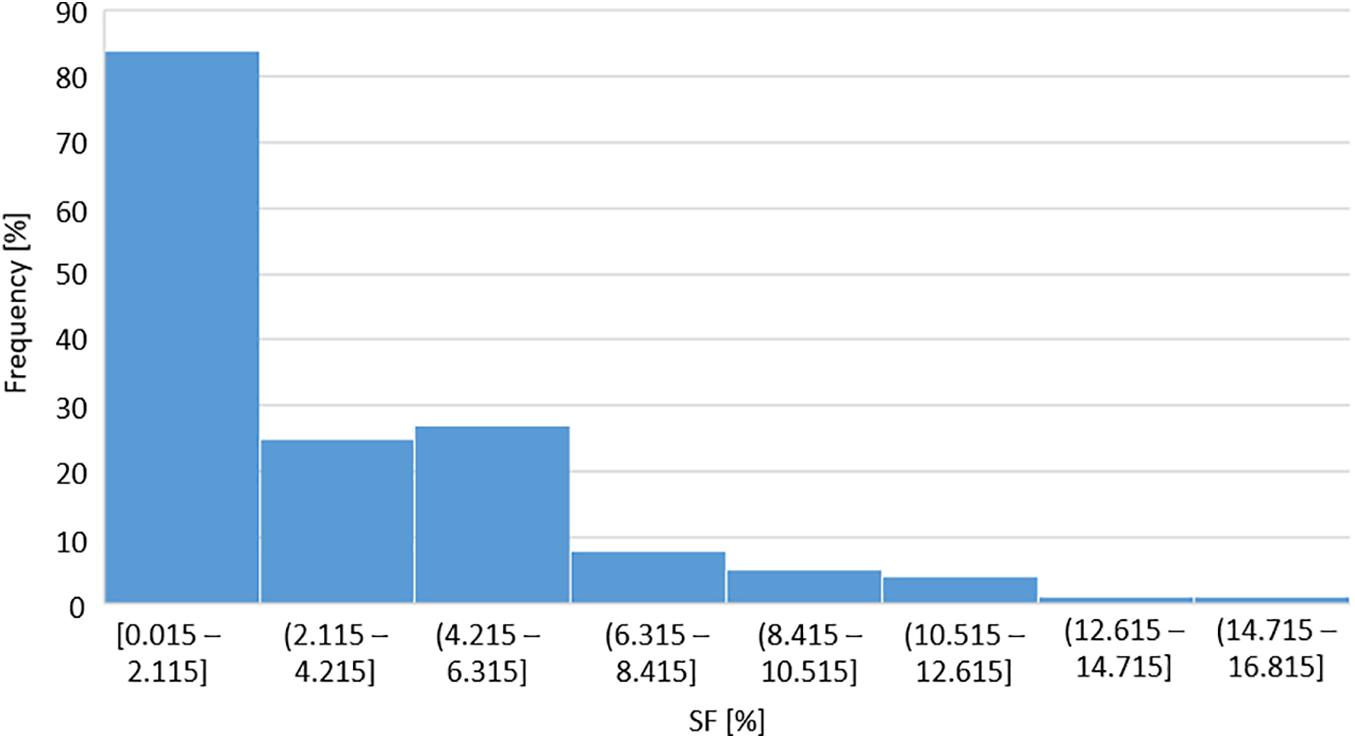
Figure 3. Histogram of measured stemflow values for birch tree.
Hierarchical Clustering
The results of hierarchical clustering are presented on a dendrogram (Figure 2, top right). Based on the structure of dendrogram’s branches, four clusters were selected. The figures, grouped in each cluster were reviewed and accordingly four types of stemflow response were determined (Figure 4), namely the group of no response, the group of slow and independent increase, the group of moderate increase and the group of strong response of stemflow.
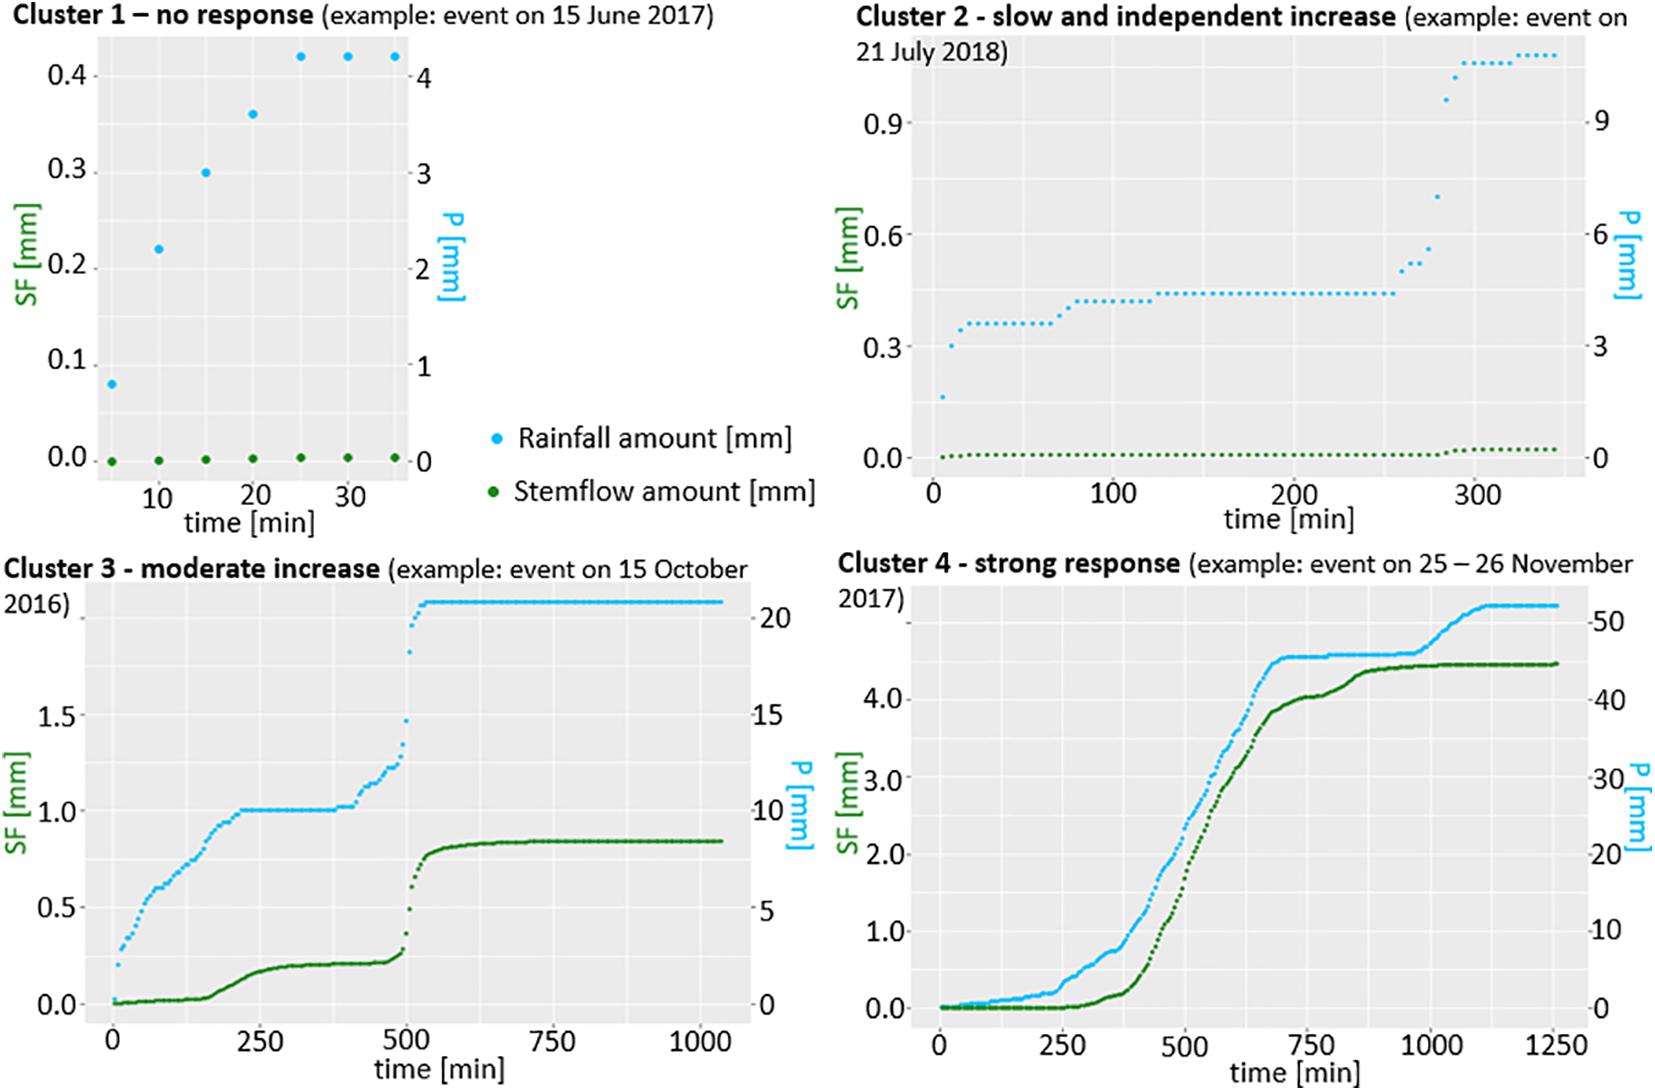
Figure 4. Examples of figures showing typical development of stemflow and rainfall grouped in individual clusters (amounts of stemflow and rainfall are plotted as the sum of the detected amounts at 5-min time intervals; the left y-axis shows values of stemflow increased by a factor of 10, the right y-axis shows values of rainfall in the open).
Events, showing no response of stemflow according to the increasing total amount of rainfall in the open, were grouped in cluster 1. 5 events were grouped in this cluster with stemflow reaching between 0.07 and 0.23% of rainfall per event, on average 0.11% (Figure 5). Four of them were detected in the leafed and one at the end of the leafless period. The rainfall amount per event was on average quite low (2.8 mm) and the events were short (27 min on average). As the majority of the events were observed in the leafed period, corresponding to the warmer months of the year, a fairly high average air temperature (18.1°C) and vapor pressure deficit (0.6 kPa) were also observed.
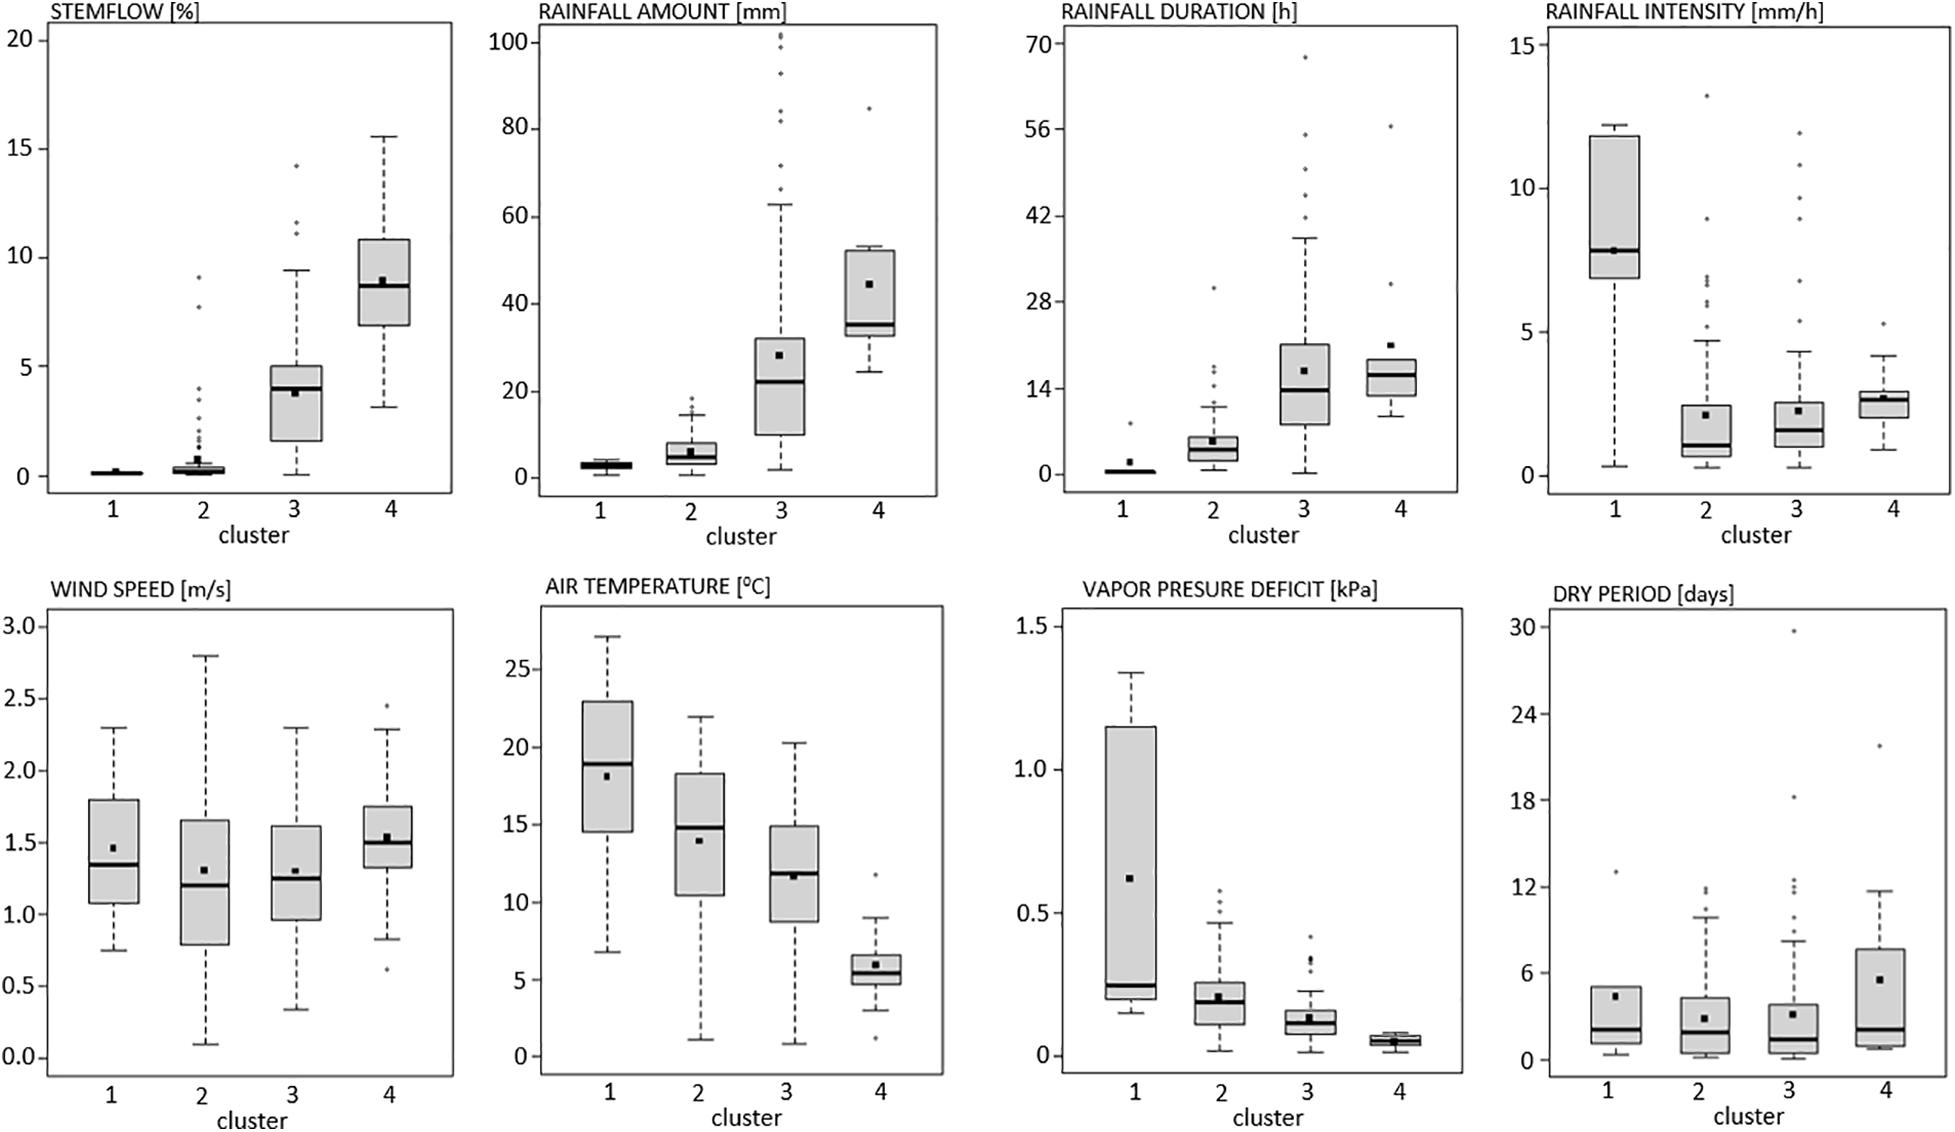
Figure 5. Comparison of rain event characteristics for the events grouped in each cluster.
For the events, merged in cluster 2, the grouped figures indicated slow increase of stemflow, which was independent to the increase of the rainfall totals in the open (Figure 4). Cluster 2 merges 61 events with a median value of stemflow equal to 0.18% of rainfall (Figure 5). The majority of the events (40 events) were observed during the leafed phenoseason. Analysis of the grouped figures shows that stemflow responded to the increase in rainfall amount. However, the line representing the stemflow volume increases slower and independently of the rainfall volume line (Figure 4). Rainfall events, grouped in cluster 2, were also quite small as the rainfall amount per event was on average 6.1 mm and did not exceed 18.5 mm (Figure 5). The rainfall event duration was on average 5.3 h, resulting in a fairly average rainfall event intensity of 2.12 mm/h, similar to the average intensities of the rainfall events grouped in clusters 3 and 4 (Figure 5). However, events with observed minimum and maximum values of rainfall intensity were assigned to cluster 2. Air temperature during the selected events was quite high, i.e., 13.9°C on average, while the average value of vapor pressure deficit of the events accounted for 0.2 kPa. The length of the dry period between the events ranged from 4.9 h to more than 11 days.
Moderate increase of stemflow amount was observed during the events grouped in cluster 3. This cluster was also the largest, combining 81 events with stemflow proportion averaging 3.8% of rainfall per event. The development of the stemflow followed in most cases the development of rainfall during the event (Figure 4). The amount of stemflow reaching the ground was significantly smaller than the amount of rainfall in the open, however, the increase in its amount with the development of the event followed the shape of the curve, formed by the increase in the rainfall amount. Characteristics of the rainfall events, assigned to cluster 3, show larger rainfall amounts and longer duration of the events comparing to the events grouped in clusters 1 and 2 (Figure 5). The average amount of rainfall was 28.1 mm and the average duration of the rainfall events was 16.6 h. This results in similar rainfall intensities as those for the events grouped in cluster 2 (Figure 5). Air temperature during the events was slightly lower, ranging from 0.8 to 20.3°C, while vapor pressure deficit values ranged from 0.01 to 0.42 kPa. Half of the events (40 events) were observed during the leafed period, while the rest of the events associate with the transitional or the leafless period.
Events with the strongest response of stemflow to the amount of rainfall in the open were assigned to cluster 4. 9 events grouped in cluster 4 were characterized with a stemflow proportion between 3.1 and 15.6% of rainfall per event, on average 9.0% of rainfall (Figure 5). They were mainly detected in the leafless period, only one event was observed in the leafed and one in the leafing period. All of the events delivered a substantial amount of rainfall (on average 44.5 mm per event), which resulted in a high proportion of stemflow and its strong response to the increase of rainfall amount during the progress of the event (Figure 4). The line of the magnified stemflow volume (multiplied by 10 for a clearer comparison) actually exceeded the volume of the plotted rainfall line in some cases. In addition to the large rainfall amounts, these events were also among the longest, averaging 20.8 h, but still quite intense (on average 2.7 mm/h; Figure 5). According to the corresponding phenoseasons and the time of the year in which the events occurred, the average air temperature during the events was the lowest, between 1 and 9°C and on average 5.9°C, with the exception of one event observed during the leafed period (11.8°C). The average vapor pressure deficit was the lowest among the four clusters, on average equal to 0.05 kPa. For the events in cluster 4 the longest dry periods were observed prior to the events, lasting more than 5 days on average.
Discussion
For monitoring of stemflow and data analysis only one birch tree was selected. Although the considerable intra-specific variations in stemflow are expected and the data of the presented analysis cannot be generalized to the other tree species, the main contribution of this research is in the data set itself and in the analysis that is enabled by such a dataset. The collection of a long term data with a short-time step is very time consuming, requires long-term presence of qualified staff and financial resources to maintain the equipment as well as ensuring the presence of the researchers, maintaining the plot and equipment, regularly collecting and analyzing the data. Therefore, the data sets covering several years and providing measurements in real time during the events are scarce. However, such data are needed to enable understanding of the influence of changing meteorological conditions during seasons on stemflow and its temporal development. Therefore, such a data set is crucial for supporting the implementation of new methods of analysis and understanding the development of stemflow.
Stemflow Characteristics
On average per event stemflow by birch tree accounted for 3.0% of rainfall in the open. Significant difference (p < 0.001) in stemflow values was observed between the leafed and the leafless period, as the difference in average stemflow per the period was equal to 2.6%. The average amount of stemflow is similar to the values observed for other deciduous tree species considered as having a smooth bark surface and growing in urban areas. Livesley et al. (2014) reported an average stemflow of 1.7% for Eucaliptus saligna tree in Melbourne, Australia, Xiao and McPherson (2011) observed 2.1% of stemflow under Citrus limon and 4.1% of stemflow under Liquidambar styraciflua tree in Oakland, California, and Guevara-Escobar et al. (2007) reported 2.2% of stemflow under Ficus benjamina tree in Queretaro city, Mexico.
Additionally, differences in the stemflow values for the deciduous trees among the leafed and leafless period were observed also in other studies. The difference reported for the two phenoseasons was similar to 1.7% detected in a deciduous forest plot in Eastern Pyrenees Mountains in Spain (Mużyło et al., 2012) and in a deciduous north-faced forest in Slovenia (Šraj et al., 2008). Furthermore, 1.6 % difference was observed for beech and 2.0% for oak tree, located in a mixed oak-beech stand in Belgium (André et al., 2008), 1.2% was monitored in a dry tropical forest in Northeast Brazil (Brasil et al., 2020) and a 3.1% difference was measured for a single beech tree in Belgium (Staelens et al., 2008). In all of the mentioned studies larger stemflow values were observed during the leafless period. In general, some differences in rainfall partitioning by deciduous trees are expected between the phenoseasons due to the substantial changes of the canopy characteristics (Zabret, 2013). During the leafless period the absence of leaves and consequently the bare branches regulate the retention and the redistribution of the rainfall water differently than during the fully leafed canopy, influencing also the paths of flow of the intercepted rainfall. In the leafed period significant amount of water is retained on the leaves and when the surface water droplet retention is fulfilled, rainfall start to drip to the ground as throughfall instead of running down the branches and stem as stemflow. Namely, due to the leaves hydrophobicity and the angle, raindrops stored on the leaves are mainly directed to the ground as dripping (Holder and Gibbes, 2016). However, during the leafless period rainfall is intercepted only by branches. When the bark storage capacity of the branches is reached, water starts to gather on the surface of the branches. Some drops fall toward the ground, however, the substantial amount is also following the flow path created by the branches toward the stem and the ground as stemflow (Sadeghi et al., 2020).
The analysis of stemflow amount and its development under birch tree indicated, that there were 0.8 mm of rainfall needed to initiate stemflow, while continuous flow was observed during the events with more than 8 mm of rainfall. The value needed to initiate the stemflow is similar to 0.6 mm, observed in a deciduous forest in Slovenia (Šraj et al., 2008) and to 1 mm reported for a single Eucalyptus saligna tree in Melbourne, Australia (Livesley et al., 2014). All of the mentioned tree species have smooth bark and all of the locations are categorized by “Cfb” climate according to the Köppen climate classification. Therefore, this simple comparison indicates that for the trees with similar bark characteristics and in similar climate zones stemflow initiate in a comparable manner. However, further information on other tree characteristics such as orientation of the branches or canopy size may offer an additional explanation, but such data are seldom available in the published research (Levia and Herwitz, 2005).
On the other hand, the comparison of values needed for continuous observation of stemflow show different responses of the compared trees. In the case of E. saligna tree only 2 mm was needed (Livesley et al., 2014), whereas for the birch tree, 8 mm of rainfall was required to initiate continuous stemflow. Furthermore, a value of 5 mm was reported to initiate continuous stemflow in case of Fagus gradifolia tree, growing in a forest located in Maryland, United States (Siegert and Levia, 2014), 8.5 mm was needed in case of tanoaks in Caspar Creek watershed in California (Reid and Lewis, 2009), and Su et al. (2016) reported values between 6.9 mm and 14.8 mm for trees in a subtropical forest of Daba Mountains in Central China. All of the mentioned tree species have smooth bark surface, however, the locations of these study plots belong to various climates. This comparison indicates that the rainfall amount and the tree characteristics (i.e., bark structure, surface and absorptiveness, canopy coverage) are not the most influencing parameters, regulating the stemflow. According to the presented values of the studies from all over the world, also the micro-climatic conditions may substantially influence the occurrence and the development of stemflow (Inkiläinen et al., 2013; van Stan et al., 2016).
The Development of Stemflow
According to the collected data we have produced graphs representing the rainfall and stemflow development during the rainfall event. The hierarchical clustering of the figures resulted in four groups, describing different levels of stemflow response. We were not able to find any similar study with such a short time data step for larger number of events. However, a few studies were identified, providing sufficient data for comparison of stemflow response per a single event to the one observed in our analysis (Figure 4).
Iida et al. (2017) analyzed the intra-storm scale rainfall interception dynamics, using hourly data. The analysis was performed for one selected event, which delivered 30.1 mm of rainfall during more than 2 days. A graph of stemflow and rainfall development for the considered event would be assigned to cluster 3 of the presented analysis. The characteristics of the considered event also correspond to the values, significant for the events grouped in cluster 3 (Figure 5). Additionally, Levia et al. (2010) performed 5-min time step measurements of stemflow production for different tree species with various characteristics. In the analysis, the synchronicity between the timing of rainfall and stemflow yield was also presented. The data collected during an ∼8-h long event, delivering 7.6 mm of rainfall, show a slight response of the stemflow volume to the rainfall volume increase. According to the response of stemflow, this event would be assigned to cluster 2, corresponding also to its meteorological characteristics (Figure 5).
The results, presented by Levia et al. (2010) and Iida et al. (2017) correspond well to the observations of the stemflow response, presented in this study (Figures 4, 5). The measurements, performed by Iida et al. (2017) focused on coniferous Japanese cedar tree, located in Tsukuba, Japan, which is classified as “Cfa” according to the Köppen Climate Classification. Levia et al. (2010) presented results for deciduous F. grandifolia tree, located in Maryland, United States, also characterized by “Cfa” climate subtype. Thus, the climate characteristics of both mentioned locations are similar to the one at the observed study plot in Ljubljana (“Cfb” by Köppen Climate Classification). Additionally, F. grandifolia is quite similar tree species to observed birch tree, as both are deciduous trees with smoother bark surface. However, the observed F. grandifolia tree had much larger diameter at breast height (74.9 cm) than our birch tree (18.3 cm). In addition, Japanese cedar tree is coniferous tree species with bark that peels off in long strips. Therefore, the comparison of the results suggests, that under similar climate the development of stemflow with the rainfall event progress is independent to the tree species. However, comparison with multiple measurements for a larger number of tree species is necessary to verify this observation.
The Influence of Meteorological Variables
For the considered rainfall events, the general characteristics of the influential variables per cluster were analyzed to characterize how the meteorological conditions during the event regulate the development of stemflow. The range of the values per individual cluster indicate the dependence on the rainfall amount, duration and intensity, the phenoseason in which the event was observed, as well as the average air temperature and vapor pressure deficit during the event. However, no characteristic values per cluster were observed for the average wind speed and its direction during the event (Figure 5).
The studies, focused on the variables, influencing the stemflow amount, usually reported the total rainfall amount per event as the most influencing variable (Xiao et al., 2000; Staelens et al., 2008; Germer et al., 2010; Siegert and Levia, 2014; van Stan et al., 2014; Su et al., 2016; Zabret et al., 2018; Zhang et al., 2020). This is expected, as the tree canopy and the bark storage capacity are becoming saturated during the initial phase of the event. When the rainfall amount reaches the threshold, saturating the canopy and the bark, stemflow can fully initiate. This process was confirmed by Xiao et al. (2000) during the high frequency measurements of rainfall, throughfall and stemflow. They demonstrated that in the case of the small rainfall events stemflow was controlled by the antecedent moisture of the tree surface, while for saturated tree conditions the magnitude of stemflow was dependent on the amount of rainfall. Also, Germer et al. (2010) reported that the time between the maximum rainfall intensity and the maximum stemflow depends on the rainfall amount saturating canopy storage capacity. Additionally, higher storage capacity of the trunk and branches of the oak in comparison to the beech tree species was recognized as a crucial variable influencing rainfall thresholds for stemflow occurrence (André et al., 2008). Considerable influence of rainfall amount on the stemflow development and its total value was also observed in this study. Values of total rainfall amount per event, grouped in individual cluster, were significantly different (p < 0.05). Additionally, significant difference was observed also between the stemflow values per cluster (p < 0.001), except between clusters 1 and 2 (p = 0.21). Also the correlation coefficient of 0.992 between the median values of stemflow and rainfall amount per cluster indicate significant interdependence between the rainfall and stemflow amount, as well as the response of stemflow.
Rainfall amount per events, grouped in clusters 1 and 2, were quite similar as the median value for cluster 1 was equal to 3.0 mm and for cluster 2 was 5.0 mm. Additionally, all rainfall events delivering less than 5 mm of rainfall were assigned either to cluster 1 or cluster 2. Further comparison of rainfall characteristics for only these small rainfall events (<5 mm) showed, that events assigned to cluster 1 were significantly shorter (p < 0.05) and their rainfall intensity was significantly higher (p < 0.001) in comparison to the events in cluster 2. Air temperature and vapor pressure deficit during the small rainfall events, grouped in cluster 1, were also significantly higher. As all of these events were observed in the leafed period, these differences are not related to the season. Although stemflow values for the events, grouped in clusters 1 and 2 were not that different, the stemflow response was (Figure 4). Therefore, it seems that the stemflow response during the rainfall events delivering less than 5 mm is related to the intensity and duration of the rainfall, as well as to the meteorological conditions during the event. For similar amounts of rainfall, stemflow will increase during the events with longer and less intense precipitation, while short and intense events will not produce any noticeable flow down the stem. This observation corresponds to the finding of Xiao et al. (2000), who reported that for the rainfall intensity greater than 1.5 mm/h stemflow for oak and pear trees was decreasing. Similarly, in a laboratory experiment Keim et al. (2006) showed that branches generally retain more water at a high rainfall intensity until some incremental storage is reached.
Although rainfall intensity was recognized as a variable, regulating stemflow response for the small rainfall events, its values were not significantly different among clusters. Furthermore, the average values of the rainfall intensity per clusters 2, 3, and 4 were equal to 2.4, 2.3 and 2.7 mm/h, respectively, while the median values show a slight deviations of values for cluster 4, as median rainfall intensity values were equal to 1.2, 1.6, and 2.6 mm/h, respectively. As the mean and median values of rainfall intensity for clusters 2 and 3 were similar, the distinct response of stemflow may be assigned to statistically significantly different (p < 0.0001) rainfall amounts and duration of the events, assigned to clusters 2 and 3. This might be connected to the observations by Mużyło et al. (2012), who pointed out the influence of rainfall duration on stemflow in the leafless period and the influence of rainfall intensity in the leafed period. Namely, the notable influence of rainfall intensity was detected for the events, assigned to cluster 1, which were observed mainly in the leafed period. Regardless of the complex interaction between the variables, the results might also be different taking into account the inter-event rainfall intensity values of shorter time steps. For example, Staelens et al. (2008) observed that the maximum hourly and 10-min rainfall intensity had a higher correlation with the stemflow values than the average rainfall intensity, while Cayuela et al. (2018) showed a significant response of stemflow to 5-min rainfall intensity.
The difference in the stemflow development during the events, grouped in clusters 2, 3, and 4 is not correlated to the intensity of the rainfall during the event. However, in addition to an increase in the rainfall amount and duration, a significant decrease of average air temperature and vapor pressure deficit (VPD) among the events in a single cluster were observed (p < 0.005). The average air temperature and VPD during the events correspond to the season/phenoseason in which the event was observed. In addition, rainfall characteristics are dependent on the season to some extent (Mużyło et al., 2012; Levia and Germer, 2015; Brasil et al., 2020). However, the size of clusters 2 and 3 is quite large (corresponding to 61 and 81 events, respectively) and the events are not characterized only by one prevailing phenoseason. The majority of the rainfall events, grouped in cluster 2, were observed between April and October (leafed period), while 13 out of 61 events occurred from November to March (leafless period). This is also reflected in the on average high air temperatures and VPD (Figure 5). Events, which delivered the most rainfall and lasted for the longest time, were grouped in clusters 3 and 4. Although no phenoseason prevailed among the events grouped in cluster 3 (40 events were observed in leafed, 29 in leafless and 12 in transitional period), the air temperature and VPD were significantly lower than during the events assigned to clusters 1 or 2.
The comparison of the rainfall event characteristics with the corresponding phenoseason show, that the differences in rainfall amount, duration, air temperature and VPD during the event among clusters are not associated only to the phenoseason. The complex interaction between phenoseasons and meteorological characteristics was already recognized as very complex (André et al., 2008; Mużyło et al., 2012; Iida et al., 2017). For example, Klamareus-Iwan and Witek (2018) observed that leaf wettability and water storage capacity are varying with seasons. However, to eliminate the influence of the phenoseason, we have compared the characteristics of the events observed only in the leafed period, which were grouped in clusters 2 and 3. The average air temperature for the events assigned to cluster 2 was higher (16.2°C) than for the events assigned to cluster 3 (14.4°C). In addition, the VPD was significantly higher (p < 0.005) for the events, assigned to cluster 2. Therefore, the difference in meteorological characteristics of the events was not related only to the season. Also the different response of stemflow, observed for clusters 2 and 3 was not the consequence of different canopy characteristics according to the phenoseasons. The results of hierarchical clustering (Figure 4) and analysis of the characteristics of the events per cluster (Figure 5) indicate that stemflow is more responsive to the rainfall input during colder events with the lower VPD conditions. Both, lower air temperature and lower VPD values indirectly decrease the evaporation, which may lead to more intense stemflow response.
The comparison of the meteorological conditions during the events, grouped in clusters, show no influence of wind characteristics (Figure 5). However, the influence of wind speed and direction on stemflow was already reported in numerous studies (Xiao et al., 2000; André et al., 2008; Staelens et al., 2008; Šraj et al., 2008; van Stan et al., 2014; Iida et al., 2017; Zabret et al., 2018; Zabret and Šraj, 2019). Additionally, the development of stemflow during the rainfall event was in detail analyzed by van Stan et al. (2011). The study showed the significant influence of wind-driven rainfall on stemflow development, taking into account 5-min time step data on wind direction during the event. Therefore, the observed influence of wind characteristics seems to be dependent on the method used for the analysis and the time step of the data taken into account (inter-event development of rainfall conditions). Thus, it appears that taking into account the average data on wind conditions during the event may lead to different results regarding the influence of wind conditions on stemflow response, as identified by clusters (Figure 4). Accordingly, we believe that the analysis of wind influence should be improved, taking into account shorter time step data, allowing to represent the changes in wind speed and direction during the event.
The Influence of the Stemflow Response on the Stemflow Volume
Values of the total stemflow and rainfall amount per event (Figure 5) show strong relationship with the observed response of the stemflow development during the event (Figure 4). This leads to a conclusion that stemflow response, defined through the process of hierarchical clustering, is significantly dependent on the total stemflow and rainfall amount per event. However, additional comparison of the results shows also a different interdependence. Events, delivering a similar amount of rainfall, as well as events with a similar proportion of stemflow according to the amount of rainfall in the open were assigned to different clusters (Figure 6). For example, events observed on 26 June 2016 and 3 October 2016 both delivered similar amounts of rainfall (15.2 mm and 15.6 mm, respectively), both occurred in the leafed phenoseason and after a similarly long dry period (10.4 and 9.8 h, respectively). However, the rainfall intensity and duration of both events were significantly different. The June event lasted for 1.1 h and had an average rainfall intensity of 13.2 mm/h, while the event in October lasted for 4.5 h, resulting in an average rainfall intensity of 3.5 mm/h. Additionally, air temperature and VPD were higher during the event in June (19.9°C and 0.31 kPa) than during the event in October (11.9°C and 0.13 kPa). According to different rainfall event characteristics and meteorological conditions, both events were grouped into different clusters, namely the June event in cluster 2 and the October event in cluster 3, indicating a different response of stemflow, and also resulting in a different proportion of the stemflow reaching the ground, i.e., 1.3% in June and 4.9% in October.
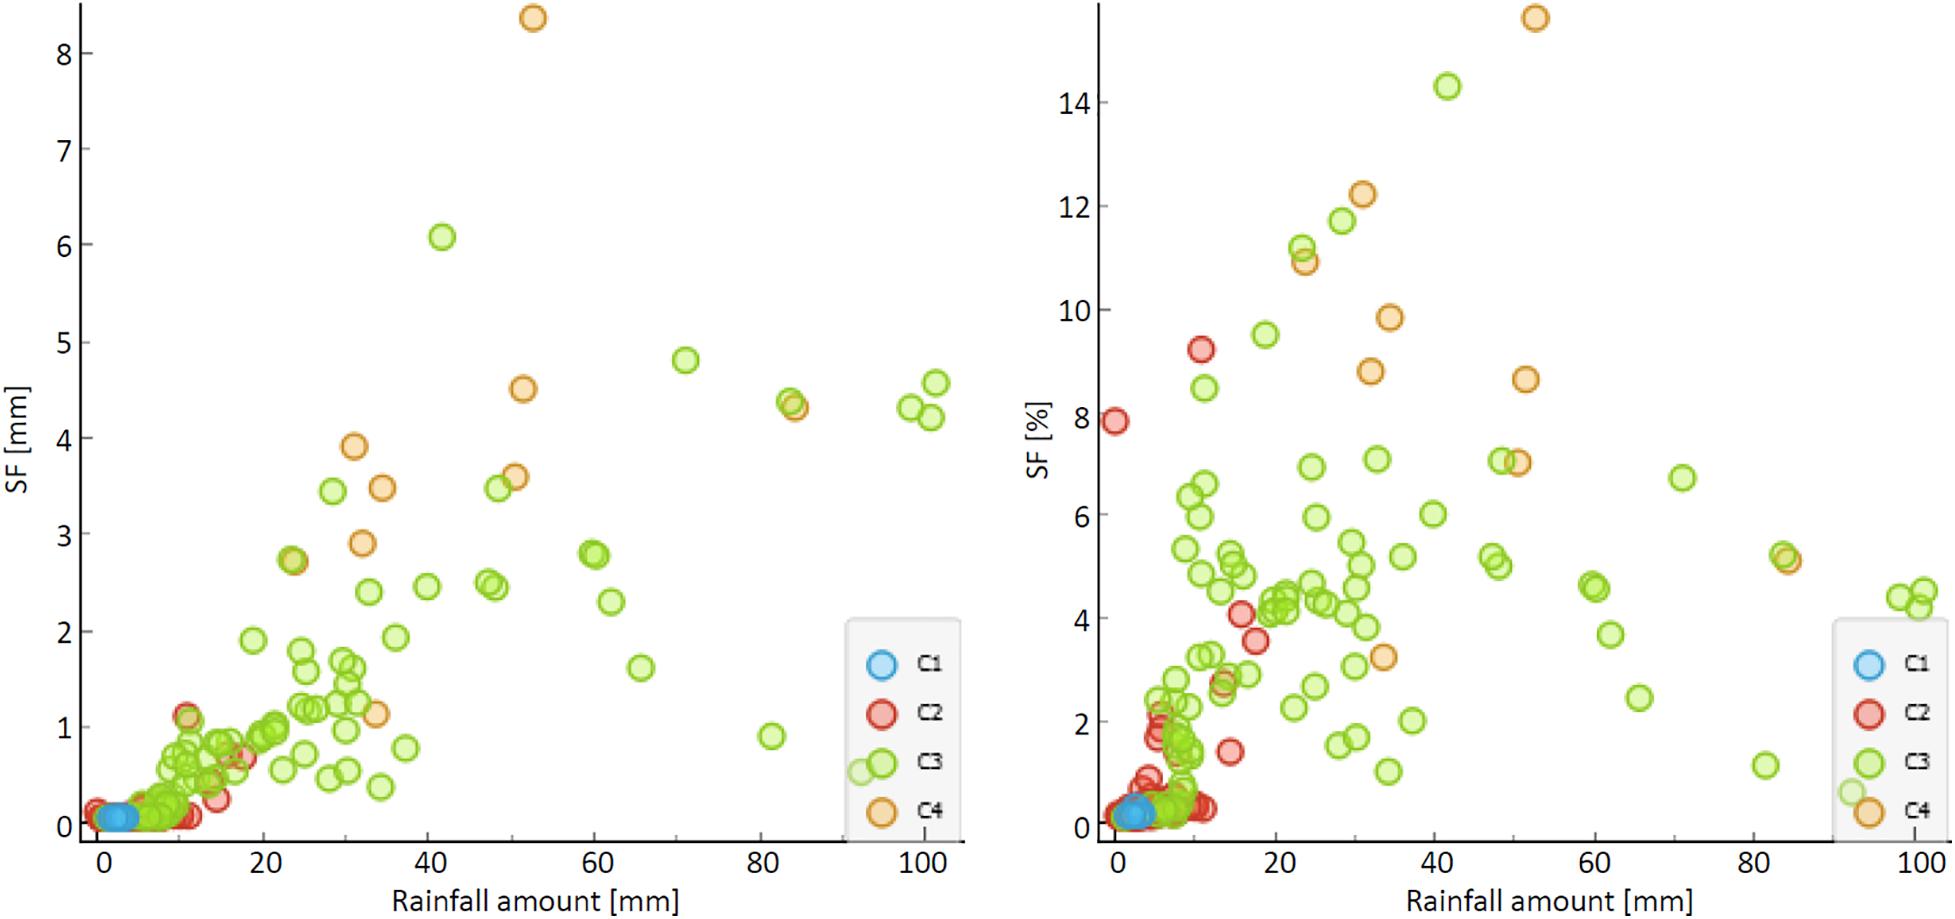
Figure 6. Relationship between the rainfall amount and the corresponding stemflow according to clusters of stemflow response.
Such comparison of data confirms a large variability of stemflow among rainfall events, which was reported also by Cayuela et al. (2018). In the scope of the presented research, this variability/relationship seems to be also depended on the type of the stemflow response (Figure 4). Therefore, inter-event meteorological characteristics, in comparison to the phenophase, seem to dictate the stemflow response to rainfall occurrence and after all also the total amount of the stemflow reaching the ground. Somehow, this was suggested also by Swaffer et al. (2014), who compared the stemflow amount for two morphologically distinct tree species and observed a larger influence of inter-event variability than plot location or tree species characteristics. Similarly, the influence of meteorological variables in comparison to the canopy characteristics or plot location for stemflow occurrence was detected by Toba and Ohta (2005).
Conclusion
In this study a detailed analysis of the development of stemflow during 156 rainfall events for a single birch tree (Betula pendula Roth.) at the study plot in the city of Ljubljana, Slovenia, was conducted. For this purpose, a new approach was applied, namely the hierarchical clustering based on the graphical presentation of the rainfall and stemflow development during the event. In the next step, significant meteorological characteristics were determined for each cluster of events in order to connect the stemflow development to the corresponding rainfall event characteristics and meteorological conditions during the event.
Four characteristic types of stemflow response were identified and connected to the corresponding event characteristics. In general, the results of the study demonstrate the response of stemflow is dependent to the rainfall amount per event, as larger events generate more responsive stemflow. However, if the rainfall events deliver less than 5 mm of rainfall, stemflow will show at least some response during longer and less intense events, while its response is expected to be negligible for shorter and intensive events. For the larger rainfall events in addition to rainfall amount also the rainfall duration has a significant influence on the stemflow response. However, more intense response is expected for the events occurring during lower air temperature and vapor pressure deficit. The fact that the response of stemflow during the events with similar rainfall amount can be substantially different due to the meteorological characteristics and other characteristics of the event, indicates that the type of the stemflow response influence also the total amount of stemflow reaching the ground.
By identifying the four groups of typical stemflow response to rainfall, we captured the complex relationships among the influencing factors, i.e., stemflow proportion and rainfall event characteristics (the amount, duration, and intensity of rainfall), as well as meteorological (air temperature, vapor pressure deficit, wind speed and wind direction), and vegetation (phenophases) conditions during the events. Furthermore, the identified types of typical stemflow response to rainfall correspond well to the examples from other locations and for other tree species that we were able to obtain from some other studies. However, further investigation is needed in terms of, e.g., a shorter time step of rainfall intensity and wind characteristics, additional variables (e.g., drop size distribution), new examples from different climates as well as for additional tree species in order to upgrade the proposed model of grouping.
Data Availability Statement
The raw data supporting the conclusions of this article will be made available by the authors, without undue reservation.
Author Contributions
KZ analyzed the data and drafted the manuscript. KZ and MŠ wrote the manuscript and revised it. Both authors contributed to the article and approved the submitted version.
Conflict of Interest
The authors declare that the research was conducted in the absence of any commercial or financial relationships that could be construed as a potential conflict of interest.
References
André, F., Jonard, M., and Ponette, Q. (2008). Influence of species and rain event characteristics on stemflow volume in a temperate mixed oak–beech stand. Hydrol. Process. 22, 4455–4466. doi: 10.1002/hyp.7048
ARSO (2020). Meteorological Archive. Available online at: http://www.meteo.si/met/sl/archive/ (accessed December 15, 2020).
Asadian, Y., and Weiler, M. (2009). A new approach in measuring rainfall interception by urban trees in coastal British Columbia. Water Qual. Res. J. Can. 44, 16–25.
Brasil, J. B., de Andrade, E. M., de Queiroz Palácio, H. A., dos Santos, J. C. N., and Medeiros, P. H. A. (2020). Temporal variability of throughfall as a function of the canopy development stage: from seasonal to intra-event scale. Hydrolog. Sci. J. 65, 1640–1651. doi: 10.1080/02626667.2020.1769105
Carlyle-Moses, D. E., Flores Laureano, J. S., and Price, A. G. (2004). Throughfall and throughfall spatial variability in Madrean oak forest communities of northeastern Mexico. J. Hydrol. 297, 124–135. doi: 10.1016/j.jhydrol.2004.04.007
Cayuela, C., Llorens, P., Sánchez-Costa, E., Levia, D. F., and Latron, J. (2018). Effect of biotic and abiotic factors on inter- and intra-event variability in stemflow rates in oak and pine stands in a Mediterranean mountain area. J. Hydrol. 560, 396–406. doi: 10.1016/j.jhydrol.2018.03.050
Crockford, R. H., and Richardson, D. P. (2000). Partitioning of rainfall into throughfall, stemflow and interception: effect of forest type, ground cover and climate. Hydrol. Process. 14, 2903–2920.
Demšar, J., Curk, T., Erjavec, A., Gorup, Č, Hočevar, T., Milutinovič, M., et al. (2013). Orange: data mining toolbox in Python. J. Mach. Learn. Res. 14, 2349–2353.
Germer, S., Werther, L., and Elsenbeer, H. (2010). Have we underestimated stemflow? Lessons from an open tropical rainforest. J. Hydrol. 395, 169–179. doi: 10.1016/j.jhydrol.2010.10.022
Guevara-Escobar, A., Gonzalez-Sosa, E., Veliz-Chavez, C., Ventura-Ramos, E., and Ramos- Salinas, M. (2007). Rainfall interception and distribution patterns of gross precipitation around an isolated Ficus benjamina tree in an urban area. J. Hydrol. 333, 532–541. doi: 10.1016/j.jhydrol.2006.09.017
Holder, C. D., and Gibbes, C. (2016). Influence of leaf and canopy characteristics on rainfall interception and urban hydrology. Hydrolog. Sci. J. 62, 182–190. doi: 10.1080/02626667.2016.1217414
Iida, S., Levia, D. F., Shimizu, A., Shimizu, T., Tamai, K., Nobuhiro, T., et al. (2017). Intrastorm scale rainfall interception dynamics in a mature coniferous forest stand. J. Hydrol. 548, 770–783. doi: 10.1016/j.jhydrol.2017.03.009
Inkiläinen, N. M., McHale, M. R., Blank, G. B., James, A. L., and Nikinmaa, E. (2013). The role of the residential urban forest in regulating throughfall: a case study in Raleigh, North Carolina, USA. Landsc. Urban Plan. 119, 91–103. doi: 10.1016/j.landurbplan.2013.07.002
Keim, R. F., Skaugset, A. E., and Weiler, M. (2006). Storage of water on vegetation under simulated rainfall of varying intensity. Adv. Water Resour. 29, 974–986. doi: 10.1016/j.advwatres.2005.07.017
Kermavnar, J., and Vilhar, U. (2017). Canopy precipitation interception in urban forests in relation to stand structure. Urban Ecosyst. 20, 1373–1387. doi: 10.1007/s11252-017-0689-7
Klamareus-Iwan, A., and Witek, W. (2018). Variability in the wettability and water storage capacity of common oak leaves (Quercus robur L.). Water 10:695. doi: 10.3390/w10060695
Levia, D. F., and Germer, S. (2015). A review of stemflow generation dynamics and stemflow-environment interactions in forests and shrublands. Rev. Geophys. 53, 673–714. doi: 10.1002/2015RG000479
Levia, D. F., and Herwitz, S. R. (2005). Interspecific variation of bark water storage capacity of three deciduous tree species in relation to stemflow yield and solute flux to forest soils. Catena 64, 117–137. doi: 10.1016/j.catena.2005.08.001
Levia, D. F., van Stan, J. T., Mage, S. M., and Kelley-Hauske, P. W. (2010). Temporal variability of stemflow volume in a beech-yellow poplar forest in relation to tree species and size. J. Hydrol. 380, 112–120. doi: 10.1016/j.jhydrol.2009.10.028
Livesley, S. J., Baudinette, B., and Glover, D. (2014). Rainfall interception and stemflow by eucalypt street trees – the impacts of canopy density and bark type. Urban For. Urban Green. 13, 192–197. doi: 10.1016/j.ufug.2013.09.001
McPherson, G., Simpson, J. R., Peper, P. J., Maco, S. E., and Xiao, Q. (2005). Municipal forest benefits and costs in five US cities. J. For. 103, 411–416.
Mużyło, A., Llorens, P., and Domingo, F. (2012). Rainfall partitioning in a deciduous forest plot in leafed and leafless periods. Ecohydrology 5, 759–767. doi: 10.1002/eco.266
Park, A., and Cameron, J. L. (2008). The influence of canopy traits on throughfall and stemflow in five tropical trees growing in a Panamanian plantation. For. Ecol. Manag. 255, 1915–1925. doi: 10.1016/j.foreco.2007.12.025
Pérez-Harguindeguy, N., Diaz, S., Garnier, E., Lavorel, S., Poorter, H., Jaureguiberry, P., et al. (2013). New handbook for standardised measurement of plant functional traits worldwide. Aust. J. Bot. 61, 167–234. doi: 10.1071/BT12225
R Core Team (2020). R: A Language and Environment for Statistical Computing. Vienna: R Foundation for Statistical Computing.
Reid, L. M., and Lewis, J. (2009). Rates, timing, and mechanisms of rainfall interception loss in a coastal redwood forest. J. Hydrol. 375, 459–470. doi: 10.1016/j.jhydrol.2009.06.048
Sadeghi, S. M. M., Attarod, P., Van Stan, J. T., Pypker, T. G., and Dunkerley, D. (2015). Efficiency of the reformulated Gash’s interception model in semiarid afforestations. Agric. For. Meteorol. 201, 76–85. doi: 10.1016/j.agrformet.2014.10.006
Sadeghi, S. M. M., Gordon, A., and van Stan, J. T. (2020). “A global synthesis of throughfall and stemflow hydrometeorology,” in Precipitation Partitioning by Vegetation: A Global Synthesis, eds J. T. van Stan, E. Gutmann, and J. Friesen (Cham: Springer Nature), 49–70.
Schooling, J. T., and Carlyle-Moses, D. E. (2015). The influence of rainfall depth class and deciduous tree traits on stemflow production in an urban park. Urban Ecosyst. 18, 1261–1284. doi: 10.1007/s11252-015-0441-0
Siegert, C. M., and Levia, D. F. (2014). Seasonal and meteorological effects on differential stemflow funneling ratios for two deciduous tree species. J. Hydrol. 519, 446–454. doi: 10.1016/j.jhydrol.2014.07.038
Šraj, M., Brilly, M., and Mikoš, M. (2008). Rainfall interception by two deciduous Mediterranean forests of contrasting stature in Slovenia. Agric. For. Meteorol. 148, 121–134. doi: 10.1016/j.agrformet.2007.09.007
Staelens, J., de Schrijver, A., Verheyen, K., and Verhoest, N. E. C. (2008). Rainfall partitioning into throughfall, stemflow, and interception within a single beech (Fagus sylvatica L.) canopy: influence of foliation, rain event characteristics, and meteorology. Hydrol. Process. 22, 33–45. doi: 10.1002/hyp.6610
Su, L., Xu, W., Zhao, C., Xie, Z., and Ju, H. (2016). Inter- and intra-specific variation in stemflow for evergreen species and deciduous tree species in a subtropical forest. J. Hydrol. 537, 1–9. doi: 10.1016/j.jhydrol.2016.03.028
Swaffer, B. A., Holland, K. L., Doody, T. M., and Hutson, J. (2014). Rainfall partitioning, tree form and measurement scale: a comparison of two co-occurring, morphologically distinct tree species in a semi-arid environment. Ecohydrology 7, 1331–1344. doi: 10.1002/eco.1461
Toba, T., and Ohta, T. (2005). An observational study of the factors that influence interception loss in boreal and temperate forests. J. Hydrol. 313, 208–220. doi: 10.1016/j.jhydrol.2005.03.003
van Stan, J. T., Gay, T. E., and Lewis, E. S. (2016). Use of multiple correspondence analysis (MCA) to identify interactive meteorological conditions affecting relative throughfall. J. Hydrol. 533, 452–460. doi: 10.1016/j.jhydrol.2015.12.039
van Stan, J. T., and Gordon, D. A. (2018). Mini-Review: stemflow as a resource limitation to near-stem soils. Front. Plant Sci. 9:248. doi: 10.3389/fpls.2018.00248
van Stan, J. T., Siegert, C. M., Levia, D. F., and Scheick, C. E. (2011). Effects of wind-driven rainfall on interception and stemflow generation between two codominant tree species with differing crown characteristics. Agric. For. Meteorol. 151, 1277–1286. doi: 10.1016/j.agrformet.2011.05.008
van Stan, J. T., van Stan, J. H., and Levia, D. F. (2014). Meteorological influences on stemflow generation across diameter size classes of two morphologically distinct deciduous species. Int. J. Biometeorol. 58, 2059–2069. doi: 10.1007/s00484-014-0807-7
Wickham, H., Chang, W., Henry, L., Pedersen, T. L., Takahashi, K., Wilke, C., et al. (2020). Package “ggplot2”. Available online at: https://cran.r-project.org/web/packages/ggplot2/ggplot2.pdf (accessed February 25, 2021).
Xiao, Q., and McPherson, E. G. (2011). Rainfall interception of three trees in Oakland, California. Urban Ecosyst. 14, 755–769. doi: 10.1007/s11252-011-0192-5
Xiao, Q., McPherson, E. G., Ustin, S. L., Grismer, M. E., and Simpson, J. R. (2000). Winter rainfall interception by two mature open-grown trees in Davis, California. Hydrol. Process. 14, 763–784. doi: 10.1002/(SICI)1099-1085(200003)14:4<763::AID-HYP971<3.0.CO;2-7
Zabret, K. (2013). The influence of tree characteristics on rainfall interception. Acta Hydrotech. 26, 99–116. (In Slovenian)
Zabret, K., Rakovec, J., Mikoš, M., and Šraj, M. (2017). Influence of raindrop size distribution on throughfall dynamics under pine and birch trees at the rainfall event level. Atmosphere 8:240. doi: 10.3390/atmos8120240
Zabret, K., Rakovec, J., and Šraj, M. (2018). Influence of meteorological variables on rainfall partitioning for deciduous and coniferous tree species in urban area. J. Hydrol. 558, 29–41. doi: 10.1016/j.jhydrol.2018.01.025
Zabret, K., and Šraj, M. (2018). Spatial variability of throughfall under single birch and pine tree canopies. Acta Hydrotech. 31, 1–20.
Zabret, K., and Šraj, M. (2019). Rainfall interception by urban trees and their impact on potential surface runoff. Clean Soil Air Water 47:1800327. doi: 10.1002/clen.201800327
Keywords: stemflow, stemflow response, rainfall characteristics, phenophase, hierarchical clustering
Citation: Zabret K and Šraj M (2021) How Characteristics of a Rainfall Event and the Meteorological Conditions Determine the Development of Stemflow: A Case Study of a Birch Tree. Front. For. Glob. Change 4:663100. doi: 10.3389/ffgc.2021.663100
Received: 02 February 2021; Accepted: 19 April 2021;
Published: 11 May 2021.
Edited by:
John T. Van Stan, Georgia Southern University, United StatesReviewed by:
Yafeng Zhang, Northwest Institute of Eco-Environment and Resources, Chinese Academy of Sciences (CAS), ChinaTom Grant Pypker, Thompson Rivers University, Canada
Copyright © 2021 Zabret and Šraj. This is an open-access article distributed under the terms of the Creative Commons Attribution License (CC BY). The use, distribution or reproduction in other forums is permitted, provided the original author(s) and the copyright owner(s) are credited and that the original publication in this journal is cited, in accordance with accepted academic practice. No use, distribution or reproduction is permitted which does not comply with these terms.
*Correspondence: Mojca Šraj, bW9qY2Euc3JhakBmZ2cudW5pLWxqLnNp