 Philipp Porada
 Paolo Giordani
- 1Ecological Modeling, Department of Biology, University of Hamburg, Hamburg, Germany
- 2DIFAR - Università di Genova, Genova, Italy
Epiphytic lichens are a characteristic feature of many forests around the world, where they often cover large areas on stems and branches. Recently, it has been found that lichens may contribute substantially to carbon and nutrient uptake in forests. Moreover, they have a large influence on interception of rainfall at the global scale, which leads to a shift of the water balance toward evaporation and a cooling of near-surface air temperature. It is thus crucial to understand which environmental factors are relevant for their growth and survival, and which potential risks may result from climate change. Water supply is a key factor which controls active time and, consequently, the carbon balance of the epiphytes. However, it is largely unclear, to what extent different modes of water uptake, which include bark water, may affect active time and growth under varying environmental conditions. Quantitative estimates on the relevance of bark water storage and its interspecific variation are, however, missing. Here, we apply the process-based, dynamic non-vascular vegetation model LiBry to assess the relevance of bark water for epiphytic lichens. LiBry not only accounts for the main physiological processes of mosses and lichens, it also represents explicitly the diversity of the organisms, by simulating a large number of possible physiological strategies. We run the model for a site in Sardinia, where epiphytic lichens are abundant. Moreover, the Mediterranean region is of interest due to likely substantial effects of global warming on local epiphytes. For current climatic conditions, the LiBry model predicts net primary production (NPP) of 32 g C m−2a−1 per stem area and biomass of 48 g C m−2 for the study region. In a second run, where uptake of bark water is switched off in the model, estimated NPP is reduced by 21%. Moreover, the simulated number of surviving strategies, representing physiological diversity, decreases by 23%. This is accompanied by changes in the simulated community composition, where strategies which have a more compact thallus increase their share on the total cover. Hence, our model simulation suggests a substantial role of bark water for growth and morphology of epiphytic lichens in Sardinia.
1. Introduction
Non-vascular (NV) epiphytes, such as lichens or mosses, are a characteristic feature of many tropical, temperate, and boreal forests around the world. Their epiphytic life style makes them largely dependent on water supply from the atmosphere, which is available in the canopy in form of throughfall, stemflow, dew, or fog, and which usually shows high temporal variability (Hargis et al., 2019). Moreover, NV epiphytes have no means of actively controlling water loss, in contrast to the stomata of vascular plants. The organisms are, however, adapted to these conditions through poikilohydry, the ability to deactivate their metabolism when they dry out, and reactivate when water becomes available again (e.g., Proctor et al., 2007; Kranner et al., 2008).
Due to the substantial amount of NV epiphytic biomass in many forests around the world (Van Stan and Pypker, 2015), their water storage may significantly affect interception of rainfall and increase evaporation at the global scale (Porada et al., 2018). Furthermore, due to this larger amount of water vapor transported from the land surface to the atmosphere, the heat flux due to convection of warm air is reduced, which may lead to cooling of the land surface (Davies-Barnard et al., 2014). Another impact of NV epiphytes on ecosystems is the alteration of throughfall and stemflow chemistry, resulting from biotic nitrogen fixation, capturing of nutrients from wet and dry deposition, or bioaccumulation of elements. Moreover, these properties make the organisms suitable bioindicators. The collected compounds may then be leached during rainfall events, depending on their chemical state and the capability of the NV epiphytes to retain them (Klos et al., 2005). Furthermore, the organisms recycle nutrients leached from vascular plant biomass or derived from decaying leaf litter (Van Stan and Pypker, 2015).
The various ecosystem functions carried out by NV epiphytes may be significantly affected by climate change. NV epiphytes adapted to warmer climatic conditions in temperate or boreal-montane climates may benefit from climatic change (Aptroot and van Herk, 2007). However, multiple studies expect negative impacts of climate change on NV epiphytes in the course of global warming in different regions of the world. Reductions in the distribution range of epiphytic lichens already occur in Southern Europe, for instance (Nascimbene et al., 2016). Furthermore, experiments suggest that tropical epiphytic bryophytes may suffer from prolonged drought periods (Metcalfe and Ahlstrand, 2019), same as cold-adapted epiphytic lichens in boreal regions (Smith et al., 2018). Also statistical modeling approaches, such as species distribution models, predict that NV epiphytes will be often negatively affected by climate change (Ellis et al., 2007; Rubio-Salcedo et al., 2017; Ellis and Eaton, 2021).
Impacts of changing climatic conditions will likely be modulated, and often amplified, by management practices, such as intensified forest management. The lack of old trees and increased dryness due to edge effects, for instance, may have additional negative effects on NV epiphytes (Johansson, 2008). In addition to general habitat loss, the disappearance of certain forest types and host tree species may have detrimental effects for NV epiphyte communities (Nascimbene and Marini, 2010; Wierzcholska et al., 2020). Thereby, loss of host trees may not only be caused by management, but also result from invasive species, such as the black locust (Nascimbene et al., 2020). Furthermore, also changes in atmospheric deposition of nutrients or pollutants may, in combination with host tree species, have stronger impacts on NV community composition than climate (Łubek et al., 2018).
Hence, both climatic and non-climatic factors, such as the substrate, will most probably play a crucial role in future abundance of NV epiphytes. Changes in these factors may not only affect amount and timing of water supply, but also lead to shifts in water source, which may affect community composition and abundance of NV epiphytes (Rodríguez-Quiel et al., 2019). Impacts on community composition may result from physiological adaptation of the organisms to the predominant mode of water supply, both at the inter-specific and also at the intra-specific level (Gauslaa, 2014).
For many NV epiphyte species, water flow along the bark, so-called stemflow, may represent a substantial contribution to their water supply. While stemflow is generally small compared to throughfall, in some forests it may account for up to a third of precipitation (Van Stan and Gordon, 2018). Since stemflow is a relatively fast process, NV epiphytes may require adaptations for an efficient uptake of water, such as rhizinomorphs, for instance (Valladares et al., 1998; Gauslaa, 2014; Merinero et al., 2014). Thereby, the utilization of stemflow by the organisms as a water source may be facilitated by temporary storage of water in the bark. The bark water reservoir usually has a size of a few millimeters of water or less, and it differs both within and between tree species (Klamerus-Iwan et al., 2020). It has been shown that bark properties, which also vary between tree species, may have a significant impact on the community composition of NV epiphytes (Kenkel and Bradfield, 1981; Bates, 1992). In particular, tree-specific bark water storage capacity may explain a part of the variation in NV epiphyte species richness between tree species (Jagodziński et al., 2018).
Although the potential importance of bark water storage for NV epiphytes has been recognized (e.g., Franks and Bergstrom, 2000), it is largely unclear how relevant the uptake of water from bark is for the water supply, and, consequently, the carbon balance of NV epiphytes in general. Furthermore, it is poorly known which factors control intra- and inter-specific variation of NV epiphytes regarding the ability to take up water from the bark reservoir. It is likely that physiological trade-offs exist between the capacity to utilize bark water and other properties associated with the water balance of the organisms, such as pore size distribution or specific thallus mass (Valladares et al., 1993; Porada et al., 2013).
The aim of this study is to assess the role of the bark water reservoir for the water balance and growth of NV epiphytes in a quantitative way. To this end, we formulate the following hypotheses:
1. The bark water reservoir represents a relevant source of water supply for NV epiphytes,
2. NV epiphytes are able to remain active for longer periods of time due to the bark water reservoir, and show thus a higher productivity,
3. The bark water reservoir affects the community composition of NV epiphytes.
We examine these hypotheses using the process-based non-vascular vegetation model LiBry (e.g., Porada et al., 2013, 2018). The LiBry model computes the main physiological functions of non-vascular vegetation which are connected to carbon, water and energy balances, based on climatic input data and other environmental conditions. Through variation of the bark water storage capacity in LiBry, we are able to quantify the relative importance of water uptake from bark compared to other sources, and the associated effects on productivity and growth. Furthermore, LiBry accounts explicitly for diversity of the organisms by simulating a large number of different physiological strategies. This makes the model ideal to study potential trade-offs connected to bark water uptake, and to elucidate the impacts of the mode of water supply on community composition of NV epiphytes.
We apply LiBry at the local scale for a field site in Sardinia. The site constitutes a good model for the study in question because it comprises a considerable set of Mediterranean ecosystems, both forest and open wooded areas. Despite the fact that the area is subject to strong water deficits for many months of the year, it hosts a remarkable diversity and morpho-functional variety of NV epiphytes (Giordani et al., 2019, see also Figure 1) adapted to the different available water sources. Finally, we discuss the implications of our findings for potential shifts in abundance and community composition of NV epiphytes under climate change, and for the feedback of the organisms on precipitation partitioning.
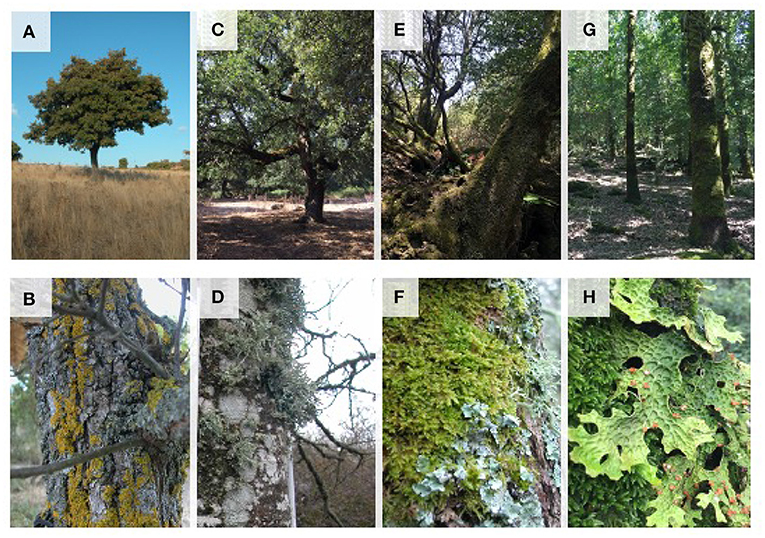
Figure 1. Epiphytic NV vegetation in different habitats of the study area: isolated trees in open grassland areas (A) mainly colonized by xerophilous species of narrow-lobed foliose and crustose lichens (B); agroforestry areas with thermophilous oak woodlands (C) with species-rich communities of foliose, crustose, and fruticose lichens (D); open holm-oak forests in mountainous areas (E) with epiphytic communities of bryophytes and hygrophilous foliose lichens (F); mature holm-oak and downy oak forests (G) colonized by extensive mossy mats and large foliose lichens of the genus Lobaria (H).
2. Methods
2.1. Model Description
The process-based Lichen and Bryophyte model (LiBry) which is applied in this study was developed to estimate carbon uptake by non-vascular vegetation at the global scale, based on climatic conditions, in order to quantify the contribution of the organisms to the global carbon balance, and, furthermore, to other global biogeochemical cycles (Porada et al., 2013, 2014, 2017). The model version used here builds on the latest developments, published in Porada et al. (2018), Porada et al. (2019), and Baldauf et al. (2020).
LiBry is a dynamic global vegetation model (DGVM), which focuses on non-vascular organisms, such as lichens and bryophytes, but also simulates terrestrial algae and cyanobacteria. Vascular vegetation, such as trees and grasses, is represented only in a simplified way, to provide boundary conditions for the non-vascular organisms, such as area for growth of epiphytes, for example. The main basic physiological functions, which lichens and bryophytes share with vascular plants, such as photosynthesis or respiration, and their climatic drivers, such as radiation, temperature, or precipitation, are simulated in LiBry similarly to other, vascular, DGVMs. The same is true for biophysical processes connected to the energy and water balance. Beyond these, however, LiBry includes various processes which are specific to non-vascular vegetation. In particular, the organisms' lack of active control over water loss is represented in the model (poikilohydry), which distinguishes them from the homoiohydric vascular plants that regulate their water loss via stomata. This is compensated, also in the model, by the ability of non-vascular organisms to deactivate their metabolism upon drying, which allows them to survive long periods without water supply (e.g., Proctor, 2000).
Moreover, the LiBry model explicitly takes into account physiological trade-offs with regard to the interactions of vegetation and environment. The concept of trade-offs is central to the functioning of modern DGVMs, and allows to connect the modeled carbon budget of plants to the adaptation to different climatic conditions. Vascular plants in DGVMs, for instance, may allocate assimilated carbon either to roots or to shoots, while ambient climate determines which allocation pattern is advantageous. The LiBry model considers multiple trade-offs which are key to the ecophysiology of non-vascular vegetation, such as the trade-off between metabolic activity and CO2-uptake from the atmosphere. The water, which the organisms accumulate in their bodies to be active and to assimilate carbon, partly leads to blocking of the diffusion pathways for CO2 from the atmosphere to the chloroplasts. Consequently, a species-specific optimum water saturation exists where metabolic activity is sufficient, but photosynthesis is not yet substantially limited by CO2 diffusion (Lange et al., 1999). The extent of the reduction in CO2-diffusivity with increasing water content depends largely on the pore size distribution of the non-vascular tissue (Valladares et al., 1993). Organisms which have a large fraction of small pores experience diffusion limitation more strongly than organisms which have, on average, larger pores. However, at low water content, small pores can be of advantage, since they retain water more efficiently due to capillary forces. Moreover, the low water potential inside the organism, resulting from small pore sizes, allows for uptake of water from unsaturated air. It has been shown that activation from air humidity alone may be relevant for the annual carbon gains of NV epiphytes (Jonsson Čabrajić et al., 2010). In a similar way, uptake of water from the bark water reservoir may be driven by a gradient in water potential between the unsaturated tissue of NV epiphytes and the saturated bark. The physiological trade-offs connected to the ability of bark water uptake may thus determine the ecological success of NV epiphytes growing on bark. In addition to trade-offs associated with water relations, LiBry takes into account the dependence of photosynthetic capacity on respiration costs, resulting from turnover of the Rubisco-Enzyme. This trade-off, which is illustrated through correlations between photosynthetic capacity, tissue nitrogen content, and specific respiration rate, has been studied in detail in vascular plants (Kattge et al., 2009). Also for non-vascular vegetation, it has been shown that photosynthetic capacity correlates with nitrogen content (Wang et al., 2017), and high nitrogen concentration is linked to high respiration rates (Palmqvist et al., 2002).
The main physiological trade-offs of non-vascular vegetation have a strong impact on the set of physiological strategies which are successful under certain given climatic conditions. In LiBry, success is defined through a positive carbon balance (gains minus losses) of non-vascular organisms in the long-term. A simulated physiological strategy gains carbon via photosynthesis, which is computed based on the established Farquhar-scheme (Farquhar and von Caemmerer, 1982). Carbon loss results from respiration and tissue turnover in the model, which both depend on photosynthetic capacity of the simulated organism, due to enzyme turnover. Furthermore, the temperature dependence of respiration is calculated via a Q10-relationship. Net Primary Production (NPP) is then computed as photosynthesis minus respiration, accumulated on a monthly basis. NPP is used in the model to increase the biomass of the simulated organisms, and to extend the surface fraction they cover. In case of NV epiphytes, this is the fraction of occupied total bark area. Biomass and cover are reduced through tissue turnover, and also disturbance, such as fire, which is represented in LiBry via fixed, ecosystem-specific intervals.
To represent physiological diversity of non-vascular organisms, the LiBry model simulates a large number, meaning several thousand, of different physiological strategies. A strategy is defined by a set of 11 physiological parameters in the model version used here, such as specific area, growth height, specific water storage capacity, optimum temperature, or photosynthetic capacity. The ranges of possible values for each parameter are determined from the literature (see Porada et al., 2013), and the strategies are created at the start of a model run by randomly sampling these literature-based ranges. Thereby, the physiological trade-offs which are relevant for non-vascular vegetation are taken into account. A high photosynthetic capacity, for instance, results in a high specific respiration rate. For any given location where the model is run under defined climatic conditions, usually only a fraction of the initial strategies are successful and show a positive carbon balance in the long-term. Through weighting of these strategies by their relative growth rate, average values of non-vascular vegetation properties can be estimated by the LiBry model, such as productivity or biomass at a given site.
2.2. New Processes and Parametrizations
For this study, we extended the representation of hydrological processes in the LiBry model with regard to the uptake of water from bark by NV epiphytes. Otherwise, the hydrological scheme used here corresponds largely to the model version published in Porada et al. (2018). In the model, water enters the canopy via rainfall, dew or snow. Depending on the leaf area index of the vascular vegetation, a certain fraction ΦR of the rainfall is intercepted by the canopy, while the remainder is directly routed to the ground as throughfall (see Figure 2). Thereby, the interception fraction is calculated as:
where LAI is the leaf area index of the location where the model is run, LAImax is the maximum LAI in a global data set (Porada et al., 2013) and pIcpt = 0.5 is a parameter, which changes the shape of the relation between the relative LAI value (LAI/LAImax) and the interception fraction ΦR. For pIcpt = 1.0, ΦR is assumed to increase linearly with increasing values of LAI, while for pIcpt <1.0, ΦR has a concave shape, which means that rainfall is intercepted faster than linearly with increasing LAI, and vice versa, for pIcpt >1.0, ΦR is convex, and high LAI values are required for efficient interception. Snowfall is assumed to directly add to throughfall. Depending on the surface type, a certain fraction ΦW of intercepted rainfall enters the interception reservoir (leaf or bark surface without NV epiphytes) or adds to the water content of the organisms, until their storage capacity is reached. The remainder of intercepted rainfall, 1 − ΦW, cannot be taken up quickly enough by the different surfaces in the canopy, and, together with surplus water from the reservoirs, is directed downwards. It either enters the bark reservoir, or adds to throughfall, depending on the fraction ΦB. Subsequently, surplus water from the bark reservoir is directed to the ground as stemflow. Dew is assumed to completely add to the interception reservoir or the NV epiphyte reservoir. Evaporation from the NV epiphytes' water reservoir is calculated based on a modified Penman-Monteith approach (Monteith, 1981), as a function of net radiation, relative humidity, and wind speed. Also the surface temperature of the organisms is calculated by this approach, as a result of the coupled energy and water balance. The canopy area which is available for growth of NV epiphytes is represented in the LiBry model by the sum of leaf area index (LAI) and stem area index (SAI), and the vertical distribution of this area is approximated by a single layer, which is located at medium height in the canopy. Consequently, the NV epiphytes receive an average intensity of radiation, which is less than the intensity at the top of the canopy, and also the intensity of rainfall is reduced, so that the product of canopy area and rainfall per area is equal to the total rainfall flux, and the mass balance for water is conserved. In LiBry, the forest type, defined by a biome classification, determines which parts of the canopy are suitable for the growth of NV epiphytes (Porada et al., 2013). In this study, we consider only NV epiphytes growing on stems (and, occasionally, branches) of trees at the study site, growth on leaves is not included, since it does not occur at the study site.
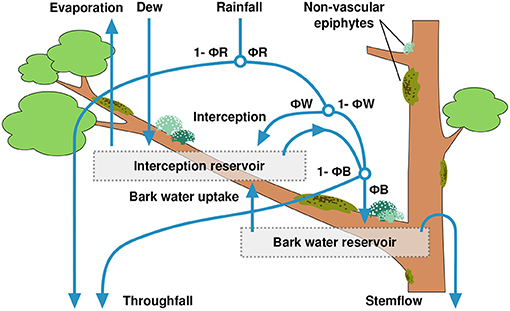
Figure 2. Scheme of precipitation partitioning in the LiBry model, including the newly introduced bark water reservoir. The model parameters ΦR, ΦW, and ΦB control the fractions of rainfall which are directed to throughfall, either directly or via drip from the canopy, into the interception reservoir, the bark water reservoir, or to stemflow.
To account for water supply from the bark, we extended the hydrological scheme of the LiBry model as follows: Below the NV epiphytes, an additional water reservoir is introduced, which has a storage capacity of 1.4 [mm] of water, based on measurements at the study site (see below). The water balance of the bark reservoir is calculated as follows:
where WNEW [mm] is the new water content of the bark reservoir computed at the current time step of the model, WOLD is the water content of the previous time step, QNV [mm s−1] is overflow of water from NV epiphytes growing on bark, QUP [mm s−1] is the flux of water from the bark to the NV epiphytes, and Δt [s] is the length of the time step of the model. Additionally, WNEW is limited to the storage capacity, and the resulting surplus water is assigned to throughfall. Uptake of water from bark is possible in the model, when the water potential inside the NV epiphytes is lower than the water potential in the bark. It is calculated based on the standard approach for a diffusive flux:
where XBARK [MPa] is the bark water potential, XNV [MPa] is the water potential inside the NV epiphytes, and XminNV = –50.0 [MPa] is the minimum water potential which the organisms are able to create. The latter is used to normalize the gradient in water potential between bark and NV epiphytes to a value of 1.0 in case the bark reservoir is saturated, and the NV epiphytes have reached their minimum potential due to desiccation at the same time. We furthermore assume that the diffusive flux of water from NV epiphytes back to the bark reservoir is negligible, and that the bark reservoir is mainly supplied by overflow from the NV epiphytes or other canopy surfaces (see Figure 2), which have a water potential of zero under this condition. The parameter pkB = 1.5E-3 [mm s−1] is an average hydraulic conductivity at the bark-epiphyte interface, which translates the gradient in water potential into a water flux. pkB was chosen to correspond roughly to the saturated hydraulic conductivity of loam (Carsel and Parrish, 1988), since appropriate values for bark could not be found in the literature. In the current version of the model (Baldauf et al., 2020), the water potential of non-vascular vegetation is computed by the following equation:
where pX1 = 15.0 [ ] is a parameter which determines the slope of the decrease in water potential with increasing desiccation, SNV [ ] is the water saturation of the organisms, and pSatX [ ] is a parameter which denotes the value of saturation, at which the water potential becomes negative. It should be mentioned that the LiBry model considers only water which is extractable under natural conditions for computing the saturation. Thus, a saturation of 0.0 does not mean that no water is left in the thallus. The value of pSatX may vary between different physiological strategies in the model. The potential of water stored in the bark is written as:
where XminB = –45.0 [MPa] is the minimum water potential in bark, pX2 = 5.0 [ ] is a slope parameter, and SBARK is the water saturation of the bark, in analogy to Equation (4). XminB and pX2 are chosen according to the assumption that NV epiphytes are able to take up water from the bark if both reservoirs have a similar water saturation.
In the LiBry version developed for this study, uptake from the bark is only possible when the simulated NV epiphytes create a sufficiently negative water potential upon drying. The value of the water potential of a physiological strategy simulated in LiBry at a given water saturation depends on its pore size distribution, which is not described directly in the model, but which is expressed through the parameter pSatX. The maximum value of pSatX = 1.0 means that the water potential of the simulated strategy becomes negative as soon as water is extracted from the tissue, due to evaporation. At a saturation of around 23%, the water potential reaches its prescribed minimum value of –50 MPa [see Baldauf et al. (2020) for details]. Thus, a value of SNV = 1.0 means that the strategy has a relatively dense tissue structure and a high ability to take up water from the bark reservoir. This is linked, however, to a relatively low diffusivity for CO2 under high water saturation, which reduces productivity. The minimum value of pSatX = 0.0 means that the water in the tissue of a physiological strategy is only weakly bound, and can be extracted almost completely without decreasing the water potential. In many moss species and also certain lichens, for instance, a substantial fraction of the water which can be stored on total is located externally on top of the thallus, where it can freely evaporate. Due to this open structure, however, these species usually show only a slight decrease in CO2-diffusivity and a high potential productivity under high water saturation (e.g., Wang and Bader, 2018).
2.3. Description of Study Site
The study area was selected in the western part of the island of Sardinia (Italy), located in the center of the Mediterranean Sea. The area stretches from the rocky coasts, to the coastal plains, up to the first mountain reliefs of Montiferru and the Marghine chain, which reach altitudes of about 1,000–1,200 m. The climate is typically Mediterranean, with dry and hot summers and relatively rainy and mild winters. In particular, due to the proximity of the sea and frequent humid atmospheric currents from the west, the area is included within the Mediterranean pluviseasonal oceanic macrobioclimate, ranging from the Upper Thermo- to the Lower Meso-Mediterranean thermotypic horizons, and from the Upper dry to the Lower humid ombrothermic horizons with Euoceanic characteristics (Canu et al., 2015).
Although the study area is considered to be in a semi-natural condition, it is subject to some sources of anthropogenic disturbance that nevertheless have low to moderate impacts on the region's ecosystems. Among these, the most relevant are grazing by sheep and goats, which, although not intensive, is widespread over large areas; forest management in wooded areas is rather limited and generally compatible with the maintenance of epiphytic communities. Fires of low intensity and extension are frequent, while major events may affect each area with an interval of several decades.
We selected 64 sites based on a stratified random sampling design (Figure 3). At each site, we installed a 20 x 20 m plot within which 1 to 6 trees were selected in proportion to the tree cover of the plot. The occurrence of NV epiphyte species was recorded in each 10x10 cm quadrat of a sampling grid, which consisted of a 10 x 50 cm ladder that was divided into five quadrats and systematically placed on the N, E, S, and W sides of each tree bole, with the top edge 1.5 m above ground level; More details are given in Giordani et al. (2014, 2019). Each sampling grid was photographed in order to derive the coverage value of each growth form at tree level (see below).
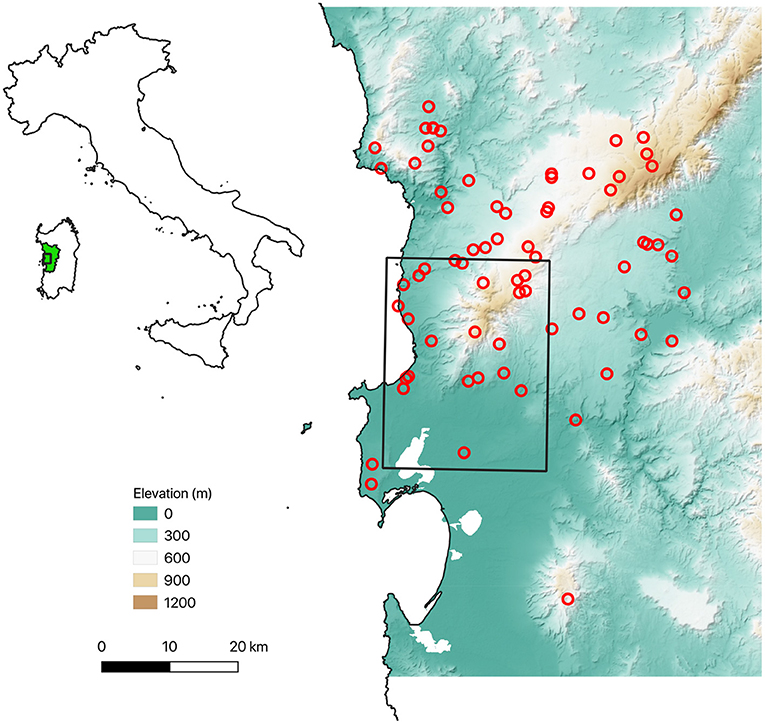
Figure 3. Overview of the sampling plots. The black rectangle marks the grid cell selected from the global ERA5 climate data set, which was used to run the LiBry model (see “Model setup” below).
2.3.1. Leaf and Stem Area Index, Bark Water Storage Capacity
In each plot, we measured the circumferences of all trees with a tape measure and the height of a representative sample of trees, obtained by triangulation with a hypsometer (Leica DISTO A5 Laser Distance Meter). These data were then used to calculate the Stem Area Index (SAI), as follows:
where t is the number of trees in a plot, cTRUNK is the circumference of a tree trunk, hTREE is the height of a tree, and APLOT is the area of a plot.
We calculated data of Leaf Area Index (LAI) for the study area, taking into account both the annual and the seasonal mean and variability derived from a set of satellite images. For broadleaf canopies, LAI is defined as the one-sided green leaf area per unit ground area. Data were retrieved from MODIS satellite images in the period 2002-2011. The MOD15A2H Version 6 Moderate Resolution Imaging Spectroradiometer (MODIS) LAI product is an 8-day composite dataset with 500 meters (m) pixel size. The algorithm chooses the “best” pixel available from all the acquisitions of the Terra sensor from within the 8-day period (Myneni et al., 2015).
The determination of the maximum bark water storage was carried out following Hauck et al. (2006). Three bark samples of 1 x 2 cm and 2 mm thickness were selected for each tree. The samples were previously cleaned with tweezers and a cutter to remove any lichen or bryophyte layer that might be present. The samples were then dried in an oven at 80° C for 24 h and weighed, obtaining the dry weights. They were then immersed in distilled water for 24 h and weighed after removing excess water by draining them, thus obtaining the weight at the state of maximum hydration. The Bark Water Storage WSCBARK was calculated according to the formula:
Where fw is the fresh weight of a sample and dw is its dry weight.
2.3.2. Morphological Properties
We sampled a total of 214 lichen species which, for the purposes of this work, were subsequently assigned to 8 groups identified on the basis of growth forms, following and partially modifying the scheme suggested by Nimis (2016): fruticose (Frut), foliose large (FolL), broad lobed foliose (FolB), narrow-lobed foliose (FolN), foliose gelatinose (FolG), squamulose (Squa), conspicuous crustose (CruCo), inconspicuous crustose (CruIn), and bryophytes (Bryo). Examples of each growth form are shown in Figure 1, and the relative cover fractions of the growth forms are shown in Figure 4.
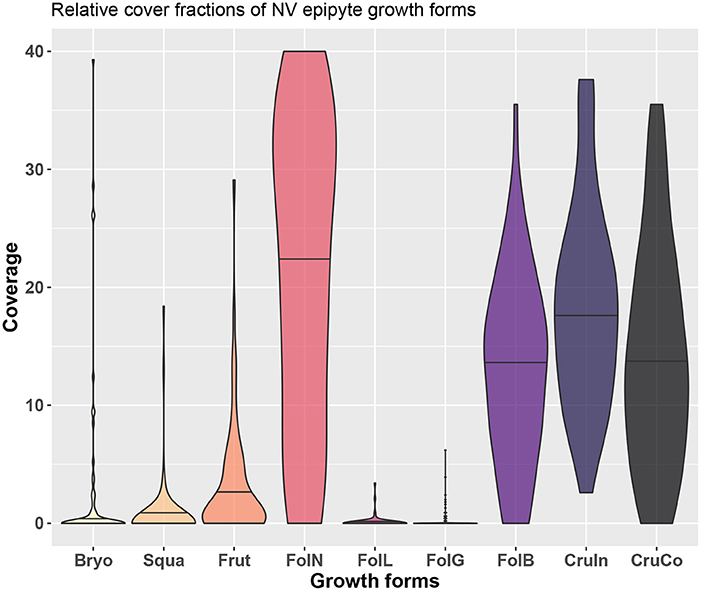
Figure 4. Overview of growth forms at the study site and the distribution of their relative cover across different trees.
While observational data on the relative abundances of NV epiphytes at the level of growth forms are available for the study site (Figure 4), data on their morphological properties had to be taken from literature (Gauslaa and Ustvedt, 2003; Hurtado et al., 2020a,b). We thus computed the median values of the literature-based morphological properties specific thallus mass (STM) and water storage capacity (WSC) for each growth form, and then used the observed abundances to compute weighted average values of STM and WSC for the study site (Table 1). In the same way, we also computed weighted minimum and maximum STM and WSC. For several growth forms, STM and WSC were not available. These were not included in the calculation of the average STM and WSC values.
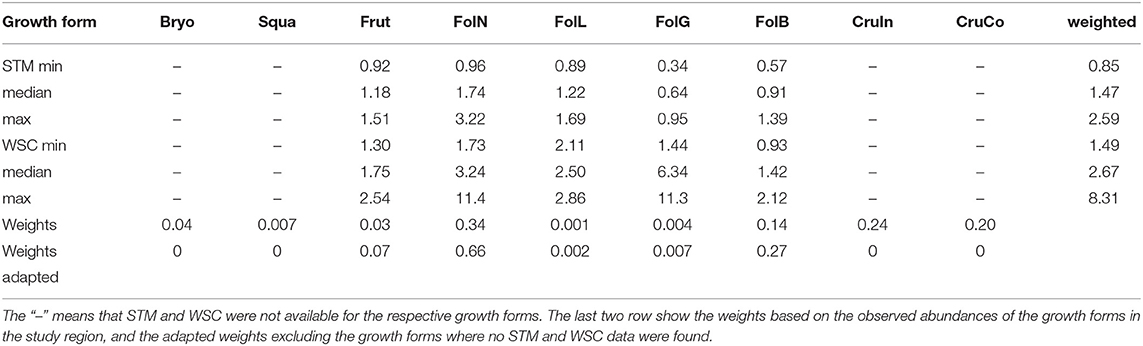
Table 1. Minimum, median, and maximum values of specific thallus mass (STM, [kg m−2]) and water storage capacity (WSC, [kg m−2]) for different growth forms of NV epiphytes which are found in the study region.
2.4. Model Setup
For this study, we drive the LiBry model with climate variables based on the global ERA5 reanalysis data set (Hersbach et al., 2020). This data set contains time series of climate variables from 1979 to 2019 in hourly temporal resolution, on a global grid with a spatial resolution of 0.28125° x 0.28125°. The climate variables used as input by the LiBry model include: down-welling short-wave (400–700 nm) solar radiation [W m−2], down-welling long-wave (near infrared,700–2,500 nm) radiation [W m−2], air temperature at 2 m height [K], relative humidity [fraction], rainfall [mm s−1], snowfall [mm s−1], and near-surface (10 m) wind speed [m s−1].
For the study site, we selected a grid cell of the ERA5 data which has the south-west corner at 8° 26' 15” E, 39° 56' 15” N, and thus includes the north-western part of the province of Oristano in Sardinia, where the field plots shown in Figure 3 are located. To assess, if the global climate data are a good approximation of the local climatic conditions, we compared ERA5 rainfall and temperature to estimates based on 19 local weather stations in the study region for the period of 1979 to 2019. The multi-year monthly distributions (Figure 5) show a very good agreement between ERA5 and local data. Only the annual temperature amplitude of the ERA5 data seems to be slightly smaller, and the interannual variability of the rainfall slightly larger compared to the station data.
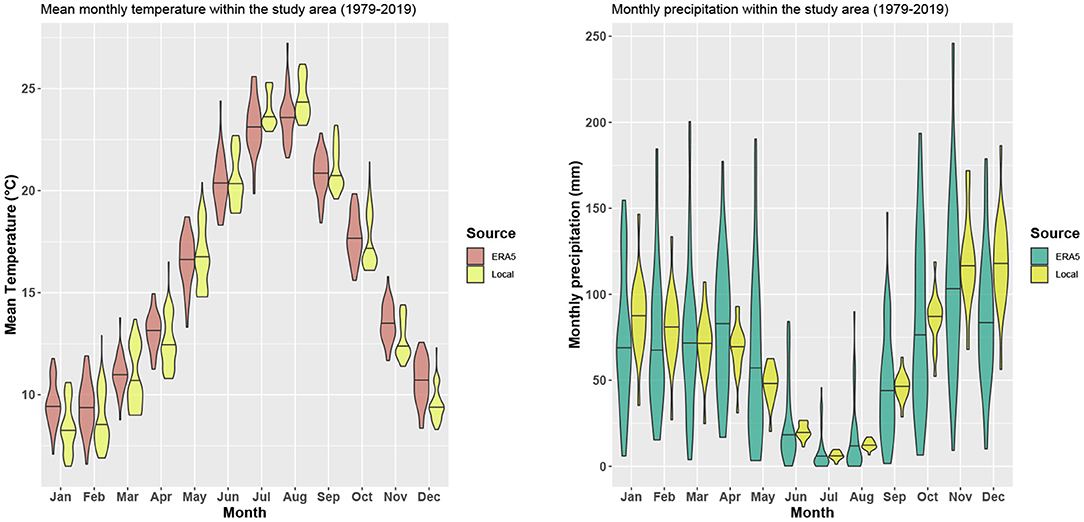
Figure 5. Comparison of ERA5 2 m air temperature and rainfall to local weather station data from the study region.
Further environmental conditions which are necessary to drive the LiBry model are the disturbance interval of the ecosystem where the NV epiphytes are located, and the LAI and SAI of the vascular vegetation. The disturbance interval is set to 30 years. LAI data from the study region are included in LiBry as multi-year monthly average values, ranging from 2.5 m2 m−2 in spring to 0.5 m2 m−2 in autumn and winter, and SAI is set to a constant value of 0.1 m2 m−2, based on the median value of 64 field plots. Bark water storage capacity in LiBry is based on the median value of 217 sampled trees in the study region and is set to 1.4 mm.
We run two LiBry simulations using the same input data, to quantify the impact of bark water storage on the growth of NV epiphytes at the study site. The first simulation includes a bark water reservoir of 1.4 mm, which represents an additional water supply for the organisms. In the second simulation, uptake of water from the bark reservoir is set to zero. By comparing the two runs with regard to the properties of the simulated NV epiphytes, we can estimate the relevance of the bark water reservoir for their physiological functioning and also their community composition.
The LiBry model is run for 600 years, repeating the full ERA5 data set (41 years), to drive the carbon balances of the simulated strategies into a steady state and ensure that the remaining strategies are able to survive in the long-term. Thereby, survival means that the strategies maintain a positive biomass for at least 600 model years. Hence, although NPP may be negative for certain periods during the simulation, it is necessary that the long-term average NPP is positive. In LiBry even inactive organisms have a small turnover of biomass, so they cannot survive with zero NPP for 600 years. The initial number of strategies is set to 3000, to cover sufficiently the multi-dimensional parameter space of physiological properties (see also Porada et al., 2013).
2.5. Model Validation and Sensitivity Analysis
To validate the LiBry model for this study, we compare the simulated properties of NV epiphytes to observations from the site in Sardinia, complemented by data from the literature. Thereby, we focus on the dominant growth forms and average morphological properties across species, such as specific thallus mass (STM) and water storage capacity (WSC). Based on the surviving strategies of a simulation, the LiBry model computes average STM and WSC for the study region. These estimates are then compared to the observation-based STM and WSC shown in Table 1. Moreover, we assess the plausibility of precipitation partitioning and the canopy energy balance simulated by LiBry.
In addition to the model validation, we carry out a sensitivity analysis of our simulated results, to quantify the impacts of uncertainties in the input data and the chosen parameter values on our findings. We vary the following model parameters by a factor of 2 and 0.5, respectively, since the properties are likely to have a broad range of possible values, and may be positively skewed:
• bark water storage capacity
• hydraulic conductivity at bark-epiphyte interface
• bark water potential
• shape parameter for the interception fraction of rainfall (pIcpt, Equation 1)
• disturbance interval
Furthermore, we vary the following properties by ± 20%:
• fraction of rainfall uptake into the interception reservoirs (ΦW, Figure 2)
• fraction of water on bark which is taken up by bark reservoir (ΦB, Figure 2)
• Leaf area index (LAI)
• rainfall rate
The reason for varying LAI is that time-series data at plot scale were not available for our site. However, we expect that the resolution of the data is still sufficiently fine to provide a realistic average estimate for the study region. Finally, we vary air temperature by ± 2° C, and we also test an alternative scheme for interactions between the physiological strategies in LiBry, While they are weighted in the default model setup by their relative growth rates, here we assume that all strategies have equal weights (neutral model), which means that the (averaged) model results, such as NPP, are more influenced by “rare” strategies.
3. Results
3.1. Simulated Water and Carbon Balance
For the study region in Sardinia, the LiBry model predicts high abundance and cover fraction of NV epiphytes (238 surviving physiological strategies out of 3000 initial ones; 77 % of total stem surface area covered by the organisms). The net primary production (NPP) of the organisms per stem area amounts to 32 g C m−2 a−1. At the ecosystem level, however, simulated NPP has a value of only 1.9 g C m−2 a−1, which is low compared to other regions of the world. Average NPP values of NV epiphytes in tropical rainforests or temperate forests, for instance, have been estimated to range from 6 to 10 g C m−2 a−1 (Elbert et al., 2012). Low simulated ecosystem NPP mainly results from the low stem area index in the study region. Simulated biomass of NV epiphytes is consistent with NPP and amounts to 48 g C m−2 per stem area and 3.1 g C m−2 of ground surface at the ecosystem level, respectively.
Water input into the canopy in form of rainfall and dew is partitioned by LiBry into throughfall, stemflow, and evaporation of intercepted water (see also Figure 2). For the study region, annual rainfall amounts to 667 mm a−1. The largest part of rainfall is directed to throughfall (71 %), while 11 % are intercepted and evaporate, and 18 % leave the canopy as stemflow. Bark water uptake represents a relevant source of water supply according to our model estimates, and amounts to 11 mm a−1, while dew and rainfall contribute 23 and 335 mm a−1, respectively (see also Figure 6).
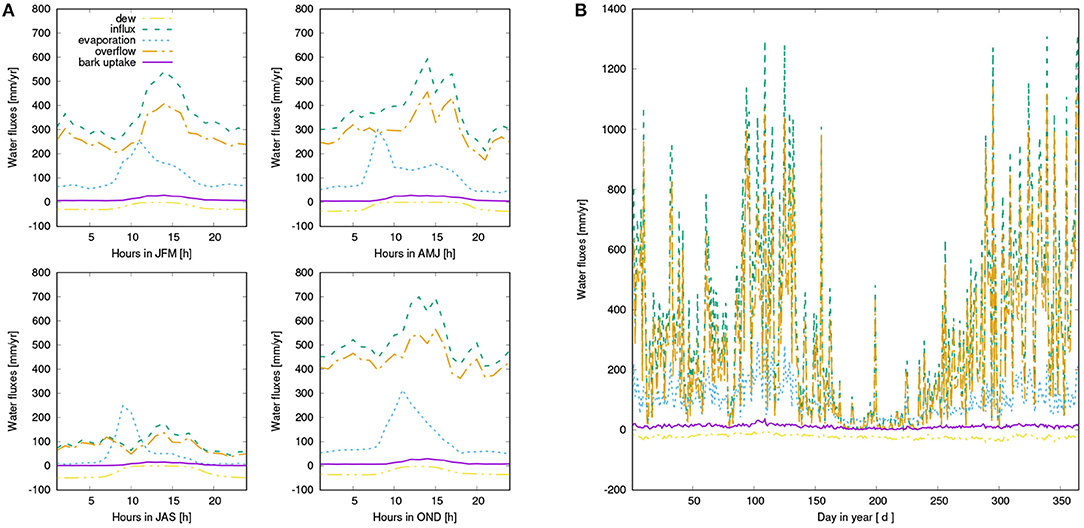
Figure 6. (A) Mean diurnal water balance of the simulated canopy for four seasons: Dew input (purple), rainfall (green), overflow from the canopy due to saturation of the interception reservoir or the NV epiphytes (orange), which is directed either to throughfall or to the bark reservoir, evaporation from the interception reservoir or the NV epiphytes (blue), and bark water uptake (yellow). (B) Seasonal pattern of water fluxes, same color coding as in (A).
When bark water uptake is switched off in the model, NPP is reduced substantially by 21%. This difference mainly results from reduced NPP in spring and early summer (see Figure 7). Throughout the year, NPP of the organisms in the control simulation is lowest in summer, while fall and spring show highest rates of NPP. While NPP and respiration have a similar magnitude in spring, NPP exceeds respiration in winter, and is in turn lower than respiration in late summer, fall, and early winter. However, average daily NPP is still positive throughout the year.
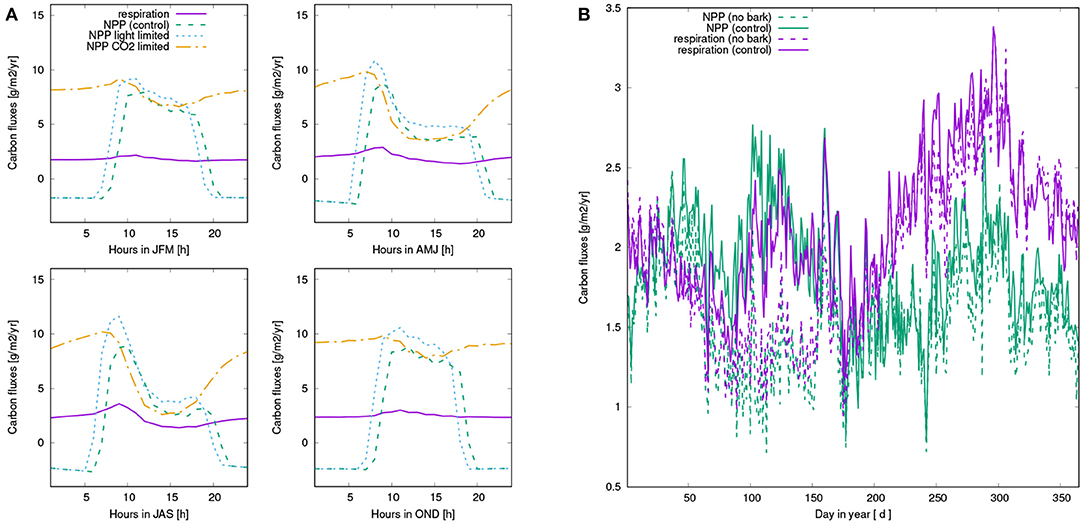
Figure 7. (A) Mean diurnal pattern of simulated carbon fluxes for four seasons, averaged over all surviving strategies of the control run: Net photosynthesis (green), Respiration (purple), light-limited rate of net photosynthesis (blue), and CO2-limited rate (orange). Net photosynthesis is computed as the minimum of the two rates. (B) Seasonal pattern of carbon balance of NV epiphytes: NPP (green) and respiration (purple) of the control run (solid lines) and the run without bark water uptake (dashed lines). All values are based on averaging over the last 10 years of the simulation.
The number of surviving strategies in the run without bark water uptake is reduced from 238 to 183, and the average physiological properties of the surviving strategies are shifted, albeit to a relatively small extent. Compared to the control run, the strategies have a slightly lower fraction of permanently air-filled thallus space and a higher fraction of small pores (Table 2). This means that they show increased water storage capacity and increased uptake of water from unsaturated air, and also a faster activation at low thallus water content, at the cost of a lower CO2-diffusivity at increasing thallus water content. Other physiological properties do not show substantial changes in their average values, such as growth height, porosity, photosynthetic capacity, optimum temperature, or albedo; also hydrophobicity of the thallus changes only slightly. Thereby, photosynthetic capacity refers to the parameter VC, MAX of the Farquhar photosynthesis scheme (Farquhar and von Caemmerer, 1982), which is used in LiBry, and hydrophobicity corresponds to a certain value of water saturation, below which potential water uptake is limited to a fixed rate. A higher value of hydrophobicity, meaning the threshold saturation, thus means that the maximum rate of water uptake of the thallus stays reduced for a longer time.
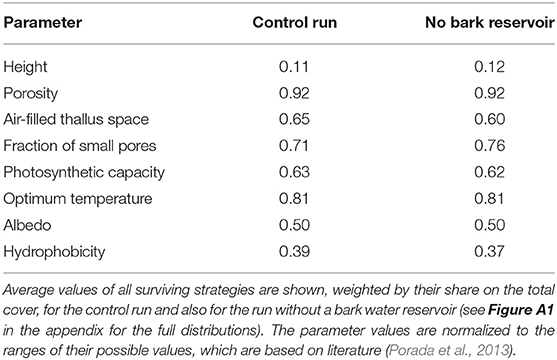
Table 2. Physiological parameters used in the LiBry model to define a physiological strategy.
While the average composition of the simulated NV epiphyte community remains relatively stable when the bark water reservoir is switched off, the individual strategies experience changes in their share on the total cover. This is shown in Figure 8 for the five strategies with the largest share on the cover in the control simulation, which make up together almost 50% of the total cover. Some parameters seem to be related to the change in cover. The two strategies which have the lowest total porosity and highest optimum temperature consistently show gains in cover, and vice versa. Furthermore, these two strategies also have a lower fraction of the thallus which remains air-filled at saturation, compared to the other strategies, and a lower fraction of small pores. The implications of these parameter shifts are discussed below. Please note that the parameter ranges in Figure 8 are normalized. Other parameters do not show a clear tendency in cover change, such as photosynthetic capacity, or height, for instance.
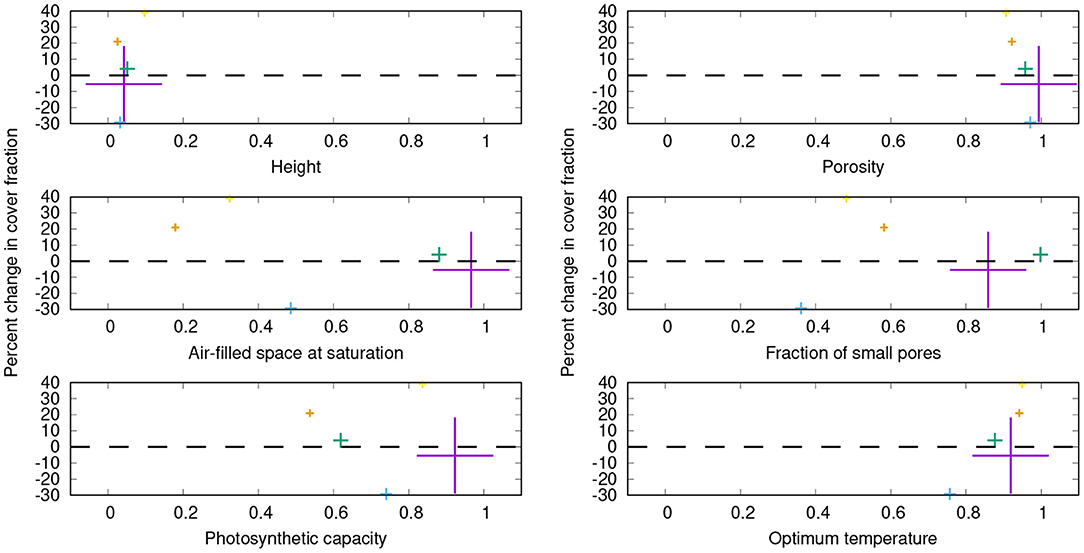
Figure 8. Percent changes in share on the total cover for the five physiological strategies which have the largest relative cover values in the control simulation, resulting from switching off the bark reservoir in LiBry. The color denotes the individual strategies, and the size of the crosses is proportional to the share of the strategy on the total cover. The dominant strategy (purple) has a share of 31% on the total cover in the control simulation. On the x-axes, a subset of the physiological parameters is shown which define a strategy in the LiBry model. The values of these parameters are normalized to the range between 0 and 1, where 0 corresponds to the lowest value and 1 to the highest value used in LiBry, based on the literature (Porada et al., 2013).
3.2. Comparison to Observations
LiBry estimates an interception fraction of 11% for the study area, which matches well with large-scale estimates for Sardinia (Miralles et al., 2010). The simulated share of stemflow on the water balance (18%) is relatively high, but still only half as high as observed maximum values (Van Stan and Gordon, 2018). The diurnal and seasonal patterns of surface temperature of the NV epiphytes simulated by LiBry are in a realistic range for the study site (P.Giordani, pers. commun.).
The successful physiological strategies simulated by LiBry for the study region are characterized by a low to intermediate height (0.5 – 2.5 cm, 1.7 cm on average), a high total porosity, a relatively high fraction of small pores, which is associated with a stronger attraction of water in the thallus and more efficient uptake of water from humid air, an intermediate to high photosynthetic capacity and respiration rate, and a high optimum temperature of photosynthesis (see Table 2, Figure 8 and Figure A1). The simulated morphological characteristics are largely consistent with the growth forms which can be found at the study site.
The LiBry model predicts average community values of specific thallus mass (STM) of 1.1 kg m−2 and water storage capacity (WSC) of 3.7 kg m−2. This compares well to the values, which were derived from observed abundance of growth forms at the study site, combined with estimated STM and WSC form the literature (Table 1). Simulated STM is slightly lower than observed, and WSC slightly higher. However, the observation-based range is relatively narrow, and the associated uncertainty is high.
3.3. Sensitivity Analysis
Our simulated estimates show an overall low sensitivity to variation in model parameter values (Table 3). The highest impacts on NPP at the ecosystem scale are due to reducing the disturbance interval by half, or doubling it. However, the associated changes in NPP are almost entirely due to changes in total surface cover of NV epiphytes, which result from more or less area which is lost to disturbance each year. The NPP per bark area does not change significantly. The second largest effects result from changes in LAI and air temperature. Thereby, a 20% lower LAI increases the NPP per area by 10%, and a likewise higher LAI decreases it by 5 %, which can be explained by the canopy scheme used in LiBry. Although lower LAI decreases the total amount of light and water captured by the canopy in the model, the concentration of these fluxes may increase due to the smaller canopy area, resulting in higher per-area productivity. Reduction of temperature by 2° C results in an 8% increase in NPP, also per bark area, while warmer temperature results in reduced NPP by 7%. Switching the scheme for interactions between strategies in LiBry to a neutral model (equal weights for all strategies) only slightly reduces NPP by 2%. However, the average morphological properties of the strategies shift substantially, resulting in increases of STM to 5.8 kg m−2 and WSC to 8.2 kg m−2. These values are outside the ranges which are derived from observations at the study site. Also the average height of the simulated NV epiphytes, which increases to 3.7 cm, seems to be too high.
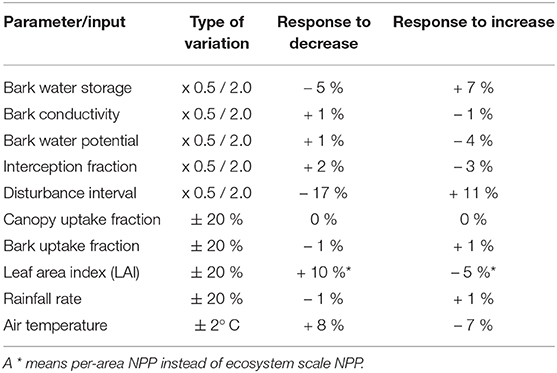
Table 3. Change in the simulated NPP of NV epiphytes, compared to the control run, resulting from variation of model parameters or climate input data.
4. Discussion
We simulated net primary production (NPP), cover, and the distribution of physiological properties of a community of NV epiphytes for a study region in Western Sardinia, using the process-based non-vascular vegetation model LiBry. Based on the model simulations, we quantified the importance of the bark water reservoir for the organisms.
Our main finding is a substantial reduction of NPP when water supply from the bark reservoir is switched off in the model. Based on the seasonal pattern of NPP (Figure 7), it is likely that the lower annual NPP results from reduced activity in spring due to decreased water availability in this time of the year (see also Figure A2). Furthermore, Figures 6A, 7A show that dew is a relevant source of water for the simulated organisms, as photosynthesis exhibits a characteristic peak in the morning hours after the thallus has been saturated during the night. This is consistent with observations (Lange et al., 1985; Baruffo and Tretiach, 2007; Tretiach et al., 2012). In fall and winter, however, photosynthesis is then in the afternoon hours only slightly limited by lack of water (Figure 7A). This means that water does not seem to be a strongly limiting factor. Since respiration is increased relative to NPP from late summer to early winter, a combination of high water saturation and warm temperature may limit NPP instead of active time. In summer, in turn, Figures 6, 7 show a strong decline in available water, associated with a substantial reduction in NPP in the afternoon. Hence, in summer the strong evaporative demand might overrule the positive effect of the bark water reservoir on NPP of the simulated NV epiphytes. This effect may be less pronounced in spring, which explains the important role of bark water supply for the simulated organisms during this time of the year. These findings confirm our hypotheses (1) and (2), the bark reservoir is a relevant source of water for the organisms and it allows for higher productivity of NV epiphytes, although the effect is most pronounced in spring.
It should be mentioned that carbon costs due to the short period of high respiration following reactivation (Palmqvist, 2000) are not yet considered in the LiBry model. This means that we can quantify impacts of the length of activity on the carbon balance of NV epiphytes, but may not capture all gains /losses of carbon due to a lower /higher number of active intervals throughout the year. However, the LiBry model accounts for turnover of biomass in the inactive state. Negative effects of longer periods of inactivity in spring on the carbon balance of NV epiphytes are thus captured by the model.
Another key result of our study is that the role of bark water supply for NV epiphytes may be species-specific. When bark water uptake is switched off in the model, not all physiological strategies are affected to an equal extent (Figure 8). Furthermore, gains and losses in cover do not seem to be distributed randomly between the strategies, but some tendencies can be recognized. Strategies which have (1) a lower total porosity and (2) a higher optimum temperature increase their share on the total cover compared to the control run. They are furthermore characterized by (3) low fractions of small pores and (4) air-filled thallus space at saturation. It is, however, not straightforward to interpret this outcome, due to the complex dependencies between physiological parameters, dynamic water content, and carbon balance in the model. In LiBry, reduced total porosity is associated with increased resistance to water loss at the cost of water storage capacity, assuming an increase of resistance with the volume of cell walls and gelatinous substances (Valladares et al., 1998). A lower fraction of air-filled space, in turn, increases water storage capacity, at the cost of a lower diffusivity for CO2 at full saturation (Cowan et al., 1992). A low fraction of small pores, however, increases diffusivity of CO2 at intermediate values of saturation, at the cost of a reduced ability to attract water in the thallus by capillary forces (Valladares et al., 1993). This leads to slower activation from humid air and decreased bark water uptake in the model. Considering these physiological trade-offs, the simulated changes in cover may be explained by selection pressure toward longer water retention when bark water is not available anymore. The higher surface resistance associated with lower porosity may prolong active time. The resulting reduced WSC may be compensated by a reduction of the air-filled space, leading to lower CO2-diffusivity. This would then be compensated by a reduced fraction of small pores, which may counteract the decreased CO2-diffusivity to some extent. The following reduced capacity for bark water uptake would have no negative effect on the carbon balance in the simulation where the bark reservoir is switched off. Except for the morning hours, simulated NPP is limited by the CO2-limited rate of photosynthesis (Figure 7A). This means that CO2 diffusion limitation may prevent strategies which have an even more compact thallus than those shown in Figure 8 from being successful in the simulation without bark reservoir. Thus, limited ability of adaptation to changed environmental conditions due to physiological trade-offs (Merinero et al., 2015) may be an additional reason for the reduced NPP compared to the control run. Overall, the model results confirm our hypothesis (3), the bark water reservoir plays an important role for the community composition of NV epiphytes.
A further consequence of reduced water supply may be elevated surface temperature caused by lack of evaporative cooling (Davies-Barnard et al., 2014), which would explain the selection of strategies which have a higher optimum temperature in the simulation without bark reservoir. However, the difference in surface temperature is small compared to the control run, less than 0.1°C on average. An alternative explanation is the consequence of reduced active time and potentially increased CO2 limitation for the carbon balance of the simulated organisms. At a given surface temperature, a higher optimum temperature not only leads to lower photosynthesis in the model, but also to lower respiration. Since respiration shows a stronger response to temperature under warm climate, it may be more beneficial for the carbon balance of the simulated NV epiphytes to have a markedly reduced respiration rate, at the cost of a less reduced photosynthesis rate.
Although we find a species-specific effect of the bark water reservoir on the carbon balance of NV epiphytes, the average physiological parameter values show no strong trends (Table 2). This is due to the fact that the strategies which have the largest shares on the total cover are the same in both the control simulation and the one without bark water uptake, even though their relative shares on the cover change, as discussed above. However, the reduction of the number of surviving species from 238 to 183 shows that strategies which have a small share on the total cover, resulting from little NPP, would be significantly affected by the decrease in bark water reservoir. Although this process would not lead to a significant quantitative change in the overall contribution of NV epiphytic communities at the landscape level, the effect would be far from negligible on ecosystem functionality at the microscale. These underrepresented strategies contribute to increasing the range of possible ecological adaptations to particular microclimatic conditions determined by the micromorphological variability of the trunks. The loss of these unique characteristics as a result of the decrease in bark water reservoir would lead to an imbalance in the relationship between functional vulnerability and functional over-redundancy and, ultimately, to the impoverishment and trivialization of epiphytic NV communities.
The validation of our simulated estimates is challenging, since we lack detailed information of the hydrological pathways in the canopy at the study site, and also field measurements of the carbon balance of the NV epiphytes. However, we find a general consistency of our results with characteristic values for this type of ecosystem. Another source of uncertainty is the estimation of the physiological properties of the NV epiphyte community in the study region. While we are able to constrain the range of possible values of morphological parameters to some extent, it is difficult to obtain exact estimates of average properties at the community level, which would require an extensive field campaign combined with laboratory analysis. Hence, to address the uncertainties associated with our modeling approach, we carried out a sensitivity analysis which included hydrological properties of the canopy, newly introduced model processes, and environmental conditions, such as climate. Since we did not find strong sensitivity of our estimates to variation in model parameters and inputs, we believe that our findings are valid in spite of the relatively large uncertainties in the approach.
Our estimates have several implications for the potential impacts of climate change on the community composition of NV epiphytes and the associated feedbacks on precipitation partitioning and the hydrological cycle. Firstly, the bark water reservoir may provide a relevant additional water supply for NV epiphytes, which makes possible increased NPP under sub-optimal environmental conditions, such as global warming and increased dryness. The reduction in NPP and the lower number of strategies in the simulation without bark water uptake indicate potential negative consequences of climate change on diversity of NV epiphytes, due to decreased active time. This may also occur indirectly, in case host trees are replaced by other tree species which have a reduced bark water storage capacity, for instance. Regarding potential feedbacks on local climate, our estimates suggest limited effects on surface temperature due to the low total bark area in the study region. In ecosystems which exhibit a larger coverage and biomass of NV epiphytes, a substantial feedback on surface temperature may occur.
From an application perspective, our results highlight the importance of adopting correct forest management strategies that reconcile the economic use of resources with the sustainability of fragile epiphytic communities. As demonstrated by our temporal simulation, this approach, generally valid, is even more critical in a Mediterranean environment where the prolonged summer water deficit makes the bark a fundamental reservoir for the survival of poikilohydric species. The quantification of the water requirements of epiphytic communities and of the water potentially available in the forest environment will allow to detail targeted forestry interventions compatible with the maintenance of the communities within their physiological optimum (Bianchi et al., 2020).
Future research can be developed to further modulate the results obtained from predictive models. Among the various aspects that could contribute to this, we draw attention to (i) the collection of more field data to obtain detailed information both on the water retention capacity of the different barks and on the physiological response of the NV epiphytes that colonize them, and (ii) greater attention to microclimatic characteristics so as to be able to increase the degree of spatial detail of the models and make them more aligned with the scale of actual biological activity of the NV epiphytes. To conclude, we found that the bark water reservoir in Sardinia is an important factor for increased productivity of NV epiphytes due to prolongation of active time. Moreover, it may sustain rare species in the ecosystem, which may otherwise not be sufficiently productive to survive in the long-term, and may thus increase potential diversity of NV epiphytes.
Data Availability Statement
The raw data supporting the conclusions of this article will be made available by the authors, without undue reservation.
Author Contributions
PP and PG designed the study concept together. PP developed the model code and ran the simulations. PG provided data for model evaluation. PP wrote the manuscript, with substantial input by PG. Both authors contributed to the article and approved the submitted version.
Funding
PP appreciates funding by the Deutsche Forschungsgemeinschaft (DFG, German Research Foundation) - 408092731, which made possible a part of the model development work.
Conflict of Interest
The authors declare that the research was conducted in the absence of any commercial or financial relationships that could be construed as a potential conflict of interest.
Acknowledgments
PP thanks Annika Jahnke-Bornemann (University of Hamburg, CEN) for support regarding the preparation of model input data.
References
Aptroot, A., and van Herk, C. (2007). Further evidence of the effects of global warming on lichens, particularly those with trentepohlia phycobionts. Environ. Pollut. 146, 293–298. doi: 10.1016/j.envpol.2006.03.018
Baldauf, S., Porada, P., Raggio, J., Maestre, F. T., and Tietjen, B. (2020). Relative humidity predominantly determines long-term biocrust-forming lichen cover in drylands under climate change. J. Ecol. 109, 1370–1385. doi: 10.1101/2020.06.09.141564
Baruffo, L., and Tretiach, M. (2007). Seasonal variations of fo, fm, and fv/fm in an epiphytic population of the lichen Punctelia subrudecta (Nyl.) Krog. Lichenologist 39, 555–566. doi: 10.1017/S0024282907006846
Bates, J. (1992). Influence of chemical and physical factors on Quercus and Fraxinus epiphytes at Loch Sunart, Western Scotland: a multivariate analysis. J. Ecol. 80, 163–179. doi: 10.2307/2261073
Bianchi, E., Benesperi, R., Brunialti, G., Di Nuzzo, L., Fackovcová, Z., Frati, L., et al. (2020). Vitality and growth of the threatened lichen Lobaria pulmonaria (L.) Hoffm. in response to logging and implications for its conservation in Mediterranean oak forests. Forests 11:995. doi: 10.3390/f11090995
Canu, S., Rosati, L., Fiori, M., Motroni, A., Filigheddu, R., and Farris, E. (2015). Bioclimate map of Sardinia (Italy). J. Maps 11, 711–718. doi: 10.1080/17445647.2014.988187
Carsel, R. F., and Parrish, R. S. (1988). Developing joint probability distributions of soil water retention characteristics. Water Resour. Res. 24, 755–769. doi: 10.1029/WR024i005p00755
Cowan, I., Lange, O., and Green, T. (1992). Carbon-dioxide exchange in lichens: determination of transport and carboxylation characteristics. Planta 187, 282–294. doi: 10.1007/BF00201952
Davies-Barnard, T., Valdes, P. J., Jones, C. D., and Singarayer, J. S. (2014). Sensitivity of a coupled climate model to canopy interception capacity. Clim. Dynam. 42, 1715–1732. doi: 10.1007/s00382-014-2100-1
Elbert, W., Weber, B., Burrows, S., Steinkamp, J., Büdel, B., Andreae, M., et al. (2012). Contribution of cryptogamic covers to the global cycles of carbon and nitrogen. Nat. Geosci. 5, 459–462. doi: 10.1038/ngeo1486
Ellis, C., Coppins, B., Dawson, T., and Seaward, M. (2007). Response of british lichens to climate change scenarios: trends and uncertainties in the projected impact for contrasting biogeographic groups. Biol. Conserv. 140, 217–235. doi: 10.1016/j.biocon.2007.08.016
Ellis, C. J., and Eaton, S. (2021). Microclimates hold the key to spatial forest planning under climate change: cyanolichens in temperate rainforest. Glob. Change Biol. doi: 10.1111/gcb.15514. [Epub ahead of print].
Farquhar, G., and von Caemmerer, S. (1982). “Modelling of photosynthetic response to environmental conditions,” in Encyclopedia of Plant Physiology, Vol. 12B, eds O. Lange, P. Nobel, C. Osmond, and H. Ziegler (Heidelberg: Springer). p. 549–587.
Franks, A. J., and Bergstrom, D. M. (2000). Corticolous bryophytes in microphyll fern forests of south-east queensland: distribution on Antarctic beech (Nothofagus moorei). Aust. Ecol. 25, 386–393. doi: 10.1046/j.1442-9993.2000.01048.x
Gauslaa, Y. (2014). Rain, dew, and humid air as drivers of morphology, function and spatial distribution in epiphytic lichens. Lichenologist 46, 1–16. doi: 10.1017/S0024282913000753
Gauslaa, Y., and Ustvedt, E. (2003). Is parietin a UV-B or a blue-light screening pigment in the lichen Xanthoria parietina? Photochem. Photobiol. Sci. 2, 424–432. doi: 10.1039/b212532c
Giordani, P., Incerti, G., Rizzi, G., Rellini, I., Nimis, P. L., and Modenesi, P. (2014). Functional traits of cryptogams in Mediterranean ecosystems are driven by water, light and substrate interactions. J. Veg. Sci. 25, 778–792. doi: 10.1111/jvs.12119
Giordani, P., Malaspina, P., Benesperi, R., Incerti, G., and Nascimbene, J. (2019). Functional over-redundancy and vulnerability of lichen communities decouple across spatial scales and environmental severity. Sci. Total Environ. 666, 22–30. doi: 10.1016/j.scitotenv.2019.02.187
Hargis, H. S.G G, Porada, P., Moore, G., Ferguson, B., and Van Stan II, J. (2019). Arboreal epiphytes in the soil-atmosphere interface: how often are the biggest "buckets" in the canopy empty? Geosciences 9, 1–17. doi: 10.3390/geosciences9080342
Hauck, M., Hofmann, E., and Schmull, M. (2006). Site factors determining epiphytic lichen distribution in a dieback-affected spruce–fir forest on Whiteface Mountain, New York: microclimate. Ann. Bot. Fennici 43, 1–12. Available online at: https://www.jstor.org/stable/23727271
Hersbach, H., Bell, B., Berrisford, P., Hirahara, S., Horányi, A., Munoz-Sabater, J., et al. (2020). The era5 global reanalysis. Q. J. R. Meteorol. Soc. 146, 1999–2049. doi: 10.1002/qj.3803
Hurtado, P., Prieto, M., de Bello, F., Aragón, G., López-Angulo, J., Giordani, P., et al. (2020a). Contrasting environmental drivers determine biodiversity patterns in epiphytic lichen communities along a European gradient. Microorganisms 8:1913. doi: 10.3390/microorganisms8121913
Hurtado, P., Prieto, M., Martínez-Vilalta, J., Giordani, P., Aragón, G., López-Angulo, J., et al. (2020b). Disentangling functional trait variation and covariation in epiphytic lichens along a continent-wide latitudinal gradient. Proc. R. Soc. B Biol. Sci. 287:20192862. doi: 10.1098/rspb.2019.2862
Jagodziński, A., Wierzcholska, S., Dyderski, M., Horodecki, P., Rusińska, A., Gdula, A., et al. (2018). Tree species effects on bryophyte guilds on a reclaimed post-mining site. Ecol. Eng. 110, 117–127. doi: 10.1016/j.ecoleng.2017.10.015
Johansson, P. (2008). Consequences of disturbance on epiphytic lichens in boreal and near boreal forests. Biol. Conserv. 141, 1933–1944. doi: 10.1016/j.biocon.2008.05.013
Jonsson Čabrajić, A., Lidén, M., Lundmark, T., Ottosson-Löfvenius, M., and Palmqvist, K. (2010). Modelling hydration and photosystem II activation in relation to in situ rain and humidity patterns: a tool to compare performance of rare and generalist epiphytic lichens. Plant Cell Environ. 33, 840–850. doi: 10.1111/j.1365-3040.2009.02110.x
Kattge, J., Knorr, W., Raddatz, T., and Wirth, C. (2009). Quantifying photosynthetic capacity and its relationship to leaf nitrogen content for global-scale terrestrial biosphere models. Glob. Change Biol. 15, 976–991. doi: 10.1111/j.1365-2486.2008.01744.x
Kenkel, N., and Bradfield, G. (1981). Ordination of epiphytic bryophyte communities in a wet-temperate coniferous forest, South-Coastal British Columbia. Vegetatio 45, 147–154. doi: 10.1007/BF00054669
Klamerus-Iwan, A., Link, T. E., Keim, R., and Van Stan II, J. (2020). “Storage and routing of precipitation through canopies,” in Precipitation Partitioning by Vegetation - A Global Synthesis, eds J. Van Stan II, E. Gutmann, and J. Friesen (Cham: Springer Nature Switzerland AG).
Klos, A., Rajfur, M., and Waclawek, W. (2005). Ion equilibrium in lichen surrounding. Bioelectrochemistry 66, 95–103. doi: 10.1016/j.bioelechem.2004.04.006
Kranner, I., Beckett, R., Hochman, A., and Nash, T. H. (2008). Desiccation-tolerance in lichens: a review. Bryologist 111, 576–593. doi: 10.1639/0007-2745-111.4.576
Lange, O., Green, T., and Reichenberger, H. (1999). The response of lichen photosynthesis to external CO2 concentration and its interaction with thallus water-status. J. Plant Physiol. 154, 157–166. doi: 10.1016/S0176-1617(99)80204-1
Lange, O., Tenhunen, J., Harley, P., and Walz, H. (1985). “Method for field measurements of CO2-Exchange. The diurnal changes in net photosynthesis and photosynthetic capacity of lichens under Mediterranean climatic conditions,” in Lichen Physiology and Cell Biology, ed D. Brown (Boston, MA: Springer). p. 23–39.
Łubek, A., Kukwa, M., Jaroszewicz, B., and Czortek, P. (2018). Changes in the epiphytic lichen biota of Białowieża Primeval Forest are not explained by climate warming. Sci. Total Environ. 643, 468–478. doi: 10.1016/j.scitotenv.2018.06.222
Merinero, S., Hilmo, O., and Gauslaa, Y. (2014). Size is a main driver for hydration traits in cyano- and cephalolichens of boreal rainforest canopies. Fungal Ecol. 7, 59–66. doi: 10.1016/j.funeco.2013.12.001
Merinero, S., Martínez, I., Rubio-Salcedo, M., and Gauslaa, Y. (2015). Epiphytic lichen growth in Mediterranean forests: effects of proximity to the ground and reproductive stage. Basic Appl. Ecol. 16, 220–230. doi: 10.1016/j.baae.2015.01.007
Metcalfe, D. B., and Ahlstrand, J. C. M. (2019). Effects of moisture dynamics on bryophyte carbon fluxes in a tropical cloud forest. New Phytol. 222, 1766–1777. doi: 10.1111/nph.15727
Miralles, D. G., Gash, J. H., Holmes, T. R. H., de Jeu, R. A. M., and Dolman, A. J. (2010). Global canopy interception from satellite observations. J. Geophys. Res. Atmos. 115, 1–8. doi: 10.1029/2009JD013530
Myneni, R., Knyazikhin, Y., and Park, T. (2015). MOD15A2H MODIS/Terra Leaf Area Index/FPAR 8-Day L4 Global 500m SIN Grid V006 [Data set]. NASA EOSDIS Land Processes DAAC.
Nascimbene, J., Benesperi, R., Casazza, G., Chiarucci, A., and Giordani, P. (2020). Range shifts of native and invasive trees exacerbate the impact of climate change on epiphyte distribution: the case of lung lichen and black locust in Italy. Sci. Total Environ. 735:139537. doi: 10.1016/j.scitotenv.2020.139537
Nascimbene, J., Casazza, G., Benesperi, R., Catalano, I., Cataldo, D., Grillo, M., et al. (2016). Climate change fosters the decline of epiphytic Lobaria species in italy. Biol. Conserv. 201, 377–384. doi: 10.1016/j.biocon.2016.08.003
Nascimbene, J., and Marini, L. (2010). Oak forest exploitation and black-locust invasion caused severe shifts in epiphytic lichen communities in Northern Italy. Sci. Total Environ. 408, 5506–5512. doi: 10.1016/j.scitotenv.2010.07.056
Nimis, P. L. (2016). The Lichens of Italy. A Second Annotated Catalogue. EUT Edizioni Università di Trieste. (Trieste).
Palmqvist, K. (2000). Tansley review no. 117. Carbon economy in lichens. New Phytol. 148, 11–36. doi: 10.1046/j.1469-8137.2000.00732.x
Palmqvist, K., Dahlman, L., Valladares, F., Tehler, A., Sancho, L., and Mattsson, J. (2002). CO2 exchange and thallus nitrogen across 75 contrasting lichen associations from different climate zones. Oecologia 133, 295–306. doi: 10.1007/s00442-002-1019-0
Porada, P., Pöschl, U., Kleidon, A., Beer, C., and Weber, B. (2017). Estimating global nitrous oxide emissions by lichens and bryophytes with a process-based productivity model. Biogeosciences 14, 1593–1602. doi: 10.5194/bg-2016-420
Porada, P., Tamm, A., Raggio, J., Cheng, Y., Kleidon, A., Pöschl, U., et al. (2019). Global NO and HONO emissions of biological soil crusts estimated by a process-based non-vascular vegetation model. Biogeosciences 16, 2003–2031. doi: 10.5194/bg-16-2003-2019
Porada, P., Van Stan, J., and Kleidon, A. (2018). Significant contribution of non-vascular vegetation to global rainfall interception. Nat. Geosci. 11, 563–567. doi: 10.1038/s41561-018-0176-7
Porada, P., Weber, B., Elbert, W., Pöschl, U., and Kleidon, A. (2013). Estimating global carbon uptake by lichens and bryophytes with a process-based model. Biogeosciences 10, 6989–7033. doi: 10.5194/bg-10-6989-2013
Porada, P., Weber, B., Elbert, W., Pöschl, U., and Kleidon, A. (2014). Estimating impacts of lichens and bryophytes on global biogeochemical cycles of nitrogen and phosphorus and on chemical weathering. Global Biogeochem. Cycles 28, 71–85. doi: 10.1002/2013GB004705
Proctor, M. (2000). The bryophyte paradox: tolerance of desiccation, evasion of drought. Plant Ecol. 151, 41–49. doi: 10.1023/A:1026517920852
Proctor, M., Oliver, M., Wood, A., Alpert, P., Stark, L., Cleavitt, N., et al. (2007). Desiccation-tolerance in bryophytes: a review. Bryologist 110, 595–621. doi: 10.1639/0007-2745(2007)110[595:DIBAR]2.0.CO;2
Rodríguez-Quiel, E., Mendieta-Leiva, G., and Bader, M. (2019). Elevational patterns of bryophyte and lichen biomass differ among substrates in the tropical montane forest of Baru volcano, Panama. J. Bryol. 41, 95–106. doi: 10.1080/03736687.2019.1584433
Rubio-Salcedo, M., Psomas, A., Prieto, M., Zimmermann, N. E., and Martínez, I. (2017). Case study of the implications of climate change for lichen diversity and distributions. Biodivers. Conserv. 26, 1121–1141. doi: 10.1007/s10531-016-1289-1
Smith, R. J., Nelson, P. R., Jovan, S., Hanson, P. J., and McCune, B. (2018). Novel climates reverse carbon uptake of atmospherically dependent epiphytes: Climatic constraints on the iconic boreal forest lichen evernia mesomorpha. Am. J. Bot. 105, 266–274. doi: 10.1002/ajb2.1022
Tretiach, M., Baruffo, L., and Piccotto, M. (2012). Effects of Mediterranean summer conditions on chlorophyll a fluorescence emission in the epiphytic lichen Flavoparmelia soredians: a field study. Plant Biosyst. 146, 171–180. doi: 10.1080/11263504.2012.727881
Valladares, F., Sancho, L., and Ascaso, C. (1998). Water storage in the lichen family Umbilicariaceae. Bot. Acta 111, 99–107.
Valladares, F., Wierzchos, J., and Ascaso, C. (1993). Porosimetric study of the lichen family Umbilicariaceae: anatomical interpretation and implications for water storage capacity of the thallus. Am. J. Bot. 80, 263–272.
Van Stan, J. II., and Gordon, D. A. (2018). Mini-review: stemflow as a resource limitation to near-stem soils. Front. Plant Sci. 9:248. doi: 10.3389/fpls.2018.00248
Van Stan, J. II., and Pypker, T. (2015). A review and evaluation of forest canopy epiphyte roles in the partitioning and chemical alteration of precipitation. Sci. Total Environ. 536, 813–824. doi: 10.1016/j.scitotenv.2015.07.134
Wang, Z., and Bader, M. (2018). Associations between shoot-level water relations and photosynthetic responses to water and light in 12 moss species. AoB Plants 10:ply034. doi: 10.1093/aobpla/ply034
Wang, Z., Liu, X., Bader, M., Feng, D., and Bao, W. (2017). The ‘plant economic spectrum’ in bryophytes, a comparative study in subalpine forest. Am. J. Bot. 104, 261–270. doi: 10.3732/ajb.1600335
Wierzcholska, S., Dyderski, M., and Jagodziński, A. (2020). Potential distribution of an epiphytic bryophyte depends on climate and forest continuity. Global Planet. Change 193:103270. doi: 10.1016/j.gloplacha.2020.103270
Appendix
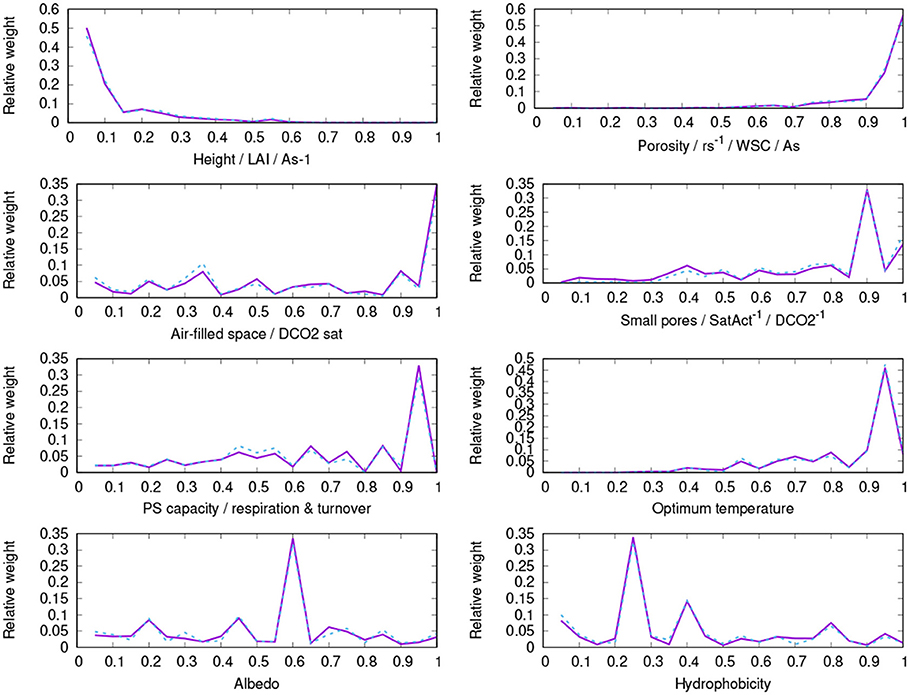
Figure A1. Parameter distribution of surviving strategies of the control run (purple, solid) and the run without bark water reservoir (blue, dashed).

Figure A2. (A) Mean diurnal activity pattern of simulated NV epiphytes for four seasons, averaged over all surviving strategies of the control run (blue, solid) and the run without bark reservoir (orange, dashed); (B) Seasonal pattern of activity.
Keywords: vegetation model, ecophysiology, functional diversity, epiphytic lichen, Mediterranean vegetation, DGVM, non-vascular plants, precipitation partitioning
Citation: Porada P and Giordani P (2021) Bark Water Storage Plays Key Role for Growth of Mediterranean Epiphytic Lichens. Front. For. Glob. Change 4:668682. doi: 10.3389/ffgc.2021.668682
Received: 17 February 2021; Accepted: 22 March 2021;
Published: 20 April 2021.
Edited by:
Anna Klamerus-Iwan, University of Agriculture in Krakow, PolandReviewed by:
Ewa Papierowska, Warsaw University of Life Sciences, PolandMarcin Dyderski, Institute of Dendrology (PAN), Poland
Copyright © 2021 Porada and Giordani. This is an open-access article distributed under the terms of the Creative Commons Attribution License (CC BY). The use, distribution or reproduction in other forums is permitted, provided the original author(s) and the copyright owner(s) are credited and that the original publication in this journal is cited, in accordance with accepted academic practice. No use, distribution or reproduction is permitted which does not comply with these terms.
*Correspondence: Philipp Porada, cGhpbGlwcC5wb3JhZGFAdW5pLWhhbWJ1cmcuZGU=