 Stefano Manzoni
 Arjun Chakrawal
 Marie Spohn
 Björn D. Lindahl
- 1Department of Physical Geography, Stockholm University, Stockholm, Sweden
- 2Bolin Centre for Climate Research, Stockholm University, Stockholm, Sweden
- 3Department of Soil and Environment, Swedish University of Agricultural Sciences, Uppsala, Sweden
Microbial decomposers face large stoichiometric imbalances when feeding on nutrient-poor plant residues. To meet the challenges of nutrient limitation, microorganisms might: (i) allocate less carbon (C) to growth vs. respiration or excretion (i.e., flexible C-use efficiency, CUE), (ii) produce extracellular enzymes to target compounds that supply the most limiting element, (iii) modify their cellular composition according to the external nutrient availability, and (iv) preferentially retain nutrients at senescence. These four resource use modes can have different consequences on the litter C and nitrogen (N) dynamics–modes that selectively remove C from the system can reduce C storage in soil, whereas modes that delay C mineralization and increase internal N recycling could promote storage of C and N. Since we do not know which modes are dominant in litter decomposers, we cannot predict the fate of C and N released from plant residues, in particular under conditions of microbial nutrient limitation. To address this question, we developed a process-based model of litter decomposition in which these four resource use modes were implemented. We then parameterized the model using ∼80 litter decomposition datasets spanning a broad range of litter qualities. The calibrated model variants were able to capture most of the variability in litter C, N, and lignin fractions during decomposition regardless of which modes were included. This suggests that different modes can lead to similar litter decomposition trajectories (thanks to the multiple alternative resource acquisition pathways), and that identification of dominant modes is not possible using “standard” litter decomposition data (an equifinality problem). Our results thus point to the need of exploring microbial adaptations to nutrient limitation with empirical estimates of microbial traits and to develop models flexible enough to consider a range of hypothesized microbial responses.
Introduction
The products of litter decomposition represent the first step toward long-term soil organic carbon (C) stabilization (Berg and McClaugherty, 2003; Cotrufo et al., 2013), but decomposing nutrient poor and/or chemically recalcitrant litter poses challenges for microorganisms. First, microbial decomposers may not be able to easily obtain C and nutrients in optimal ratios for biomass and metabolism (Mooshammer et al., 2014). Second, access to energetically or nutritionally useful compounds can be hindered when these compounds are protected by recalcitrant ones (Talbot and Treseder, 2012). The adaptations of decomposers to face these challenges affect rates of litter decomposition and ultimately organic matter stabilization.
The first challenge is imposed by stoichiometric imbalances between litter and decomposers, which decomposers can confront by four different modes of resource use: (i) flexible C-use efficiency (CUE), (ii) synthesis of extra-cellular enzymes to target the most limiting element (selective enzymes), (iii) adjustment of microbial cellular composition (plastic microbial C:N), and (iv) by retaining limiting resources during senescence (nutrient retention). There is empirical support for the first mode–decomposers might become less efficient in converting C taken up to biomass when nutrients are scarce (i.e., lower CUE) (Mooshammer et al., 2014; Manzoni et al., 2017). If microbial CUE is lower when nutrients are limiting, it is possible that decomposition continues, but more C is mineralized or excreted in soluble and labile forms (Hessen and Anderson, 2008; Spohn, 2015). Preferential synthesis of specific extracellular enzymes can occur, especially when addition of one element triggers production of enzymes to mine another element from organic matter (Carreiro et al., 2000; Mooshammer et al., 2014). The potential consequence of decoupling of C and nutrient acquisition is that some compounds rich in the least limiting element (C in litter) can be left behind during decomposition and the overall rate of decomposition decreases under nutrient limitation (Boberg et al., 2008). Microbial cellular composition can be changed when facing nutrient limitation (Camenzind et al., 2021), but empirical evidence points to relatively homeostatic behavior (i.e., stable element ratios) at the microbial community level when considering nitrogen (N) as a limiting factor (Manzoni et al., 2010; Fanin et al., 2013). Finally, microorganisms can retain the most limiting resource more efficiently, and reduce losses of limiting resources in necromass or extracellular products (Spohn, 2016; Spohn and Widdig, 2017; Camenzind et al., 2021). Therefore, depending on the net effect of these adaptations, litter with low nutrient contents may promote or reduce C stabilization.
The second challenge is imposed by the presence of recalcitrant compounds that impede access to more useful and metabolically valuable ones. Energy-rich hydrolysable compounds, such as cellulose, or nutrient containing compounds, such as proteins, are partly chemically cross-linked to, or physically protected by, recalcitrant compounds, such as tannins, lignins or melanins, which need to be degraded by oxidative mechanisms for microorganisms to access the more labile, hydrolysable compounds (Talbot and Treseder, 2012; Baskaran et al., 2019). High lignin content is known to decrease decomposition rates both across litter types (Aerts, 1997) and among litters from genotypes of the same species with variable lignin content (Talbot and Treseder, 2012). Notably, there are also major “hidden” metabolic costs associated with oxidation of recalcitrant compounds (Shimizu et al., 2005), potentially associated with hydrogen peroxide production and amelioration of oxidative stress. Thus, decomposing recalcitrant compounds requires expending energy that could otherwise be invested in growth.
Quantifying the combined influence of these different adaptations on C stocks and dynamics is complicated because they affect C and nutrient dynamics throughout the decomposition process–during enzymatic depolymerization, when compounds are metabolized, when resources are converted into biomass, and during recycling at senescence. Process-based models are useful tools to track C and nutrients as they are cycled during decomposition, and to assess the complex consequences of these microbial resource use modes. Indeed, several models have been proposed to describe these processes, but they have not been integrated into a fully coherent framework.
In models, the first challenge (stoichiometric imbalances) is typically dealt with by imposing stoichiometric constraints in the equations linking C and nutrient flows. Flexible CUE has been implemented in some models, generally as a C-overflow mechanism in which “redundant” C is disposed of via respiration (Schimel and Weintraub, 2003; Wutzler et al., 2017), but also as an empirically-based function of nutrient availability (Campbell et al., 2016; Manzoni, 2017; Zhang et al., 2018). In models that include extracellular enzymes, selective production of different enzymes is generally constrained so that the total enzyme synthesis is constant, while the proportion of enzymes for degrading C-rich or nutrient-rich compounds can be varied (Moorhead et al., 2012; Averill, 2014; Wutzler et al., 2017). More complex models allow dynamic synthesis of different enzymes to create a balanced resource supply to the decomposers (Sistla et al., 2014). Some models also allow for phenotypic plasticity in microbial C:N ratio, assuming that microbial C:N increases with decreasing N availability (McGill et al., 1981; Parton et al., 1993; Sistla et al., 2014; Fatichi et al., 2019). However, most models impose strict homeostasis (constant C:N), which constrains microbial proliferation and decomposition under nutrient limitation (Moorhead and Sinsabaugh, 2006; Manzoni and Porporato, 2009; Zhang et al., 2018). We are not aware of modeling approaches in which nutrient retention at senescence can be adjusted.
Historically, decomposition models have focused on the second challenge, characterizing litter chemical properties in terms of different turnover times for each C compartment (Liski et al., 2005; Manzoni and Porporato, 2009). While most models assume independent decomposition in each compartment, some describe interactions between recalcitrant and labile compounds, including inhibition of hydrolizable C decomposition when the content of recalcitrant compounds is high (Moorhead and Sinsabaugh, 2006; Moorhead et al., 2013; Campbell et al., 2016; Fatichi et al., 2019). In contrast, a recent continuous quality model describes in a mechanistic way the release of cellulose from the lignin matrix (Sainte-Marie et al., 2021). These models, however, are generally complex and require estimation of numerous parameters (except for the simple parameterization in Moorhead et al., 2013). Moreover, as far as we know, no attempt has been made to describe “hidden” metabolic costs of organic matter decomposition. Therefore, there is a need for an intermediate complexity model that harmonizes the current theories on both stoichiometric and chemical controls on decomposition and requires readily available data for calibration.
Our first goal in this contribution is to fill this gap, specifically aiming at a formulation where stoichiometric constraints dictate how the kinetics of decomposition and CUE vary with substrate quality when microorganisms employ different adaptation mechanisms, as summarized by the four resource use modes described above–flexible CUE, selective enzymes, plastic microbial C:N, and nutrient retention. Second, we ask if we can exclude putative modes using litter decomposition data. To this aim, we calibrated four variants of our model (one for each mode) and assessed their performance in capturing changes in C, N, and lignin amounts during decomposition of 81 litter types at four sites (data were obtained from published studies). If a model variant based on a certain mode cannot capture trends in the data, that mode could be excluded as a putative microbial response during litter decomposition. In contrast, adaptations that, when represented, lead to more accurate modeling of litter decomposition trajectories would be useful targets for empirical studies aiming to specifically investigate the underlying microbial traits.
Theory and Data Analysis
The modeled litter system is composed of three substrate compartments and one microbial decomposer compartment. Substrates include a carbohydrate pool (containing only C) and a protein pool (containing C and N), both degraded by hydrolytic enzymes, as well as a recalcitrant organic matter pool (containing C and N), which is only degraded by oxidative mechanisms and therefore denoted as “oxidizable organic matter” in the following. Microorganisms are pooled into a single compartment containing C and N in fixed proportion in all model variants except mode (iii) implementing a plastic microbial C:N. Decomposition rates depend on microbial biomass content in the litter and cellular mortality feeds back into the substrate pools. This general model structure is based on previous theoretical work (e.g., Moorhead et al., 2013; Sistla et al., 2014), and the novelty here is in the way resource use is described and analyzed. The model schematic is shown in Figure 1A, and a detailed description of the model equations is provided in the following; C balance equations and fluxes are presented first (sections “Carbon Balance Equations,” “Carbon Flow Rates,” and “Effects of Oxidizable Carbon on Decomposition and Microbial Growth”), followed by the N balances and related fluxes (sections “Nitrogen Balance Equations,” “Net Nitrogen Mineralization Under Carbon Limitation,” and “Partitioning of Necromass Among Organic Matter Compartments”). Next, the implementation of the four resource use modes is presented (section “Nitrogen Limitation: Occurrence and Microbial Responses”; symbols are defined in Table 1). Finally, model parameterization, datasets, and numerical solution are described (sections “Model Parameterization,” “Litter Decomposition Data,” and “Mass Balance Solution and Parameter Optimization”).
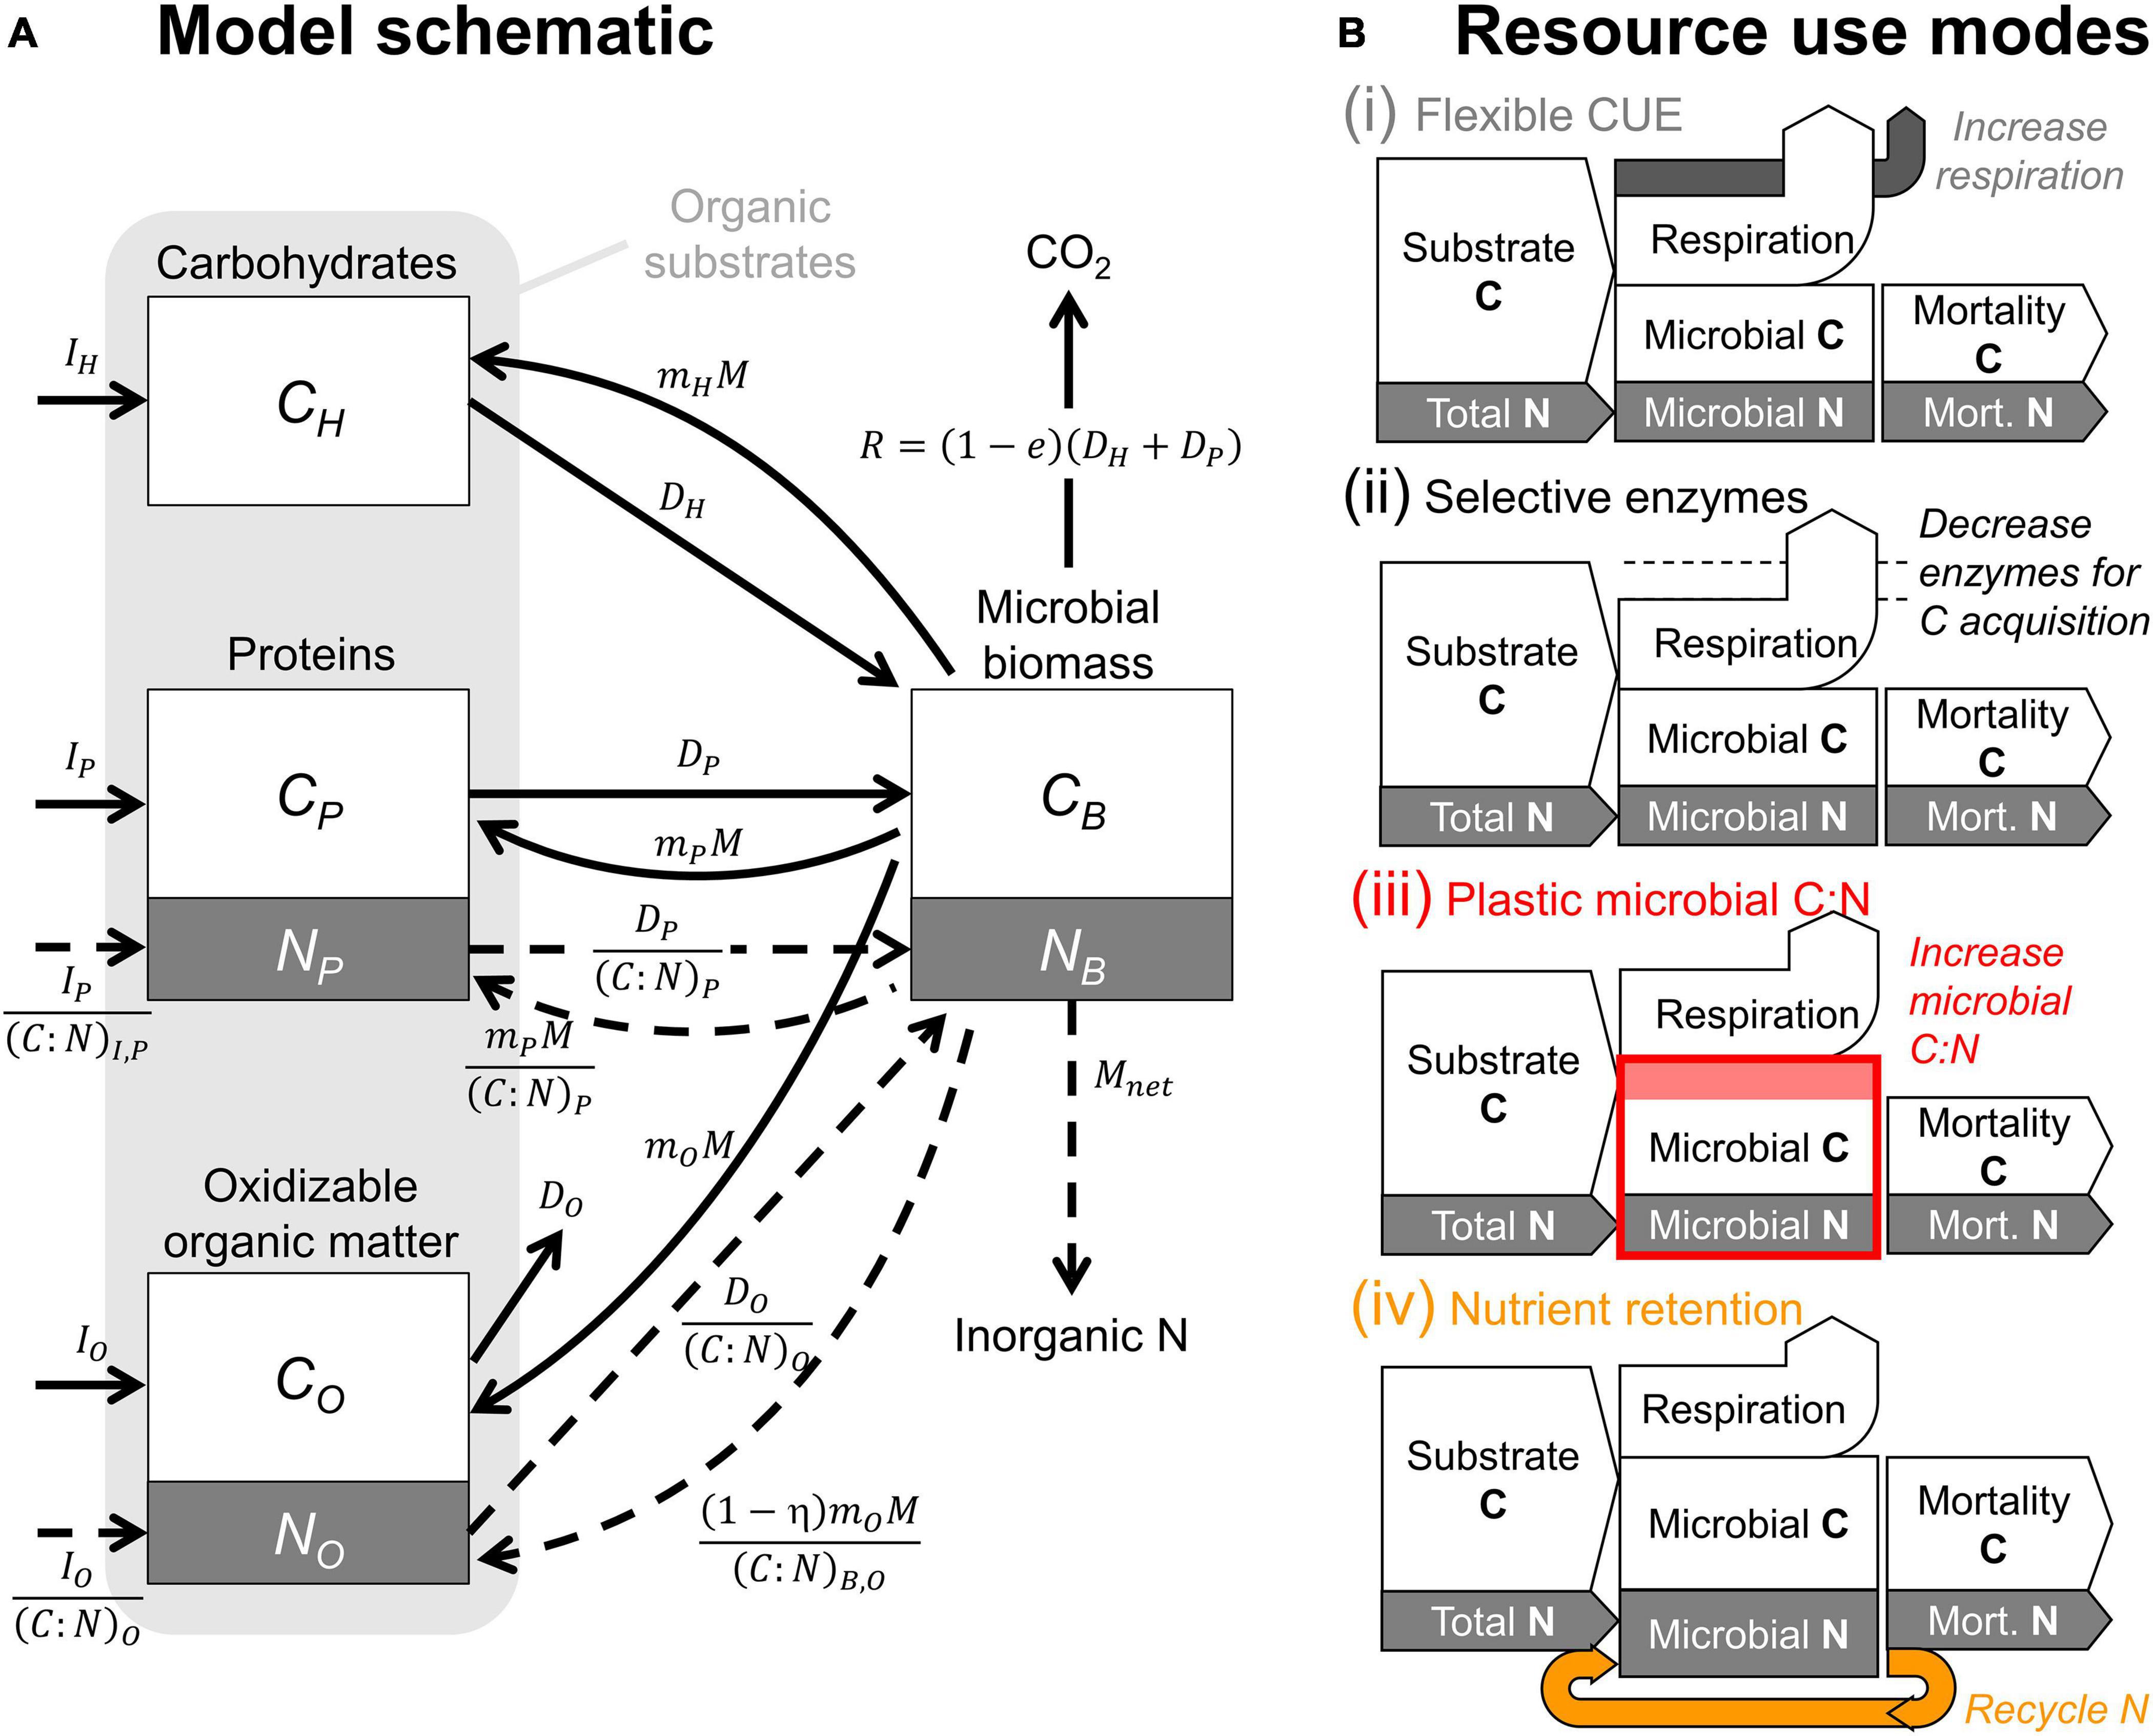
Figure 1. (A) Model schematic. White and gray boxes represent the modeled carbon (C) and nitrogen (N) compartments; solid and dashed arrows represent C and N flow rates, respectively (straight arrows refer to input, decomposition, and mineralization rates; curved arrows refer to recycling of microbial residues in the substrate compartments). (B) Simplified representations of the four resource use modes implemented in the model shown in panel (A) (color-coded as in Figures 2–6, 9). The text in italic explains the response to N limitation in each mode; the label “Total N” indicates N supply to microbes from both organic substrates and the inorganic N compartment.
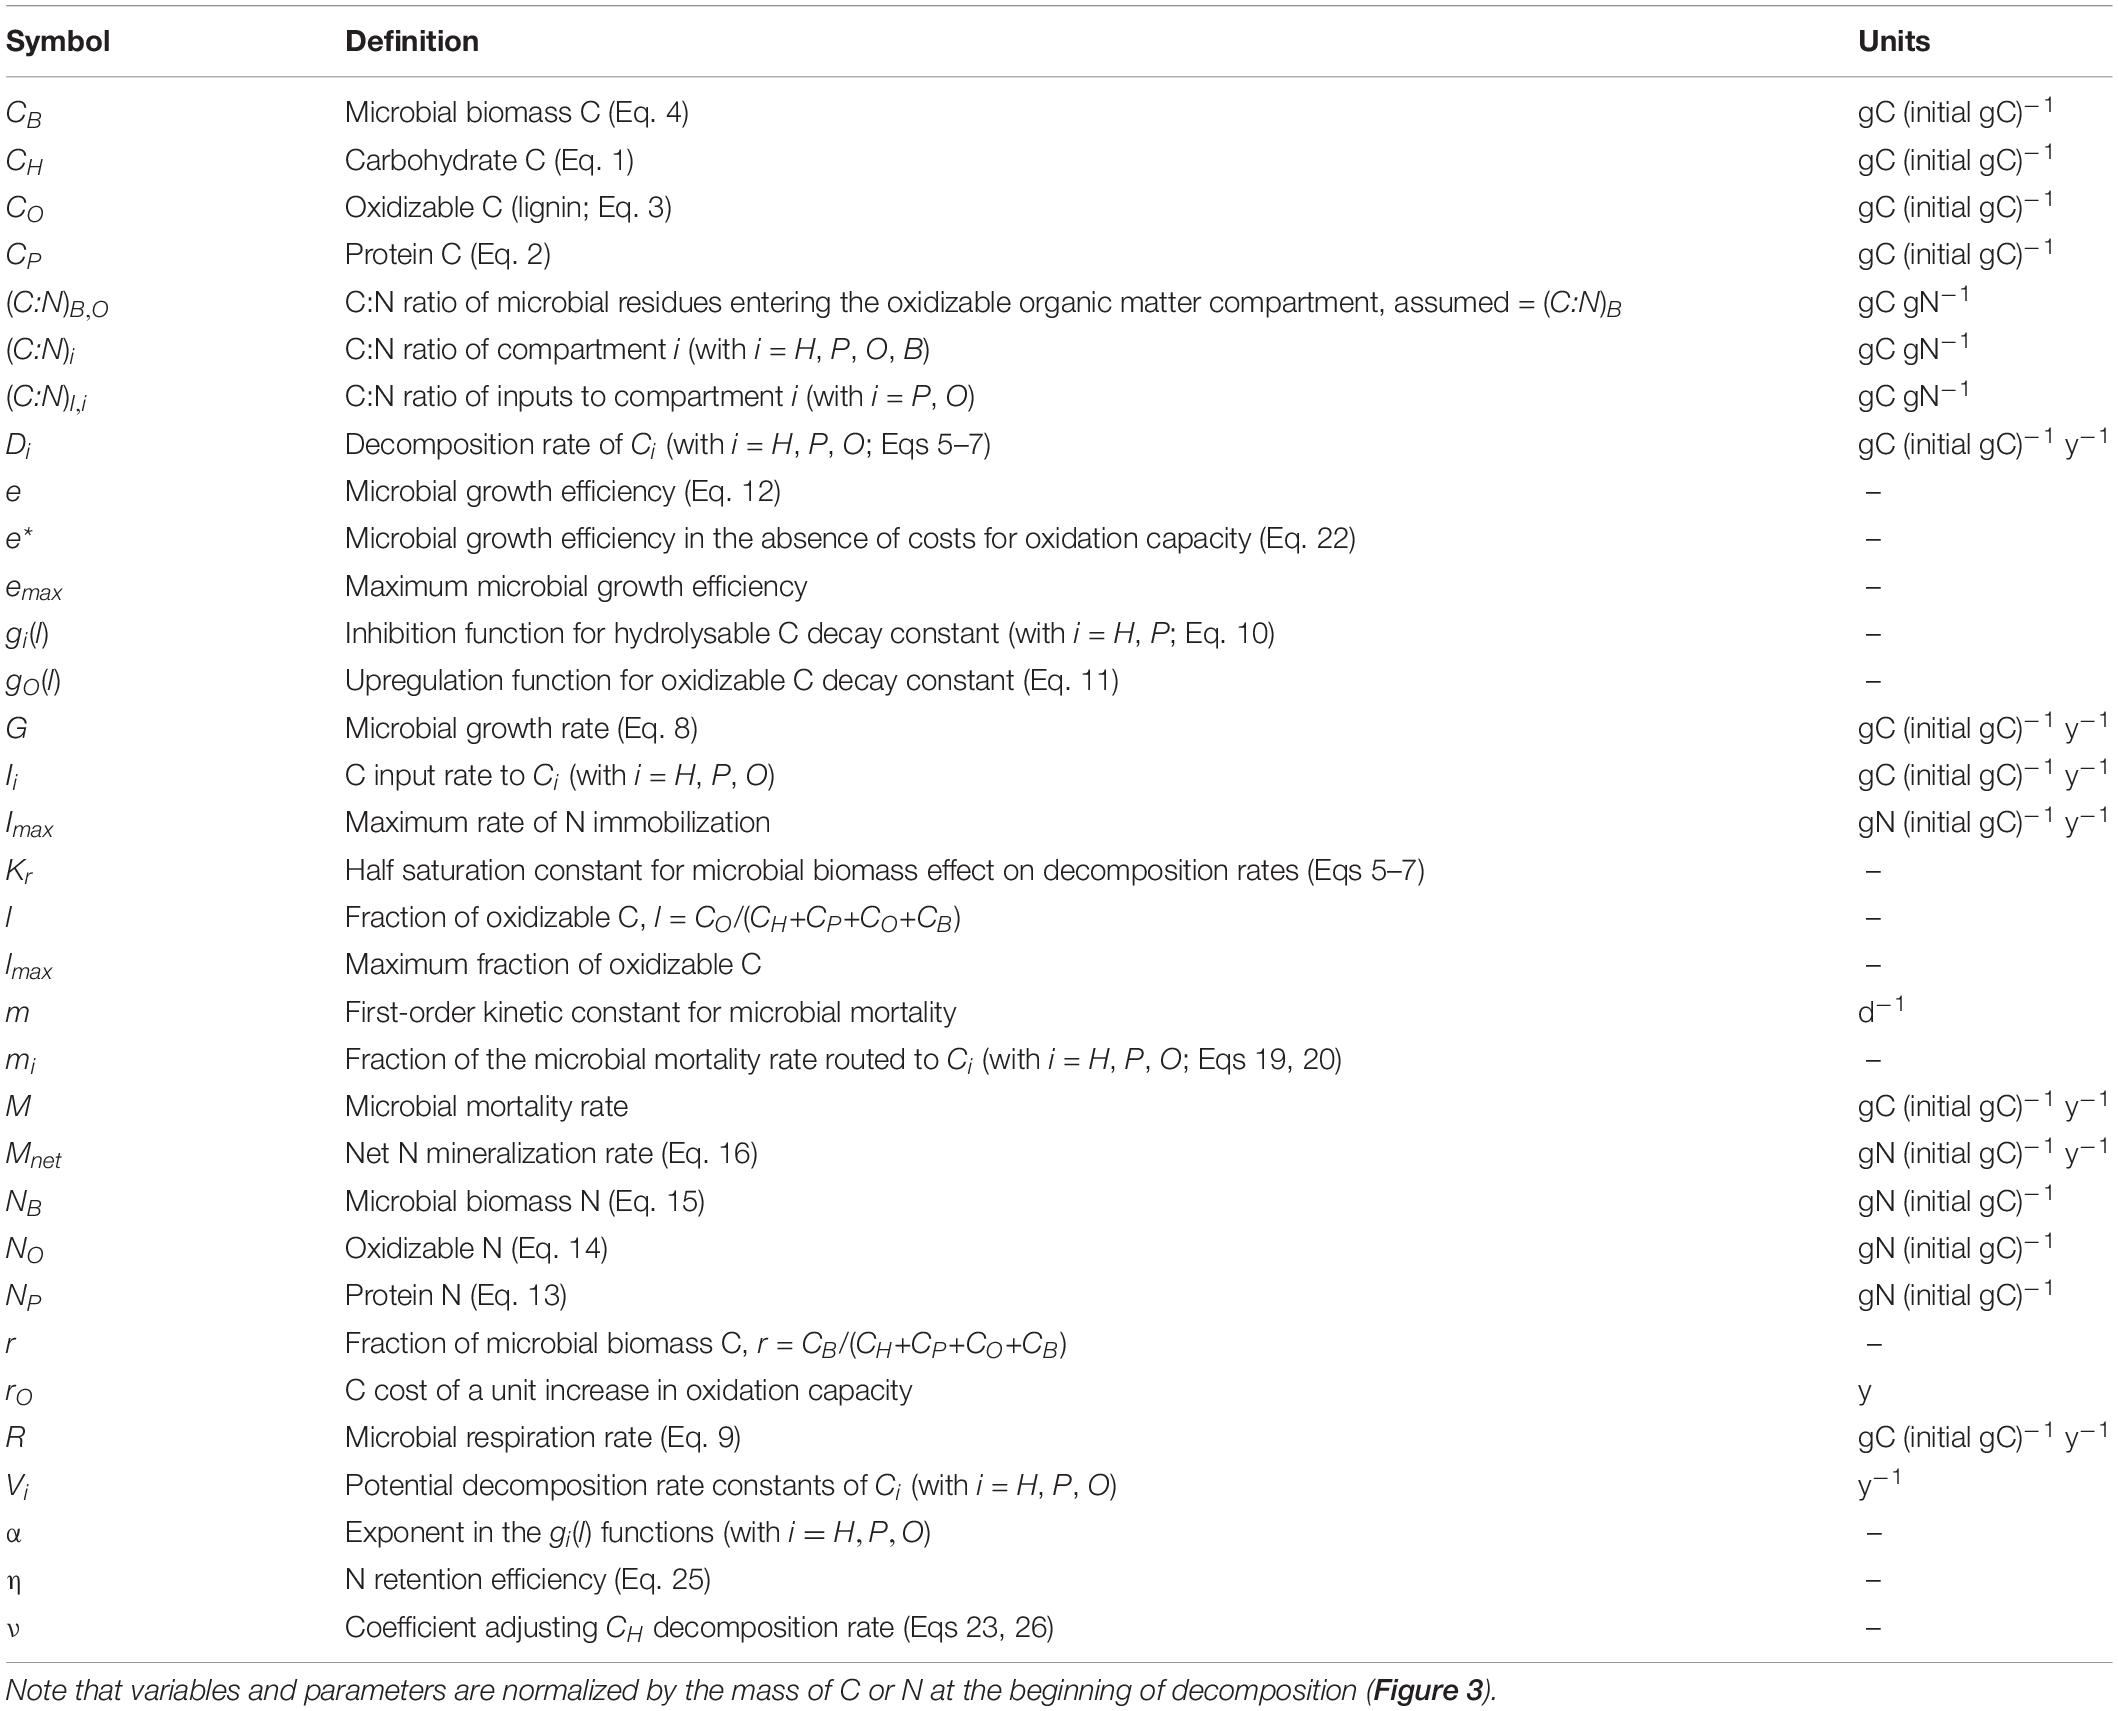
Table 1. Symbol definitions and units.
Carbon Balance Equations
All the substrate pools (CH: carbohydrate C, CP: protein C, CO: oxidizable C) receive inputs from litterfall and root turnover (Ii, with i = H, P, O) and from microbial necromass. The partitioning of necromass to each substrate pool is defined by the fraction mi of the total microbial mortality rate M that reaches that pool; i.e., miM (with i = H, P, O and with the constraint mH+mP+mO = 1). Outputs from the substrate pools are due to decomposition (Di, with i = H, P, O), although only C from CH and CP can be utilized by the microorganisms, whereas products of CO decomposition are expected to be of little utility for microorganisms and lost by leaching or oxidized extracellularly all the way to CO2. The mass balances of the organic C pools are written as:
Microorganisms (CB) convert CH and CP to biomass with a growth efficiency e and die at a rate M,
Carbon Flow Rates
The decomposition rates are defined as linear functions of the substrate being degraded, but they also include non-linear saturation functions of microbial biomass (similar to reverse Monod kinetics),
where Vi (i = H, P, O) are the potential decomposition rates when biomass and oxidizable C are not limiting factors, gi(l) (with i = H, P) is the function reducing hydrolytic enzyme activity when recalcitrant C accumulates (l is the fraction of recalcitrant C in the organic matter, l = CO/(CH+CP+CO+CB)), gO(l) is the function describing the up-regulation of oxidative enzyme activity at high l values, r is the fraction of microbial biomass C in the organic matter pool (i.e., r = CB/(CH+CP+CO+CB)), and Kr is the half saturation constant for biomass fraction. As explained in section “Mode (ii): Selective Enzymes,” the coefficient ν in Eq. 5 decreases in response to N limitation (i.e., carbohydrate degradation is decreased if there is not enough N to convert DH into biomass), but is set to ν = 1 under C limitation.
We do not model extracellular enzyme dynamics explicitly, as the focus is on relatively long-time scales (monthly to decadal) at which we can assume that enzyme content is in quasi-equilibrium and thus adjusts rapidly. This equilibrium assumption implies that enzyme contents are proportional to synthesis rates and inversely proportional to the enzyme decay constant; in turn, if synthesis rates are assumed to scale linearly with microbial biomass, the actual enzyme content will be also proportional to biomass (a result of mathematically setting the mass balance equation for the enzyme pool to zero), allowing us to account for enzyme activity via CB in the decomposition equations. Moreover, microbial biomass fraction (i.e., r) rather than biomass content per se is used in Eqs 5–7. This choice is motivated by the observation that the colonization of the substrate can lead to competition among microorganisms for the substrate. When the biomass fraction increases, both the room for new biomass and the likelihood that an enzyme hits a substrate molecule decrease.
With this model structure, the microbial growth rate is found by summing up the contributions of the carbohydrate and protein compartments,
Similarly, the microbial respiration rate is calculated as,
Microbial mortality is assumed to follow first-order kinetics; i.e., M = mCB.
Effects of Oxidizable Carbon on Decomposition and Microbial Growth
The negative effect of recalcitrant C on the decomposition rates of the hydrolysable C pools is modeled by reducing the potential decay constants VH and VP as the content of CO increases. This effect is implemented through the function gi,
where i = H or P, l is the fraction of recalcitrant C in the organic matter, lmax is the fraction at which the rate constants of hydrolysable C degradation become zero and α is an exponent controlling the curvature of the relation (here assumed equal to two). A similar approach was also proposed by Moorhead et al. (2013) and Margida et al. (2020). While degradation of hydrolysable C is inhibited by high values of l, oxidative capacity is increased according to the function gO,
From a dynamic system perspective, Eqs 10, 11 constrain the fraction of oxidizable C to be lower or equal to lmax, which characterizes the final composition of organic matter.
The microbial growth efficiency e is assumed to decrease with increasing oxidative enzyme capacity VO. This decrease is primarily ascribed to the C cost of producing hydrogen peroxide, which is necessary for the functioning of oxidative enzymes and consumed during oxidative decomposition (Kirk et al., 1976; Shimizu et al., 2005). Thus, if microorganisms invest more in oxidation of CO, the cost of such an investment is accounted for in the reduction of e,
where the cost of oxidative capacity is denoted by rO, and e∗ is the growth efficiency in the absence of this cost. Note that oxidative capacity changes with increasing oxidizable C fraction, so that during decomposition, the associated cost also increases and e decreases.
Under C limitation, we assumed that e∗ attains a maximum value set by substrate energy content and the intrinsic catabolic requirements of the decomposers, e∗ = emax, whereas it can be decreased under N limitation (section “Mode (i): Flexible C-Use Efficiency”). Maintenance respiration is not explicitly modeled, so e is interpreted as an apparent growth efficiency that accounts for maintenance costs (sensu van Bodegom, 2007), and is thus mathematically equivalent to the definition of CUE (ratio of growth over substrate uptake).
Nitrogen Balance Equations
The N balance equations corresponding to Eqs 2–4 (recall that the carbohydrate pool contains only C) can be written as,
where (C:N)I,P and (C:N)I,O are the C:N ratios of the inputs to protein and oxidizable organic matter pools, respectively, (C:N)B,O is the C:N ratio of microbial residues routed to the oxidizable organic matter compartment, (C:N)i (i = P, O, B) are the C:N ratios of the organic matter compartments. The coefficient η in Eqs 14, 15 is the efficiency of N retention at senescence. It is set to η = 0 under C limitation, when necromass is produced with the same C:N ratio as the active microbial biomass (no N retention). However, under N limitation, η becomes larger than zero, indicating that N is preferentially retained in the active biomass and that the C:N in necromass increases (section “Mode (iv): Nutrient Retention”). In Eq. 15, the net N mineralization rate is denoted by Mnet, and it is assumed that N associated with oxidizable organic matter can be taken up by microorganisms (in contrast to CO). This assumption is equivalent to letting microorganisms “mine” N from the oxidizable organic matter (Craine et al., 2007).
If (C:N)B is assumed to be time-invariant, microbial N can be calculated at any time as NB = CB/(C:N)B, making Eq. 15 redundant. Moreover, if we assume that the C:N of inputs to the protein compartment is equal to (C:N)P, also Eq. 13 becomes redundant and at any time NP = CP/(C:N)P. This reduces the total number of ordinary differential equations to solve to five (C balance Eqs 1–4 and a single N balance Eq. 14). However, if (C:N)B is allowed to vary under N limitation (section “Mode (iii): Plastic Microbial Biomass C:N”), six independent equations–including Eq. 15–are to be solved.
Net Nitrogen Mineralization Under Carbon Limitation
The net N mineralization rate is calculated to keep the microbial C:N ratio constant (homeostatic assumption). Imposing a time-invariant C:N ratio implies setting dCB/dt = (C:N)BdNB/dt, which yields,
where the first two terms on the right-hand side represent the available N from organic N sources (protein and oxidizable organic matter compartments), and the third term represents the microbial demand for N (driven by the microbial growth rate; Eq. 8). When the supply of organic N is higher than the demand, net N mineralization ensues and Mnet > 0; in contrast, when the supply is lower than the demand, Mnet < 0, requiring N to be immobilized from the inorganic N pool (as long as inorganic N is available, see section “Nitrogen Limitation: Occurrence and Microbial Responses”). It is also important to notice that η does not appear in Eq. 16 because under C limited conditions η = 0 (see section “Mode (iv): Nutrient Retention”).
Partitioning of Necromass Among Organic Matter Compartments
We calculate how microbial necromass is partitioned among the substrate compartments (coefficients mi, i = H, P, O) based on C and N conservation–the microbial C and N loss rates via microbial mortality must equal the rates of C and N transfer to the substrate compartments. These mass conservation constraints can be formulated as,
Note that in Eq. 18, no N from microbial mortality is transferred to the carbohydrate compartment, which contains only C. However, N is transferred to the protein compartment according to the protein C:N ratio, (C:N)P, and to the oxidizable organic matter compartment based on a specific C:N ratio, (C:N)B,O, which reflects the chemical composition of the oxidizable fraction of microbial biomass. These two equations contain three unspecified coefficients (the mi coefficients) besides the C:N ratios of the substrate compartments, allowing us to express two coefficients as a function of the third one. Using the fraction of oxidizable C in the microbial biomass mO as a coefficient to be calibrated, the other two coefficients are found from Eqs 17, 18 as,
The effect of nutrient retention can be seen in both equations, which depend on η. If all N in mortality is retained, no N will be lost in mortality (η = 1). As a result, no C or N will reach the protein compartment (mP = 0 if η = 1), and only C will reach the oxidizable and hydrolysable organic matter compartments according to the coefficients mH and mO.
Nitrogen Limitation: Occurrence and Microbial Responses
Four alternative resource use modes are considered when N becomes limiting (Figure 1B and Table 2): (i) flexible CUE (section “Mode (i): Flexible C-Use Efficiency”), (ii) selective enzymes (section “Mode (ii): Selective Enzymes”), (iii) plastic microbial C:N (section “Mode (iii): Plastic Microbial Biomass C:N”), or (iv) nutrient retention (section “Mode (iv): Nutrient Retention”). These four modes are implemented by constraining the microbial C:N ratio to a constant value despite inorganic N sources being insufficient to meet the microbial N demand in modes (i), (ii), and (iv), or by allowing the microbial C:N ratio to vary depending on the relative availability of C and N in mode (iii). In modes (i) and (iii), the coefficient ν is set to one, whereas under N limitation in modes (ii) and in some cases also in mode (iv), ν < 1. In modes (i) to (iii), the N retention efficiency η = 0, indicating that microbial C and N loss rates via mortality are coupled according to the microbial C:N ratio; when under N limitation microbial N is retained more efficiently than C, η can increase.
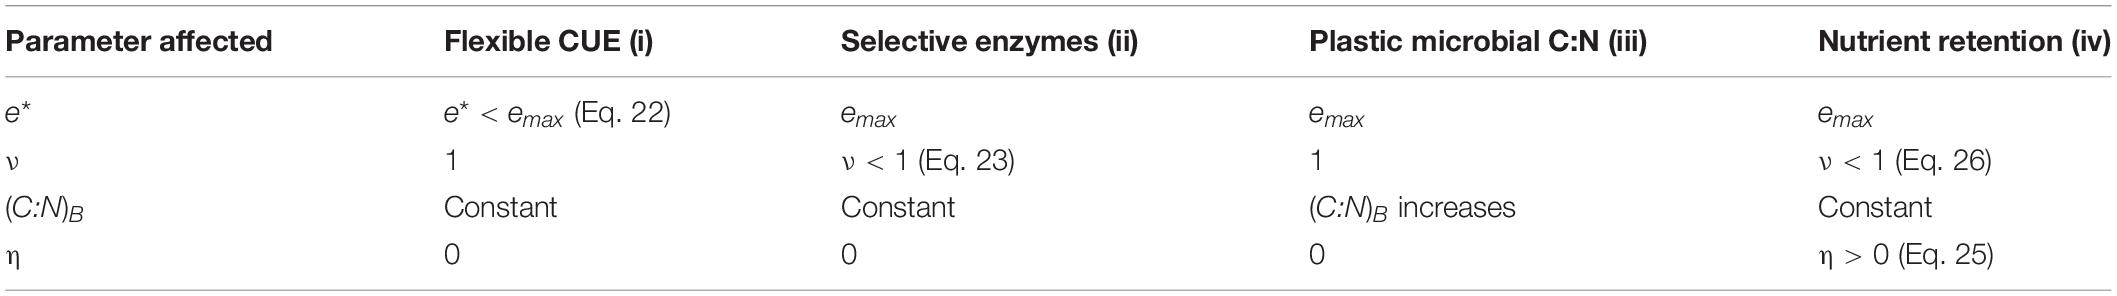
Table 2. Summary of model implementation of the four resource use modes, and changes of model parameters when microorganisms are N limited (see also Figure 1B).
To proceed, the conditions under which N limitation occurs must be defined. When the organic N supply to microorganisms is lower than their N demand, Eq. 16 provides the rate of net N immobilization that would compensate this imbalance and allow microorganisms to maintain a constant C:N ratio. This potential net N immobilization rate, however, may not be met if inorganic N supply is limited to a lower rate Imax. Thus, when the condition
is verified, microbial growth switches from being C limited to being N limited.
Mode (i): Flexible C-Use Efficiency
Under N limitation, microbial growth has to be adjusted to the amounts of N that organic matter decomposition and inorganic N immobilization (i.e., Imax) supply to the microbial biomass. Slowing microbial growth by reducing e∗ is one possible mechanism (recall that G depends on e, Eq. 8). Mathematically, the value of growth efficiency under N limitation is found by matching N demand and inorganic N immobilization in Eq. 21 and solving for e∗,
The value of e∗ defined by Eq. 22 maintains microorganisms under conditions of C and N co-limitation, thus maximizing their growth rate for given N availability from organic and inorganic sources.
Mode (ii): Selective Enzymes
To balance resource uptake when confronted with low N availability, microorganisms can decrease the synthesis of hydrolytic enzymes that degrade C-rich carbohydrates, resulting in lower activity of these enzymes and lower C uptake rate from the CH pool. In turn, lowering carbohydrate uptake decreases microbial growth and thus N demand, while maintaining N supply from NP and NO. The activity of hydrolytic enzymes for C acquisition is modeled by adjusting the coefficient ν in the decomposition rate DH (Eq. 5) when N is limiting (otherwise, ν = 1). Specifically, the value of ν that reduces DH to the point of balancing N demand and N supply is found as before by equating N demand and N immobilization in Eq. 21, recalling Eq. 5, and solving for ν,
While lowering growth efficiency increases respiration at the expense of C stocks, lowering carbohydrate decomposition at constant growth efficiency maintains C in the organic matter substrates; therefore, modes (i) and (ii) have different consequences at the decomposition system level.
Mode (iii): Plastic Microbial Biomass C:N
As a third alternative to cope with N limitation, we consider the possibility that microorganisms adjust their cellular composition, by increasing their C:N ratio to lower N demand. This process is implemented by allowing the C:N ratio of microbial biomass to vary as a function of the external N supply (i.e., Imax) under N limitation. In practice, plasticity is achieved by setting Mnet = −Imax (N limitation condition) and solving Eqs 4, 15 independently through time. When a higher amount of C is taken up relative to N early during decomposition, the microbial C:N increases, while at the end of the N limitation phase, higher N inputs than required reduce microbial C:N. For simplicity, and in contrast to other models (e.g., Sistla et al., 2014), we did not set any upper limit to microbial C:N, as that would have required switching to another resource use mode.
A plastic microbial biomass C:N ratio has implications for the definition of net N mineralization and microbial N recycling to the substrate compartments. In fact, the partition coefficients mP and mH (Eqs 19, 20) depend on (C:N)B to ensure that all the C and N flows remain balanced, and (C:N)B under this scenario varies through time. Moreover, the effect of higher microbial C:N ratio under N limitation leads to long-term consequences. In fact, when N limitation ends, microbial C:N slowly transitions back to the C:N ratio under C limitation, which will be attained only at equilibrium.
Mode (iv): Nutrient Retention
Microorganisms can also adapt to low N availability by selectively retaining N at senescence. This is equivalent to the release of extracellular polysaccharides upon cell death combined with reallocation of N to living cells. Selective N retention under N limitation is modeled by letting the N retention efficiency η increase from zero under C limitation to a maximum of one. Assuming conditions of N limitation (i.e., Mnet = −Imax), we can express the constraint that microbial C:N ratio is time-invariant (i.e., dCB/dt = (C:N)BdNB/dt) as,
.
Solving for η we find,
With decreasing organic N availability (second term in the numerator of Eq. 25), η increases. However, at most, an amount of N per unit time equal to M/(C:N)B can be recycled internally, corresponding to η = 1. Thus, under strong N limitation, the N retention mechanism may not suffice to compensate for stoichiometric imbalances, requiring another mechanism to keep microbial C:N stable. We assumed that under such conditions the rate of uptake of carbohydrates is decreased by reducing ν, similar to mode (ii). To calculate how much ν is reduced in Eq. 5, we set η = 1 in Eq. 25 and solve for DH first and then for ν,
Interestingly, this solution is equivalent to that in Eq. 23 except for the term M/e that accounts for the fact that no N is allowed to be lost in mortality. The limit η = 1 (complete N recycling) is probably not realistic, but relaxing this assumption would only lead to switching to mode (ii) at lower substrate C:N, thus not significantly affecting the model outputs.
Model Parameterization
The model was parameterized to describe decomposition of single leaf litter cohorts, as measured in litterbag studies (Table 3). In these studies, inputs of organic matter are assumed negligible (i.e., IH = IP = IO = 0), but the system is open to CO2 release and exchanges of inorganic N, even though N immobilization is constrained by external availability. Initial conditions for all the variables in our model were calculated based on the measured initial litter chemical composition, which included total C, total N, and Klason lignin contents (the latter corresponding to our CO pool), and assuming initial protein and decomposer biomass C fractions of 0.02 and 0.001, respectively. We also assumed that (C:N)P = 4 and (C:N)B = 11 (Manzoni et al., 2017). With this information, we could determine the initial CH by difference (total C - CO - CB - CP). Next, the initial NP and NB were calculated as CP and CB divided by their respective C:N, and finally, the initial NO was found as total N - NP - NB.
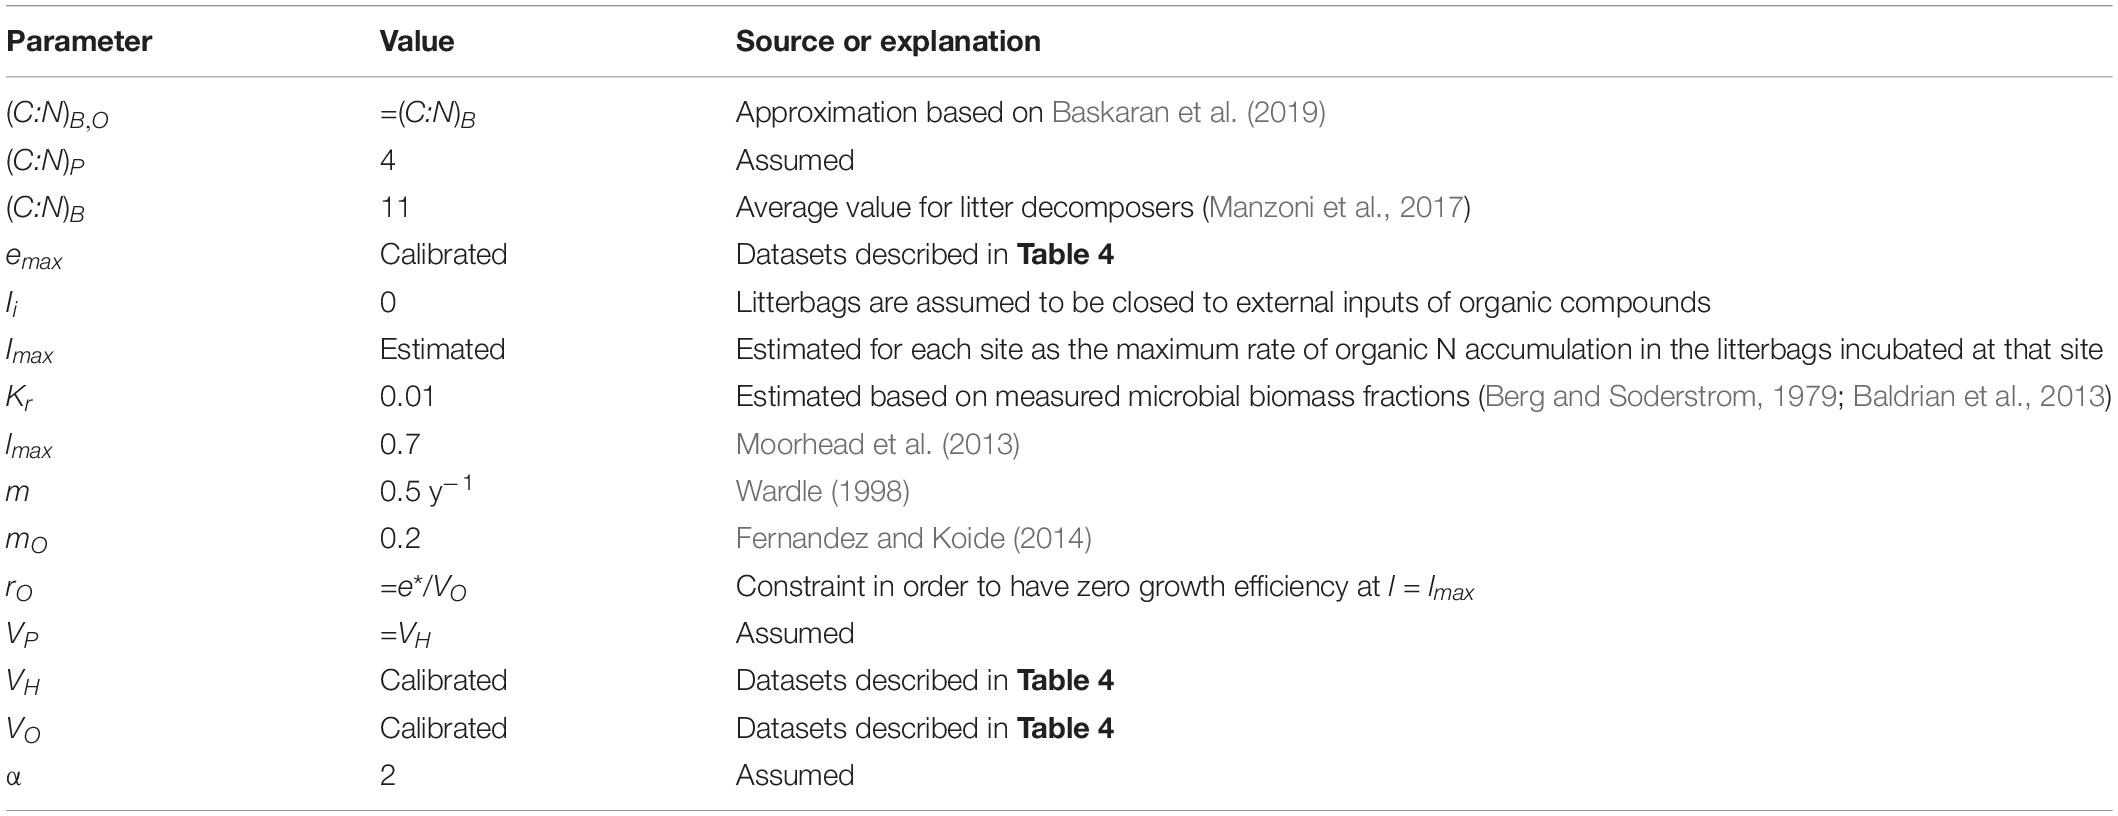
Table 3. Values of model parameters and their sources.
It can be argued that decomposer communities are adapted to grow between substrate limitation and self-regulation. If this is the case, the half-saturation constant Kr regulating the microbial fraction effect on decomposition can be estimated as the long-term mean biomass fraction during decomposition. In the forest floor or at intermediate stages of decomposition, the microbial (fungal) fraction is in the order of 0.01 (Berg and Soderstrom, 1979; Baldrian et al., 2013), whereas in decomposing litter under laboratory conditions it can range between 0.01 and 0.1 (from nutrient poor to nutrient rich litter) (Voriskova et al., 2011). Based on the field estimates, we thus selected Kr = 0.01.
The microbial mortality rate constant is set to m = 0.5 y–1 (based on Figure 3 in Wardle, 1998). This values is lower than more recent turnover rate estimates for forest soils (Spohn et al., 2016a), but it captures the long residence time of microbial C in inactive biomass. The partitioning coefficient mO is the recalcitrant fraction of microbial biomass, estimated as 20% (5–15% melanin; see Fernandez and Koide, 2014). The C:N ratio of these residues is in turn estimated by first assuming that about 25% of microbial necromass N is recalcitrant (Baskaran et al., 2019); it follows that . This estimate is also consistent with reported C:N ratios for melanins between 6 and 11, though allomelanins, which are common in fungi, contain no N (Huang et al., 2018). Therefore, considering the large uncertainties, it seems appropriate to approximate (C:N)B,O ≈ (C:N)B. As a result, using Eqs 19, 20 with mO ≈ 0.2 yields mP ≈ 0.3 and mH ≈ 0.5. These fractions, however, may change according to Eqs 19, 20 when (C:N)B is plastic, as in mode (iii).
The cost of maintaining oxidative enzymes rO is estimated assuming that microbial growth efficiency is zero when the oxidizable C fraction reaches the maximum level lmax, leading to rO = e∗/VO. With this parameterization, microbial growth rate can be also expressed as e = e∗[1 − gO(l)]. This assumption is conceptually equivalent to considering a “negative” efficiency (i.e., a C cost) associated with decomposition of oxidizable C, as in Moorhead et al. (2013).
The value of Imax incorporates any inorganic N input to the litter system, including atmospheric N deposition, N throughfall from the canopy, and import of external N through fungal hyphae. To account for all these inputs, we adopted a data-driven approach–Imax was estimated for a given site as the mean value of the maximum measured rate of N accumulation in each litter type incubated at that site.
Litter Decomposition Data
Litter decomposition data were obtained from four studies in which mass loss, as well as N and oxidizable C (acid-insoluble residue, hereafter referred to as lignin) contents were reported; climatic conditions and litter chemical characteristics for these studies are summarized in Table 4 (more details are provided in the original sources). Raw data from the Malaysian and Japanese sites were provided by Prof. T. Osono; data from Berg and McClaugherty (1989) are available in the Depository of Unpublished Data associated with that paper (CISTI, National Research Council of Canada, Ottawa, Ont., Canada KIA OS2). Unless reported in the original sources, a 50% C content (on a dry mass basis) was assumed. Moreover, the C fractions and dry weight fractions of oxidizable material were assumed to be equal (i.e., we assumed similar C contents in all litter compounds). To calibrate the four model variants, we normalized total C, total N, and oxidizable C by the respective values at the beginning of the litterbag incubations. As a result, all variables (as well as model predictions and errors) are non-dimensional and presented as fractions of initial values. Oxidizable C and total N fractions can be larger than one when net accumulation of these compounds occurs.
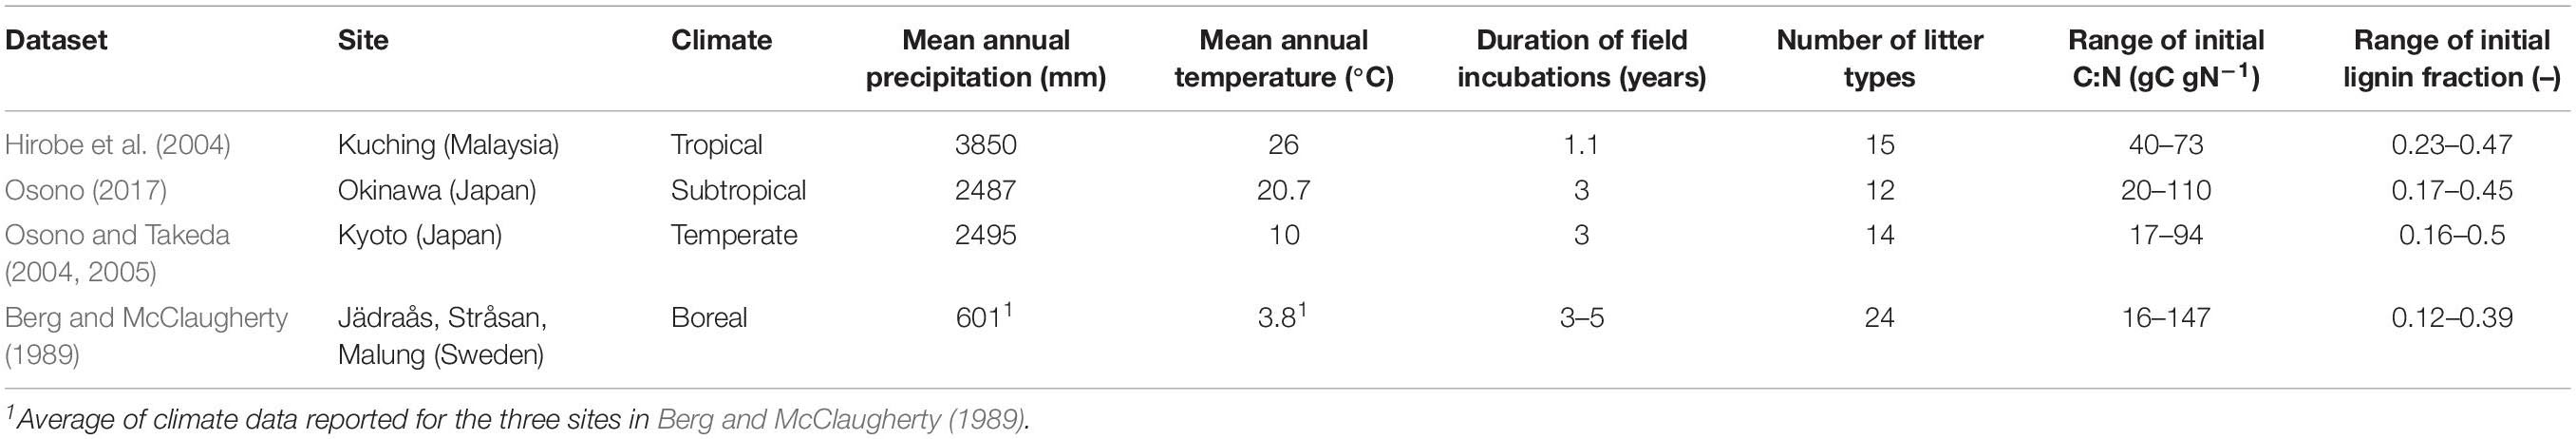
Table 4. Description of the litter decomposition datasets.
Litter data were screened to detect faster N release compared to C loss, indicating N leaching, which was not modeled (following the approach by Manzoni et al., 2010). If the first value of fraction of remaining N mass was lower than that of C; i.e., N1/N0 < C1/C0, we assumed that N leaching was occurring. Additionally, the data was also screened for rapid loss of initial C, again as a result of leaching (setting a threshold C1/C0 < 0.7). If either of these two conditions were satisfied, we removed the first measurement point and renormalized the data starting from the second point prior to model parameter estimation.
Mass Balance Solution and Parameter Optimization
To solve the mass balance Eqs 1–4 and 13–15 (for each of the resource use modes), we used both the solver NDSolve in Wolfram Mathematica 12.0.0.0, and an in-house developed script written in MATLAB R2020a based on a finite difference scheme and Picard iteration. Results from the two approaches were cross-validated to ensure consistent results. The Mathematica script was used to produce Figures 2–4 and the MATLAB script for calibration and to produce the remaining figures. For parameter optimization, we used the lsqcurvefit function, which finds the best fitted parameter using a least-square error approach.
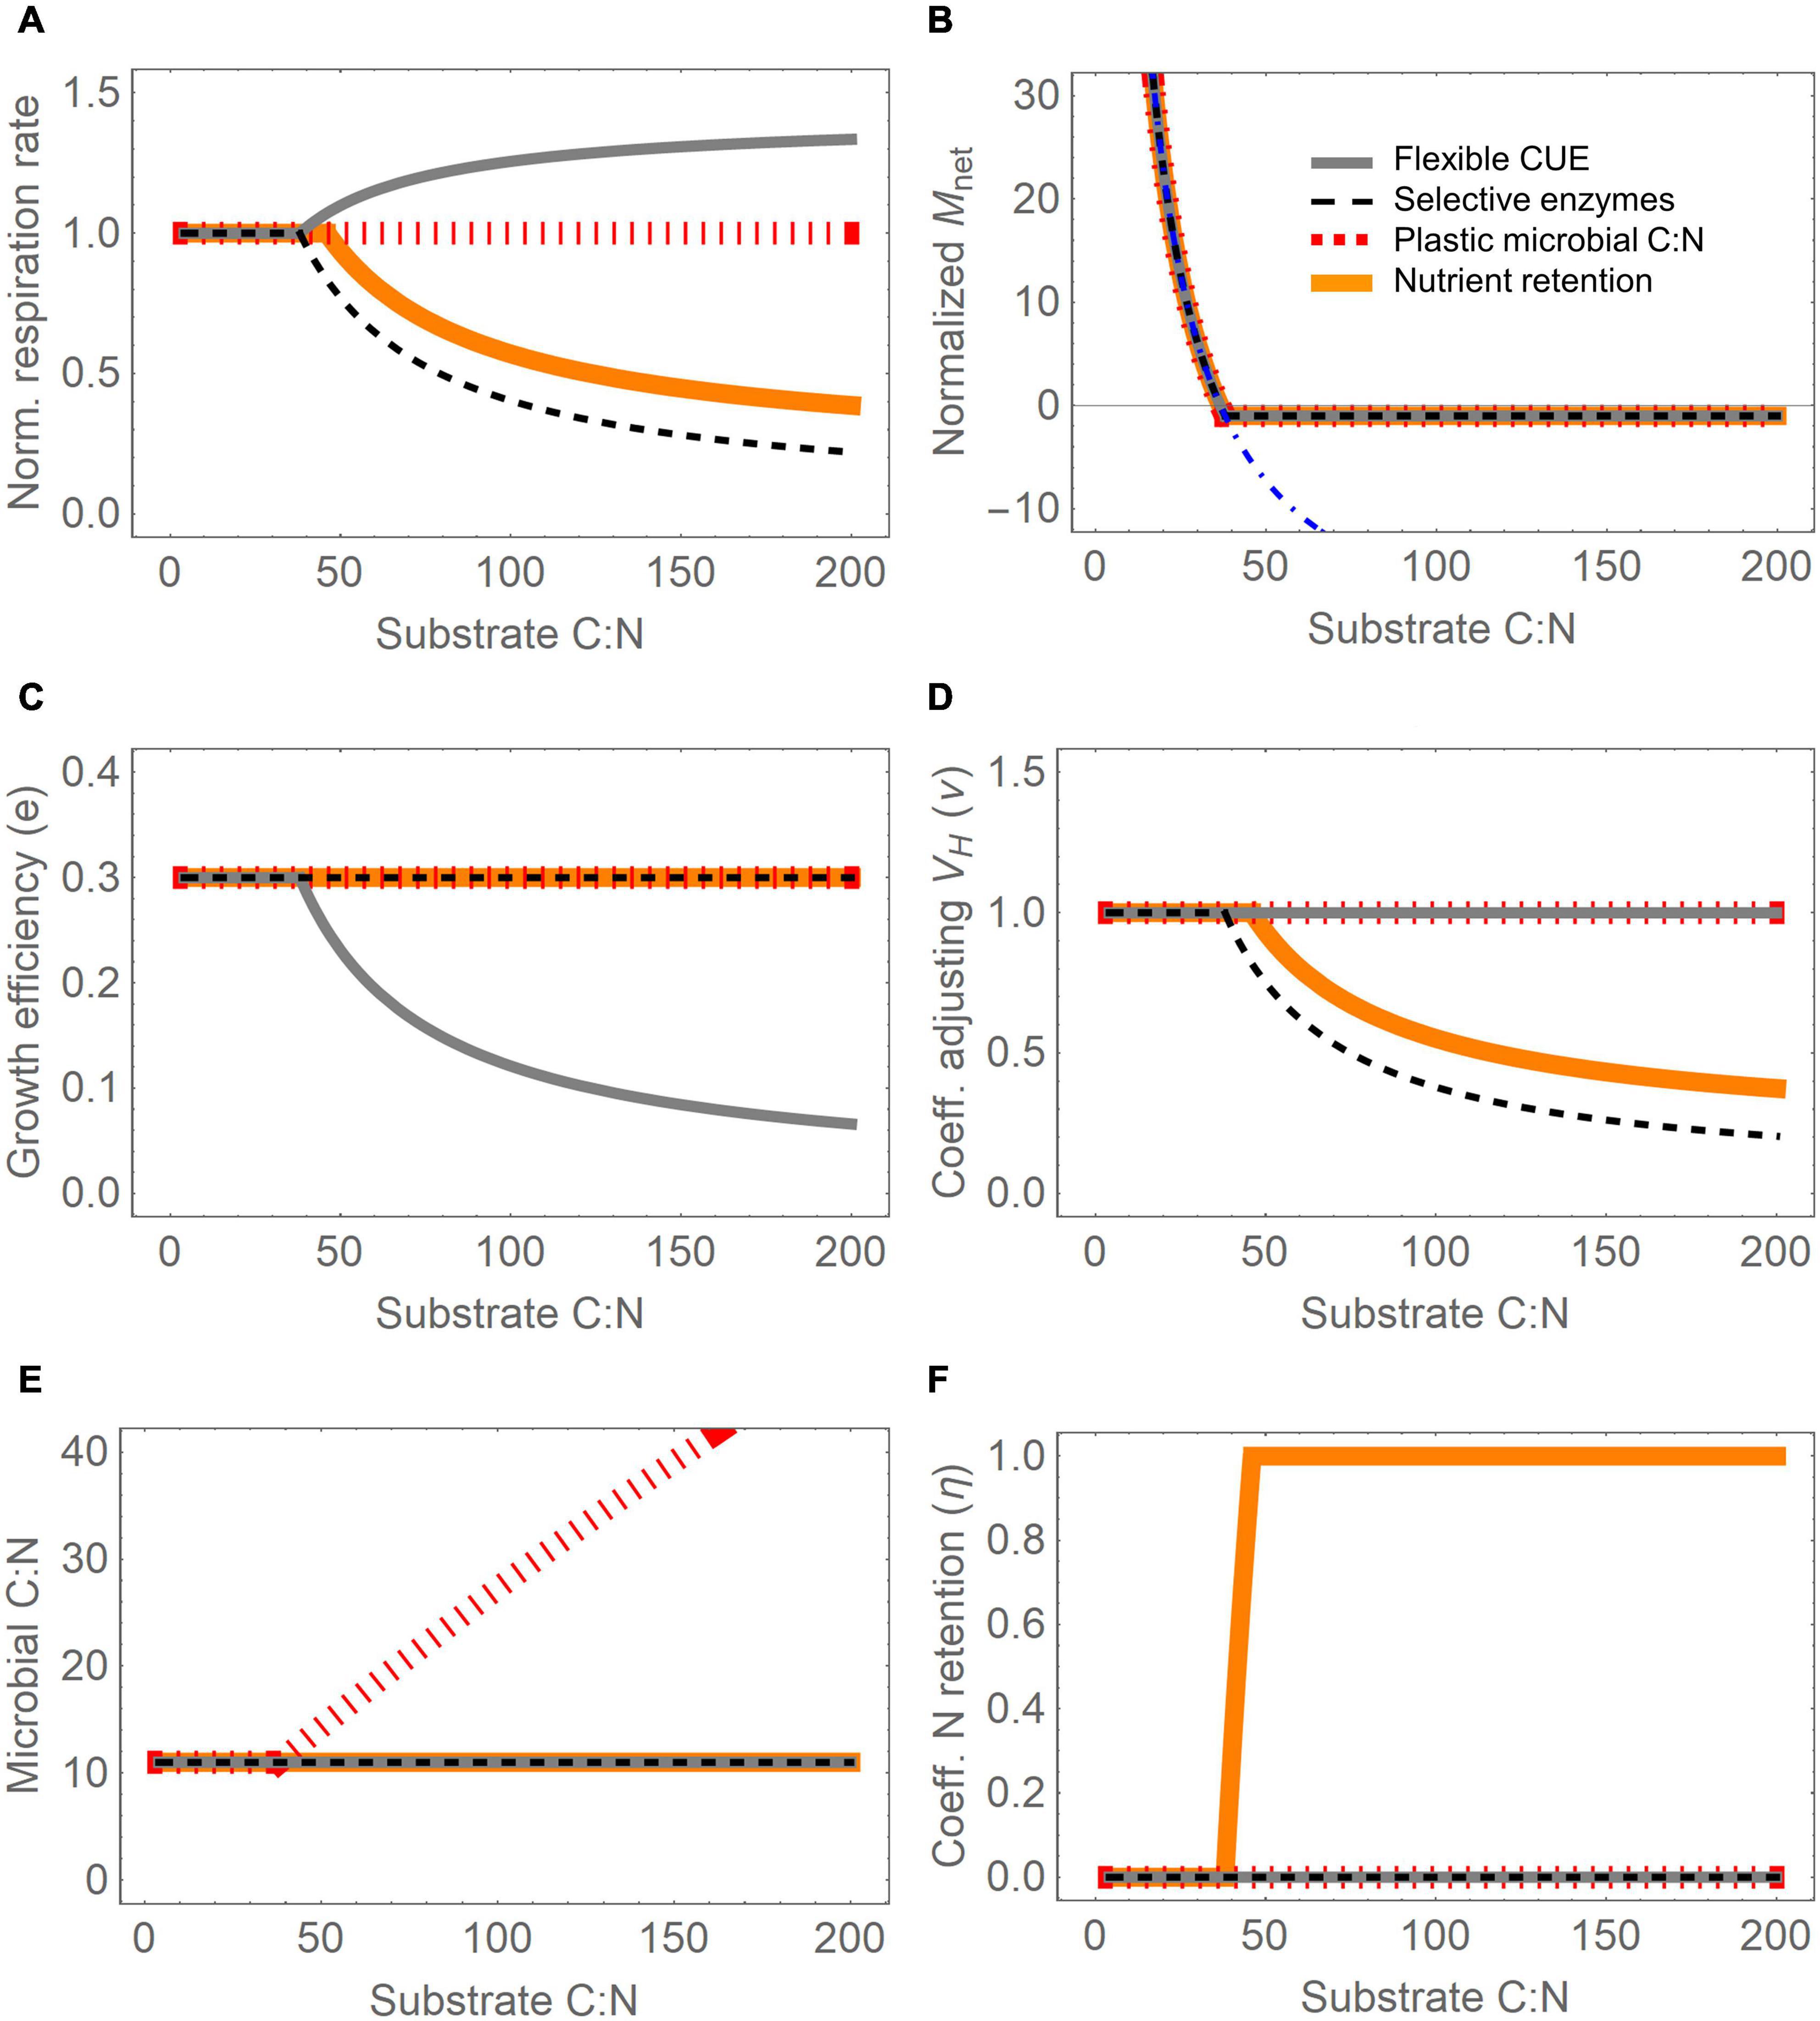
Figure 2. Effect of four resource use modes (different line styles) for varying substrate C:N ratio on: (A) total microbial respiration rate (normalized by the C-limited respiration rate), (B) net N mineralization rate, Mnet (normalized by the maximum immobilization rate, Imax), (C) growth efficiency (Eq. 22), (D) coefficient adjusting CH decomposition rate, ν (Eq. 23), (E) microbial biomass C:N ratio at equilibrium (obtained by combining Eqs 4, 15), and (F) N retention efficiency, η (Eq. 25). Variations in substrate C:N are imposed by increasing the fraction of carbohydrates from 2 to 98% (lowest and highest C:N on the abscissa, respectively), assuming no oxidizable compounds are present; microbial biomass C is fixed to 1% of the total organic C. In panel (B), the dot-dashed blue curve shows the net N mineralization rate under C limitation. Parameter values are reported in Table 3, except for emax = 0.3, Imax = 0.004 gN (g initial C)–1 y–1, VH = 4 y–1, and M = 0.2 g C (g initial C)–1 y–1. Note that in most panels several lines overlap, especially under C limitation.
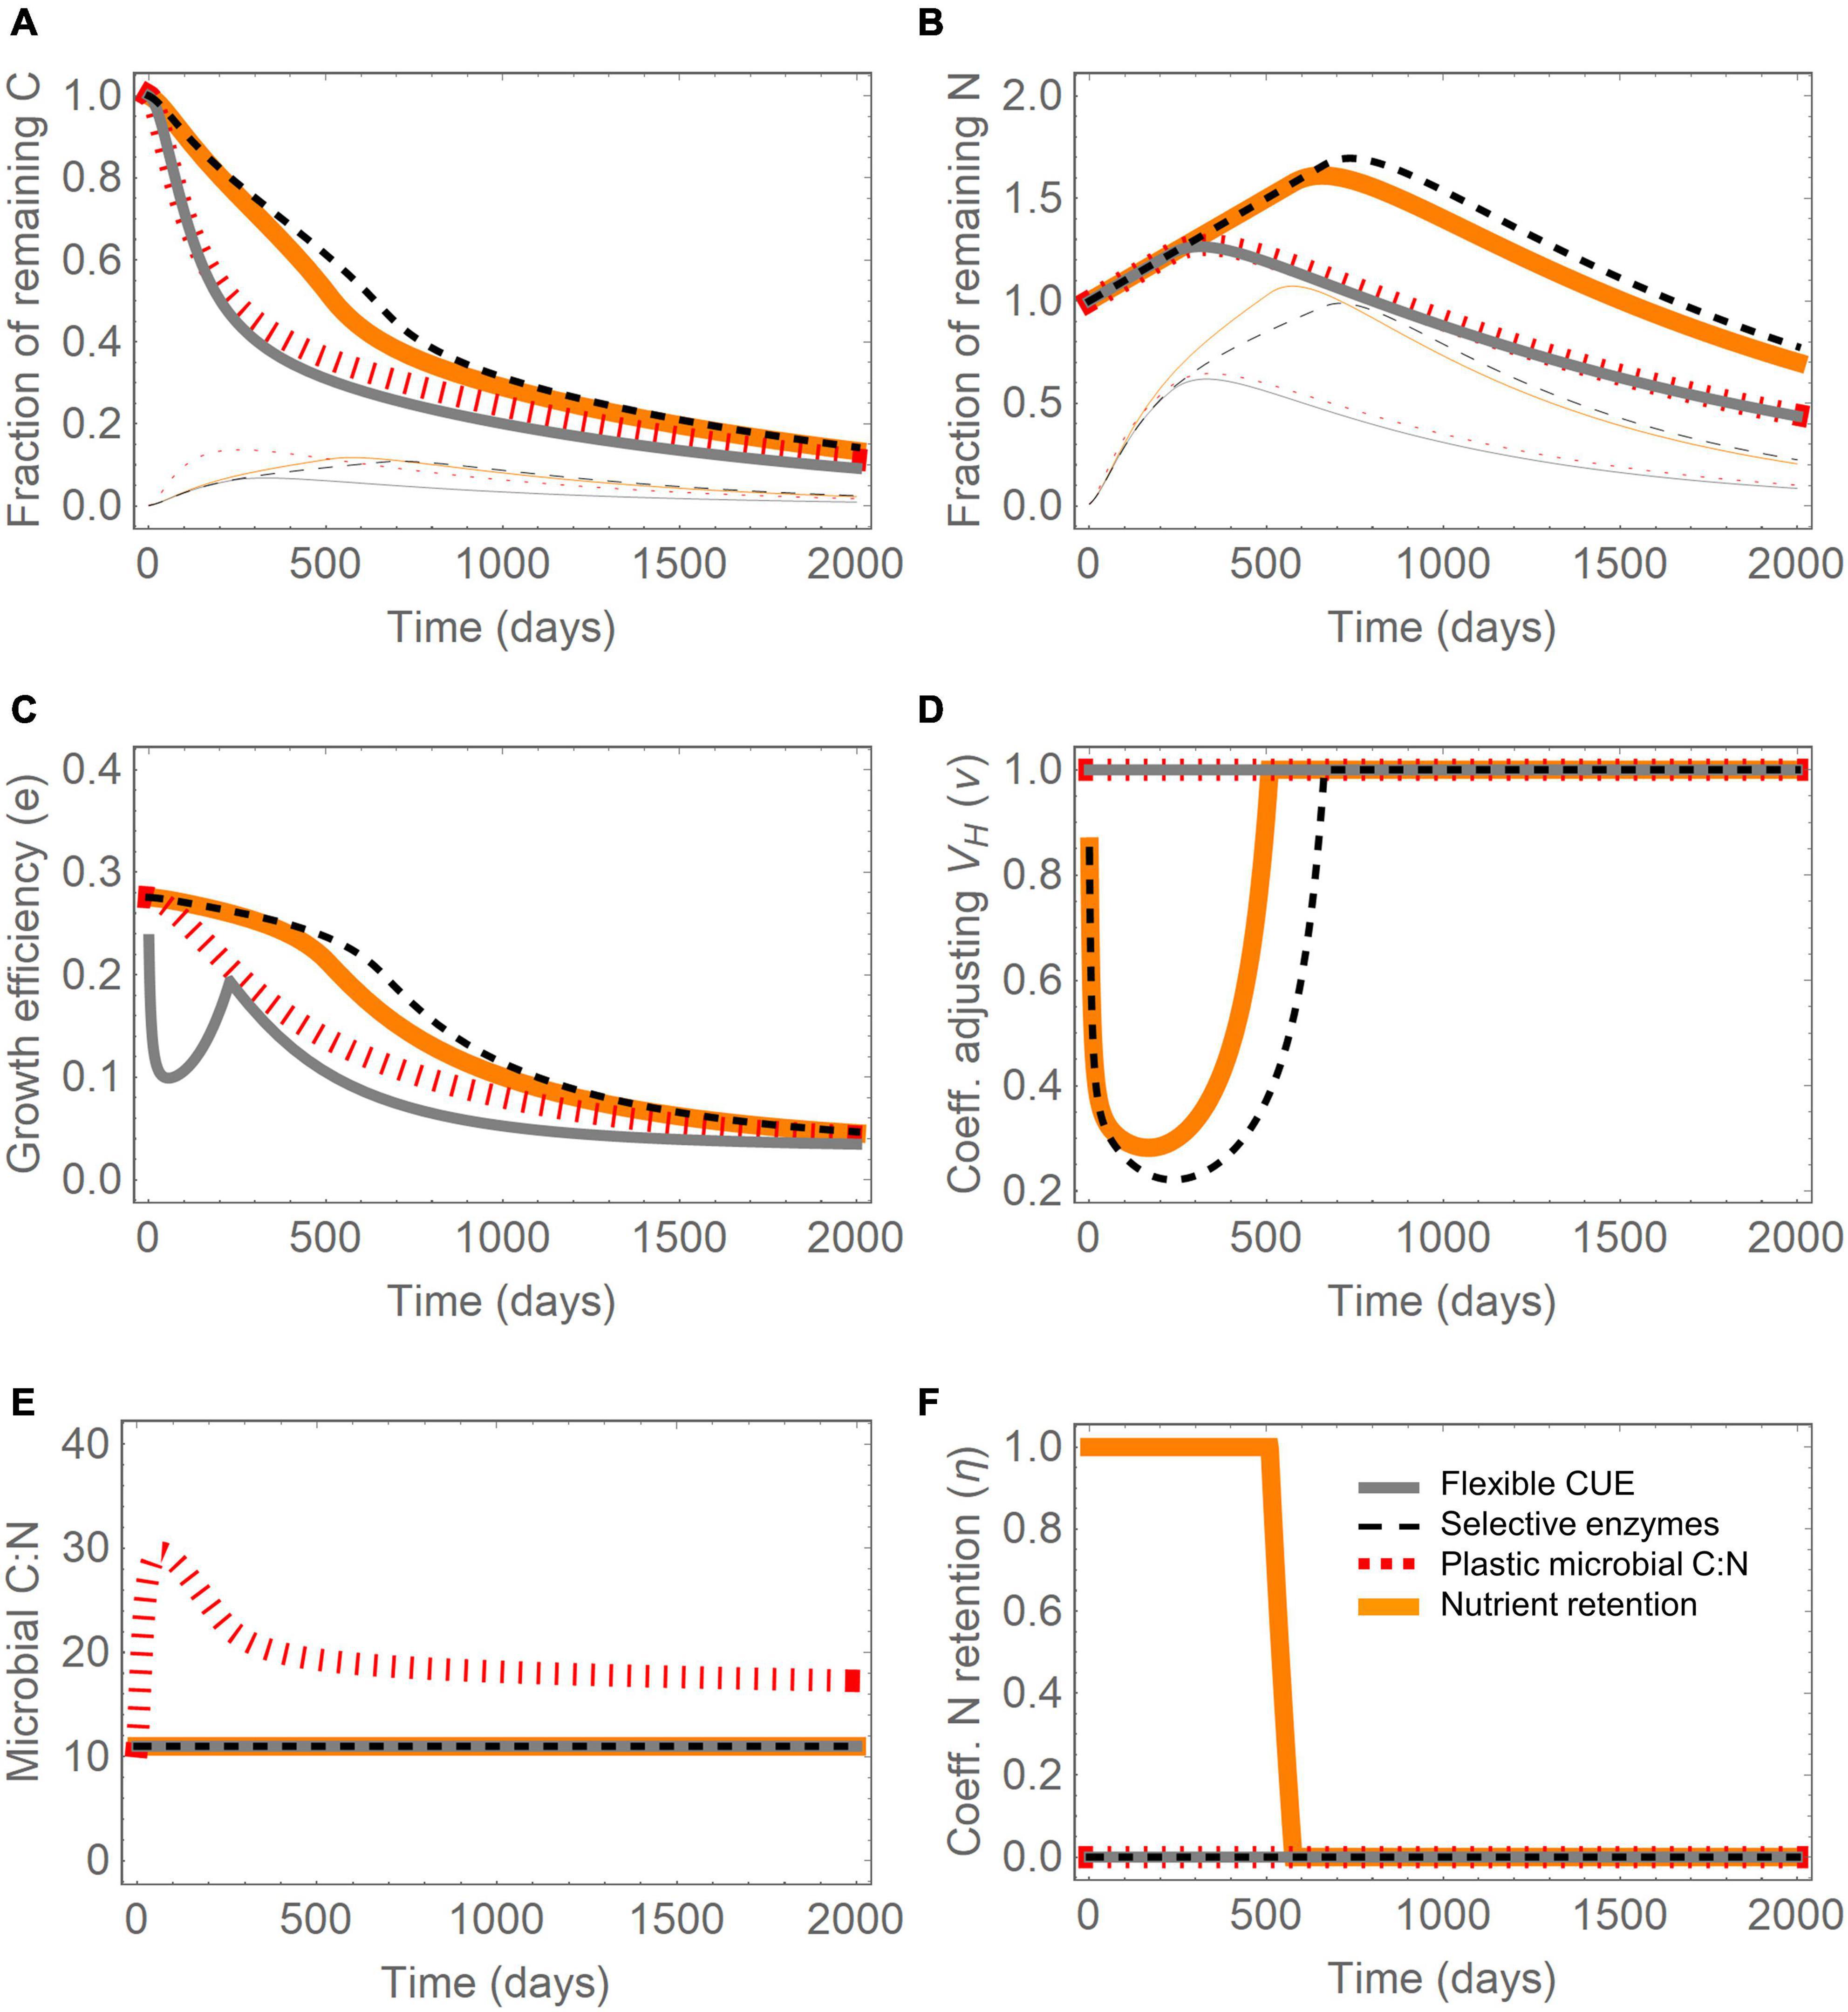
Figure 3. Effect of four resource use modes (different line styles) during decomposition of plant residues: (A) fraction of remaining C (thick lines: total, thin lines: microbial biomass fraction), (B) fraction of remaining N (thick lines: total, thin lines: microbial biomass fraction), (C) growth efficiency (Eq. 22), (D) coefficient adjusting CH decomposition rate, ν (Eq. 23), (E) microbial biomass C:N ratio, and (F) N retention efficiency, η (Eq. 25). Initial conditions (normalized by the total initial C): CH(0) = 0.78, CP(0) = 0.02, CO(0) = 0.20, CS(0) = 10–3; initial N contents are obtained by imposing (C:N)P = 4, (C:N)B = 11, and determining (C:N)O = 41 from a total litter C:N = 100. Parameter values are as in Figure 2. Note that in most panels several lines overlap, especially under C limitation.
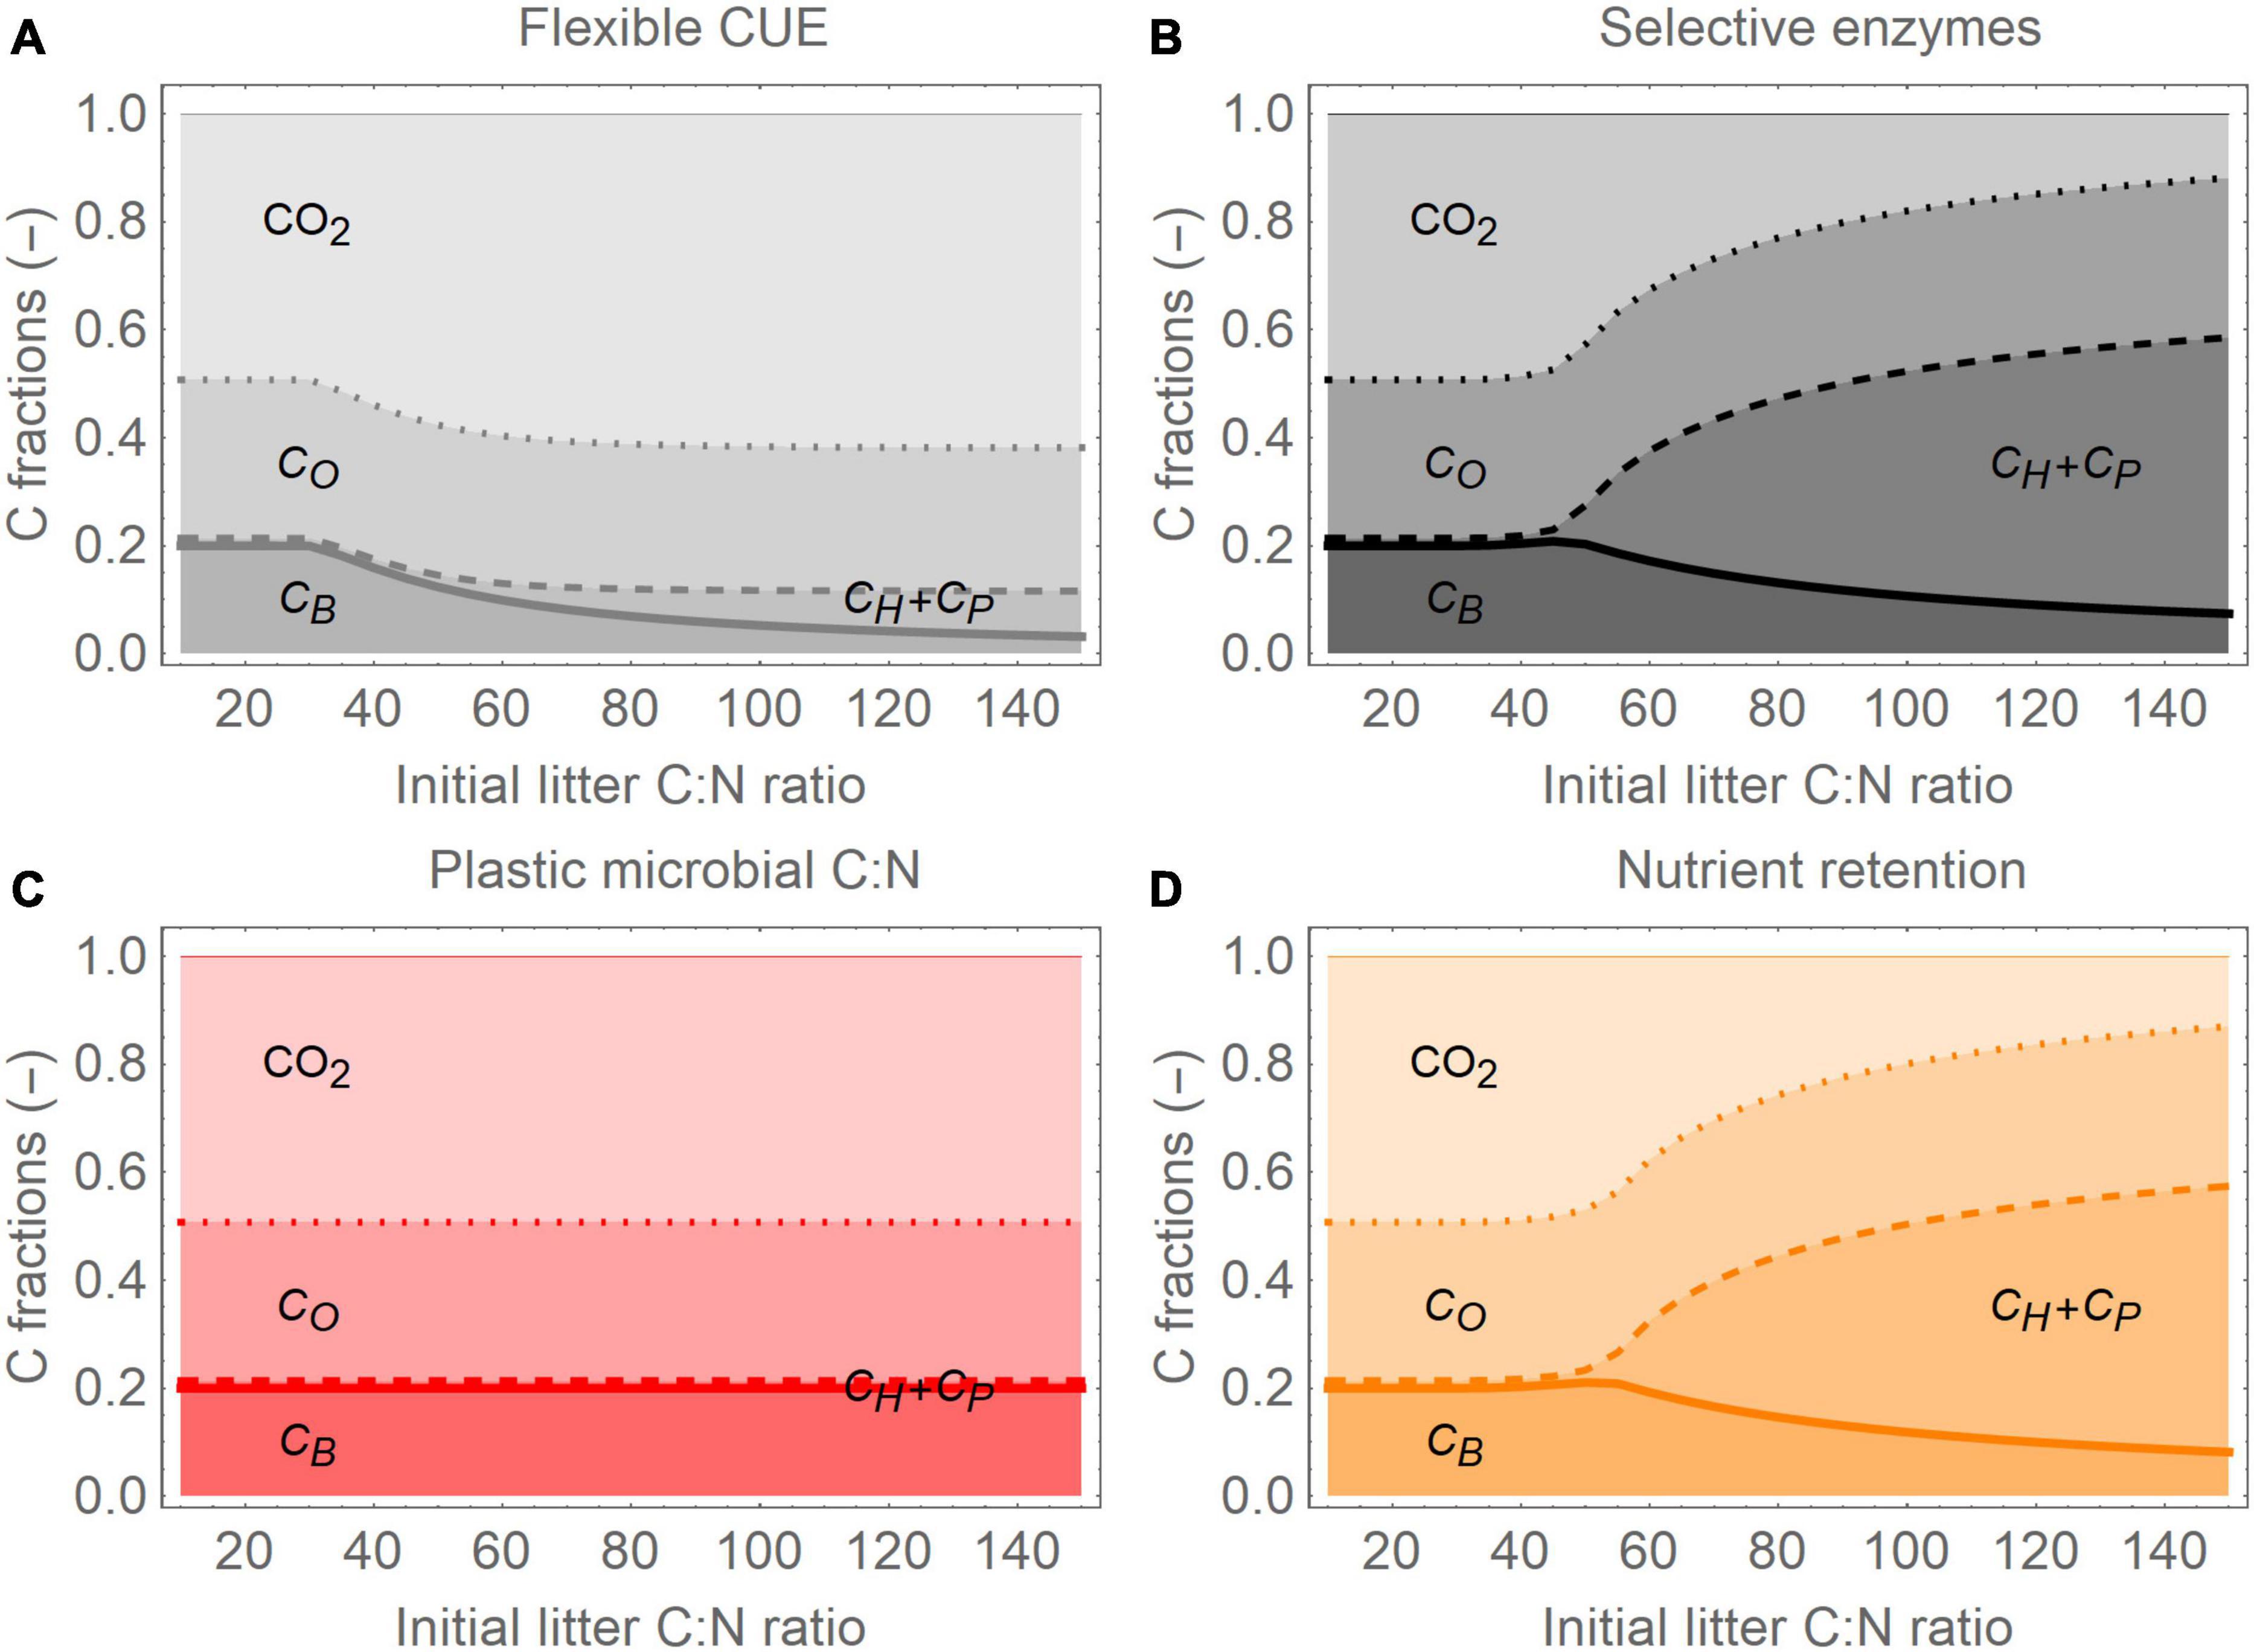
Figure 4. Partitioning of C among litter components and CO2 (including microbial respiration and the products of CO decomposition) when the initial litter C:N ratio is varied, for the four resource use modes, 1 year after the start of the incubation: (A) flexible CUE, (B) selective enzymes, (C) plastic microbial C:N ratio, and (D) nutrient retention (color scheme as in Figures 2, 3). The total litter C:N is varied, but protein and microbial C:N are fixed, so that moving left to right on the abscissa is equivalent to increasing the initial carbohydrate fraction from 0.3 to 0.7, and decreasing the protein fraction from 0.4 to nearly zero. For clarity, carbohydrate and protein C are combined into a single C fraction, CH+CP; parameter values and initial conditions are as in Figure 3, except total litter C:N, which is varied along the abscissa.
After estimating most model parameters from independent sources (Table 3), the parameters VH, VO, and emax were left for calibration. These parameters should capture three key and independent features of the decomposition process: the kinetics of degradation in the early and late phases of decomposition (respectively VH and VO) and microbial metabolism (emax). Therefore, with this choice of calibration parameters, we did not expect equifinality issues. Moreover, VH was constrained to be higher than VO, and all parameters were constrained within meaningful ranges (0–11 y–1 for the rate constants and 0.05–0.8 for emax).
Two calibration approaches were used: a “local calibration” in which the three parameters were calibrated independently for each litter type, and a “global calibration” in which they were calibrated once for all litter types at each of the four sites. Model variants were calibrated using all available data in each litter dataset; i.e., the time series of fractions of initial C, N, and lignin. Our goal was to compare the performance of model variants based on different assumptions on resource use by decomposers. Thus, we did not attempt to explain inter-site variability, but rather analyzed the four sites separately, acknowledging that they are intrinsically different due to contrasting ecological, edaphic, and climatic factors.
Model performance was evaluated with root mean square error (RMSE) and coefficient of determination (R2), calculated from all data used for parameter estimation, or only for a subsection of the data–only the fraction of remaining C, N or lignin. Comparisons were performed for all litter types and for only those litter types that exhibited N limitation (where the resource use modes were activated). Performances can be compared without accounting for different degrees of freedom across model variants because they all have three calibration parameters. When using the local optimization approach, a Kruskal–Wallis test was performed to assess if the median R2 values for any given site differed among models with different modes at play (R2 values are not normally distributed), and a two-way ANOVA was used to compare the mean RMSE among modes and sites. The Kruskal–Wallis test was also used to compare the median values of VH, VO, and emax (also in general not normally distributed) across modes for a given site. Statistical tests were performed in MATLAB environment.
Results
We start by showing how increasing litter C:N ratio altered microbial traits (growth efficiency, enzymatic activity for carbohydrate C degradation, microbial biomass C:N ratio, and N loss in mortality) when different resource use modes were implemented (section “Effect of Substrate C:N Ratio on C and N Fluxes, and Microbial Traits”). Next, the model was applied to the litter decomposition datasets, and the performance of the four model variants was compared (section “Model Application to Litter Decomposition Data”).
Effect of Substrate C:N Ratio on C and N Fluxes, and Microbial Traits
Figure 2 shows the modeled responses of heterotrophic respiration, net N mineralization, and microbial traits to changes in substrate C:N ratio, under different resource use modes. To facilitate the interpretation of this figure, oxidizable compounds were not considered (i.e., CO = 0 and g(l) = 1), microbial biomass was assumed not to be limiting decomposition (Kr = 0), microbial biomass C was set to a constant value, and the C:N ratio of the substrate was changed by varying the proportion of hydrolysable compounds (which do not contain N) and proteins (N-rich). With this setup, Figure 2 essentially shows how instantaneous C and N flow rates and kinetic or stoichiometric parameters change when only substrate C:N is altered.
The four modes caused contrasting patterns in respiration as the substrate C:N increased, in particular at C:N above 50, when N limitation occurs (Figure 2A). At higher C:N, respiration increased when CUE was decreased (mode (i), gray line), decreased if carbohydrate acquisition was downregulated (modes (ii) and (iv), black dashed and orange solid lines, respectively), and did not change with plastic microbial C:N (modes (iii), red dotted). The decrease in mode (iv) occurs at a slightly higher C:N than in mode (ii) because carbohydrate acquisition is reduced only when all N in mortality is internally recycled.
All the modes except (iii) are based on the assumption that microbial C:N is constant under C limitation, which implies decreasing net N mineralization as the substrate C:N increases (Figure 2B). The decrease continues until net N mineralization turns negative and eventually reaches the maximum N immobilization rate (Imax) when N becomes limiting. Further increase in substrate C:N at this point does not change the realized net N mineralization rate, which remains constrained by Imax. However, the N demand kept increasing with substrate C:N, as indicated by the blue dot-dashed line in Figure 2B. Therefore–by model construction–the response of the net N mineralization rate to changes in substrate C:N was the same regardless of which mode was implemented.
Figures 2C–F show how specific traits were affected by the four modes under N limitation–each mode affects primarily one trait, while the others remain fixed at their values under C limitation. Flexible CUE (Eq. 22) caused a progressively decreasing proportion of acquired C to be assimilated into biomass as substrate C:N increased (gray line in Figure 2C), whereas selective enzymes and nutrient retention modes caused the rate constant for CH decomposition to decrease (Eq. 23; black dashed and orange solid lines in Figure 2D). In mode (iii), the microbial C:N ratio increased (red dotted line in Figure 2E), and with the nutrient retention mode, the fraction of N internally recycled increased under N limitation compared to C limited conditions (orange solid curve in Figure 2F). The N retention efficiency increased to a value of one, indicating that above C:N∼50 all N is retained in the active biomass. However, this N saving is not enough at C:N > 50, implying that also decreased carbohydrate acquisition is required (Figure 2D).
Next, we considered the decomposition trajectories for the full model (including the oxidizable pool), for each of the four modes in the case of plant residues with initial C:N = 100 and an initial carbohydrate fraction of nearly 80%. All modes caused a loss of about 90% of initial C in 5 years (comparable to conditions in boreal conifer forests) (Figure 3A), and a net N gain ranging between 25 and 70% over the first 1–2 years, depending on the mode (Figure 3B). When carbohydrate decomposition was decreased in modes (ii) and (iv), C loss was slower and N immobilization more prolonged than with the other modes (black dashed and solid lines in Figures 3A,B). This delayed N accumulation implies that large microbial biomass fractions (especially in terms of biomass N) can be achieved with modes (ii) and (iv) at later stages of decomposition than in mode (i) and (iii) (thin lines in Figures 3A,B). In turn, high biomass promotes decomposition, as shown in Figure 3A by the steep decline in litter C around day 500 (solid orange and dashed black lines). It is also worth noticing that the fraction of microbial biomass in the litter peaks at around 10% of initial litter, since the mortality rate we selected is relatively low (m = 0.5 y–1), causing accumulation of biomass before necromass is transferred to the substrate compartments. With biomass C fractions much higher than 1% (i.e., the value of half saturation constant Kr, Eqs 5–7), the decomposition rate becomes essentially a linear function of substrate C content in the intermediate phases of decomposition.
Figures 3C–F illustrate how the traits affected by the four modes change through time, as the initial N-limited conditions shift to C limitation after 1–2 years of decomposition. The initial period of low growth efficiency lasted about 1 year (Figure 3C), whereas lowered carbohydrate decomposition lasted for about 2 years for mode (ii) and 1.5 years for mode (iv) (Figure 3D). The microbial C:N increased during the N-limited phase in mode (iii), but did not recover its initial value even by the end of the simulation (Figure 3E). Microbial recycling of N was highest until day 500, and then decreased to zero as conditions transitioned to C limitation (Figure 3F). Because N retention was not sufficient to compensate the initial N shortage, mode (iv) resulted also in lower carbohydrate acquisition, as in mode (ii) (orange line in Figure 3D).
The four resource use modes caused not only different temporal changes of the litter C compartments (Figure 3), but also–at a given time–contrasting C distributions among the compartments when the initial litter C:N was varied (Figure 4, showing “snapshots” of C partitioning at year 1 for a range of initial C:N). At low initial C:N, N was not a limiting factor and all modes were equivalent (initial C:N < 30), but as the initial C:N was increased, they began to diverge. When microbial C:N increased, decomposers acclimated to varying litter C:N and were not affected by N limitation, leading to a fixed partitioning of C along the litter C:N gradient (Figure 4C). In contrast, the other modes resulted in decreasing decomposer biomass and increasing pools of non-decomposed labile C (carbohydrates and proteins) as litter C:N was increased (Figures 4A,B,D). The reduced loss of labile C is particularly strong when carbohydrate acquisition was lowered, and was accompanied by a decrease in respiration (Figures 4B,D; note that CO2 here includes both microbial respiration and the products of CO decomposition). In contrast, flexible CUE led to higher respiration at high initial litter C:N (Figure 4A). In all modes, the fraction of oxidizable C was relatively stable, because at the time of the “snapshots” (1 year after the start of the incubation), this pool had not been significantly degraded yet.
Model Application to Litter Decomposition Data
Examples of model fitting obtained with the local and global parameter optimization approaches are shown in Figure 5. As expected, local optimization allowed a more accurate fitting of the time series of C, N, and lignin fractions, with similar model fit for all four resource use modes and for both litter types selected as examples (top two rows in Figure 5). When optimizing parameters for all datasets from a given site together (global optimization), performance overall decreased, with errors depending on the specific litter type (bottom two rows in Figure 5). Nevertheless, the general pattern of higher N immobilization in high C:N litter was correctly predicted.
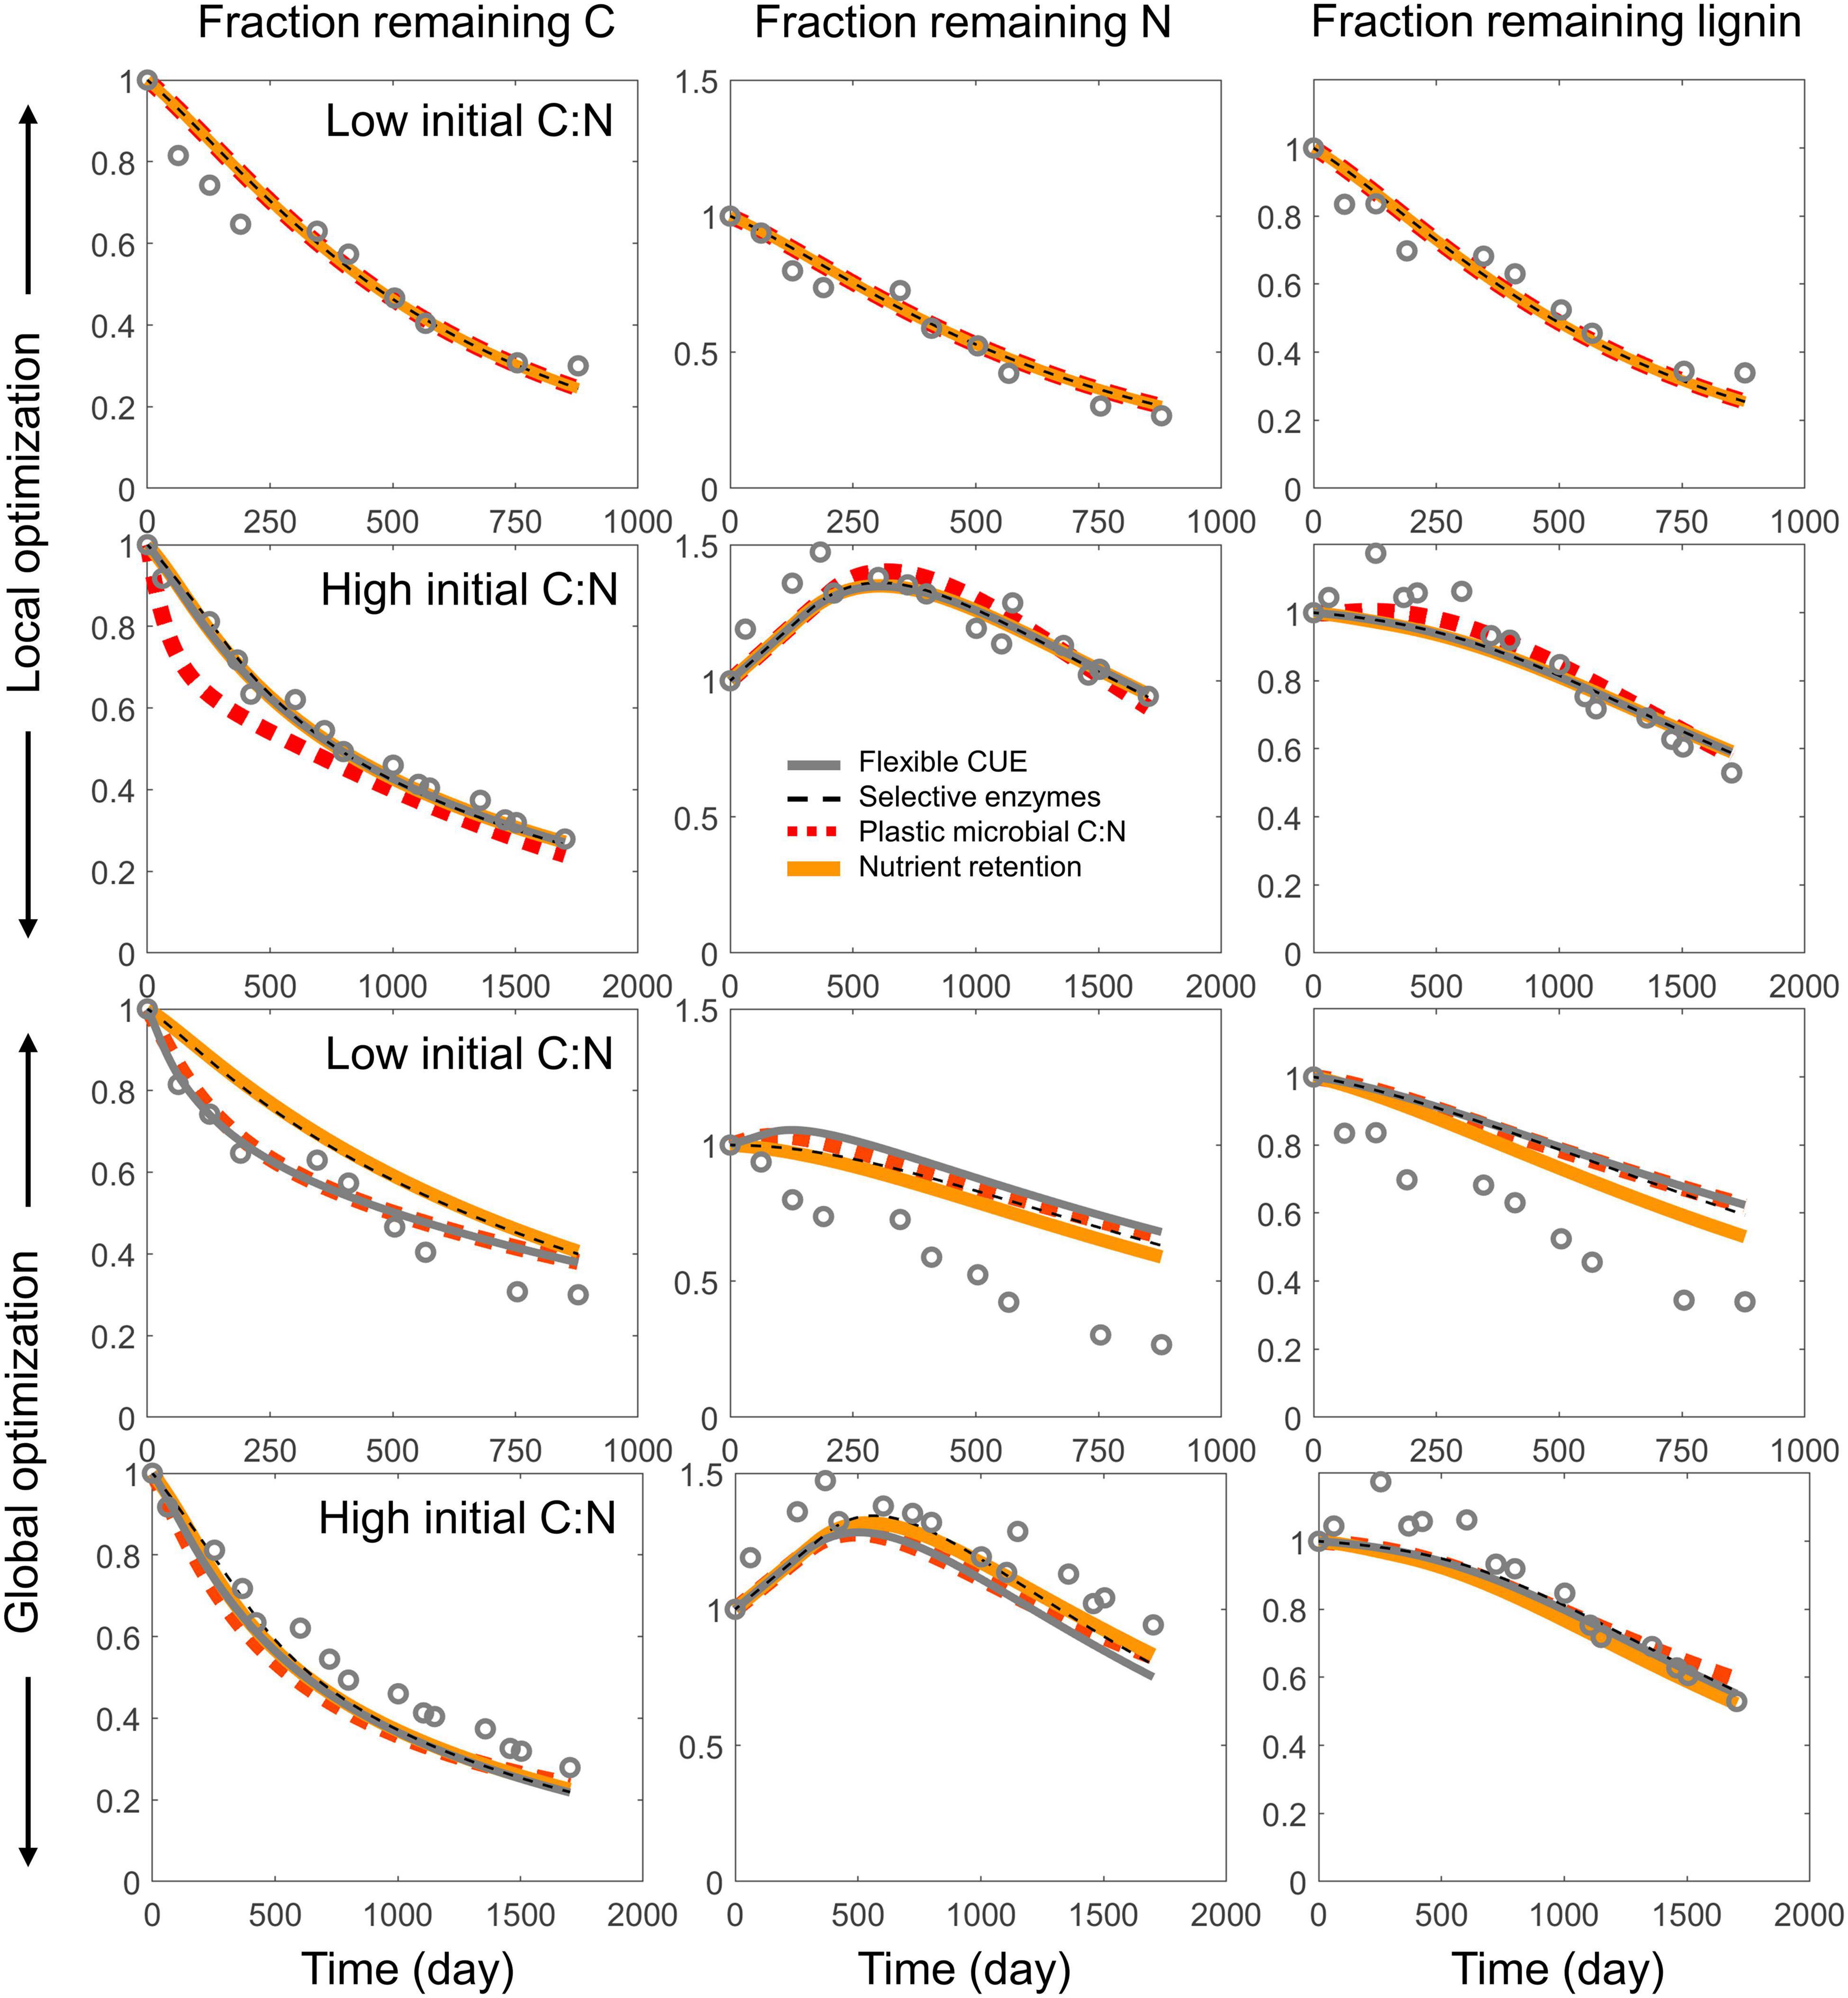
Figure 5. Examples of model fitting using the local (top two rows) and global (bottom two rows) parameter optimization approaches, applied to each of the four resource use modes (same line styles as in Figures 2, 3). The fractions of remaining total C, total N, and lignin (CO) are shown in the left, center, and right columns, respectively. Two litter types with contrasting initial C:N ratio were chosen as examples–one with high initial C:N [Pinus sylvestris, C:N = 132, from Berg and McClaugherty (1989)], and one with low initial C:N [Pterostyrax hispida, C:N = 14, from Osono and Takeda (2004, 2005)].
Across all datasets, local optimization resulted in a range of parameter values for each site, with increasing VH and VO from boreal to tropical climates, and highest emax under temperate conditions (compare groups of bars in Figure 6). When comparing different modes at a given site, parameter values were strongly correlated and their median values did not differ significantly (p > 0.05, compare colors within a group of bars in Figure 6). The strong correlation of parameter values between modes is expected because most datasets did not exhibit N limitation, and all modes are equivalent under C limitation. Next, we compared parameter values from fitting of litter types where decomposers were initially N limited, which reduced the number of litter types-mode combinations to 73 (out of 324 in total). The temperate and tropical sites exhibited mostly C limited conditions and were thus excluded from this analysis. As for the whole dataset, also when selecting the N limited litters, median parameter values did not differ between modes.
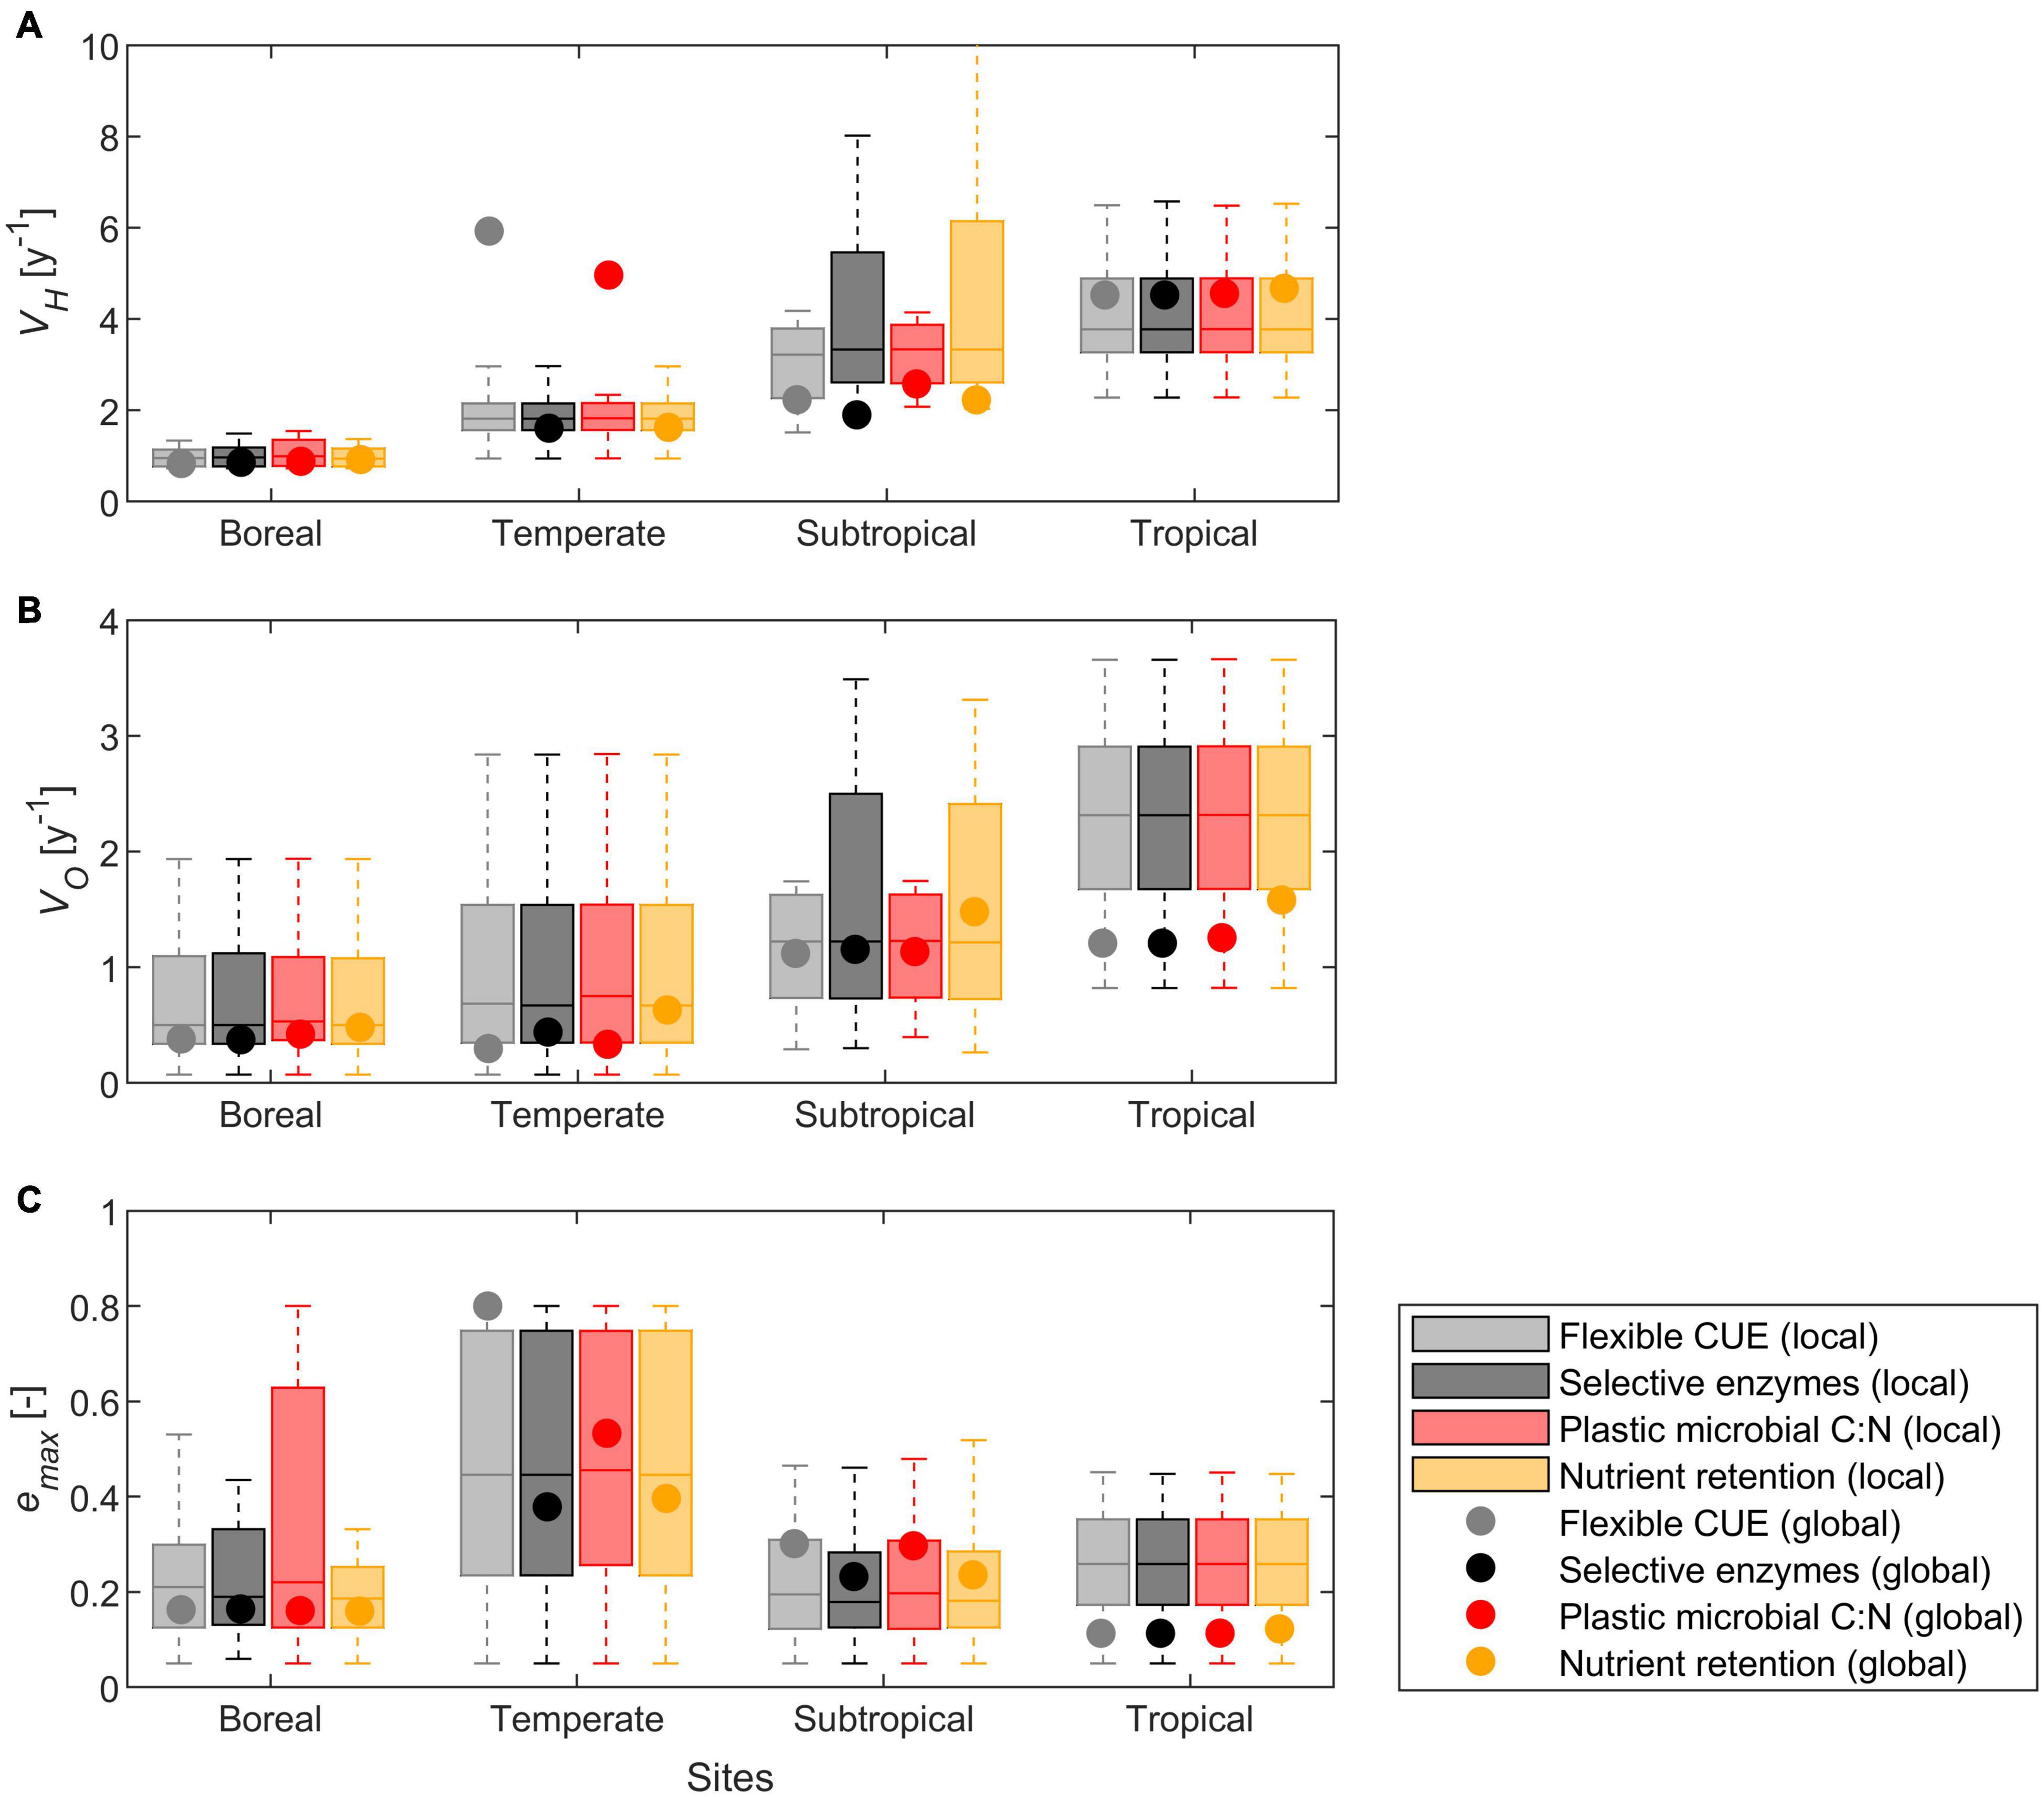
Figure 6. Calibrated model parameters, including results from the local (box plots) and global (points) parameter optimization approaches: (A) maximum rate of hydrolysable C uptake (VH), (B) maximum rate of oxidizable C uptake (VO), and (C) maximum growth efficiency (emax). Datasets are grouped by climate (Table 4) and resource use mode (color coded according to the legend). Each box indicates median and quartiles, and whiskers cover the data range excluding outliers.
The global optimization resulted in site-averaged parameters that followed the same patterns as those found with the local optimization (i.e., higher rate constants at warmer sites), but locally and globally optimized parameters differed in the subtropical and tropical sites (compare dots and median values in Figure 6). At the subtropical site, VH and emax from the global optimization were lower and higher, respectively, than most values found with the local optimization. At the tropical site, VH, VO, and emax from the global optimization were higher, lower, and lower, respectively, than most values found with the local optimization.
Similar to the examples in Figure 5, also in general the model performance was higher when fitting parameters locally than globally, as indicated by the lower scatter of predicted vs. observed data points in Figure 7 compared to Figure 8. With modes (ii) to (iv), the models tended to underestimate both the initial N immobilization (predicted N fraction lower than observed) and the later N mineralization (predicted N fraction higher than observed). None of the model variants was able to predict the initial accumulation of lignin in some boreal litter types.
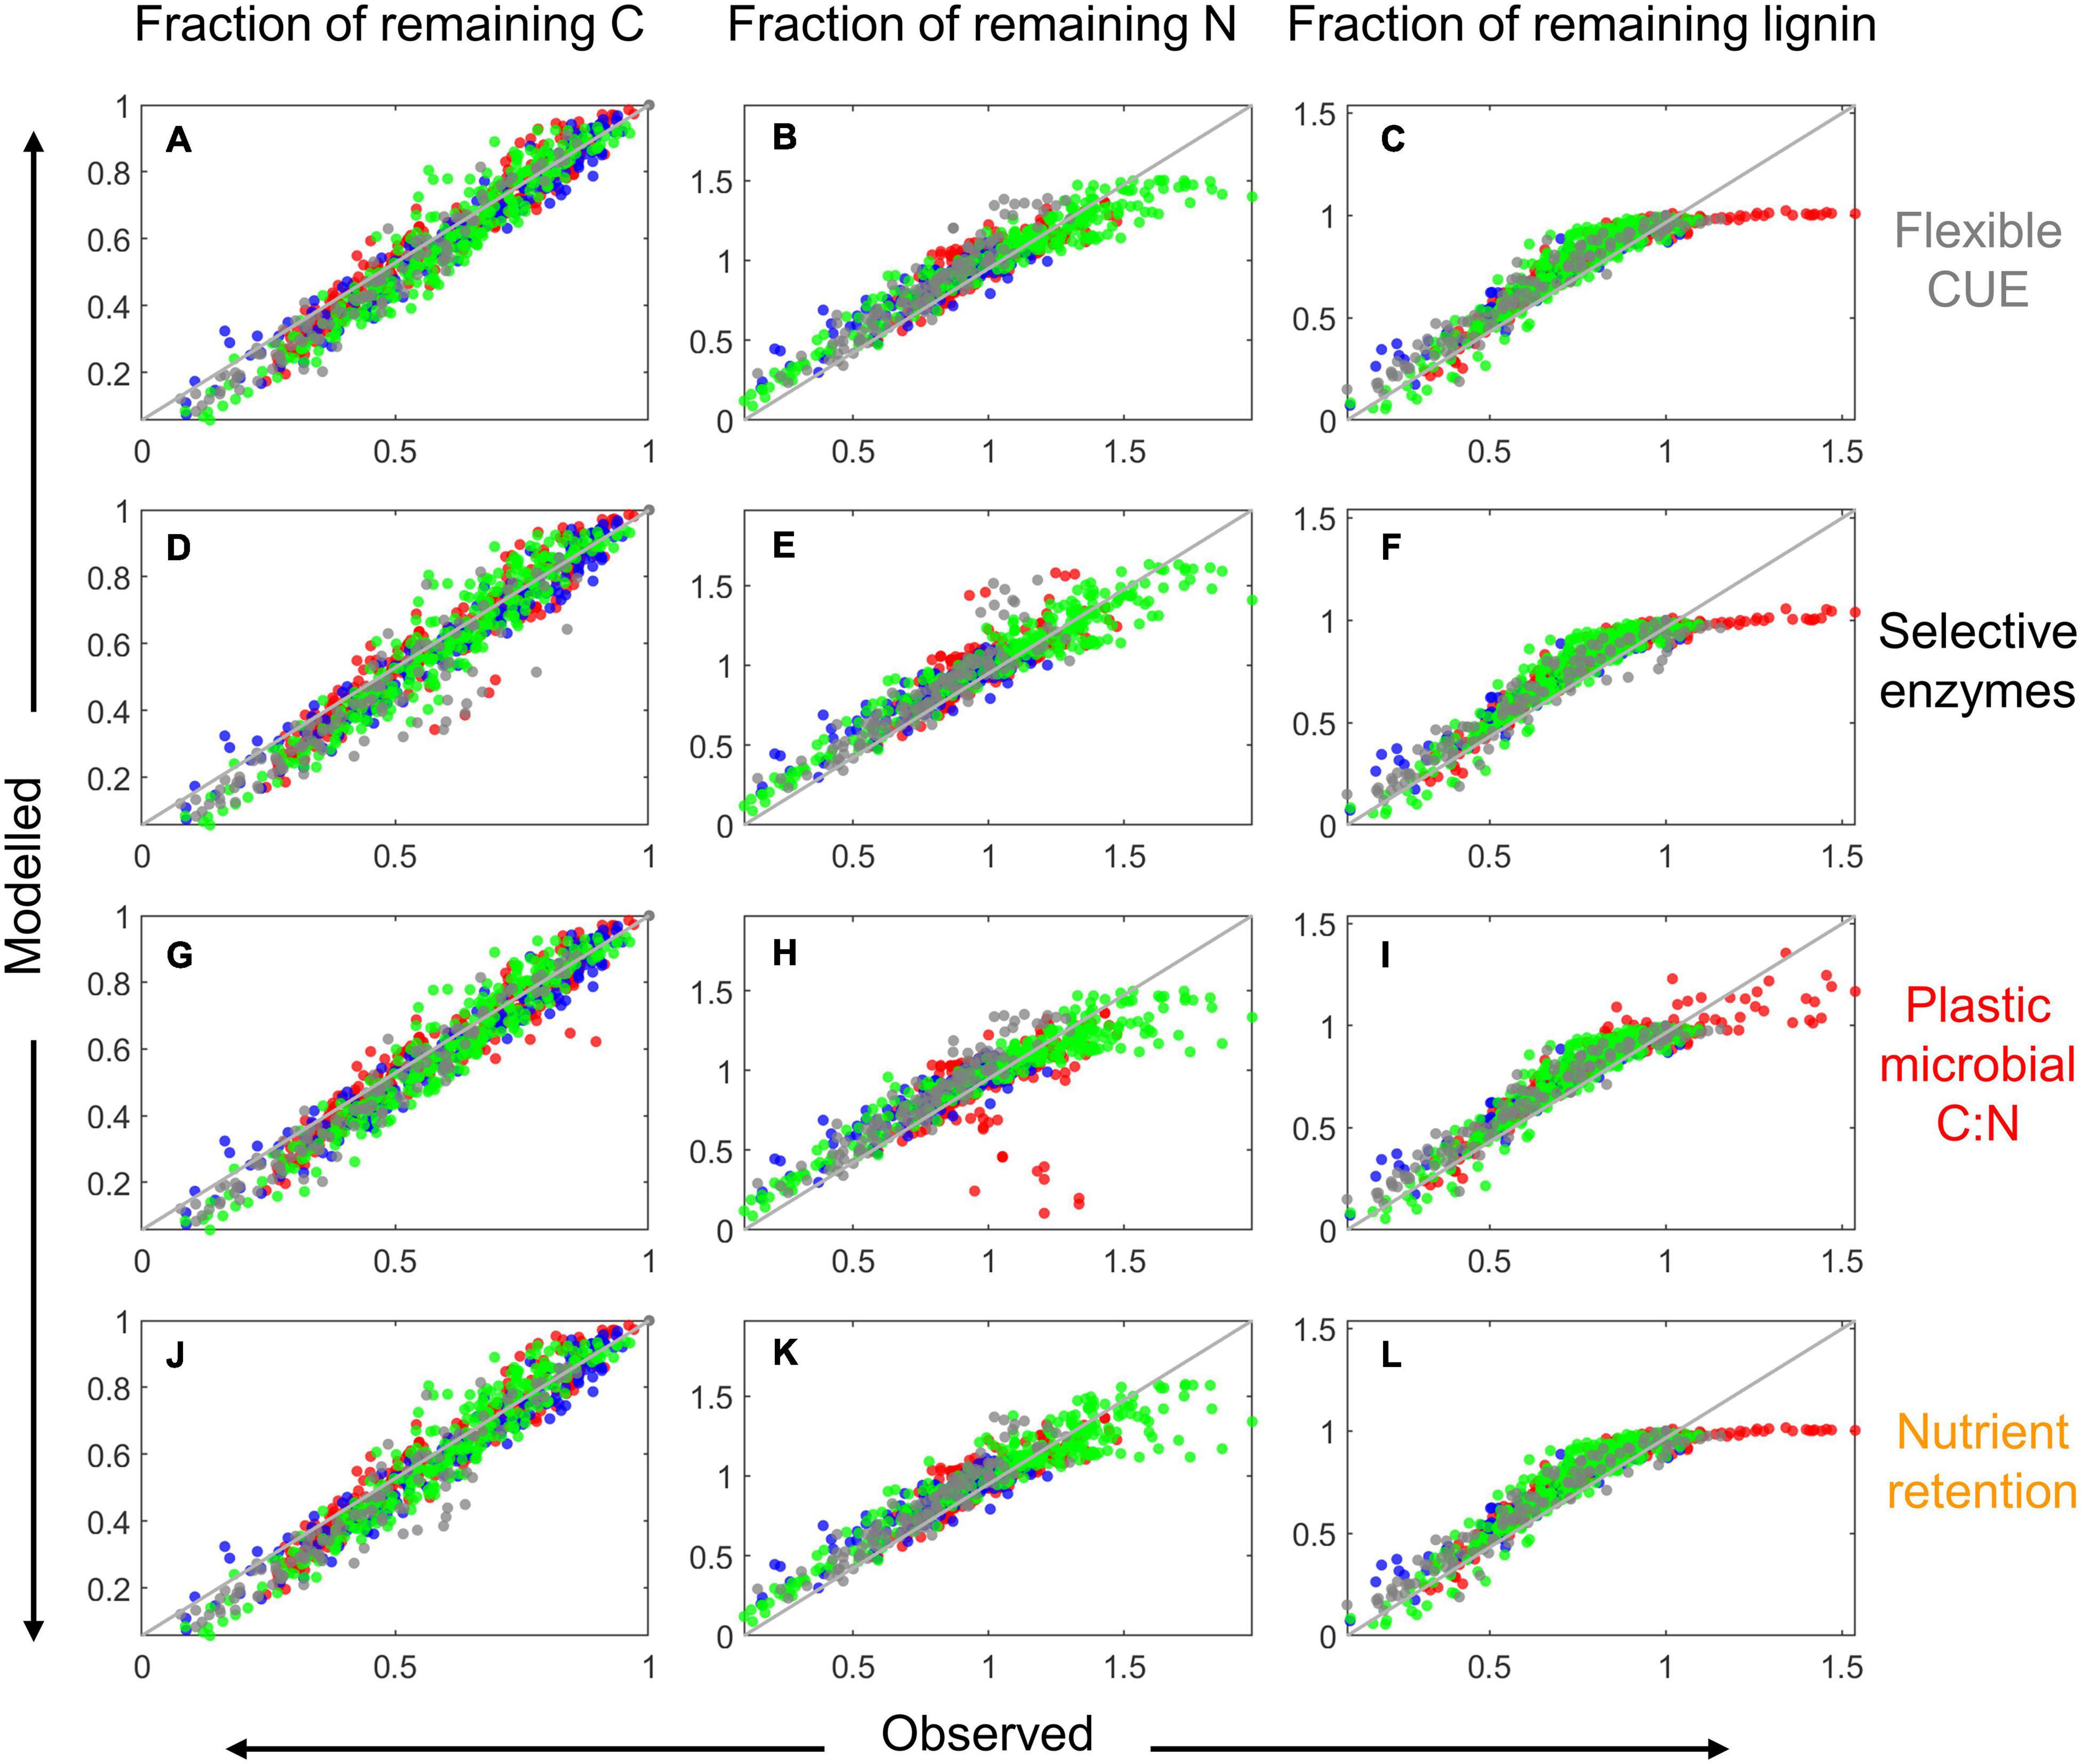
Figure 7. Comparison of modeled and observed fractions of remaining total C [left column: (A,D,G,J)], total N [center column: (B,E,H,K)], and lignin (CO) [right column: (C,F,I,L)] for the four resource use modes (as indicated on the right) when the model parameters were locally fitted. Data points are color coded according to their source: red from Berg and McClaugherty (1989), green from Osono and Takeda (2004, 2005), gray from Osono (2017), and blue from Hirobe et al. (2004); the 1:1 line is depicted as a solid gray line.
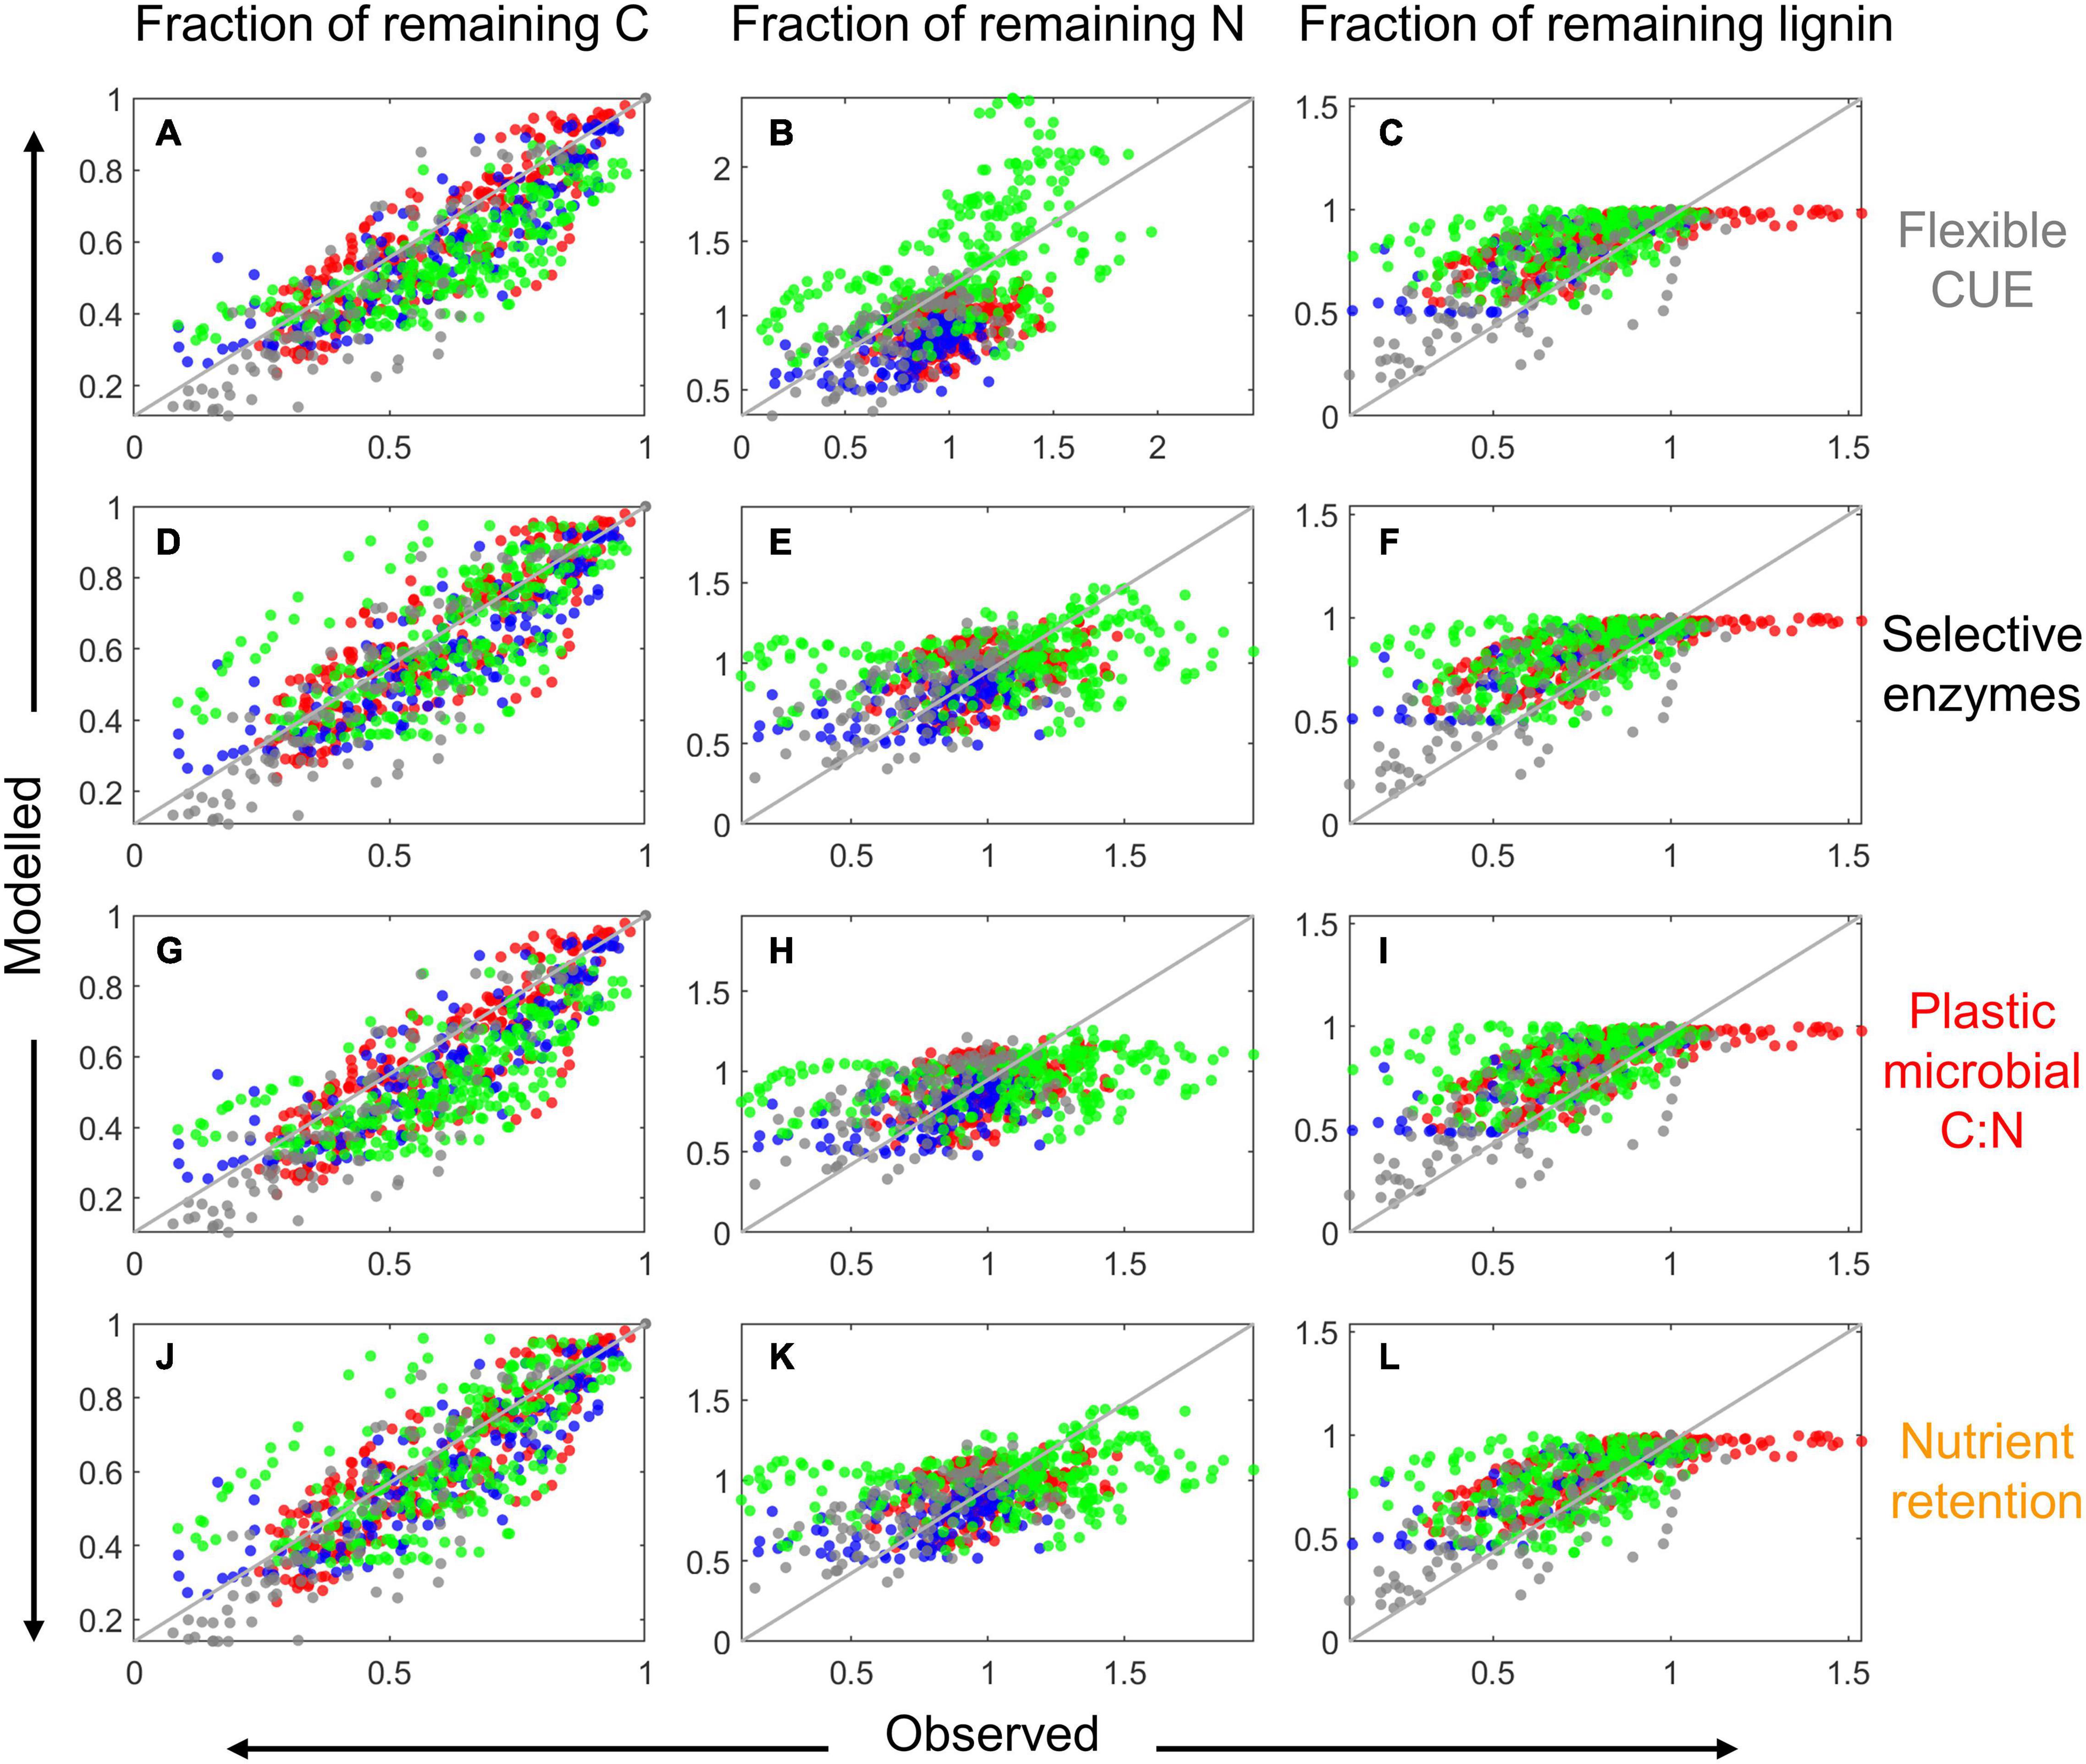
Figure 8. Comparison of modeled and observed fractions of remaining total C [left column: A,D,G,J], total N [center column: (B,E,H,K)], and lignin (CO) [right column: C,F,I,L] for the four resource use modes (as indicated on the right) when the model parameters were globally fitted. Data points are color coded according to their source: red from Berg and McClaugherty (1989), green from Osono and Takeda (2004, 2005), gray from Osono (2017), and blue from Hirobe et al. (2004); the 1:1 line is depicted as a solid gray line.
To gain insights into the role of the resource use modes, we focus now on N limited conditions, as none of the modes was activated when decomposers were C limited. The overall model performance for datasets that exhibited N limitation is summarized in Figure 9A. The median coefficients of determination for the locally fitted models were above 0.9, whereas for the globally fitted models they were around 0.7. Notably, the overall performance was not significantly affected by which mode was implemented in the local calibration approaches (compare colors within a group of bars in Figure 9), but mode (iv) had slightly higher R2 values at both sites. Also when comparing performances with the global calibration, mode (iv) appeared marginally superior, followed by model (iii). Performances were also similar across modes when comparing the RMSE from the fitting of only one of the three variables we considered (fractions of remaining C, N, or lignin), as shown in Figures 9B–D. Predictions of the fraction of remaining C were slightly, but not significantly better (lower RMSE) when microorganisms were assumed to have flexible CUE (Figure 9B).
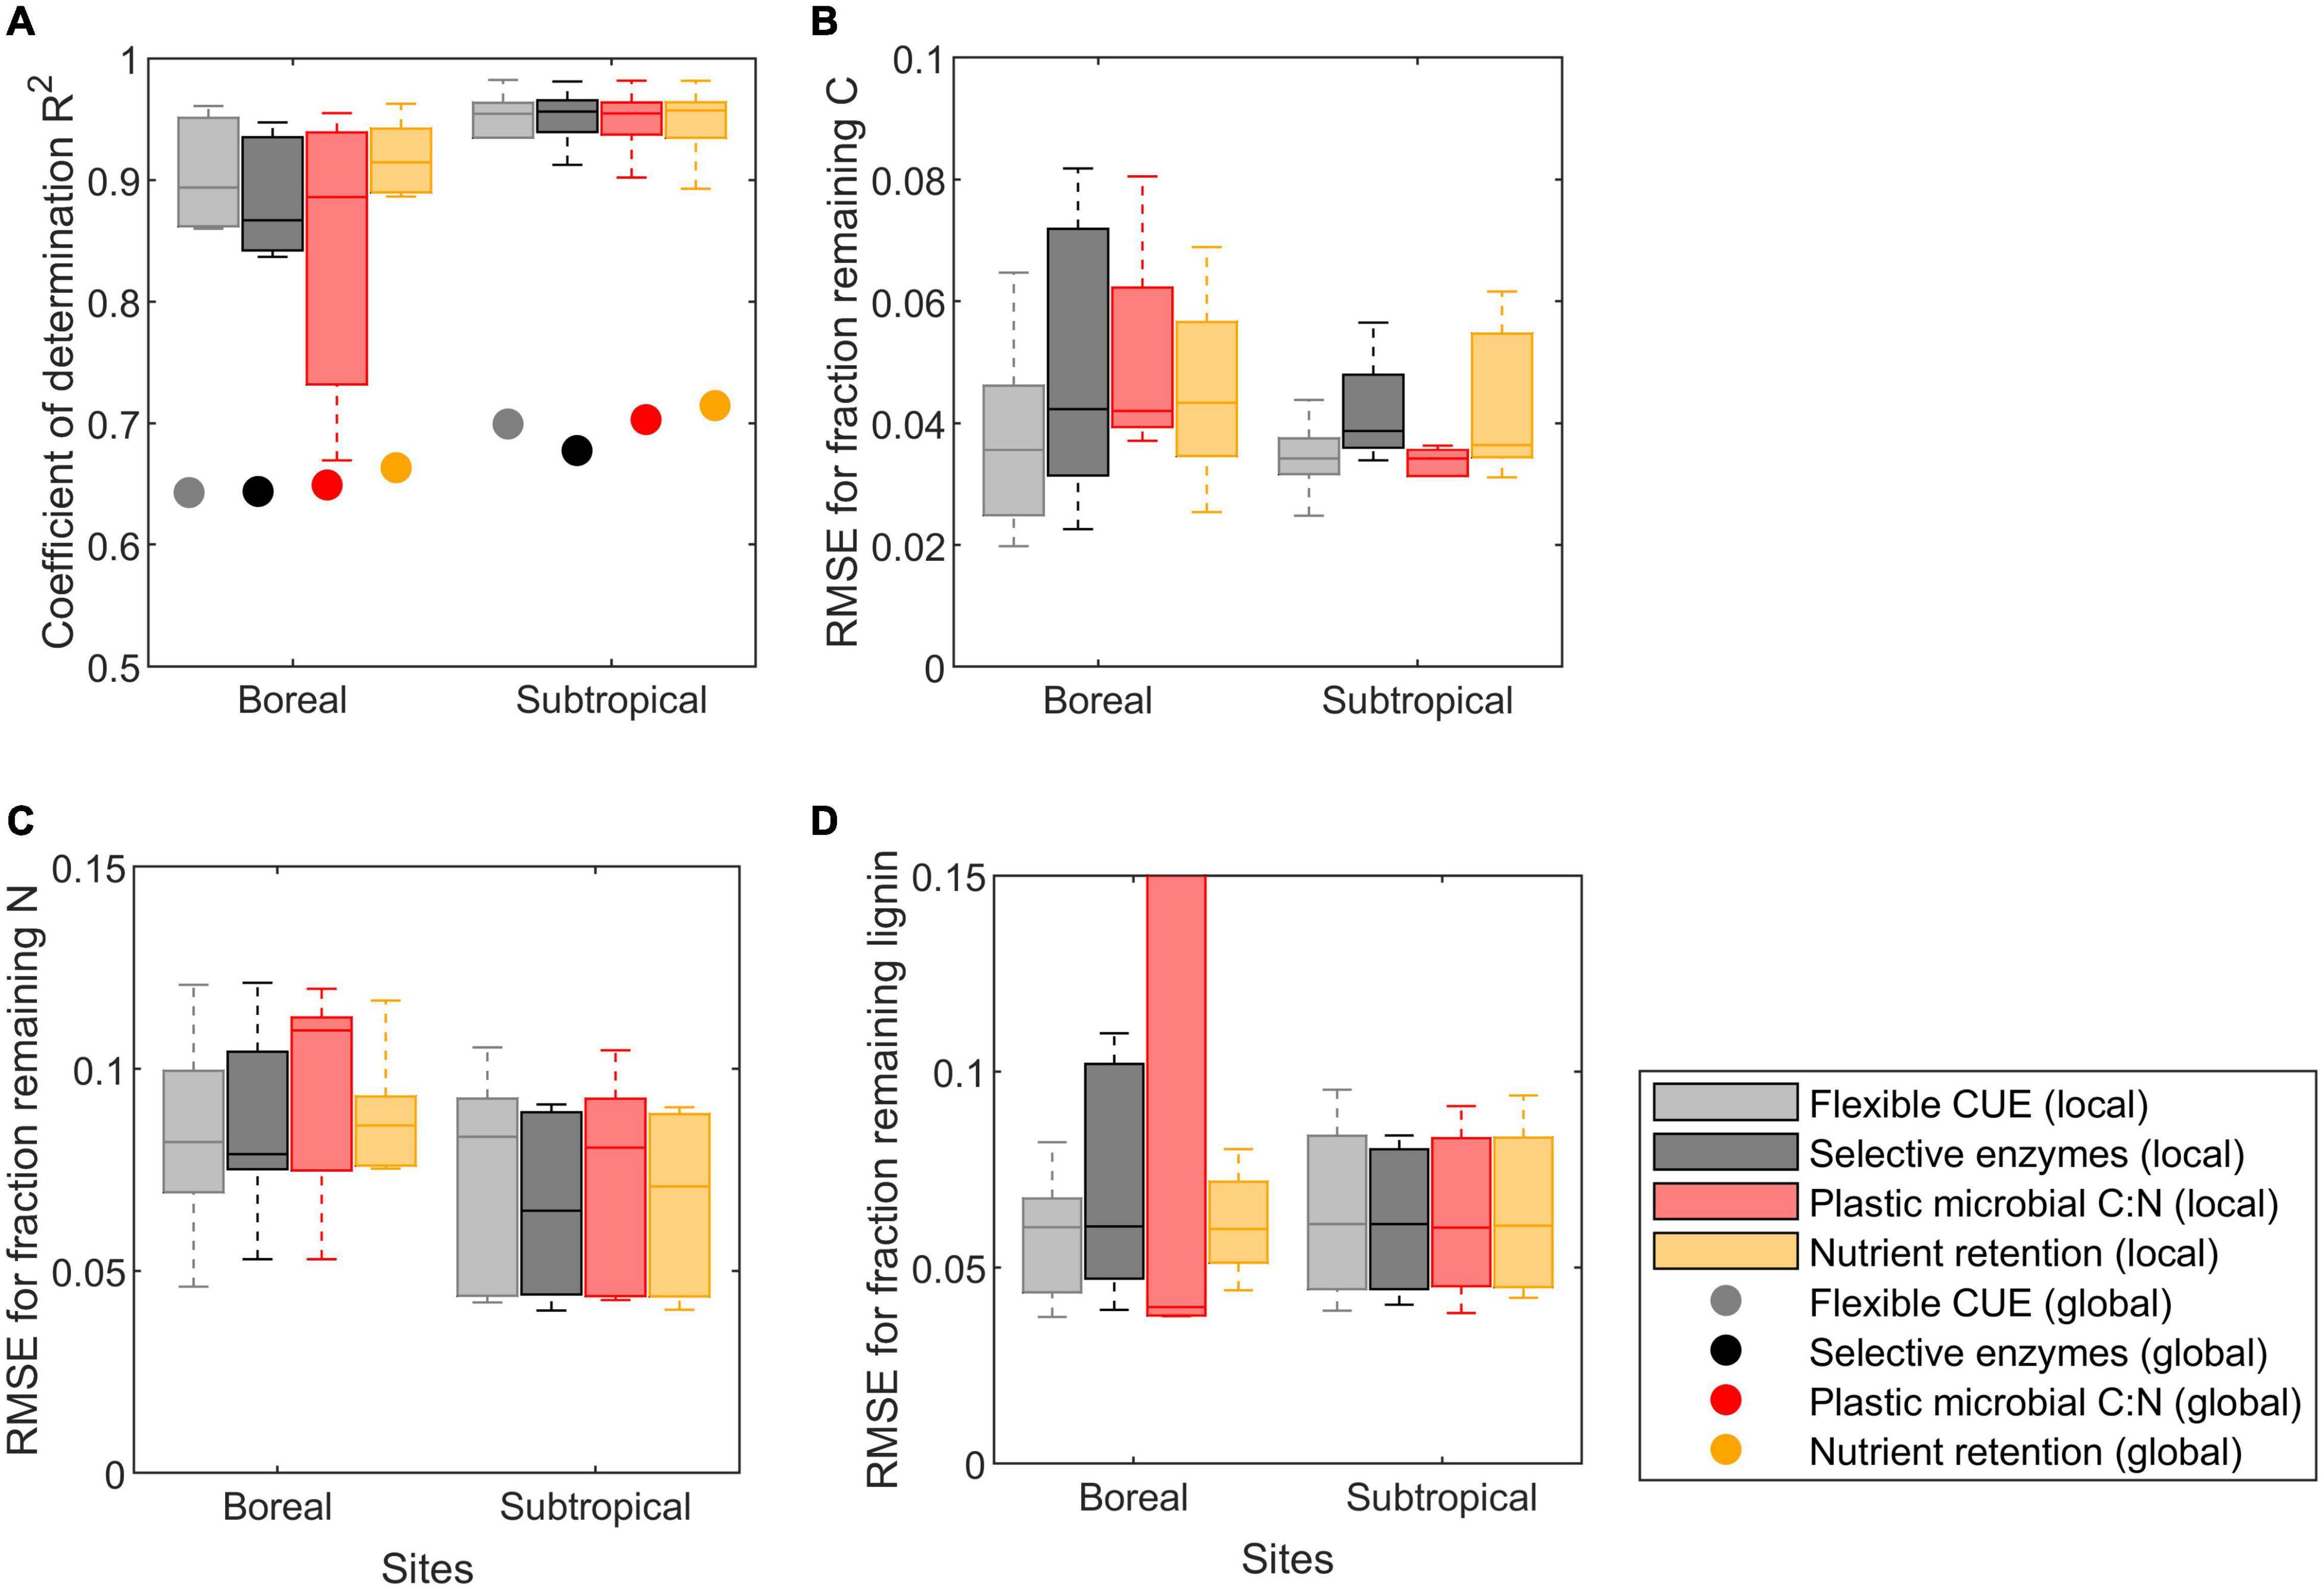
Figure 9. Summary of model performance for litter datasets in which microorganisms were N limited (only litter from boreal and subtropical sites). Performance is evaluated by (A) the overall coefficient of determination (R2), and the root mean square errors (RMSE) of model fitting to the fractions of remaining: (B) total C, (C) total N, and (D) lignin. RMSE values are non-dimensional because errors refer to the fractions of remaining C, N, and lignin. In panel (A), results from both the local (box plots) and the global (points) parameter optimization approaches are shown for comparison. Performance metrices are grouped by dataset (ordered based on their climate; Table 4) and resource use modes (color coded according to the legend). Each box indicates median and quartiles, and whiskers cover the data range excluding outliers.
Discussion
Putative Resource Use Modes Emerging From Earlier Models
In previous works, structurally different models of litter decomposition were compared, but only rarely have different approaches of modeling N limitation been contrasted using a common model platform. In this section, we discuss which resource use mode (or their combinations) might be occurring based on these earlier model results.
Nicolardot et al. (2001) treated growth efficiency (mode (i)), litter decay constant (mode (ii)), and microbial C:N (mode (iii)) as time-invariant parameters, and estimated them by fitting their model to data from mixtures of soil and residues with contrasting chemical properties. They found that growth efficiency was nearly constant, whereas the litter decay constant decreased and microbial C:N increased with increasing litter C:N. However, growth efficiency and microbial biomass C:N ratio are not independent parameters, as noted by Ågren et al. (2013), so that fitting both simultaneously might lead to equifinality issues. Moreover, these parameters were kept constant through time, thus not allowing the identification of specific microbial responses during the N limited phase of decomposition. Other approaches considered dynamic changes in microbial traits during decomposition, as discussed next.
Manzoni (2017) tested a range of stoichiometric models predicting the fraction of remaining N as a function of the fraction of remaining C during decomposition. These models assumed that microbial growth efficiency was time-invariant (calibrated to each dataset as in our local optimization approach), that it varied during decomposition (mode (i)), or that both growth efficiency and microbial C:N ratio varied (a combination of modes (i) and (iii)). In nutrient poor litter, growth efficiency was lower and increased more during decomposition compared to nutrient rich litter, consistent with the hypothesis of flexible CUE. Including plastic microbial biomass C:N did not alter the results–growth efficiency still decreased in N poor litter despite plastic microbial C:N. Notably, among these models, the simplest version based on time invariant, but locally calibrated growth efficiency was selected for nearly 60% of the datasets according to the Akaike Information Criterion, suggesting that N limitation (or other associated litter traits, including chemical recalcitrance and substrate accessibility) might affect the long-term average CUE, and not only CUE during the initial phases of decomposition.
Moorhead et al. (2012) derived an equation for the relative synthesis of enzymes involved in C and N acquisition from an organic matter compartment that included both elements, and of enzymes acquiring C from a second, C-only compartment. Their equation was based on the constraint that microbial resource acquisition is always stoichiometrically balanced, analogous to our approach. When allocation of all efforts to enzymes acquiring both C and N resulted in too low N release, overflow respiration would ensue (as in Schimel and Weintraub, 2003). This model thus implements modes (i) and (ii) simultaneously. Interestingly, however, these two mechanisms were not expressed simultaneously, because enzyme selection occurred only at low substrate C:N ratios, while overflow respiration occurred at high C:N. Building on the model by Moorhead et al. (2012), it was later proposed that enzyme synthesis could be optimized to maximize the microbial C uptake rate (Averill, 2014). This assumption led to different rates of synthesis of C- and N-acquiring enzymes at low substrate C:N ratios. The assumption of optimal enzyme synthesis eliminated N losses via mineralization, whereas the stoichiometric homeostasis allowed N release. Another approach to modeling enzyme synthesis was recently added in the same framework by Wutzler et al. (2017). In this approach, enzyme allocation was proportional to the return on investment in that enzyme. As a result, the activity of N acquiring enzymes was elevated and growth efficiency decreased as substrate C:N increased. Therefore, results from these contributions in general suggest that selective enzyme synthesis could partly alleviate N shortage, but that flexible CUE would be necessary under severe N limitation. Although the concept of “overflow respiration” as implemented in these models suggests disposal of excessive C, it seems likely that microbial mechanisms have evolved to ensure that the additional energy released by respiration is instead used to intensify N foraging (Craine et al., 2007).
Zhang et al. (2018) compared different variants of the CENTURY model to assess whether N limitation decreased CUE (mode (i)), the rate of labile litter decomposition (modes (ii)), or both. Implementing both modes improved the model fit, but required more parameters compared to models without N limitation effects or only flexible CUE. This suggests that different resource use modes may be at play simultaneously. This possibility was not tested here because our model structure requires evaluation of a single mechanism at a time (except for mode (iv)) to mathematically “close” the problem and determine how a selected trait varies with N availability. Alternatively, one could allow for independent variations of several traits as a function of nutrient availability (Sistla et al., 2014, where modes (i), (ii), and (iii) are implemented), but at the cost of additional parameters to estimate via data fitting. Since even the simplest microbial models can be overparameterized and exhibit equifinality issues (Marschmann et al., 2019), we preferred to implement one mechanism at a time and compare model fitting across our four variants. In fact, even with our minimal calibration approach–and in contrast with our intuitive expectation–the comparison between local and global parameter optimization shows that growth efficiency and decomposition rate constants tend to change in concert and variations in the former can be compensated by variations in the latter when minimizing model errors (Figure 6).
Individual-based models have also been used to study nutrient limitation and its consequences on the overall microbial community response (e.g., Allison, 2012; Kaiser et al., 2014). These models consider the interactions of cells belonging to different microbial groups in small domains, and therefore study decomposition as an emerging process driven by micro-scale interactions. Both models mentioned above assume that microbial cells release C in excess via mineralization, similar to our flexible CUE mode. The model by Allison (2012) allows some flexibility in microbial C:N, contrary to the strict homeostasis in the model by Kaiser et al. (2014). None of these models considers preferential resorption of N upon senescence. However, both allow different microbial groups to produce enzymes targeting different compounds, which leads to selection of microbial groups with enzymes able to support their growth for given substrate type and availability. This sorting mechanism in turn causes changes in community-averaged C:N and CUE that depend on substrate and time. For example, according to Kaiser et al. (2014), the community-averaged CUE increases at the beginning of decomposition (as in our flexible CUE mode in high C:N litter) and then decreases in the later phases, but thanks to interactions among microbial groups, after the initial increase, CUE is insensitive to the initial litter C:N. This is different from our result that even the long-term CUE values depend on litter type (as discussed in section “Can Any Microbial Resource Use Mode Be Excluded Using Litter Decomposition Data?”).
Overall, these findings suggest that, depending on the model structure, different modes may be predicted to co-occur, or that certain modes might be dominant at low litter C:N (e.g., enzyme selection) vs. high litter C:N (e.g., flexible CUE). A particular mode could also emerge from interactions within the microbial community, as opposed to being imposed during model design. None of the modes considered in these models, however, could be excluded as putative microbial mechanisms, which is consistent with our main result that all are plausible.
Can Any Microbial Resource Use Mode Be Excluded Using Litter Decomposition Data?
Based on the consistently high and comparable performance of the four model variants, all hypothesized mechanisms of adaptation to N limitation appear to be plausible. This finding indicates that either all resource use modes are possible (as alternative modes or occurring simultaneously) or that our approach does not allow any of them to be ruled out (section “Can We Use Bulk Chemistry Data to Identify Resource Use Modes?”).
Besides the theoretical evidence discussed in section “Putative Resource Use Modes Emerging From Earlier Models,” there is empirical evidence that different modes can be expressed under nutrient limitation (Mooshammer et al., 2014; Spohn, 2016). Microbial CUE (which is mathematically equivalent to the apparent growth efficiency in our model) has been shown to decrease as the bulk substrate C:N ratio increases in soil (Lee and Schmidt, 2014) and litter (Boberg et al., 2008; Manzoni et al., 2010; Voriskova et al., 2011; Lashermes et al., 2016; but see contrasting results in Camenzind et al., 2020). This trend in CUE is expected if we assume that microbial growth rate (Manzoni et al., 2017) or C uptake rate (Wutzler et al., 2017) is maximized along a gradient in nutrient availability. However, stoichiometric imbalances are not the only drivers of CUE changes along nutrient availability gradients. For example, CUE might increase in fertilized soils because of lower energy costs of N acquisition associated with inhibition of oxidative enzyme activity (Craine et al., 2007; Spohn et al., 2016b). When comparing soil with contrasting organic matter C:N ratios, CUE patterns could also be driven by variation in microbial community composition rather than by phenotypic responses to nutrient availability (Soares and Rousk, 2019), suggesting again that stoichiometric constraints alone do not always explain CUE variations. Here we showed that flexible CUE allows for marginally better model fitting to the fraction of remaining C compared to other adaptations, indicating that this mode is indeed important.
There is also evidence of selective resource acquisition via extracellular enzymes. In our implementation of mode (ii), we assumed that less carbohydrate-degrading enzymes are produced and thus less C is acquired in N limited conditions. Therefore, the occurrence of this mode could be verified by evidence of lower activity of hydrolytic enzymes for C acquisition (e.g., β-glucosidases) compared to hydrolytic enzymes for N acquisition (e.g., leucine aminopeptidase). This has been reported, for example, for grassland soils in North America, where N inputs decreased leucine aminopeptidase activity by ∼70% (Ramirez et al., 2012). Similarly, in a 65-year grassland experiment with multiple levels of N addition in South Africa, N addition decreased leucine aminopeptidase activity and increased β-glucosidase activity (Schleuss et al., 2019). The strong increase in the activities of these two groups of enzymes with increasing C:N ratio of the dissolved organic matter occurred at a low (<6) C:N ratio (Schleuss et al., 2019). In contrast to these studies, there is also evidence of coordinated decreases of both C and N acquiring enzymes at high C:N (Camenzind et al., 2020). Overall, this evidence indicates that mode (ii) can be expected at relatively low C:N ratios, as also predicted by previous models (section “Putative Resource Use Modes Emerging From Earlier Models”). Our results do not show a consistent improvement of any model performance metric when implementing mode (ii) compared to other modes, but performances were relatively high, so mode (ii) could not be excluded.
Similarly, we could not exclude mode (iii), consistent with evidence of increased microbial C:N ratio of fungal isolates under nutrient limitation (Camenzind et al., 2021), or at the community level in the earlier phases of litter decomposition (Van Meeteren et al., 2007). Other reports, however, indicate stoichiometric homeostasis at the microbial community level, despite large variations in substrate C:N ratios (Fanin et al., 2013; Schleuss et al., 2019). Indeed, the C:N ratio of pure mycelium of fungi degrading pine needles was not affected by N additions but varied between fungal species (Boberg et al., 2014), suggesting that community level C:N could be stabilized by species selection. It remains to be determined whether the observed homeostasis in litter and soil communities might be partly an artifact of the fumigation extraction, which could miss high molecular weight or non-polar storage compounds that would skew microbial C:N ratio in ways consistent with mode (iii). We thus expect that plasticity in microbial biomass C:N ratio could be an important mechanism to face N limitation, though its role at the community level, relevant for most biogeochemical models, remains to be demonstrated empirically.
The proposed mode (iv) has perhaps the least empirical support, mostly because technical developments have only recently allowed us to estimate microbial mortality. We describe nutrient retention relative to C by allowing N to be internally recycled at senescence. Consistent with this mode, N was preferentially recycled in growing fungal hyphae, leaving behind a C enriched less active biomass (Camenzind et al., 2021). The turnover rate of microbial phosphorus (P) was shown to be faster in fertilized soils, indicating a relatively higher P retention when this element was less available (Spohn and Widdig, 2017). In a cropland soil, C in the microbial biomass had a mean residence time of ∼3 months, while P had a mean residence time less than half that of C, indicating that C was more efficiently retained in the microbial biomass than the nutrient (Kouno et al., 2002). Nutrients can also be recycled via consumption of the decaying part of the microbial community by the active part (Capek et al., 2021). When fresh pine litter (high C:N) was linked to pre-decomposed (low C:N) litter by a common fungal mycelium, N was transferred from the older N-rich needles toward the fresh N-poor needles, where fungal biomass production and decomposition were stimulated (Boberg et al., 2014). Addition of new litter also decreased fungal biomass in the pre-decomposed litter, indicating that N limitation induced biomass recycling. In the same experiment, biomass recycling was linked to increased CUE, showing that a combination of modes (i) and (iv) was at play. Moreover, high expression of chitinase encoding genes has been observed in senescing mycelium of a wood decomposing fungus, indicating internal recycling of cell-wall bound N (Karlsson et al., 2016). Interestingly, the model variant that performed best in the global optimization was based on mode (iv), suggesting that quantifying microbial mortality and associated nutrient and C flows as nutrient availability varies holds promise to improve the predictive capacity of biogeochemical models.
Can We Use Bulk Chemistry Data to Identify Resource Use Modes?
As suggested above, it is possible that our approach does not have the resolution required to dismiss any adaptation mechanism. Ideally, one could test if a specific mode is at play by directly measuring the four microbial properties that are affected by the modes (i.e., CUE, enzyme activity, microbial C:N, and turnover rate of C vs. other nutrients in microbial biomass)–model predictions could then be tested against these data. Here we instead use coarse-resolution, bulk litter chemistry data that are readily available for litter types ranging from N-rich to N-poor. These datasets are useful for our purposes only if a given adaptation leaves a specific signature at a macroscopic (i.e., bulk chemistry) level–an indirect test, as often done when model parameters map onto traits that are not readily measured. Except for slightly higher performance achieved by mode (iv) (followed by (iii)) when using a global optimization approach), the four modes did not result in distinctive features in the predicted litter chemistry.
It could also be argued that fitting of the three parameters VH, VO, and emax for each model variant reduces the effect of different modes on macroscopic litter chemistry. In fact, a given mode could have a strong effect on model performance, but the least square fitting could converge to the same trajectory as the other modes by adjusting the three free parameters. The parameter values, however, were not significantly different across modes even when restricting the comparison to litter types with N limited decomposers. This suggests that, overall, the model calibration did not mask effects of the modes on model performance.
However, it is important to emphasize that in most litter types, the local optimization yielded low values of emax, which alone prevent N limitation in the early phases of decomposition. We thus performed an additional local optimization by not allowing emax values lower than 0.2 (not shown). As a result, as expected, N limitation emerged and the resource use modes were accordingly activated more often, in 131 combinations of litter type, mode and site, out of a total of 324 combinations. However, the model performance declined, suggesting that low emax values are necessary to obtain a good fitting (results not shown). This result implies that long-term adaptations (recall that emax is a time-invariant parameter) might be as important as short-term responses to N limitation.
As the mechanisms of microbial adaptation to N limitation are difficult to deduce indirectly, direct measurements of microbial traits and how they change between substrates and throughout different stages of decomposition are needed. Litter bag experiments combined with metatranscriptomic analyses of the collective gene expression of communities of litter decomposers may provide simultaneous information about relative investments in extracellular enzymes, growth, respiratory energy production (Barbi et al., 2020) and even autolytic biomass turnover (Karlsson et al., 2016). Such assays could be combined with more direct, incubation-based measurements of growth, turnover, and CUE by isotope labeling (Spohn et al., 2016b; Spohn and Widdig, 2017; Soares and Rousk, 2019) and monitoring of the temporal dynamics of enzyme activities (Sinsabaugh et al., 2002) and chemical pools (Baskaran et al., 2019). Importantly, for these combined approaches to be useful to select the dominant adaptations to N limitation, they would need to be applied both across litter types with varying C:N and through time.
Conclusion
Four modes of microbial adaptation to N limitation were defined based on existing theories and empirical evidence: (i) flexible C-use efficiency, (ii) selective enzymes, (iii) plastic microbial biomass C:N ratio, and (iv) nutrient retention in the microbial biomass. We set out to assess if some of these modes are less likely than others to play a role during early litter decomposition. Based on the performance metrics of four model variants, each implementing a single mode and calibrated on litter decomposition data, we could not decisively dismiss any of the four hypothesized modes–they all enabled comparably good model fit. Therefore, we suggest that all strategies are plausible and that direct measurement of the microbial traits indicative of each mode are necessary to identify in which conditions a specific adaptation is particularly relevant or whether different modes of adaptation occur in concert.
Data Availability Statement
The data analyzed in this study can be found in the original publications (Berg and McClaugherty, 1989; Hirobe et al., 2004; Osono and Takeda, 2004, 2005; Osono, 2017); model parameters and performance metrics are reported in Supplementary Tables 1, 2 for all litter types and sites. The datasets are published and can be requested from the authors of the articles.
Author Contributions
All authors designed the study and developed the theory. SM and AC conducted the analyses and produced the results. SM drafted the manuscript. AC, MS, and BL commented and revised the manuscript.
Funding
This work is supported by the Swedish Research Council Vetenskapsrådet (grant 2020-03910) and by the Swedish Research Council FORMAS (grant 2015-00468).
Conflict of Interest
The authors declare that the research was conducted in the absence of any commercial or financial relationships that could be construed as a potential conflict of interest.
The handling editor declared a past co-authorship with one of the author BL.
Acknowledgments
We thank T. Osono for sharing litter decomposition data, and two reviewers for constructive comments.
Supplementary Material
The Supplementary Material for this article can be found online at: https://www.frontiersin.org/articles/10.3389/ffgc.2021.686945/full#supplementary-material
Supplementary Table 1 | Results of the local parameter optimization and model performance. Imax: maximum rate of N immobilization; VH: potential decomposition rate constant of protein and carbohydrate C; VO: potential decomposition rate constant of the oxidizable C; emax: maximum growth efficiency; RMSE: root mean square error; R2: coefficient of determination.
Supplementary Table 2 | Results of the global parameter optimization and model performance. Imax: maximum rate of N immobilization; VH: potential decomposition rate constant of protein and carbohydrate C; VO: potential decomposition rate constant of the oxidizable C; emax: maximum growth efficiency; RMSE: root mean square error; R2: coefficient of determination.
References
Aerts, R. (1997). Climate, leaf litter chemistry and leaf litter decomposition in terrestrial ecosystems: a triangular relationship. Oikos 79, 439–449. doi: 10.2307/3546886
Ågren, G. I., Hyvonen, R., Berglund, S. L., and Hobbie, S. E. (2013). Estimating the critical N:C from litter decomposition data and its relation to soil organic matter stoichiometry. Soil Biol. Biochem. 67, 312–318. doi: 10.1016/j.soilbio.2013.09.010
Allison, S. D. (2012). A trait-based approach for modelling microbial litter decomposition. Ecol. Lett. 15, 1058–1070. doi: 10.1111/j.1461-0248.2012.01807.x
Averill, C. (2014). Divergence in plant and microbial allocation strategies explains continental patterns in microbial allocation and biogeochemical fluxes. Ecol. Lett. 17, 1202–1210. doi: 10.1111/ele.12324
Baldrian, P., Vetrovsky, T., Cajthaml, T., Dobiasova, P., Petrankova, M., Snajdr, J., et al. (2013). Estimation of fungal biomass in forest litter and soil. Fungal Ecol. 6, 1–11. doi: 10.1016/j.funeco.2012.10.002
Barbi, F., Kohler, A., Barry, K., Baskaran, P., Daum, C., Fauchery, L., et al. (2020). Fungal ecological strategies reflected in gene transcription–a case study of two litter decomposers. Environ. Microbiol. 22, 1089–1103. doi: 10.1111/1462-2920.14873
Baskaran, P., Ekblad, A., Soucemarianadin, L. N., Hyvonen, R., Schleucher, J., and Lindahl, B. D. (2019). Nitrogen dynamics of decomposing Scots pine needle litter depends on colonizing fungal species. Fems Microbiol. Ecol. 95:fiz059. doi: 10.1093/femsec/fiz059
Berg, B., and McClaugherty, C. (1989). Nitrogen and phosphorus release from decomposing litter in relation to the disappearance of lignin. Can. J. Bot. Rev. Can. Bot. 67, 1148–1156. doi: 10.1139/b89-150
Berg, B., and McClaugherty, C. A. (2003). Plant Litter. Decomposition, Humus Formation, Carbon Sequestration. Berlin: Springer.
Berg, B., and Soderstrom, B. (1979). Fungal biomass and nitrogen in decomposing scots pine needle litter. Soil Biol. Biochem. 11, 339–341. doi: 10.1016/0038-0717(79)90045-2
Boberg, J., Finlay, R. D., Stenlid, J., Nasholm, T., and Lindahl, B. D. (2008). Glucose and ammonium additions affect needle decomposition and carbon allocation by the litter degrading fungus Mycena epipterygia. Soil Biol. Biochem. 40, 995–999. doi: 10.1016/j.soilbio.2007.11.005
Boberg, J. B., Finlay, R. D., Stenlid, J., Ekblad, A., and Lindahl, B. D. (2014). Nitrogen and carbon reallocation in fungal mycelia during decomposition of boreal forest litter. Plos One 9:e92897. doi: 10.1371/journal.pone.0092897
Camenzind, T., Lehmann, A., Ahland, J., Rumpel, S., and Rillig, M. C. (2020). Trait-based approaches reveal fungal adaptations to nutrient-limiting conditions. Environ. Microbiol. 22, 3548–3560. doi: 10.1111/1462-2920.15132
Camenzind, T., Philipp Grenz, K., Lehmann, J., and Rillig, M. C. (2021). Soil fungal mycelia have unexpectedly flexible stoichiometric C:N and C:P ratios. Ecol. Lett. 24, 208–218. doi: 10.1111/ele.13632
Campbell, E. E., Parton, W. J., Soong, J. L., Paustian, K., Hobbs, N. T., and Cotrufo, M. F. (2016). Using litter chemistry controls on microbial processes to partition litter carbon fluxes with the Litter Decomposition and Leaching (LIDEL) model. Soil Biol. Biochem. 100, 160–174. doi: 10.1016/j.soilbio.2016.06.007
Capek, P., Choma, M., Tahovska, K., Kana, J., Kopacek, J., and Santruckova, H. (2021). Coupling the resource stoichiometry and microbial biomass turnover to predict nutrient mineralization and immobilization in soil. Geoderma 385:114884. doi: 10.1016/j.geoderma.2020.114884
Carreiro, M. M., Sinsabaugh, R. L., Repert, D. A., and Parkhurst, D. F. (2000). Microbial enzyme shifts explain litter decay responses to simulated nitrogen deposition. Ecology 81, 2359–2365. doi: 10.2307/177459
Cotrufo, M. F., Wallenstein, M. D., Boot, C. M., Denef, K., and Paul, E. (2013). The microbial efficiency-matrix stabilization (MEMS) framework integrates plant litter decomposition with soil organic matter stabilization: do labile plant inputs form stable soil organic matter? Glob. Change Biol. 19, 988–995. doi: 10.1111/gcb.12113
Craine, J. M., Morrow, C., and Fierer, N. (2007). Microbial nitrogen limitation increases decomposition. Ecology 88, 2105–2113. doi: 10.1890/06-1847.1
Fanin, N., Fromin, N., Buatois, B., and Hättenschwiler, S. (2013). An experimental test of the hypothesis of non-homeostatic consumer stoichiometry in a plant litter–microbe system. Ecol. Lett. 16, 764–772. doi: 10.1111/ele.12108
Fatichi, S., Manzoni, S., Or, D., and Paschalis, A. (2019). A mechanistic model of microbially mediated soil biogeochemical processes: a reality check. Glob. Biogeochem. Cycles 33, 620–648. doi: 10.1029/2018gb006077
Fernandez, C. W., and Koide, R. T. (2014). Initial melanin and nitrogen concentrations control the decomposition of ectomycorrhizal fungal litter. Soil Biol. Biochem. 77, 150–157. doi: 10.1016/j.soilbio.2014.06.026
Hessen, D. O., and Anderson, T. R. (2008). Excess carbon in aquatic organisms and ecosystems: physiological, ecological, and evolutionary implications. Limnol. Oceanogr. 53, 1685–1696. doi: 10.4319/lo.2008.53.4.1685
Hirobe, M., Sabang, J., Bhatta, B. K., and Takeda, H. (2004). Leaf-litter decomposition of 15 tree species in a lowland tropical rain forest in Sarawak: dynamics of carbon, nutrients, and organic constituents. J. For. Res. 9, 347–354. doi: 10.1007/s10310-004-0088-9
Huang, L., Liu, M., Huang, H., Wen, Y., Zhang, X., and Wei, Y. (2018). Recent advances and progress on melanin-like materials and their biomedical applications. Biomacromolecules 19, 1858–1868. doi: 10.1021/acs.biomac.8b00437
Kaiser, C., Franklin, O., Dieckmann, U., and Richter, A. (2014). Microbial community dynamics alleviate stoichiometric constraints during litter decay. Ecol. Lett. 17, 680–690. doi: 10.1111/ele.12269
Karlsson, M., Stenlid, J., and Lindahl, B. (2016). Functional differentiation of chitinases in the white-rot fungus Phanerochaete chrysosporium. Fungal Ecol. 22, 52–60. doi: 10.1016/j.funeco.2016.04.004
Kirk, T., Connors, W., and Zeikus, J. (1976). Requirement for a growth substrate during lignin decomposition by 2 wood-rotting fungi. Appl. Environ. Microbiol. 32, 192–194. doi: 10.1128/AEM.32.1.192-194.1976
Kouno, K., Wu, J., and Brookes, P. C. (2002). Turnover of biomass C and P in soil following incorporation of glucose or ryegrass. Soil Biol. Biochem. 34, 617–622. doi: 10.1016/S0038-0717(01)00218-8
Lashermes, G., Gainvors-Claisse, A., Recous, S., and Bertrand, I. (2016). Enzymatic strategies and carbon use efficiency of a litter-decomposing fungus grown on maize leaves, stems, and roots. Front. Microbiol. 7:1315. doi: 10.3389/fmicb.2016.01315
Lee, Z. M., and Schmidt, T. M. (2014). Bacterial growth efficiency varies in soils under different land management practices. Soil Biol. Biochem. 69, 282–290. doi: 10.1016/j.soilbio.2013.11.012
Liski, J., Palosuo, T., Peltoniemi, M., and Sievanen, R. (2005). Carbon and decomposition model Yasso for forest soils. Ecol. Model. 189, 168–182. doi: 10.1016/j.ecolmodel.2005.03.005
Manzoni, S. (2017). Flexible carbon-use efficiency across litter types and during decomposition partly compensates nutrient imbalances—results from analytical stoichiometric models. Front. Microbiol. 8:661. doi: 10.3389/fmicb.2017.00661
Manzoni, S., Čapek, P., Mooshammer, M., Lindahl, B. D., Richter, A., and Šantrůčková, H. (2017). Optimal metabolic regulation along resource stoichiometry gradients. Ecol. Lett. 20, 1182–1191. doi: 10.1111/ele.12815
Manzoni, S., and Porporato, A. (2009). Soil carbon and nitrogen mineralization: theory and models across scales. Soil Biol. Biochem. 41, 1355–1379. doi: 10.1016/j.soilbio.2009.02.031
Manzoni, S., Trofymow, J. A., Jackson, R. B., and Porporato, A. (2010). Stoichiometric controls dynamics on carbon, nitrogen, and phosphorus in decomposing litter. Ecol. Monogr. 80, 89–106. doi: 10.1890/09-0179.1
Margida, M. G., Lashermes, G., and Moorhead, D. L. (2020). Estimating relative cellulolytic and ligninolytic enzyme activities as functions of lignin and cellulose content in decomposing plant litter. Soil Biol. Biochem. 141:107689. doi: 10.1016/j.soilbio.2019.107689
Marschmann, G. L., Pagel, H., Kuegler, P., and Streck, T. (2019). Equifinality, sloppiness, and emergent structures of mechanistic soil biogeochemical models. Environ. Model. Softw. 122:UNS104518. doi: 10.1016/j.envsoft.2019.104518
McGill, W. B., Hunt, H. W., Woodmansee, R. G., and Reuss, J. O. (1981). “Phoenix, a model of the dynamics of carbon and nitrogen in grassland soils,” in Terrestrial Nitrogen Cycles. Processes, Ecosystem Strategies and Management Impacts, eds F. E. Clark and T. Rosswall (Stockholm: Ecological Bullettins), 49–115.
Moorhead, D. L., Lashermes, G., and Sinsabaugh, R. L. (2012). A theoretical model of C- and N-acquiring exoenzyme activities, which balances microbial demands during decomposition. Soil Biol. Biochem. 53, 133–141. doi: 10.1016/j.soilbio.2012.05.011
Moorhead, D. L., Lashermes, G., Sinsabaugh, R. L., and Weintraub, M. N. (2013). Calculating co-metabolic costs of lignin decay and their impacts on carbon use efficiency. Soil Biol. Biochem. 66, 17–19. doi: 10.1016/j.soilbio.2013.06.016
Moorhead, D. L., and Sinsabaugh, R. L. (2006). A theoretical model of litter decay and microbial interaction. Ecol. Monogr. 76, 151–174. doi: 10.1890/0012-9615(2006)076[0151:atmold]2.0.co;2
Mooshammer, M., Wanek, W., Zechmeister-Boltenstern, S., and Richter, A. (2014). Stoichiometric imbalances between terrestrial decomposer communities and their resources: mechanisms and implications of microbial adaptations to their resources. Front. Microbiol. 5:22. doi: 10.3389/fmicb.2014.00022
Nicolardot, B., Recous, S., and Mary, B. (2001). Simulation of C and N mineralisation during crop residue decomposition: a simple dynamic model based on the C: N ratio of the residues. Plant Soil 228, 83–103.
Osono, T. (2017). Leaf litter decomposition of 12 tree species in a subtropical forest in Japan. Ecol. Res. 32, 413–422. doi: 10.1007/s11284-017-1449-0
Osono, T., and Takeda, H. (2004). Accumulation and release of nitrogen and phosphorus in relation to lignin decomposition in leaf litter of 14 tree species. Ecol. Res. 19, 593–602. doi: 10.1111/j.1440-1703.2004.00675.x
Osono, T., and Takeda, H. (2005). Decomposition of organic chemical components in relation to nitrogen dynamics in leaf litter of 14 tree species in a cool temperate forest. Ecol. Res. 20, 41–49. doi: 10.1007/s11284-004-0002-0
Parton, W. J., Scurlock, J. M. O., Ojima, D. S., Gilmanov, T. G., Scholes, R. J., Schimel, D. S., et al. (1993). Observations and modeling of biomass and soil organic-matter dynamics for the grassland biome worldwide. Glob. Biogeochem. Cycles 7, 785–809. doi: 10.1029/93gb02042
Ramirez, K. S., Craine, J. M., and Fierer, N. (2012). Consistent effects of nitrogen amendments on soil microbial communities and processes across biomes. Glob. Change Biol. 18, 1918–1927. doi: 10.1111/j.1365-2486.2012.02639.x
Sainte-Marie, J., Barrandon, M., Saint-André, L., Gelhaye, E., Martin, F., and Derrien, D. (2021). C-STABILITY an innovative modeling framework to leverage the continuous representation of organic matter. Nat. Commun. 12:810. doi: 10.1038/s41467-021-21079-6
Schimel, J. P., and Weintraub, M. N. (2003). The implications of exoenzyme activity on microbial carbon and nitrogen limitation in soil: a theoretical model. Soil Biol. Biochem. 35, 549–563. doi: 10.1016/s0038-0717(03)00015-4
Schleuss, P.-M., Widdig, M., Heintz-Buschart, A., Guhr, A., Martin, S., Kirkman, K., et al. (2019). Stoichiometric controls of soil carbon and nitrogen cycling after long-term nitrogen and phosphorus addition in a mesic grassland in South Africa. Soil Biol. Biochem. 135, 294–303. doi: 10.1016/j.soilbio.2019.05.018
Shimizu, M., Yuda, N., Nakamura, T., Tanaka, H., and Wariishi, H. (2005). Metabolic regulation at the tricarboxylic acid and glyoxylate cycles of the lignin-degrading basidiomycete Phanerochaete chrysosporium against exogenous addition of vanillin. Proteomics 5, 3919–3931. doi: 10.1002/pmic.200401251
Sinsabaugh, R. L., Carreiro, M. M., and Repert, D. A. (2002). Allocation of extracellular enzymatic activity in relation to litter composition. N deposition, and mass loss. Biogeochemistry 60, 1–24. doi: 10.1023/A:1016541114786
Sistla, S. A., Rastetter, E. B., and Schimel, J. P. (2014). Responses of a tundra system to warming using SCAMPS: a stoichiometrically coupled, acclimating microbe-plant-soil model. Ecol. Monogr. 84, 151–170. doi: 10.1890/12-2119.1
Soares, M., and Rousk, J. (2019). Microbial growth and carbon use efficiency in soil: links to fungal-bacterial dominance, SOC-quality and stoichiometry. Soil Biol. Biochem. 131, 195–205. doi: 10.1016/j.soilbio.2019.01.010
Spohn, M. (2015). Microbial respiration per unit microbial biomass depends on litter layer carbon-to-nitrogen ratio. Biogeosciences 12, 817–823. doi: 10.5194/bg-12-817-2015
Spohn, M. (2016). Element cycling as driven by stoichiometric homeostasis of soil microorganisms. Basic Appl. Ecol. 17, 471–478. doi: 10.1016/j.baae.2016.05.003
Spohn, M., Klaus, K., Wanek, W., and Richter, A. (2016a). Microbial carbon use efficiency and biomass turnover times depending on soil depth–implications for carbon cycling. Soil Biol. Biochem. 96, 74–81. doi: 10.1016/j.soilbio.2016.01.016
Spohn, M., Pötsch, E. M., Eichorst, S. A., Woebken, D., Wanek, W., and Richter, A. (2016b). Soil microbial carbon use efficiency and biomass turnover in a long-term fertilization experiment in a temperate grassland. Soil Biol. Biochem. 97, 168–175. doi: 10.1016/j.soilbio.2016.03.008
Spohn, M., and Widdig, M. (2017). Turnover of carbon and phosphorus in the microbial biomass depending on phosphorus availability. Soil Biol. Biochem. 113, 53–59. doi: 10.1016/j.soilbio.2017.05.017
Talbot, J. M., and Treseder, K. K. (2012). Interactions among lignin, cellulose, and nitrogen drive litter chemistry-decay relationships. Ecology 93, 345–354. doi: 10.1890/11-0843.1
van Bodegom, P. (2007). Microbial maintenance: a critical review on its quantification. Microb. Ecol. 53, 513–523. doi: 10.1007/s00248-006-9049-5
Van Meeteren, M. J. M., Tietema, A., and Westerveld, J. W. (2007). Regulation of microbial carbon, nitrogen, and phosphorus transformations by temperature and moisture during decomposition of Calluna vulgaris litter. Biol. Fertil. Soils 44, 103–112. doi: 10.1007/s00374-007-0184-z
Voriskova, J., Dobiasova, P., Snajdr, J., Vanek, D., Cajthaml, T., Santruckova, H., et al. (2011). Chemical composition of litter affects the growth and enzyme production by the saprotrophic basidiomycete Hypholoma fasciculare. Fungal Ecol. 4, 417–426. doi: 10.1016/j.funeco.2011.03.005
Wardle, D. A. (1998). Controls of temporal variability of the soil microbial biomass: a global-scale synthesis. Soil Biol. Biochem. 30, 1627–1637. doi: 10.1016/s0038-0717(97)00201-0
Wutzler, T., Zaehle, S., Schrumpf, M., Ahrens, B., and Reichstein, M. (2017). Adaptation of microbial resource allocation affects modelled long term soil organic matter and nutrient cycling. Soil Biol. Biochem. 115, 322–336. doi: 10.1016/j.soilbio.2017.08.031
Keywords: nitrogen limitation, litter decomposition, microbial model, carbon use efficiency, C:N ratio, microbial stoichiometry, extracellular enzymes
Citation: Manzoni S, Chakrawal A, Spohn M and Lindahl BD (2021) Modeling Microbial Adaptations to Nutrient Limitation During Litter Decomposition. Front. For. Glob. Change 4:686945. doi: 10.3389/ffgc.2021.686945
Received: 28 March 2021; Accepted: 10 May 2021;
Published: 11 June 2021.
Edited by:
Nicolas Fanin, INRAE Nouvelle-Aquitaine Bordeaux, FranceReviewed by:
Bin Wang, University of California, Irvine, United StatesDaryl Lee Moorhead, The University of Toledo, United States
Copyright © 2021 Manzoni, Chakrawal, Spohn and Lindahl. This is an open-access article distributed under the terms of the Creative Commons Attribution License (CC BY). The use, distribution or reproduction in other forums is permitted, provided the original author(s) and the copyright owner(s) are credited and that the original publication in this journal is cited, in accordance with accepted academic practice. No use, distribution or reproduction is permitted which does not comply with these terms.
*Correspondence: Stefano Manzoni, c3RlZmFuby5tYW56b25pQG5hdGdlby5zdS5zZQ==