 Richard W. Guldin
- Guldin Forestry LLC, Silver Spring, MD, United States
Small domain estimation (SDE) research outside of the United States has been centered in Canada and Europe—both in transnational organizations, such as the European Union, and in the national statistics offices of individual countries. Support for SDE research is driven by government policy-makers responsible for core national statistics across domains. Examples include demographic information about provision of health care or education (a social domain) or business data for a manufacturing sector (economic domain). Small area estimation (SAE) research on forest statistics has typically studied a subset of core environmental statistics for a limited geographic domain. The statistical design and sampling intensity of national forest inventories (NFIs) provide population estimates of acceptable precision at the national level and sometimes for broad sub-national regions. But forest managers responsible for smaller areas—states/provinces, districts, counties—are facing changing market conditions, such as emerging forest carbon markets, and budgetary pressures that limit local forest inventories. They need better estimates of conditions and trends for small sub-sets of a national-scale domain than can be provided at acceptable levels of precision from NFIs. Small area estimation research is how forest biometricians at the science-policy interface build bridges to inform decisions by forest managers, landowners, and investors.
Introduction
Defining Small Domain Estimation and Small Area Estimation
A study domain is a major segment of some population for which separate statistics are needed. A domain can be defined in many ways, including a demographic characteristic (e.g., an age stratum or an ethnic group) or an economic characteristic (e.g., a category of manufacturers) or a geographical area (e.g., a political jurisdiction, the range of a tree species, a hydrologic basin) (Lavrakas, 2008).
According to Brackstone (1987), small domain estimation (SDE) began several centuries ago—in the eleventh century in England and the seventeenth century in Canada. Those were based on data from complete enumerations of the population's members, commonly called censuses. But today, even what are called mandatory censuses rarely obtain data from all members of the population. Further the costs and administrative burdens of complete enumerations are no longer affordable. Therefore, surveys based on statistical sampling designs applied to a population have largely replaced complete enumerations as data collection tools, and statistical estimation procedures are used to make inferences from the sample data about the characteristics of the entire domain's population. The sampling and statistical plan for the survey normally specifies the level of detail and reliability or precision required in the estimates sought from the sample data. But despite well-constructed sampling and statistical plans that carefully balance users' information needs and available funding, demands from data users continually arise for attribute estimates for sub-populations in sub-domains that were not envisioned in the original plans (U.S. Census Bureau, 2021).
A clear definition of SDE and SAE can be obtained by melding points made by three authors. Lavrakas (2008, p. 675) distinguished between large domains or areas and small domains or area, saying, “A domain is considered ‘large' or ‘major' if the domain sample is sufficiently large so that it can provide direct estimates of the domain parameter, for example, the mean, with adequate precision. A domain or area is regarded as “small” if the domain-specific sample is not large enough to produce an estimate with reliable precision. Areas or domains with small samples are called small areas, small domains, local areas, subdomains, or substates.”
Pfeffermann (2013, p. 41) acknowledged and clarified definitional confusion, “The term ‘small area estimation' is somewhat confusing because it's the size of the sample from the area that causes estimation problems, not size of the area.”
Ghosh (2020, p. 2) said that what is important in defining small area is, “… the ‘smallness' of the targeted population within an area that constitutes the basis for SAE.” He elaborated further that, “A domain is regarded as ‘small' if domain-specific sample size is not large enough to produce estimates of desired precision.” and “A domain (area) specific estimator is ‘direct' if it is based only on the domain-specific sample data.” In comparison, an indirect estimator is one that requires additional data. The additional data may come from the same geographic area though not part of the original domain-specific sample or it may come from related geographic areas and/or time periods. In all cases, the additional data are used, “… to increase the “effective” sample size. This is usually done through the use of models, mostly ‘explicit', or at least ‘implicit' that links the related areas and/or time periods …” to the original domain-specific sample data to yield estimates of acceptable precision.
The raison d'etre for SDE/SAE is that the data in one domain of information is too sparse to yield acceptable precision—root mean square error (RMSE) or other error statistic—for a desired estimate computed from the domain's sample data. To improve the precision/reduce the RMSE of the desired estimate, small area methods “borrow strength” (Ghosh and Rao, 1994) from auxiliary data, as the quotations from Ghosh (2020) in the previous paragraph outlined. Direct estimators, using only plots from within the domain of interest, may also incorporate auxiliary data for improved precision. However, the sample within that specific domain may not be large enough for estimates to be made sufficiently precise, even with the assistance of auxiliary data. This review includes methods of SAE as defined in the Introduction, as well as closely related direct methods that improve estimates of forest conditions.
When the definitional aspects of U.S. Census Bureau (2021), Lavrakas (2008), Pfeffermann (2013) and Ghosh (2020) are melded—all rooted in prior work by Ghosh and Rao (1994), Pfeffermann (2002) and Rao (2003)—definitional clarity emerges on two points. First, “small area” in SAE is synonymous with “small domain,” thus SAE and SDE are identical conceptually. Although SDE is the still the proper statistical term, when the domain is defined spatially, it's become common to refer to SDE as SAE. In the January 2019 issue of The Survey Statistician—newsletter of the International Association of Survey Statisticians—the editors said, “Small area estimation is one of the most popular topics in survey statistics of the 21st century.” (Krapavickaite and Rancourt, 2019, p. 3). Following the custom of the International Association of Survey Statisticians, the term SAE will be used instead of SDE in the remainder of this paper. Second and more important definitionally, “area” and “domain” are surrogates for the fact that the defined geospatial area or subdomain has a dataset too small to yield credible direct estimates. Thus, indirect estimators are required where data are few or even non-existent.
Forest Sector Interest in SAE
In forestry today, the word “area” is commonly considered a geospatial term that describes the space enclosed by a set of arcs (lines or boundaries to a closed polygon, defined by a set of vertices or coordinate points). The space inside the polygon—its “area”—is measured in units such as acres or hectares.
Whether an area with forests is considered “large” or “small” is typically a function of the jurisdiction of the public forester or private forest manager, landowner, or investor. To a forest manager or landowner responsible for hundreds to several thousand acres, “small area” might mean a specific stand, compartment, or management unit—a small subset of a property composed of tens to a hundred stands or compartments. To a state/provincial forester responsible for a million hectares or several million acres of forests, “small area” might mean a county, municipality, or group of counties and municipalities within their state or province. The point is the total forest area within a jurisdiction or ownership creates meaning and context for those responsible for the jurisdiction or ownership about what they consider a “large area” vs. a “small area.” This not only means that different foresters have different notions about relative sizes regarded as “small,” but their notions differ conceptually and fundamentally from what a “small area” means to a forest biometrician or statistician in the context of SAE. Consequently, there are currently misconceptions and misunderstandings within the forestry community over what “small area” in SAE really means. One of the purposes of this special issue of “Frontiers in Forests and Global Change” is to clarify conceptions and improve understanding at the science-policy interface between forest biometricians and statisticians on the one hand who have made much scientific progress the past two decades in SAE, and on the other hand, foresters, landowners, and investors who need reliable, credible estimates of forest conditions and trends to make well-informed resource management and policy decisions for lands within their purview.
In the forest sector, the domain/population for a national forest inventory (NFI)1 is typically the entire country. While the NFI sampling design and intensity may yield credible estimates2 at the national level, often the low spatial sampling intensities for NFI purposes may yield datasets too sparse for making estimates with acceptable precision at state/provincial, or smaller spatial scales. Forest managers and policy makers most commonly turn to digital aerial photography or data from other passive or active sensors3 as the auxiliary datasets to “borrow strength” (Ghosh and Rao, 1994) for improving the RMSEs of desired NFI data attributes. Through imputation models, including both parametric (e.g., multiple regression) and non-parametric models (e.g., k-nearest neighbor), image pixels are assigned to classes, such as species or cover types or stand heights, or given values, such as growing stock volume or biomass volume. Then, after geospatial boundary files are defined for the small area, the imputed pixel values are summarized using some algorithm to make an SAE with acceptable RMSE.
Organizers of an SAE-focused technical session at the 2019 Forest Inventory and Analysis (FIA) Stakeholders Science meeting4 invited the author to present a review of recent SAE research pertaining to forests by researchers outside the United States to provide context—both historic and current—for SAE presentations by U.S. researchers using NFI data from the FIA program. The invitation set the sideboards and shaped the survey design for this systematic review of SAE research.
Methods
Defining the Survey Criteria
Recent
Small area estimation research accelerated in the mid-1990s. There was an upsurge across many disciplines from basic statistics to diverse applied statistics disciplines. Starting in 2000, articles about developing SAE from NFI data began appearing in the forestry and remote sensing literature. This review assumed that papers published in the first decade of this century are already well-known. Thus, 2010 was the threshold chosen for defining “recent.” However, information is included from the previous decade (2000–2009) to provide context for the more recent decade.
Pertaining to Forests
Many articles have been published about SAE research across many different disciplines. They range from pure statistical theory to applied statistical research. Regarding applied research, results of case studies span all domains, from social (e.g., health care, education) and economic (e.g., poverty, marketing) to ecological (e.g., farm crop production, meteorology, and forests). Again, this paper ignores all the excellent work in other domains and sub-domains to focus tightly on applied statistical research related to making estimates of forest conditions from small geographic areas.
Outside the United States
Early SAE research was accomplished within the pure statistics community by statisticians outside the United States. Leading statisticians who summarized the state-of-science at various times were from Canada [J.N.K. Rao (Ghosh and Rao, 1994; Rao, 2003; Rao and Molina, 2015)], the United Kingdom [Danny Pfeffermann (Pfeffermann, 2002, 2013), Ayoub Saei and Ray Chambers (Saei and Chambers, 2003)], and Australia [Azizur Rahman (Rahman, 2008)]. Although their reviews included citations of work by statisticians in the United States, many—if not most—of the articles they reviewed were from researchers in Europe, India, and elsewhere.
A challenge to focusing on SAE research results from individuals and teams from outside the United States is that Ronald McRoberts,5 was deeply involved with colleagues from other countries in seminal SAE research pertaining to forests. The early international collaboration emerged from his activities within the International Union of Forest Research Organizations (IUFRO). Beginning in the late 1990s, McRoberts published many SAE articles with international coauthors. Therefore, it is impossible to tease apart completely the international SAE research progress pertaining to forests from domestic SAE research progress because so much of the early progress here and abroad was led or influenced by McRoberts.
With these three survey design criteria in place, the rest of the paper presents an overview of applied research since 2010 about connecting national- and regional-scale forest inventories to smaller geographic areas from researchers outside the United States.
Designing the Review Survey
There is little evidence that auxiliary data other than spatial information from passive or active sensors have been used in any of the forestry disciplines in the United States. For example, census data haven't been used to improve SAEs for woodland owners' characteristics or attributes. Nor have economic data from the Commerce Department's Bureau of Economic Analysis been used to improve SAEs for forests. Therefore, the search for international SAE activities will focus mainly on applications using remotely sensed data as auxiliary data, and secondarily on socio-economic census data.
The fact that remotely sensed spatial data have been the prime source of auxiliary data guided the design of the search for international examples down three pathways. First, a broad-based search for SAE research and applications by scientists from other countries was conducted using Google Scholar and ResearchGate. Two mandatory search terms were used (“small area estim” and “forest”) to identify journals that had the large numbers of SAE articles related to forestry. Second, detailed searches of the archives of the leading journals publications were conducted. Third, additional searches were conducted, based on literature cited in articles from the leading journals, and international authors who had published in the leading journals and may have published in journals less-frequently identified in the initial searches. Finally, based on these results, personal contacts were made with the leading experts working in NFIs in Europe and Canada to understand their current research programs underway and recent progress that perhaps had not yet been published. The experts were identified through the author's IUFRO network connections.
Results
Google Scholar and ResearchGate Search Engines
These two search engines take different approaches to identifying relevant content. Google Scholar is a web crawler that provides citations of articles that have the named search terms in their titles, abstracts, and keywords. But for full-text articles, the user must go to the publication's website. ResearchGate is a membership application whose members can upload citations and full-text articles that are then available to other members for downloading. Guldin (2018) contrasted these two applications and the relative difficulties they provide to practicing foresters searching for scientific information to use in their daily work. ResearchGate provides greater likelihood for free access to full-text articles.
Analysis of the initial search results showed that two journals dominated the forest-related applied SAE niche: Remote Sensing of Environment6 and Remote Sensing.7 Therefore, the review dove deeply into their article archives.
Remote Sensing of Environment
Leading Authors
The query of this journal's database yielded 12 articles from 2010 to May 2021 that had a total of 57 coauthors and an additional 13 articles from 2000 to 2009 that had 335 coauthors. Several researchers were authors or coauthors on multiple publications, Table 1.
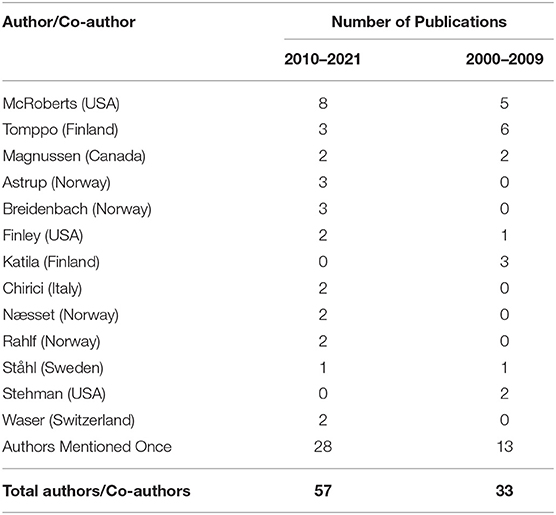
Table 1. Authors and co-authors of articles on small area estimation published in Remote Sensing of Environment since 2000.
Looking at all 25 articles since 2000, McRoberts was an author or coauthor on half of them (sole author on 5, lead author on 2, and coauthor on 6). Leading authors from other countries on three or more articles included Erkki Tomppo (Finland, 9), Steen Magnussen (Canada, 4), Rasmus Astrup (Norway 3), Johannes Breidenbach (Norway, 3), Andrew Finley (USA 3), and Matti Katila (Finland 3).
The data illustrate that although the number of publications in the two time periods were roughly equivalent (12 from 2000 to 2009 vs. 13 from 2010 to 2021), many more researchers have been involved as coauthors in the latter period. This highlights the recent growth in interest and a broadening of the talent studying this issue.
From a networking perspective, Tomppo and McRoberts were central figures. Tomppo's work began earlier, and his seminal contributions were recognized with the Marcus Wallenberg Prize in 1997.8 Tomppo and McRoberts coauthored six articles together (2007, twice in 2009, 2011, and twice in 2016). McRoberts coauthored two articles with Magnussen, two with Gherardo Chirici, and single articles with Breidenbach, Astrup, and Finley. Beyond publishing with McRoberts, Tomppo published three times in this journal with Katila, twice in this journal with Magnussen, Chirici, and Waser, and once with 12 others (all but one from Europe).
Leading Topics
The primary foci of these articles were to combine NFI field plot data with remotely sensed data from satellite-borne sensors [e.g., LANDSAT's Thematic Mapper (TM)] and aircraft-borne passive sensors (both panchromatic and infrared digital cameras) or active sensors (e.g., LiDAR). Through non-parametric (primarily) or parametric (secondarily) methods, detailed forest attributes in the field plot data were imputed to pixels in the remotely sensed data. Then the imputed pixel attributes were aggregated to estimate forest conditions (e.g., tree cover area, forest type) for small areas with too few field plots to make estimates with acceptable RMSEs without the sensor-based imputed information. Satellite-borne sensor data were used in 10 of the papers; aerial photography and LiDAR once each.
The k-Nearest-Neighbor (k-NN) algorithm was used in 6 of the 24 papers. The k-NN approach is based on similarity in the space of the selected auxiliary variables to impute a value to a pixel when a value is missing. The plot observations and the image pixels' spectral values for the field inventory plots are the “training data set.” An image pixel that isn't associated with a field inventory plot is assigned a value based on how closely its pixel spectrum resembles the spectrum of pixels in the training data set for plot locations in in the space of the auxiliary variables. In summary, every pixel in an image with missing values—pixels not associated with known forest inventory plots—can be assigned a value by finding its closest neighbors whose spectra closely resemble it and imputing a weighted mean of its nearest neighbors to it. Most of the early publications about k-NN were from the 2006–2010 era. Tomppo, McRoberts and/or Magnussen were the lead author or coauthors in all six papers. The most recent paper in the journal on k-NN was a review paper by Chirici et al. (2016).
A key factor in using the k-NN approach is the geospatial accuracy of the field plot centers/perimeter coordinates vis a vis the geospatial coordinates recorded by the sensor. This aspect was examined in several papers.
The variables whose values were most frequently imputed were the volumes of timber or growing stock and the area and types of forest cover. Estimating changes in cover—types of changes, their rates, and intensities—were discussed in two articles.
For 2010 to 2019, satellite or aerial photography were the auxiliary data used in eight of the 13 papers to study various forest attributes, including timber volume estimates (twice), tree cover (twice) and land use change. The precision of various models and estimators was examined in eight of the papers.
Remote Sensing
The second leading journal was the open-access MDPI journal Remote Sensing. This journal began publication in 2009. It classifies articles and special issues by broad sections, one of which is “Forest Remote Sensing.” In that section, 389 articles have been published since 2009, including articles in 37 special issues related to the section (https://www.mdpi.com/journal/remotesensing/sections/Forest_Remote_Sensing). Sixty-two of the articles in the category Forest Remote Sensing have “forest inventory” as a key word. Only one mentioned small area/domain estimation.
Latifi and Heurich (2019) edited a special issue of 10 papers titled, “Remote Sensing Based Forest Inventories from Landscape to Global Scale.” Two of the papers discussed SAE-related questions. Durante et al. (2019) focused on a 2.8-million-acre region in southwestern Spain, combining Spanish NFI field plot data, high-precision airborne laser scans (ALS), and bio-geophysical spectral variables from MODIS.9 Novo-Fernández et al. (2019) described estimation procedures that combined Spanish NFI data and ALS data to predict growing stock volume for three major commercial tree species growing in northwestern Spain. Details for both these papers are discussed further in the section on Spain's NFI, below. Hill et al. (2018) reported a case study from northwestern Germany, discussed further in the section on Germany's NFI, below.
Other papers having “forest inventory” as a key word had limited relevance to the SAE issue. In general, the articles tested ways of using NFI data to improve estimates from airborne or terrestrial LiDAR point clouds and data from various passive sensors. In many cases, the NFI field plot data were used to either demonstrate the utility of new sensors or sensor-platforms (e.g., small UAVs aka “drones”) or to improve various types of estimates made from the remotely sensed data. Some estimates were classification calls, such as forest cover type or forest vs. non-forest. Other estimates focused on stand characteristics, such as growing stock volume or above-ground biomass volume, or stand indices, such as leaf-area-index or normalized difference vegetation index. Some articles focused on individual tree characteristics, such as tree species identification. The aim of improving classification algorithms or stand estimates based on NFI data was to make estimates and inferences with acceptable RMSEs for larger geographic areas—regions or countries—from wall-to-wall remotely sensed data or to create geospatial data layers or map products. But in general, the novelty of the research reported either arose from applying a technique developed elsewhere to a new landscape or from showing how NFI field data could be used to calibrate remotely sensed data and save time and resources in developing larger spatial scale products—the opposite of the SAE issue for which this paper was invited.
Google Scholar Citations Since 2010
The first 200 “hits” returned by Google Scholar to the search terms “small area estim” and “forest” identified 21 articles published since 2010 within the scope of this review that were not published in either Remote Sensing of Environment or Remote Sensing. The Canadian Journal of Forest Research had one-third of them, the Scandinavian Journal of Forest Research and Forest Ecology and Management together had another third, and the last third were spread across six other journals.
The expanding impact of Nordic researchers in SAE is evident in the articles published in both the Scandinavian Journal of Forest Research and Canadian Journal of Forest Research. The former isn't surprising. The latter illustrates increased collaboration among Steen Magnussen (Canada) and researchers in Norway and Denmark. Magnussen et al. (2014) and Magnussen and Nord-Larsen (2020) illustrate the international collaboration on SAE that currently exists, with the lead author being from Canada and coauthors from Norway, Switzerland, and Denmark. The former article introduced five facets that can improve inference in SAE: (1) model groups; (2) test of area effects; (3) conditional EBLUPs,10 (4) model selection; and (5) model averaging. Two contrasting case studies with data from the Swiss and Norwegian NFIs were used to demonstrate the five facets. The latter article used data from the Danish forest inventory to demonstrate how spatial model strata for post-stratification (e.g., for SAE) can be identified from design-based model-assisted inference with either lasso or finite mixture modeling methods.
Other articles published the past 3 years that illustrate the Nordic and Canadian collaboration include Rahlf et al. (2021), Strîmbu et al. (2021), Breidenbach et al. (2020), Astrup et al. (2019), and Haakana et al. (2019a,b). Rahlf et al. (2021) found that maps based on NFI data augmented by ALS data can be used in lieu of maps developed from forest management inventory (FMI) data to estimate timber volumes in mature spruce stands—potentially saving the cost of doing an FMI. Strîmbu et al. (2021) dealt with the issue of inconsistency that arises when one attempts to aggregate parameter estimates for SAEs to a larger domain and the sum differs from the directly estimated domain parameter. Breidenbach et al. (2020) used Sentinel-211 mosaics along with NFI data to model and map Norwegian conifer types. The models were then used to create species-specific range maps for smaller geographic areas, such as municipalities. Astrup et al. (2019) described how photogrammetric point cloud data were combined with NFI point cloud data to produce a 16 × 16 m raster map with selected modeled attributes that could be used in FMIs. The two articles by Haakana et al. (2019a,b) focused on using post-stratification as an alternative way to use auxiliary information to estimate parameters for municipalities from Finland's NFI data.
ResearchGate Citations Since 2010
The first 50 citations returned during a search (“small area estima” and “forest”) had 20 articles since 2010 and 6 from 2000 to 2009 that matched the sideboards of this review. Seventeen of the articles had been previously identified in searches of Remote Sensing of Environment, Remote Sensing, Scandinavian Journal of Forest Research and Canadian Journal of Forest Research. Of the other 24 articles outside the sideboards of this review, 18 dealt with research on North American forests and 6 with research about forests in Asia and Oceana.
Two articles providing overviews were found in the ResearchGate search; Kangas et al. (2018) and Jiang and Rao (2020). Kangas and her 10 coauthors reviewed the state of science in Nordic country NFIs and how remotely sensed data are being used to augment NFI and FMI data and reduce uncertainties in parameter estimates—nationally and sub-nationally. More importantly, the article also lays out a roadmap for future research and development work and proposes a common research program for the Nordic countries focused on six identified problem areas. Although not focused on forest inventories, the overview of SAE methods by Jiang and Rao (2020) is a good current synopsis of the current state of statistical research. It is a good entry point for readers desiring an organizing framework for the many different SAE methods.
Discussion
Online searches using Google Scholar and ResearchGate for recent research pertaining to SAE of forest conditions in countries outside the United States shed some additional light on the state of science. There was a notable lag, often several years, between journal publication and when the search engines reported it. Besides Remote Sensing of Environment or Remote Sensing, three other journals have published a growing number of articles on SAE, notably the Canadian and Scandinavian Journals of Forest Research and Forest Ecology and Management (e.g., McRoberts, 2012; McRoberts et al., 2017). This suggests that researchers desiring to follow SAE advances should focus first on those five journals, before relying on broader search engines to find new international research on SAE pertaining to forests.
The emergence of journal policies to publish accepted journal on-line prior to articles appearing in printed volumes often results in two different years for citations. For example, Haakana et al. (2019b) was published on-line on 10 December 2019 but didn't appear in print until the April 2020 issue. The citations in this article use the on-line publication date rather than the in-print date.
Status of Small Area Estimation in National Forest Inventories: Global Overview
Barrett et al. (2016) summarized the operational use of remotely sensed data in NFIs, based on the responses of 45 countries' experts (representing 65% of global forest area) to a questionnaire circulated as part of the COST Action FP1001.12 They found that remotely sensed data—from many different sensors—were widely used to enhance estimates for many parameters but called for further research on ways to improve uncertainty estimation by better integrating remotely sensed data and field data.
Thirteen countries used spatial datasets (e.g., digital elevation models, soils, and geology maps, ownership data) from other sources beyond the NFI program to enhance forest map data layers that were constructed from satellite-borne sensors and field data. The most common map layers produced were land cover/land use, forest cover type, and species group maps.
Where insufficient field data were available, nine countries reported that imputation models were used to integrate other spatial datasets and available field data to predict ground attributes (from which maps can be created) and calculate local estimates. Many different prediction techniques were used. Eight countries used supervised parametric techniques (maximum likelihood, discriminant analysis, and linear, non-linear, and logistic regression). Seven countries used non-parametric methods (k-NN) and unsupervised approaches (neural networks, isodata, or k-means). But only 12 countries attempted to estimate uncertainty for map attributes they estimated or imputed, and only nine countries attempted to include uncertainty estimates for area statistics associated with forest area vs. non-forest area maps.
From the articles reviewed that were published in the last 5 years (2016 to 2021), it's apparent that the focus of forest-related SAE research outside the USA is shifting. Three major threads have emerged:
1. Using model-based approaches and NFI data to make estimates at smaller spatial scales—provinces, forest management units, municipalities. The focus is on demonstrating that existing well-funded and well-designed NFIs can supplant less-well funded FMIs for many regional/local purposes. While stand-level inventories still have their place in planning management activities, the NFI-based SAEs show promise in helping offset lack of support and funding for FMIs. In some cases, NFI-based models are being used to sort out priorities for stand/compartment exams.
2. Increased focus on methods for reducing uncertainties of estimates and improving precision of estimates. Several articles described using simulation approaches, based on NFI data, to explore alternative estimation procedures that reduce uncertainties/improve precision. Creating simulations is faster and less expensive than gathering plot data to test alternative SAE approaches.
3. Estimating above ground biomass (AGB) volume has become a prominent parameter of interest for SAEs, eclipsing interest in estimating timber volumes. Recently adopted global policies, such as greenhouse gas reporting and REDD+, have driven this shift. Public and governmental interest in understanding better the roles of forests in sequestering carbon and tracking forest carbon stocks and fluxes at the sub-national level have also played a role. Changes in the objectives of grant programs have been used to shift the focus of SAE research.
Switzerland's National Forest Inventory: Overview of SAE Research Since 2010
Recent work done in Switzerland's NFI program was summarized by Pulkkinen and Zell (2019).
Background
The Swiss foundation on sampling theory for forest inventory rests upon the design-based Monte-Carlo approach, where sampling is carried out for an infinite population of the points within a region of interest (see Chapters 4 and 5 in Mandallaz, 2008). Target parameters are spatial means computed as tree-population totals (sums of tree characteristics over all the trees within the region) divided by the area of the region. The spatial means are equal to the expectations of the local densities of the target variables over the uniform distribution of points within the region. The local density of a target variable is defined at each point of the region as the ratio of the Horvitz-Thompson estimate of the tree population total of the variable, based on a probability sample of trees taken at the point, to the area of the region.
In the population of the points within the region, a two-phase sampling approach is typically used. First, many uniformly randomly located sample points are drawn independently of each other and auxiliary information is collected at these points. Second, a simple random sample from the first-phase points is used to locate field plots where data are collected on the target variables (i.e., their local densities). In a three-phase sampling approach, there are two nested phases for collecting auxiliary information before field plots are identified. In practice, points are located at the intersections of systematic grids whose starting point and orientation of the largest grid being considered are chosen randomly. Therefore, the variance estimators derived from the assumption of uniform random locations can be considered generally conservative. The Swiss NFI follows this design-based Monte Carlo paradigm with its two-phase simple random sampling for post-stratification estimation, where the auxiliary information is used to do the post-stratification.
The Swiss NFI is now in its fifth cycle. The methodology of the fourth cycle (2009–2017) was detailed by Fischer and Traub (2019). The 5th cycle continues the continuous mode adopted for the fourth cycle by systematically measuring 1/9th of the field plots over the whole country each year. The field plots are located on a 1.41 × 1.41 km grid, whereas the auxiliary information, mostly based in digital aerial images, is currently available on a 100 × 100 m super-grid.
For small-area estimation, the design-based model-assisted approach is used. Design-based inference relies on probability samples for validity and its estimators of population parameters are generally unbiased. Design-based inference relies on three assumptions: a probability sample incorporating some form of randomization is used; each population unit has one and only one possible value; and selection of population units into the sample is based on positive and known probabilities of selection (McRoberts et al., 2019). Brewer (2013) equated design-based with randomization-based inference, and contrasted it to model-based inference, which he equated with prediction-based inference.
Model-assisted means that a model is used to support estimation following probability sampling (Ståhl et al., 2016). A prominent example of model-assisted survey sampling in a forest inventory context was highlighted by Gregoire et al. (2016), who described how the point cloud of airborne LiDAR height measurements can be linked by statistical regression to estimates of forest biomass from a ground sample of forested plots whose trees have their heights measured and above-ground biomass volumes computed from equations. Pulkkinen and Zell (2019) reported that end-users and stakeholders in the Swiss NFI prefer the design-based, model-assisted approach, albeit using digital aerial photography rather than airborne LiDAR, over a model-based/model-dependent approach.
Development of New Design-Based Model-Assisted Small Area Estimators
At ETH Zurich, Mandallaz and his students have developed new design-based model-assisted estimators that involve: (i) non-exhaustive auxiliary data (auxiliary data not available wall-to-wall but coming from a sample); and (ii) external models of any type (models constructed in the data that are entirely independent of the current field plot data of the small area) or internal linear models (linear models fitted to the data containing the current field plot data of the small-area). The estimators consist of the means of the: (i) model predictions over the auxiliary data points (null/first-phase sample); and (ii) model residuals over the field plots (second-phase sample) within the area. When using an internal model, the idea is to fit a model “globally” in a large region containing the area of interest, and to apply it “locally” to the specific area. In this case, like in the classical regression estimators developed for finite populations, the variation of the model parameter estimates over (hypothetical) repeated samples is considered in the variance estimators of the new small-area estimators. Further, the uncertainty due to employing estimated auxiliary variable means instead of (unavailable) true means is incorporated in the variance estimators. The researchers also present an approach where the internal linear model is extended with the indicator variable(s) of the area(s), thus eliminating the residual-dependent part of the estimator, which greatly simplifies the calculation of the variance.
Mandallaz (2013) introduced the new small-area estimators for two-phase sampling, with both exhaustive and non-exhaustive auxiliary data and including the special case of cluster sampling. He illustrated the estimators with a small case study and with a simple simulation example. Mandallaz et al. (2013) completed this work by presenting the estimators for the case where some auxiliary variables are available exhaustively (wall-to-wall) and others non-exhaustively. They tested the estimators with a simulation example like the one in the earlier paper but with a larger case study using data from the Swiss NFI. Hill et al. (2018) applied the estimators for timber volume estimation in forest management units of two levels (forest districts and sub-districts) in the German state of Rhineland-Palatinate using data from the German NFI.
Mandallaz (2014) extended the two-phase small-area estimators with partially exhaustive auxiliary data to three-phase sampling, where the auxiliary variable values come from nested null- and first-phase samples. He illustrated the estimators with a simulation example like those in the earlier papers.
Massey et al. (2014) applied these three-phase estimators to estimate timber volumes in the five production regions (summing up to the entire country) of the fourth Swiss NFI, when only three annual panels (out of nine) of field plot data were available. The reduced second-phase sample size was compensated by using the full field plot data from the third inventory as the first-phase auxiliary data, in addition to the usual aerial photography used as the null-phase auxiliary data. Steinmann et al. (2013) applied the two-phase synthetic and difference estimators (involving external models) for forest area and timber volume estimation in the Swiss canton of Aargau using data from the Swiss NFI. Two doctoral theses have resulted from this research (Massey, 2015; Hill, 2018). Hill et al. (2021) have implemented the estimators discussed above in the R package forestinventory.
Construction of SAE System for Swiss NFI
In an ongoing project, Pulkkinen, Lanz, and Zell are developing an operational system for producing estimates of several target parameters for small areas/domains in the Swiss NFI. Auxiliary information comes from several sources, the most important being a vegetation height model estimated from a digital elevation model of tree canopy height and a LiDAR-based terrain elevation model. The small-area estimators included in the system are the design-based model-assisted estimators discussed above, with (i) internal linear models or (ii) external models of any type, and with estimated auxiliary variable means. When internal models are used, they are built/fitted separately for each small area/domain. Currently, the system estimates forest area, total growing-stock volume, and total growing-stock biomass above ground for the cantons, forest districts and municipalities in Switzerland.
Norway's National Forest Inventory: Small Area Estimation on Multiple Scales
Breidenbach et al. (2019) presented the status of SAE research and use in the Norwegian NFI. national forest inventory field plot inventory data are combined with 3D remotely sensed data to estimate forest characteristics at different spatial scales. ALS and image matching are currently used as auxiliary information to create the NFI's forest resource map SR16, a raster map with a pixel size of 16 × 16 m (Astrup et al., 2019). While model-dependent methods were used on the scale of pixels and forest stands (Breidenbach et al., 2015), model-assisted estimators were used on the scale of municipalities and larger area of interests (Breidenbach and Astrup, 2012).
Developing Forest Resource Map SR16
Development of SR16 tested new methods for using ALS to make stand-level estimates and comparing those estimates with independent data from a FMI. Astrup et al. (2019) described the development and utility of the SR16 in greater detail. They used photogrammetric point cloud data with ground plots from the Norwegian NFI. First, an existing forest mask was updated using object-based image analysis methods. Within the updated forest mask, a 16 × 16 m raster map was developed with Lorey's height (hL),13 volume, biomass, and tree species as attributes. All attributes were predicted with generalized linear models that explained about 70% of the observed variation and had relative RMSEs of about 50%. The raster map was then segmented into stand-like polygons that internally were relatively homogenous with respect to tree species, volume, site index, and hL. When SR16 was used as auxiliary information to NFI field plot data and a model-assisted estimator, the precision was on average 2–3 times greater than estimates based on field data only. In conclusion, SR16 was useful for improved estimates from the Norwegian NFI at various scales. The mapped products may be useful as additional information in forest management Inventories (FMIs).
Applying SR16 to Small Area Estimation
One of the biggest challenges for the Norwegian NFI is satisfying the interests of stakeholders in forest attribute information for small sub-populations, such as municipalities or protected areas (Breidenbach and Astrup, 2012). Auxiliary information that is correlated with attributes of interest can improve the precision of estimates. Two examples have been recently reported in the literature. In the first one, Breidenbach and Astrup (2012) used the height and volume information in SR16 to improve the estimates of mean above-ground biomass for small areas. In the second (Breidenbach et al., 2019), ALS and SR16 data layers were used to improve the precision of information for FMIs. FMI data required local adjustments to obtain the desired precision. Mixed-effects models were fit, using fine-scale ALS data. SR16 data layers used to make SAEs were compared to FMI stand-level estimates. The RMSD between FMI and SR16 estimates of timber volume on stand-level ranged between 11 and 17%. While no systematic deviation was visible for stands in mature pine forest types, SR16 data underestimated timber volume in mature spruce forests by 12%, especially in ALS projects where the NFI data did not cover the full range of explanatory variables. They concluded that the accuracy of SR16 map data layers may be sufficient for most small-scale forest owners and for some strata for larger forest enterprises. Accuracy can be improved, and systematic errors removed by integrating auxiliary information where a limited number of NFI plots do not cover the range of explanatory variables within an ALS coverage area.
Germany/s National Forest Inventory: Small Area Estimation at the District Level
Hill et al. (2018) described a double-sampling extension of the German NFI to make design-based SAE at the forest district level. They used an ALS-estimated canopy height model and a tree species classification map based on satellite data as auxiliary data with a regression model to produce timber volume predictions.
The German NFI is based on a nationwide 4 × 4 km grid. But some states (Rhineland-Palatinate in Hill et al., 2018) have intensified the sample to a 2 × 2 km grid. At each grid point, field crews collect data from a cluster of four sample plots, arranged in a square with 150 m sides. The number of actual plots measured in a cluster can vary between one and four depending on the forest/non-forest decisions made by the crew. At each sample point, trees to tally are identified using a BAF 4 m2/ha prism/relascope, and included if their DBH is >7 cm.
Wagner et al. (2017) used SAE methods to estimate spruce timber reserves in the Rhineland-Palatinate's forest districts. The state forest inventory and an ALS-based canopy height model provided the data. A new spline-based SAE method was proposed. It provided stable estimates that met specialized constraints. Results were compared with existing spruce timber estimates.
Rationale for SAE Research
Rhineland-Palatinate is one of the two most densely forested German states, with 8,400 km2 of forest comprising 42% of the land area. Two characteristics dominate Rhineland-Palatinate forests. Mixed forest stands dominate (82% of the forest area). Public ownership dominates private ownership−27% are state-owned forests and 46% are municipally owned vs. 27% that are privately owned. The state forest agency has a mandate to sustainably manage state and municipal forests, including planning, harvesting, and selling wood. Therefore, the state has been further sub-divided into 45 districts (averaging 43,777 ha), and 405 sub-districts (averaging 4,624 ha). A key question for the state agency is where and how to gather information suitable for managing at the state, district, and sub-district levels. While the NFI information is helpful at the state level, estimators at the district and sub-district level derived from the NFI have unacceptable RMSEs for planning and implementing management activities. Many states have solved this problem by establishing forest district-level inventories (FDI) with much greater sampling intensities than the NFI (e.g., the quadruple intensification of NFI in Rhineland-Palatinate). But FDIs are costly, and many states are facing increasing restrictions on budgets and personnel. Therefore, states are seeking more cost-efficient inventory methods, among them SAE methods.
Researchers from ETH Zurich and the Rhineland-Palatinate State Forest Service partnered to test SAE approaches for cost-efficiency. They considered three types of design-based regression estimators suggested by Mandallaz (2013) and Mandallaz et al. (2013): Pseudo-small, extended pseudo-synthetic, and pseudo-synthetic. Auxiliary data were a canopy height model from nationwide ALS and a tree species classification map to be used for regression estimation within tree species strata. A double-sampling approach was used, for five reasons discussed in detail in Hill et al. (2018). At the district level, results showed that both the pseudo-small and the extended pseudo-synthetic estimators led to substantial reductions in estimation error compared to the standard one-phase estimator. But the sub-district level was too small geographically and had too few sampling points to achieve the same estimated error reduction as at the district level. However, estimation errors at the sub-district level were still smaller than the standard one-phase estimator (20 vs. 40%). But the authors acknowledged that further research is needed to determine whether the achieved reductions in error levels are enough to support forest planning decisions.
A complicating factor in the case study was that the ALS data were of various ages—some relatively recent, others a decade old. Beyond the obvious issue of tree height growth over a decade, a tougher challenge was that laser sensor technology advanced rapidly over the decade, resulting in much denser point clouds for recent years compared to older years. As older scans are replaced by newer scans, the power of the auxiliary information will improve—both in terms of consistent tree canopy height models across the landscape and within the tree species strata.
The methods introduced by Hill et al. (2018) are being tested on NFI data from other states. In 2019, data from Thuringia were being tested and data from Mecklenburg-Pomerania was next. The intent is to have these new estimation features operational by 2023, at the latest, after completion of the 2021/2022 inventory cycle.14
Finland's National Forest Inventory: Efficiency of Post-stratification for Small Area Estimation
Tomppo (1990, 1991) was the global pioneer in combining NFI data, satellite data, and k-NN for making estimates. His research formed the intellectual foundation for Finland's NFI, and for SAE work in many other countries, including the United States.
Haakana et al. (2019a,b) reported on recent research in Finland, using southern Finland provinces and municipalities within provinces as test regions both for making point estimates (e.g., growing stock volume by tree species groups) and evaluating variances estimated by alternative methods. They found that post-stratification, based on remotely sensed data, even if old and incomplete, improves efficiency in estimating selected variables at the provincial and smaller municipality levels when compared to results from making estimates using only current NFI data. Work by Tomppo, McRoberts, and Magnussen was extensively cited.
The two papers explored several options for obtaining auxiliary information to use in post-stratification. Sweden was cited as an example where official statistics are based solely on field plots, but estimates are developed using design-based post-stratification, based on k-NN maps or other map products.
Haakana et al. (2019a) presented a case study on estimating growing stock volumes by tree species groups. The auxiliary information was derived from NFI volume maps available for provinces in southern Finland. These maps were developed from the data gathered in the previous NFI iteration (2005–2008) and LANDSAT 5 TM imagery from 2007. Full-coverage raster maps with 20 m pixels were created by combining satellite images, digital map data, and NFI sample plot data and then using the k-NN method to estimate growing stock volume, by species group, for each pixel in a forest land mask. Procedures described by Tomppo et al. (2012) were used.
One of the challenges discussed was the use of older volume maps from the prior NFI iteration combined with older LANDSAT 5 TM data. The primary reason for using older maps based on older remotely sensed data was to use independent auxiliary data. But during the intervening time, many forest management activities, such as thinnings and final harvests, occurred, which reduced the correlation between the older auxiliary data and the current NFI data. But the reduced correlation and potential reduction in estimation efficiency weren't quantified—just recognized—because updating the prior information was thought too costly for the project.
Post-stratification by mean volume improved the precision of both area and volume estimates for forest area and growing stock volume compared to using NFI data alone. Relative efficiencies ranged between 2.3 and 3.5. As expected, post-stratification resulted in a smaller decrease in mean relative standard error for the smaller areas than for the larger areas. This result held both for the forest area variable as well as for total growing stock volume and volume by tree species stratum (pine, spruce, birch, and other deciduous strata). Further, the small area estimates from post-stratification were robust compared to the field plot data estimates because the largest variances improved more than the average variances.
Haakana et al. (2019b) acknowledged that the k-NN method can provide a model-based estimator for small geographic areas, but not a designed-unbiased estimator for RMSE. Thus, in this article they focused specifically on municipalities to explore the lower limits in geographic size that could still yield estimates of forest area and growing stock volume with adequate precision. They explored the differences in estimation efficiency and error estimates for various sizes of areas—ranging from 5,700 to 921,600 ha—made possible by post-stratification.
The major conclusions of the two articles were that: (1) utilizing old forest resources maps in a fully operational approach for national level estimation improved estimates; and (2) although post-stratification enabled forest area and growing stock to be estimated more accurately for much smaller geographic areas than with field plot data alone, post-stratification should be limited to the smallest municipalities where model-based estimation is still needed. Haakana et al. (2019a) acknowledged that precision could be further improved by updating maps to account for thinning, regeneration cuttings, and final harvests; segmenting maps and remotely sensed data into homogenous segments; and by having improved boundary files for municipality land use classes. But overall, these opportunities didn't detract from the overall results.
Katila and Heikkinen (2020) reviewed the time-series of k-NN estimates over two decades for municipalities, based in NFI data. Their interest was in the variation among estimates from different time periods—exceeding 10% in mean volume—which they believed indicated a systematic error in SAEs. They combined NFI estimates from three points in time−2011, 2013, and 2015—and found that multi-temporal data fusion made small but consistent improvements in the estimates.
France's National Forest Inventory: Three-Dimensional Auxiliary Data
Since 2005, the French NFI has used a two-phase sampling design on a 1 km grid. Each year, one-tenth of the plots are photo-interpreted for land use and land cover in the first phase. Then in a second phase, a sample is drawn as a function of land cover types, resulting in about 6,500 plots being measured each year nationwide.
Vega et al. (2021) introduced a new estimation algorithm to balance between statistical precision and spatial scale. The algorithm identifies the smallest possible groups of domains satisfying prescribed sampling density and estimation error. The research used NFI data from oak-dominated areas in the Sologne and Orléans areas of central France, covering 157 municipalities of varying sizes. Auxiliary data were a national forest cover type map, a canopy height model from digital aerial photographs, and LANDSAT imagery. The algorithm depends on the statistical strength between the field attributes—growing stock volume and basal area in this case—and on auxiliary variables and the spatial heterogeneity of the forests. Results illustrate the balance between desired precision and the spatial scale required to attain that precision in attribute estimates.
Fortin (2020) explored the problem caused by annually sampling only a portion of the NFI population of plots and the impact on variance of point estimates for a geographic area when plot data are from 1 to 10 years old. Fortin proposed overcoming the difference in time since last remeasurement by using an individual tree forest growth model (MATHILDE) to update older plot measurements to account for growth since last measurement. But this seemingly simple solution leads to a hybrid inferential model where uncertainty arises not only from the sample design but also from the growth model used to update measurements (Kangas et al., 2019). Fortin tested the updating approach on French NFI data from the Lorraine region and concluded that under certain conditions, using a forest growth model can increase the precision of inventory estimates.
Irulappa-Pillai-Vijayakumar et al. (2019) used three-dimensional (3D) variables from photogrammetric-estimated canopy height models, a forest type map, vegetation indices, and LANDSAT 8 spectral bands as auxiliary data to lend strength to French NFI data for a 733,500-ha region in central France that is 48% forested. Adding complexity was the fact that much of the forest in the region was a mixed broadleaved species cover type that was more diverse in species composition and therefore in form, structure, and fragmentation than the typical conifer forest. The objective of the research was to test whether multivariate k-NN imputations could improve the precision of estimates for 11 forest attributes beyond the precision based solely on NFI data.
The NFI data came from 755 plots measured from 2010 to 2014. Irulappa-Pillai-Vijayakumar et al. (2019) goes into considerable detail about the significant effort invested and difficulties encountered in: (1) transforming digital aerial photography and ALS into 3D digital terrain models that could be used to estimate canopy height models for two different time periods (2008 and 2014); and (2) using the estimated changes in height between 2008 and 2014 to estimate changes in other forest attributes, such as stand density, basal area and several different types of volume. Finally, auxiliary data for all 11 variables were converted to a spatial resolution of 30 m to conform with the spatial resolution of the TM sensor aboard LANDSAT.
Results were that volume attributes had the greatest reduction in errors. Using 3D change estimates contributed to the substantial increase in precision and improved neighbor selection within the k-NN method. The authors reported that these results open possibilities for improving forest attribute estimation for smaller areas. Their downscaling work continues.
Spain's National Forest Inventory: Integrating NFI Field Plot Data With Airborne LiDAR Data
Four recent papers have discussed research in Spain, including Condés and McRoberts (2017), Esteban et al. (2019), Durante et al. (2019), and Novo-Fernández et al. (2019).
Condés and McRoberts (2017) reported new methods to update NFI-based estimates when the year of the most recent NFI survey doesn't match the required year for international reporting requirements. Their main aim was to develop an unbiased method to update NFI estimates of mean growing stock volume (m3/ha) using models to predict annual plot-level volume change, and to estimate the associated uncertainties. Because the final large area volume estimates were based on plot-level model predictions rather than field observations, hybrid inference was necessary to accommodate both model prediction uncertainty and sampling variation. Specific objectives were to compare modeling approaches, to assess the utility of Landsat data for increasing model prediction accuracy, to select the most accurate method, and to compare model-based and design-based uncertainty components. For four forest types, data from the 2nd and 3rd Spanish NFI surveys together with site variables and Landsat imagery were used to construct models to predict NFI information for the year of the 4th NFI survey. Data from the 3rd and 4th surveys were used to assess the accuracy of the model predictions at both plot-level and large area spatial scales. The most accurate method used a set of three models: one to predict the probability of volume removals, one to predict the amount of volume removed, and one to predict gross annual volume. Incorporation of Landsat-based variables in the models increased prediction accuracy. Differences between large area estimates based on plot-level field observations for the 4th NFI survey and estimates based on the model predictions were minimal for all four forest types. Further, the standard errors of the estimates based on the model predictions were only slightly greater than standard errors based on the field observations. Thus, model predictions of plot-level growing stock volume based on field and satellite image data as auxiliary information can be used to update large area NFI estimates for reporting years for which spectral data are available, but field observations are not.
Esteban et al. (2019) described an approach to model-assisted inference, using a random forests (RF) approach. RF has recently emerged as a popular approach because it's able to select and rank many predictor variables and it relies on an ensemble of trees as a strategy to improve model robustness. Random forest consists of a combination of decision trees where each decision tree contributes a single prediction for each population unit with the final prediction for each unit calculated as the mean over the RF decision tree predictions. Although RF has been used by others, little literature is available on model-based mean square error (MSE) estimation for population parameters with this algorithm. The study had three objectives:
1. Construct RF models to predict response variables (volume and above-ground biomass) and changes in the response variables for population units (ALS cells);
2. Compare multiple bootstrap estimators of the model based MSE of the estimate of the population mean; and
3. Construct change maps and change uncertainty maps.
Two study areas were used, one in the La Rioja region of Spain and the other in Våler municipality, southeastern Norway. The Spanish data included plot-level volume datasets acquired at different times for different plots as well as corresponding multi-temporal ALS (2010–2016) and multi-spectral data. The Norwegian data included plot-level biomass datasets for two times for the same plots and temporally consistent ALS data (1999, 2010). The authors concluded that RF models adequately described the relationship between field plot measurements of volume and biomass per unit area and remotely sensed data. They also found that model-assisted and model-based estimators based on RF predictions produced similar estimates of population means and change estimates and smaller MSEs than expansion estimators. Some insights into two bootstrapping approaches were provided too.
Durante et al. (2019) focused on a 2.8-million-acre region in Spain, combining Spanish NFI field plot data, fine-precision ALS, and bio-geophysical spectral variables from MODIS. The novelty of the study was testing a two-stage upscaling approach where above-ground biomass estimates from ALS data were first calibrated with NFI field plot data from 242 NFI field plots, then used to train a machine-learning method that could be applied to MODIS-estimated indices and topographic factors to develop wall-to-wall maps of above-ground biomass for the region. In one sense, this is the reverse of usual SAE approaches, borrowing strength from the NFI field plot data to improve biomass estimates made from laser point clouds and then link the improved biomass estimates to MODIS data to create a regional map. The authors again highlighted the difficulties created by lack of precision in field plot center coordinates (5–15 m nominal accuracy) compared to ALS data. The biomass model was based on four types of information: (1) 2 m resolution ALS data; (2) sketches of field plot layout; (3) high resolution ortho-imagery from the Spanish National Plan for Aerial Orthophotography; and (4) total height, species type, and location of each tree in the field. Earlier work in case studies in western Finland by Maltamo et al. (2009) and Norway by Nelson et al. (2012) were cited.
Novo-Fernández et al. (2019) carried out similar work in northwestern Spain. The area studied contains forest plantations that contribute 58% of the annual national timber harvest and thus are important to commercial enterprises producing panelboard, sawn lumber, and pulpwood. Dominant species are Eucalyptus globulus Labill, Pinus pinaster Ait., and Pinus radiata D. Don. Therefore, the main objective of this study was to generate a fine-resolution raster database with information about key forest yield variables such as total over bark volume (m3/ha) and total aboveground biomass (t/ha), by species. Secondary objectives—necessary to achieve the first objective—included: (1) development of a procedure to harmonize the Spanish NFI and ALS data; (2) selection of the best empirical models of relationships between field measures and ALS-derived metrics, by comparing a parametric machine learning technique (multiple linear regression) and several well-known non-parametric techniques; and (3) to estimate spatially-continuous maps of yield variables. The same methodology has been used in Austria, Denmark, Sweden.
Summary
Small Domain Estimation research in the forest sector has focused almost entirely on spatial domains to the exclusion of other domains, hence the term SAE has replaced SDE in the forest inventory literature. SAE research and applications are underway in many European countries to improve estimates—reduce the RMSE or confidence intervals—of forest attributes based on sample data collected on NFI field plots.
Airborne LiDAR data are becoming increasingly popular as auxiliary data, especially where country-wide laser scanning has replaced country-wide aerial photography as the raw data for national topographical mapping, transportation, or other agencies.
Design-based model-assisted SAE inference methods are being used in several countries, but pure model-based or hybrid inference methods are also being explored. Each methodology has advantages in specific situations. Regardless of methodology, the k-NN approach is the current “standard,” although with tweaks here and there. Various two-stage or double-sampling approaches are popular for post-stratification.
The intellectual leadership in SAE research in the forest sector is broadening. In the 1990s and first decade of the twenty-first century, only a few researchers—notably Erkki Tomppo and Ronald McRoberts—had published more than two articles on the topic. Since 2010, the forest SAE literature documents increased trans-national collaboration by many more authors and coauthors in advancing the use SAE. This review found that the influence of Daniel Mandallaz and his students from ETH-Zurich is growing.
McRoberts pointed out15 that as scientific disciplines mature, they inevitably move through a three-step sequence of phases:
1. Descriptive studies (estimating means and variances);
2. Predictive studies (creating models and maps); to
3. Inferential studies (determining confidence intervals for population parameters, testing of hypotheses).
National forest inventories moved early into the inferential phase, but remote sensing is just now moving into that phase. The point is that as remote sensing research and applications in the forest sector mature, they will inevitably become more rigorous statistically and characterized by use of more sophisticated statistical techniques. Greater statistical sophistication will of necessity entail greater attention to uncertainty issues in estimates, models, and predictions. There is some evidence from this review of international research that this progression of phases is occurring; as it also is currently progressing in the United States.
The increase since 2010 in research and applications of SAE methods is being driven largely by NFI stakeholders' needs for information about forests at sub-national and sub-state/sub-province spatial scales. Two driving forces stood out in the literature reviewed. First, the costs—financial and staffing—of forest management unit inventories are pinching the budgets of state/provincial forest managers. They are searching for cost-cutting measures and using NFI data to make more precise estimates at sub-national levels is emerging as a viable solution.
Second, international carbon-accounting reporting expectations are growing. Carbon stocks and fluxes now need to be estimated from spatially and species-specific forest inventory data rather than simply applying broad-based, generalized, per-area carbon estimates to forest cover type area estimates. Hence, greater emphasis on obtaining above-ground forest biomass estimates specific to forest-cover-types or species for discrete regions of a country (accounting for site differences, such as soils, geology, topography, and land use patterns). If smoothly functioning markets emerge that compensate forest landowners for carbon sequestered in forests, agencies, and landowners want to have site- and species-specific, statistically reliable information available to support their payment contracts.
Three final points. None of the recent literature reviewed cited the need for or use of SAE estimates to satisfy forest certification criteria. Second, as interest in forest carbon markets continues to grow, it will be interesting to see if SAE estimates of forest carbon stocks and fluxes become acceptable to market investors. The emergence of interest in estimating AGB portends this issue. Third, although this paper focused on forest-sector literature dominated by authors and applications outside the United States, there is much SAE underway inside and outside the forest sector within the United States. Researchers for the U.S. Census Bureau (2021) can provide useful entrees to SAE outside the forest sector, just as similar SAE research outside the forest sector is reported by the European Union and national statistical agencies of individual European countries.
Data Availability Statement
The original contributions presented in the study are included in the article/supplementary material, further inquiries can be directed to the corresponding author/s.
Author Contributions
The author confirms being the sole contributor of this work and has approved it for publication.
Funding
The manuscript was prepared using my company's funding.
Conflict of Interest
RG owns Guldin Forestry LLC, a sole-proprietorship forestry consulting firm through which he conducts forest research, forest resource assessments, and analyses of forest policy issues for clients in the United States of America and internationally. He declares that he received no funding from any source outside his firm to prepare this paper. He alone was involved in the study design; the collection, analysis, and interpretation of the data; and the writing of this article.
Acknowledgments
The author thanks Ronald McRoberts for reviewing the original paper and providing many helpful technical revisions and several additional citations from recent European studies. Whatever errors remain is solely the responsibility of the author.
Footnotes
1. ^National forest inventory means an inventory of all the forests in a nation, not an inventory of just federally owned forests.
2. ^The Forest Inventory and Analysis (FIA) program—the U.S.A.'s NFI—is based on a three-phase sampling design, the second phase of which is an array of roughly 127,000 hexagons, each 6,000 acres in size with one permanent plot. Precision standards for phase 2 population estimates are plus/minus 3% per million acres of Timberland and plus/minus 5% per billion cubic feet of growing-stock volume in the Eastern United States. See Bechtold and Patterson (2005) for more details.
3. ^Passive sensors measure natural radiation (e.g., reflected sunlight) while active sensors use their own energy source to emit radiation and record what's reflected to the sensor. The term “imagery” usually refers to data collected only by passive sensors, often called optical sensors because they “see” reflected sunlight across visible spectral bands or re-emitted sunlight energy across near infrared, thermal infrared, and/or short-wave infrared bands. An example is the Thematic Mapper (TM) sensor on LANDSAT that collects data across seven spectral bands. Passive sensor data are often characterized on two principal ways—by spectral resolution (the number of bands of reflected/reemitted radiation recorded) or by spatial resolution of the recorded information [hundreds of meters (e.g., MODIS and AVHRR), tens of meters (e.g., TM or Sentinel), or meters (e.g., IKONOS)]. In contrast, data collected by active sensors, such as LiDAR or synthetic aperture radar, is not usually referred to as “imagery.” Active sensor resolution is usually characterized as a function of the radiation emitter. Some sensors are satellite-borne, like GEDI on the International Space Station, TM on LANDSAT or MODIS on the EOS-AM and EOS-PM satellites. Other sensors are carried by piloted aircraft or unmanned aerial vehicles (UAVs) or terrestrial-based. See Gutman (2010) or Canadian Centre for Remote Sensing (CCRS) (2019). See https://www.gedi.umd.edu/mission/mission-overview for details.
4. ^Held November 19–21, 2019, in Knoxville, Tennessee, USA.
5. ^Adjunct Professor, Department of Forest Resources, University of Minnesota, and Principal, Raspberry Ridge Analytics LLC. Formerly, USDA Forest Service, Northern Research Station FIA program until June 2019.
6. ^Published by Elsevier (https://www.journals.elsevier.com/remote-sensing-of-environment).
7. ^Published by MDPI (https://www.mdpi.com/journal/remotesensing).
8. ^His citation read, in part: “… his unique method of integrating available information sources into one system that is reliable and also allows accurate estimates for smaller areas than the traditional field inventories. Tomppo's system considerably enhances the total information value of data sources used and also allows for ecological data to be effectively assessed. In the context of national forest assessment, it is now possible to obtain inventory data at the community and owner levels as well – which has previously not been possible without extensive field work.” (http://www.metla.fi/tiedotteet/1997/wallenberg-eng.htm).
9. ^Moderate Resolution Imaging Spectroradiometer sensor aboard the Terra and Aqua satellites. https://modis.gsfc.nasa.gov/about/.
10. ^EBLUP is an acronym for Empirical Best Linear Unbiased Predictor.
11. ^Sentinel-2 is a European Space Agency mission of two polar-orbiting satellites monitoring variability in land surface conditions. Their wide swath width (290 km) and high revisit time supports monitoring of Earth's surface changes. https://sentinel.esa.int/web/sentinel/missions/sentinel-2.
12. ^COST is a European framework for improving Cooperation in Science and Technology. COST action FP1001 focused on improving information about potential supplies of wood.
13. ^Lorey's height (hL) is a mean height estimate that is weighted by basal area, which allows the larger trees to contribute more to the mean. It is a commonly used mean height estimator outside the USA. Lorey's height is computed as the sum of tree height multiplied by tree basal area for all trees, divided by the basal area of the stand. Because variable radius plot sampling (Bitterlich or prism sampling) selects trees proportional to their basal area, the mean height of trees included in one or more prism sample counts gives an estimate of hL.
14. ^Personal communication with Dr. Sebastian Schnell, Thünen Institute of Forest Ecosystems, Eberswalde, Germany.
15. ^Personal communication, 17 Nov 2019.
References
Astrup, R., Rahlf, J., Bjørkelo, K., Debella-Gilo, M., Gjertsen, A., and Breidenbach, J. (2019). Forest information at multiple scales: development, evaluation, and application of the Norwegian Forest Resources Map SR16. Scand. J. For. Res. 34, 484–496. doi: 10.1080/02827581.2019.1588989
Barrett, F., McRoberts, R. E., Tomppo, E., Cienciala, E., and Waser, L. (2016). A questionnaire-based review of the operational use of remotely sensed data by national forest inventories. Rem. Sen. Environ. 174, 279–289. doi: 10.1016/j.rse.2015.08.029
Bechtold, W. A., and Patterson, P. L., (eds.). (2005). The Enhanced Forest Inventory and Analysis Program—National Sampling Design and Estimation Procedures. Gen. Tech. Rept. SRS-80. Asheville, NC: USDA Forest Service. Southern Research Station. p. 85.
Brackstone, G. J. (1987). “Small area data: policy issues and technical challenges,” in Small Area Statistics, eds R. Platek, J. N. K. Rao, C. E. Särndal, and M. P. Singh (New York, NY: Wiley), 3–20.
Breidenbach, J., and Astrup, R. (2012). Small area estimation of forest attributes in the Norwegian national forest inventory. Eur. J. For. Res. 131, 1255–1267. doi: 10.1007/s10342-012-0596-7
Breidenbach, J., McRoberts, R. E., and Astrup, R. (2015). Empirical coverage of model-based estimators for remote sensing assisted estimation of stand-level timber volume. Rem. Sens. Environ. 173, 274–281. doi: 10.1016/j.rse.2015.07.026
Breidenbach, J., Rahlf, J., Hauglin, M., and Astrup, R. (2019). “Small area estimation on multiple scale—with a focus on stand-level estimates,” Presentation at: A Century of National Forest Inventories: Informing Past, Present, and Future Decisions (Sundvolden: Norsk Institutt For Bioøkonomi (NIBIO)).
Breidenbach, J., Waser, L., Debella-Gilo, M., Schumacher, J., Rahlf, J., Hauglin, M., et al. (2020). National mapping and estimation of forest area by dominant tree species using Sentinal-2 data. Can. J. For. Res. 51, 365–379. doi: 10.1139/cjfr-2020-0170
Brewer, K. (2013). Three controversies in the history of survey sampling. 12-001-X. Surv. Methodol. 39, 249–262. Available online at: https://www150.statcan.gc.ca/n1/pub/12-001-x/2013002/article/11883-eng.htm (accessed June 18, 2021).
Canadian Centre for Remote Sensing (CCRS). (2019). Fundamentals of Remote Sensing. Ottawa, ON: Natural Resources Canada. p. 258. Available online at: https://www.nrcan.gc.ca/maps-tools-publications/satellite-imagery-air-photos/tutorial-fundamentals-remote-sensing/9309 (accessed June 18, 2021).
Chirici, G., Mura, M., McInerney, D., Py, N., Tomppo, E., Waser, L., et al. (2016). A meta-analysis and review of the literature on the K-nearest neighbors technique for forestry applications that use remotely sensed data. Rem. Sens. Environ. 176, 282–294. doi: 10.1016/j.rse.2016.02.001
Condés, S., and McRoberts, R. E. (2017). Updating national forest inventory estimates of growing stock volume using hybrid inference. For. Ecol. Manage. 400, 48–57. doi: 10.1016/j.foreco.2017.04.046
Durante, P., Martín-Alcón, S., Gil-Tena, A., Algeet, N., Tomé, J., Recuero, L., et al. (2019). Improving aboveground forest biomass maps: from high-resolution to national scale. Rem. Sens. 11:795. doi: 10.3390/rs11070795
Esteban, J., McRoberts, R., Fernández-Landa, A., José Luis Tomé, J., and Næsset, E. (2019). Estimating forest volume and biomass and their changes using random forests and remotely sensed data. Rem. Sens. 11:1944. doi: 10.3390/rs11161944
Fischer, C., and Traub, B., (eds.). (2019). Swiss National Forest Inventory – Methods and Models of the Fourth Assessment. Cham: Springer Nature Switzerland AG. p. 431.
Fortin, M. (2020). Updating plots to improve the precision of small area estimates: the example of the Lorraine region, France. Can. J. For. Res. 50, 648–658. doi: 10.1139/cjfr-2019-0405
Ghosh, M. (2020). Small area estimation: its evolution in five decades. Stat. Trans. 21, 1–22. doi: 10.21307/stattrans-2020-022
Gregoire, T. G., Næsset, E., McRoberts, R. E., Ståhl, G., Andersen, H. E., Gobakken, T., et al. (2016). Statistical rigor in LiDAR-assisted estimation of aboveground forest biomass. Rem. Sens. Environ. 173, 98–108. doi: 10.1016/j.rse.2015.11.012
Guldin, R. W. (2018). How today's professionals prefer to find the science they need to do their jobs. J. For. 116, 451–459. doi: 10.1093/jofore/fvy036
Gutman, G. (2010). Optical Remote Sensing: Basics, Data Processing, Applications. Washington, DC: NASA. p. 61. Available online at: https://www.lcluc.umd.edu/sites/default/files/lcluc_documents/gutman_lcluc_8-2010_training_0.pdf
Haakana, H., Heikkinen, J., Katila, M., and Kangas, A. (2019a). Efficiency of post-stratification for a large-scale forest inventory – case Finnish NFI. Ann. For. Sci. 76:9. doi: 10.1007/s13595-018-0795-6
Haakana, H., Heikkinen, J., Katila, M., and Kangas, A. (2019b). Precision of exogenous post-stratification in small area estimation based on a continuous forest inventory. Can. J. For. Res. 50:359–370. doi: 10.1139/cjfr-2019-0139
Hill, A. (2018). Integration of Small Area Estimation Procedures in Large-Scale Forest Inventories. Thesis for the degree of Doctor of Sciences, Eidgenössische Technische Hochschule Zürich, Zürich, Switzerland. p. 125.
Hill, A., Mandallaz, D., and Langshausen, J. (2018). A double-sampling extension of the German national forest inventory for design-based small area estimation on forest district levels. Rem. Sens. 10:1052. doi: 10.3390/rs10071052
Hill, A., Massey, A., and Mandallaz, D. (2021). The R Package forestinventory: design-based global and small area estimations for multiphase forest inventories. J. Stat. Softw. 97, 1–40. doi: 10.18637/jss.v097.i04
Irulappa-Pillai-Vijayakumar, D. B., Renaud, J.-P., Morneau, F., McRoberts, R. E., and Vega, C. (2019). Increasing precision for French forest inventory estimates using the k-NN technique with optical and photogrammetric data and model-assisted estimators. Rem. Sens. 11, 991–1010. doi: 10.3390/rs11080991
Jiang, J., and Rao, J. (2020). Robust small area estimation: an overview. Ann. Rev. Stats. 7, 337–360. doi: 10.1146/annurev-statistics-031219-041212
Kangas, A., Astrup, R., Breidenbach, J., Fridman, J., Gobakken, T., Korhonen, K., et al. (2018). Remote sensing and forest inventories in Nordic countries—a roadmap for the future. Scand. J. For. Res. 33, 397–412. doi: 10.1080/02827581.2017.1416666
Kangas, A., Räty, M., Korhonen, K. T., Vauhkonen, J., and Packalen, T. (2019). Catering information needs from global to local scales – potential and challenges with national forest inventories. Forests 10:800. doi: 10.3390/f10090800
Katila, M., and Heikkinen, J. (2020). Reducing error in small-area estimates of multi-source forest inventory by multi-temporal data fusion. Forestry 93, 471–480. doi: 10.1093/foresj/cpz076
Krapavickaite, D., and Rancourt, E. (2019). Letters from the editors. Surv. Statist. 79:3. Available online at: http://isi-iass.org/home/wp-content/uploads/N79-2019-01-ISSN.pdf
Latifi, H., and Heurich, M., (2019). Multi-scale remote sensing-assisted forest inventory: a glimpse of the state-of-the-art and future prospects. Rem. Sens. 11:1260. doi: 10.3390/rs11111260
Lavrakas, P. J., (2008). “Small area estimation,” in Encyclopedia of Survey Research Methods, Vol 2. (Thousand Oaks, CA: SAGE Publications).
Magnussen, S., Mandallaz, D., Breidenbach, J., Lanz, A., and Ginzler, C. (2014). National forest inventories in the service of small area estimation of stem volume. Can. J. For. Res. 44, 1079–1090. doi: 10.1139/cjfr-2013-0448
Magnussen, S., and Nord-Larsen, T. (2020). Forest inventory inference with spatial model strata. Scand. J. For. Res. 36, 43–54. doi: 10.1080/02827581.2020.1852309
Maltamo, M., Packalén, P., Suvanto, A., Korhonen, K. T., Mehtätalo, L., and Hyvönen, P. (2009). Combining ALS and NFI training data for forest management planning: a case study in Kuortane, Western Finland. Eur. J. For. Res. 128:305. doi: 10.1007/s10342-009-0266-6
Mandallaz, D. (2008). Sampling Techniques for Forest Inventories. Boca Raton, FL: Chapman and Hall/CRC. p. 256.
Mandallaz, D. (2013). Design-based properties of some small-area estimators in forest inventory with two-phase sampling. Can. J. For. Res. 43, 441–449. doi: 10.1139/cjfr-2012-0381
Mandallaz, D. (2014). A three-phase sampling extension of the generalized regression estimator with partially exhaustive information. Can. J. For. Res. 44, 383–388. doi: 10.1139/cjfr-2013-0449
Mandallaz, D., Breschan, J., and Hill, A. (2013). New regression estimators in forest inventories with two-phase sampling and partially exhaustive information: a design-based Monte Carlo approach with applications to small-area estimation. Can. J. For. Res. 43, 1023–1031 doi: 10.1139/cjfr-2013-0181
Massey, A. (2015). Multiphase Estimation Procedures for Forest Inventories Under the Design-Based Monte Carlo Approach. [Thesis for the degree of Doctor of Sciences, Eidgenössische Technische Hochschule Zürich, Zürich, Switzerland. p. 85.
Massey, A., Mandallaz, D., and Lanz, A. (2014). Integrating remote sensing and past inventory data under the new annual design of the Swiss National Forest Inventory using three-phase design-based regression estimation. Can. J. For. Res. 44, 1177–1186. doi: 10.1139/cjfr-2014-0152
McRoberts, R. E. (2012). Estimating forest attribute parameters for small areas using nearest neighbors techniques. For. Ecol. Manage. 272, 3–12. doi: 10.1016/j.foreco.2011.06.039
McRoberts, R. E., Chen, Q., and Walters, B. F. (2017). Multivariate inference for forest inventories using auxiliary airborne laser scanning data. For. Ecol. Manage. 401, 295–303. doi: 10.1016/j.foreco.2017.07.017
McRoberts, R. E., Næsset, E., Saatchi, S., Liknes, G. C., Walters, B. F., and Chen, Q. (2019). Local validation of global biomass maps. Int. J. Appl. Earth Obs. Geoinform. 83:101931. doi: 10.1016/j.jag.2019.101931
Nelson, R., Gobakken, T., Næsset, E., Gregoire, T., Ståhl, G., Holm, S., et al. (2012). Lidar sampling—Using an airborne profiler to estimate forest biomass in Hedmark County, Norway. Remote Sens. Environ. 123, 563–578. doi: 10.1016/j.rse.2011.10.036
Novo-Fernández, A., Barrio-Anta, M., Recondo, C., Cámara-Obregón, A., and López-Sánchez, C. A. (2019). Integration of national forest inventory and nationwide airborne laser scanning data to improve forest yield predictions in north-western Spain. Rem. Sens. 11:1643. doi: 10.3390/rs11141693
Pfeffermann, D. (2002). Small area estimation – new developments and directors. Intl. Stat. Rev. 70, 125–143. doi: 10.1111/j.1751-5823.2002.tb00352.x
Pfeffermann, D. (2013). New important developments in small area estimation. Stat. Sci. 28, 40–68. doi: 10.1214/12-STS395
Pulkkinen, M., and Zell, J. (2019). Overview of Research Carried out on Small-Area Estimation Around Swiss NFI Since 2010. Birmensdorf: Swiss Federal Institute for Forest, Snow, and Landscape Research (WSL). p. 3.
Rahlf, J., Hauglin, M., Astrup, R., and Breidenbach, J. (2021). Timber volume estimation based on airborne laser scanning—comparing the use of national forest inventory and forest management inventory data. Ann. For. Sci. 78:49. doi: 10.1007/s13595-021-01061-4
Rahman, A. (2008). A Review of Small Area Estimation Problems and Methodological Developments. Discussion Paper 66. Canberra, ACT: Univ. of Canberra, National Centre for Social and Economic Modeling (NATSEM). p. 56. Available online at: https://researchoutput.csu.edu.au/en/publications/a-review-of-small-area-estimation-problems-and-methodological-dev (accessed June 18, 2021).
Saei, A., and Chambers, R. (2003). Small Area Estimation: A Review of Methods Based on the Application of Mixed Models. Methodology Working Paper M03/16. Southampton, UK: University of Southampton. Southampton Statistical Sciences Research Institute. 36 p. Available online at: https://eprints.soton.ac.uk/8166/ (accessed June 18, 2021).
Ståhl, G., Saarele, S., Schnell, S., Holm, S., Breidenbach, J., Healey, S. P., et al. (2016). Use of models in large-area forest surveys: comparing model-assisted, model-based, and hybrid estimation. For. Ecos. 3:5. doi: 10.1186/s40663-016-0064-9
Steinmann, K., Mandallaz, D., Ginzler, C., and Lanz, A. (2013). Small area estimations of proportion of forest and timber volume combining Lidar data and stereo aerial images with terrestrial data. Scand. J. For. Res. 28, 373–385. doi: 10.1080/02827581.2012.754936
Strîmbu, V., Ørka, H., and Næsset, E. (2021). Consistent forest biomass stock and change estimation across stand, property, and landscape levels. Can. J. For. Res. 51, 1–11. doi: 10.1139/cjfr-2020-0203
Tomppo, E. (1990). “Designing a satellite image-aided national forest survey in Finland,” in The Usability of Remote Sensing for Forest Inventory and Planning: Proceedings of an SNS/IUFRO Workshop, 26-28 February 1990. Report No. 4. (Umeå: Swedish University of Agricultural Sciences, Remote Sensing Laboratory), 43–47.
Tomppo, E. (1991). “Satellite image-based national forest inventory for Finland,” Proceedings of the Symposium on Global and Environmental Monitoring, Techniques, and Impacts, International Archives of Photogrammetry and Remote Sensing 28, Vol. 7, Part 1 (Victoria, BC:), 419–424. Available online at: https://goobi.tib.eu/viewer/image/856669164/1/ (accessed June 18, 2021).
Tomppo, E., Katila, M., Mäkisara, K., and Peräsaari, J. (2012). The Multi-Source National Forest Inventory of Finland—Methods and Results 2007. Working Papers of the Finnish Forest Research Institute 227. p. 233. Available online at: http://www.metla.fi/julkaisut/workingpapers/2012/mwp227-en.htm (accessed June 18, 2021).
U.S. Census Bureau (2021). Small Area Estimation. Available online at: https://www.census.gov/topics/research/stat-research/expertise/small-area-est.html (accessed June 18, 2021).
Vega, C., Renaud, J.-P., Sagar, A., and Bouriaud, O. (2021). A new small area estimation algorithm to balance between statistical precision and scale. Intl. J. Appl. Earth Obs. Geoinf. 97:102303. doi: 10.1016/j.jag.2021.102303
Keywords: estimating forest conditions for small areas, using national forest inventory data at small spatial scales, remotely sensed imagery as auxilliary data for imputation, small area estimation research in Europe, driving forces spurring small area estimation research
Citation: Guldin RW (2021) A Systematic Review of Small Domain Estimation Research in Forestry During the Twenty-First Century From Outside the United States. Front. For. Glob. Change 4:695929. doi: 10.3389/ffgc.2021.695929
Received: 15 April 2021; Accepted: 21 June 2021;
Published: 15 July 2021.
Edited by:
Gretchen Moisen, United States Forest Service (USDA), United StatesReviewed by:
Paula Soares, University of Lisbon, PortugalSteve Prisley, National Council for Air and Stream Improvement, Inc. (NCASI), United States
Copyright © 2021 Guldin. This is an open-access article distributed under the terms of the Creative Commons Attribution License (CC BY). The use, distribution or reproduction in other forums is permitted, provided the original author(s) and the copyright owner(s) are credited and that the original publication in this journal is cited, in accordance with accepted academic practice. No use, distribution or reproduction is permitted which does not comply with these terms.
*Correspondence: Richard W. Guldin, cmljaEBndWxkaW5mb3Jlc3RyeS5jb20=