 Thomas Patterson
- School of Biological, Environmental, and Earth Sciences, The University of Southern Mississippi, Hattiesburg, MS, United States
The U.S. Forest Service has monitored longleaf pine cone production at sites throughout the southeastern United States for over 60 years. Data from the multi-decadal surveys have supported our understanding of the variability of stand-level cone production as it relates to environmental and ecological processes, and more broadly, how longleaf pine operates as a masting species. Cones from longleaf pine are counted each spring using visual surveys that follow a standard protocol. Rapid mast assessments have been proposed in the literature as an alternative to traditional methods, yet these approaches have not been examined for longleaf pine. In this study, I compared average cone production (using the traditional method) to the percentage of trees bearing cones (rapid assessment) to understand the relationship between these two mast measurements. I examined 29 years of data from 18 cone-monitoring sites containing 234 trees. Using simple linear models, I discovered the percentage of trees bearing cones explained 58–94% of the variance in log-average cone production across all sites. One-way ANOVA analysis revealed cone crops required for successful regeneration (25 + cones per tree) occurred when the percentage of trees bearing cones exceeded 90%, and the results from this study underscore the utility of a simple 90% threshold when determining a successful cone crop. While traditional cone-count methods should not be abandoned, I advocate for the use of rapid cone-crop assessments when a proxy approach is suitable.
Introduction
The southeastern United States once supported a variety of longleaf pine ecosystems prior to European settlement, and during the last three centuries the spatial extent of longleaf pine has contracted from over 37 million hectares to less than 2 million hectares due to land-use changes coupled with fire suppression (Frost, 2006). The loss of over 95 percent of longleaf pine ecosystems has placed enormous pressure on the co-occurring biota within this region—recently recognized as a global biodiversity hotspot for its high species richness coupled with extensive habitat loss (Peet, 2006; Noss et al., 2015). Longleaf pine restoration campaigns, such as the American Longleaf Restoration Initiative, have successfully reversed the trend of longleaf pine ecosystem loss, and restoration efforts are underway to increase the spatial extent of longleaf pine to 3.2 million hectares by 2025 (Oswalt and Guldin, 2021). At present, approximately one third of all longleaf pine are less than 20 years old and have been planted from seedlings (Oswalt and Guldin, 2021), underscoring the need for a comprehensive understanding of longleaf pine cone production.
Longleaf pine is a masting species, whereby episodic cone crops required for successful regeneration occur both episodically and synchronously within and between stands (Boyer, 1987; Brockway et al., 2006). Challenges of successful, natural regeneration relate to large cone crops that occur on average every 7–10 years (Boyer, 1998). Longleaf pine cone crops have entered their seventh decade of observation, beginning in Escambia County, Alabama in 1958 (Connor et al., 2014) and currently monitored by the United States Forest Service (hereafter USFS) and collaborators at 11 locations throughout the species’ range (Brockway, 2019). Data from these stands have supported numerous studies that have examined annual cone production as it relates to climate (Pederson et al., 1999; Guo et al., 2016; Leduc et al., 2016), fire (Haymes and Fox, 2012), stand dynamics (Loudermilk et al., 2016), basal ring growth (Patterson and Knapp, 2016, 2018), and its inherit complexity as a masting species (Chen et al., 2016, 2017, 2018, 2020). The robustness of the multi-decadal dataset lies in the repeated measures of cone counts, which are outlined each year in the annual USFS cone report (e.g., Brockway, 2019).
Most of the longleaf pine cone-production literature has analyzed stand-level averages, yet individual-tree data have been used to explore nuanced features of cone production. I have previously reported on the concept of superproducing longleaf pine trees—individual trees that produce an abundance of cones relative to normal-producing trees (Patterson, 2020). Outside of longleaf pine, Greenberg (2020) reported on the linear relationship between individual oak trees that produce acorns and overall acorn production for five oak species in western North Carolina. She found the percentage of trees producing acorns, a rapid binary metric, was consistently correlated to average acorn production as measured in traps (Greenberg, 2020), supporting previous research on similar topics (Greenberg and Parresol, 2000; Greenberg and Warburton, 2007). Others have examined linear relationships between acorn crop and visual surveys (e.g., Carevic et al., 2014; Nakajima et al., 2015), but this research is lacking for longleaf pine. At present Greenberg (2020) is the only rapid mast examination performed in the southeastern United States, thus establishing the possibility to explore this relationship for longleaf pine. In this research, I examined the linear relationship between longleaf pine cone production and the percentage of trees producing cones across the species’ range. The following sections detail the findings of my study as well as the implications of a rapid cone assessment for longleaf pine.
Materials and Methods
Data
Longleaf pine cones are counted each spring from a set number of trees at 11 sites throughout the longleaf pine range (Figure 1). The public receives site-based averages based on data from the individual trees; however, the individual-tree data provide a richer context into masting variability within each stand. In this study, I exclusively used individual-tree cone data that produce the annual site averages reported to the public each spring (see Brockway, 2019 for cone-counting protocol). Digitized, individual tree-data begin in 1991, and therefore I only analyzed years from 1991 to present. Data for individual tree age, crown size, height, canopy position (e.g., dominant, co-dominant, etc.) as well as stand density were unavailable; however, individual-tree diameter at breast height (hereafter DBH) were examined. Some of the sites contained compartments (e.g., Escambia, Alabama or the Eglin Air Force Base, Florida) where previous foresters counted cones separately, and I treated the compartments as separate sites. The cone data were incomplete for a number of sites and years, and thus I pretreated the data before analysis. I eliminated approximately 20% of data for sites containing an insufficient number of trees, trees with missing values or marked “dead,” or an insufficient number of years for a particular site. As a result, both sample size and the years that were analyzed varied considerably, leaving site-by-site comparisons unexplorable. Care was given to retain as much data as possible, with a minimum number of trees or years at a site set to seven. Table 1 contains site information and descriptive statistics for all 18 sites in this study.
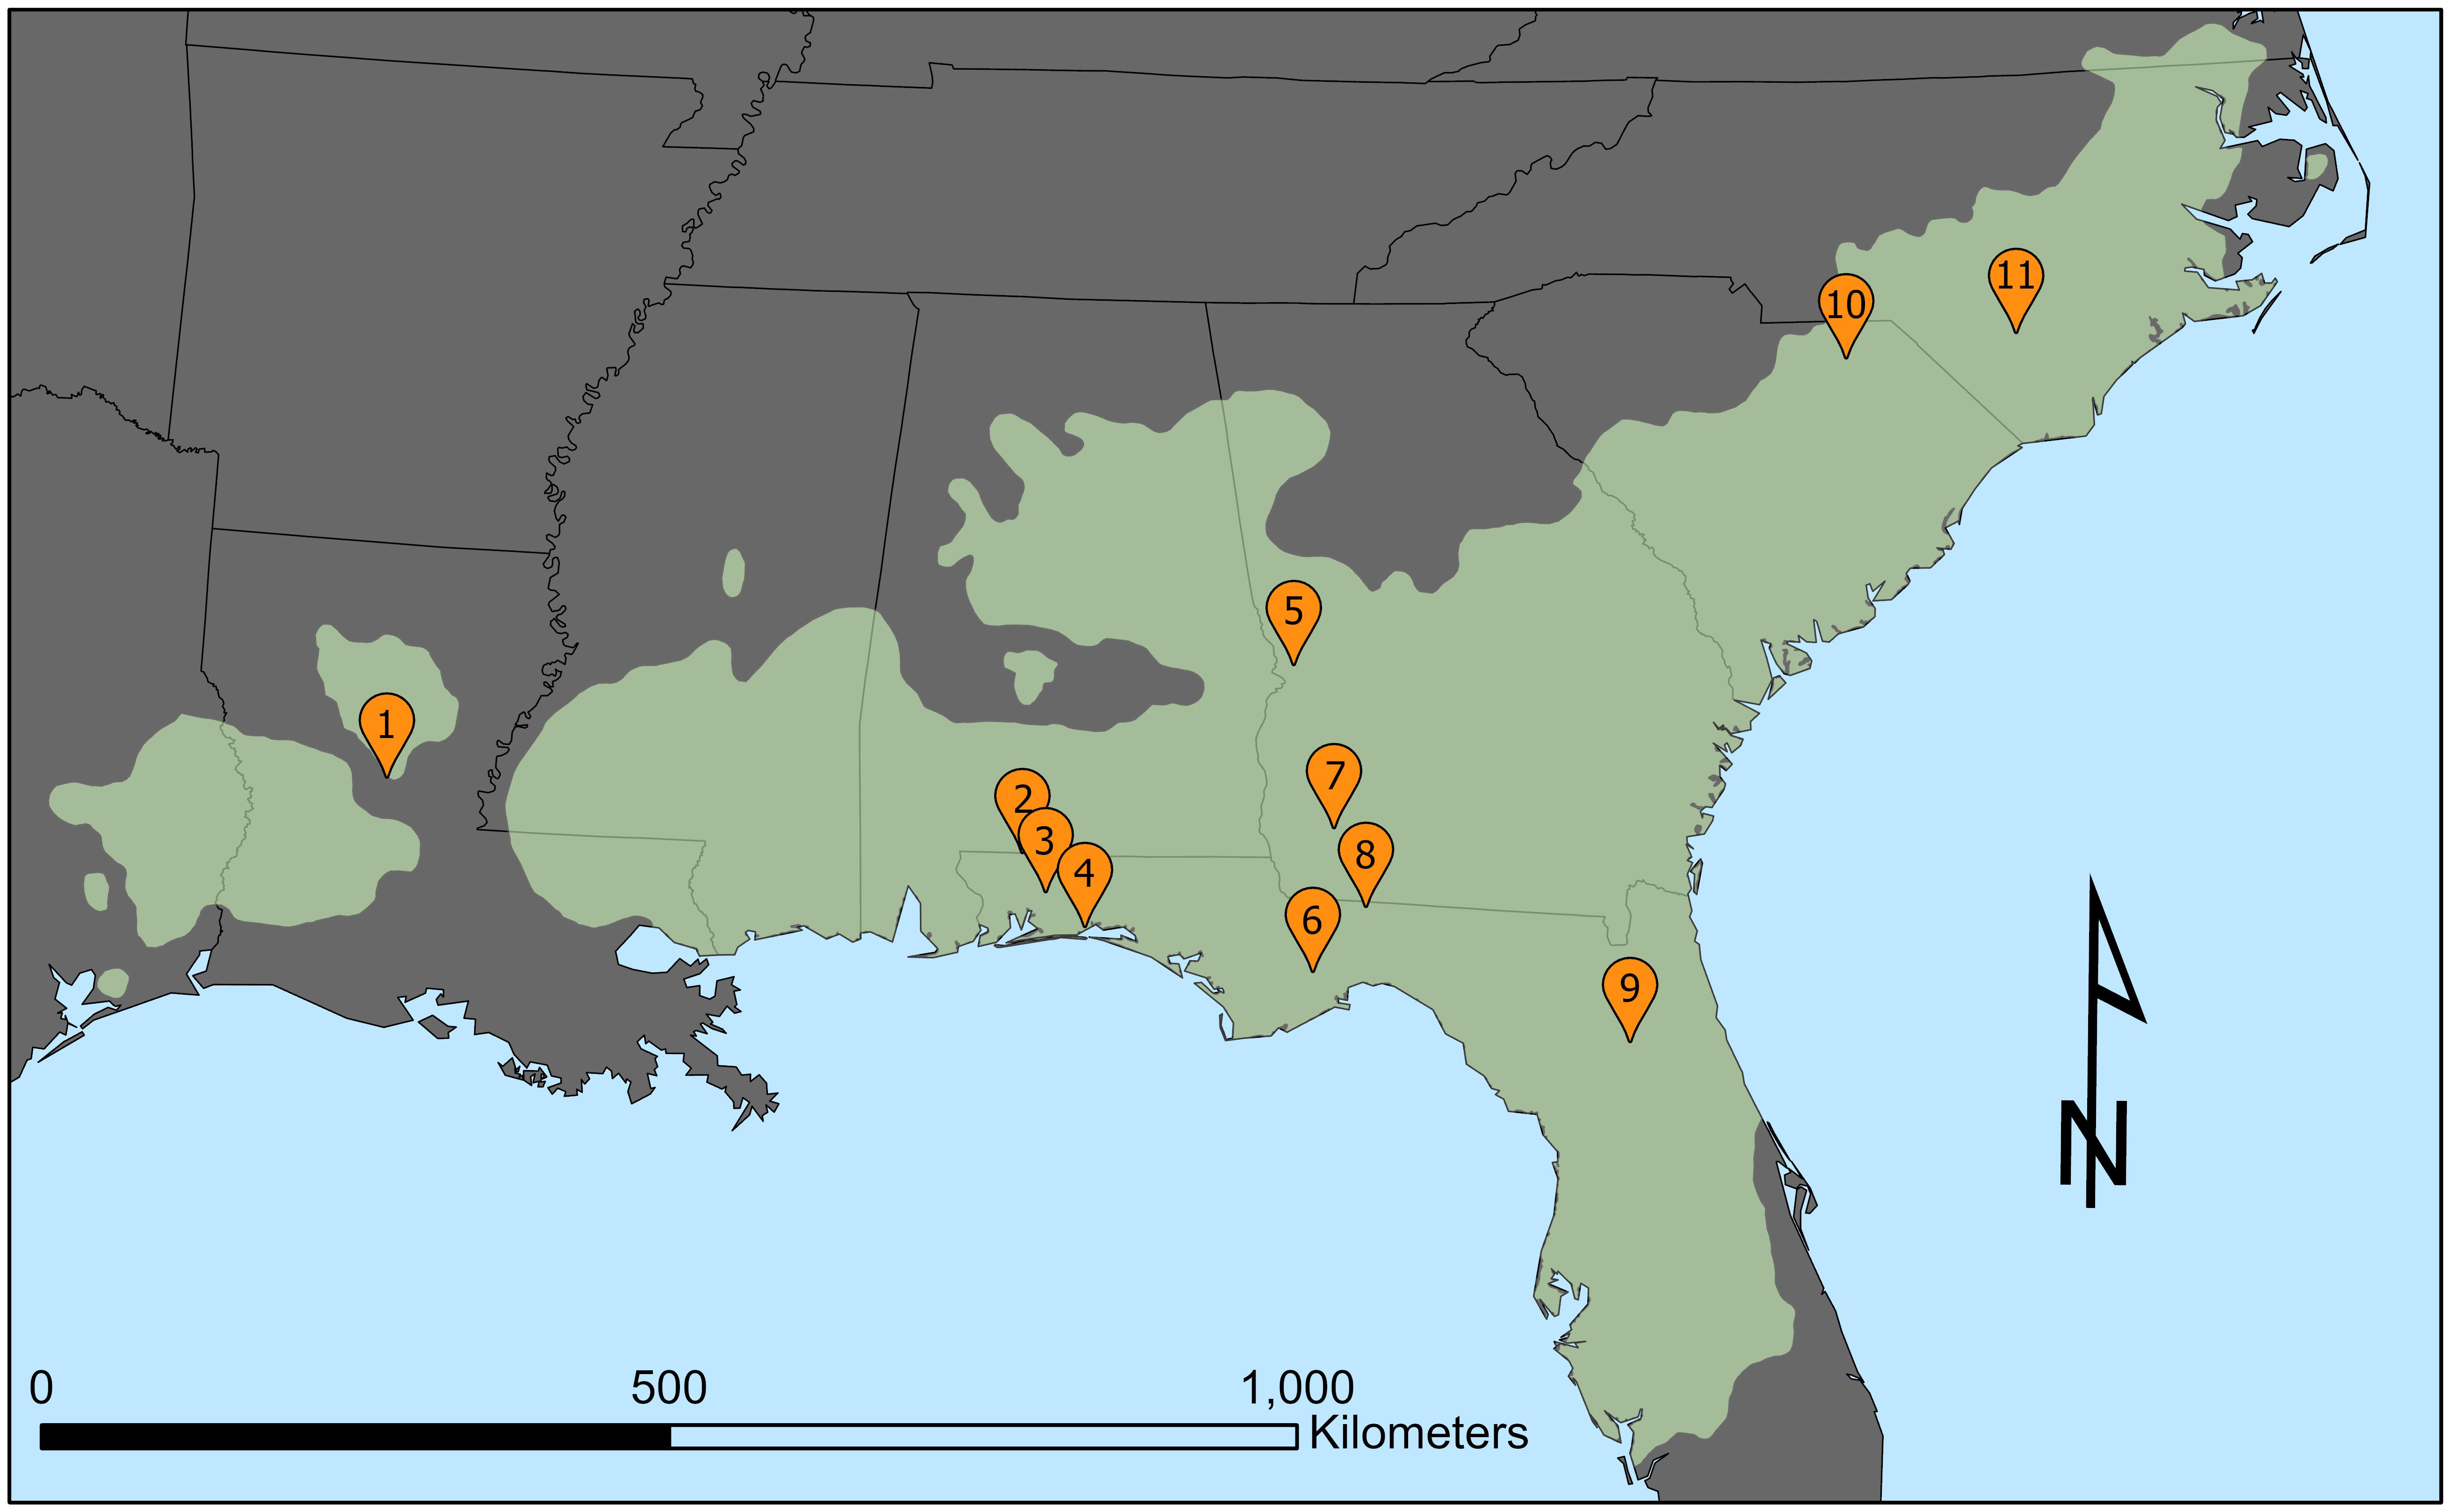
Figure 1. Map of the 11 USFS cone-count locations (orange pins) within the longleaf pine range (light green). Cone count locations are ordered west to east as follows: 1. Kisatchie National Forest, Grant Parish, Louisiana; 2. T. R. Miller Woodlands (Escambia Experimental Forest), Escambia County, Alabama; 3. Blackwater River State Forest, Santa Rosa County, Florida, 4. Eglin Air Force Base, Okaloosa County, Florida; 5. Fort Benning Military Base, Chattahoochee County, Georgia; 6. Apalachicola National Forest Florida, Leon County, Florida; 7. Jones Ecological Research Center, Baker County, Georgia; 8. Tall Timbers Research Station, Leon County, Florida; 9. Ordway-Swisher Biological Station, Putnam County, Florida; 10. Sandhills State Forest, Chesterfield County, South Carolina; 11. Bladen Lakes State Forest, Bladen County, North Carolina.
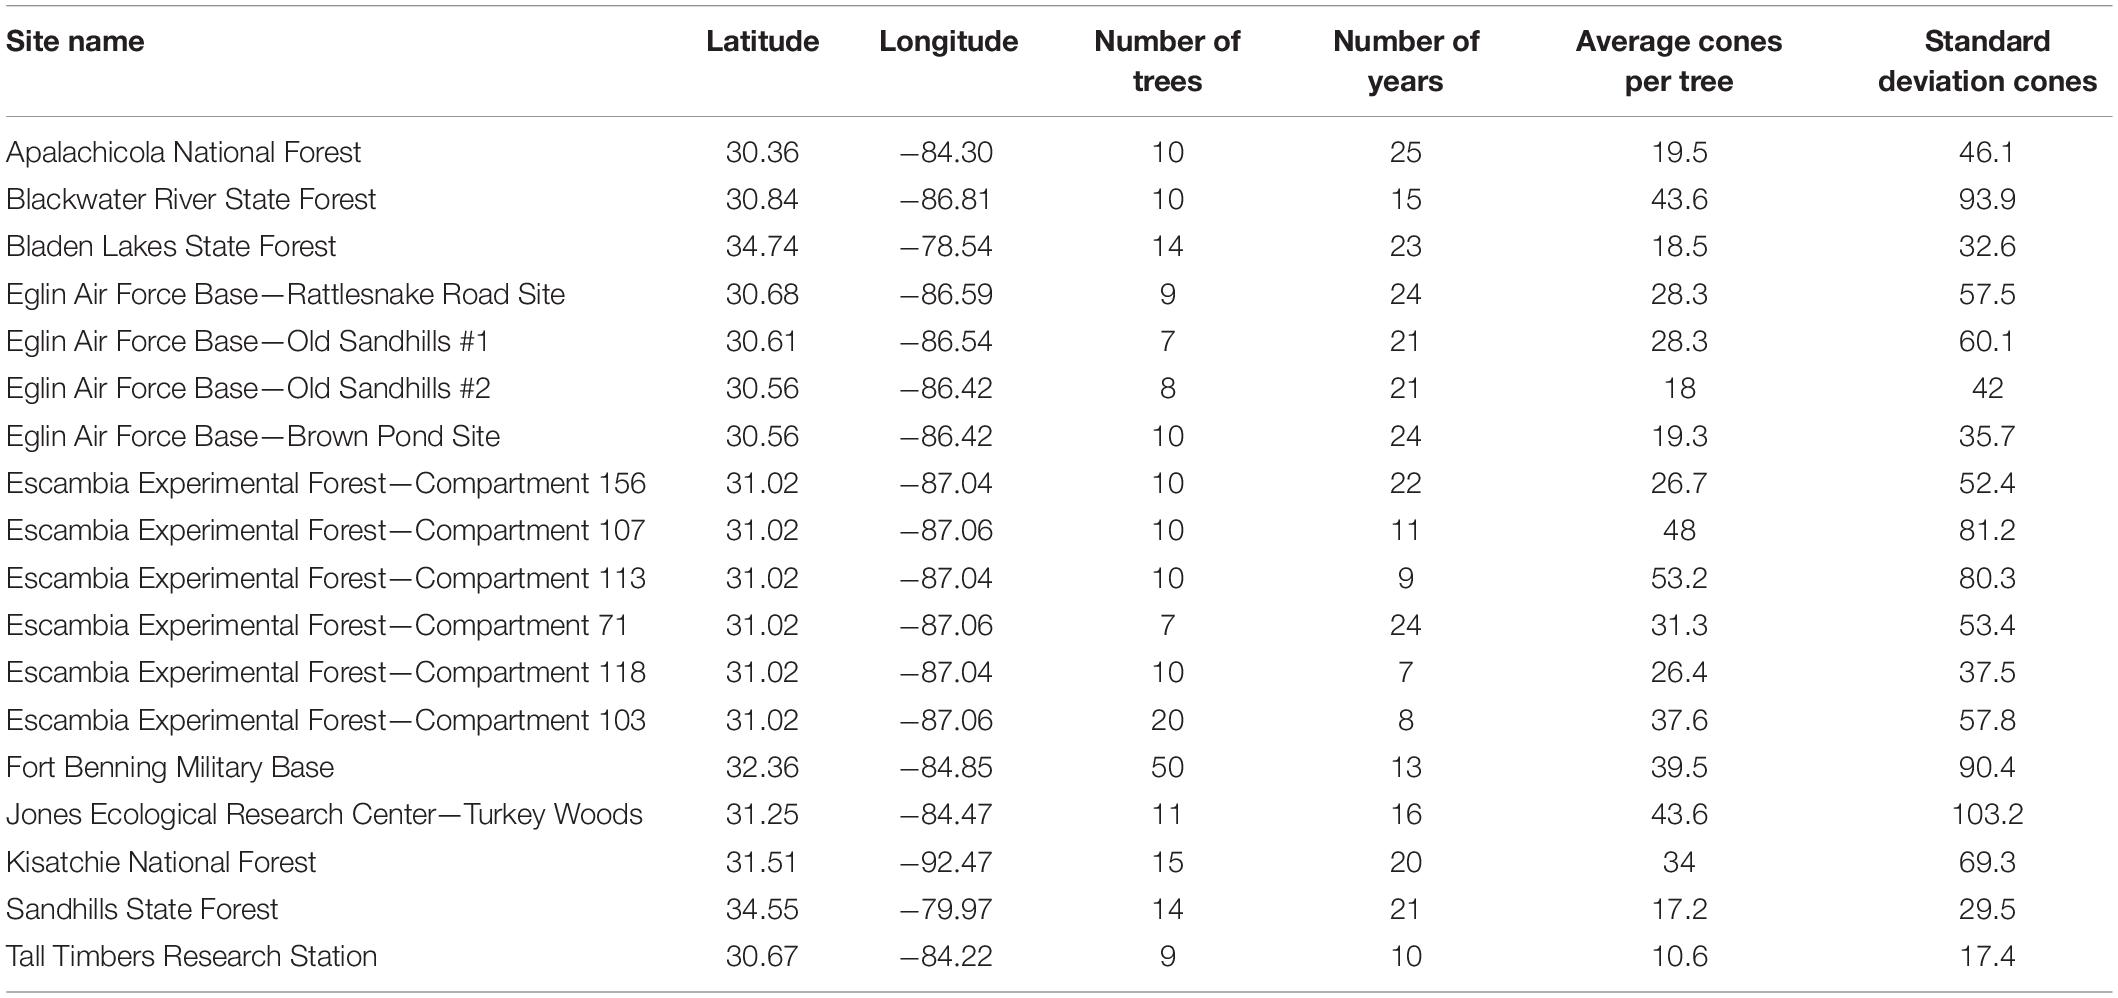
Table 1. Site information listed alphabetically and descriptive statistics for each of the 18 cone count sites.
Analyses
I computed annual average cone-production for all years at each site, and log transformed these results due to the uneven nature of cone production. Log transformation of the data was performed such that simple linear models could be used, which differed from Greenberg (2020) that used log-linear models when examining the relationship between acorn production and the percentage of trees bearing acorns. Next, I computed the percentage of trees bearing cones (hereafter PBC) for each year and site by dividing the number of trees producing >0 cones by the total number of trees. I then modeled the relationship between PBC and annual log-transformed cone production using simple linear regression. For all models, I treated PBC as the independent variable and annual log-transformed cone production as the dependent variable. I examined all models for quality control ensuring PBC was a statistically significant predictor (p < 0.05) and evaluated each model by examining the variance that was explained in the dependent variable (r2). I assembled these models for all 18 sites as well as the combined dataset (n = 314).
I also examined PBC as it relates to the USFS cone-crop classifications. The official classifications are both qualitative and quantitative based on the annual average number of cones per tree at each site: Failed 0–9, Poor 10–24, Fair 25–49, Good 50–99, and Bumper ≥100 (Brockway, 2019). I classified each of the 314 observations by their average cone crop using the Failed—Bumper classification, and examined the difference in PBC means for all five groups using a one-way ANOVA analysis. I further examined pairwise comparisons of the different group means using a Tukey Honest Square Different post hoc test.
Finally, I examined the accuracy of correctly identifying a productive cone year from PBC based on the results of the ANOVA analysis. In this procedure, I used an odds ratio to examine the instances where PBC above a certain threshold corresponded to years that classified as Fair, Good, and Bumper vs. the instances where that same PBC threshold corresponded to years that classified as Poor or Failed. The diagnostic odds-ratio test provided the odds of accurately identifying high-production cone crops when PBC was equal to or greater than a specific threshold vs. a false positive scenario where a high PBC corresponded to a small cone crop.
Results
A total of 18 sites were examined from seven states in the longleaf pine range spanning 29 years (1991–2019; Table 1). The average (standard deviation) of trees per site was 13 (9.8) and each site had an average of 17.4 (6.3) years of cone data (Table 1). Average (SD) annual PBC for all sites equaled 66% (10%), meaning that for each site an average of two out of three trees produced cones each year. The most consistently productive site (highest annual average PBC) was Kisatchie (86%) whereas the least productive sites were two sub compartments of the Eglin Air Force base (Old Sandhills #1 and Old Sandhills #2) that each produced annual average PBC values <50 (Figure 2).
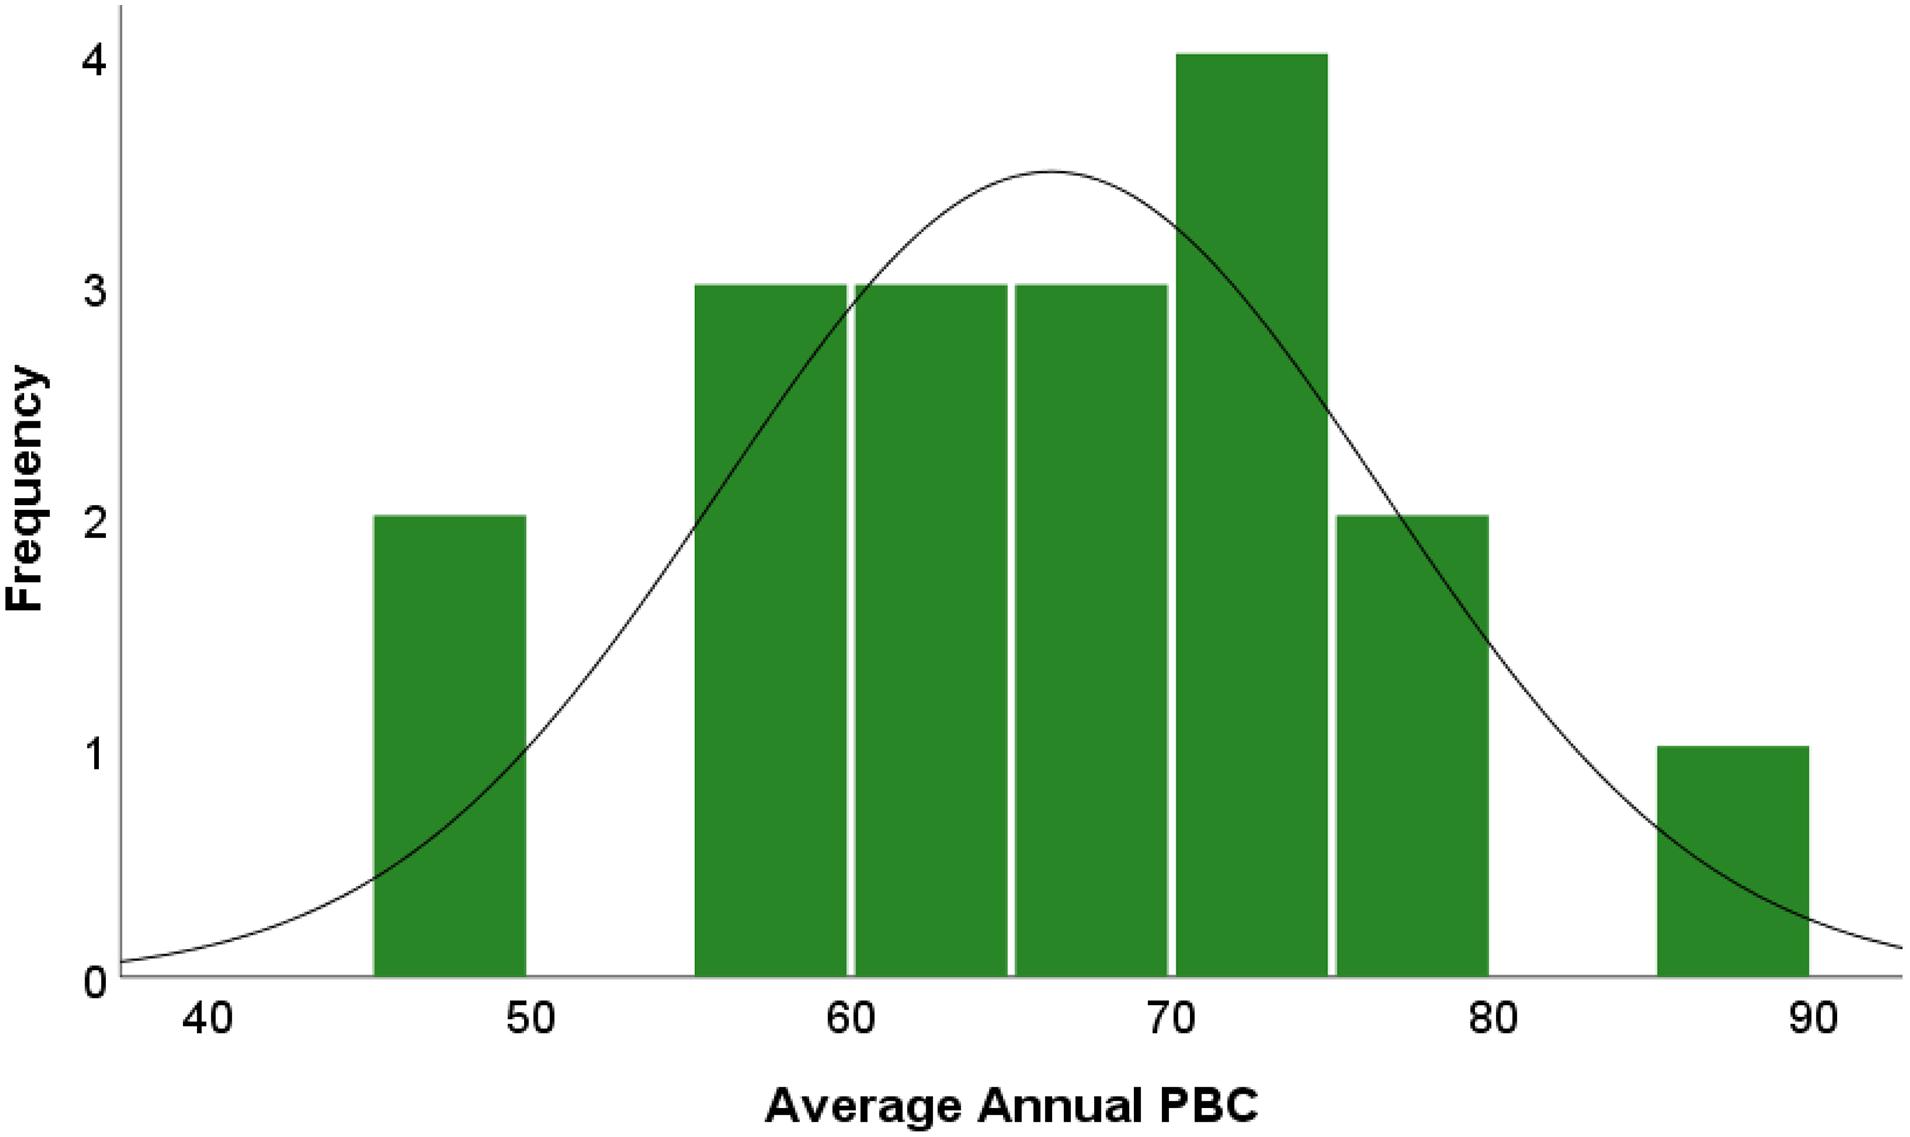
Figure 2. Frequency histogram of average annual percent of trees bearing cones per site (n = 18, μ = 78%, SD = 10%).
The percent of trees bearing cones was a strong predictor for log-average cone production at all sites (Table 2). All site models were statistically significant (p < 0.05), with PBC model explanatory power (r2) ranging from 58 to 94% variance explained. The median explanatory power of all models was 78% variance explained, with a standard deviation of 10%. All but four sites produced model explanatory power within one standard deviation of the mean. Compartments 118 and 103 in the Escambia Experimental forest were 1.6 and 1.4 deviations from the mean whereas the Kisatchie National Forest and Tall Timbers Research Station were 1.9 and 2.1 deviations from the mean.
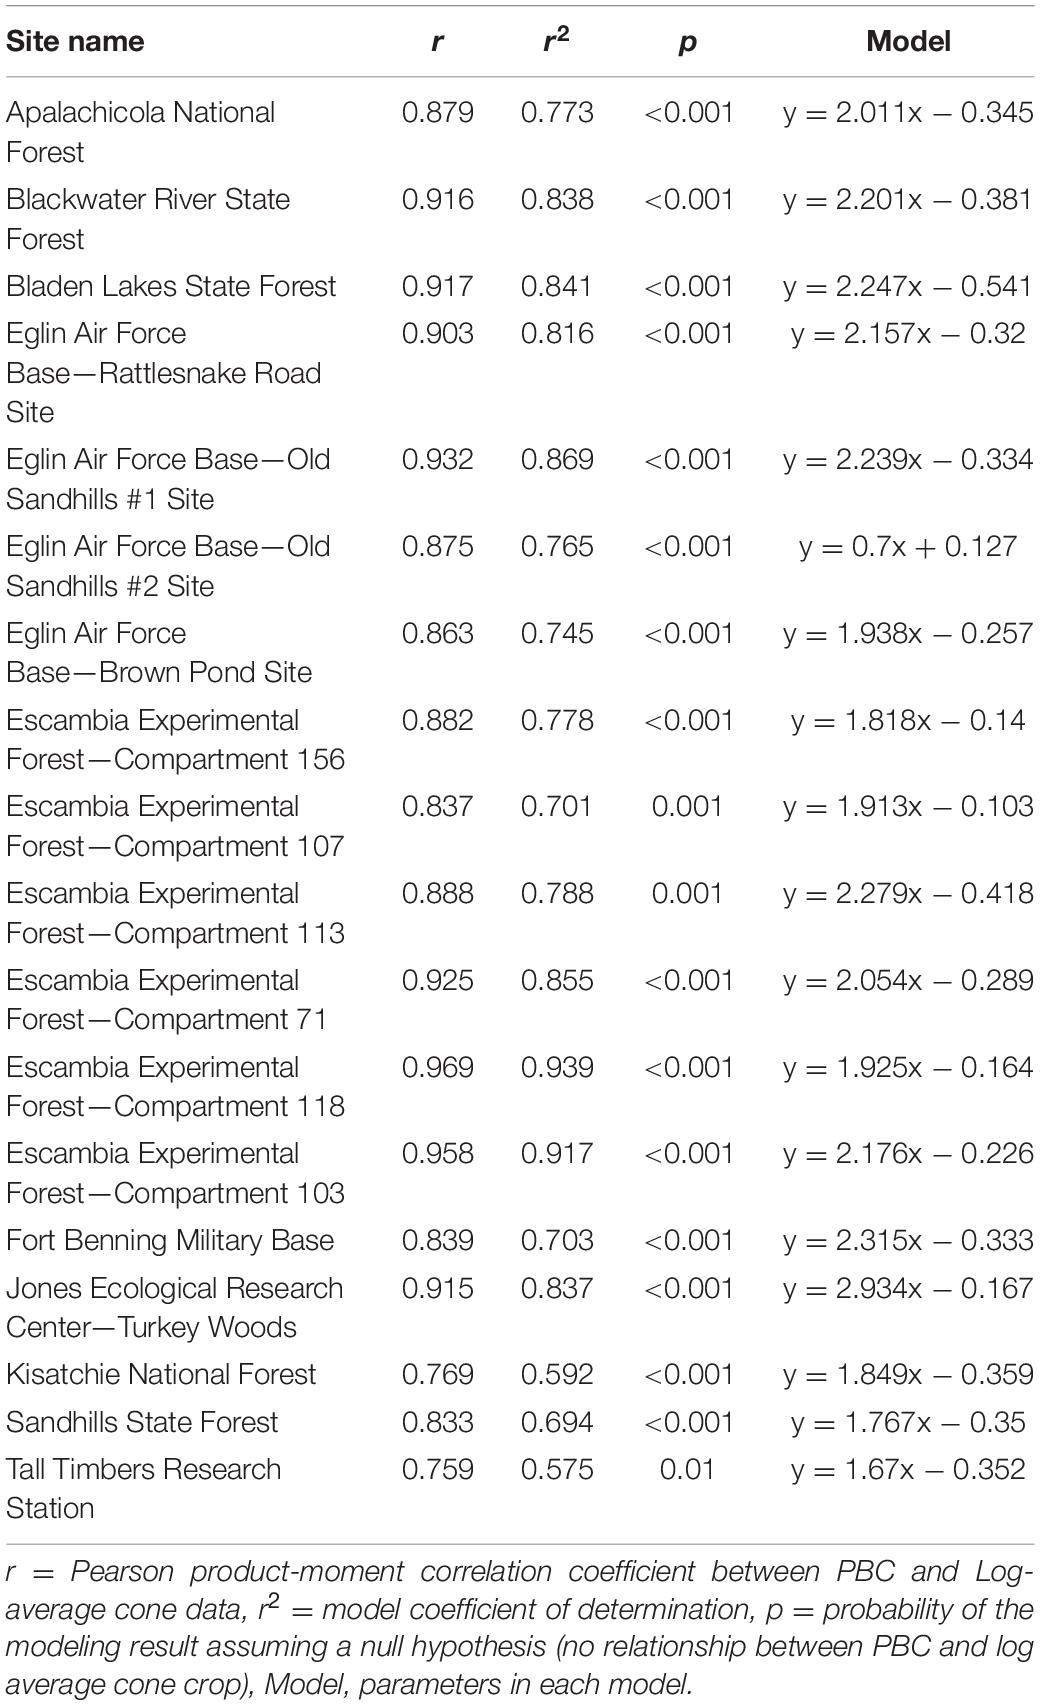
Table 2. Results of the linear models between PBC and log average cone crop for all 18 sites.
When all PBC observations were modeled together (n = 314), the combined dataset explained the same amount of variance in log-transformed cone production (Figure 3). Sixty-eight observations (22.7% of the data) produced a PBC value of 100 even though log- average cone production ranged from 1.9–5.4. When these results were untransformed, PBC equal to 100 resulted in 7–222 cones per tree. These data suggest that 100 can PBC span the categories of “Failed” to “Bumper” in the USFS cone-crop classification system (Brockway, 2019).
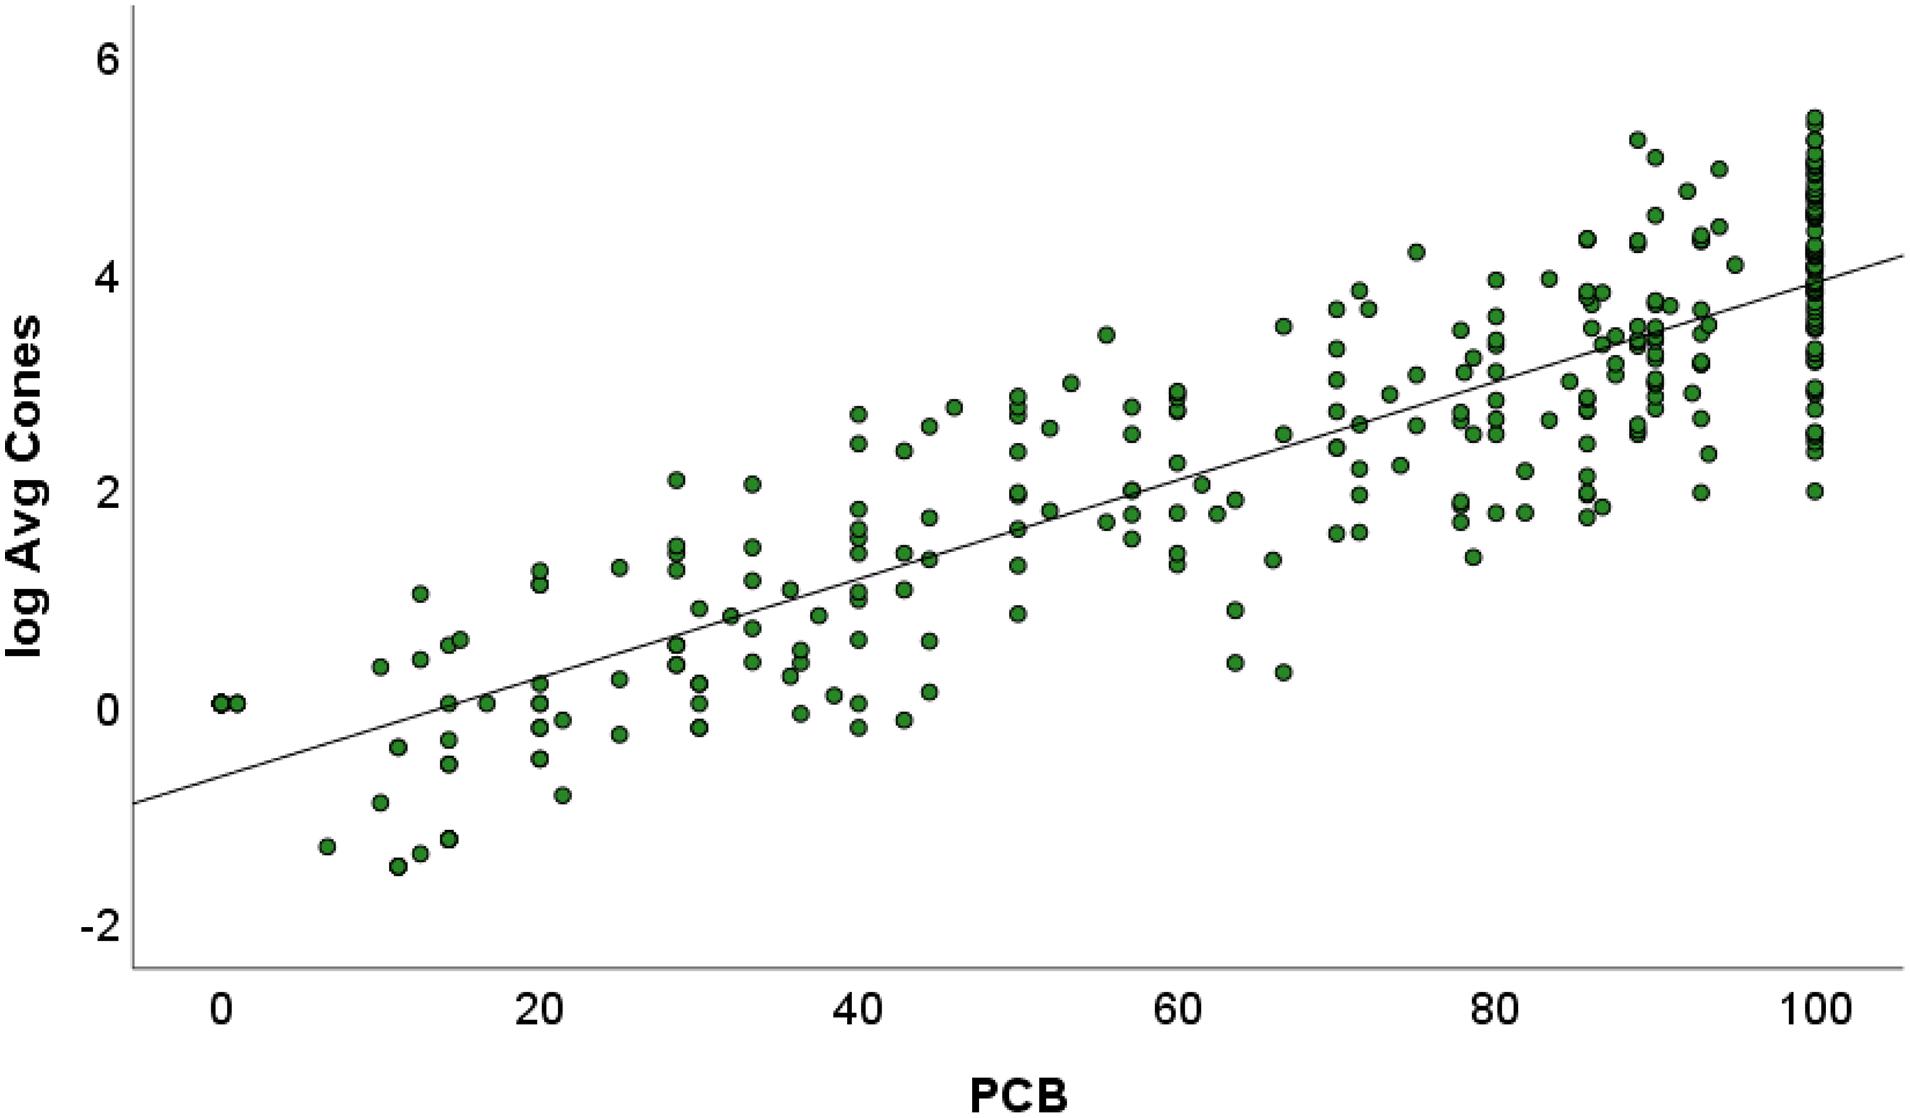
Figure 3. Scatterplot of the percentage of trees bearing cones and log-transformed average cone production (n = 314). The linear-fit line (Y = 4.55X – 0.67) was statistically significant (p < 0.001). Note the clustering of values when PBC = 100.
The average number of cones by site and average site DBH were not related (r = 0.114, p > 0.05, n = 18). Conversely, a strong, negative relationship existed between average site DBH and model explanatory power by site (r = −0.69, p < 0.001, n = 18).
When the average number of cones were grouped using the Failed–Bumper classification, and a one-way ANOVA test with Tukey post hoc comparisons was performed, significant differences in mean PBC existed between the five groups (F = 139.8, p < 0.001). No difference in mean PBC existed between the Fair–Bumper groups; however, mean PBC was significantly lower (p < 0.01) for the Poor group and the mean PBC for the Failed group was significantly lower (p < 0.001) than all other groups (Figure 4). Of the three PBC groups with no statistical difference (Fair, Good, and Bumper), the Fair group contained the lowest mean PBC that equaled 89.47, indicating PBC values ≥90 corresponded with Fair or better cone crops.
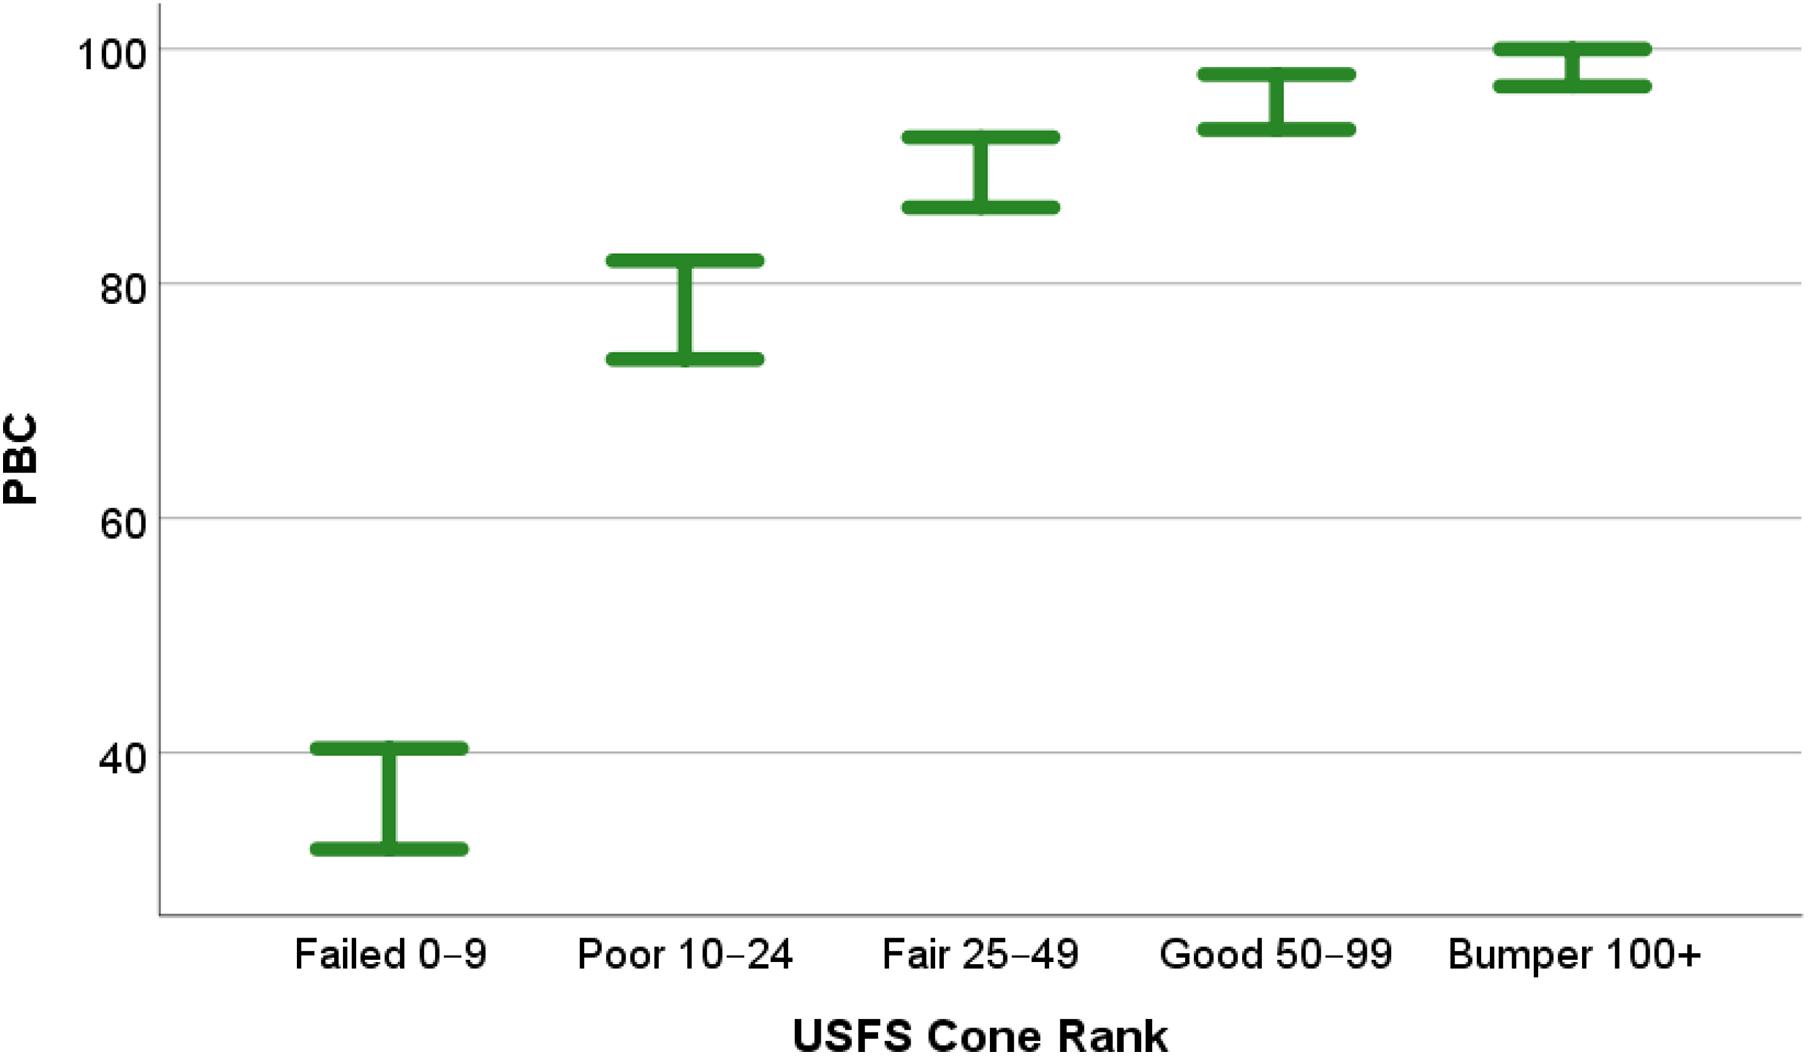
Figure 4. Error plot (95% confidence intervals) for the one-way ANOVA analysis of PBC categorized by USFS cone-class (n = 314). Average number of cones per tree as follows: Failed = 0–9 cones, Poor = 10–24 cones, Fair = 25–49, Good = 50–99, and Bumper ≥ 100.
To determine the efficacy of a 90% of trees bearing cones threshold to indicate Fair or better cones crops, I performed an odds ratio that examined the odds of a Fair or better cone crop when PBC was ≥90. The results of the odds-ratio were that cone-count stands would be at least 18.4 (95% CI 10.2, 33.4) times more likely to have a Fair, Good, or Bumper crop when PBC ≥90 than when PBC is <90.
Discussion
The results of my study align with the findings of Greenberg (2020) that showed a similar relationship between acorn production and the percentage of trees bearing acorns. Whereas, Greenberg (2020) used log-linear models, I log transformed the average cone data and used simple linear models. Regardless of the modeling technique, we both show the percentage of trees that are producing mast crop are a strong predictor of actual mast count for five southern Appalachian oak species and longleaf pine. I revealed a consistent relationship between PBC and log-average cone production across all sites in the study, and due to the fidelity of this relationship, it appears that PBC is a useful proxy for cone production throughout the longleaf pine range.
The results of the ANOVA analysis indicate an important outcome of this study: when 9 out of 10 trees have cones expect 25 cones or greater per tree. This unexpected finding has important implications regarding successful longleaf pine regeneration. The most recent USFS longleaf pine cone report indicates cone crops categorized as Fair or better represent regeneration opportunities, and approximately 30 cones per tree, with 25 trees per acre, achieves this benchmark (Boyer, 1998; Brockway, 2019). I found no statistical differences in PBC between the Fair, Good, and Bumper groups, and the minimum mean PBC for Fair equaled exactly 89.47%. This finding indicates cone crops with a minimum of 9 out of 10 trees bearing cones should fall into the highest three cone-crop categories. Further, the odds of the 90% threshold proving true (Fair–Bumper crops when PBC ≥ 90) was 18.4:1, with a lower 95% confidence-interval threshold of 10.2:1 and an upper 95% confidence-interval threshold of 33.4:1. These findings represent the successful recognition of a Fair–Bumper year using the simple binary measure of PBC with a 90% threshold.
The percentage of explained variance in the models varied across the 18 cone-monitoring sites, with most sites (14 out of 18) falling within one standard deviation of the mean and only one site (Tall Timbers Research Station) exceeding two standard deviations of the mean. The percentage of variance explained had a strong, negative relationship with average trunk diameter across all 18 sites even though average cone crop was not related to average trunk diameter. My findings support Platt et al. (1988) and Haymes and Fox (2012) that found weak relationships between cone production and DBH. Interestingly, Platt et al. (1988) observed an increase in the variance of average cones per tree as DBH increased, and Haymes and Fox (2012) observed more variance in the relationship between DBH and cone production for open-grown trees vs. trees growing in high density. I believe the model variation observed in this study relates to a combination of variability in tree DBH between stands as well as variability in stand density, for which no data were available to analyze. Even though variations existed, all models were significant and PBC was a strong and reliable predictor through the species’ range.
Longleaf pine cone monitoring has followed a consistent protocol for over six decades (Connor et al., 2014), and the continuity of data-collection has led to numerous publications that have aided the understanding of longleaf pine regeneration (e.g., Boyer, 1987, 1998; Brockway et al., 2006). Rapid mast assessments, such as the one examined in this study, will never replace decades-running measurement techniques designed to produce precise results. That said, rapid assessments might be useful for forest managers interested in quickly identifying high-production mast years. While the results of this observational study were based on data spanning 1991–2019, it would be improper to assume this relationship should always hold for future years. To examine future predictions of cone production from rapid assessments, a rigorous, predictive study should be initiated to make sound predictions from rapid cone measures. Future studies would need to develop a field protocol for the rapid assessment, and these studies should include large sample sizes, a diversity of microsite variations, as well as regional analyses.
Conclusion
A rapid mast assessment, such as the one proposed in this study, should never fully replace traditional mast measurements for reasons related to data-collection continuity. However, rapid assessments could serve as a proxy approach for a landowner or layperson interested in estimating large cone crops. While the rapid cone assessment examined in this study was unable to determine differences in Fair–Bumper cone crops, I was able to show with convincing odds that cone crops required for successful regeneration occurred when PBC met or exceeded 90. Future research should examine rapid mast assessments to learn more about longleaf pine cone production.
Data Availability Statement
The data analyzed in this study is subject to the following licenses/restrictions: data were provided by the USFS Southern Research Station. Requests to access these data should be directed to Sm9obi5XaWxsaXNAdXNkYS5nb3Y=.
Author Contributions
The author confirms being the sole contributor of this work and has approved it for publication.
Conflict of Interest
The author declares that the research was conducted in the absence of any commercial or financial relationships that could be construed as a potential conflict of interest.
Publisher’s Note
All claims expressed in this article are solely those of the authors and do not necessarily represent those of their affiliated organizations, or those of the publisher, the editors and the reviewers. Any product that may be evaluated in this article, or claim that may be made by its manufacturer, is not guaranteed or endorsed by the publisher.
References
Boyer, W. D. (1987). “Annual and geographic variations in cone production by longleaf pine,” in Proceedings Fourth Biennial Southern Silvicultural Research Conference, (Asheville, NC: USDA Forest Service Southeastern Forest Experimental Station), 73–76. Gen. Tech. Rep. SE-42.
Boyer, W. D. (1998). “Long-term changes in flowering and cone production by longleaf pine,” in Proceedings of the Ninth Biennial Southern Silvicultural Research Conference, (Asheville, NC: US Department of Agriculture), 92–98. Clemson, SC. Gen. Tech. Rep. SRS-20.
Brockway, D. G. (2019). Longleaf Pine Cone Prospects for 2019 and 2020. Auburn, AL: USDA Forest Service Southern Research Station, 24.
Brockway, D. G., Outcalt, K. W., and Boyer, W. D. (2006). “Longleaf pine regeneration ecology and methods,” in The Longleaf Pine Ecosystem, eds S. Jose, E. J. Jokela, and D. L. Miller (New York, NY: Springer), 95–133. doi: 10.1007/0-387-30687-0_4
Carevic, F. S., Alejano, R., Fernández, M., and Martín, D. (2014). Assessment and comparison of the visual survey method for estimating acorn production in holm oak (Quercus ilex ssp. ballota) open woodland of Southwestern Spain. Arid Land Res. Manag. 28, 102–108. doi: 10.1080/15324982.2013.808718
Chen, X., Brockway, D. G., and Guo, Q. (2018). Characterizing the dynamics of cone production for longleaf pine forests in the southeastern United States. For. Ecol. Manag. 429, 1–6. doi: 10.1016/j.foreco.2018.06.014
Chen, X., Brockway, D. G., and Guo, Q. (2020). Burstiness of seed production in longleaf pine and Chinese Torreya. J. Sust. For. 40, 188–196. doi: 10.1080/10549811.2020.1746914
Chen, X., Guo, Q., and Brockway, D. G. (2016). Analyzing the complexity of cone production in longleaf pine by multiscale entropy. J. Sust. For. 35, 172–182. doi: 10.1080/10549811.2015.1135294
Chen, X., Guo, Q., and Brockway, D. G. (2017). Power laws in cone production of longleaf pine across its native range in the United States. Sustain. Agric. Res. 6, 64–73. doi: 10.5539/sar.v6n4p64
Connor, K. F., Brockway, D. G., and Boyer, W. D. (2014). “Restoring a legacy: longleaf pine research at the forest service escambia experimental forest,” in USDA Forest Service Experimental Forests and Ranges, eds D. C. Hayes, S. L. Stout, R. H. Crawford, and A. P. Hoover (New York, NY: Springer), 85–101. doi: 10.1007/978-1-4614-1818-4_4
Frost, C. C. (2006). “History and future of the longleaf pine ecosystem,” in The Longleaf Pine Ecosystem, eds S. Jose, E. J. Jokela, and D. L. Miller (New York, NY: Springer), 9–48. doi: 10.1007/978-0-387-30687-2_2
Greenberg, C. H. (2020). Modelling annual southern appalachian acorn production using visual surveys. Wildl. Soc. Bull. 44, 292–299. doi: 10.1002/wsb.1082
Greenberg, C. H., and Parresol, B. R. (2000). Acorn Production Characteristics of Southern Appalachian Oaks: A Simple Method to Predict Within-Year Acorn Crop Size. Asheville, NC: U.S. Department of Agriculture Forest Service. Research Paper SRS-RP-20.
Greenberg, C. H., and Warburton, G. S. (2007). A rapid hard-mast index from acorn presence–absence tallies. J. Wildl. Manag. 71, 1654–1661. doi: 10.2193/2006-295
Guo, Q., Zarnoch, S. J., Chen, X., and Brockway, D. G. (2016). Life cycle and masting of a recovering keystone indicator species under climate fluctuation. Ecosyst. Health Sust. 2:e01226. doi: 10.1002/ehs2.1226
Haymes, K. L., and Fox, G. A. (2012). Variation among individuals in cone production in Pinus palustris (Pinaceae). Am. J. Bot. 99, 640–645. doi: 10.3732/ajb.1100339
Leduc, D. J., Sung, S.-J. S., Brockway, D. G., and Sayer, M. A. (2016). “Weather effects on the success of longleaf pine cone crops,” in Proceedings of the 18th Biennial Southern Silvicultural Research Conference, eds C. J. Schweitzer, W. K. Clatterbuck, and C. M. Oswalt (Asheville, NC: USDA Forest Service, Southern Research Station), 535–541.
Loudermilk, L. E., Hiers, K. J., Pokswinski, S., O’Brien, J. J., Barnett, A., and Mitchell, R. J. (2016). The path back: Oaks (Quercus spp.) facilitate longleaf pine (Pinus palustris) seedling establishment in xeric sites. Ecosphere 7: e01361. doi: 10.1002/ecs2.1361
Nakajima, A., Masaki, T., Koike, S., Yamazaki, K., and Kaji, K. (2015). Estimation of tree crop size across multiple taxa: generalization of a visual survey method. Open J. For. 5, 651–661. doi: 10.4236/ojf.2015.57057
Noss, R. F., Platt, W. J., Sorrie, B. A., Weakley, A. S., Means, D. B., Costanza, J., et al. (2015). How global biodiversity hotspots may go unrecognized: lessons from the North American Coastal Plain. Divers. Distrib. 21, 236–244. doi: 10.1111/ddi.12278
Oswalt, C., and Guldin, J. M. (2021). “Status of longleaf pine in the South: an FIA update,” in On File With: Chris Oswalt, Southern Research Station, Forest Inventory and Analysis, 4700, (Knoxville, TN: Old Kingston Pike), 25.
Patterson, T. W. (2020). Longleaf pine cone production and the influence of super-producing trees. Southeast. Geogr. 60, 332–344. doi: 10.1353/sgo.2020.0027
Patterson, T. W., and Knapp, P. A. (2016). Stand dynamics influence Masting/Radial growth relationships in Pinus palustris mill. Castanea 81, 314–322. doi: 10.2179/16-085
Patterson, T. W., and Knapp, P. A. (2018). Longleaf pine cone–radial growth relationships in the southeastern USA. Dendrochronologia 50, 134–141. doi: 10.1016/j.dendro.2018.05.006
Pederson, N., Kush, J. S., Meldahl, R. S., and Boyer, W. D. (1999). “Longleaf pine cone crops and climate: a possible link,” in Tenth Biennial Southern Silvicultural Research Conference, (Shreveport, LA: USDA Forest Service, Southern Research Station), 255–259.
Peet, R. K. (2006). “Ecological classification of longleaf pine woodlands,” in The Longleaf Pine Ecosystem, eds S. Jose, E. J. Jokela, and D. L. Miller (New York, NY: Springer), 51–93. doi: 10.1007/0-387-30687-0_3
Keywords: longleaf pine, masting, pine cone, southeast, modeling
Citation: Patterson T (2021) The Percentage of Trees Bearing Cones as a Predictor for Annual Longleaf Pine Cone Production. Front. For. Glob. Change 4:718218. doi: 10.3389/ffgc.2021.718218
Received: 31 May 2021; Accepted: 09 July 2021;
Published: 28 July 2021.
Edited by:
John L. Willis, Southern Research Station, Forest Service, United States Forest Service (USDA), United StatesReviewed by:
Qinfeng Guo, United States Forest Service (USDA), United StatesDavid Clabo, University of Georgia, United States
Copyright © 2021 Patterson. This is an open-access article distributed under the terms of the Creative Commons Attribution License (CC BY). The use, distribution or reproduction in other forums is permitted, provided the original author(s) and the copyright owner(s) are credited and that the original publication in this journal is cited, in accordance with accepted academic practice. No use, distribution or reproduction is permitted which does not comply with these terms.
*Correspondence: Thomas Patterson, VGhvbWFzLncucGF0dGVyc29uQHVzbS5lZHU=