 Joachim Zhu1,2
 Anne Thimonier1
 Sophia Etzold1
 Katrin Meusburger1
 Peter Waldner1
 Maria Schmitt1
 Patrick Schleppi1
 Marcus Schaub1Jean-Jacques Thormann2
 Marco M. Lehmann1*
- 1Swiss Federal Institute for Forest, Snow and Landscape Research (WSL), Birmensdorf, Switzerland
- 2School of Agricultural, Forest and Food Sciences (HAFL), Bern University of Applied Sciences (BFH), Zollikofen, Switzerland
Leaf morphological traits (LMTs) of forest trees have been observed to vary across space and species. However, long-term records of LMTs are scarce, due to a lack of measurements and systematic leaf archives. This leaves a large gap in our understanding of the temporal dynamics and drivers of LMT variations, which may help us understand tree acclimation strategies. In our study, we used long-term LMT measurements from foliar material collections of European beech (Fagus sylvatica) and Norway spruce (Picea abies), performed every second year from 1995 to 2019 on the same trees within the Swiss Long-term Forest Ecosystem Research Program LWF. The 11 study plots (6 beech, 4 spruce, and 1 mixed) are distributed along gradients of elevation (485–1,650 m a.s.l.), mean annual precipitation (935–2142 mm), and mean annual temperature (3.2–9.8°C). The investigated LMTs were (i) leaf or needle mass, (ii) leaf area or needle length, and (iii) leaf mass per area or needle mass per length. We combined this unique data set with plot variables and long-term data on potential temporal drivers of LMT variations, including meteorological and tree trait data. We used univariate linear regressions and linear mixed-effects models to identify the main spatial and temporal drivers of LMT variations, respectively. For beech LMTs, our temporal analysis revealed effects of mast year and crown defoliation, and legacy effects of vapor pressure deficit and temperature in summer and autumn of the preceding year, but no clear long-term trend was observed. In contrast, spruce LMTs were mainly driven by current-year spring conditions, and only needle mass per length showed a decreasing long-term trend over the study period. In temporal models, we observed that LMTs of both species were influenced by elevation and foliar nutrient concentrations, and this finding was partly confirmed by our spatial analyses. Our results demonstrate the importance of temporal analysis for determining less recognized drivers and legacy effects that influence LMTs, which are difficult to determine across space and species. The observed differences in the temporal drivers of beech and spruce LMTs suggest differences in the adaptation and acclimation potential of the two species.
Introduction
Global observations of declining forest health and increasing tree mortality, induced by various abiotic and biotic stressors, are raising worldwide concerns about forests’ responses to future climate scenarios (IPCC, 2015; O’sullivan et al., 2017). Monitoring environmental changes and forest responses to these changes is thus essential to predict future dynamics in these ecosystems (Rigling and Schaffer, 2015; Thom et al., 2017). European beech (Fagus sylvatica L.) and Norway spruce [Picea abies (L.) Karst.], the most prominent broadleaf deciduous and evergreen coniferous tree species in the European Alps and forelands, are known to be negatively affected by extreme climatic events, especially the extended droughts and warm periods that have occurred in recent years (Leuschner, 2020; Rigling and Stähli, 2020; Walthert et al., 2021). Thus, a deeper understanding of the spatio-temporal acclimation capabilities and strategies of these prominent tree species is essential.
Leaf morphological traits (LMTs) have often been used as taxonomic identifiers and are considered appropriate indicators of plant functioning, such as photosynthetic and respiratory rates (Wright et al., 2004; Poorter et al., 2009). Leaves are used to exchange water and air with the surrounding environment, and their morphology directly affects their physiology (Fitter and Hay, 2002). Adjustments in LMTs, such as dry mass, leaf area (LA) and their ratio leaf mass per area (LMA), can enable plants to acclimate and cope with local environmental conditions along with global changes (e.g., water availability, temperature, air humidity, and nutrients) (Teskey, 2004; Scoffoni et al., 2014; Sanginés de Cárcer et al., 2017; Halbritter et al., 2020). LMTs demonstrate high plasticity between different tree species, according to their plant functional type and different acclimation strategies, within the same species and within the canopy of individual trees (Teskey, 2004; Wright et al., 2004). Major differences in LMTs are commonly observed between deciduous broadleaved and coniferous evergreen species. Conifers generally have a higher LMA, mainly due to their greater leaf tissue density, lower relative LMA plasticity and lower mass-based leaf nitrogen (N) concentration than deciduous broadleaved trees (Poorter et al., 2009; Wyka et al., 2012).
Beech LMTs have been found to have high intrapopulation variability and, therefore, a high potential acclimation capacity (Bresson et al., 2011). Beech leaves flush in spring and leaf growth stops in early summer, with an average life span of 5.4 months (Withington et al., 2006). The number of primordial leaf buds is determined during the preceding year’s growing season (Roloff, 1987; Cochard et al., 2005), where early summer droughts reduce the number of buds and late summer droughts affect the size of the future leaves (Roloff, 1987). Therefore, climatic conditions in both the preceding year (bud formation) and the year in which the leaves flush and grow (bud expansion) can potentially influence leaf morphology, in particular leaf size (Roloff, 1987; Coder and Warnell, 1999). Similarly, the occurrence of mast years is determined by the climatic conditions of the preceding summer (Müller-Haubold et al., 2015; Nussbaumer et al., 2021) and has been shown to influence leaf size and mass, with smaller leaves or lower dry mass observed in years with high fructification. Moreover, LMA has been reported to correlate positively and leaf size negatively with elevation (Bresson et al., 2011). Beech LMA has also been shown to be consistently higher for sun leaves compared with shade leaves (Closa et al., 2010). Reduced water availability usually promotes higher LMA and lower leaf size (Bussotti et al., 2005; Bréda et al., 2006). However, LMA has been shown to decrease and leaf size to increase from moist to drier sites in Germany and Switzerland, as long as spring conditions are favorable (Meier and Leuschner, 2008; Leuschner, 2020; Salehi et al., 2020).
For Norway spruce, needle primordia are formed in summer of the preceding year, when bud scales are formed and shoot growth declines (Ununger and Kang, 1988). In contrast to beech leaves, spruce needles can have a life span of more than 8 years (Withington et al., 2006). To our knowledge, no studies exist on the potential effects of previous year climatic conditions on spruce LMTs. However, Selås et al. (2002) reported that seed production and tree ring growth were influenced by summer temperatures in the preceding year, as well as precipitation in both the preceding and current year. Spruce needle length (NL) (Baig and Tranquillini, 1976) and needle dry mass (Gottardini et al., 2016) decrease with increasing elevation, i.e., decreasing temperature. NL has also been observed to be influenced by irradiance and ambient CO2 concentration (Kubínová et al., 2018). Sun-exposed needles are generally longer and denser and have a greater volume and higher LMA than leaves growing in the shade, also due to their greater cross-sectional area (Kubínová et al., 2018; Gebauer et al., 2019). Needle structure is more affected by canopy structure than by water availability (Gebauer et al., 2019). Nevertheless, drought has been observed to negatively influence NL, but without leading to changes in LMA or dry mass (Gebauer et al., 2019). Even though spruce is more susceptible to drought than beech (Zang et al., 2014; Sanginés de Cárcer et al., 2017), we found few studies in which spruce LMTs were considered.
Although a great deal of research has been devoted to the topic, our knowledge on LMTs is still mainly based on spatial comparisons across different gradients, which indicate that variations in LMTs are mainly driven by temperature and water availability (Peppe et al., 2011; Wright et al., 2017). In contrast, temporal variations in LMTs and their response to multiple drivers are still poorly understood, mainly owing to the scarcity of systematic measurements and foliar archives (e.g., Li et al., 2020). However, knowledge on long-term LMT variation in trees is key for the correct interpretation of growth and physiological responses to rising air temperatures and CO2 concentrations (IPCC, 2015), increasing vapor pressure deficit (Trotsiuk et al., 2021), more extreme and longer-lasting summer droughts (CH2018, 2018), and shifts in nutrient availability driven by changes in atmospheric deposition (Waldner et al., 2014, 2015).
The main aims of this study were, therefore, to determine the (1) spatial and (2) temporal variation in LMTs of beech and spruce across different forest plots, and (3) to identify the potential drivers of LMT variations. We made use of archived foliar material as whole leaves and needles that was collected biennially within the Swiss Long-term Forest Ecosystem Research network (LWF, e.g., Schaub et al., 2011) from 1995 to 2019. Based on this unique foliar collection, we built a LMT chronology for investigating dry weight, LA or NL, and LMA or needle mass per length (NML) for six beech and four spruce plots and one mixed forest plot. We combined this LMT data set with plot variables (e.g., elevation and stand age) and long-term data covering climatic variables and drought indices, foliar nutrient and carbon (C) concentrations, and other tree-trait parameters (e.g., fruiting intensity and crown defoliation) to identify the main spatial and temporal drivers of LMT variations.
Materials and Methods
Description of Study Plots
Foliar material and tree traits from beech and spruce were acquired from 11 forest plots with differing environmental conditions in Switzerland (Figure 1 and Table 1). All 11 plots are part of the LWF network (e.g., Schaub et al., 2011) and belong to the Level II network of the European International Co-operative Program on Assessment and Monitoring of Air Pollution Effects on Forests (ICP Forests; e.g., de Vries et al., 2003). The plots are distributed along large gradients of elevation (485–1,650 m a.s.l.), mean annual precipitation (MAP, 935–2,142 mm) and mean annual temperature (MAT, 3.2–9.8°C). The plot selection was based on the prominence of the studied tree species and the availability of long-term data from the LWF network. Parts of the beech stands investigated by Salehi et al. (2020) were included in our study.
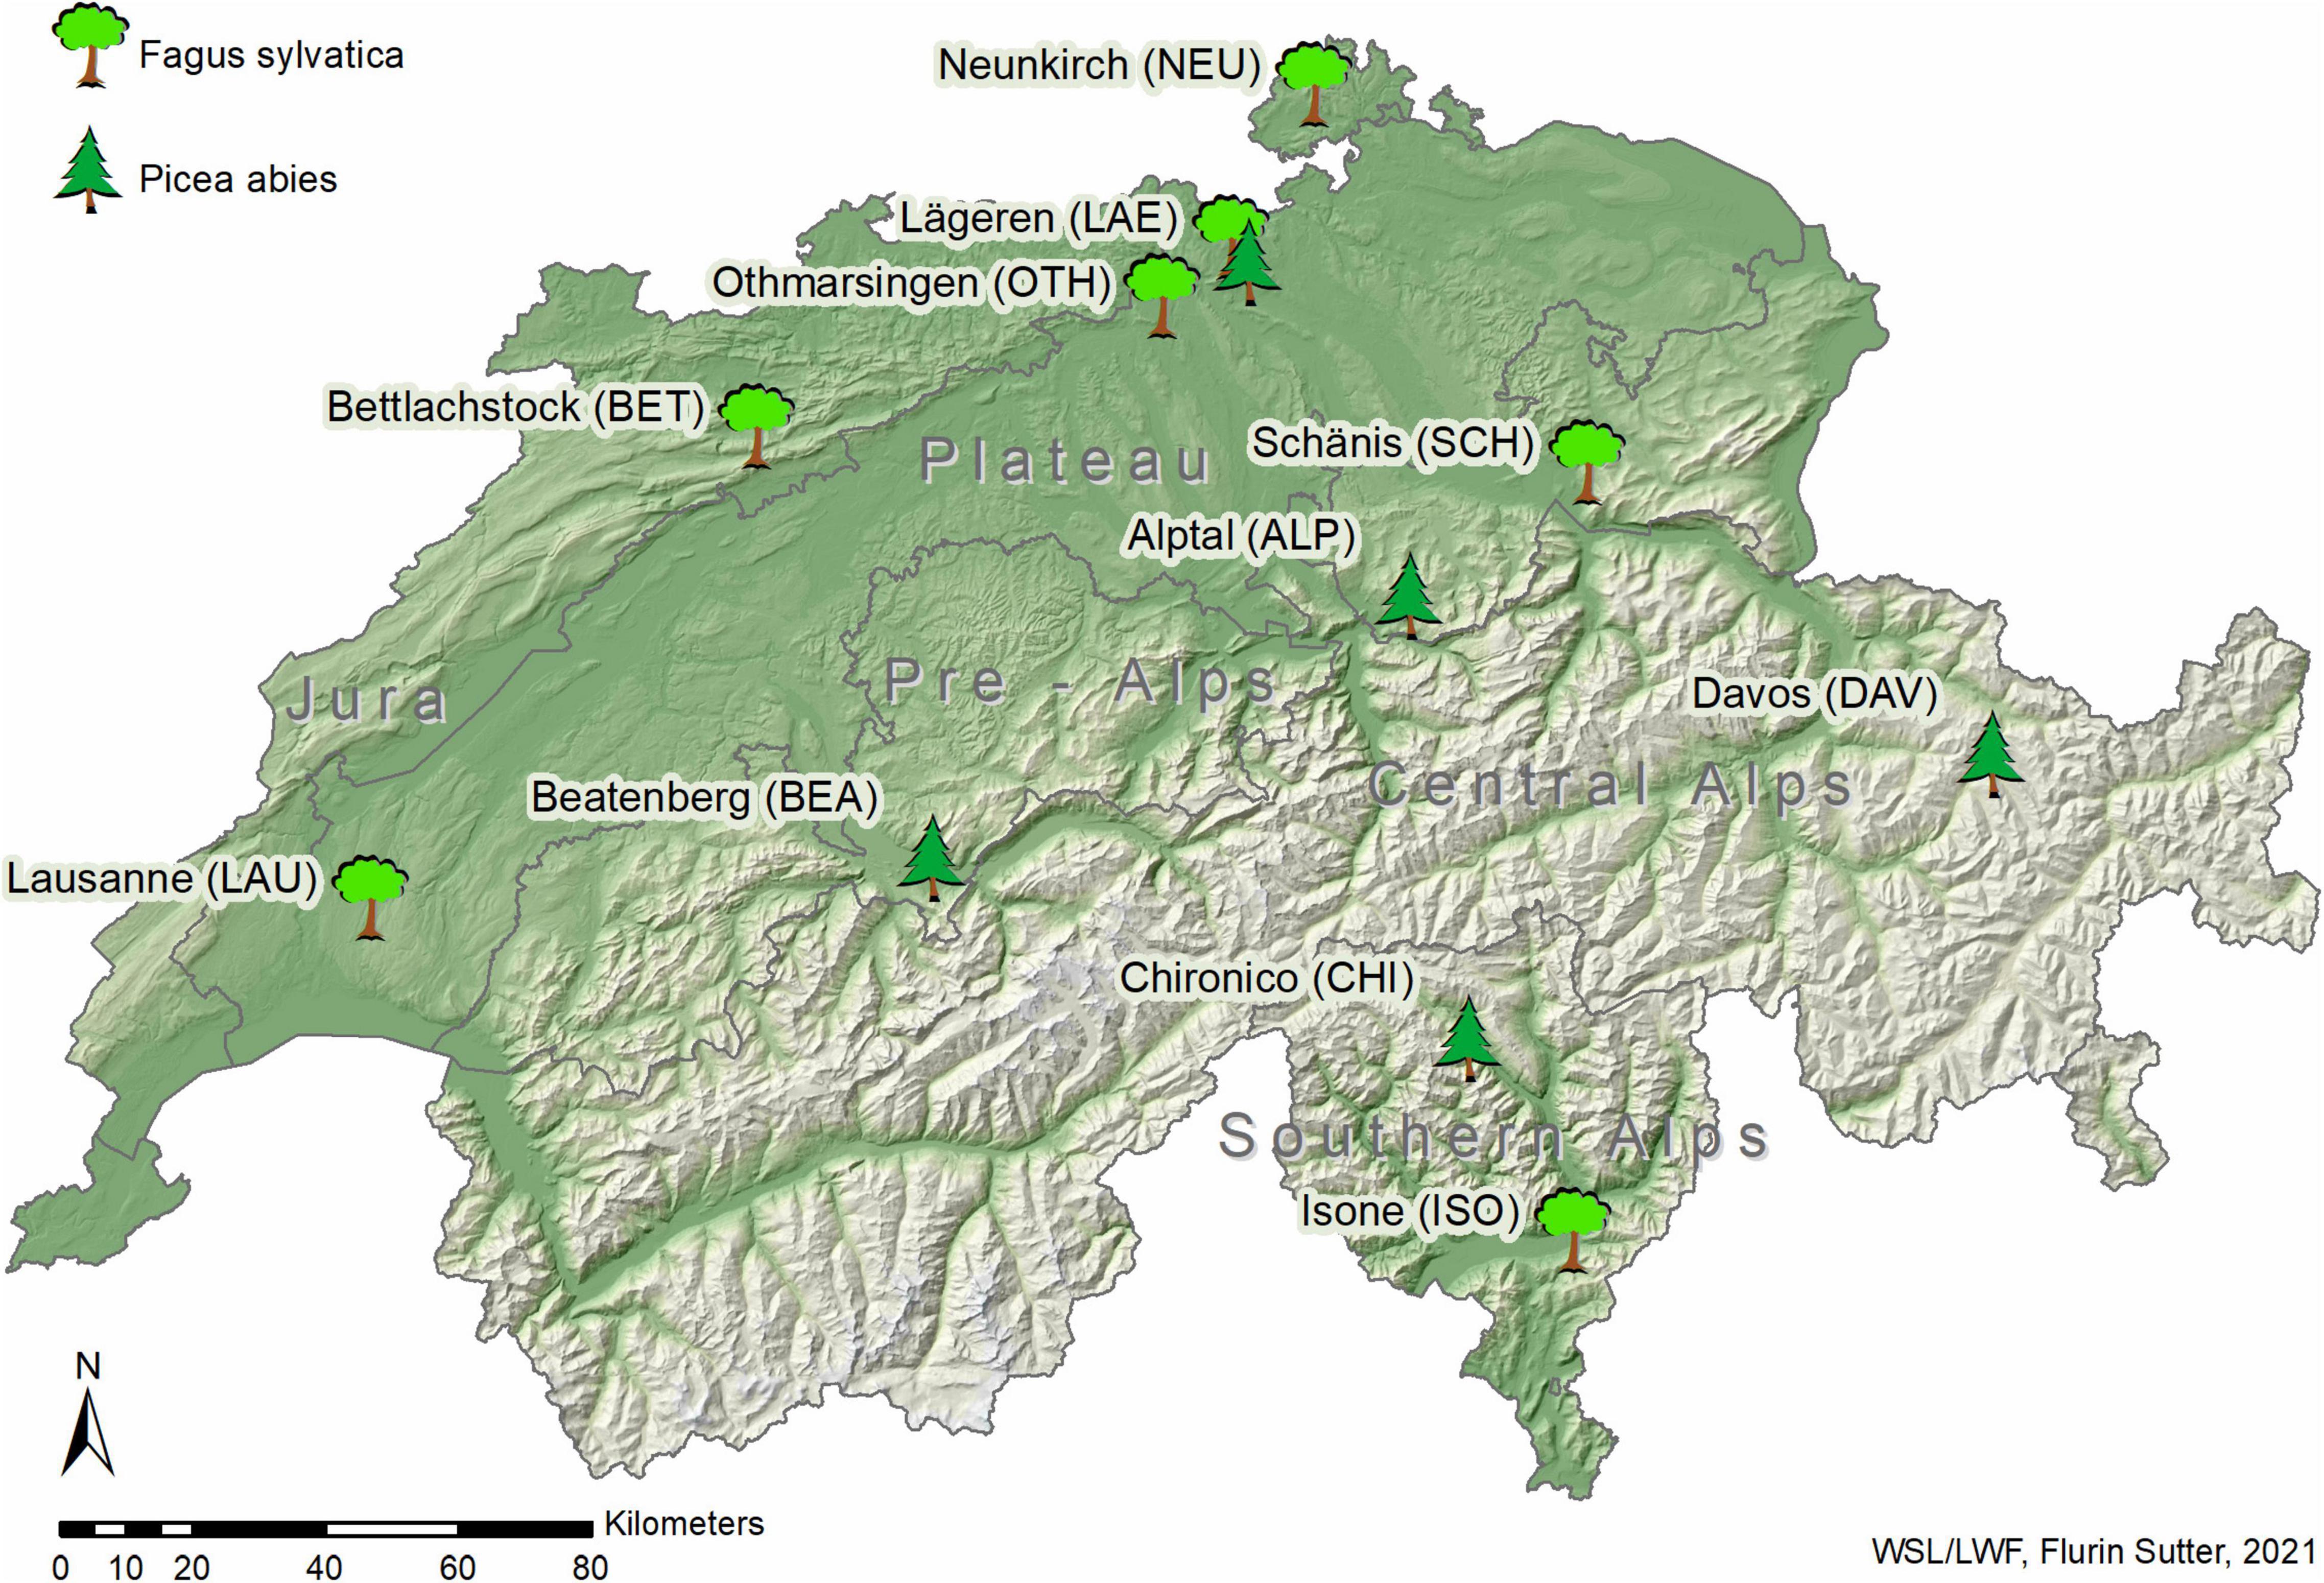
Figure 1. Locations of the 11 study plots distributed across Switzerland with the investigated main tree species European beech (Fagus sylvatica) and Norway spruce (Picea abies).
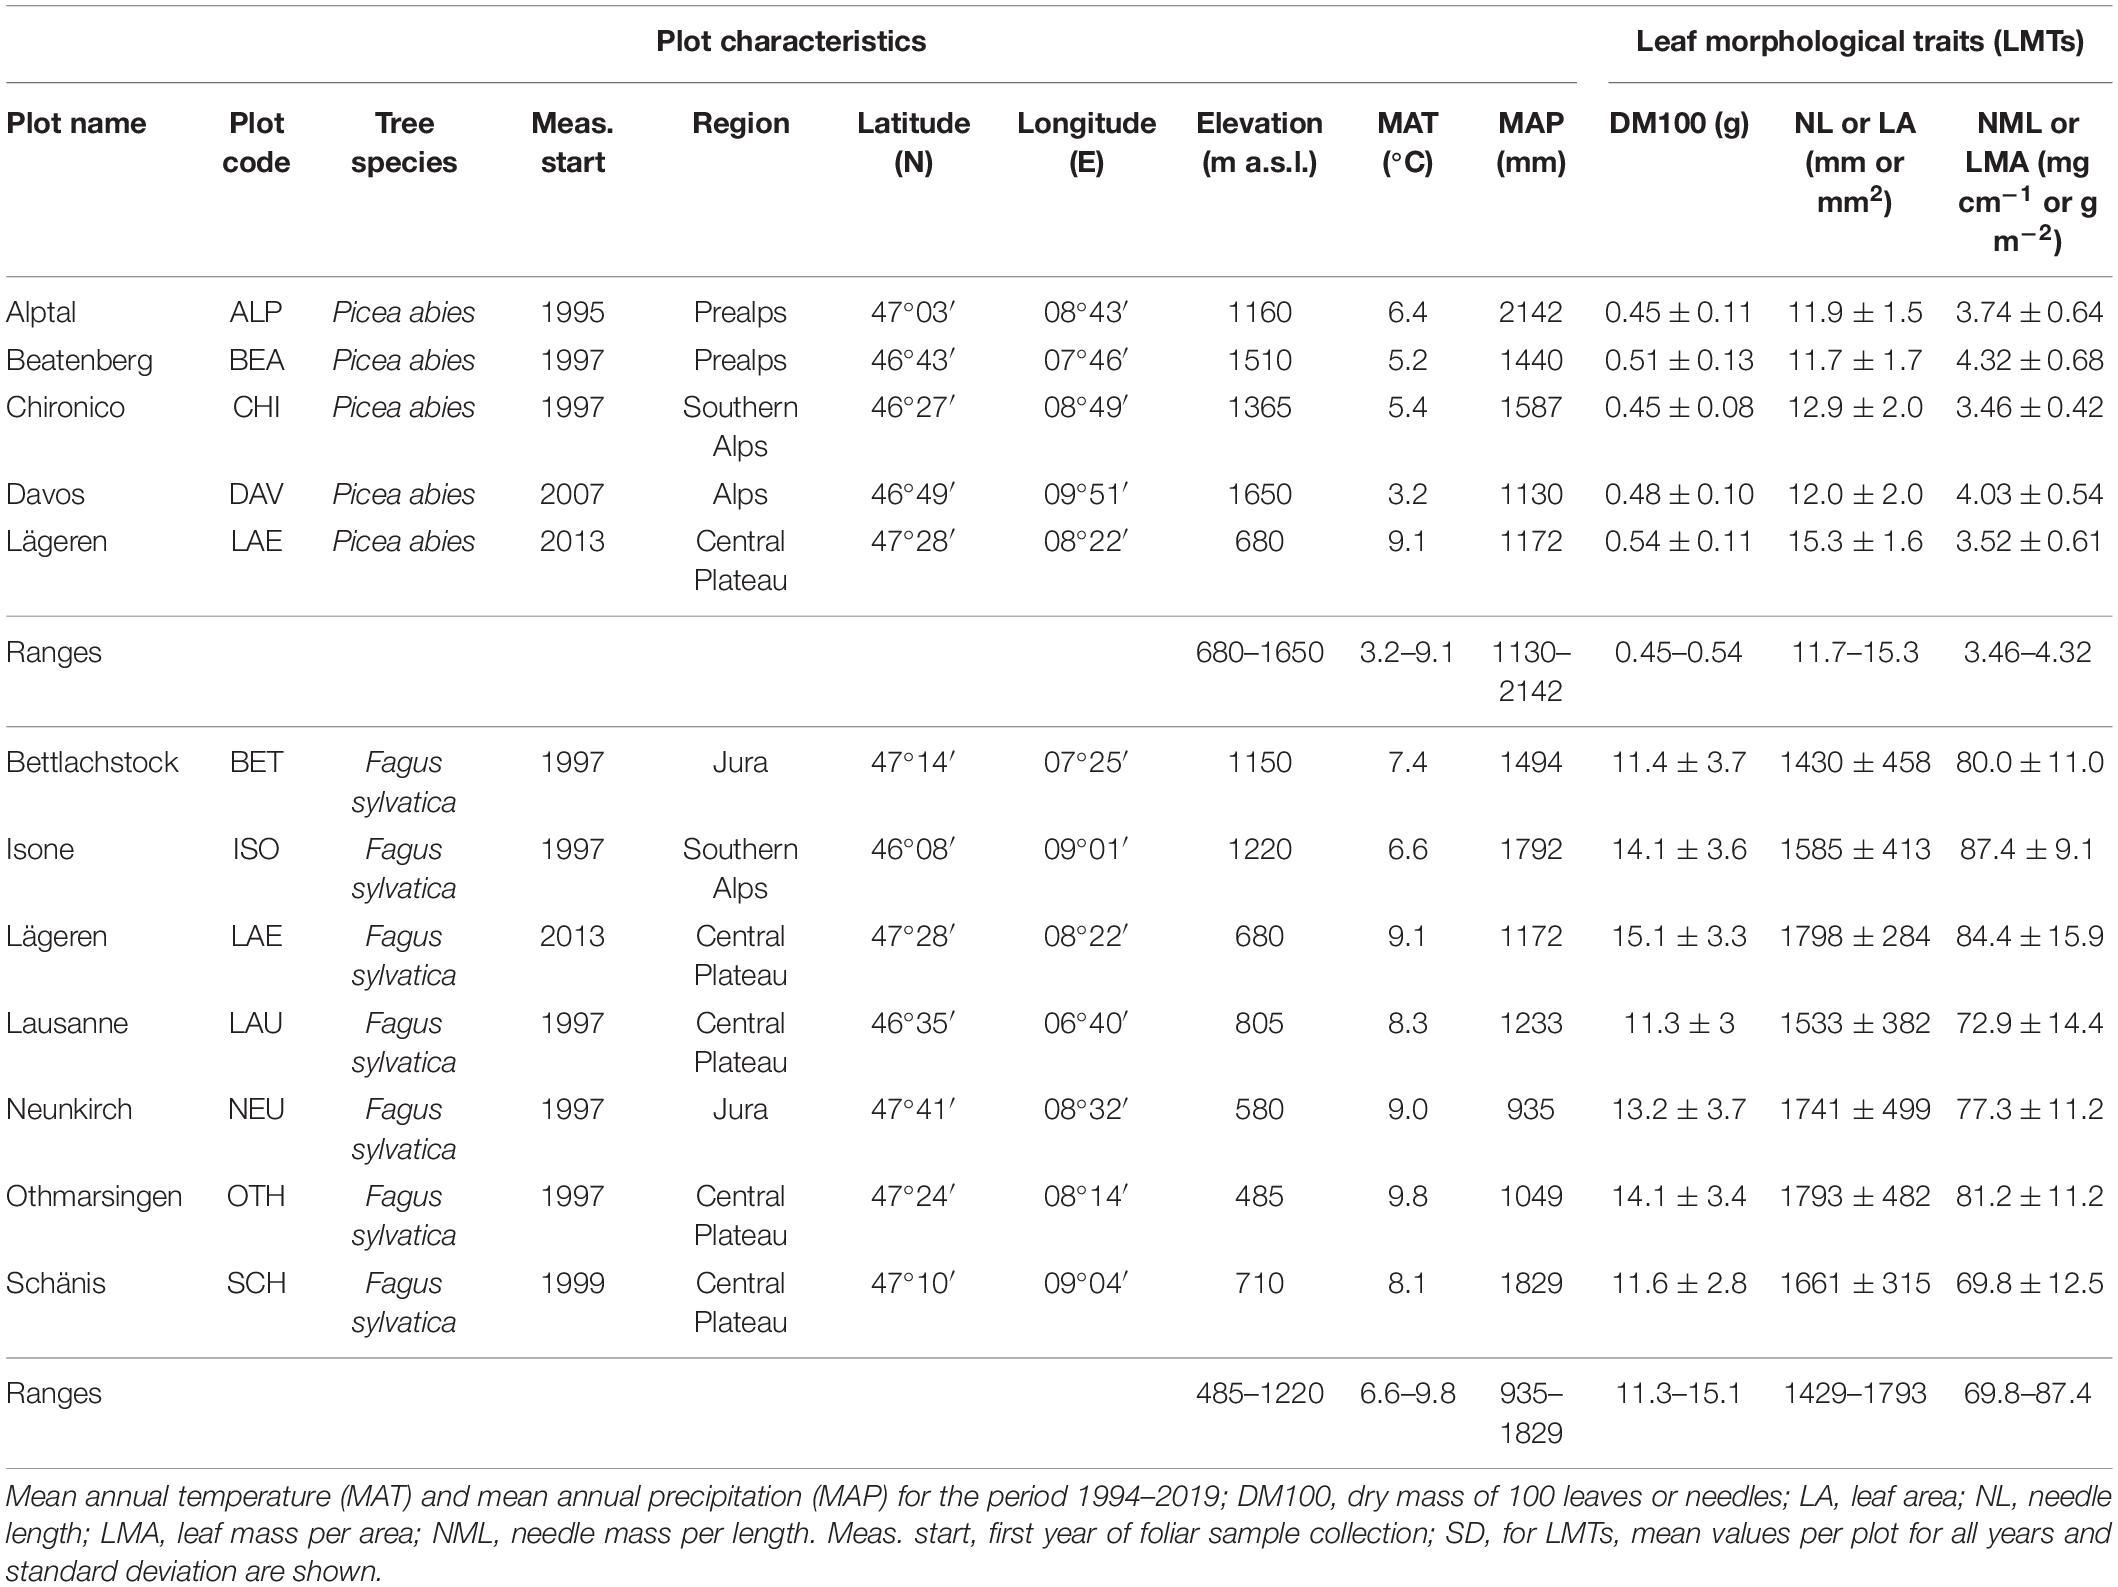
Table 1. Plot characteristics, ranges and average long-term leaf morphological traits (LMTs) for 11 study plots (6 beech, 4 spruce, and 1 mixed stand).
Sampling, Processing, and Measurement of Foliar Material
Field Sampling
The collection of leaves and needles on the LWF plots followed the UNECE/ICP Forests protocol for foliar chemistry (Rautio et al., 2016) and was conducted between 1995 and 2019, generally every second year, which is the minimum sampling frequency recommended in ICP Forests. The foliar samples were obtained from five adult trees (Davos plot: six trees) belonging to the dominant or co-dominant class for each plot and tree species. The social class of the trees was determined by trained field observers using the definitions of the Swiss Sanasilva Inventory described by Dobbertin et al. (2016). Dominant trees denote trees with upper crowns reaching above the general level of the canopy (see top height in Supplementary Table 1), clearly dominating the neighboring trees. Co-dominant trees reflect trees with upper crowns participating in the forming of the uppermost canopy level, but with crowns that are less strong and less well developed than those of the dominant trees. From each tree, one or two sun-exposed branches, approximately 1–1.5 m long, were collected from the upper third of the crown (see tree and sampling height in Supplementary Table 1). The sampling was performed at the end of the summer for beech (usually August), before leaf yellowing or senescence, and during autumn for spruce (usually October), when coniferous species begin their dormancy period (Thimonier et al., 2010). The branches were transported to the laboratory in plastic bags and stored at 2°C before processing.
Foliar Sample Processing and Leaf Morphological Trait Measurements
Leaf and Needle Dry Mass
In the laboratory, the overall condition of leaves and needles of the sampled branches was first described. In particular, the presence and extent of visible symptoms of damage (e.g., presence of necrotic tissue, discoloration, and physical damage), as well as the presence of beechnuts and spruce cones (see section “Tree and Stand Parameters”), were documented. Beech leaves were then clipped from the branches. For spruce, whole shoots of the current year were separated. The dry mass of 100 leaves or needles (DM100) was determined (since 1995 or later, depending on the plot) after oven-drying the foliar material at 65°C until a constant weight was reached. For beech, DM100 was determined by weighing exactly 100 leaves. For spruce, DM100 was determined by weighing three sets of 100 needles and by calculating the average mass of these three sets. If the coefficient of variation was higher than 10%, a fourth set of 100 needles was weighed and included in the calculation of the average.
Leaf Area and Needle Length
Within the LWF plots, LA and NL have been determined since 2005 by scanning 30 fresh beech leaves (200 dpi, ∼10 leaves per scan) and 300 dried spruce needles (600 dpi, ∼100 needles per scan) with a flatbed scanner (Epson Perfection V800, Seiko Epson Corporation, Japan) and processing the images with the software WinSeedle (version 2006, Régent Instruments, Quebec, QC, Canada). For beech, LA was occasionally underestimated because curled leaves had been scanned. To quantify and correct this curling effect, we simulated the whole process with a new set of fresh beech leaves, scanning them with and without a weighting glass plate. The LA of the unweighted leaves was on average 10% smaller than the LA of weighted leaves, with a maximum difference of 26% for an individual leaf. Based on the quantification of the curling effect, we established and applied a curling correction factor of 6 levels (0, 2, 5, 8, 12, and 18%) to all the existing scans (i.e., completed since 2005). For spruce, we observed LA differences of up to 50%, depending on the placement of the needles on the flatbed scanner, as spruce needles are not symmetrically wide (e.g., Kubínová et al., 2018). This effect was much less severe for the length of the needles, with differences of up to around 4%. Consequently, we investigated NL but not needle area for spruce.
Prior to 2005, beech LA and spruce NL were not measured within the LWF program, and we applied an adapted method to measure the archived samples. For beech, we took 10–20 leaves per sample from the archive, depending on the availability of intact leaves. We first re-dried the samples to a constant weight at 65°C and weighed them, then humidified them for 24 h in a sealed plastic bag with 1–2 sprays (1.5–2 ml) of deionized water. The humidified leaves became pliable again and therefore could be scanned. We measured LA as done for the samples collected within the LWF program. In some cases we used the same adapted method to repeat the existing scans for particularly curled beech leaves, which were too difficult to assess with the established curling correction factor, using archived samples collected after 2005. For spruce, we also re-dried archived needles to a constant weight of 0.5–0.8 g (∼100–200 needles) per sample, weighed (1 mg precision) and scanned them, and measured NL as done for the samples collected within the LWF program. The number of archived leaves or needles that we processed was lower than the number of leaves or needles usually processed as part of the LWF program. We therefore verified the representativeness of the samples taken from the archives by comparing the average dry mass of a leaf or a needle from the archives with that determined in the LWF program.
Leaf Mass Per Area and Needle Mass Per Length
Leaf mass per area was calculated for beech by dividing the dry mass of the 30 scanned leaves, estimated as a proportion of measured DM100, by their area. For spruce, NML was calculated by dividing the average dry mass of a needle by the average NL, which were both determined using the same sets of 3 × 100 needles. For the samples collected before 2005 and for archived samples collected after 2005 that were measured again, LMA and NML were calculated from the actual LA or NL and dry mass measurements of the samples.
Investigated Parameters as Potential Drivers of Leaf Morphological Traits Variation
A list with the abbreviations and descriptions of all investigated LMTs, their potential drivers and other abbreviations used in this study is given in Table 2.
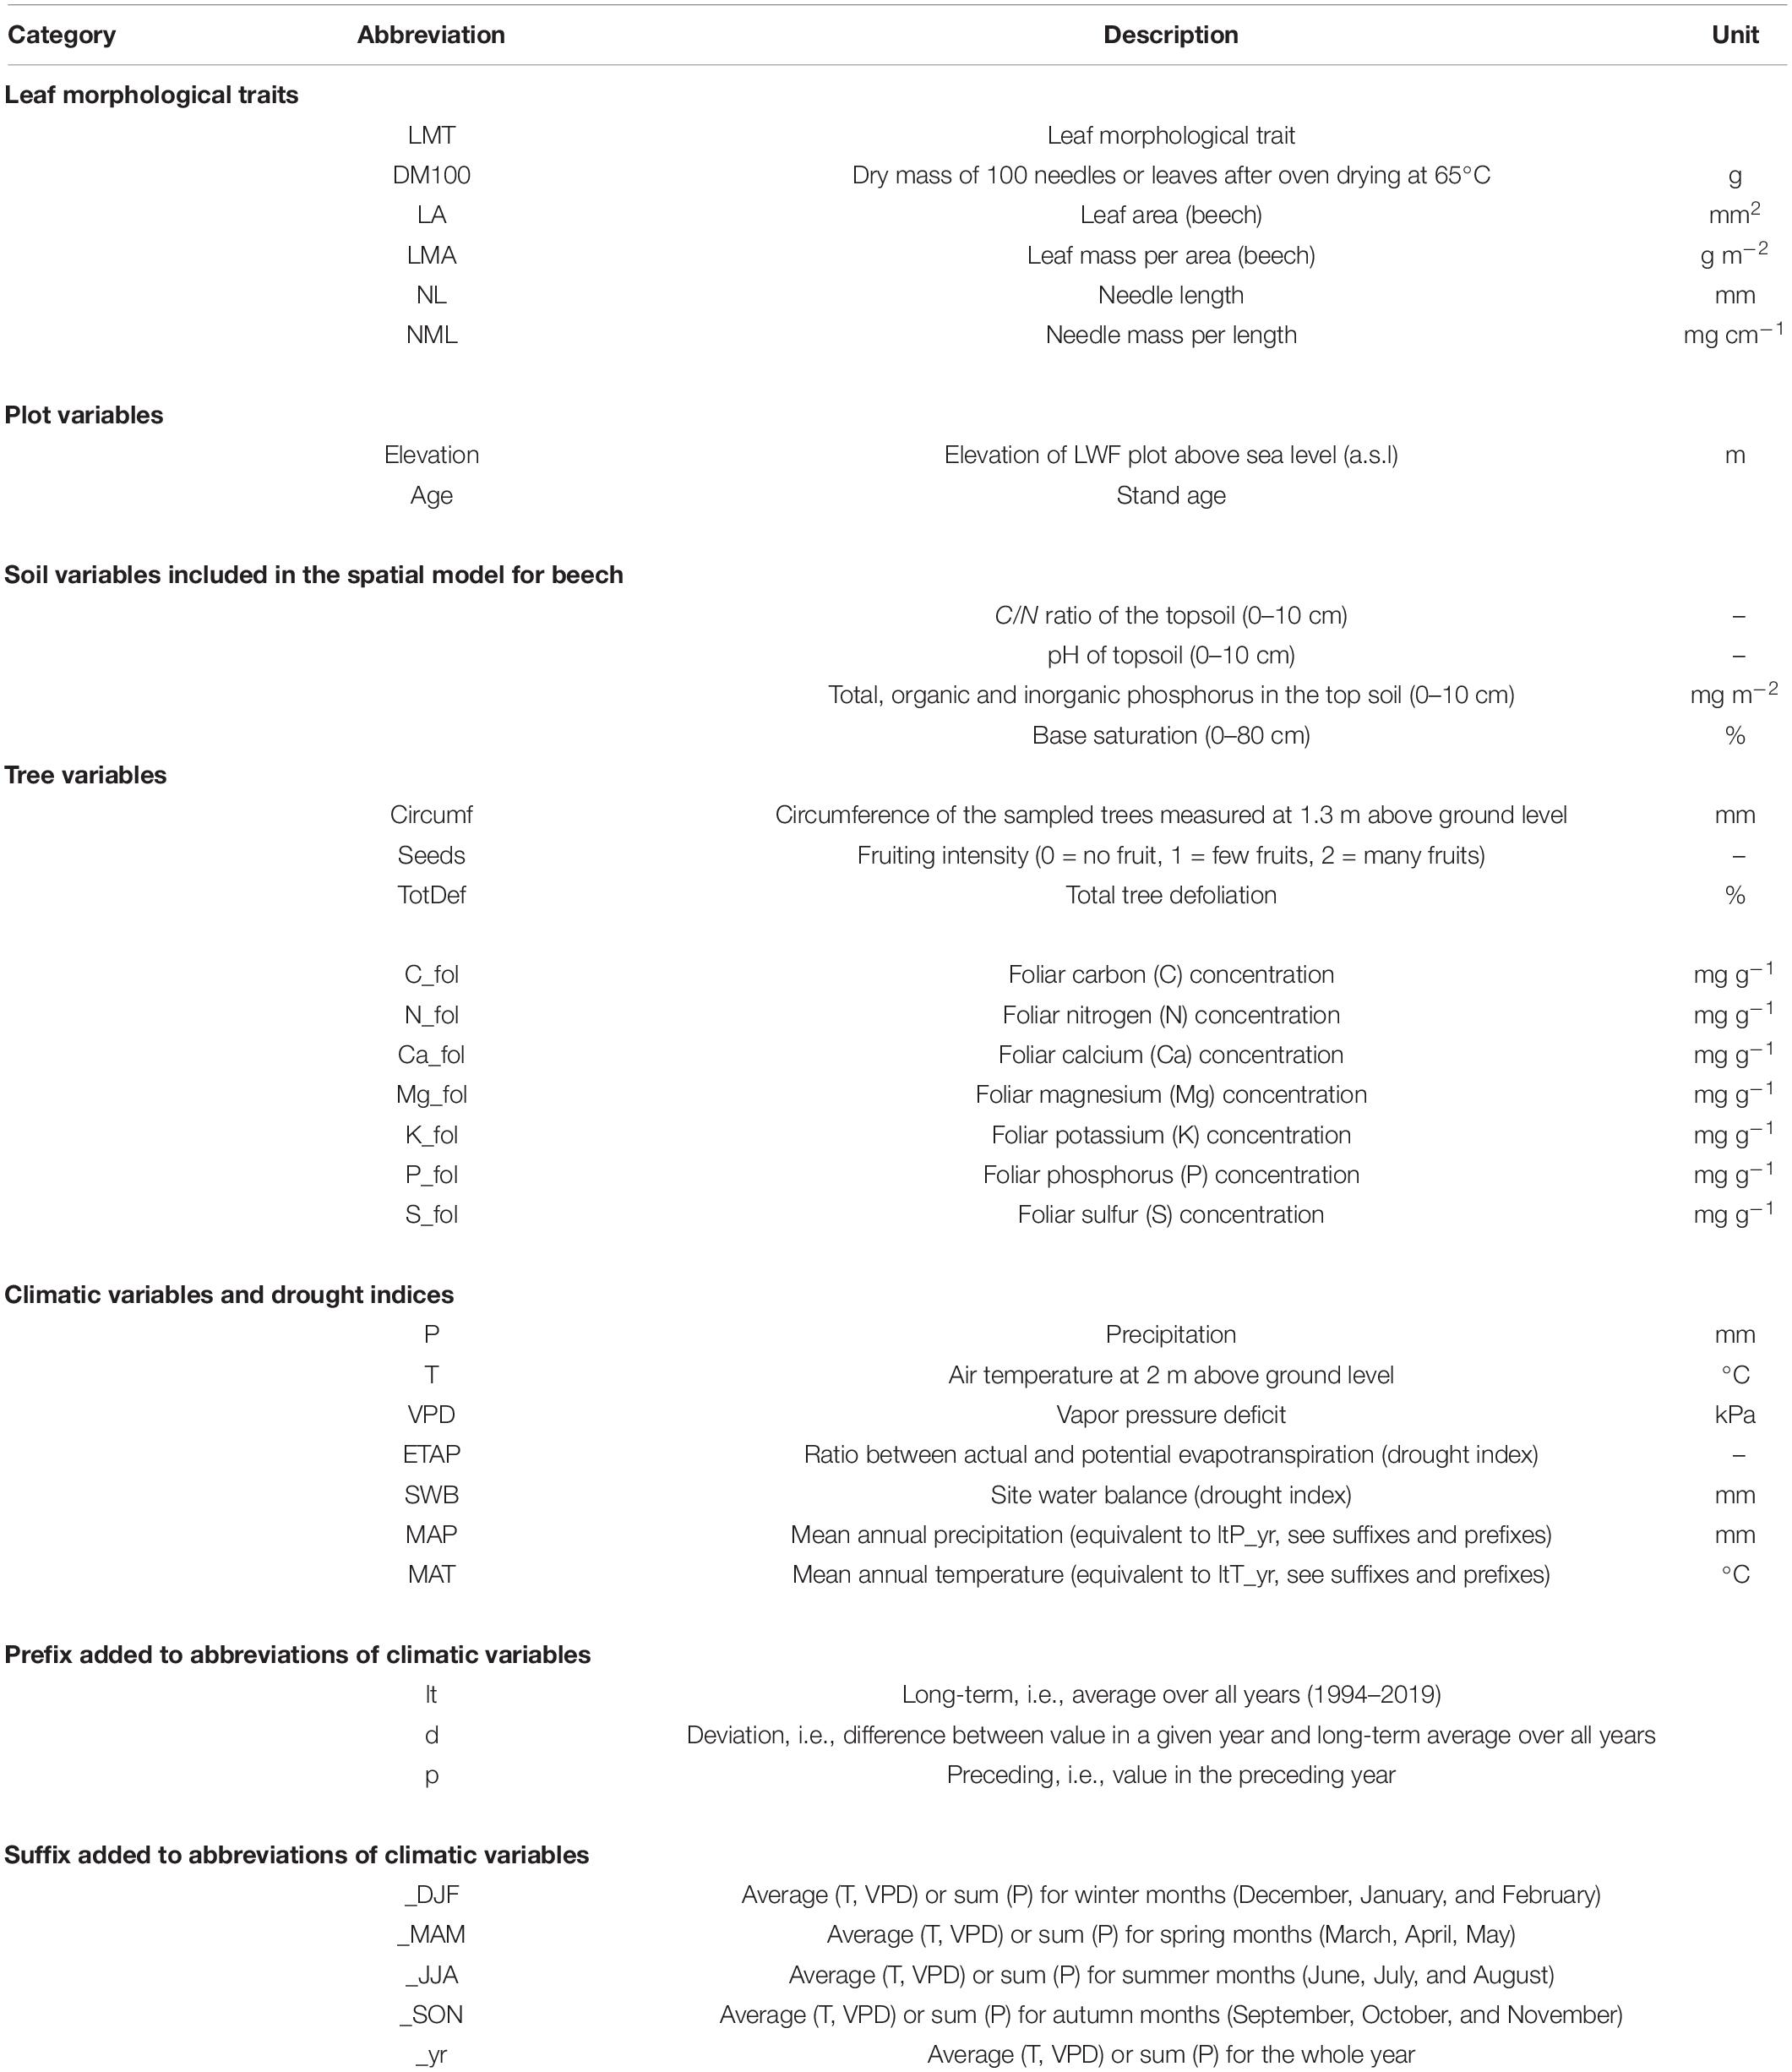
Table 2. List of abbreviations and variable descriptions.
Tree and Stand Parameters
The circumference of the sampled trees was measured at 1.30 m above ground level with a girth tape on the day of foliage collection (see also the average stem diameter of the sampled trees measured during the 2014/2015 tree inventory in Supplementary Table 1). Fruiting or seeding intensity and crown defoliation were assessed during the Sanasilva inventory, which takes place every summer on LWF plots (Dobbertin et al., 2016; Eichhorn et al., 2016). We also considered the elevation, stand age and, for beech plots only, the physico-chemical properties of the soil (see section “Spatial Analysis”).
We investigated fruiting intensity only for beech, as less data was readily available for spruce cones, particular for earlier sampling years. We extracted information on the quantity of beechnuts from the laboratory protocols describing sampled branches, or, when the information was missing, from photographs of the branches. This information was combined with the assessments from the Sanasilva inventory (Dobbertin et al., 2016) at tree level, which were available for 2009–2019 only. We established a three-level factor for fruiting intensity (categorical variable “seeds”) to indicate the presence and quantity of beech nuts at the branch level, with 0 = <5 fruits, 1 = ≥5 but <50 fruits, and 2 = ≥50 fruits. To calculate the score at the plot level, we used the median of the scores at the tree level, rounding down to full numbers, while also verifying the representativeness of our scores by re-checking the branch photographs and Sanasilva scores. Higher scores (i.e., 1 or 2) of fruiting intensities are indicative of mast years. The percentage of total crown defoliation (TotDef) of the sample trees was determined by the Sanasilva team (Dobbertin et al., 2016). If information was missing for individual trees, we relied on the average crown defoliation at the plot level.
Foliar Macronutrient and Carbon Concentrations
Subsamples of 3–4 g beech leaves and 2–3 g spruce needles per tree (both oven-dried at 65°C) were ground in a mixer mill (MM400, Retsch GmbH, Haan, Germany) to determine their chemical composition. A more thorough description of the various chemical analyses is given in Salehi et al. (2020). This study focused on the concentrations [‰ of dry weight] of foliar macronutrients and carbon. Carbon (C) and nitrogen (N) were determined with a CN element analyzer (NA 2500, CE Instruments, Wigan, United Kingdom), while sulfur (S), phosphorus (P), potassium (K), calcium (Ca), and magnesium (Mg) were measured by microwave digestion with 5 M nitric acid (HNO3) and 0.5 M fluoric acid (HF), with a subsequent ICP-AES analysis (Optima 3000, PerkinElmer, Waltham, MA, United States). These analyses were done partly on the subsamples of the single trees and partly on pooled subsamples from the five trees from the same plot. In the figures and tables, we abbreviate foliar nutrient and C concentrations using the suffix “_fol” to avoid confusion between the chemical and climatic abbreviations, e.g., phosphorus and precipitation.
Climatic Data and Drought Indices
We considered environmental data from the year of sampling, as well as from preceding years, to take into account potential legacy effects (e.g., Jump et al., 2017), i.e., data from 1994–2019. We investigated the following climatic parameters and drought indices for each plot: temperature (T), precipitation (P), vapor pressure deficit (VPD), site water balance (SWB) and the ratio between actual evapotranspiration (ETa) and potential evapotranspiration (ETp), i.e., ETa/ETp, which we simplified to ETAP. Meteotest AG provided the data (version from May 06, 2021), in the form of interpolated weather measurements from the SwissMetNet stations at a resolution of 250 m × 250 m, as described by Remund et al. (2016). All parameters were available at a daily resolution before further aggregation, except SWB (described below), which was calculated from monthly data (Meteotest, 2020). All climatic parameters were averaged when aggregated, except P and ETp, which were summed. ETp was calculated with the method of Romanenko (1961). For our analyses, we aggregated T, P, and VPD to meteorological seasons (DJF, MAM, JJA, and SON, see Table 2), while we only considered the yearly values of the drought indices ETAP and SWB, as they are already pertinent for the vegetative period (April through August, see below). For the spatial analysis, we additionally included the yearly aggregated climatic parameters.
Vapor pressure deficit was calculated based on the daily mean temperatures and dewpoint temperatures with the R package plantecophys (Duursma, 2015). Maximum available water capacity of the soil (AWC) is an essential factor for calculating the drought indices. The drought index SWB is determined by the water balance calculated as P – ETp. The monthly values are summed after being reset to 0 during either in the first autumn month (September through December) with a positive water balance or in January of the new year if the water balance is negative for every autumn month. If the maximum storage capacity of the soil is exceeded, the monthly water balance is reduced accordingly (SWB cannot exceed AWC). The yearly SWB is the difference during the vegetative period (August minus March). ETAP depends on the soil water accumulation, which is set to 80% at the beginning of each period, rises with P and sinks with ETa. The amount of soil water stored in the soil can vary between 0 and AWC. If the soil has accumulated >60% of its capacity, then ETa and ETp are considered equal, and if <60% then ETAP decreases linearly with the amount of water stored in the soil until 0 is reached. The yearly ETAP is the average of the monthly values from April to August. Further details on the interpolation, aggregation and correction of these parameters can be found in Remund et al. (2016) and Meteotest (2020).
Data Analysis
We performed statistical analyses using the statistical software environments R version 4.0.3 (R Core Team, 2020) and SAS 9.4 (SAS Institute Inc., Cary, NC, United States). We first processed the data at the most detailed level, then averaged the data per plot, year and species for statistical analyses. Only trees with a complete time series, meaning they were not replaced during their measurement period, were kept for the analyses (n = 4–6 trees per plot). We performed Pearson correlations between the different LMTs, comparing the values per plot and sampling year to investigate their relationships, using the ‘cor.test’ function in the R package stats.
Temporal Analysis
We first tested for long-term temporal trends in LMTs, foliar nutrient and carbon concentrations, and climatic data (aggregated on the annual or seasonal level) using mixed linear models (MIXED procedure in SAS 9.4). Sampling year and plot were defined as random effects, while the number of years since the beginning of sampling (1995 for spruce, 1997 for beech) was included as a fixed effect. The model was applied separately to the beech and the spruce data sets (Jonard et al., 2009; Thimonier et al., 2012).
Second, we used linear mixed-effects models (LMM) in R to analyze the drivers of temporal changes in LMTs. We used the deviations (seasonal and yearly) of the climatic data from the long-term average values (1994–2019) to reduce the effects of spatial variation (Supplementary Tables 2, 3). We considered only the seasons starting from spring of the preceding year up to the current summer for beech and up to the current autumn for spruce, due to their different sampling periods. For the drought indices ETAP and SWB, we investigated only yearly values from the preceding and current year. We chose these timeframes and resolutions to consider the seasonal and yearly variations that are most relevant during foliage formation. Please see Table 2 for abbreviations of climate variables and drought indices and their modifications (i.e., prefixes and suffixes). In order to investigate which combination of variables (“drivers”) best explain the changes in each LMT, the LMMs were fitted using the ‘lme’ function in the R package nlme version 3.1-149 (Pinheiro et al., 2020), with the LMT as the dependent variable. Normal distribution and homoscedasticity were checked for all dependent and independent variables using Q–Q plots in the R package car (Fox and Weisberg, 2019). Due to some missing data, especially for TotDef, incomplete observations were removed, leaving 60 out of 76 and 44 out of 48 observations for beech and spruce, respectively. For both species, the earliest complete observations were from 1999. The elevation, foliar nutrient and carbon concentrations, fruiting intensity, TotDef, climatic variables and drought indices were used as fixed effects, while plot was added as a random effect. All fixed effects were scaled (i.e., mean = 0, SD = 1) to improve interpretation and comparability, except fruiting intensity because it was a categorical variable. Although elevation did not change over time, we included it in the temporal analysis, as our spatial analysis and past research (e.g., Midolo et al., 2019) both indicated that elevation affects LMTs in a significant way.
Third, we performed the following model selection to reduce the number of variables and identify the best LMMs. We used the ‘StepAIC’ function from the R package MASS (Venables and Ripley, 2002) to perform a stepwise model selection using the Akaike Information Criteria (AIC) with the stepwise search direction = ‘both.’ This function compares the models by adding and removing independent variables from the models, thereby selecting the model that explains the greatest amount of variation using the fewest possible independent variables (Burnham and Anderson, 2004). This pre-selection decreased the number of variables considerably, but not enough to avoid overfitting. New LMMs were built using the pre-selection from the StepAIC function. We then applied the ‘dredge’ function from the R package MuMIn version 1.43.17 (Barton, 2020), limiting the best-fit models to a maximum of five fixed effects. This number of variables meets the suggestions by Harrell (2015) of having at least 10 observations per covariate. We did not use the ‘dredge’ function from the beginning because there was a limit of 31 fixed effects for running the function, which we surpassed. In the case of spruce, the ‘dredge’ output resulted in multiple possible best-fit models that were not significantly different. We thus used the model averaging function, from the MuMIn package, to include the different variables (more than the set limit of five) present in the various non-significantly different best-fit models. We considered the ‘full’ averaging option of the MuMIn package, which uses a shrinkage estimator, therefore penalizing and decreasing the estimates and the significance of the variables present only in some of the comparable models.
Fourth, we calculated the variance inflation factor (VIF) with the car package to ensure that there were no remaining collinearity problems with the variables present in our best models. All VIFs were <3 in all our final models, indicating no concerning collinearity issues. To assess the goodness of the fit, we calculated the marginal R2 (mR2), indicating the variance explained by the fixed effects, and the conditional R2 (cR2), indicating the variance explained by both random and fixed effects, with the ‘r.squaredGLMM’ function from the MuMIn package. These coefficients of determination are explicitly designed to help interpret mixed-effects models (Nakagawa et al., 2017). ‘r.squaredGLMM’ was used only on the best model for each LMT from the ‘dredge’ output, as it could not compute the marginal or conditional R2 from the averaged models.
Spatial Analysis
We calculated the average value per plot of each LMT using only the sampling years common to all plots, i.e., 2013, 2015, 2017, and 2019, since LWF monitoring activities started in 2012 only in plot LAE (for plot codes, see Table 1). Then, we built univariate linear regressions using the average LMT value per plot as a dependent variable and the following scaled explanatory variables. Plot variables: (i) Elevation and stand age. (ii) Soil physico-chemical properties (beech plots only): C/N ratio of the topsoil (0–10 cm); pH of the topsoil (0–10 cm); total, organic and inorganic phosphorus in the top soil (0–10 cm); and base saturation (0–80 cm) (data as in Salehi et al., 2020). (iii) Climatic variables and drought indices: long-term averages (1994–2019) of P, T, VPD, ETAP, and SWB, aggregated at the annual or seasonal level (Supplementary Tables 2, 3). (iv) Tree variables: tree circumference, foliar nutrient and carbon concentrations, fruiting intensity and TotDef, averaged for the same years as the LMT.
Results
Observed Leaf Morphological Trait Variations and Correlations
We observed strong year-to-year variation in all selected LMTs in the study plots (Figure 2). Across all 11 plots, however, the LMTs of beech and spruce were rather coherent over time, with the plots tending to keep their particular rank relative to other plots throughout the monitoring period. For example, LMA values were (among) the highest in the ISO beech plot over the period 1997–2019, while they were consistently lower in the SCH plot (Figure 2C). In plot LAE, DM100, and LA were among the highest for beech (Figures 2A,B), and needles were distinctly longer than in any of the other four spruce plots (Figure 2E). However, depending on plots and years, we also observed notable differences in LMT variation, particularly for the ISO and CHI plots located south of the Alps, which occasionally showed the opposite response compared to other plots.
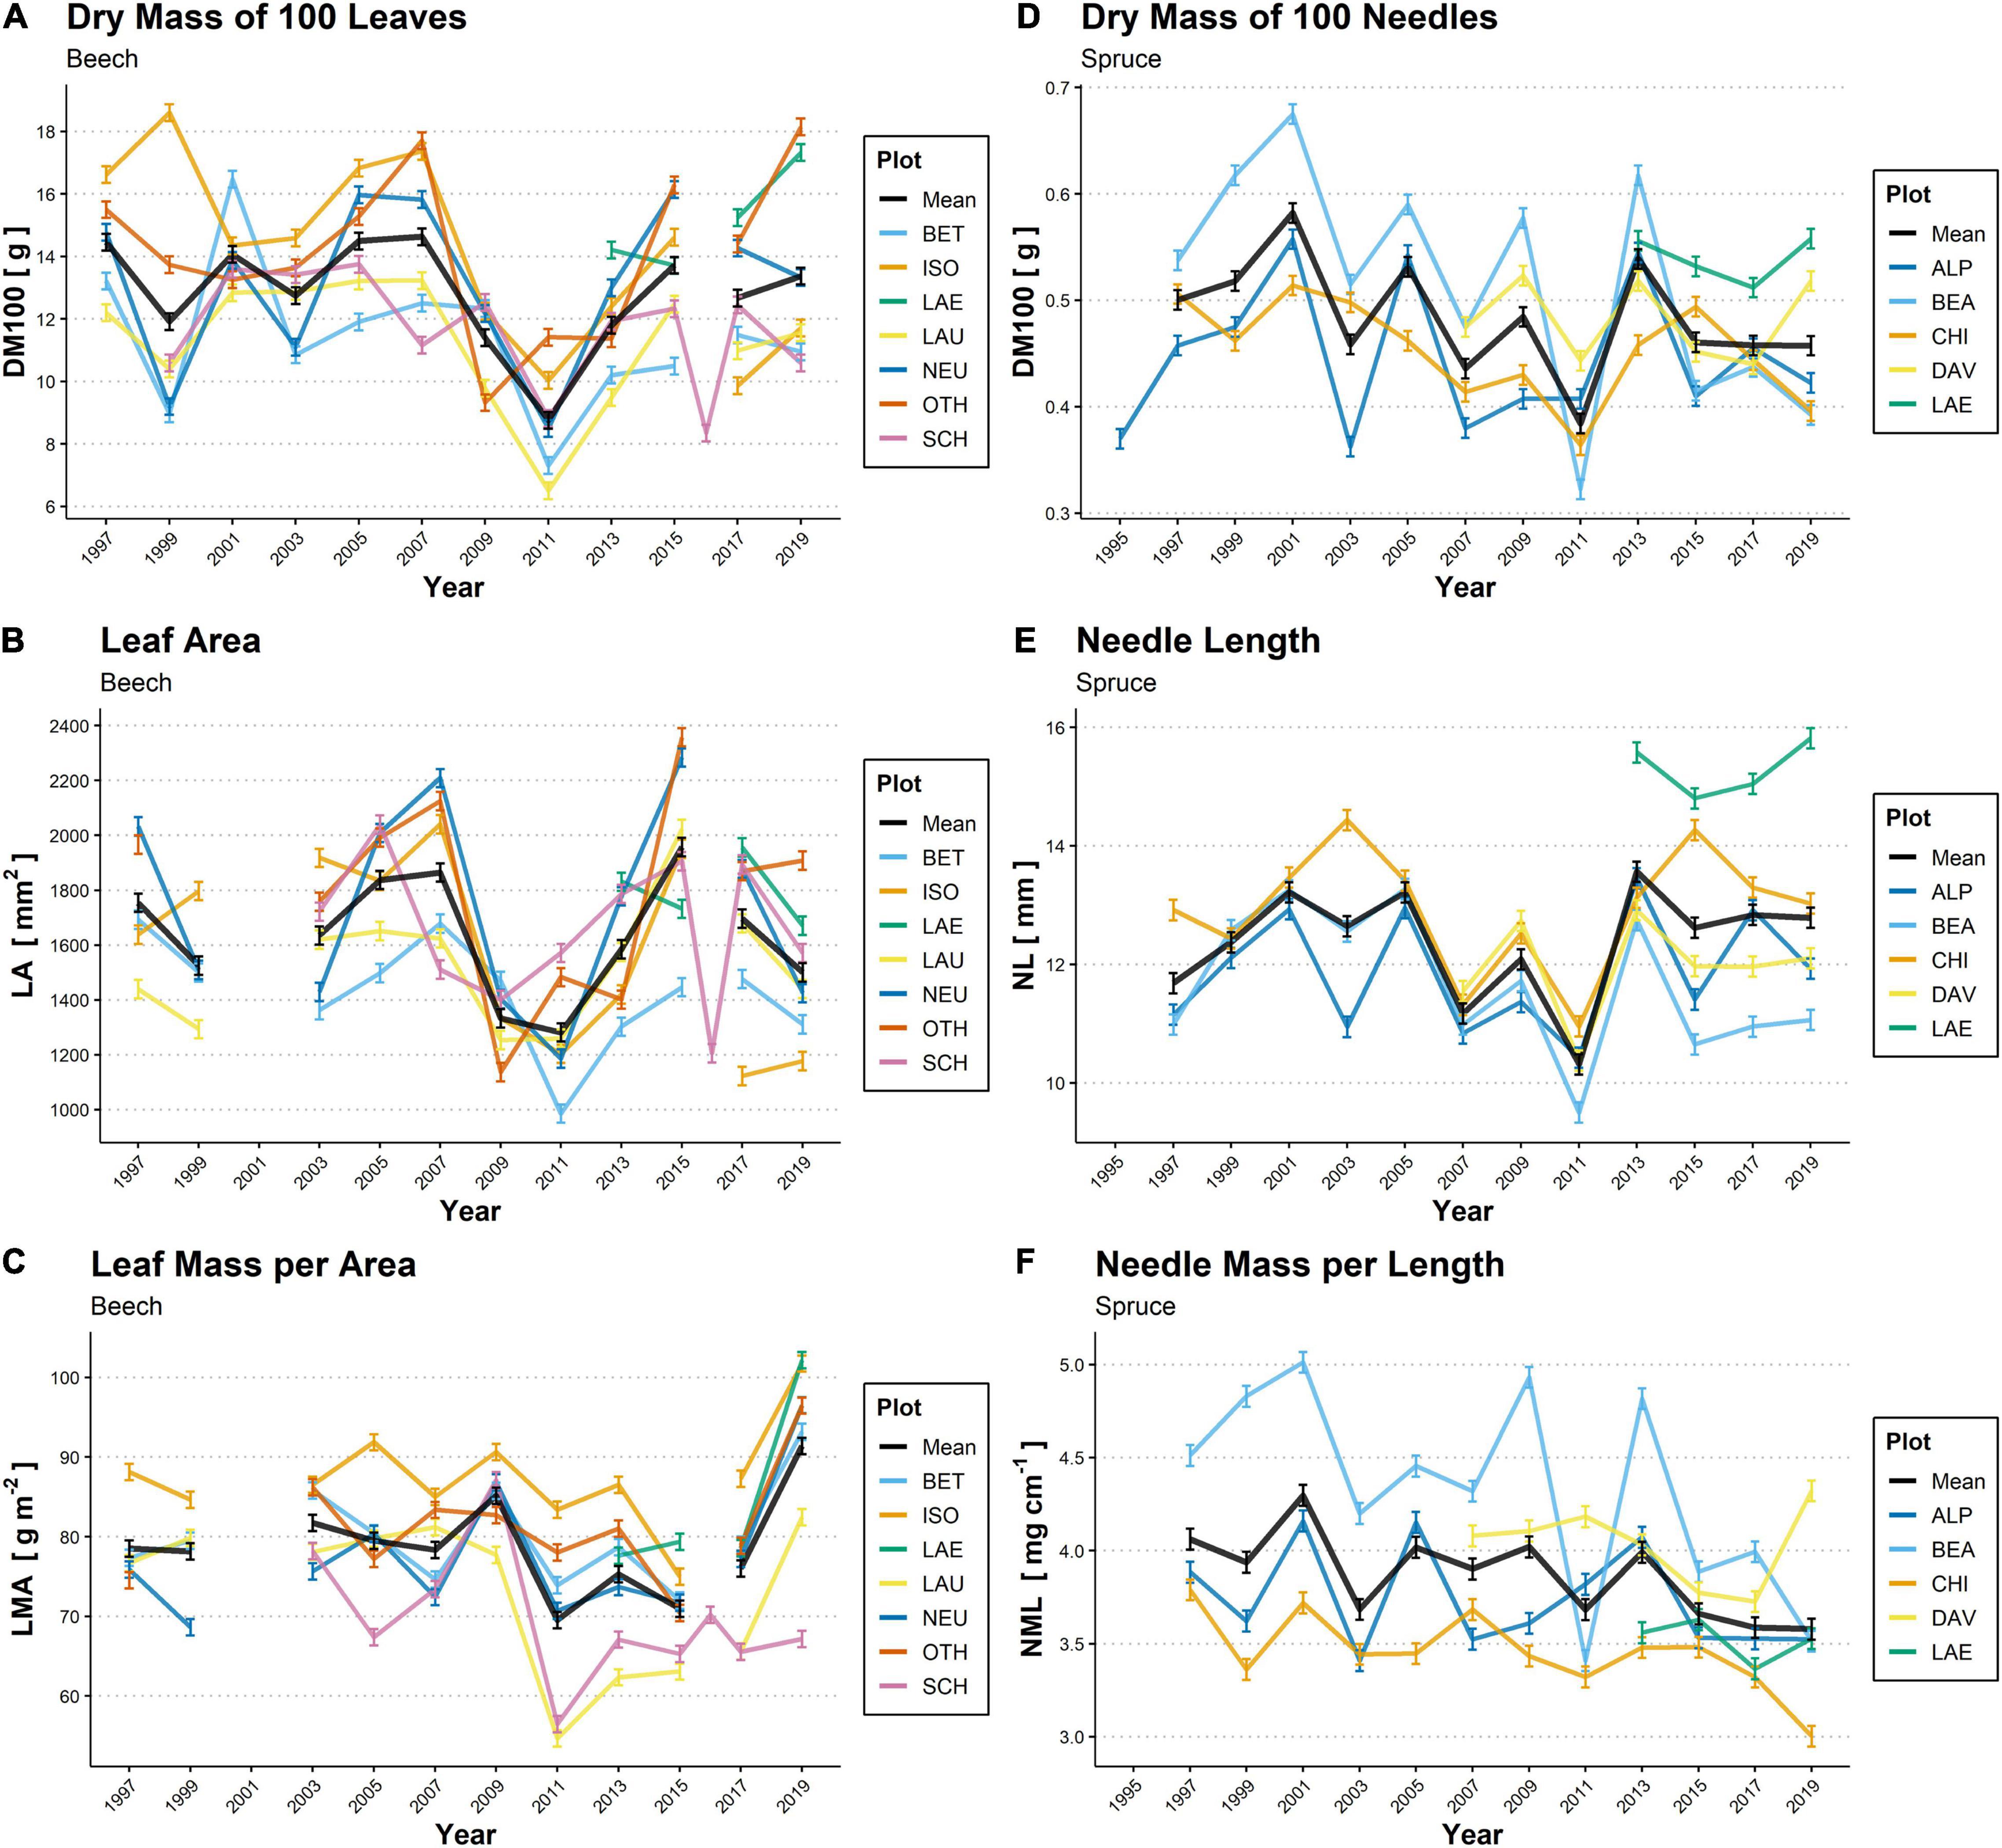
Figure 2. Biennial temporal variations in the dry mass of 100 leaves (DM100; A,D), leaf area (LA; B) and needle length (NL; E), leaf mass per area (LMA; C) and needle mass per length (NML; F) of beech leaves (A–C; 1997–2019) and spruce needles (D–F; 1995–2019) in 11 plots across Switzerland. The colored lines denote individual plots, while the solid black line indicates the mean from all plots. For beech, no samples were available for LA measurement in 2001, and exceptional values were measured in 2016 in SCH. For spruce, continuous observations in DAV and LAE first started in 2007 and 2013, respectively. For plot codes see Table 1. Mean values ± SE are shown (n = 4–6).
Mean annual DM100 in beech (averaged per year over all plots) varied from 8.7 to 14.7 g, and mean LA ranged from 1,280 to 1,960 mm2. We found lower values of DM100 and LA (high correlation between these two variables; Table 3) for all beech plots during the period between 2009 to 2013, particularly in 2011 (Figures 2A,B). Mean LMA varied between 69 and 92 g m–2, showed particularly high variation among plots in the year 2011 when SCH and LAU reached markedly low values, and was highest for all beech plots except for SCH in 2019 (Figure 2C). In spruce, mean DM100 followed a zig-zag shape over the monitoring period, with particularly low values in 2003 and 2011 (lowest value: 0.38 g) and peaks in 2001, 2005, and 2013 (highest value: 0.58 g; Figure 2D). Mean NL, which co-varied with DM100 (Table 3), showed a similar pattern (lowest value: 10.3 mm in 2011; highest value: 13.6 mm in 2013; Figure 2E). Mean NML values ranged from 3.6 to 4.3 mg cm–1 (Figure 2F).
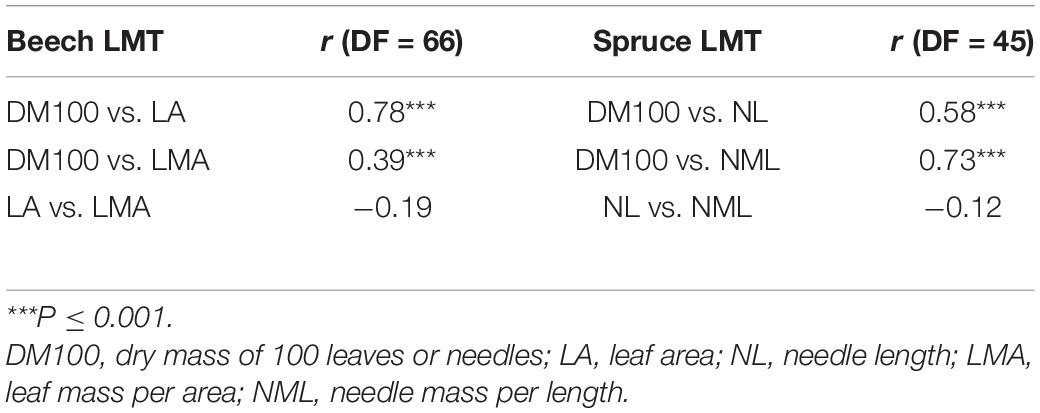
Table 3. Pearson correlations (r, correlation coefficient; DF, degrees of freedom) between leaf morphological traits (LMTs) averaged over plot and year, for beech and for spruce.
Pearson correlations between different LMTs indicated that DM100 and LA were significantly correlated (r = 0.78, P ≤ 0.001), as were DM100 and NL (r = 0.58, P ≤ 0.001; Table 3). DM100 was also significantly correlated with LMA (r = 0.39, P ≤ 0.001) and with NML (r = 0.73, P ≤ 0.001), while LA and NL showed lower and non-significant correlations with LMA and NML, respectively (Table 3).
Temporal Drivers of Leaf Morphological Traits (1995–2019)
Of all the LMTs considered for the two species, NML of spruce was the only trait that showed a statistically significant long-term trend, indicated by a decrease over the entire observation period (mean -0.02 ± 0.01 mg cm–1 per year, P ≤ 0.01; Figure 2F). Among the foliar nutrients, only N concentrations in beech leaves showed a significant linear trend, with an average decrease of −0.19 ± 0.03 mg g–1 per year over the period 1997–2019 (P ≤ 0.001). Significant long-term trends were also observed among the climatic variables. We observed a decrease in annual precipitation (−10.5 ± 4.7 mm per year, P ≤ 0.05) for the beech plots over the period 1994–2019. The decrease in precipitation was mostly observable for the beech plots situated on the Swiss Plateau (not shown). Beech plots also showed a marginal long-term increase in annual, summer and autumn temperatures and summer VPD, as well as a marginal decrease in annual SWB (P ≤ 0.10). For spruce plots, summer temperature increased significantly (+0.05 ± 0.03°C per year, P ≤ 0.05) over the same period, while only an increasing trend was observed in annual temperature and in spring and summer VPD (P ≤ 0.10).
The outcome of our LMM selection for each LMT for beech and spruce is presented in Table 4. These LMMs indicate which combination of five variables, or more in the case of averaged models (only spruce), explained most of the LMT variation during their respective observation periods. For beech, DM100 and LA both increased with higher temperatures in autumn of the preceding year (dpT_SON, both P ≤ 0.001) and with higher foliar N concentrations (P ≤ 0.01 and P ≤ 0.001, respectively), and decreased with elevation (P ≤ 0.05 and P ≤ 0.01, respectively). DM100 also decreased with higher crown defoliation (TotDef, P ≤ 0.001) and fruiting intensity (seeds0 = reference class, seeds1 P ≤ 0.01, seeds2 P ≤ 0.001), while LA also decreased with higher foliar Ca and P concentrations (all P ≤ 0.001). LMA increased with higher VPD in the preceding summer (dpVPD_JJA, P ≤ 0.001) and higher fruiting intensity (seeds0 = reference class, seeds1 P ≤ 0.05, seeds2 P ≤ 0.01) and decreased with higher foliar Ca and P concentrations and higher winter temperature (all P ≤ 0.001). For beech LMMs, mR2 values were more similar to cR2 values, indicating that the model already performed quite well based only on the fixed effects, while spruce LMMs improved more noticeably when the random effect of plot was included. For spruce, both DM100 and NL decreased with higher spring VPD (dVPD_MAM, P ≤ 0.001). DM100 also decreased slightly with dETAP of the current year and autumn precipitation (dP_SON, P ≤ 0.01). NL decreased with higher spring precipitation (dP_MAM, P ≤ 0.001) and high autumn temperature (dT_SON, P ≤ 0.01). NML increased with high foliar P concentration (P ≤ 0.001). Graphs depicting the predicted ∼ measured values are given in the Supplementary Material to illustrate the fit (Supplementary Figure 1).
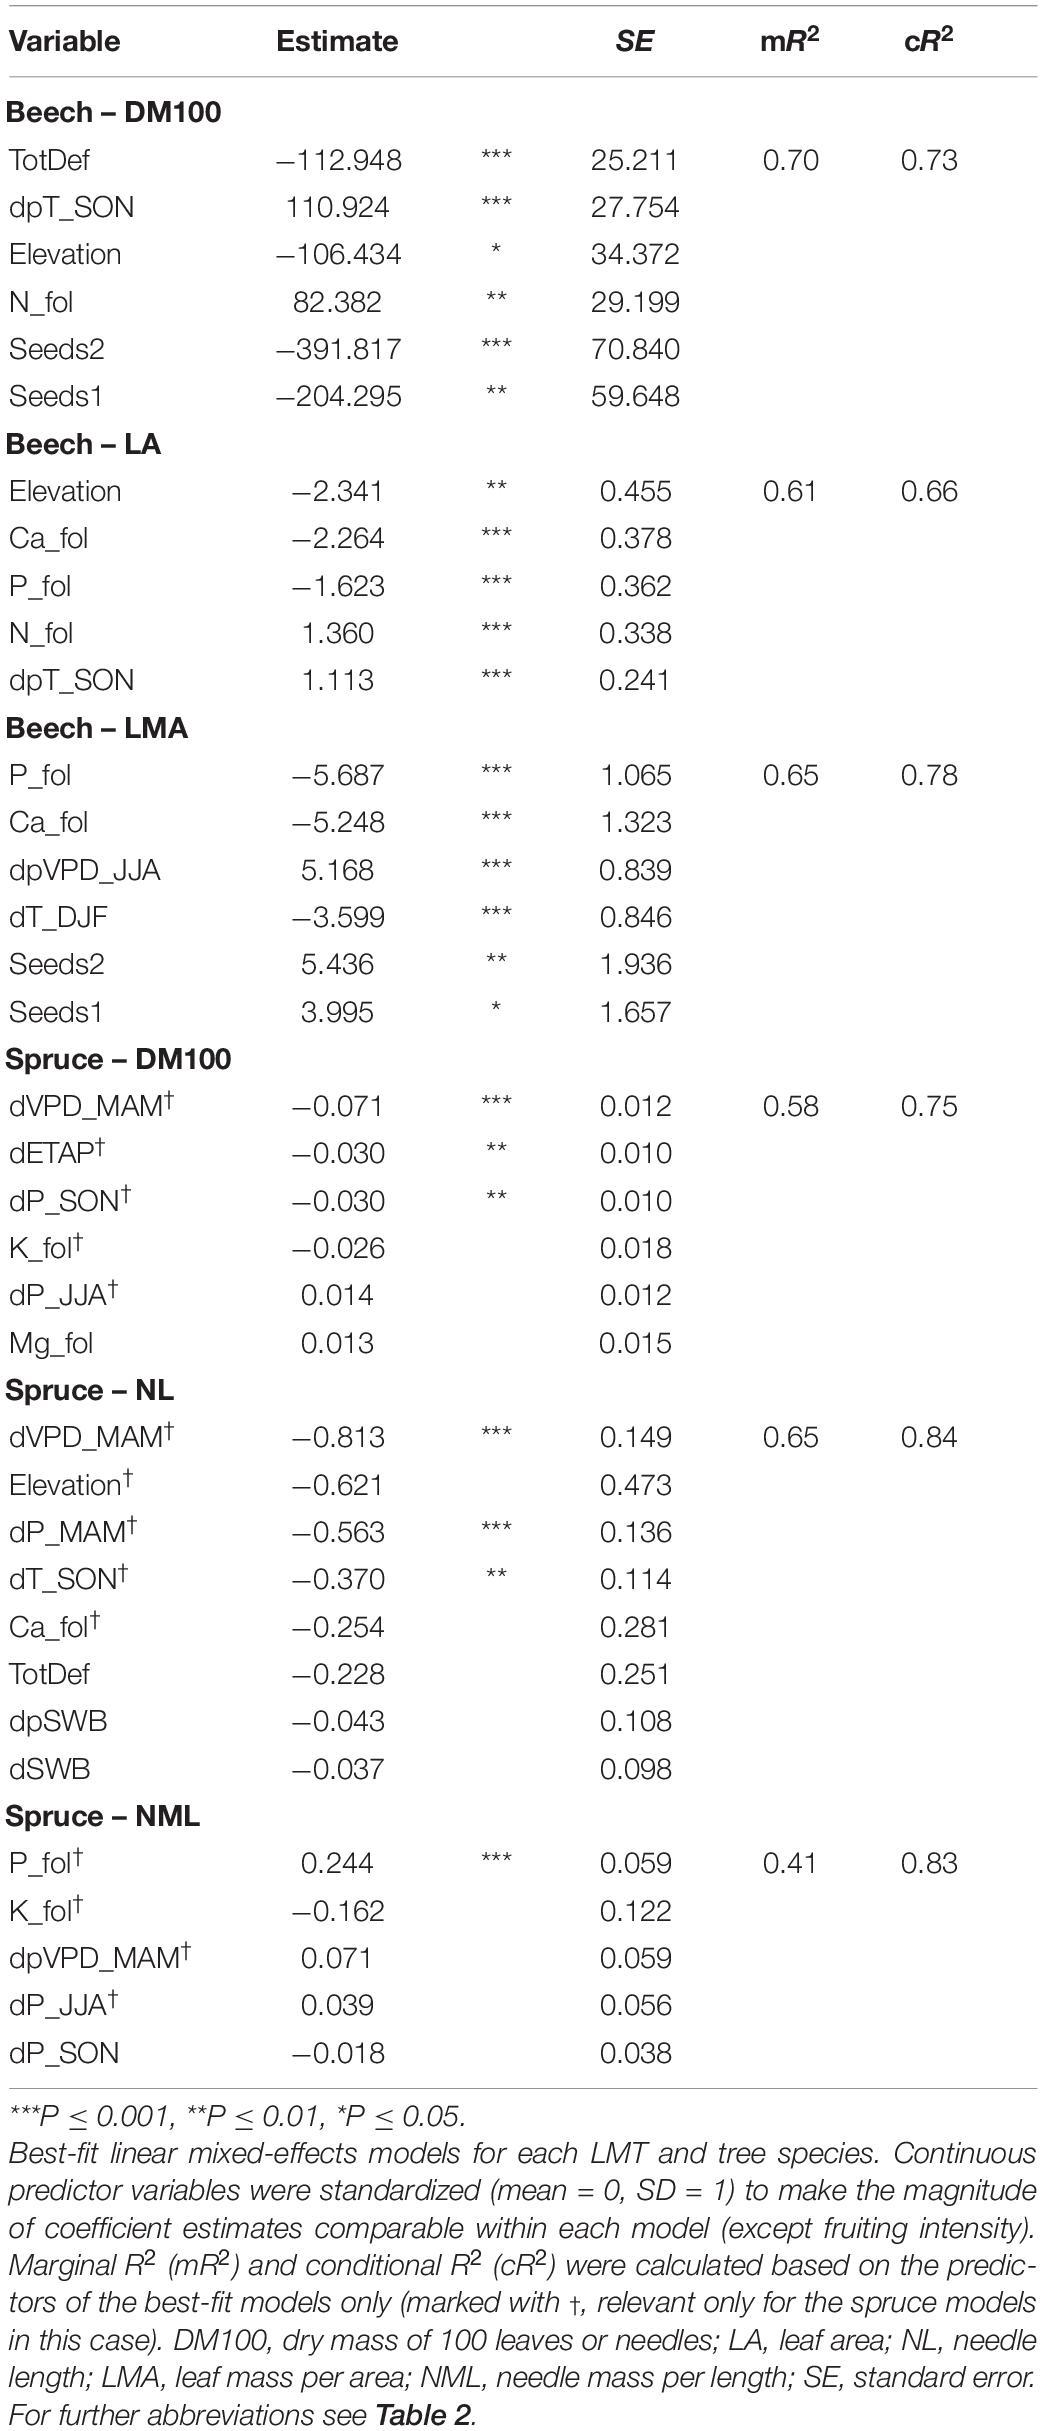
Table 4. Temporal drivers of leaf morphological trait (LMT) variation.
Spatial Drivers of Leaf Morphological Traits
In beech plots, the univariate linear regression showed a LA decrease with increasing elevation (Figure 3A and Table 5). A similar but marginal relationship between DM100 and elevation was also apparent (R2 = 0.50, P = 0.076, not shown). Both LA and DM100 increased with increasing long-term average spring and summer temperatures and VPD (ltT_MAM, ltT_JJA, ltVPD_MAM, and ltVPD_JJA; Figures 3B,C and Table 5). LA also increased significantly with increasing autumn temperature (ltT_SON; Table 5), but decreased with higher autumn VPD (ltVPD_SON, Table 5). Lastly, LMA was positively related to foliar C concentration (Table 5).
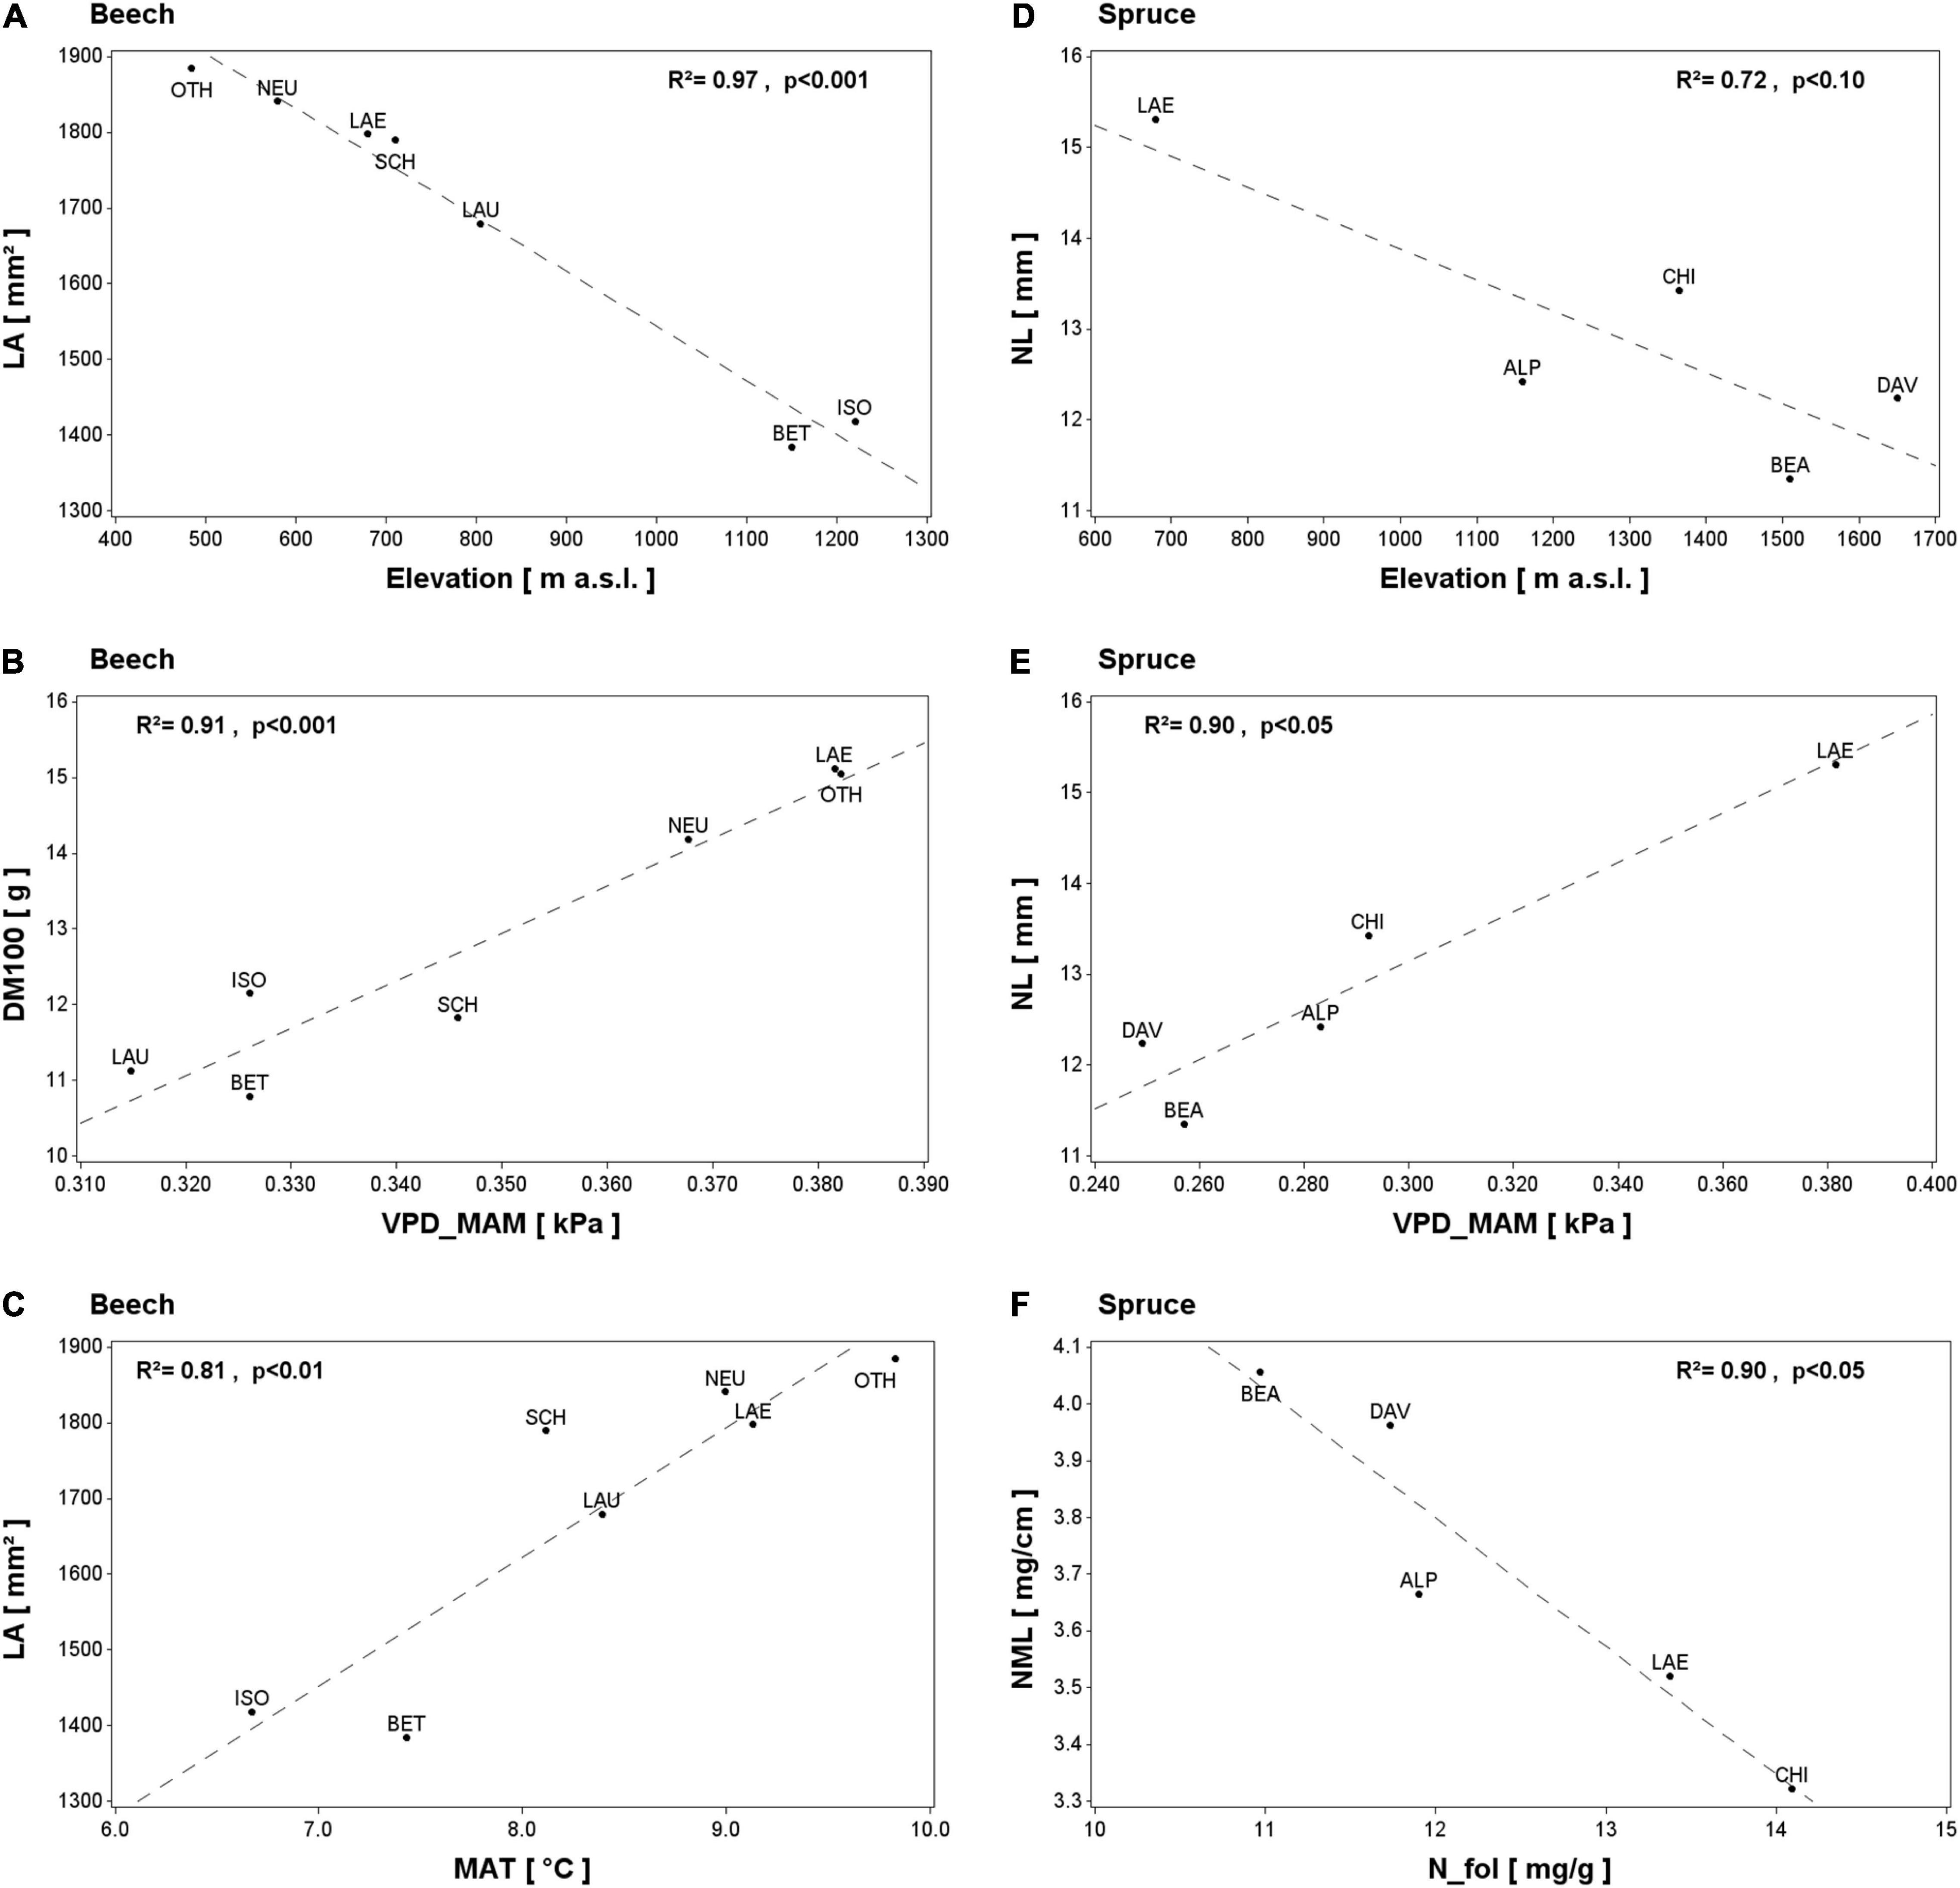
Figure 3. Selected spatial relationships between leaf morphological traits in beech (A–C) and spruce (D–F) and independent variables: elevation (A,D) and long-term averages (1994–2019) of spring vapor pressure deficit (B,E), mean annual temperature (C) and foliar N concentration (F). The coefficient of determination (R2) and the P-value of the linear regressions are shown. Selection was based on species differences, results of temporal LMT variations, and the significance of the relationship. For abbreviations see Table 2.
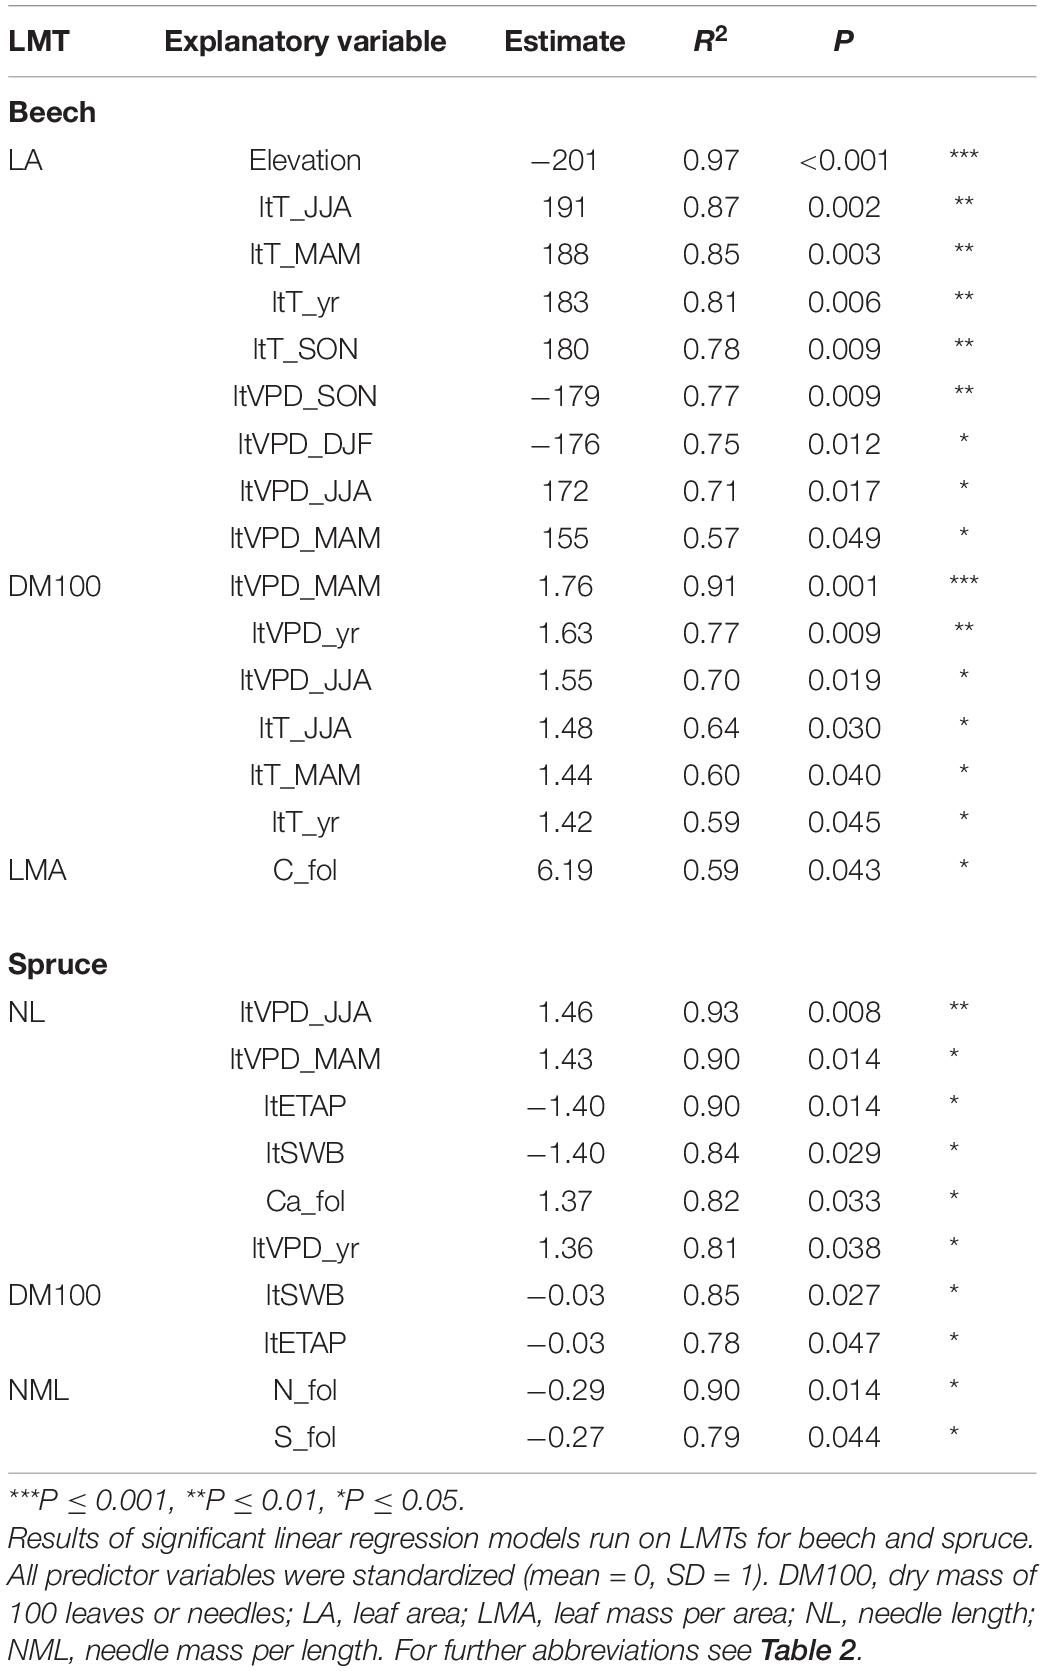
Table 5. Spatial drivers of leaf morphological trait (LMT) variation.
In spruce, NL tended to decrease with elevation (Figure 3D) and to increase with summer temperature (ltT_JJA, R2 = 0.71, P = 0.072, not shown). NL also increased significantly with increasing spring and summer VPD (ltVPD_MAM, Figure 3E; ltVPD_JJA, Table 5). Further, both NL and DM100 increased with decreasing ltETAP and ltSWB (Table 5), while NML decreased with increasing foliar N and S concentrations (Figure 3F and Table 5).
Discussion
Here, we made use of a unique long-term foliage collection and data set within the LWF program, covering several beech and spruce plots in Switzerland in biennial resolution for over two decades (Figure 1 and Table 1). Generally, we found strong temporal variability in LMTs (Figure 2), which was mostly coherent across the plots for both tree species. DM100 of both species was highly correlated with LA or LMA for beech and NL or NML for spruce. However, there was no significant correlation between LA and LMA or between NL and NML (Table 3). A similar observation was found by Hager and Sterba (1985), where DM100 could be used to predict LMA in spruce. LMA is commonly known as a key parameter of the leaf economic spectrum, reflecting the photosynthetic capacity of plants (Wright et al., 2004; Poorter et al., 2009). In this regard, our results suggest that LMA (or NML), and thus the trees’ acclimation potential to gain C, is more driven by changes in leaf thickness and structural density (i.e., DM100) than by those in leaf surface area (i.e., LA and NL).
Long-Term Trends in Spruce but not in Beech Leaf Morphological Traits
NML of spruce was the only LMT with a significant decreasing trend in our study (Figure 2F). The small long-term trends of increasing temperature and VPD detected in our data set may have played a role in the decreasing trend of NML. This may seem in contrast with the findings of Gebauer et al. (2019), who reported that mild drought led to shorter needles but did not significantly affect needle dry mass, resulting in higher NML. However, as temperature is a limiting factor at higher elevations and water availability in spring is high in all of our spruce plots, the positive effect of warmer conditions on NL might override potentially negative drought effects, making a decrease in NML plausible. Further, the decreasing trend of foliar N concentrations over 20–25 years in our plots (Thimonier et al., 2012), possibly related to the observed decreasing trend in atmospheric deposition (Thimonier et al., 2019), may have contributed to the decreasing trend in NML, as N availability is strongly correlated with carbon assimilation rates and thus biomass production per LA (Reich et al., 1999). Further investigations are needed to determine whether the decreasing trend in spruce NML reflects only a species-specific response to environmental changes or already an adaptation.
In contrast, the absence of long-term trends in beech LMTs may be due to generally strong year-to-year variations in both the LMTs (Figure 2) and the predictive variables (e.g., Supplementary Figure 2). The climatic changes that occurred during the studied period might not have been strong enough to induce a long-term trend in LMTs, or the effects of individual events (e.g., mast seeding), climatic factors (VPD, T), and plot properties (e.g., SWB and nutrient availability) on LMTs may have canceled each other out. In contrast to our results, Braun et al. (2020) found an increase in beech leaf dry mass over 30 years (1984–2015) in 74 plots in Switzerland but no significant climatic predictors for this trait, showing that more data is needed to build a more consistent picture of beech LMT responses over time.
Mast Year and Crown Defoliation Effects on Leaf Morphological Traits
Mast years, indicated by fruiting intensity in our study, had one of the most important effects on beech LMTs, as demonstrated by our temporal analysis (predictor variable ‘seeds1’ and ‘seeds2’ in Table 4), affecting DM100 negatively and LMA positively. The mast-year effects on beech LMTs were also indicated by the low mean DM100 and LA in the period between 2009 and 2013 (Figures 2A,B). During this period, strong mast years for beech trees occurred across Central Europe (Müller-Haubold et al., 2013; Nussbaumer et al., 2020), which likely negatively affected LA and DM100 (Müller-Haubold et al., 2015; Braun et al., 2020). The strong influence of fruiting intensity on beech LMTs is further confirmed by the anomaly in the plot OTH, where trees bore more beechnuts in 2009 and 2013 than in 2011 and in the other beech plots. Accordingly, in this plot, DM100 and LA were lower in 2009 and 2013 than in 2011 (Figures 2A,B). The same holds for the plot SCH in 2007, where there were significantly more beechnuts on the sampled trees than in the other beech plots, and the singular measurement in 2016, which was a strong fructification year for SCH (Nussbaumer et al., 2020). For spruce, 2011 was also a mast year according to the Sanasilva assessments and was characterized by the lowest DM100 and NL of all plots. However, due to the lack of high-resolution data on seeding intensity for spruce, it remains unclear whether this was driven by mast-year effects or by the particularly hot and dry spring, which was also reported by Swidrak et al. (2013). The negative effects of mast years on beech LMTs and potentially on spruce LMTs may be explained by tradeoffs in resource allocation during high fructification (Nussbaumer et al., 2021), which lead to reduced leaf and radial growth.
Our temporal analysis also indicates a negative effect of crown defoliation (TotDef) on DM100 of beech (Table 4). The negative relationship between TotDef and DM100 is in line with the findings of Gottardini et al. (2020), who additionally reported a decrease in leaf volume and photosynthetic efficiency with increasing defoliation. Thus, a thinned-out crown could indicate leaf loss due to drought-induced embolism or parasites, but at the same time allows more irradiance to reach inside the canopy, which has been shown to influence LMTs (e.g., Poorter et al., 2009). Given that TotDef is determined by multiple factors, it remains difficult to discern whether TotDef is really a driver of LMTs or simply reflects the health and leaf condition of the trees (Gottardini et al., 2020).
Common and Different Responses of Leaf Morphological Traits to Climatic Effects in Beech and Spruce
Our temporal analyses revealed negative effects of elevation on DM100 and LA in beech and on NL in spruce in both our spatial and temporal models (Figures 2, 3A,D and Tables 4, 5), which is consistent with the results of previous studies, e.g., Bresson et al. (2011) for beech and Baig and Tranquillini (1976) for spruce. Different elevations imply different abiotic and biotic environmental conditions, which are strongly related to temperature and additional factors, such as radiation (Read et al., 2014; Midolo et al., 2019). This is most obvious for plot LAE (located at 680 m a.s.l.), which displayed consistently longer and heavier needles than the rest of the spruce plots located in the Alps at higher elevations (Table 1), which is in accordance with the negative effect of elevation on needle size (Gottardini et al., 2016). Therefore, elevation likely represents an important baseline effect on LMTs at the plot level.
Interestingly, beech and spruce LMTs were differently driven by preceding- and current-year climatic effects (Table 4). Beech DM100 and LA both increased with autumn temperatures of the preceding year. This is in line with the study of Nussbaumer et al. (2021), who found that high temperatures in September and October of the preceding year influenced the annual leaf production of beech. Nussbaumer et al. (2021) used the total leaf mass in litterfall in their model, and therefore they could not determine whether enhanced leaf biomass resulted from the production of more leaves or from an increase in dry mass of individual leaves. Our temporal model suggests the latter. Further, our temporal model indicates a positive relationship between LMA and VPD in the preceding summer (Table 4). This relationship is partially related to the exceptional increase in LMA in all plots in 2019, mostly as a result of reduced LA (Figures 2B,C). This observation can be explained by the exceptionally hot and dry summer in the preceding year, i.e., 2018 (e.g., Schuldt et al., 2020), as extended droughts or drier sites can increase leaf thickness (Bussotti, 1995) and reduce LA (Grossoni et al., 1998). It should be noted that many of the leaf samples in 2019 were damaged and had perforation holes, which might also skew our findings toward a higher LMA. The effects of the summer and autumn climate (i.e., VPD, T) in the preceding year confirm the existence of legacy effects on leaf primordia buds that influence the development of beech leaves in the current year (e.g., Nussbaumer et al., 2021). The reason for the negative effect of winter temperatures on LMA in our temporal analysis remains uncertain, but might be related to temperature-driven shifts in the timing of leaf phenology (Clark et al., 2014).
In comparison to beech, LMTs of spruce were significantly influenced by climatic factors of the current year (Table 4), with the strongest negative response of DM100 and NL being to higher-than-average spring VPD. This goes along with the observation that the zig-zag pattern of spruce mean DM100 and NL (Figures 2D,E) corresponded surprisingly well to the inverse pattern of spring VPD (Supplementary Figure 3). Our finding is in line with other studies in which a negative impact of drought on NL was observed (e.g., Gebauer et al., 2019) or the importance of spring conditions during needle elongation was reported (Ununger and Kang, 1988). Further, our temporal models show a negative effect of spring precipitation on NL (Table 4). High precipitation in spring can represent high snowfall, which affects the site conditions and therefore the growth of the needles (e.g., Cunningham et al., 2006). Additionally, more precipitation usually means more cloud cover and less radiation. This could also negatively impact needle development, as insolation of the canopy has been shown to affect needle structure more than water availability (Gebauer et al., 2019), with sun-exposed needles being generally larger and thicker (Kubínová et al., 2018). Interestingly, the negative effect of spring precipitation goes along with the negative effects of ETAP and SWB on spruce DM100 and NL, which were highlighted in both the spatial and the temporal model (Tables 4, 5). Our spruce plots are characterized by high soil water availability and usually high ETAP (ltETAP in LAE = 0.88; other plots = 0.97–1.00; Supplementary Table 3) and high SWB (ltSWB LAE = −54.5 mm; other plots = −5.9–0.5; Supplementary Table 3). ETAP < 0.8 was only found at LAE in a few years and at CHI in 2003, and SWB < −150 mm occurred only at LAE in 2015 and 2018, indicating a small number of drought years across the spruce plots. In contrast, we cannot explain the negative effect of autumn temperatures and precipitation on NL (Table 4), as the sampling was conducted at the onset of autumn and thus the needles did not completely experience autumn conditions of the current year. Thus, these effects are probably due to a spurious correlation.
In addition, our spatial analysis of spruce plots showed positive effects of long-term spring and summer VPD on NL (Figure 3 and Table 5). Likewise, a positive correlation was found across our beech plots between spring or summer VPD and LA or DM100 (Figure 3 and Table 5). These results are counter-intuitive, since high-VPD-induced drought is expected to reduce needle or leaf growth, as also indicated by our temporal model for NL in spruce (Table 4). These results might be explained by the positive correlation between VPD with T, which suggests that the VPD gradient might actually reflect a temperature gradient and that positive effects of higher temperature were dominant. On the other hand, the positive spatial correlation between VPD and NL, LA or DM100 could be due to negative effects on needle or leaf growth of the generally low spring VPD (e.g., for spruce: LAE = 0.38 kPa; other plots = 0.25–0.29 kPa; Supplementary Table 3). The opposite effect in our temporal analysis for spruce may therefore highlight the increasing importance of VPD for forest ecosystems in Switzerland (Trotsiuk et al., 2021), where needle length is reduced in years with particularly high spring VPD (i.e., significantly above the long-term average values, Supplementary Table 3).
Foliar Nutrient Effects on Leaf Morphological Traits
Our temporal models for beech LMTs indicate a positive effect of foliar N concentration on DM100 and LA and a negative effect of foliar Ca and P concentrations on LA and LMA (Table 4). N is the most important and growth-limiting nutrient in beech trees in temperate forests (Yang et al., 2020), and the positive effect of foliar N concentration on DM100 and LA is in line with the knowledge that foliar N concentrations increase linearly with the photosynthetic capacity per unit leaf mass (Chapin and Eviner, 2004). The interpretation of the negative relationship of foliar Ca and P with LA and LMA is less straightforward. It could just be a concentration effect resulting from smaller leaves, as in Braun et al. (2020), since both Ca and P concentrations correlated negatively with DM100 in our plots, whereas N concentration did not (not shown). Alternatively, the opposite patterns in foliar N vs. Ca and P concentrations may be related to the levels of atmospheric N deposition in our plots, which are still high despite a general downward trend over time (Thimonier et al., 2019). Both experimental addition of N and elevated N deposition can lead to higher foliar N concentrations and reduced P, K, Mg, and Ca concentrations (e.g., Flückiger and Braun, 1999; Waldner et al., 2015). Foliar nutrient concentrations integrate climate and site factors, as well as plant ecological strategies (e.g., Sardans and Peñuelas, 2013). Thus they are potentially good indicators of acclimation processes and could influence or explain variation in LMTs, but complex allocation patterns, dynamics and co-variations make interpretation challenging. Moreover, in our spatial analysis LMA was the only beech LMT that was significantly correlated with a foliar concentration (Table 5). LMA increased with increasing foliar C concentration, which may indicate a greater presence of lignified sclerenchymatous tissue (de la Riva et al., 2016).
In spruce, foliar P concentration had a positive effect on NML and was thus the only significant temporal driver of NML variation (Table 4). This could be related to the decreasing effects of N and S additions on foliar P, e.g., Nielssen and Wiklund (1992) and Clarholm and Rosengren-Brinck (1995), and would be in line with the negative relationship of foliar N and S concentration with NML in our spatial analysis (Table 5). However, it remains unclear whether this negative spatial relationship results from N and S being limiting, or if co-variation effects (e.g., elevation) are at play. The observed decrease in foliar N and S concentration with increasing NML (and also increasing elevation) can be interpreted similarly to the often reported negative relationship between foliar N and LMA, with thicker leaves containing more structural tissues relative to photosynthetically active and N-rich parenchyma (de la Riva et al., 2016).
Conclusion
The aim of our study was to investigate the temporal and spatial variations in LMTs of beech and spruce across Switzerland and to identify their main drivers. For beech LMTs, our temporal analysis revealed effects of mast years, crown defoliation, and legacy effects from VPD and temperature in summer and autumn of the preceding year, which would typically be neglected or difficult to determine with only spatial analyses. In contrast, spruce LMTs were marked by a decreasing trend in NML over the study period and were mainly driven by spring conditions of the current year, suggesting differences in the acclimation and adaptation potential of the two species. Further, we observed that temporal LMT models for both species were influenced by elevation and foliar nutrient concentrations, patterns that were confirmed by our spatial analyses. These sometimes contrasting effects on LMTs caused by the same driver (e.g., VPD) in the spatial and temporal analyses point to the need to investigate the reasons for certain LMT responses to climatic changes in more detail. We therefore encourage more research and long-term measurements of LMTs, as foliar samples can be collected, stored and measured without the need of sophisticated and costly technologies. The insights that can be acquired from these long-term analyses represent a valuable contribution to our understanding of acclimation strategies and vulnerability of different tree species, growing under different environmental conditions, in response to a rapidly changing climate.
Data Availability Statement
The raw data supporting the conclusions of this article will be made available by the authors, without undue reservation.
Author Contributions
JZ, MML, AT, and MCS designed the study. AT, PW, and MIS were responsible for the LWF foliar sampling survey. JZ performed the LMT measurements of archived material. JZ, MML, AT, SE, and KM performed the statistical analysis. JZ, MML, and AT drafted a first version of the manuscript, which was improved with the help of all authors.
Funding
This project was funded by the SNF Ambizione project “TreeCarbo” (No. 179978, granted to MML). The LWF measurements are mainly financed by WSL, with additional support from the Canton of St. Gallen and the City of Lausanne, with the kind permission of landowners.
Conflict of Interest
The authors declare that the research was conducted in the absence of any commercial or financial relationships that could be construed as a potential conflict of interest.
Publisher’s Note
All claims expressed in this article are solely those of the authors and do not necessarily represent those of their affiliated organizations, or those of the publisher, the editors and the reviewers. Any product that may be evaluated in this article, or claim that may be made by its manufacturer, is not guaranteed or endorsed by the publisher.
Acknowledgments
We would like to thank the tree climbers who collected the branches, the LWF field and laboratory technicians and temporary staff who processed the foliage samples, and the WSL Central Laboratory for chemical analyses, as well as Christian Hug and the Sanasilva team for completing the crown condition assessments. We are grateful to Jan Remund and Pascal Graf from Meteotest AG, Bern for preparing the meteorological data (with financial support from the Federal Office for the Environment FOEN) and providing support. We further thank Flurin Sutter, Peter Jakob, Simpal Kumar, and Volodymyr Trotsiuk for GIS and database support (all located at WSL), and Melissa Dawes for linguistic corrections.
Supplementary Material
The Supplementary Material for this article can be found online at: https://www.frontiersin.org/articles/10.3389/ffgc.2021.778351/full#supplementary-material
References
Baig, M. N., and Tranquillini, W. (1976). Studies on upper timberline: morphology and anatomy of Norway spruce (Picea abies) and stone pine (Pinus cembra) needles from various habitat conditions. Can. J. Bot. 54, 1622–1632.
Braun, S., Schindler, C., and Rihm, B. (2020). Foliar nutrient concentrations of European beech in Switzerland: relations with nitrogen deposition, ozone, climate and soil chemistry. Front. For. Glob. Change 3:33. doi: 10.3389/ffgc.2020.00033
Bréda, N., Huc, R., Granier, A., and Dreyer, E. (2006). Temperate forest trees and stands under severe drought: a review of ecophysiological responses, adaptation processes and long-term consequences. Ann. For. Sci. 63, 625–644. doi: 10.1051/forest:2006042
Bresson, C. C., Vitasse, Y., Kremer, A., and Delzon, S. (2011). To what extent is altitudinal variation of functional traits driven by genetic adaptation in European oak and beech? Tree Physiol. 31, 1164–1174. doi: 10.1093/treephys/tpr084
Burnham, K. P., and Anderson, D. R. (2004). Model Selection and Multimodel Inference. New York, NY: Springer New York.
Bussotti, F. (1995). Morpho-anatomical alterations in leaves collected from beech trees (Fagus sylvatica L.) in conditions of natural water stress. Environ. Exp. Bot. 35, 201–213. doi: 10.1016/0098-8472(94)00040-C
Bussotti, F., Prancrazi, M., Matteucci, G., and Gerosa, G. (2005). Leaf morphology and chemistry in Fagus sylvatica (beech) trees as affected by site factors and ozone: results from CONECOFOR permanent monitoring plots in Italy. Tree Physiol. 25, 211–219. doi: 10.1093/treephys/25.2.211
CH2018 (2018). CH2018 – Climate Scenarios for Switzerland: Technical Report. Zürich: National Centre for Climate Services.
Chapin, F. S., and Eviner, V. T. (2004). “Biogeochemistry of terrestrial net primary production,” in Treatise on geochemistry, eds H. D. Holland and K. K. Turekian (Amsterdam: Elsevier), 1–35.
Clarholm, M., and Rosengren-Brinck, U. (1995). Phosphorus and nitrogen fertilization of a Norway spruce forest – Effects on needle concentrations and acid phosphatase activity in the humus layer. Plant Soil 175, 239–249.
Clark, J. S., Salk, C., Melillo, J., and Mohan, J. (2014). Tree phenology responses to winter chilling, spring warming, at north and south range limits. Funct. Ecol. 28, 1344–1355. doi: 10.1111/1365-2435.12309
Closa, I., Irigoyen, J. J., and Goicoechea, N. (2010). Microclimatic conditions determined by stem density influence leaf anatomy and leaf physiology of beech (Fagus sylvatica L.) growing within stands that naturally regenerate from clear-cutting. Trees 24, 1029–1043. doi: 10.1007/s00468-010-0472-3
Cochard, H., Coste, S., Chanson, B., Guehl, J. M., and Nicolini, E. (2005). Hydraulic architecture correlates with bud organogenesis and primary shoot growth in beech (Fagus sylvatica). Tree Physiol. 25, 1545–1552. doi: 10.1093/treephys/25.12.1545
Cunningham, C., Zimmermann, N. E., Stoeckli, V., and Bugmann, H. (2006). Growth of Norway spruce (Picea abies L.) saplings in subalpine forests in Switzerland: does spring climate matter? For. Ecol. Manage. 228, 19–32. doi: 10.1016/j.foreco.2006.02.052
de la Riva, E. G., de Olmo, M., Poorter, H., Ubera, J. L., and Villar, R. (2016). Leaf mass per area (LMA) and its relationship with leaf structure and anatomy in 34 Mediterranean woody species along a water availability gradient. PLoS One 11:e0148788. doi: 10.1371/journal.pone.0148788
de Vries, W., de Vel, E., Reinds, G., Deelstra, H., Klap, J., Leeters, E., et al. (2003). Intensive monitoring of forest ecosystems in Europe. For. Ecol. Manage. 174, 77–95. doi: 10.1016/S0378-1127(02)00029-4
Dobbertin, M., Hug, C., Schwyzer, A., Borer, S., and Schmalz, H. (2016). Aufnahmeanleitung - Kronenansprachen auf den Sanasilva- und auf LWF-Flächen. Birmensdorf: Swiss Federal Institute for Forest, Snow and Landscape Research WSL.
Duursma, R. A. (2015). Plantecophys–An R package for analysing and modelling leaf gas exchange data. PLoS One 10:e0143346. doi: 10.1371/journal.pone.0143346
Eichhorn, J., Roskams, P., Potočić, N., Timmermann, V., Ferretti, M., Mues, V., et al. (2016). “Part IV: visual assessment of crown condition and damaging agents,” in Manual on methods and criteria for harmonized sampling, assessment, monitoring and analysis of the effects of air pollution on forests, ed. UNECE ICP Forests Programme Co-ordinating Centre (Eberswalde: Thünen Institute of Forest Ecosystems).
Fitter, A., and Hay, R. (2002). “Water,” in Environmental Physiology of Plants, eds A. Fitter and R. Hay (Amsterdam: Elsevier), 131–190.
Flückiger, W., and Braun, S. (1999). Nitrogen and its effect on growth, nutrient status and parasite attacks in beech and Norway spruce. Water Air Soil Pollut. 116, 99–110. doi: 10.1023/A:1005298609109
Fox, J., and Weisberg, S. (2019). An R Companion to Applied Regression. Thousand Oaks CA: Sage Publications.
Gebauer, R., Volarík, D., Urban, J., Børja, I., Nagy, N. E., Eldhuset, T. D., et al. (2019). Effects of mild drought on the morphology of sun and shade needles in 20-year-old Norway spruce trees. iForest 12, 27–34. doi: 10.3832/ifor2809-011
Gottardini, E., Cristofolini, F., Cristofori, A., Camin, F., Calderisi, M., and Ferretti, M. (2016). Consistent response of crown transparency, shoot growth and leaf traits on Norway spruce (Picea abies (L.) H. Karst.) trees along an elevation gradient in northern Italy. Ecol. Indic. 60, 1041–1044. doi: 10.1016/j.ecolind.2015.09.006
Gottardini, E., Cristofolini, F., Cristofori, A., Pollastrini, M., Camin, F., and Ferretti, M. (2020). A multi-proxy approach reveals common and species-specific features associated with tree defoliation in broadleaved species. For. Ecol. Manage. 467:118151. doi: 10.1016/j.foreco.2020.118151
Grossoni, P., Bussotti, F., Tani, C., Gravano, E., Antarelli, S., and Bottacci, A. (1998). Morpho-anatomical aterations in leaves of Fagus sylvatica L. and Quercus ilex L. in different environmental stress condition. Chemosphere 36, 919–924. doi: 10.1016/S0045-6535(97)10148-5
Hager, H., and Sterba, H. (1985). Specific leaf area and needle weight of Norway spruce (Picea abies) in stands of different densities. Can. J. For. Res. 15, 389–392. doi: 10.1139/x85-062
Halbritter, A. H., de Boeck, H. J., Eycott, A. E., Reinsch, S., Robinson, D. A., Vicca, S., et al. (2020). The handbook for standardized field and laboratory measurements in terrestrial climate change experiments and observational studies (ClimEx). Methods Ecol. Evol. 11, 22–37. doi: 10.1111/2041-210X.13331
IPCC (2015). Climate Change 2014: Synthesis Report. Contribution of Working Groups I, II and III to the Fifth Assessment Report of the Intergovernmental Panel on Climate Change. Geneva: IPCC.
Jonard, M., André, F., Dambrine, E., Ponette, Q., and Ulrich, E. (2009). Temporal trends in the foliar nutritional status of the French, Walloon and Luxembourg broad-leaved plots of forest monitoring. Ann. For. Sci. 66:412. doi: 10.1051/forest/2009014
Jump, A. S., Ruiz-Benito, P., Greenwood, S., Allen, C. D., Kitzberger, T., Fensham, R., et al. (2017). Structural overshoot of tree growth with climate variability and the global spectrum of drought-induced forest dieback. Glob. Change Biol. 23, 3742–3757. doi: 10.1111/gcb.13636
Kubínová, Z., Janáček, J., Lhotáková, Z., Šprtová, M., Kubínová, L., and Albrechtová, J. (2018). Norway spruce needle size and cross section shape variability induced by irradiance on a macro- and microscale and CO2 concentration. Trees 32, 231–244. doi: 10.1007/s00468-017-1626-3
Leuschner, C. (2020). Drought response of European beech (Fagus sylvatica L.)—A review. Perspect. Plant Ecol. Evol. Syst. 47:125576. doi: 10.1016/j.ppees.2020.125576
Li, Y., Zou, D., Shrestha, N., Xu, X., Wang, Q., Jia, W., et al. (2020). Spatiotemporal variation in leaf size and shape in response to climate. J. Plant Ecol. 13, 87–96. doi: 10.1093/jpe/rtz053
Meier, I. C., and Leuschner, C. (2008). Leaf size and leaf area index in Fagus sylvatica forests: competing effects of precipitation, temperature, and nitrogen availability. Ecosystems 11, 655–669. doi: 10.1007/s10021-008-9135-2
Meteotest (2020). Klimadaten Waldforschung: Berechnung von historischen Meteo- und Trockenheitsindizes für die Waldforschung auf der Basis von SwissMetNet-Stationsdaten. Bern: Meteotest.
Midolo, G., Frenne, P., de Hölzel, N., and Wellstein, C. (2019). Global patterns of intraspecific leaf trait responses to elevation. Glob. Change Biol. 25, 2485–2498. doi: 10.1111/gcb.14646
Müller-Haubold, H., Hertel, D., and Leuschner, C. (2015). Climatic drivers of mast fruiting in European beech and resulting C and N allocation shifts. Ecosystems 18, 1083–1100. doi: 10.1007/s10021-015-9885-6
Müller-Haubold, H., Hertel, D., Seidel, D., Knutzen, F., and Leuschner, C. (2013). Climate responses of aboveground productivity and allocation in Fagus sylvatica: a transect study in mature forests. Ecosystems 16, 1498–1516. doi: 10.1007/s10021-013-9698-4
Nakagawa, S., Johnson, P. C. D., and Schielzeth, H. (2017). The coefficient of determination R2 and intra-class correlation coefficient from generalized linear mixed-effects models revisited and expanded. J. R. Soc. Interface 14:20170213. doi: 10.1098/rsif.2017.0213
Nielssen, L. O., and Wiklund, K. (1992). Influence of nutrient and water stress on Norway spruce production in south Sweden – the role of air pollutants. Plant Soil 147, 251–265.
Nussbaumer, A., Gessler, A., Benham, S., de Cinti, B., Etzold, S., Ingerslev, M., et al. (2021). Contrasting resource dynamics in mast years for European beech and oak – a continental scale analysis. Front. For. Glob. Change 4:689836. doi: 10.3389/ffgc.2021.689836
Nussbaumer, A., Meusburger, K., Schmitt, M., Waldner, P., Gehrig, R., Haeni, M., et al. (2020). Extreme summer heat and drought lead to early fruit abortion in European beech. Sci. Rep. 10:5334. doi: 10.1038/s41598-020-62073-0
O’sullivan, O. S., Heskel, M. A., Reich, P. B., Tjoelker, M. G., Weerasinghe, L. K., Penillard, A., et al. (2017). Thermal limits of leaf metabolism across biomes. Glob. Change Biol. 23, 209–223. doi: 10.1111/gcb.13477
Peppe, D. J., Royer, D. L., Cariglino, B., Oliver, S. Y., Newman, S., Leight, E., et al. (2011). Sensitivity of leaf size and shape to climate: global patterns and paleoclimatic applications. New Phytol. 190, 724–739. doi: 10.1111/j.1469-8137.2010.03615.x
Pinheiro, J., Bates, D., Saikat, D., Deepayan, S., and R Core Team (2020). nlme: Linear and Nonlinear Mixed Effects Models: R package version 3.1-149.
Poorter, H., Niinemets, Ü, Poorter, L., Wright, I. J., and Villar, R. (2009). Causes and consequences of variation in leaf mass per area (LMA): a meta-analysis. New Phytol. 182, 565–588.
R Core Team (2020). R: A Language and Environment for Statistical Computing: R Foundation for Statistical Computing. Vienna: R Foundation for Statistical Computing.
Rautio, P., Fürst, A., Stefan, K., Raitio, H., and Bartels, U. (2016). “Part XII: sampling and analysis of needles and leaves,” in Manual on Methods and Criteria for Harmonized Sampling, Assessment, Monitoring and Analysis of the Effects of Air Pollution on Forests, ed. UNECE ICP Forests Programme Co-ordinating Centre (Eberswalde: Thünen Institute of Forest Ecosystems).
Read, Q. D., Moorhead, L. C., Swenson, N. G., Bailey, J. K., and Sanders, N. J. (2014). Convergent effects of elevation on functional leaf traits within and among species. Funct. Ecol. 28, 37–45. doi: 10.1111/1365-2435.12162
Reich, P. B., Ellsworth, D. S., Walters, M. B., Vose, J. M., Gresham, C., Volin, J. C., et al. (1999). Generality of leaf trait relationships: a test across six biomes. Ecology 80, 1955–1969.
Remund, J., Rihm, B., and Huguenin-Landl, B. (2016). Klimadaten für die Waldmodellierung für das 20. und 21. Jahrhundert: Schlussbericht des Projektes im Forschungsprogramm Wald und Klimawandel. Zürich: ETH Zurich.
Rigling, A., and Schaffer, H. P. (2015). Forest report 2015. Condition and use of Swiss forests. Bern: Federal Office for the Environment.
Rigling, A., and Stähli, M. (2020). Erkenntnisse aus der Trockenheit 2018 für die zukünftige Waldentwicklung. Schweiz. Z. Forstwesen 171, 242–248. doi: 10.3188/szf.2018.0242
Roloff, A. (1987). Morphologie der Kronenentwicklung von Fagus sylvatica L. (Rotbuche) unter besonderer Berücksichtigung neuartiger Veränderungen: auszug aus der Dissertation des Autors vom November 1985 am Forstbotanischen Institut der Universität Göttingen. Flora 179, 355–378. doi: 10.1016/S0367-2530(17)30269-4
Romanenko, V. A. (1961). “Computation of the autumn soil moisture using a universal relationship for a large area,” in Proceedings of the Ukrainian Hydrometeorological Research Institute, Kiev.
Salehi, M., Walthert, L., Zimmermann, S., Waldner, P., Schmitt, M., Schleppi, P., et al. (2020). Leaf morphological traits and leaf nutrient concentrations of European beech across a water availability gradient in Switzerland. Front. For. Glob. Change 3:19. doi: 10.3389/ffgc.2020.00019
Sanginés de Cárcer, P., Signarbieux, C., Schlaepfer, R., Buttler, A., and Vollenweider, P. (2017). Responses of antinomic foliar traits to experimental climate forcing in beech and spruce saplings. Environ. Exp. Bot. 140, 128–140. doi: 10.1016/j.envexpbot.2017.05.013
Sardans, J., and Peñuelas, J. (2013). Tree growth changes with climate and forest type are associated with relative allocation of nutrients, especially phosphorus, to leaves and wood. Glob. Ecol. Biogeogr. 22, 494–507. doi: 10.1111/geb.12015
Schaub, M., Dobbertin, M., Kräuchi, N., and Dobbertin, M. K. (2011). Preface–Long-term ecosystem research: understanding the present to shape the future. Environ. Monit. Assess. 174, 1–2. doi: 10.1007/s10661-010-1756-1
Schuldt, B., Buras, A., Arend, M., Vitasse, Y., Beierkuhnlein, C., Damm, A., et al. (2020). A first assessment of the impact of the extreme 2018 summer drought on Central European forests. Basic Appl. Ecol. 45, 86–103. doi: 10.1016/j.baae.2020.04.003
Scoffoni, C., Vuong, C., Diep, S., Cochard, H., and Sack, L. (2014). Leaf shrinkage with dehydration: coordination with hydraulic vulnerability and drought tolerance. Plant Physiol. 164, 1772–1788. doi: 10.1104/pp.113.221424
Selås, V., Piovesan, G., Adams, J. M., and Bernabei, M. (2002). Climatic factors controlling reproduction and growth of Norway spruce in southern Norway. Can. J. For. Res. 32, 217–225. doi: 10.1139/x01-192
Swidrak, I., Schuster, R., and Oberhuber, W. (2013). Comparing growth phenology of co-occurring deciduous and evergreen conifers exposed to drought. Flora 208, 609–617. doi: 10.1016/j.flora.2013.09.004
Teskey, R. O. (2004). “Canopy processes,” in Encyclopedia of Forest Sciences, eds J. Burley, J. A. Youngquist, and J. Evans (Amsterdam: Elsevier), 1622–1628.
Thimonier, A., Graf Pannatier, E., Schmitt, M., Waldner, P., Schleppi, P., and Braun, S. (2012). Dépôts atmosphériques azotés et leurs effets en forêt: un bilan des sites d’observation à long terme. Schweiz. Z. Forstwesen 163, 343–354. doi: 10.3188/szf.2012.0343
Thimonier, A., Graf Pannatier, E., Schmitt, M., Waldner, P., Walthert, L., Schleppi, P., et al. (2010). Does exceeding the critical loads for nitrogen alter nitrate leaching, the nutrient status of trees and their crown condition at Swiss Long-term Forest Ecosystem Research (LWF) sites? Eur. J. For. Res. 129, 443–461. doi: 10.1007/s10342-009-0328-9
Thimonier, A., Kosonen, Z., Braun, S., Rihm, B., Schleppi, P., Schmitt, M., et al. (2019). Total deposition of nitrogen in Swiss forests: comparison of assessment methods and evaluation of changes over two decades. Atmos. Environ. 198, 335–350. doi: 10.1016/j.atmosenv.2018.10.051
Thom, D., Rammer, W., Dirnböck, T., Müller, J., Kobler, J., Katzensteiner, K., et al. (2017). The impacts of climate change and disturbance on spatio-temporal trajectories of biodiversity in a temperate forest landscape. J. Appl. Ecol. 54, 28–38.
Trotsiuk, V., Babst, F., Grossiord, C., Gessler, A., Forrester, D. I., Buchmann, N., et al. (2021). Tree growth in Switzerland is increasingly constrained by rising evaporative demand. J. Ecol. 109, 2981–2990. doi: 10.1111/1365-2745.13712
Ununger, J., and Kang, H. (1988). Estimated bud development period in Picea abies. Scand. J. For. Res. 3, 47–53. doi: 10.1080/02827588809382494
Venables, W. N., and Ripley, B. D. (2002). Modern Applied Statistics with S. New York, NY: Springer.
Waldner, P., Marchetto, A., Thimonier, A., Schmitt, M., Rogora, M., Granke, O., et al. (2014). Detection of temporal trends in atmospheric deposition of inorganic nitrogen and sulphate to forests in Europe. Atmos. Environ. 95, 363–374. doi: 10.1016/j.atmosenv.2014.06.054
Waldner, P., Thimonier, A., Graf Pannatier, E., Etzold, S., Schmitt, M., Marchetto, A., et al. (2015). Exceedance of critical loads and of critical limits impacts tree nutrition across Europe. Ann. For. Sci. 72, 929–939. doi: 10.1007/s13595-015-0489-2
Walthert, L., Ganthaler, A., Mayr, S., Saurer, M., Waldner, P., Walser, M., et al. (2021). From the comfort zone to crown dieback: sequence of physiological stress thresholds in mature European beech trees across progressive drought. Sci. Total Environ. 753, 141792. doi: 10.1016/j.scitotenv.2020.141792
Withington, J. M., Reich, P. B., Oleksyn, J., and Eissenstat, D. M. (2006). Comparisons of structure and life span in roots and leaves among temperate trees. Ecol. Monogr. 76, 381–397.
Wright, I. J., Dong, N., Maire, V., Prentice, I. C., Westoby, M., Díaz, S., et al. (2017). Global climatic drivers of leaf size. Science 357, 917–921. doi: 10.1126/science.aal4760
Wright, I. J., Reich, P. B., Westoby, M., Ackerly, D. D., Baruch, Z., Bongers, F., et al. (2004). The worldwide leaf economics spectrum. Nature 428, 821–827. doi: 10.1038/nature02403
Wyka, T. P., Oleksyn, J., Zytkowiak, R., Karolewski, P., Jagodziński, A. M., and Reich, P. B. (2012). Responses of leaf structure and photosynthetic properties to intra-canopy light gradients: a common garden test with four broadleaf deciduous angiosperm and seven evergreen conifer tree species. Oecologia 170, 11–24. doi: 10.1007/s00442-012-2279-y
Yang, F., Magh, R.-K., Ivanković, M., Lanšćak, M., Haberstroh, S., Du, B., et al. (2020). Foliar P nutrition of European beech (Fagus sylvatica L.) depends on the season but remains unaffected by co-cultivation with silver fir (Abies alba Mill.). Eur. J. For. Res. 139, 853–868. doi: 10.1007/s10342-020-01289-1
Keywords: European beech, Norway spruce, climate change, foliar nutrients, ICP Forests, leaf morphological trait, VPD, mast years
Citation: Zhu J, Thimonier A, Etzold S, Meusburger K, Waldner P, Schmitt M, Schleppi P, Schaub M, Thormann J-J and Lehmann MM (2022) Variation in Leaf Morphological Traits of European Beech and Norway Spruce Over Two Decades in Switzerland. Front. For. Glob. Change 4:778351. doi: 10.3389/ffgc.2021.778351
Received: 16 September 2021; Accepted: 29 November 2021;
Published: 05 January 2022.
Edited by:
Rüdiger Grote, Karlsruhe Institute of Technology (KIT), GermanyReviewed by:
Hu Bin, University of Freiburg, GermanyLina Fusaro, Institute for Bioeconomy, National Research Council (CNR), Italy
Copyright © 2022 Zhu, Thimonier, Etzold, Meusburger, Waldner, Schmitt, Schleppi, Schaub, Thormann and Lehmann. This is an open-access article distributed under the terms of the Creative Commons Attribution License (CC BY). The use, distribution or reproduction in other forums is permitted, provided the original author(s) and the copyright owner(s) are credited and that the original publication in this journal is cited, in accordance with accepted academic practice. No use, distribution or reproduction is permitted which does not comply with these terms.
*Correspondence: Marco M. Lehmann, bWFyY28ubGVobWFubkBhbHVtbmkuZXRoei5jaA==