 Beverly E. Law
 Logan T. Berner
 David J. Mildrexler
 Ralph O. Bloemers
 William J. Ripple1,2,5
- 1Department of Forest Ecosystems and Society, Oregon State University, Corvallis, OR, United States
- 2EcoSpatial Services L.L.C., Flagstaff, AZ, United States
- 3Eastern Oregon Legacy Lands, Joseph, OR, United States
- 4Green Oregon Alliance, Portland, OR, United States
- 5Conservation Biology Institute, Corvallis, OR, United States
Creating strategic forest reserves is essential for stemming the loss of biodiversity and contributing to climate mitigation and adaptation. Meeting preservation targets of 30% protection by 2030, and 50% by 2050 would lead to greater protection of animal taxa and tree species habitat, carbon stocks and accumulation, and forests that are important sources of drinking water. Here, we develop a regional framework to specifically identify at a fine resolution (30 m) high priority forestlands for preservation in Oregon, USA. We include a resilience metric that represents connectivity and topographic diversity, and identify areas within each ecoregion that are ranked high priority for carbon, biodiversity, resilience and drinking water. Oregon has less than 10% of its forestlands protected at the highest levels, yet its temperate forests are among those with the highest carbon densities in the world. Reserves for surface drinking water sources and forest habitat for birds, mammals, amphibians, and reptiles could increase to 50–70% protection at the highest levels by 2050. Protected aboveground biomass carbon could triple to 635 teragrams of carbon by 2050. The ownership of the high preservation priority lands for carbon and biodiversity is primarily federal (67% by 2050) followed by private (28% by 2050), with much less in the other ownerships. Forest reserves could be established on federal lands through executive action, regulation and rule-making, while private landowners could be incentivized to store more carbon, limit harvest in certain areas and transfer ownership to land trusts. Protecting mature and old forests on federal lands fulfills an urgent need for protection and provides a low-cost way to simultaneously meet national and international goals. This study provides a flexible, dynamic framework for identifying areas that are high priority to protect for climate mitigation and adaptation at regional and sub-regional scales.
Introduction
Immediate and effective action is essential to address accelerated warming, water shortages and biodiversity losses, which includes animals, plants, and ecosystems (Pörtner et al., 2021). Biodiversity loss, degradation and transformation of ecosystems are already worse than predicted due to past global warming and will continue to escalate with increased warming (IPCC, 2022). Safeguarding biodiversity and ecosystem services depend on effective “conservation of about 30–50% of Earth’s land, freshwater and ocean areas, including currently near-natural ecosystems” (IPCC, 2022).
In the conterminous United States, only 6.1% of forestland is protected at the highest level, with 0.2% in strict nature reserves to protect biodiversity, 4.8% in wilderness areas, and 1.1% in National Parks (Nelson et al., 2020). Some of the responsibility for immediate action to halt biodiversity loss, protect human drinking water supplies, and mitigate climate change rests upon the states and requires cross-jurisdictional coordination across complex multi-ownership boundaries.
Over the western US, we previously prioritized forest areas for protection based on their carbon densities and biodiversity of animal taxa and tree species (Law et al., 2021). The study suggests the Pacific Northwest has a large amount of forest area that should be high priority for protection by 2030 and 2050. Yet, Oregon has the lowest percentage (10%) of its forest area permanently protected in the eleven western US states. This shortfall called for a closer examination of available ecological data and policy considerations.
Oregon is positioned to take significant actions to meet the protection targets, as it has more than 12 million hectares of forestland, with some of the highest carbon densities in the world (Hudiburg et al., 2009; Law et al., 2018). Oregon relies on mountain watersheds and rivers for a large portion of the drinking water supply. Identifying important areas for conservation at the local scale may require finer spatial data than our western US study (Law et al., 2021), and consideration of different facets of biodiversity, from species richness to the importance of species with small ranges (Pollock et al., 2017), and consideration of all land ownerships to formulate appropriate policy actions. Here, we refined our regional framework to identify forest areas within Oregon for permanent protections that, if preserved, would stem further biodiversity loss, protect drinking water supplies at their sources, prevent carbon dioxide emissions from forest conversion, and safeguard natural carbon stocks and accumulation. We focus on the following questions:
(1) How much of Oregon’s land and forestland is currently protected by ecoregion?
(2) Which forestlands could be strategically preserved under 30 × 30 and 50 × 50 within each ecoregion based on forest carbon, biodiversity and/or climate resilience?
(3) Who owns the high preservation priority forestlands?
(4) How would reaching 30 × 30 or 50 × 50 affect protection of species habitat, current forest carbon stocks and surface drinking water sources?
(5) What are potential social and cultural effects of preservation actions and how could policies address this?
Here we used fine resolution datasets (30 m), and expanded our analysis from using species richness as a biodiversity metric to include a priority class based on landscape characteristics such as connectivity and topographic diversity as a resilience metric (Carroll et al., 2018). Stable land characteristics that increase diversity and resilience are not likely to change with climate change (Lawler et al., 2013). We applied the priority ranking within each ecoregion to address the importance of distributing protections across the diversity of ecoregions (Dinerstein et al., 2017; Law et al., 2021).
Our study demonstrated that Oregon has high carbon density forests that also have high biodiversity and connectivity for species movement. When these characteristics were prioritized within each ecoregion, it identified sufficient forestland to meet both the 30% protection by 2030 and 50% by 2050 targets that are important nationally and internationally. Our study did not consider the effects of livestock grazing, but this topic was recently investigated in Oregon and across the American West (Ripple et al., 2022).
Materials and methods
Study region
The study region is Oregon, USA, with a total land area of about 25.06 Mha, of which 12.45 Mha (∼49.7%) is forested (Figure 1). Oregon has strong climatic gradients from the Pacific coast to the inland high desert, and multiple mountain ranges that have their own climatic gradients associated with aspect and elevation. Because of this variation, we chose to identify areas with relative potential for protection within each ecoregion. Oregon has nine Environmental Protection Agency (EPA) level 3 ecoregions (Omernik and Griffith, 2014) ranging from temperate mesic forests in the Coast Range and West Cascades ecoregions to semi-arid East Cascades and high biodiversity forests of the Klamath Mountains to interior mixed-conifer forests of the Blue Mountains. Ecoregions are defined by seasonal temperature, precipitation, soil properties, and vegetation types. Three of the eleven ecoregions have little to no forest, including the Columbia Plateau, Northern Basin and Range, and Snake River Plain. Soils range from the high nitrogen and high soil water holding capacity of the Coast Range ecoregion to volcanic soils in the semi-arid East Cascades, affecting productivity. The study region provides a range of conditions that might be expected at much larger scales.
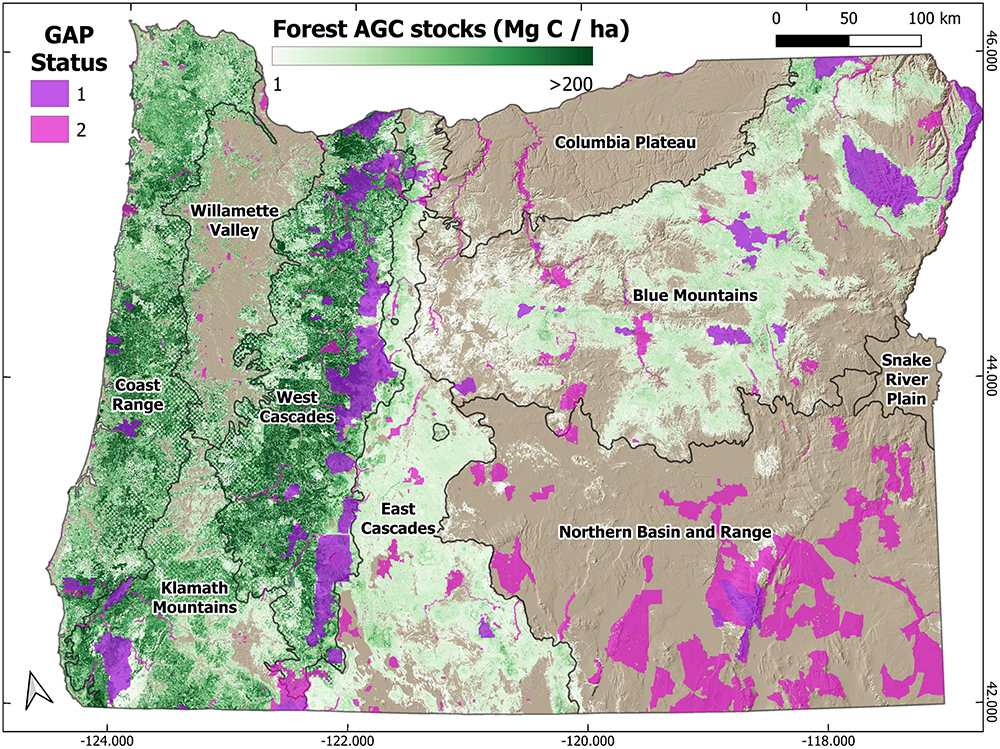
Figure 1. Current protected lands and forest aboveground carbon stocks across Oregon. Protected lands depicted here are assigned GAP Analysis Project (GAP) Status 1 or 2 by the Protected Areas Database of the United States (PAD-US v. 2.1) (USGS GAP, 2020) and include both forestlands and non-forestlands. These statuses characterize areas with permanent protection from anthropogenic conversion of natural land cover. Forest aboveground carbon stocks (Mg C ha–1) in 2017 were spatially modeled from inventory measurements, satellite remote sensing, and environmental data (Landscape Ecology Modeling Mapping and Analysis (Lemma) Team, 2020).
The forests in the region experienced intensive harvesting across public and private lands from the early 1900s through the late 1980s. Implementation of the Northwest Forest Plan (NWFP) in the wetter western portion of Oregon, Washington, and Northern California to protect sensitive aquatic and terrestrial species and habitat in old-growth forests resulted in an 82% decrease in timber harvest on public forestlands. These protections also benefited other ecosystem services like watershed protection (Frissell, 2013) and increased forest carbon accumulation on public lands. Prior to implementation of the NWFP, both public and private forests were about equal net carbon sources (Turner et al., 2011). Between 1990 and 2007, net carbon accumulation on public lands, even after accounting for fires and harvest, was 8 times that on private lands where intensive harvest of young tree plantations continued (Turner et al., 2011; Law et al., 2022). This demonstrates how forest carbon increases when harvest on public lands is limited for biodiversity and water protection. In the drier eastern forests, a set of rules were adopted around the same time to protect sensitive species, older trees and aquatic life, but these rules were rolled back by the US Forest Servic (2021).
Data processing
We analyzed the current extent, future opportunities, and benefits of forest preservation across Oregon using existing spatial datasets related to live tree aboveground carbon stocks, biodiversity, climate resilience, disturbance, and other factors. These spatial datasets were mapped at 30 m to 90 m spatial resolution and thus well suited to inform local to regional forest management decisions (Hansen et al., 2013; USGS GAP, 2018). Therefore, we conducted our spatial analysis at moderately high (30 m) spatial resolution using a common grid in an Albers Equal Area projection. We analyzed and visualized data using the open-source software R (version 4.0) (R Core Team, 2021) with the libraries terra (Hijmans, 2022), raster (Hijmans, 2019), sf (Pebesma, 2018), data.table (Dowle and Srinivasan, 2021), and ggplot2 (Wickham, 2016). We created the maps using open-source software QGIS (v3.20; R Core Team, 2021).
Current and additional protection to meet targets
We determined the current extent of protected lands across Oregon using the Protected Areas Database of the United States (PAD-US version 2.1) that is the official national inventory of protected areas. The PAD-US is a geospatial database created by the United States Geological Survey (USGS) GAP Analysis Project (GAP) that includes information on the spatial extent and protective status of public and private lands across the nation (USGS GAP, 2020). Protective status is characterized by GAP status codes that describe management intent to preserve biodiversity following guidelines from the International Union for the Conservation of Nature (IUCN). The highest protective statuses are GAP 1 and 2, which are for lands that have management plans to maintain the natural state of ecosystems and include permanent protection from human activities that cause land cover conversion. GAP 1 typically aligns with IUCN Categories Ia, Ib, and II, whereas GAP 2 aligns with IUCN Categories III through VI. We clipped the PAD-US shapefile to the boundaries of Oregon and then gridded the GAP status codes at 30 m resolution. Lands can have multiple GAP status codes when under multiple forms of management, in which case we used the lowest GAP status code. We then computed the total land and forest area with permanent protection (GAP 1 or 2) in each ecoregion, as well as how much additional area would be required to protect 30 and 50% of total land and forest area in each ecoregion.
Prioritizing forest protection using preservation targets
To strategically meet the 30 × 30 and 50 × 50 preservation targets in each of Oregon’s ecoregions, we jointly and singularly prioritized forestlands for protection using carbon, biodiversity, and climate resilience metrics (sensu Law et al., 2021). For each prioritization metric, we computed the percentile rank (0–100%) of every grid cell compared to all other grid cells in the ecoregion. We then computed each grid cell’s overall forest preservation priority rank by reranking the sum of its live tree aboveground carbon stocks, biodiversity, and climate resilience ranks. We identified the highest ranked currently unprotected forestlands that could be strategically protected (GAP 1 or 2) to meet each preservation target with the prioritization metrics.
For the carbon priority ranking, we focused on live tree aboveground carbon stocks (AGC). Tree AGC stocks in Oregon’s forests typically account for 41 to 55% of total ecosystem carbon and are a focus for climate change mitigation because of their sensitivity to forest management activities. Tree AGC stocks have been mapped across Oregon’s forestlands for the year 2017 using forest inventory, satellite, and environmental datasets (Landscape Ecology Modeling Mapping and Analysis (Lemma) Team, 2020). Specifically, tree AGC stocks were mapped for all live trees ≥2.5 cm diameter at breast height that occurred in areas that had or could potentially have at least 10% tree cover (Landscape Ecology Modeling Mapping and Analysis (Lemma) Team, 2020). To account for impacts of recent stand-replacing disturbances (e.g., wildfires, logging), we identified areas where forest loss occurred from 2017 to 2020 using the most recently available Global Forest Change dataset derived from 30 m resolution Landsat satellite data (Hansen et al., 2013). We set tree AGC stocks to zero in any grid cell where forest loss was observed during this period, and assumed the disturbances did not cause a permanent transition to non-forest.
For the biodiversity priority ranking, we used terrestrial vertebrate species (hereafter animal) richness by taxa and tree species richness. Current potential habitat distribution of 1,718 animal species was mapped by the USGS at 30 m resolution across the contiguous U.S. using geospatial predictors (USGS GAP, 2018). This included potential habitat for amphibian, bird, mammal, and reptile species found in the region. These habitat maps do not include stopover habitats for migratory species. Furthermore, we characterized the current potential habitat distribution of 89 tree species across Oregon based on the presence or absence of live tree basal area mapped state-wide at 30 m resolution using forest inventory, satellite, and environmental datasets (Landscape Ecology Modeling Mapping and Analysis (Lemma) Team, 2020). For each species that occurred in Oregon, we masked out habitat on non-forestlands, which resulted in our analysis including 544 animal species and 89 tree species. We then estimated species richness for each taxon by counting the number of species with habitat in each forested grid cell. For each grid cell, we (1) derived an animal priority rank based on the ranked sum of the four animal taxa ranks and then (2) derived the biodiversity rank by reranking the sum of the animal and tree priority rank.
For the climate resilience ranking, we used a metric of terrestrial landscape resilience that incorporated geophysical and topo-climatic diversity and landscape permeability (Buttrick et al., 2015). Landscape resilience refers to the capacity of a landscape or ecoregion to maintain biological diversity and ecological function despite climate change. As the climate continues to warm, biodiversity and ecological function are more likely to be maintained in landscapes that are topographically complex and permeable to movement of animals and plants. Complex topography provides corridors and microsites where species can move in response to climate change while a landscape free of barriers (i.e., highly permeable) allows species to take advantage of different microclimates. We used the terrestrial landscape resilience dataset (90 m resolution) produced for the Pacific Northwest USA by The Nature Conservancy (Buttrick et al., 2015). The topo-climatic diversity metric incorporated a heat-load index computed from a digital elevation model and topographic index as a metric of relative variation in water availability. Permeability is a measure of the hardness of barriers, connectedness of natural cover, and arrangement of land uses. More details are in Buttrick et al. (2015).
To select areas with the highest priority for preservation that could meet the 30 × 30 and 50 × 50 targets, forestlands within each ecoregion were ranked by carbon, biodiversity, and/or climate resilience metrics. We used pixel by pixel prioritization ranking rather than neighborhood average for adding spatial structure to the prioritization. The highest ranked forests were then combined with areas currently protected at GAP 1 or 2 until each preservation target was reached. We then assessed who owns these high-preservation priority forestlands, as well as potential effects of increased forest preservation for carbon, biodiversity, and drinking water.
Ownership of high preservation priority forests
Forestland ownership across the state was assessed using the Oregon Department of Forestry (ODF) data representing forest ownership conditions in 2015. The ownership classes in this spatial dataset include Federal, Tribal, State, Local, Private, and Industrial. We examined current ownership of forestlands, as well as ownership of forestlands that we identified as high priority for preservation.
Assessing effects of forest preservation on carbon, biodiversity, and water
We assessed current protection of forest carbon, biodiversity, and surface drinking water across Oregon, as well as potential protection of these ecosystem services if each preservation target was met. To help Oregon’s public water systems and communities, the Department of Environmental Quality identified and mapped public surface drinking water source areas across the state, including rivers, streams and lakes (Oregon Department of Environmental Quality [DEQ], 2019). We used these data in our analysis. First, we quantified the amount of tree AGC stocks, animal and tree species’ habitat, and surface drinking water source areas that are currently protected (GAP 1 or 2) across forestlands in Oregon. Next, we quantified potential protection of these ecosystem services if the 30 × 30 and 50 × 50 preservation targets were met. We focused particularly on forestlands that could be jointly prioritized for preservation using carbon, biodiversity, and climate resilience metrics. Given the importance of protecting the habitat that sustains threatened and endangered (T&E) species, we summarized current and potential habitat protection for animal species that are currently listed by Oregon and/or the federal government. A list of current T&E species is maintained by the Oregon Department of Fish and Wildlife (2021). We excluded from analysis (1) T&E fish, sea turtles, shore birds, and marine mammals; (2) animal species with only distinct population segments listed as T&E [e.g., Pacific marten (Martes caurina)]; and (3) the streaked horned lark (Eremophila alpestris strigata) because habitat data were not available.
Results
Current protected forests
Oregon has 12.45 Mha of forestland of which 1.23 Mha is protected at GAP 1 or 2 levels, less than 10% of the forested area (Figure 1 and Table 1). The largest protected forest area is in the mesic West Cascades (0.55 Mha) followed by the Blue Mountains in eastern Oregon (0.32 Mha) and Klamath Mountains in southwestern Oregon (0.13 Mha). Oregon’s portion of the Coast Range with its heavily forested temperate rainforests is primarily in industrial ownership and managed as tree plantations and, therefore, it holds the smallest portion of forestland that is permanently protected (3%, 0.06 Mha). When the Washington to California portions of the Coast Range are included, it increases to 10%. Similarly, the full Blue Mountains ecoregion that extends into southeast Washington has 10% of its forestland permanently protected (0.48 Mha) (Law et al., 2021).
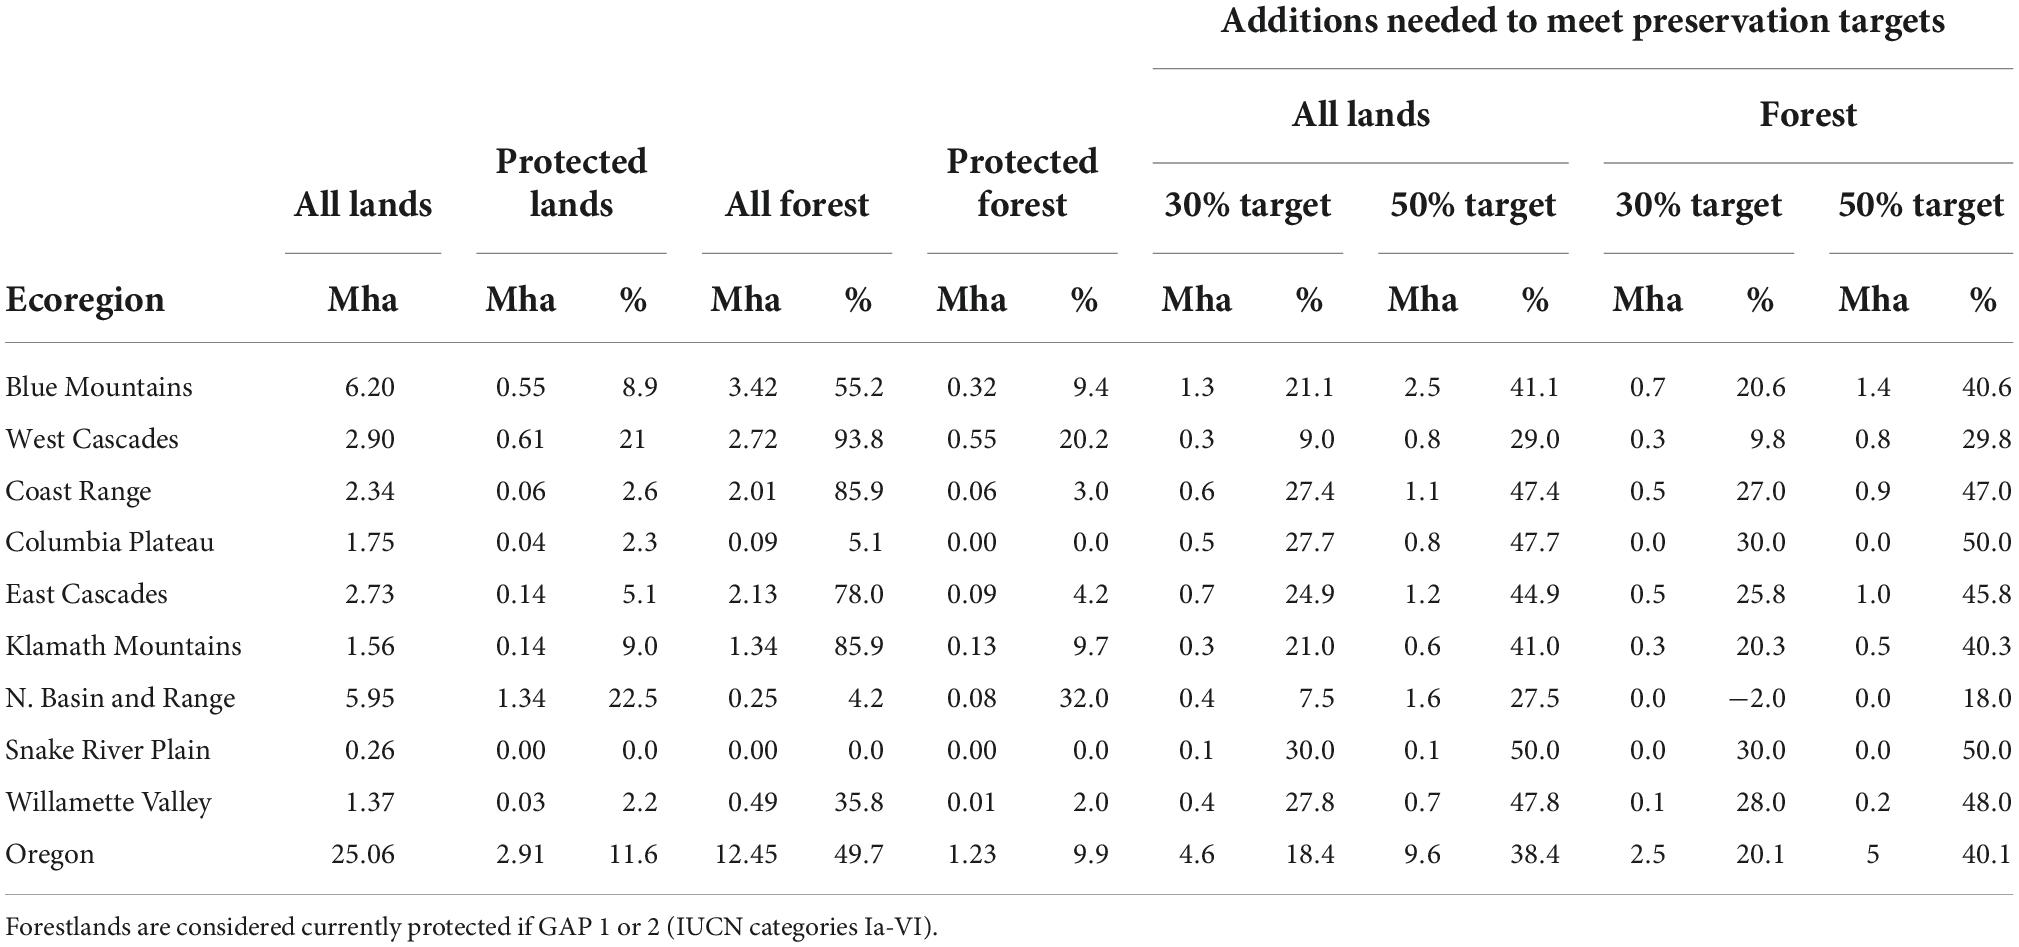
Table 1. Current extent of all forestlands, protected forestlands, and additional forestlands needed to meet preservation targets for each ecoregion in Oregon.
High priority areas for preservation of carbon and/or biodiversity
The forest preservation rankings for carbon and/or biodiversity at GAP 1 or 2 status levels are widely distributed across the forested ecoregions (Figures 2B,C; Supplementary Figures 1–6). However, the climate resilience rank highlights large areas within the ecoregions with larger landscape features that are important for resilience (Figure 2D), such as the topography of mountain ranges in southwest Oregon, the Coast Range, Cascades, and Blue Mountains in the northeast.
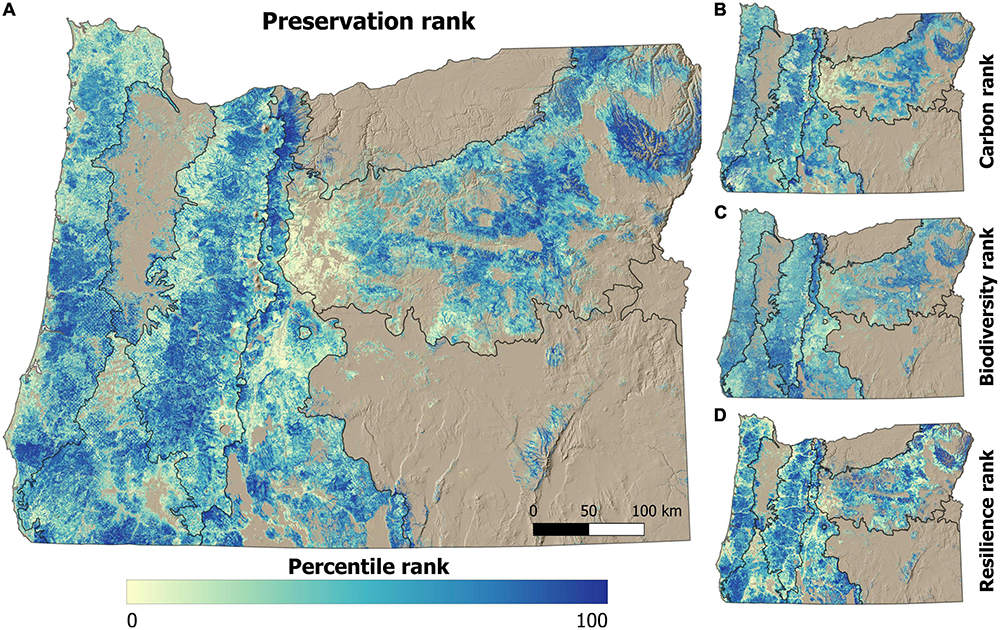
Figure 2. Oregon forest preservation, carbon, biodiversity, and climate resilience priority rankings. (A) Forest preservation priority ranks were derived from (B) carbon, (C) biodiversity, and (D) climate resilience priority ranks within each ecoregion. Forest carbon ranks were based on tree aboveground carbon stocks (AGC) stocks. Forest biodiversity ranks incorporate species richness of amphibians, birds, mammals, reptiles, and trees. Climate resilience priority ranks incorporated topoclimatic diversity and landscape connectivity.
To reach 30% protection in each forested ecoregion by 2030, an additional 2.5 Mha (20.1% of forest area) would need to be protected in less than 10 years (Table 1). To reach the 50% target, a total of 5 Mha (40.1%) would need to be protected by 2050, most of which is in the Blue Mountains, followed by East and West Cascades and the Coast Range (Figure 3).
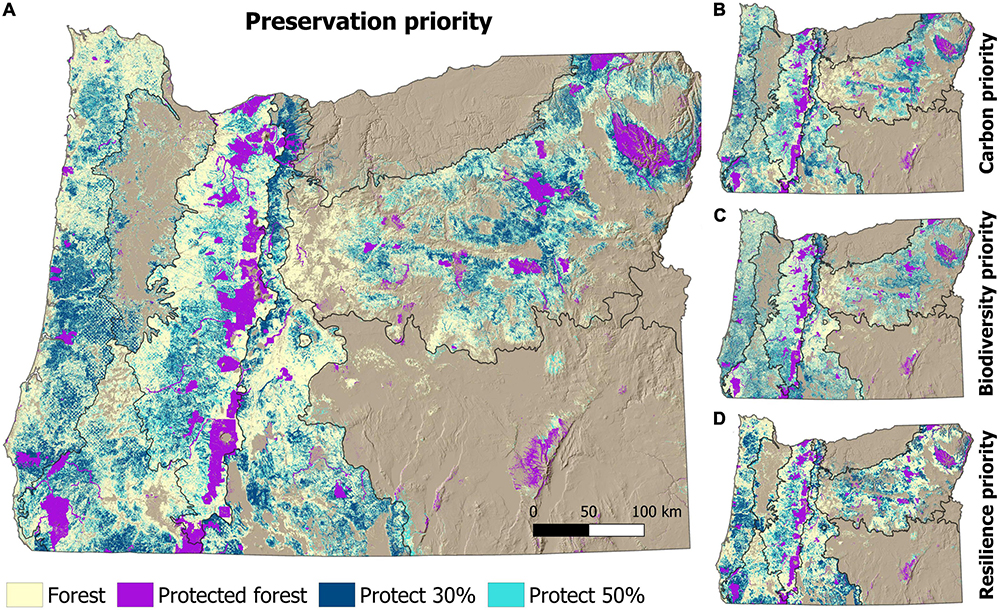
Figure 3. Forestlands prioritized to meet preservation targets across Oregon. Preservation targets include protecting 30 and 50% of each ecoregion’s forestlands. To identify preservation targets, the current extent of forest protection was determined for each ecoregion and then the highest ranked unprotected forestlands were sequentially added to the protected area network until each preservation target was met. (A) Forest preservation priority targets are shown, as are the (B) carbon, (C) biodiversity, and (D) climate resilience priority targets.
We chose four areas for closer examination as examples of potential co-benefits and synergies with existing public lands (Figure 4).
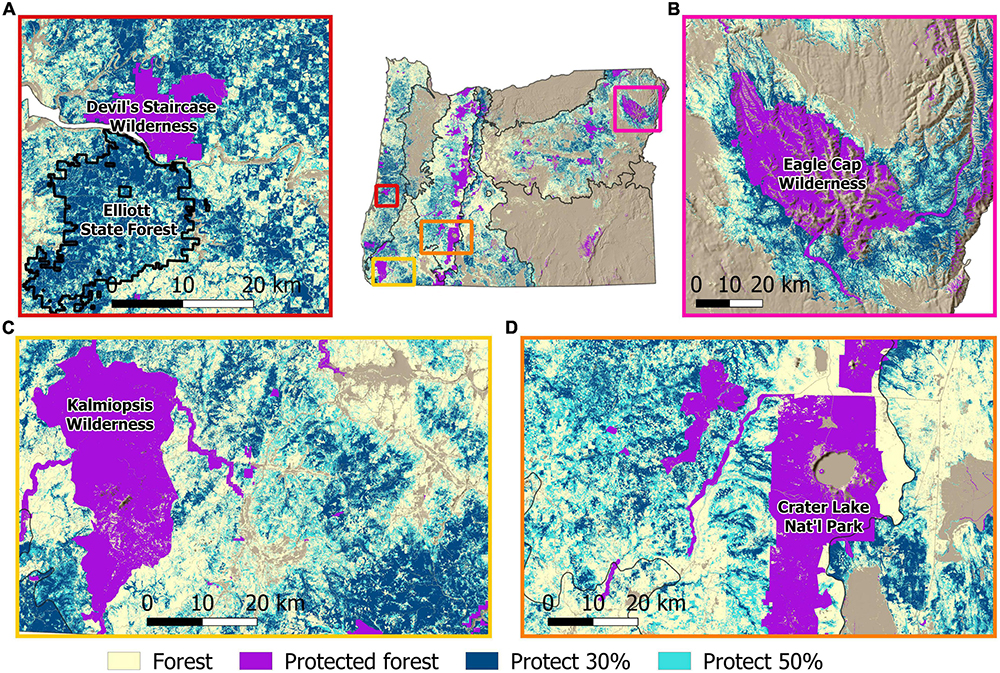
Figure 4. Close-up examples of forestlands prioritized to meet preservation targets in Oregon. Examples include forestlands around the (A) Devil’s Staircase Wilderness and Elliot State Forest in the Coast Range, (B) Eagle Cap Wilderness in the Blue Mountains, (C) Kalmiopsis Wilderness in the Klamath Mountains, and (D) Crater Lake National Park in the Cascade Mountains. In these examples, forestlands were jointly prioritized using carbon, biodiversity, and climate resilience metrics.
The Coast Range ecoregion stretches along the coasts of Washington, Oregon, and northern California. The low elevation mountains (∼1000 m) generally have deep soils with high soil water holding capacity and frequent fog that keeps vapor pressure deficits relatively low, resulting in a longer period of photosynthesis. The Coast Range contains two of the tallest conifer species in the world–Coast Douglas-fir (Pseudotsuga menziesii var. menziesii) and Sitka spruce (Picea sitchensis). These cool, temperate, moist forests can achieve higher biomass carbon density than tropical forests (Law et al., 2018). It is also the most intensively logged ecoregion. Within the areas we identified as high priority for both carbon and biodiversity are the Devil’s Staircase Wilderness and the 32,375 ha Elliott State Research Forest (Figure 4). Both areas have a large portion of mature and old forests. Together, the ESRF reserves in Conservation Research Watersheds and adjacent Devil’s Staircase Wilderness Area represent 26,404 ha of protected reserve (3.8% of Coast Range forestland), the largest in the Oregon Coast Range. The Devil’s Staircase Wilderness was designated in 2019, and could be expanded to a larger area with connectivity corridors on BLM and State forestlands. The 83,000-acre Elliott State Forest was established as Oregon’s first state forest in 1930. By 2020, half of it had been clearcut and planted. In 2020, the Elliott State Research Forest (ESRF) was established following an attempt to privatize the area for industrial management. The Research Forest has strong public support for conservation values including protection of mature and older forests, and threatened and endangered species (northern spotted owl, marbled murrelet, and Oregon Coast coho). Approximately 61% of the Elliott is identified as a reserve to meet state conservation goals, including 13,759 contiguous hectares, and another 5,870 ha of reserves located in harvest areas “protecting older trees and critical species habitat” (Oregon Division of State Lands, 2021; College of Forestry, 2022). To meet IUCN rules and national goals, at least 75% of the ESRF needs to be protected as strict reserves (IUCN, 2013).
The Klamath Mountains ecoregion is very diverse in climate, topography and plant and animal species. This area extends from southwestern Oregon into northern California where high priority forestlands provide connectivity between several large protected Wilderness Areas (Law et al., 2021). The most diverse forest flora in western North America (Whittaker, 1960) is found here, with more than 3,500 plant species, partly due to its steep climatic and topo-edaphic gradients. Plant communities range from temperate rain forests to moist inland forests, oak forests and savannas, and high elevation forests. The Kalmiopsis and Wild Rogue Wilderness Areas are in the Klamath Mountains, and each one presents potential for expansion (Figure 4). The Kalmiopsis was designated an Area of Global Botanical Significance by the IUCN, one of only seven in the United States. The area experienced the large Biscuit Fire in 2002, but has been slowly recovering its carbon stocks as conifer regeneration continued and woody biomass increased in the 10 years after the fire (Donato et al., 2015). The proposed Wild Rogue Wilderness would protect the Zane Grey Roadless Area, the largest forested BLM roadless area in southern Oregon and northern California.
The West Cascades ecoregion has a moist temperate climate that supports high productivity coniferous forests that are also intensively managed for logging. High-elevation forests along the Cascades Crest have received more protection including Crater Lake National Park, Oregon’s only National Park (Figure 4). Crater Lake and surrounding forestlands include significant expansion opportunities of its protected area boundaries to include multiple rivers and elevating the protection of species (GAP 1 or 2) to become part of the strategic reserves system. The Crater Lake Wilderness Proposal would designate 219,744 hectares (2,197 km2) of intact roadless forestlands as Wilderness on National Forest and National Park lands in a conservation area.
The Blue Mountains ecoregion contains a complex of mountain ranges interspersed with valleys stretching from the Cascades in the west to the Rocky Mountains in the east. This is the largest ecoregion in Oregon and has the largest Wilderness area in the state. The area supports diverse and abundant native fish and wildlife populations and has a significant portion of the region’s remaining road-free wildlands. The forest types have fire-adaptive traits related to the wildfire regimes in this ecoregion, with ponderosa pine dominated forests in the south and a greater mix of dry, moist and cold forest types in the north due to receiving more moisture through the Columbia River Gorge. The Eagle Cap Wilderness (Figure 4) is surrounded by roadless areas and presents expansion opportunities that would help secure connectivity in a crucial wildlife corridor with large Wilderness areas in the Rocky Mountains.
Land ownership of high priority areas
In 2015, Oregon forestlands were primarily owned by the federal government (59%), private entities (31%), and industry (7%), whereas little was owned by state, local, or tribal governments (0–3%; Table 2). However, forest ownership widely varied among ecoregions. The federal government owned 66–77% of forestlands in the Blue Mountains, East and West Cascades, and Northern Basin, with these four ecoregions together accounting for 80% of federal forestlands statewide. Conversely, private or industrial owners held 57–92% of forestlands in the Coast Range, Columbia Plateau, Snake River Plain, and Willamette Valley, though these ecoregions together made up only 35% of private and industrial forestlands statewide because, with the exception of the Coast Range, these ecoregions are minimally forested. In terms of total forest area, private ownership was concentrated in the Blue Mountains and Coast Range, which respectively, accounted for 30 and 20% of private forestlands statewide. Similarly, industrial ownership was concentrated in the Coast Range and West Cascades, which respectively, accounted for 46 and 36% of all industrial forestlands statewide. The notable checkerboard pattern of forest carbon stocks and preservation priorities in the Coast Range (Figures 1–3) reflects differences in forest management between public and private ownership.
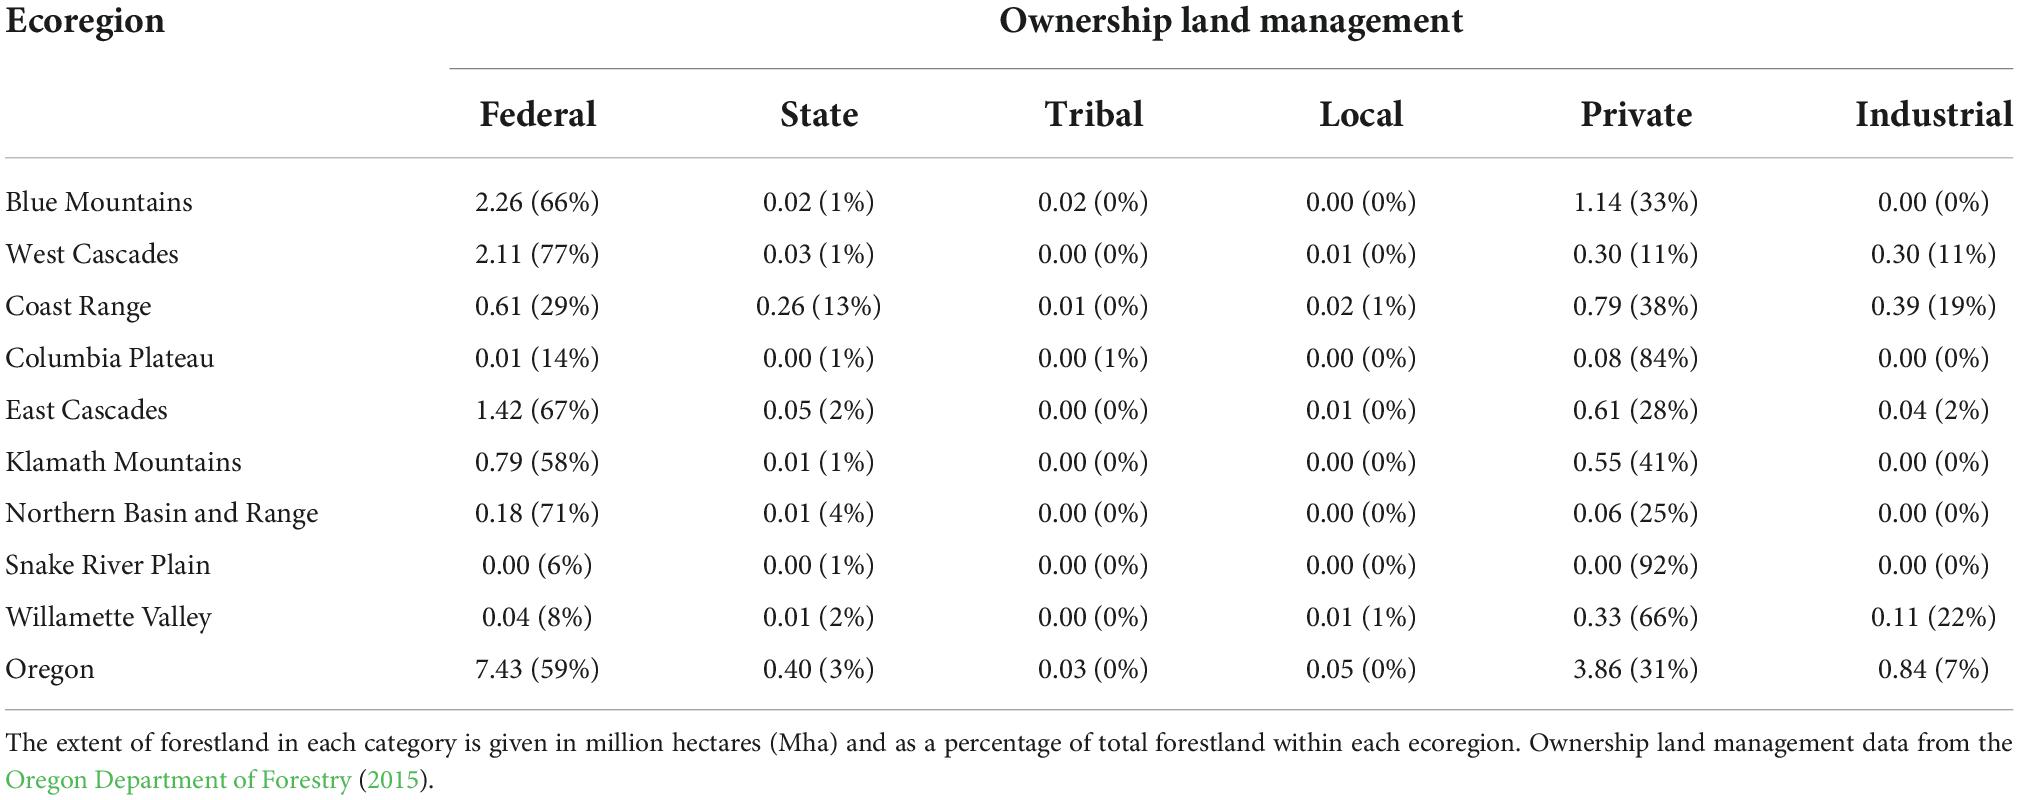
Table 2. Current forestland ownership and management within each ecoregion and overall for Oregon.
The ownership of the high preservation priority forestlands for carbon and biodiversity is primarily federal (72% by 2030, 67% by 2050) followed by private (20% by 2030 and 25% by 2050), with much less in the other ownerships (Figure 5). The additional federal lands needed to meet the high preservation priority targets adds up to 1.75 Mha by 2030 and 3.3 Mha by 2050 (Table 1 and Figure 5). Prioritizing biodiversity increases the percentages on private lands (Figure 5, right frame).
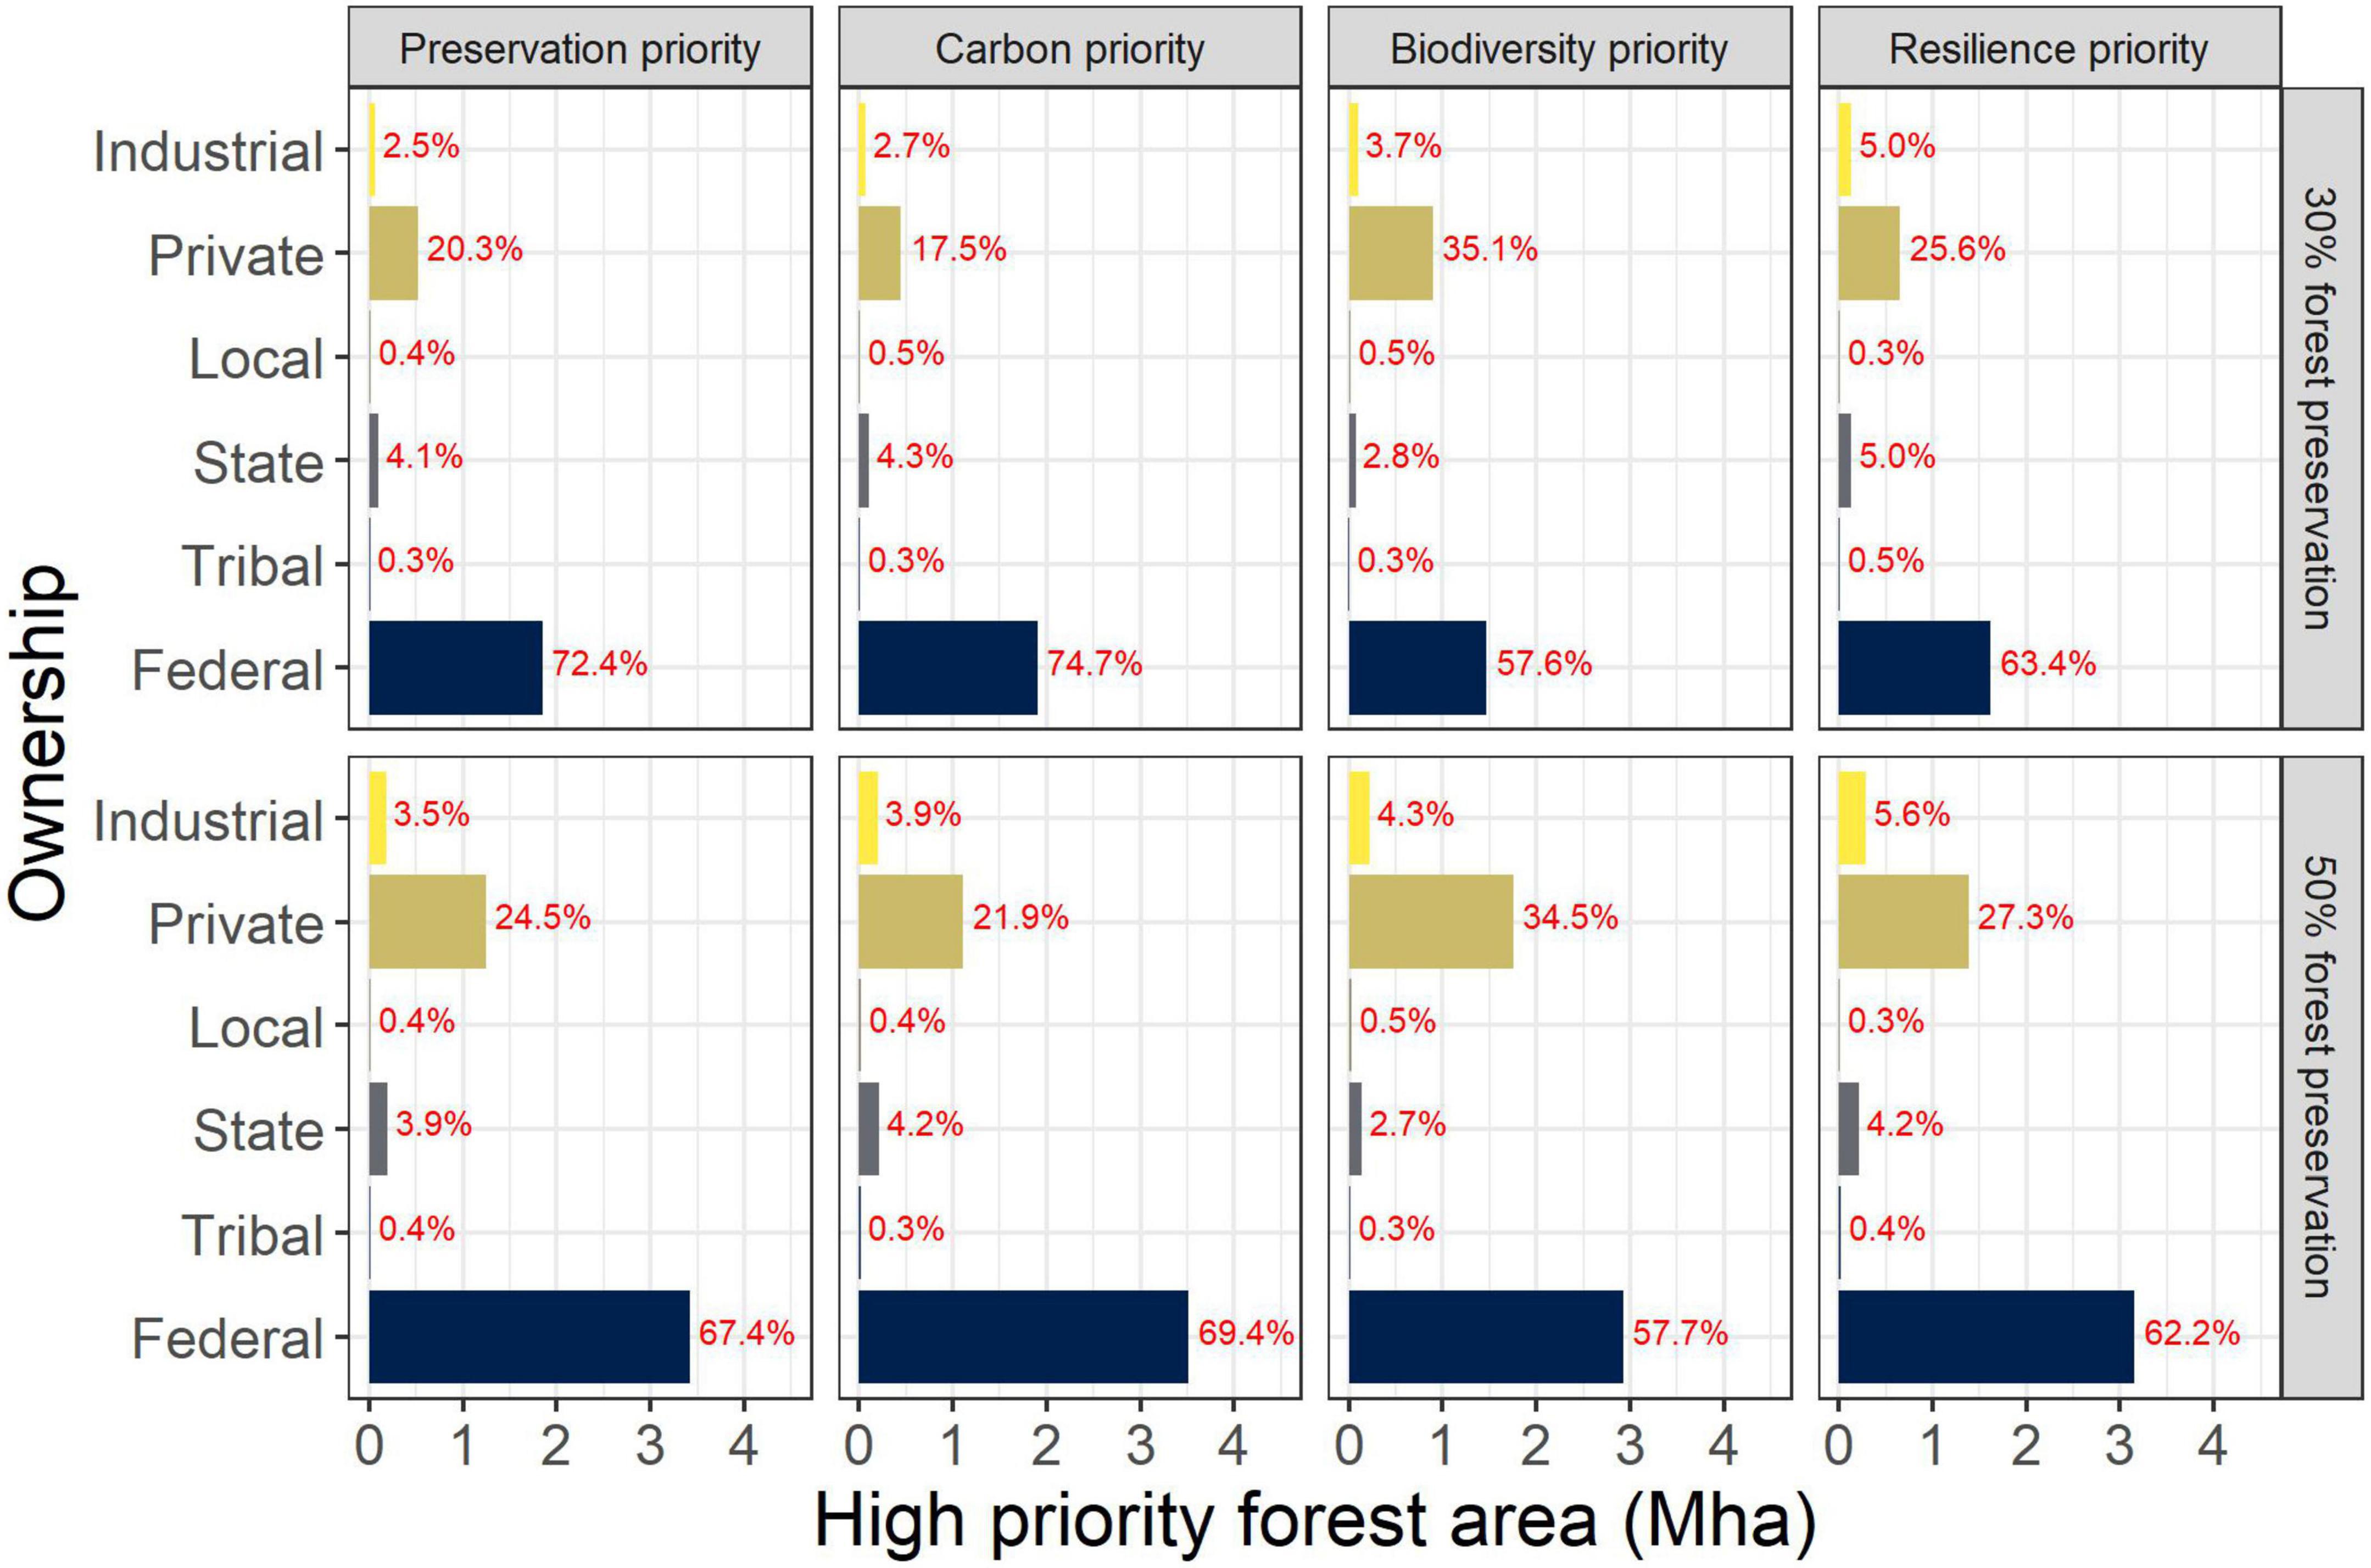
Figure 5. Land ownership of high priority forest areas to protect in Oregon to meet preservation targets. Ownership is summarized for each preservation target (rows) and priority (columns). Land ownership data from Oregon Department of Forestry (2015).
There are large differences among ecoregions in the ownership of high priority forestlands (Figure 6). For example, 80 to >90% of high priority forestlands are federally owned in the Cascade, Klamath, and Blue Mountains, whereas about 80% are privately owned in the Willamette Valley. In ecoregions with very little forestlands (Willamette Valley, Snake River, and Columbia Plateau), most high priority areas are privately owned. The highest population density is in the Willamette Valley and the other two ecoregions are drier. In the Coast Range, 60% of high priority forestlands are on federal lands, and 15% are on Tribally owned lands, the highest in the State.
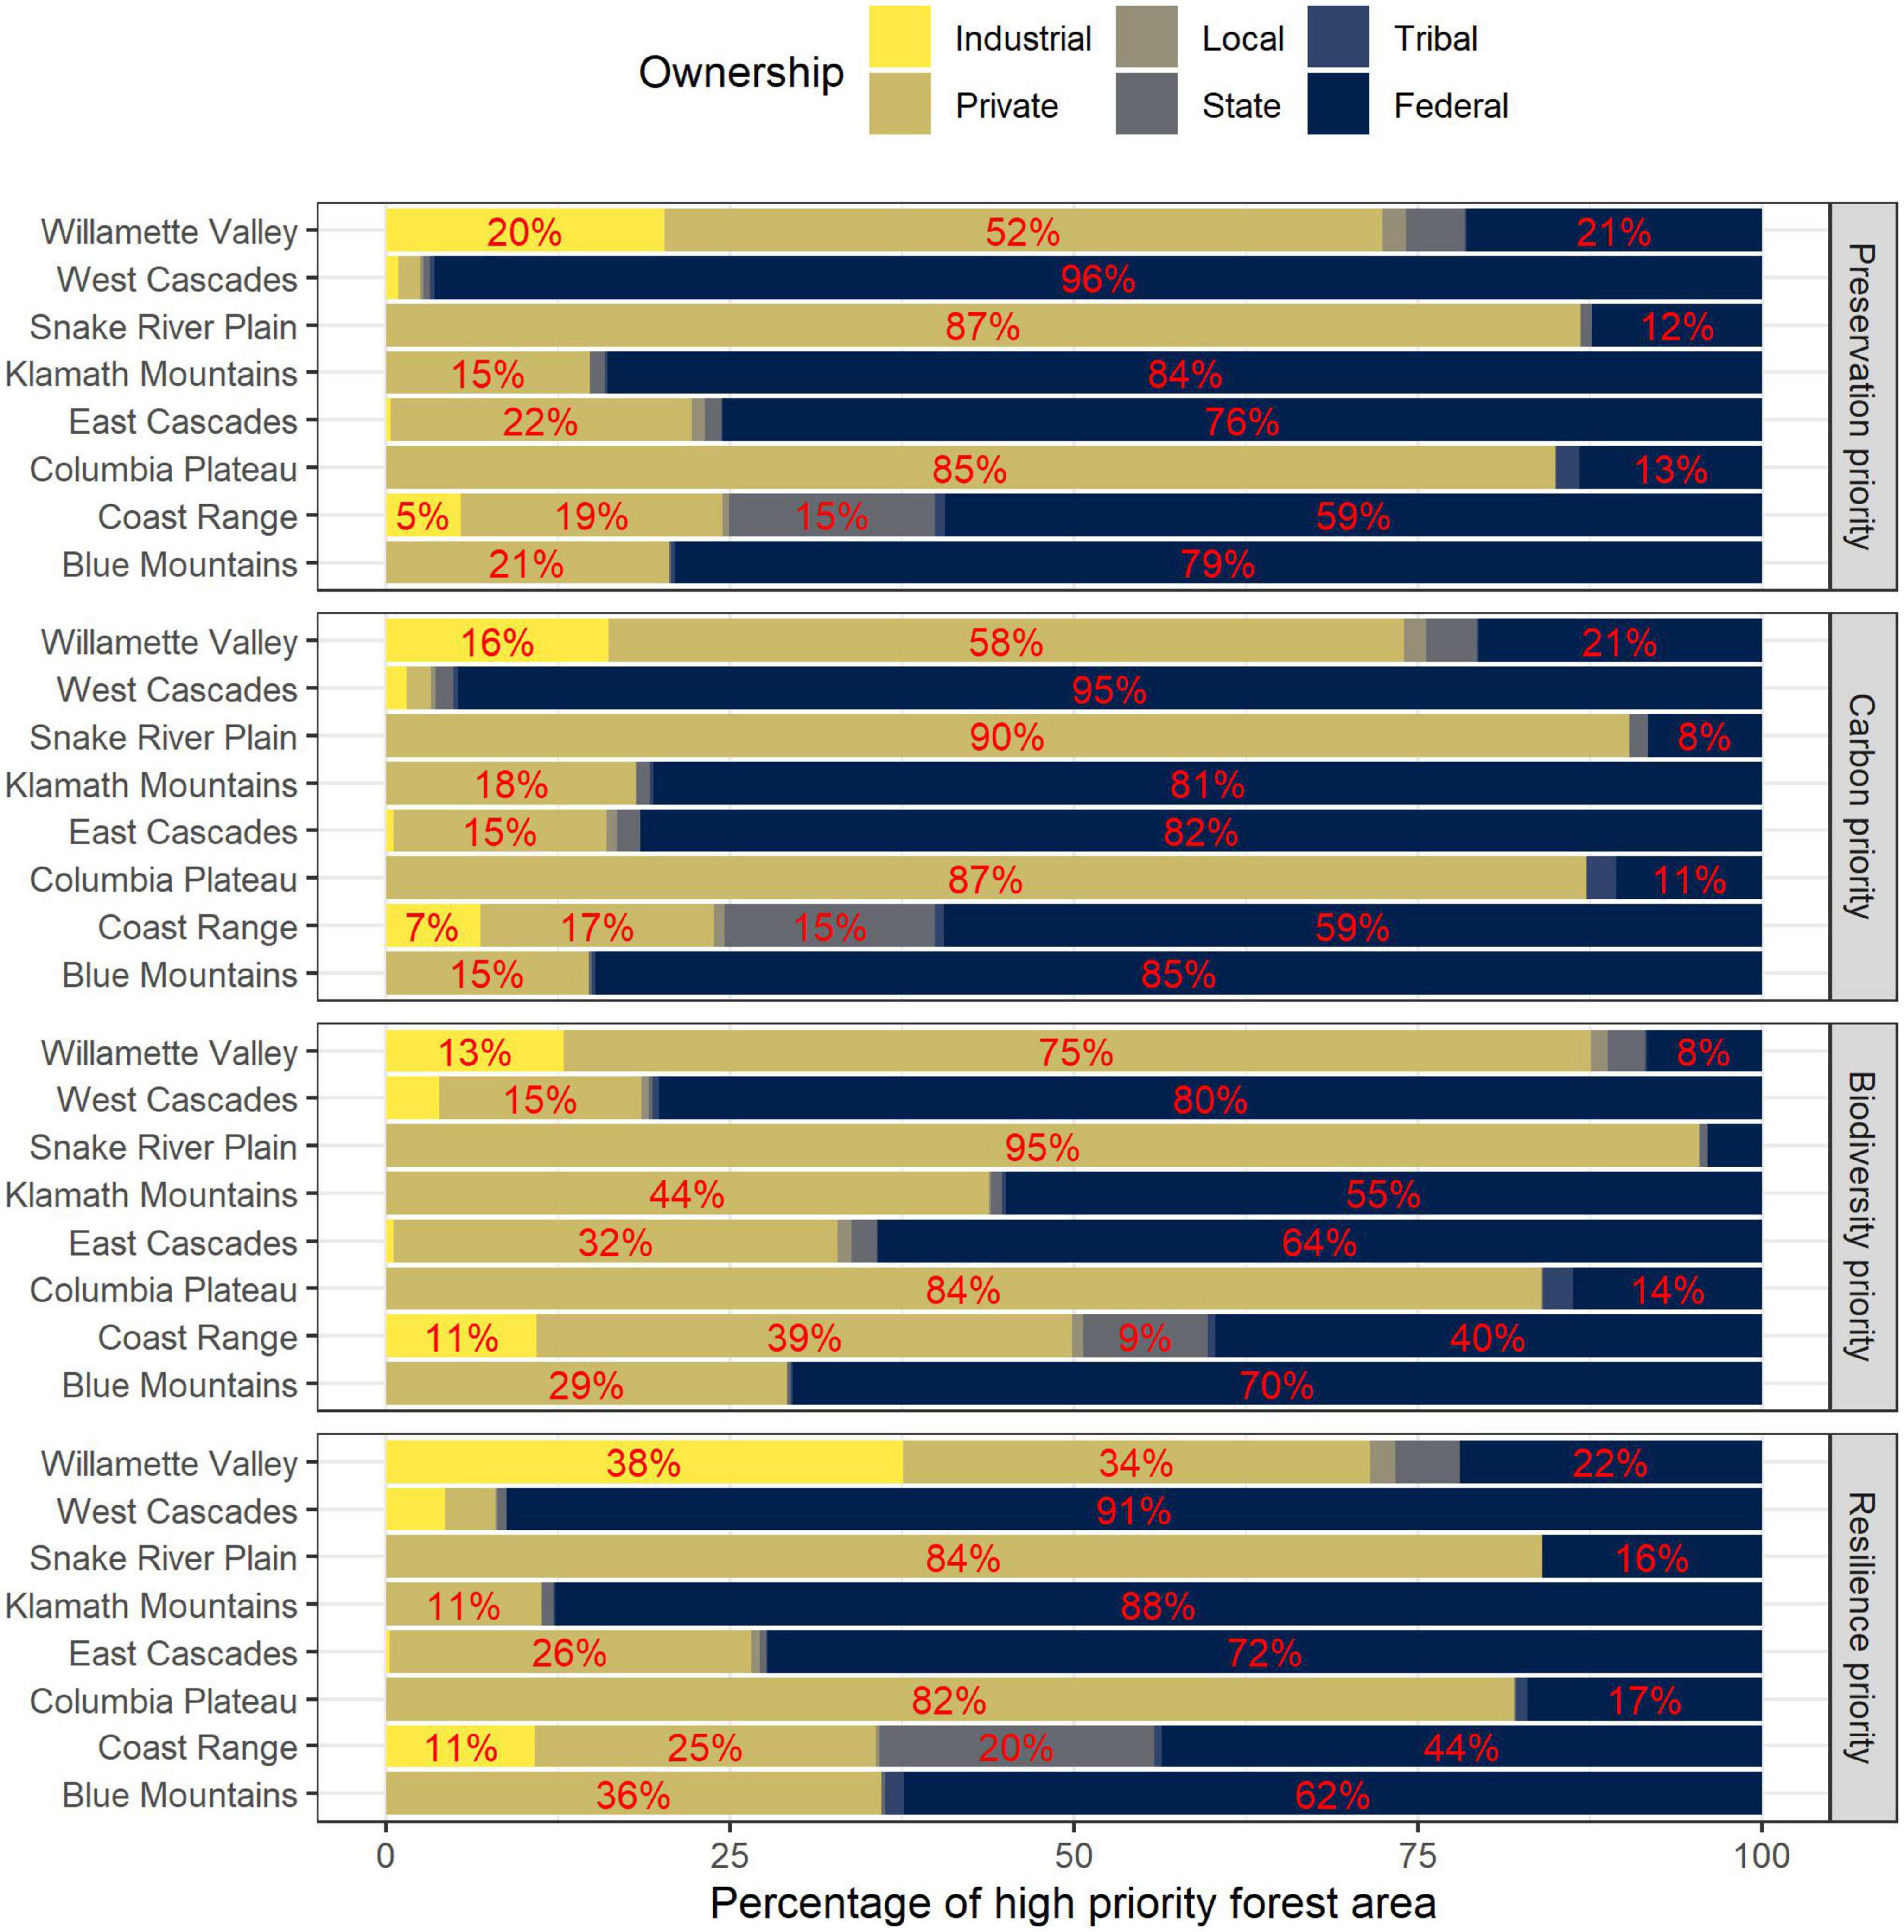
Figure 6. Land ownership of high priority forest areas to protect to reach 30% preservation for each ecoregion in Oregon. Ownership is summarized for each preservation priority (rows). Land ownership data from Oregon Department of Forestry (2015).
Forest habitat, carbon, and drinking water if protected
Meeting the forest preservation targets would substantially increase protection of tree carbon stocks, animal and tree species’ habitat, and surface drinking water source areas. Tree AGC stocks in all of Oregon’s forests is 905 Tg C (Table 3). Currently, only 12% of Oregon’s tree AGC stocks (104 Tg C) are in protected areas, mostly in the West Cascades (65 Tg C), followed by the Blue Mountains (13.5 Tg C) and Coast Range (10.9 Tg C). If the 30 and 50% forest preservation targets were met, then protected tree AGC stocks would total 405 and 635 Tg C (Table 3). The West Cascades and Coast Range would account for about 60% of the additional protected carbon stocks.
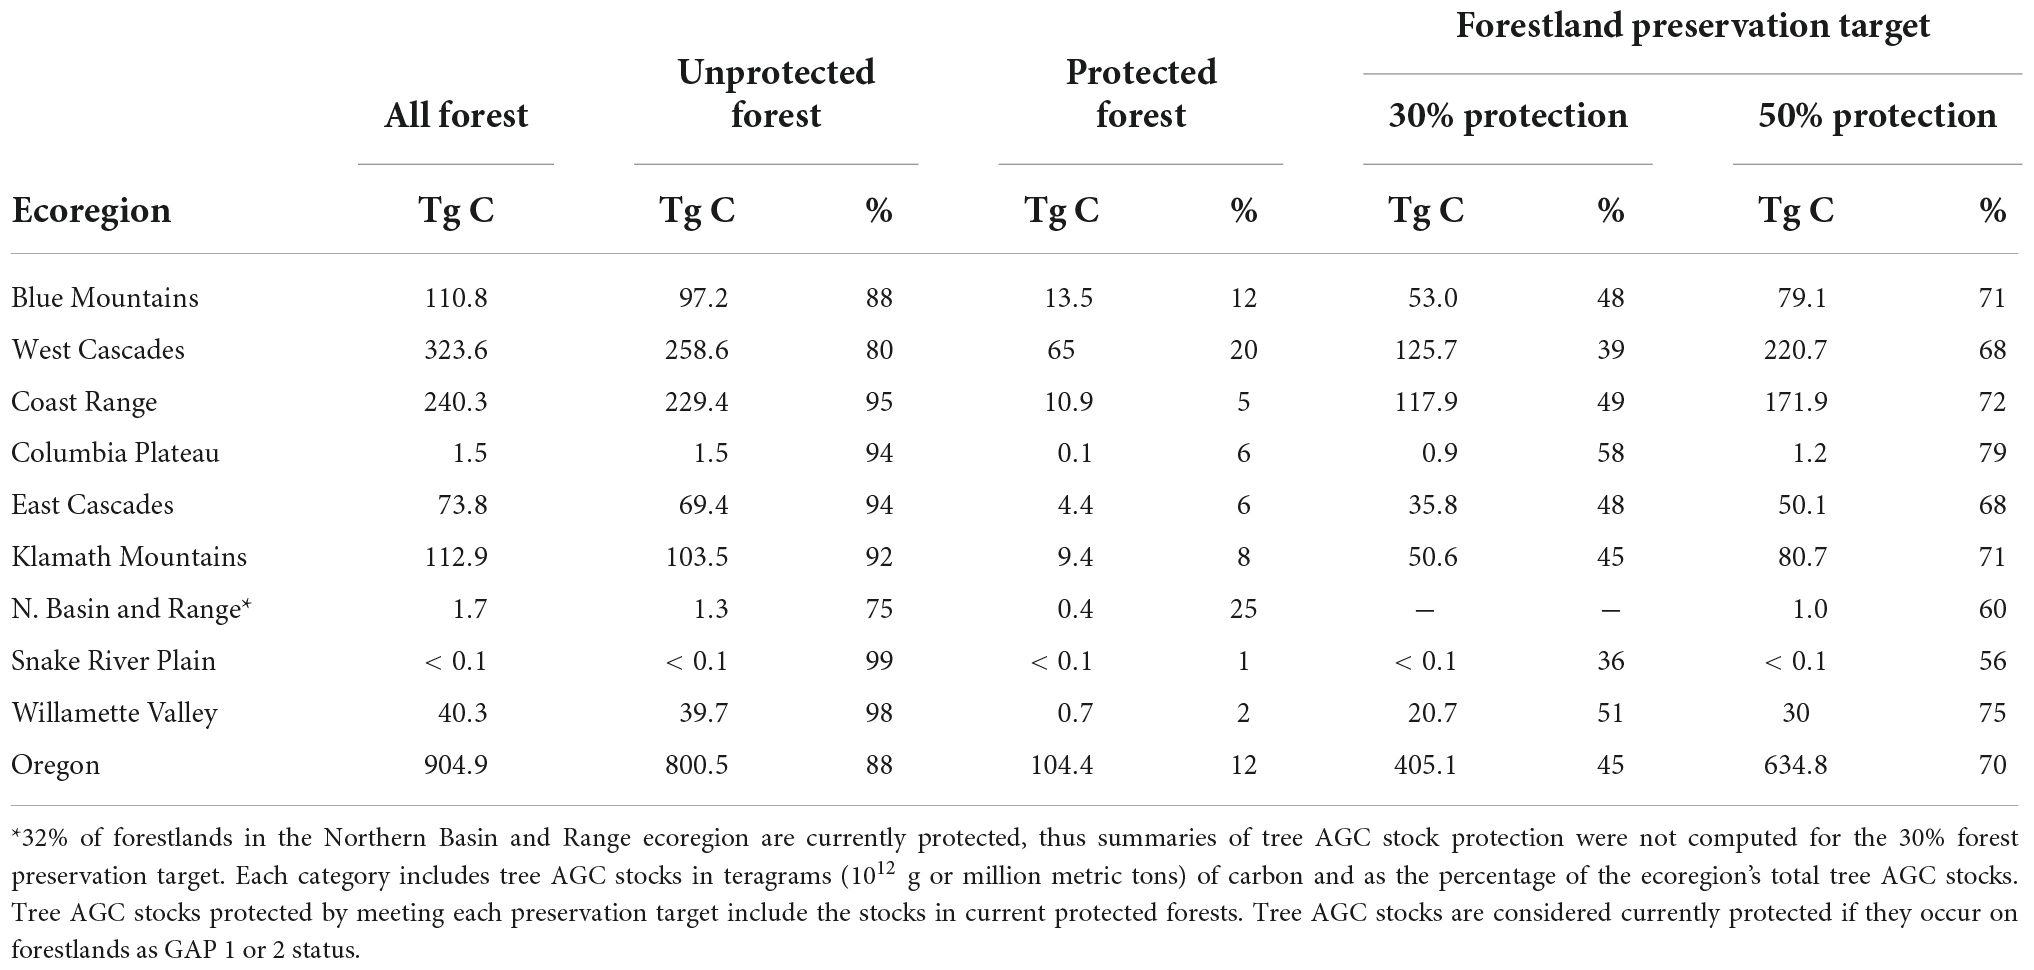
Table 3. Current tree aboveground carbon (AGC) stocks in each ecoregion’s forests, protected forests, and forests that would be protected by meeting preservation targets using joint prioritization.
For most of the considered animal taxa and tree species, only a small percentage of their forest habitat is currently protected. Merely 6 and 14% of animal and tree species have at least 30% of their forest habitat currently protected. Moreover, the median percentage of forest habitat currently protected ranges from 8 to 12% among amphibian, bird, mammal, and reptile species and is 10% among tree species (Figure 7A). If the 30 and 50% forest preservation targets were met, then the median amount of forest habitat protected would be 27–42 and 45–63% among animal taxa, respectively, and reach 41 and 67% among tree species (Figure 7B).
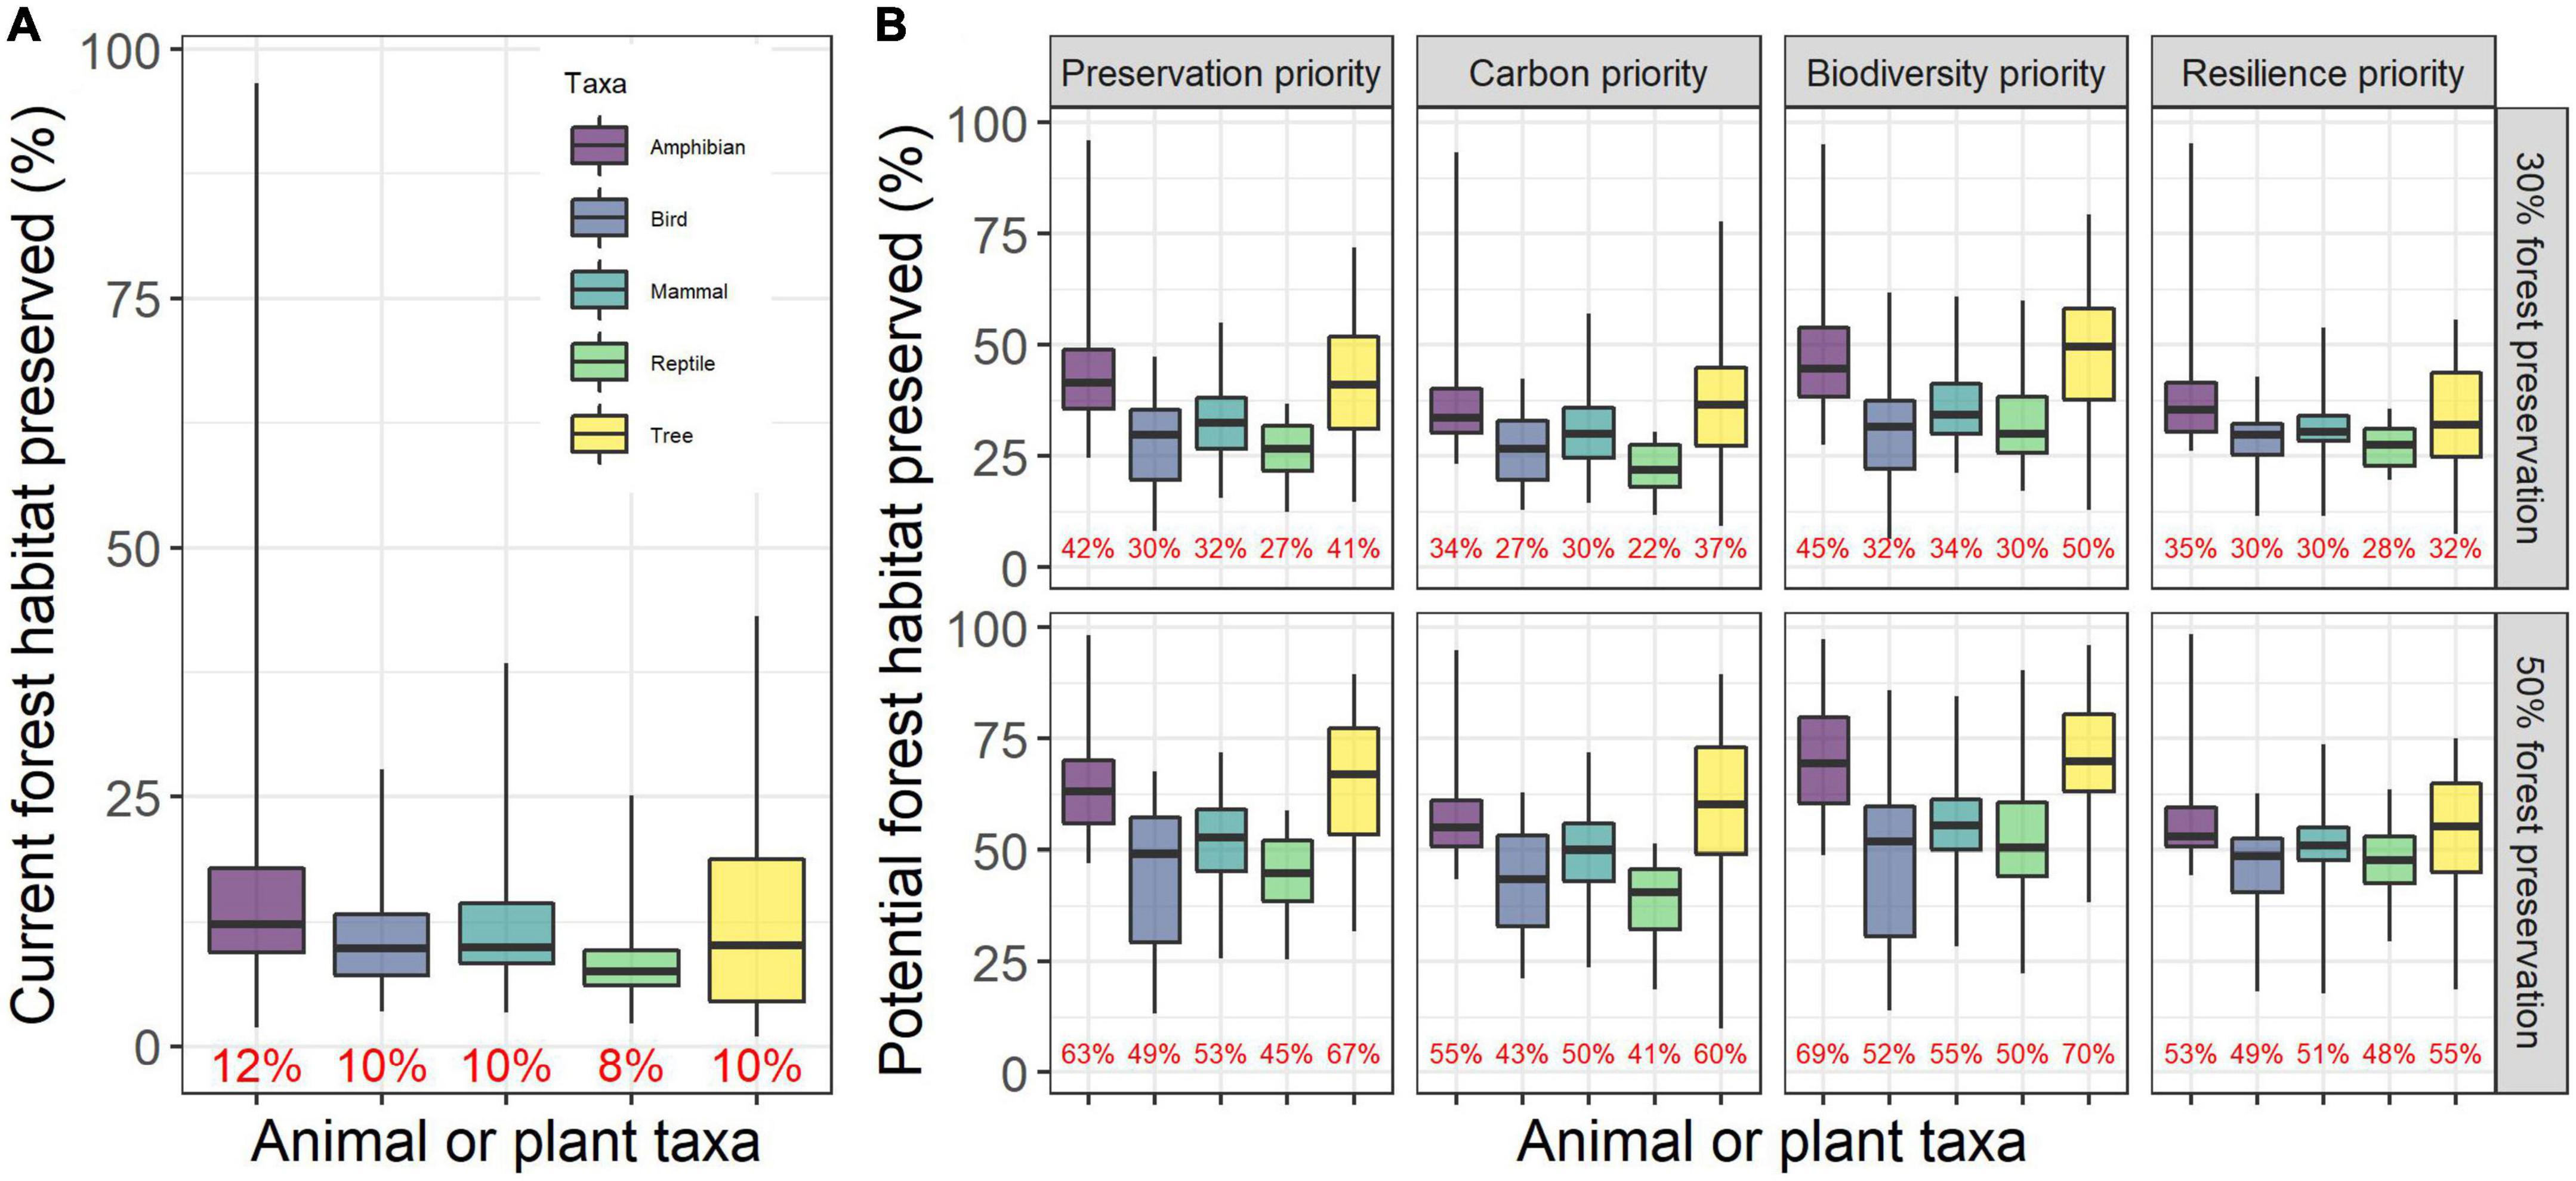
Figure 7. Current and potential protection of animal taxa and tree species forest habitat across Oregon. The percentage of each species’ forest habitat that (A) is currently protected and (B) would be protected by meeting preservation targets based on each priority. The median percentage of current and potential protected species habitat is provided for each taxon (red text). Boxplots depict medians (intra-box lines), 25th–75th percentiles (box edges), and 5th to 95th percentiles (whiskers). Animal and tree species habitat data were from the USGS GAP (2018) and Landscape Ecology Modeling Mapping and Analysis (Lemma) Team (2020), respectively.
Meeting these forest preservation targets would substantially increase forest habitat protection for threatened and endangered (T&E) species and other species of interest (Table 4). For example, only 8% of marbled murrelet (Brachyramphus marmoratus) and spotted owl (Strix occidentalis) forest habitat is currently protected, yet 36–44% would be protected if the 30% forest preservation target was met. Similarly, forest habitat protection for Canada lynx (Lynx canadensis) would increase from 12 to 40%, while it would increase from 34 to 55% for wolverines (Gulo gulo). Important non-T&E species such as wolves (Canis lupus) and beavers (Castor canadensis) would see forest habitat protection increase from 35 to 59% and from 10 to 40%, respectively, if this preservation target was met. These wolf and beaver habitat targets would help fulfill a recent proposal for rewilding the American West (Ripple et al., 2022). The additional habitat that could be protected by 2030 and 2050 increases dramatically for most of these species when forestlands are jointly prioritized based on carbon, biodiversity and climate resilience, which includes connectivity for animal movement.
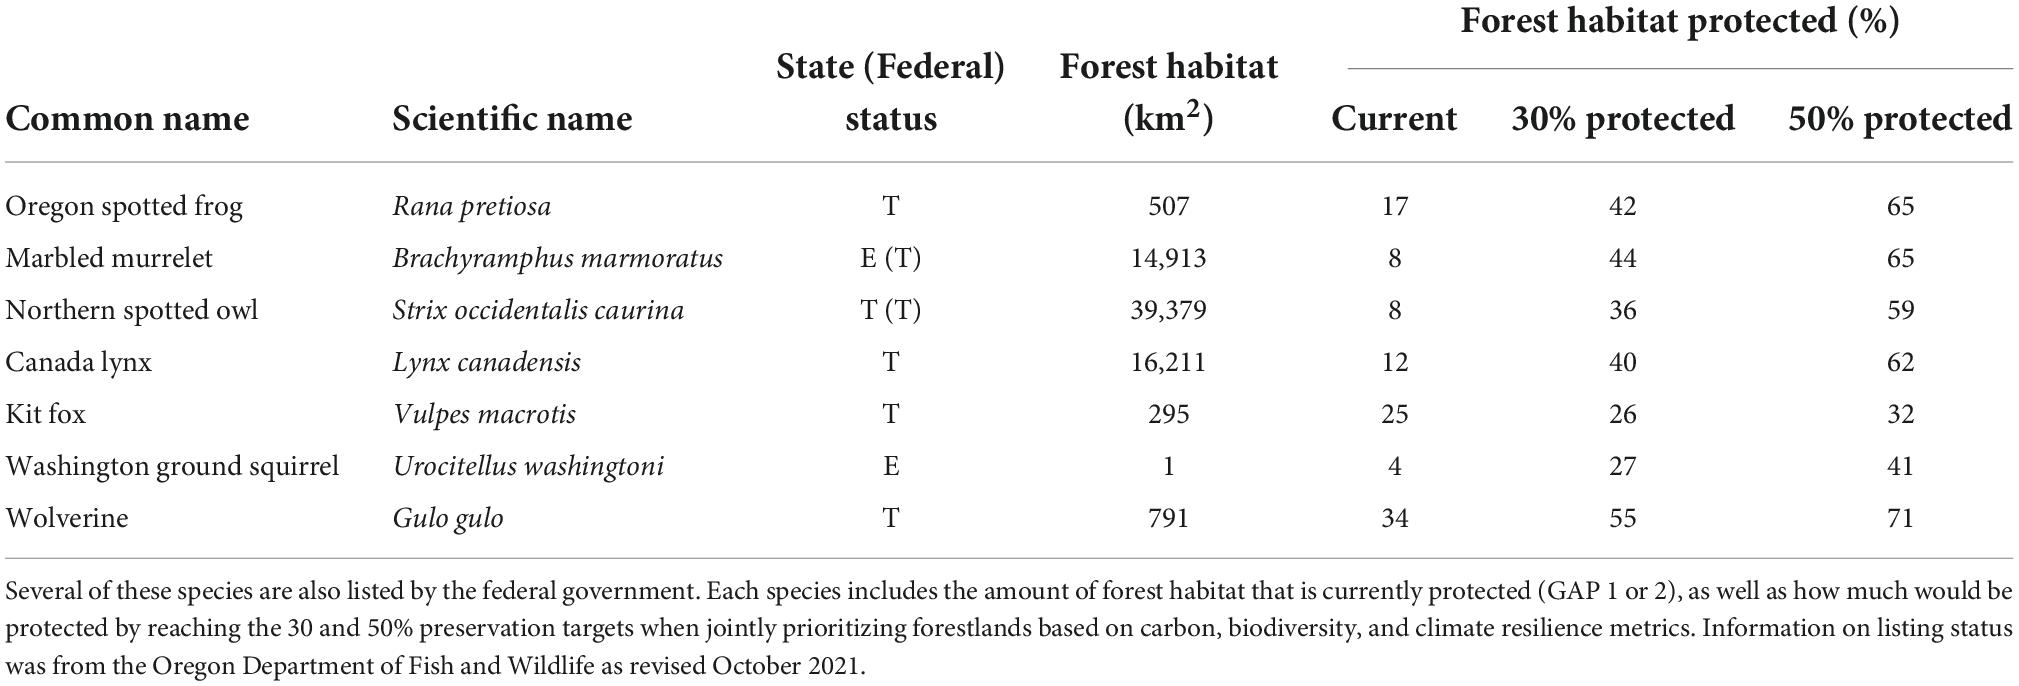
Table 4. Current and potential habitat protection for animal species listed as threatened (T) or endangered (E) by the state of Oregon.
Forestlands account for 78% (4.14 Mha) of the 5.3 Mha of surface drinking water source areas across Oregon, yet only 9% (0.37 Mha) of these forestlands are currently protected at GAP 1 or 2 levels (Table 5). This would increase to 27% by 2030 and 48% by 2050 if the high priority areas for carbon, biodiversity and resilience are protected (GAP 1 or 2). Most of the currently protected surface water source areas and the areas suitable for potential increases in protection are in the West Cascades, though protection of surface water sources areas would also increase notably in the Blue Mountains, Klamath Mountains, and Coast Range (Figure 8).
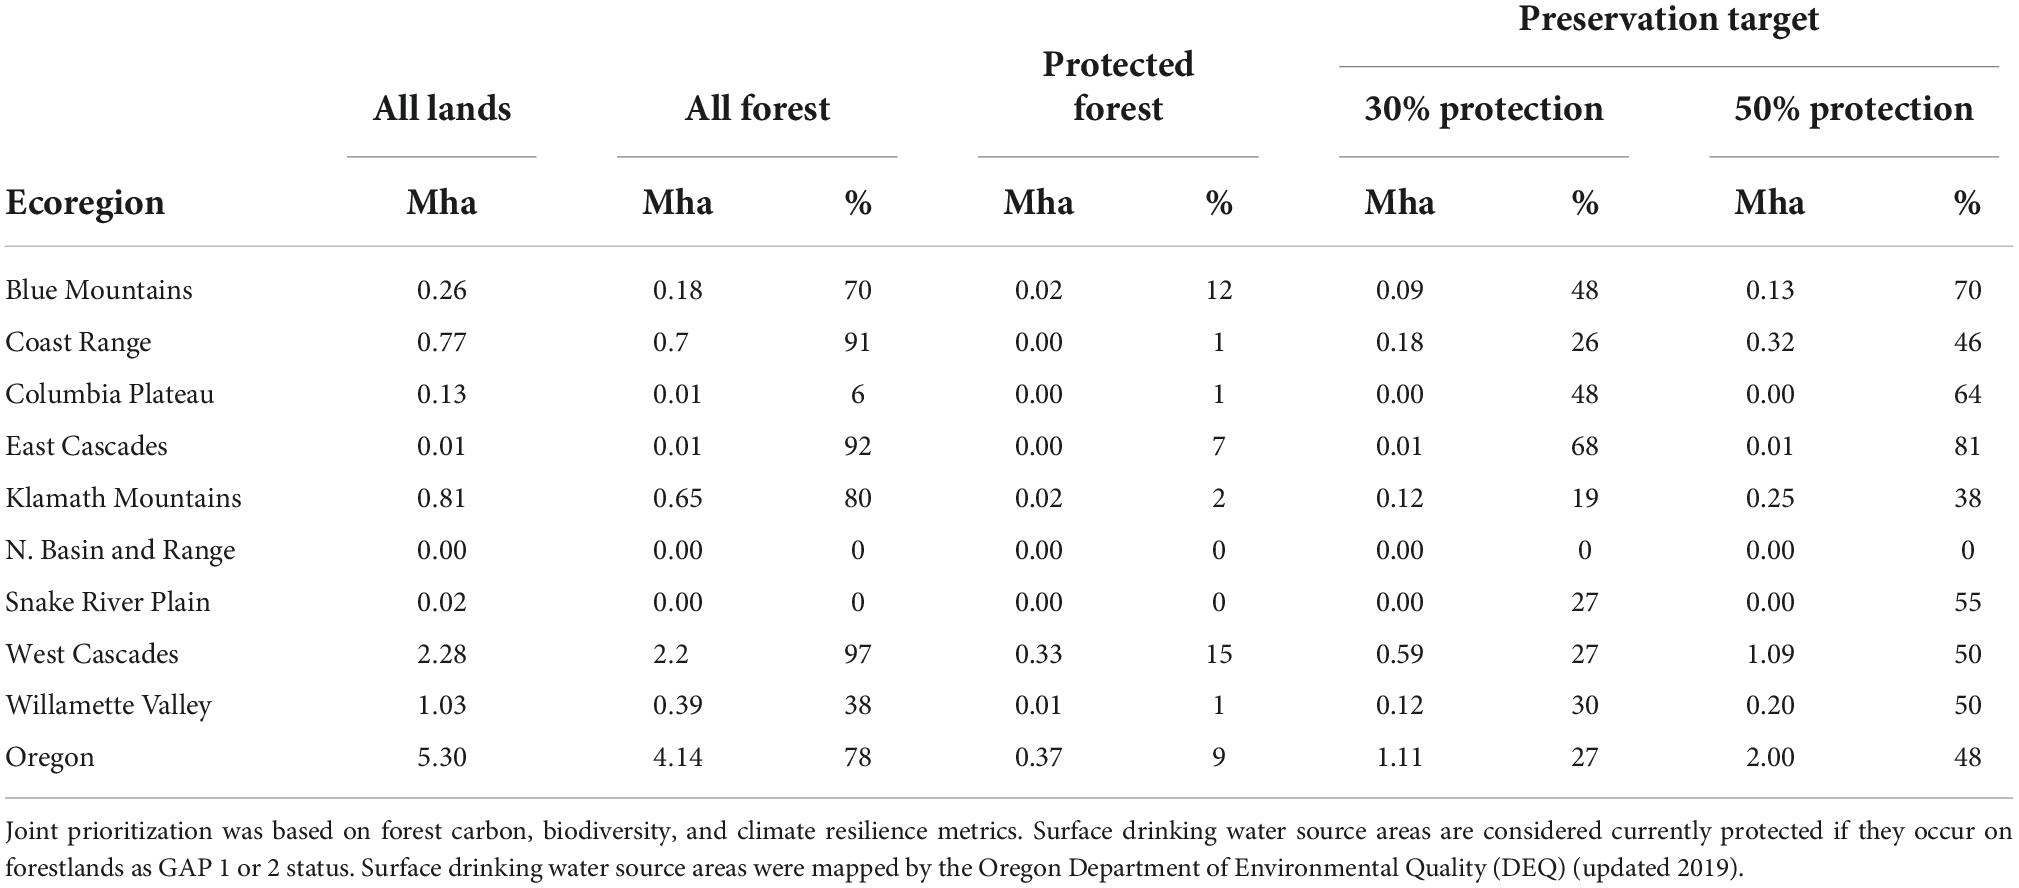
Table 5. Surface drinking water source areas for public water systems in each ecoregion’s forests, protected forests, and forests that would be protected by meeting preservation targets using joint prioritization.
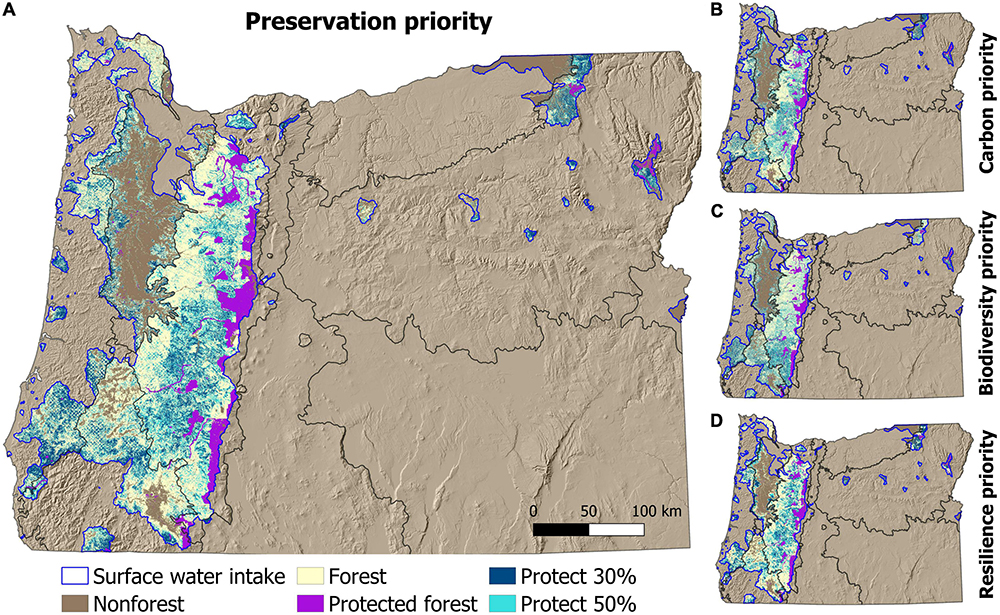
Figure 8. Current and potential protection of surface drinking water source areas in forestlands across Oregon. Potential protection is shown for the (A) forest preservation priority targets, as well as for (B) carbon, (C) biodiversity, and (D) climate resilience priority targets. Surface drinking water source area data were from the Oregon Department of Environmental Quality (Oregon Department of Environmental Quality [DEQ], 2019).
Discussion
Regional considerations for protecting carbon, biodiversity, and water
The IPCC AR6 (2022) states that “maintaining the resilience of biodiversity and ecosystem services at a global scale depends on effective and equitable conservation of approximately 30–50% of Earth’s land, freshwater and ocean areas, including currently near-natural ecosystems.” This acknowledges the multiple lines of evidence that maintaining ecological integrity of biodiversity is essential for addressing climate change effectively.
Accordingly, our analysis prioritizes areas within ecoregions to ensure biodiversity losses are reduced, or even enhanced in some areas through natural recovery of species and reintroductions, across the range of ecosystems. This approach also benefits carbon for climate mitigation, protects water availability and increases other ecosystem services.
A global application of the ecoregion approach found that temperate broadleaf, mixed, and conifer forests could achieve protection of half of the global forest area, and the majority of the ecoregions are categorized as “imperiled” or “could recover” (Dinerstein et al., 2017). This emphasizes the need for protection.
Here, we found that the current 1.3 Mha protected as GAP 1 or GAP 2 status would increase to 2.5 Mha by 2030 and 5 Mha by 2050 to meet the preservation targets. Federal lands account for the majority of the protected area needed, which would provide more permanence. Protecting high carbon priority forests from timber harvest (GAP 1) is critical to dampen the accelerating anthropogenic carbon dioxide emissions.
Mitigation strategies need to explicitly protect existing old-growth forests, and allow mature secondary forests to regrow to their carbon capacity. For climate mitigation using natural climate solutions, effectiveness is based on the time that a unit of biomass carbon is resident in a forest ecosystem stock and thus kept out of the atmosphere (Körner, 2017; Mackey et al., 2020). Oregon’s wet coastal forests have among the highest carbon residence times of any forests in the western USA (Berner et al., 2017). The large and old trees dominate forest carbon in temperate and tropical forests, and can maintain large carbon stocks and accumulation for centuries (Luyssaert et al., 2008; Hudiburg et al., 2009).
Oregon inventory data show that stand ages reach beyond 1,000 years, and public lands have far more stands older than 200 years than private lands do (Hudiburg et al., 2009). Mean and maximum live biomass are also higher on public lands. The maximum mean trend of biomass within each ecoregion occurred by the age of 300 years in the Coast Range to 430 years in the West Cascades and 600+years in the Klamath Mountains, and biomass continued to increase beyond these ages (Hudiburg et al., 2009). Ecoregions with the highest ecosystem carbon density in vegetation and soils are the Coast Range, West Cascades, and Klamath Mountains (330, 318 and 316 Mg C ha–1, respectively), with 55% of it in live tree carbon (180, 175, 173 Mg C ha–1) (Law et al., 2018). Oregon’s forest carbon stocks could almost double in the absence of disturbance (Hudiburg et al., 2009). These trends are influenced by harvest intensities, particularly in the Coast Range where the temperate rainforests have so little forestland protected, yet they are among the highest carbon dense forests in the world (Table 1).
Although we did not simulate changes in forest carbon and accumulation under future climate, our previous studies showed that preserving 50% of high priority forests by 2050 would triple the amount of carbon accumulation compared to current levels over the western United States (Law et al., 2021), accounting for projected climate effects including CO2 enhancement of photosynthesis constrained by nitrogen and carbon losses from forest fires. Because we prioritized relatively high carbon density within each forested ecoregion in our current study, the carbon accumulation is probably lower than if priorities were only in the ecoregions with the highest net accumulation (average of 1.4 compared to 4 to 8 Mg C ha–1 yr–1; Law et al., 2013).
A global study assumed an average accumulation rate of 0.14 MgC ha–1 yr–1 for boreal and temperate forests over the next decades (Griscom et al., 2017). Our estimate for natural forest management in Oregon is almost ten times the global value. We also found that limiting harvest to half of current levels on public lands and doubling harvest cycles to 80 years on private lands was three times more effective as a land use strategy than replanting and reforestation after cutting within current forest boundaries in Oregon (Law et al., 2018). The global study presents different results, highlighting the need for consistent approaches for national, regional and state-level analysis to refine estimates of forest carbon benefits.
There is concern that protecting areas that are vulnerable to increased drought and fire will be ineffective, however, species diversity, and threatened and endangered species still need habitat, refugia and connectivity with other protected areas. Wildfires tend to be patchy, and a majority of trees survive low to mixed-severity fires (Halofsky et al., 2011) that can be critical habitat, and burned forests still retain the vast majority of their carbon (Hudiburg et al., 2009; Law et al., 2018). When very few populations of a given species exist, the potential to recolonize areas with strong site fidelity is needed. The conservation of habitat suitability is necessary even if it is currently unoccupied by those populations (Merkle et al., 2022). Moreover, transboundary assessment of priority areas for preservation and connectivity is essential, as well as collaborative development of implementation plans that transcend political boundaries (Noss et al., 2012; Law et al., 2021).
Across the western U.S., federal forestlands are the dominant source of clean drinking water, and private forestlands are the most likely to experience land use change and impacts on water supplies (Liu et al., 2021). In western Oregon, where human population is concentrated and projected to continue growing rapidly, communities depend on drinking water from both private and federal forestlands. While there is concern about the impacts of wildfire on drinking water sources, forestlands tend to be adapted to these periodic disturbances and recover with minimal interventions. However, repeated harvesting, road networks and application of pesticides can expose aquatic systems to chronic stressors that continuously reduce water quantity and degrade water quality (e.g., soil erosion, sediment load, higher stream temperature) (Rieman et al., 2003; Karr et al., 2004).
As warming increases, mountain snowpack is expected to melt earlier in spring, which reduces drinking water supplies (Evan and Eisenman, 2021). The Cascade Mountains are expected to be among the most vulnerable mountain ranges because of their mild climate where even small temperature increases will result in precipitation falling as rain rather than snow, further reducing snowpack accumulation and increasing melt. This ecoregion is the largest area currently protecting forest drinking water sources at GAP 1 or 2 status and it is critical for additional preservation area for protection of habitat, biodiversity, and carbon. Protecting clean drinking water sources from extractions (mining, logging) is cost effective and essential, as loss of forest cover or conversion to plantations has been shown to reduce water supplies by up to 50% as compared to mature forests (Segura et al., 2020). Logging is still occurring in Oregon watersheds that feed surface water and replenish groundwater sources of drinking water.
In the drier Klamath and Blue Mountains ecoregions, dependence of water supplies on sufficient accumulated winter snowpack is amplified due to less rainfall. The mountains serve as crucial water collection sources for these areas. Mountains receive far more moisture than the lower elevation valleys and canyons that they eventually supply with water. As snow melts, it recharges soil water to support ecosystems through seasonally dry summers. The slow transfer of water sustains water supplies and maintains summer stream flows that in turn support high levels of biodiversity in aquatic and riparian systems. Mountain water is also of major importance to agriculture. In these seasonally dry forests, protecting forested watersheds will be crucial to the long-term water security of the region.
Older forests in Oregon’s watersheds exhibit greater water retention and improved late summer stream flows compared to managed plantations (Segura et al., 2020). Intact forests also tend to harbor more large and old trees, bolstering carbon stores and biodiversity services that large trees provide (Lutz et al., 2018; Plumtre et al., 2021). As warming increases, protecting the integrity of these intact forested watersheds would help sustain valuable ecosystem services, including a clean, reliable supply of water. Oregon’s largest protected area, the Eagle Cap Wilderness, demonstrates the tremendous value of a largely protected forested mountain range for providing a reliable source of clean water to the ecosystems and communities of northeast Oregon.
Some ecoregions will see declines and even biome shifts as warming continues, but this is somewhat counteracted by the positive effect of atmospheric CO2 on photosynthesis and lengthened growing seasons in the wetter ecoregions. The effects of increasing atmospheric CO2 will continue in spite of reaching greenhouse gas reduction targets because surface temperatures will not immediately return to previous levels and may persist for a millennium or more (Solomon et al., 2009). While strategic forest reserves for climate mitigation and adaptation by plants and animals may face near-term challenges, the urgency and benefits of protecting landscapes for community and ecosystem values is nonetheless very high as the world moves to transition away from fossil fuel pollution.
The diversity of ecoregions and forest communities within Oregon also suggests that systems will respond differently to warming across the region. Even within forest types, individual species have unique adaptations and vulnerability thresholds. In Oregon’s Coast Range, conversion of diverse conifer systems to Douglas-fir plantations has increased vulnerability to Swiss Needle Cast disease (Shaw et al., 2021), and climatic change may further exacerbate this vulnerability (Mildrexler et al., 2019). Moreover, young industrial plantations show a higher incidence of high severity fires, almost twice as many as on public lands (Levine et al., 2022). In other ecosystems, disturbance-induced shifts may facilitate changes in species composition, including shifts toward communities better adapted to changing climatic conditions. Taken as a whole, Oregon’s exceptional ecosystem diversity will help buffer its forests against large-scale shifts in ecosystems.
Improving measurement, reporting and verification
To initiate strategic reserves, consistent guidelines, definitions, and accounting rules need to be established. Similar to international requirements for monitoring, reporting and verification (MRV; Ellis and Moarif, 2015), there is a need to upgrade our measurement systems as recommended in national and international reports (e.g., Law et al., 2008; Ciais et al., 2014). Consistent, current metrics will help refine locations for reserves, establish baseline conditions, and monitor changes in plant and animal species, forest carbon and other metrics of condition. Updated metrics will also ensure reliability in protection agreements.
An executive order issued by President Biden in 2022 recognized the importance of mature and old-growth forests in limiting climate change and makes their conservation a national policy.1 The land management agencies are tasked with defining mature and old. Carbon per unit area ground (carbon density) is an essential climate variable for mitigation, and can be used to distinguish mature from young forests. Carbon density is computed from tree diameter and height and can be used to identify the inflection point at which the increase following stand-replacing disturbance begins to slow for a tree community within ecoregion. In addition, tree diameter and height are useful to infer site fertility and could be used to scale forest carbon potential in different environments. When assessing the mitigation potential of forests in a region, we must consider that carbon density and removal rates are strongly variable with edaphoclimatic conditions, even within the same forest type. Young forests have low carbon density compared to mature and old (Hudiburg et al., 2009). Age alone is not a good metric because it is not measured well in most regions or is approximated from tree diameter. Furthermore, age is a good indicator of the time since the last stand-replacing disturbance only in early successional stands with pioneer tree species. In late-successional stands with shade-tolerant trees (i.e., long suppression phases), maximum tree age is not necessarily related to disturbance. Long-term repeated measurements of ecosystems across the landscape/ecoregion provide a much more precise picture of carbon dynamics, like the repeated direct measurements of diameter and height in federal inventories (Forest Inventory and Analysis [FIA], 2014). In addition, these measurements are used to produce a metric of structural diversity that is important for biodiversity.
Coordination among federal, state and international programs are needed for consistency of repeated measurements, reporting, and verification. To inform strategic assessments and decision making, spatial datasets must represent environmental conditions consistently across the country at moderate to high spatial resolution (30–250 m) and must be updated at least every 5-year (e.g., for the federally mandated National Climate Assessment produced every 4 years), and include:
∘ Processed inventory data that use height and dbh in improved algorithms for estimating aboveground biomass carbon.
∘ More frequent maps of forest area, forest type, forest carbon stocks, forest age (young, mature, and old) and spatial estimates of uncertainty for each product.
∘ Consistent and repeated measurements of plant and animal species richness and habitat quality in a measurement system that is co-located or coincides with the forest inventory, and data reporting to a central database.
∘ Habitat connectivity data products.
∘ Ecosystem model projections of future forest carbon dynamics and vulnerabilities to drought, fire, and insects under various climate scenarios (transition model projection from research oriented to operational oriented analysis).
Socioeconomic and policy challenges and solutions
To some extent, forest management priorities on national forests have changed from timber harvest and maximizing wood production to conservation and adaptation to climate change (USDA Forest Service, 2022). These changes are well aligned with strategic forest reserves that can serve as focal areas of ecological integrity and genetic diversity that benefit adjacent areas (Greater Protected Areas). As our western US and Oregon analyses show, achieving protected area targets is a practical goal and does not require all federal forestlands. Many areas will remain outside protected areas, but these forests will experience long-term benefits from increased proximity to protected landscapes.
Forest ownership by public real estate investment trusts (REITs) and timber investment management organizations (TIMOs) have the goal of maximizing return on investment. In Canada and the United States, 60% of the timberland area owned by the top ten entities was in REITs in 2015. Over the past 40 years, as much as 304,000 hectares of Oregon’s non-industrial forest ownership has transferred to forest industries by buyouts and mergers, now dominated by a few industrial owners in each county (Willer, 2021). As of 2020, at least 40% of private forest lands are owned by investment companies as public or private REITs whose forestland portfolio is managed by TIMOs. The industry consists of investors or owners and corporate management that serves them, and it often subcontracts harvest, transport, reforestation and pesticide chemical application. Forest operations are compartmentalized. While REITs and TIMOs seek to monetize the value of timber harvest, they also have been involved in projects that monetize ecosystem services, carbon sequestration, and, in some cases, a land use change from forestry to development. Integrated forest companies own forestland and mills and they, on the other hand, depend on a consistent, predictable supply of wood. They view limits on harvest for ecosystem values as an encumbrance that impacts the bottom line. REITs, TIMOs and integrated forest product companies own the bulk of private forests in Oregon, but there are approximately 1.49 million hectares of family owned non-industrial forests that are enjoyed for privacy, wildlife, scenic values, water and, to a far lesser extent, harvest.
Currently, there is little incentive to manage private forestlands for ecosystem resilience to climate change impacts, biodiversity or carbon storage, and industrial management has resulted in significant losses of habitat and biodiversity and carbon stocks, and degraded water systems. Oregon’s private forests laws have lagged behind those in California and Washington for decades, and recent changes adopted in 2022 focus primarily on changes for threatened and endangered fish species, not climate mitigation, terrestrial biodiversity or drinking water supplies.
Land trusts have played a role in protecting Oregon’s private forestlands, yet their coverage area is growing but not yet substantial. With significant funding, land trusts could play a greater and important role in securing high-priority private forest lands from development and harvest. Land trusts typically use conservation easements to protect key private lands from extractive management and to protect certain values in perpetuity. This analysis provides a framework to spatially examine the value of private forestlands and prioritize efforts for the greatest climate mitigation and biodiversity protection benefits.
To sustainably achieve climate and conservation goals, projects must not lead to more emissions from deforestation and forest degradation (Nolan et al., 2021). To do so and be included in meeting preservation targets, lands should be protected at GAP 1 or GAP 2 status (IUCN 1a to VI). Roadless areas that are not currently inventoried should be inventoried to determine if they qualify.
Projects have to demonstrate permanence of protected forest carbon, and account for leakage and additionality. Regular assessment of permanence, leakage and additionality is essential for forest offsets programs to ensure there is not over-crediting (Anderegg et al., 2020). Moreover, carbon accounting among projects is needed to understand their contributions to meeting climate goals. Permanence can be addressed by requiring a portion of the credits (e.g., 20%) be set aside as a buffer in case natural disturbances occur in the project area (wildfire, beetle kill; Anderson et al., 2017). Leakage means that protecting one area of forest could result in cutting elsewhere, even in another country, and currently there is no international program to track it. Leakage could be addressed by assuming leakage exists and providing only partial credit for projects. Although a regulatory pathway is the typical approach to constraining what qualifies for meeting the intended goal with a minimum of unintended consequences, the requirement of additionality can hinder success in protecting private and indigenous forestlands. Additionality means one has to demonstrate that the climate benefits of preserving forests would not have occurred without the project. An option is to have science-based verification of proposed projects before they are approved, and if a proposed project cannot protect the whole area, then provide partial credit for the areas that are most likely to be protected with permanence. Accounting and incentives could be applied to ensure the protection targets are met at local to national scales. Offsets are just one of a number of ways (and not the best way from a climate mitigation perspective) in which forest ecosystem carbon removals from the atmosphere and accumulated carbon stocks can be used, accounted for, and forest stewards rewarded.
Conclusion
The most important action Oregon can take to mitigate climate change, reduce biodiversity losses, and protect watersheds for drinking water is to set aside existing forests. Reforestation or afforestation can be done too, but it takes decades for young trees to mature into net carbon sinks. Planting young trees will not result in much additional storage within the time forest carbon stocks need to increase in order to contribute to emission reduction and global warming targets.
The approach developed by Law et al. (2021) demonstrated the value of coupling forest carbon and biodiversity metrics into a spatially continuous prioritization framework that can be applied across large, diverse forested regions. Here, we improved the approach by adding a resilience metric that represents connectivity and topographic diversity, and used finer resolution (30 m) and more recent data to better resolve within-state variability in carbon, drinking water sources, and biodiversity and resilience metrics. An ecoregion-based approach along with resilience-based metrics will ensure species and habitat are protected and connected so that species can move to areas where they can survive and thrive as climate change intensifies.
The analysis identifies the potential for a well distributed forest reserve network within Oregon that captures unique ecological facets by ecoregion to achieve targets for protecting 30% of forests by 2030 and 50% by 2050. Protecting forest carbon, watersheds, and biodiversity are universally important priorities regionally, nationally and globally, and our framework could be applied in other regions for mitigation and adaptation to climate change.
Data availability statement
The datasets presented in this study can be found in online repositories. The names of the repository/repositories and accession number(s) can be found below: The forest prioritization dataset generated for this study will be publicly archived with PANGAEA (https://www.pangaea.de/). Further, the following existing dataset were analyzed for this study. Forest structure and composition data were from the Landscape Ecology Modeling Mapping and Analysis (Lemma) Team (https://lemma.forestry.oregonstate.edu/data). Forest disturbance data were from University of Maryland’s Global Forest Change dataset (https://earthengine.google.com/). Protected Area data were from the United States Geological Survey GAP Analysis program (https://doi.org/10.5066/P92QM3NT), as were species habitat maps (https://doi.org/10.5066/F7V122T2). Forest land management data were from the Oregon Department of Forestry (https://spatialdata.oregonexplorer.info/). Surface drinking water source data were from the Oregon Department of Environmental Quality (https://www.oregon.gov/deq/wq/programs/Pages/DWP-Maps.aspx).
Author contributions
BL: BL and LB: investigation and writing – original draft preparation. LB: data analysis and visualization. BL, LB, DM, WR, and RB: writing – review and editing. All authors have read and agreed to the published version of the manuscript.
Funding
RB was supported by the Oregon Community Foundation.
Acknowledgments
The authors thank Mary Wood and Doug Quirk from U Oregon and Polly Buotte from UC-Berkeley for reviewing an early draft.
Conflict of interest
The authors declare that the research was conducted in the absence of any commercial or financial relationships that could be construed as a potential conflict of interest.
Publisher’s note
All claims expressed in this article are solely those of the authors and do not necessarily represent those of their affiliated organizations, or those of the publisher, the editors and the reviewers. Any product that may be evaluated in this article, or claim that may be made by its manufacturer, is not guaranteed or endorsed by the publisher.
Supplementary material
The Supplementary Material for this article can be found online at: https://www.frontiersin.org/articles/10.3389/ffgc.2022.1028401/full#supplementary-material
Footnotes
- ^ https://www.federalregister.gov/documents/2022/04/27/2022-09138/strengthening-the-nations-forests-communities-and-local-economies
References
Anderegg, W. R., Trugman, A. T., Badgley, G., Anderson, C. M., Bartuska, A., Ciais, P., et al. (2020). Climate-driven risks to the climate mitigation potential of forests. Science 368:6497. doi: 10.1126/science.aaz7005
Anderson, C. M., Field, C. B., and Mach, K. J. (2017). Forest offsets partner climate-change mitigationwith conservation. Front. Ecol. Environ. 15:359–365. doi: 10.1002/fee.1515
Berner, L. T., Law, B. E., and Hudiburg, T. W. (2017). Water availability limits tree productivity, carbon stocks, and carbon residence time in mature forests across the western US. Biogeosciences 14, 365–378.
Buttrick, S., Popper, K., Schindel, M., McRae, B., Unnasch, B., Jones, A., et al. (2015). Conserving nature’s stage: Identifying resilient terrestrial landscapes in the Pacific Northwest. Portland, OR: The Nature Conservancy.
Carroll, C., Parks, S. A., Dobrowski, S. Z., and Roberts, D. R. (2018). Climatic, topographic, and anthropogenic factors determine connectivity between current and future climate analogs in North America. Glob. Change Biol. 24, 5318–5331. doi: 10.1111/gcb.14373
Ciais, P., Dolman, A. J., Bombelli, A., Duren, R., Peregon, A., Rayner, P. J., et al. (2014). Current systematic carbon-cycle observations and needs for implementing a policy-relevant carbon observation system. Biogeoscience 11, 3547–3602. doi: 10.5194/bg-11-3547-2014
Dinerstein, E., Olson, D., Joshi, A., Vynne, C., Burgess, N. D., Wikramanayake, E., et al. (2017). An ecoregion-based approach to protecting half the terrestrial realm. Bioscience 67, 534–545. doi: 10.1093/biosci/bix014
Donato, D. C., Campbell, J. L., and Fontaine, J. B. (2015). Ten years after the biscuit fire: Evaluating vegetation succession and post-fire management effects. Final Report JFSP. Olympia, WA: Washington State Department of Natural Resources.
Dowle, M., and Srinivasan, A. (2021). data.table: Extension of ‘data.frame’. R package version 1.14.2. Available online at: https://CRAN.R-project.org/package=data.table
Ellis, J., and Moarif, S. (2015). Identifying and addressing gaps in the UNFCCC reporting framework, OECD/IEA climate change expert group papers, no. 2015/07. Paris: OECD Publishing. doi: 10.1787/5jm56w6f918n-en
Evan, A., and Eisenman, I. (2021). A mechanism for regional variations in snowpack melt under rising temperature. Nat. Clim. Change 11, 326–330. doi: 10.1038/s41558-021-00996-w
Forest Inventory and Analysis (2014). The forest inventory and analysis database: Database description and user guide version 6.0.1 for phase 3. Washington, DC: U.S. Department of Agriculture, Forest Service.
Frissell, C. A. (2013). Aquatic resource protections in the northwest forest plan: Evaluating potential consequences of proposed riparian reserve reductions for clean water, streams and fish. Corvallis, OR: Report prepared for the Coast Range Association.
Griscom, B. W., Adams, J., Ellis, P. W., Houghton, R. A., Lomax, G., Miteva, D. A., et al. (2017). Natural climate solutions. Proc. Natl. Acad. Sci. U.S.A. 114, 11645–11650.
Halofsky, J. E., Donato, D. C., Hibbs, D. E., Campbell, J. L., Donaghy Cannon, M., Fontaine, J. B., et al. (2011). Mixed-severity fire regimes: Lessons and hypotheses from the Klamath-Siskiyou Ecoregion. Ecosphere 2, 1–19. doi: 10.1890/ES10-00184.1
Hansen, M. C., Potapov, P. V., Moore, R., Hancher, M., Turubanova, S. A., Tyukavina, A., et al. (2013). High-resolution global maps of 21st-century forest cover change. Science 342:850. doi: 10.1126/science1244693
Hijmans, R. J. (2019). raster: Geographic analysis and modeling. R package Version 3.0-12. Available online at: http://CRAN.R-project.org/package=raster
Hijmans, R. J. (2022). terra: Spatial data analysis. R package Version 1.5-21. Available online at: https://CRAN.Rproject.org/package=terra
Hudiburg, T., Law, B. E., Turner, D. P., Campbell, J. L., Donato, D. C., and Duane, M. (2009). Carbon dynamics of Oregon and Northern California forests and potential land-based carbon storage. Ecol. Appl. 19, 163–180. doi: 10.1890/07-2006.1
IPCC (2022). “Climate change 2022: Impacts, adaptation, and vulnerability. Contribution of working group ii to the sixth assessment report of the intergovernmental panel on climate change,” in Summary for policymakers, eds H.-O. Pörtner, D. C. Roberts, E. S. Poloczanska, K. Mintenbeck, M. Tignor, A. Alegría, et al. (Cambridge: Cambridge University Press).
IUCN (2013). “IUCN WCPA best practice guidance on recognising protected areas and assigning management categories and governance types,” in Best practice protected area guidelines series no. 21, ed. N. Dudley (Gland: IUCN).
Karr, J. R., Rhodes, J. J., Minshall, G. W., Hauer, F. R., Beschta, R. L., Frissell, C. A., et al. (2004). The effects of postfire salvage logging on aquatic ecosystems in the American West. Bioscience 54, 1029–1033. doi: 10.1641/0006-35682004054[1029:TEOPSL]2.0CO;2
Landscape Ecology Modeling Mapping and Analysis (Lemma) Team (2020). Gradient nearest neighbor (GNN) raster dataset (version 2020.01). Modeled forest vegetation data using direct gradient analysis and nearest neighbor imputation. Available online at: https://lemma.forestry.oregonstate.edu/data
Law, B. E., Arkebauer, T., Campbell, J. L., Chen, J., Sun, O., Schwartz, M., et al. (2008). Terrestrial carbon observations: Protocols for vegetation sampling and data submission. Report 55, global terrestrial observing system. Rome: FAO, 87.
Law, B. E., Berner, L. T., Buotte, P. C., Mildrexler, D. J., and Ripple, W. J. (2021). Strategic forest reserves can protect biodiversity in the western United States and mitigate climate change. Nat. Commun. Earth Environ. 2:254. doi: 10.1038/s43247-021-00326-0
Law, B. E., Hudiburg, T. W., Berner, L. T., Kent, J. J., Buotte, P. C., and Harmon, M. E. (2018). Land use strategies to mitigate climate change in carbon dense temperate forests. Proc. Natl. Acad. Sci. U.S.A. 115, 3663–3668. doi: 10.1073/pnas.1720064115
Law, B. E., Hudiburg, T., and Luyssaert, S. (2013). Thinning effects on forest productivity: Consequences of preserving old forests and mitigating impacts of fire and drought. Plant Ecol. Divers. 6, 73–85. doi: 10.1080/17550874.2012.679013
Law, B. E., Moomaw, W. R., Hudiburg, T. W., Schlesinger, W. H., Sterman, J. D., and Woodwell, G. W. (2022). Creating strategic reserves to protect forest carbon and reduce biodiversity losses in the United States. Land 11:721. doi: 10.3390/land11050721
Lawler, J. J., Ruesch, A., Olden, J. D., and McRae, B. H. (2013). Projected climate-driven faunal movement routes. Ecol. Lett. 16, 1014–1022. doi: 10.1111/ele.12132
Levine, J. I., Collins, B. M., Steel, J. L., de Valpine, P., and Stevens, S. L. (2022). High incidence of higher severity fire in and near industrially managed forests. Front. Ecol. Environ. 20:397–404. doi: 10.1002/fee.2499
Liu, N., Caldwell, P. V., Dobbs, G. R., Miniat, C. F., Bolstad, P. V., Nelson, S. A., et al. (2021). Forested lands dominate drinking water supply in the conterminous United States. Environ. Res. Lett. 16:084008. doi: 10.1088/1748-9326/ac09b0
Lutz, J. A., Furniss, T. J., Johnson, D. J., Davies, S. J., Allen, D., Alonso, A., et al. (2018). Global importance of large-diameter trees. Glob. Ecol. Biogeogr. 27, 849–864. doi: 10.1111/geb.12747
Luyssaert, S., Schulze, E. D., Börner, A., Knohl, A., Hessenmöller, D., Law, B. E., et al. (2008). Old-growth forests as global carbon sinks. Nature 455, 213–215. doi: 10.1038/nature07276
Mackey, B., Kormos, C. F., Keith, H., Moomaw, W. R., Houghton, R. A., Mittermeier, R. A., et al. (2020). Understanding the importance of primary tropical forest protection as a mitigation strategy. Mitigation adaptation strat. Glob. Change 25, 763–787.
Merkle, J. A., Abrahms, B., Armstrong, J. B., Sawyer, J., Costa, D. P., and Chalfoun, A. D. (2022). Site fidelity as a maladaptive behavior in the anthropocene. Front. Ecol. Environ. 20:187–194. doi: 10.1002/fee.2456
Mildrexler, D. J., Shaw, D. C., and Cohen, W. B. (2019). Short-term climate trends and the Swiss needle cast epidemic in Oregon’s public and private coastal forestlands. For. Ecol. Manag. 432, 501–513. doi: 10.1016/j.foreco.2018.09.025
Nelson, M. D., Riitters, K. H., Coulston, J. W., Domke, G. M., Greenfield, E. J., Langner, L. L., et al. (2020). Defining the United States land base: A technical document supporting the USDA forest service 2020 RPA assessment. General Technical Reports NRS–191. Madison, WI: USDA Forest Service, Northern Research Station. doi: 10.2737/NRS-GTR-191
Nolan, C. J., Field, C. B., and Mach, K. J. (2021). Constraints and enablers for increasing carbon storage in the terrestrial biosphere. Nat. Rev. Earth Environ. 2, 436–446. doi: 10.1038/s43017-021-00166-8
Noss, R. F., Dobson, A. P., Baldwin, R., Beier, P., Davis, C. R., DellaSala, D. A., et al. (2012). Bolder thinking for conservation. Conserv. Biol. 26:1. doi: 10.1111/j.1523-1739.2011.01738.x
Omernik, J. M., and Griffith, G. E. (2014). Ecoregions of the conterminous United States: Evolution of a hierarchical spatial framework. Environ. Manag. 54, 1249–1266. doi: 10.1007/s00267-014-0364-1
Oregon Department of Environmental Quality [DEQ] (2019). Surface water drinking water source areas in Oregon dataset. Available online at: https://www.oregon.gov/deq/wq/programs/Pages/DWP-Maps.aspx (accessed June 9, 2022).
Oregon Department of Fish and Wildlife (2021). Threatened, endangered, and candidate fish and wildlife species [Online]. Available online at: https://www.dfw.state.or.us/wildlife/diversity/species/threatened_endangered_candidate_list.asp (accessed June 2022).
Oregon Department of Forestry (2015). Oregon land management – 2015. Available online at: https://spatialdata.oregonexplorer.info/geoportal/ (accessed February 2022).
Oregon Division of State Lands (2021). Elliott state research forest habitat conservation plan. 234.
Pebesma, E. J. (2018). Simple features for R: Standardized support for spatial vector data. R. J. 10, 439–446.
Plumtre, A. J., Baisero, D., Belote, R. T., Vázquez-Domínguez, E., Faurby, S., Jȩdrzejewski, W., et al. (2021). Where might we find ecologically intact communities? Front. For. Glob. Change 4:626635. doi: 10.3389/ffgc.2021.626635
Pollock, L. J., Thuiller, W., and Jetts, W. (2017). Large conservation gains possible for global biodiversity facets. Nature 546, 141–144. doi: 10.1038/nature22368
Pörtner, H. –O., Sholes, R. J., Agard, J., Archer, E., Arneth, A., Bai, X., et al. (2021). IPBES-IPCC co-sponsored workshop report on biodiversity and climate change. Bonn: IPBES and IPCC. doi: 10.5281/zenodo.4782538
Qgis Org (2021). QGIS geographic information system. QGIS Association. Available online at: http://www.qgis.org
R Core Team (2021). R: A language and environment for statistical computing. Vienna: R Foundation for Statistical Computing.
Rieman, B. E., Lee, D., Burns, D., Gresswell, R., Young, M., Stowell, R., et al. (2003). Status of native fishes in the western United States and issues for fire and fuels management. For. Ecol. Manage. 178, 197–211. doi: 10.1016/S0378-1127(03)00062-8
Ripple, W. J., Wolf, C., Phillips, M. K., Beschta, R. L., Vucetich, J. A., Kauffman, B., et al. (2022). Rewilding the American West. Bioscience 72, 931–935. doi: 10.1093/biosci/biac069
Segura, C., Bladon, K. D., Hatten, J. A., Jones, J. A., Hale, V. C., and Ice, G. G. (2020). Long-term effects of forest harvesting on summer low flow deficits in the coast range of Oregon. J. Hydrol. 585:124749. doi: 10.1016/j.jhydrol.2020.124749
Shaw, D. C., Ritóková, G., Lan, Y.-H., Mainwaring, D. B., Russo, A., Comeleo, R., et al. (2021). Persistence of the swiss needle cast outbreak in oregon coastal douglas-fir and new insights from research and monitoring. J. For. 119, 407–421. doi: 10.1093/jfore/fvab011
Solomon, S., Plattner, G.-K., Knutti, R., and Friedlingstein, P. (2009). Irreversible climate change due to carbon dioxide emissions. Proc. Nat. Acad. Sci. U.S.A. 106, 1704–1709. doi: 10.1073/pnas.0812721106
Turner, D. P., Ritts, W. D., Yang, Z., Kennedy, R. E., Cohen, W. B., Duane, M. V., et al. (2011). Decadal trends in net ecosystem production and net ecosystem carbon balance for a regional socioecological system. For. Ecol. Manage. 262, 1318–1325. doi: 10.1016/j.foreco.2011.06.034
US Forest Servic (2021). Forest plans amendment. Forest management direction for large diameter trees in eastern oregon and southeastern washington. Environmental assessment. Portland, OR: USDA, Forest Service, Pacific Northwest Region.
USDA Forest Service (2022). USDA forest service climate adaptation plan. Available online at: https://www.usda.gov/sites/default/files/documents/4_NRE_FS_ClimateAdaptationPlan_2022.pdf (accessed August 19, 2022).
USGS GAP (2018). Gap analysis project species habitat maps CONUS_2001. Reston, VA: U.S. Geological Survey. doi: 10.5066/F7V122T2
USGS GAP (2020). Protected areas database of the United States (PAD-US) 2.1: U.S. geological survey data release. Reston, VA: U.S. Geological Survey. doi: 10.5066/P92QM3NT
Whittaker, R. H. (1960). Vegetation of the Siskiyou Mountains. Ecol. Monogr. 30, 279–338. doi: 10.2307/1943563
Keywords: forests, carbon, biodiversity, drinking water, resilience, climate mitigation, adaptation
Citation: Law BE, Berner LT, Mildrexler DJ, Bloemers RO and Ripple WJ (2022) Strategic reserves in Oregon’s forests for biodiversity, water, and carbon to mitigate and adapt to climate change. Front. For. Glob. Change 5:1028401. doi: 10.3389/ffgc.2022.1028401
Received: 26 August 2022; Accepted: 17 November 2022;
Published: 05 December 2022.
Edited by:
Brendan George Mackey, Griffith University, AustraliaReviewed by:
Alfredo Di Filippo, University of Tuscia, ItalyAndreas Fichtner, Leuphana University Lüneburg, Germany
Copyright © 2022 Law, Berner, Mildrexler, Bloemers and Ripple. This is an open-access article distributed under the terms of the Creative Commons Attribution License (CC BY). The use, distribution or reproduction in other forums is permitted, provided the original author(s) and the copyright owner(s) are credited and that the original publication in this journal is cited, in accordance with accepted academic practice. No use, distribution or reproduction is permitted which does not comply with these terms.
*Correspondence: Beverly E. Law, YmV2Lmxhd0BvcmVnb25zdGF0ZS5lZHU=