 Diana H. Mayne
 Nisa Karimi
 Elsie M. Cruywagen
 Patrick Cole5†
- 1School of Animal, Plant and Environmental Sciences, University of the Witwatersrand, Johannesburg, South Africa
- 2Department of Botany, University of Wisconsin, Madison, WI, United States
- 3Forestry and Agricultural Biotechnology Institute (FABI), University of Pretoria, Pretoria, South Africa
- 4Agricultural Research Council, Pretoria, South Africa
- 5Council for Geoscience, Pretoria, South Africa
- 6Department of Statistics, Nelson Mandela University, Gqeberha, South Africa
Climate variability and resilience remain gaps in tree research, challenged by the interacting factors in climate change, long-term resilience and the influence of evolutionary legacy effects. In a multidisciplinary approach using 90-year (1930–2020) climate-growth data, we investigated the dynamics of climate variability on growth and resilience of the tropical African baobab (Adansonia digitata) at the range edge in climate-variable, southeast Africa. The main driver of climate variability, ENSO (El Niño-Southern Oscillation), triggered 83% of droughts exacerbated by positive Indian Ocean Dipole (pIOD) events. Growth over 90 years was positively correlated with maximum temperature and increased after the 1976–1977 Global Warming Shift. The influence of warming was compromised by climate variability and extreme events. Although growth is a measure of adaptive capacity, accelerated growth over the past 20 years contrasted with dehydration, canopy dieback and a novel Didymella pathogen. Resilience was contingent on high genetic diversity (polyploidy and heterozygosity) and Neotropical legacy effects of stem water storage and longevity trade-offs of low growth, recruitment and reproduction. The evolution of resprouting in disturbed, fire-prone ecosystems and bark regeneration increased recovery from disturbance. As resource opportunists, baobabs adopted a fast-slow survival strategy. Rainfall and warming enhanced growth while low and variable rainfall favoured a conservative, low growth-higher survival strategy. Low rainfall, climate extremes and topography increased mortality risk. Mortality was higher at lower elevations on site and regionally. Low growth may conserve the baobab in climate warming but the southern hemisphere tropics is one of two identified global hotspots with amplified hot years. The heightened disturbance predicted from increased climate variability, hot droughts and landfalling tropical cyclones magnifies mortality risk for “Africa’s favourite tree.”
Introduction
Multiple interacting factors affect tree response to climate, including evolutionary and environmental influences on adaptation and survival from species-specific traits, trade-offs, ecosystem processes, and climate dynamics (Brodribb et al., 2020). The “highly uncertain” consequences of climate are a major obstacle to progress (Hartmann et al., 2018), constrained by the limited attention to climate drivers, long-term precipitation patterns (O’Brien et al., 2014), and dependence on means instead of climate variability and extremes (Seddon et al., 2016). Climate change and rising temperatures, elevated CO2, water stress and disturbance from drought, pathogen outbreaks and topographic variations escalate vulnerability (Allen et al., 2015; Brodribb et al., 2020). Although climate variability was identified as a major contributor to tree decline and mortality over forty years ago (White, 1986), the impact of climate fluctuations and resilience remain overlooked, especially in long-lived, tropical species with long generation times where recovery time may be significant (Schwalm et al., 2017; Willis et al., 2018). Conserving resilience has thus become a “key priority” in tropical species and in forested ecosystems (Willis et al., 2018).
Recording climate drivers and disturbance like drought and mortality, or recovery, requires long-term datasets. According to the World Meteorological Organization [WMO] (2017), the statistical minimum for a viable climate dataset is 30 years, but may not capture variability and extremes in driver and response (Smith, 2011). Modelling is unrealistic (Allen et al., 2015; IPCC, 2021) or oversimplified, to capture the complexity of drought-induced mortality (Hartmann et al., 2018), climate extremes (Reichstein et al., 2013), and the timing of progressive dieback (White, 1986). Understanding response and resilience in trees and ecosystems to drivers of climate variability, notably the ocean-atmosphere coupled El NinϷo-Southern Oscillation (ENSO) which dominates pan-tropical climate interactions and variability (Cai et al., 2019) remains an obstacle to progress.
Although experimental findings have established greater mortality from hydraulic failure in drought (Adams et al., 2017), response to climate is complex. Research is impeded by the reproducibility of natural climate variability, acclimation from past conditions, and the use of average conditions (Gutschick and BassiriRad, 2010). Adaptation may be significant in tropical species with long generation times and several driving and response variables adding to the complexity (Heisler and Weltzin, 2006; Box 1). These include the influence of slope, soils and runoff (Piearce et al., 1994; McDowell et al., 2008; Brodribb et al., 2020), genotypic and phenotypic variations in drought tolerance (Heisler and Weltzin, 2006), increased disturbance from pathogen outbreaks (McDowell et al., 2020), historic variability and timing of disturbance (Heisler and Weltzin, 2006) and the “critical” but overlooked recovery time (Schwalm et al., 2017; Brodribb et al., 2020). Reliance on single drought events cannot address the long-term effects of climate stress and response that may be significant to recovery and resilience (Matusick et al., 2018). The evolutionary context remains a major gap in research, including the nature and consequences of legacy effects from biogeography, species-specific traits and adaptation to previous climate warming episodes (Cavender-Bares et al., 2016).
| BOX 1 Glossary. |
| Climate Mean: Mean monthly value of climate data comprising a minimum of 3 consecutive decades (World Meteorological Organization [WMO], 2017). |
| Climate Variability: Climate variability is a dynamic component of climate that includes the temporal and spatial climate anomalies inherent in all ecosystems which extend beyond mean conditions (ibid). Temporal variability includes intra-seasonal, seasonal, interannual, decadal, random, or discontinuous variability (Nicholson, 2011). |
| Dieback: Dieback is a drought-adaptation strategy prevalent in semi-arid areas where hydraulically vulnerable but expendable leaves, twigs and branches are “sacrificed” to mitigate water loss in the more vulnerable stem; described as a cost-effective strategy in coping with water stress (Tyree et al., 1993). |
| Disturbance: Disturbance is a discrete event or regime that disrupts the population and ecosystem by altering the resources and physical environment. It includes climate variability, drought, heatwaves, frost, flooding, fire, landscape, and biotic disturbance (deforestation, herbivory, pests and pathogens, harvesting). |
| Drought: Unlike aridity, drought is a distinct episodic event with anomalous low rainfall, influenced by the nature and timing of events. It can be meteorological (rainfall deficiency) or hydrological (reduced infiltration) or both. The result is low soil moisture amplified by topography and runoff (Trenberth et al., 2014). |
| Evolutionary legacy effects: The biogeographic influence in the evolution and adaptation of response and resilience. |
| Resilience: Ability to resist, adapt to, or recover after, disturbance. |
| Variables: Driving variables: past and present climate, rainfall variability, seasonality, dry intervals, time lags, migration, disturbance, hydrology, topography, ecosystem diversity, soil type, and rooting depth. Response Variables: physiology, growth, recovery rates, genotypic and phenotypic variation, and buffering mechanisms. |
The African baobab (Adansonia digitata), described as “Africa’s favourite tree” (New Scientist, 1991), is widely assumed to be a “xeric succulent” which survives through use of a “seasonal reservoir” of stored water during the dry season, instead of a woody forest tree and migrant to semi-arid regions (Wickens and Lowe, 2008). Response to climate variations and disturbance can be traced to the biogeographic origins in the seasonally dry Neotropics where 90% of the Bombacoideae, a subfamily within the family Malvaceae, remain (Carvalho-Sobrinho et al., 2016). Water storage is a common trait in the Neotropics because of the adaptive benefit during the 5-month-long dry season (Lopez and Kursar, 2003). Evolutionary legacy effects include traits of parenchymatous wood (Zizka et al., 2020), a narrow hydraulic safety margin (HSM) which potentially increases drought vulnerability (Choat et al., 2012; Supplementary Table 1), and cortical photosynthesis. The traits are shared with the Neotropical genus, Cavanillesia (Wolfe et al., 2016; Wolfe, 2017) within the same clade as the Adansonia (Carvalho-Sobrinho et al., 2016).
Although baobabs have far higher water content values (500–800%) than other trees (30–300%) (Tsoumis, 1991), findings show pronounced economy in stem water use ranging from 2 to ∼6% in A. digitata (Fenner, 1980; Van den Bilcke et al., 2013). Drought-deciduousness also limits water loss (Chapotin et al., 2006a; Van den Bilcke et al., 2013). As the low density, parenchymatous (69–88%) wood operates near turgor-loss point, moderate change to the stem water content may affect biomechanical stability because of the low elastic modulus of wood (Chapotin et al., 2006b). The primary function of water storage is to provide the necessary turgidity for mechanical integrity and survival (ibid). Stored water includes a dimorphic root system which contains 68% of the ∼80% total plant water in the taproots of juveniles (Van den Bilcke et al., 2013). Mature baobabs have a widespread, shallow root system estimated at 40–100 m around the stem (Wickens and Lowe, 2008) which can rapidly absorb water from surface soils and exploit rainfall pulses and run-off from heavy rainfall (Fenner, 1980). Green, photosynthetic tissue or cortical photosynthesis in the outermost layer of baobab bark (Baum, 1995; Kotina et al., 2017; Figure 1) avoids carbon starvation during stomatal closure in dormancy or drought by enabling recycled carbon and atmospheric CO2 through bark lenticels (Van den Bilcke et al., 2013, Kotina et al., 2017) without water loss (Simbo et al., 2013). The double syndrome may increase carbohydrates during drought and high temperatures or when trees are leafless and leaf photosynthesis does not support hydraulic function (Cernusak and Cheeseman, 2015; Vandegehuchte et al., 2015).
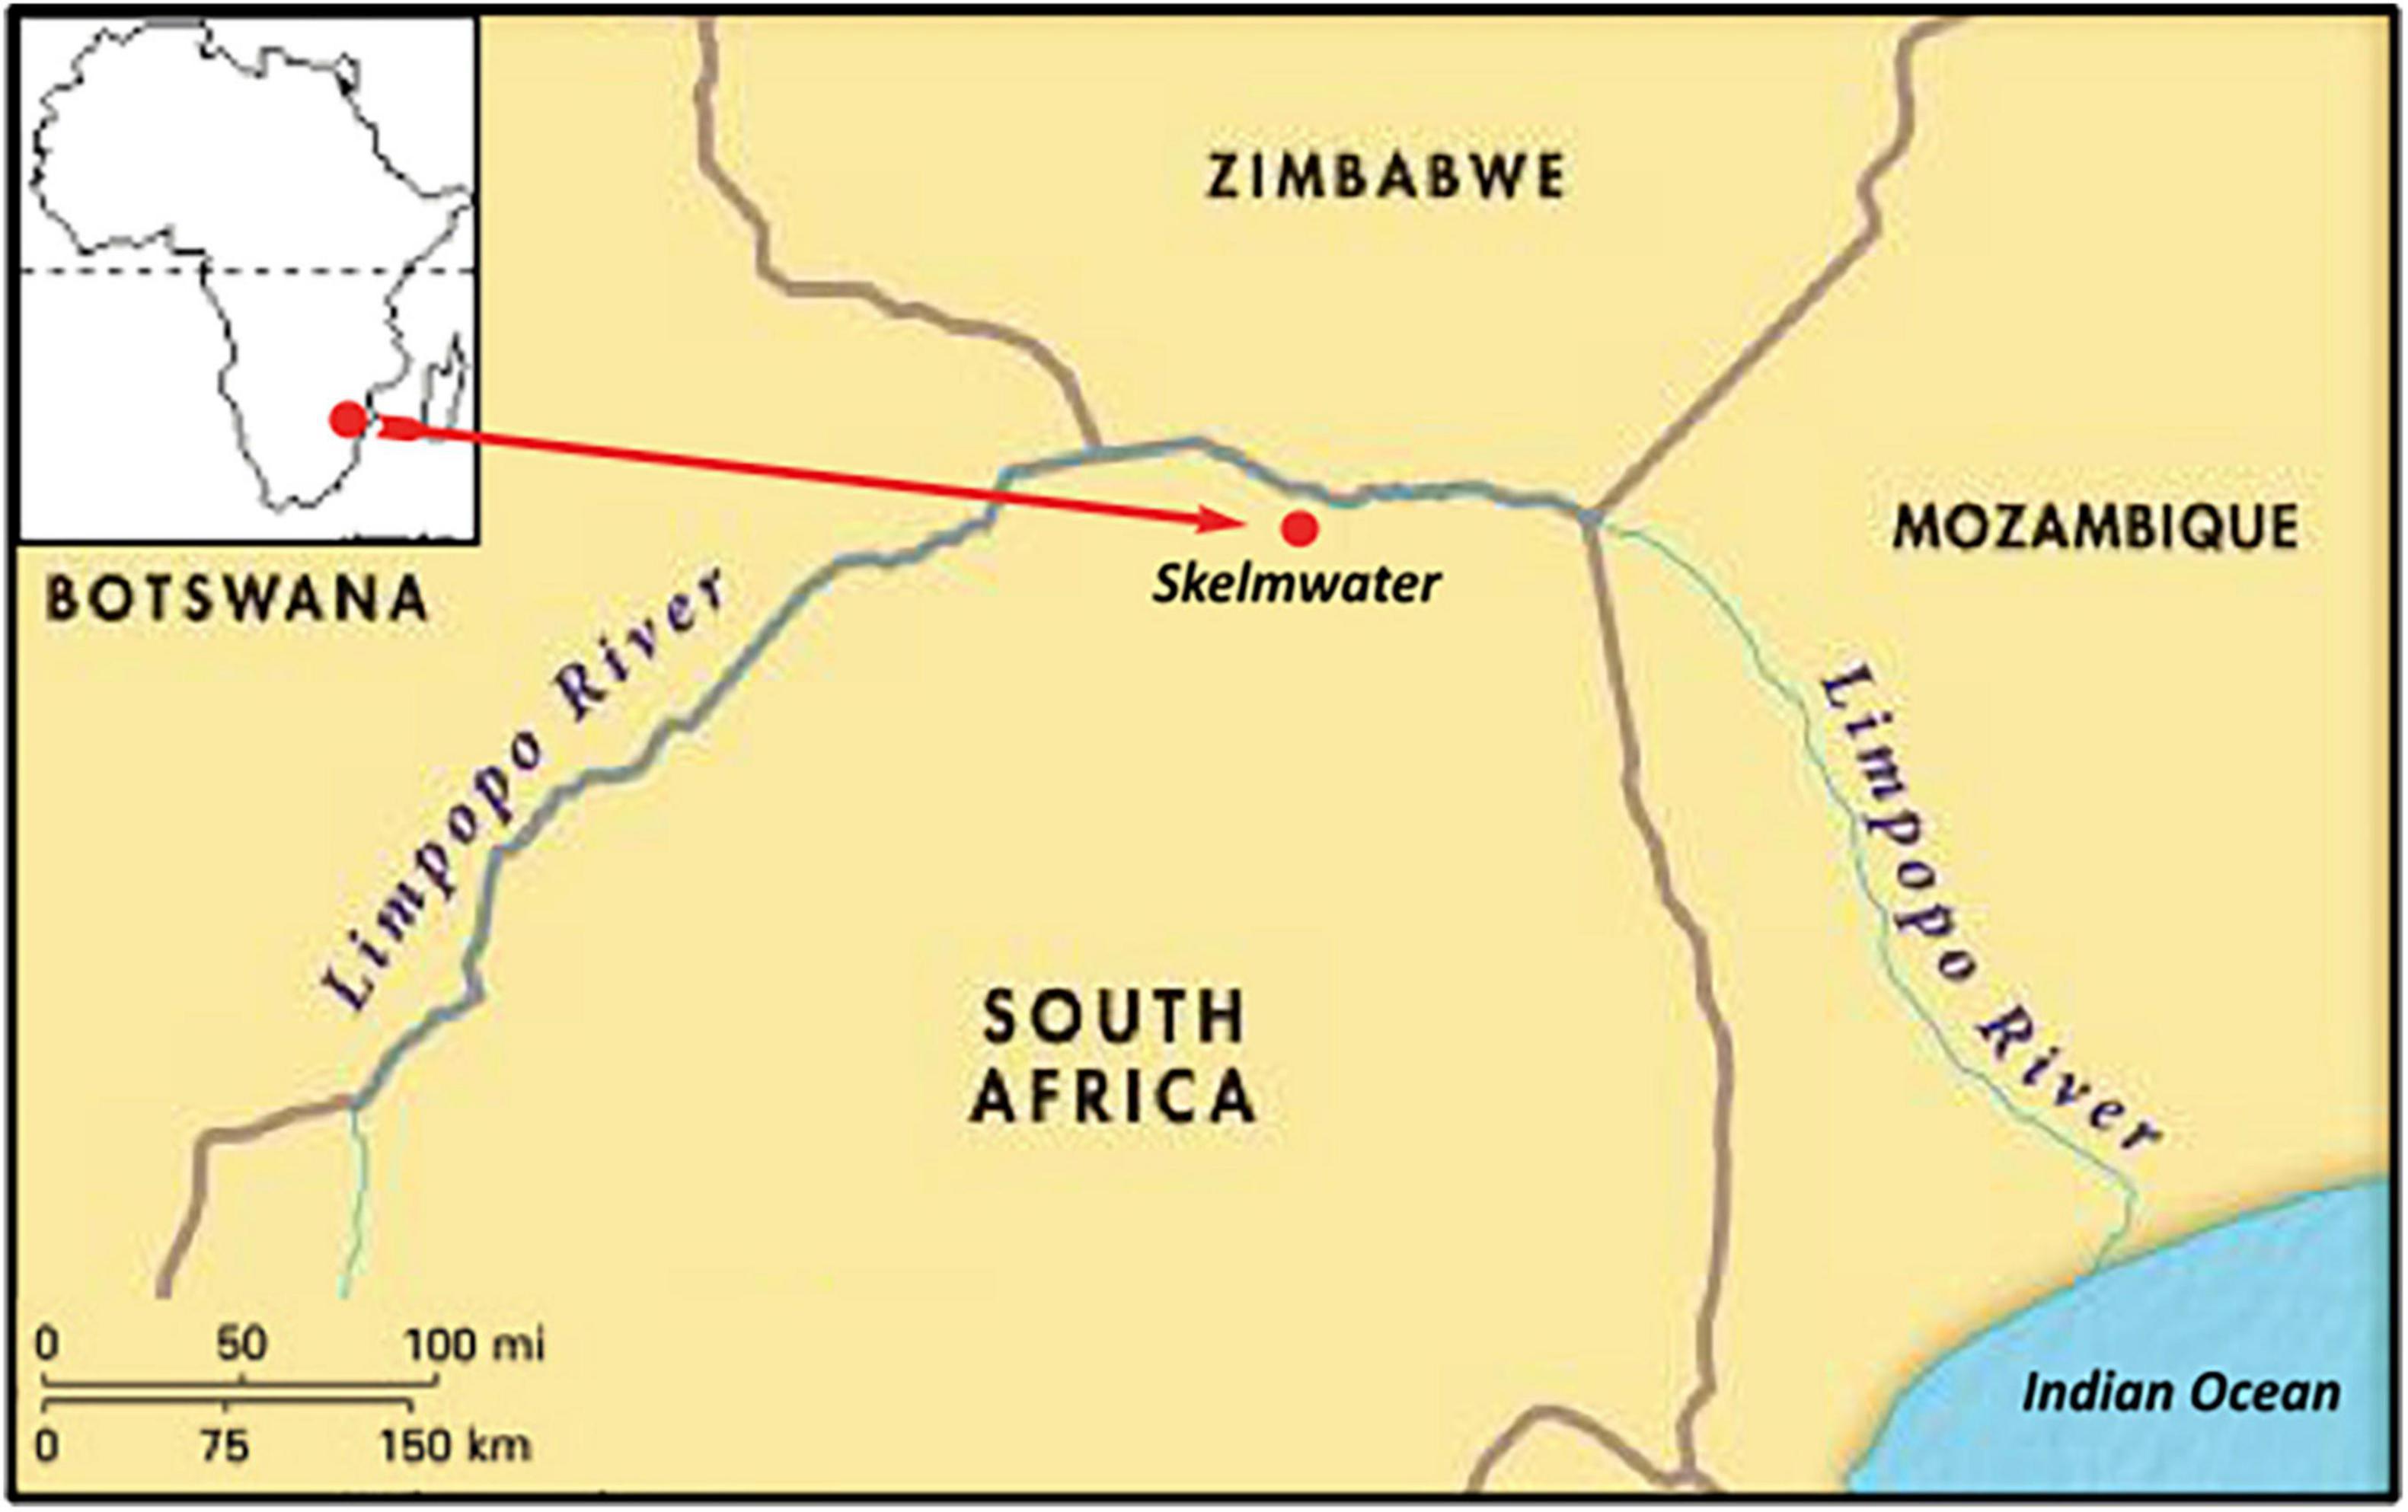
Figure 1. Site location in the Limpopo River Valley and Africa.
The study site in semi-arid, southern Africa lies at the southern edge of A. digitata’s range following migration from West Africa (Leong Pock Tsy et al., 2009). Despite polyploidy being an advantage in stressful environments (Van de Peer et al., 2021) and unique in the genus (Baum and Oginuma, 1994), nearly a century of findings in southern Africa provide evidence of drought-induced mortality (De Villiers, 1951; Guy, 1970, Piearce et al., 1994; Caplan, 1995). A “sooty mould syndrome,” redescribed as “black mould” (Cruywagen et al., 2015), has been linked since the 1940s with prolonged drought stress and mortality (Piearce et al., 1994). A. digitata has also been reported as “very sensitive” to climate variations and disturbance (Guy, 1970, Piearce et al., 1994). Yet, longevity of regional baobabs has been radiocarbon dated to ∼2000 years (Patrut et al., 2013). As climate variability is an inherent dynamic of regional climate and paleoclimate (Thomas and Burrough, 2012) it raises the paradox: Why is the disturbance-vulnerable baobab long-lived in climate-variable conditions? Extending a 1930–1993 climate-growth study by the Department of Forestry in South Africa to 2020 (90 years), we evaluate recruitment, resource acquisition and growth, and hypothesise that longevity in A. digitata, like other tropical species (Perez et al., 2016); (1) Is compromised by climate variability, extreme events and climate change as warming affects the moisture-holding capacity of the atmosphere and increases surface drying (Trenberth et al., 2003); (2) Depends for resilience primarily on higher genetic diversity and evolutionary legacy effects in the climate-variable, edge of the range in southern Africa.
Materials and methods
Study region, experimental site, and climate
Baobabs “probably nowhere so numerous in Africa” (Hutchinson, 1946), including some of the oldest and largest trees, are scattered at varying densities in woodland, savanna and floodplains for ∼265 km along the Limpopo River Valley (LRV) in southeast Africa (Figure 1). The LRV belongs to the Zambezian region of tropical Africa in plant diversity (Linder, 2014) and is relatively species-rich (Willis et al., 2018). In 1930, the Department of Forestry in South Africa set aside a 6-hectare site at the centre of the distribution (-22.49663, 29.9823) on a hot, northwest-facing hillslope within a protected forest reserve with 17 mixed-age baobabs “to study the age and growth rate of baobabs in their natural state” (De Villiers, 1951). Initially called the “Messina Plot,” the site was re-proclaimed in 1984 as Skelmwater Nature Reserve (SNR) and is widely documented in the literature (for example, De Villiers, 1951; Swart, 1963; Guy, 1970, 1982; Fenner, 1980; Wickens, 1982; Piearce et al., 1994; Wickens and Lowe, 2008). The Department of Forestry ended the project in 1993. When we restarted the monitoring in 2003, our aim to continue the growth measurements, evolved into a multifaceted project. Although small, the project is unique as the only long-term study of baobabs and has been recommended as an “international site of special scientific interest” for baobab growth (Wickens and Lowe, 2008).
The dominant drivers of climate variability are ENSO (El Niño-Southern Oscillation), which cycles irregularly and asymmetrically between dry El Niño and generally wet La Niña, and the Indian Ocean Dipole (IOD) (Manatsa et al., 2008; Abram et al., 2020; Wang et al., 2020). Reconstruction of sea surface temperatures (SSTs) in the southwest Indian Ocean (SWIO) indicates the significant correlation between El Niño and pIOD episodes on annual to decadal timescales of 0.64–0.77 at a 95% confidence level (Sundqvist et al., 2013). Although commonly viewed as an equatorial east-west Indian Ocean dipole, the pIOD results in a dry-wet dipole between the tropical LRV and equatorial East Africa (Nicholson, 2011). El Niño and the pIOD occur during the mature and peak stage of an event; the former from the mid-to-late rainy season and the latter at the start of rains and leaf flush. La Niña is less predictable and can be a multi-year and re-emergent event.
The climate is influenced by high temporal variability, including intra-seasonal dry/wet spells (Usman and Reason, 2004), interannual variability (Reason et al., 2005) and pronounced interdecadal variability from an 18 to 20 year rainfall oscillation (Tyson and Preston-Whyte, 2012). Drought is endemic to the region (ibid.). Mean annual rainfall (MAP) in the central LRV was 359 mm between 1929 and 2020 (91 years) with pronounced seasonality: 94% falls during the 7-month rainy season in summer between October to April. Long-term mean evaporation is 2683 mm, mean daily sunlight is 8.5 h, and temperatures may exceed 40°C (Jordaan et al., 2004). As evaporation is over seven times higher than MAP, drought risk is increased (Trenberth et al., 2003). Rainfall originates from coastal Angola, the tropical southeast Atlantic and the tropical SWIO associated with the synoptic Inter-Tropical Convergence Zone (Reason and Smart, 2015; see Figure 1). Tropical systems in the SWIO include landfalling tropical cyclones (Rapolaki et al., 2019).
Methodology
In tropical species with thick bark like baobabs, stem water storage correlates with girth (Borchert, 1994). Water storage parenchyma in A. digitata are arranged in tangential bands alternating with xylem (Rajput, 2004) which allow significant contraction from water withdrawal (Chapotin et al., 2006a) and non-invasive interpretation of water use or retention in drought (De Swaef et al., 2015).
Tree dataset
Tree positions were determined using a GPS unit (Garmin) and checked against a 1967 site sketch in the Department of Forestry archive, before transferral to ArcGIS 10. According to the original methodology, “A line was painted around the stem 4 feet 6 inches (1.37 m) from the ground so that the top of the tape coincided with the bottom line of the painted strip” (De Villiers, 1951). This regularly repainted ring acted as a permanent and consistent guide of stem shrinkage and swelling; a recognised proxy for water stress linked to water storage dynamics (De Schepper et al., 2012). Girth was measured irregularly by the Department of Forestry at the start of the dry season between 1930 and 1993, and annually by ourselves from 2003 with similar timing (Supplementary Table 1). To counter the irregularity of measurements, a moving average smooths the time series data to identify trends.
The 17 baobabs at SNR were divided into 3 cohorts according to size: Cohort 1 includes juveniles and newly mature Tree 9 (< 2 m girth) or 24% of the population; Cohort 2 includes mature (post “cone-stage”) baobabs (2–5 m) with developing secondary growth (17% of the population). Cohort 3 includes mid-size baobabs, the largest class (5–9 m) at SNR, comprising 59% of the population is similar to 62% (n = 1998) for this cohort in the Kruger National Park (KNP) (Whyte et al., 1996). All trees in Cohort 3 have been historically damaged by elephants. A growth index (GI) was calculated by dividing the DBH by the interpolated measurements between 1933 and 2020 when both rainfall + temperature data were available (Supplementary Table 2).
Reconstruction of life-history
Samples collected from dead Tree 15 (midway in Cohort 3) in 1966–1967 (Guy, 1970) resulted in an age of 400 ± 120 years (Sheppard and Swart, 1971). Because of the variability in atmospheric 14C/12C ratios over time, Tree 15 required age recalibration. Cores were extracted from the other two cohorts; Tree 13 (Cohort 1) and Tree 11 (Cohort 2), using a Haglöf CO 600 increment borer 60 cm long with an inner diameter of 0.43 cm. Dating was performed using accelerator mass spectrometry (AMS) at the NOSAMS facility, Woods Hole Oceanographic Institute (WHOI), USA in 2009 (Tree 11) and 2011 (Tree 13).
Climate dataset
The dataset includes daily rainfall for 91 years and daily minimum (Tmin) and maximum temperature (Tmax), available from 1933, providing a combined dataset of 87 years. This includes approximately 33,200 data points for rainfall and 63,500 for temperature from the two closest weather stations: Messina-Mauville (26 km) (S22.2700, E29.9000) between 1929 and 2009 (closure) and Venetia (68 km) (S22.4510, E29.3310) (2010–2020) [South African Weather Service (SAWS)].1 Historic 18th and 19th climate were obtained from gauge records, and like paleoclimate, from contributary research.
Extreme events
SAWS define drought conditions as < 75% of MAP, based on 30-year data, equivalent to < 268 mm in the study area. Drought episodes were determined from daily rainfall data (1929–2020) using the parameters of MAP, duration and rainfall deficit. Drought/Dry spells include severe drought years interspersed with low rainfall years. Sub-zero spells (T-z) were determined using daily Tmin data. Heatwave data were extracted from daily Tmax data (1933–2020) using the SAWS definition of a heatwave: exceeding the mean temperature of the hottest month (33°) by 5° or 39°C+ for at least 3 consecutive days.
Climate variability and growth
Climate variability was determined by climate drivers, ENSO (El Niño and La Niña), the pIOD, and measures of variance. Coefficient of variation values were calculated by an index of climatic risk [CV = (SD/)*100] and determined by annual, decadal and seasonal rainfall variability. CV values for temperature were converted to a Kelvin scale. Daily rainfall data (1929–2020) were evaluated according to four variables to determine variability and impact on growth: (1) MAP; (2) Seasonal rainfall; determined by the six wettest months between November and April (NDJFMA) with 88% of MAP; (3) Early season rainfall (ESR) between November to January (NDJ); (4) Late season rainfall (LSR) between February to April. A growth index for each tree was computed by dividing the DBH by the interpolated measurements between 1933 and 2020 (Supplementary Table 2). To counter the irregularity of tree measurements and rainfall variability, a moving average based on a 20-year rainfall oscillation was used to smooth the time series and identify trends. As the temperature range of ∼2°C over 87 years is negligible, the indexed values for every tree were linearly interpolated between dates of tree measurements to create a continuous graph for all trees using a series of gradients based on normalised values of MAT.
Site and disturbance
As growth on the hillslope site may be influenced by elevation, slope, soils, hydrogeology, geomorphology and disturbance, the methodology included the following:
(1) Collection of soil cores to bedrock around all baobabs with a soil augur to analyse soil depth, soil type, and soil fertility (texture, organic matter, and macronutrients. (2) Hydrogeological investigation to identify fractures that may allow ponding; (3) Determination of hillslope profile and cross-sections. (4) Calculation of slope values for each tree using ArcGIS 10 with a Spatial Analyst extension on a slope grid; (5) Identification of tree locations and hydrogeomorphic disturbance from sheet erosion (scour zone), rills, gullies and deposition of quartz rock which covers much of the site; (6) Interaction/s between rainfall, slope, elevation, and growth; (7) Correction of diagrammatic gully alignments shown in archival 1967 sketch (Department of Forestry) using Garmin tracking data, and illustrated in ArcGIS 10 using National Geo-spatial Information (NGI), 50 cm colour imagery (Colour Digital Aerial Imagery at 0.5 m GSD (2008–2016) and 0.25 GSD (2017- current).
Pests and pathogens
Stem samples of lesions and potential fungal infections were collected across southern Africa in 2007 following a hot drought and from seven healthy and symptomatic trees with dieback at SNR in 2016 to determine the presence of pathogens in symptomatic samples and absence in healthy samples. Isolations from asymptomatic material and lesions were made onto 2% malt extract as described by Cruywagen et al. (2017). Cultures were purified by transferring hyphal tips of mycelia to clean 2% MEA when fungal growth was observed.
Fungi were identified based on morphology, DNA sequencing and phylogenetic analyses. DNA extraction was performed using Prepman Ultra (Applied Biosystems, Foster City, CA, USA) according to the method described by Linnakoski et al. (2008). Identification of fungi at species level was done by PCR amplification and sequencing of the ITS rDNA and the translation elongation factor-1α (tef-1α) gene region as described by Cruywagen et al. (2017). Consensus sequences of opposite strands were obtained using CLC Main workbench 7.2 BLAST searches were conducted with these sequences on NCBI3 to find closely related sequences. The best-fit substitution models were determined for each dataset with jModeltest v.2.1.3 using the Akaike Information Criterion (AIC) (Guindon and Gascuel, 2003; Darriba et al., 2012). Phylogenetic analyses were conducted using PhyML v.3.0 (Guindon and Gascuel, 2003) with the appropriate model selected by jModeltest to construct Maximum Likelihood trees to identify isolates.
Genetic diversity
As fitness and response to environmental conditions differ based on genotypic diversity (Engelhardt et al., 2014), we evaluated genotypic diversity from microsatellite fragment analysis; a widely used proxy for fitness (Shikano and Taniguchi, 2002; Da Silva et al., 2009).
The DNeasy Plant Mini Kit (Qiagen, USA) was used to extract DNA from silica-dried leaf tissue from all trees following the manufacturer’s instructions with the following modifications: (1) Increased lysis buffer from 400 μL to 650 μL, and added 10 μL of Proteinase K (25 mg/ml); (2) Tissue and lysis buffer was incubated at 65°C for 20 min instead of 10 min at 65°C; (3) All steps in the centrifugation process were performed at 4°C instead of room temperature. (4) The final elution was made with a heated buffer (85°C) and incubated at room temperature for 10 min before centrifugation.
Eight Adansonia digitata microsatellite loci were selected according to Larsen et al. (2009), based on successful polymerase chain reaction (PCR) amplification (Supplementary Table 3) with five loci missing from the complete data matrix (one locus from three individuals, two loci from a fourth individual). Forward primers were synthesised and labelled with fluorescent dyes using Dye Set D (6FAM, HEX, TAMRA) by Eurofins (USA). PCR reactions totalled 25 μL in volume which included 0.5–1 μL of DNA template, 0.5 μL of each 10 μM forward and reverse primers, 2 μL of MgCl2, 5 μL of GoTaq Flexi buffer and 0.2 μL of Flexi taq polymerase (Promega, Madison, WI USA), and 15.3 μL of MilliQ water. PCR thermocycler parameters followed Cron et al. (2016). Successful amplification was determined by confirming the expected size range for each locus on 1% agarose gel electrophoresis. A total of 10 μL of formamide and 0.3 μL of GENEFLOROX labelled 625 DNA ladder was added to 2 μL of PCR product. Fragment analysis was performed on an ABI 3170 at the University of Wisconsin-Madison Biotechnology Center, USA. Chromatographs of microsatellite alleles were scored manually in Geneious 5.0 with the Microsat Plug-in.
GenoDive 2.0 (Meirmans and Van Tienderen, 2004) was used to calculate genetic diversity indices for individuals, cohorts, and the total population. As Adansonia digitata is a polyploid species (Baum and Oginuma, 1994), the expected heterozygosity was corrected using a maximum likelihood method to correct for the unknown dosage of the alleles given the overall population allele frequencies. Hardy–Weinberg equilibrium was calculated using the heterozygosity-based method (Nei G) and total heterozygosity measures were corrected for the limited sample size. To infer if past climate-triggered mortality could have been a selective pressure by reducing overall population diversity, we measured d2 as described in Coulson et al. (1998); a proxy to study the impacts of inbreeding within a population, with higher measures of d2 inferred due to greater genetic distance of parental genomes.
Results
Climate drivers and disturbance
Supplementary Table 4 lists the climate drivers and the pattern and properties of climate disturbance; timing, duration, deficits, and extreme events. ENSO (El Niño-Southern Oscillation) and the positive Indian Ocean Dipole (pIOD) triggered 83% of the 12 droughts which resulted in stem contraction. The rain-bearing La Niña-dominated climate from 1999 triggered 38% of ENSO events over the last 23 years, including an anomalous drought in 2011–2012 (Supplementary Table 4). Episodic climate extremes comprised 50% of droughts. All three protracted droughts (6–7 years) included at least two El Niños and one pIOD. The driest and longest 7-year drought (1961–1968) resulted in MAP of 260 mm with an annual mean deficit of 39%. Deficits of 44% resulted from the most intense drought (1981–1984) and between 36–50% for single-year droughts. The highest deficits were in 1959–1960 (50%), 2011–2012 (48%), and 1997–1998 (47%). Seasonal rainfall was delayed in 76% of droughts or dry spells.
Drought
Drought followed two distinct climatic phases: Droughts combined with sub-zero spells up to 1972–1973 and droughts combined with warming and heatwaves between 1981 and 2020 with consecutive temperatures of 39°C or higher. Sub-zero temperatures (T-z) were rare in the LRV (0.008% of the 87-year record). The majority of freezing spells (86%) occurred before 1968 with none after 1985. The coldest recorded was during June 1964 with the lowest monthly mean of 3.9°C. The driest decade occurred between 1958 and 1968 with MAP of 244 mm. The hottest decade was between 1999 and 2009 and the highest recorded temperatures and heatwaves occurred during the 2004–2007 growth seasons in the hottest drought between 2001 and 2007. The driest 7-year drought (1961–1968) recorded the lowest number of heatwaves; 1.7 per annum with a mean of 3.2 days. The hottest droughts included the highest number of heatwave days per annum; 32 between 1972–1973 and 25 between 2001–2007. The average recovery time after drought was 4.5 years.
Rainfall and temperature variability
Figure 2 shows rainfall variability and dispersion around the mean (359 mm) for 91 years (1929–2020) and across two seasonal variables: early season (NDJ) and late-season rainfall (FMA) as well as MAP. A locally weighted smoothing (LOESS) curve illustrates the trendlines. These reflect a relatively constant mean but high and increasing dispersion of “spikes” (higher rainfall) and “troughs” (drought episodes), resulting in a high coefficient of variation. Figure 3 illustrates the pronounced interdecadal pattern of rainfall variability. A 20-year moving average of the coefficient of variation of annual rainfall (following the methods of Van Wilgen et al., 2016; New et al., 2000) found an almost significant (p = 0.0569) gradient (Figure 4). CV values for MAT between 1933 and 2020 were 2.7%, and higher 3.8%/4.6% for early and late seasonal rainfall, respectively.
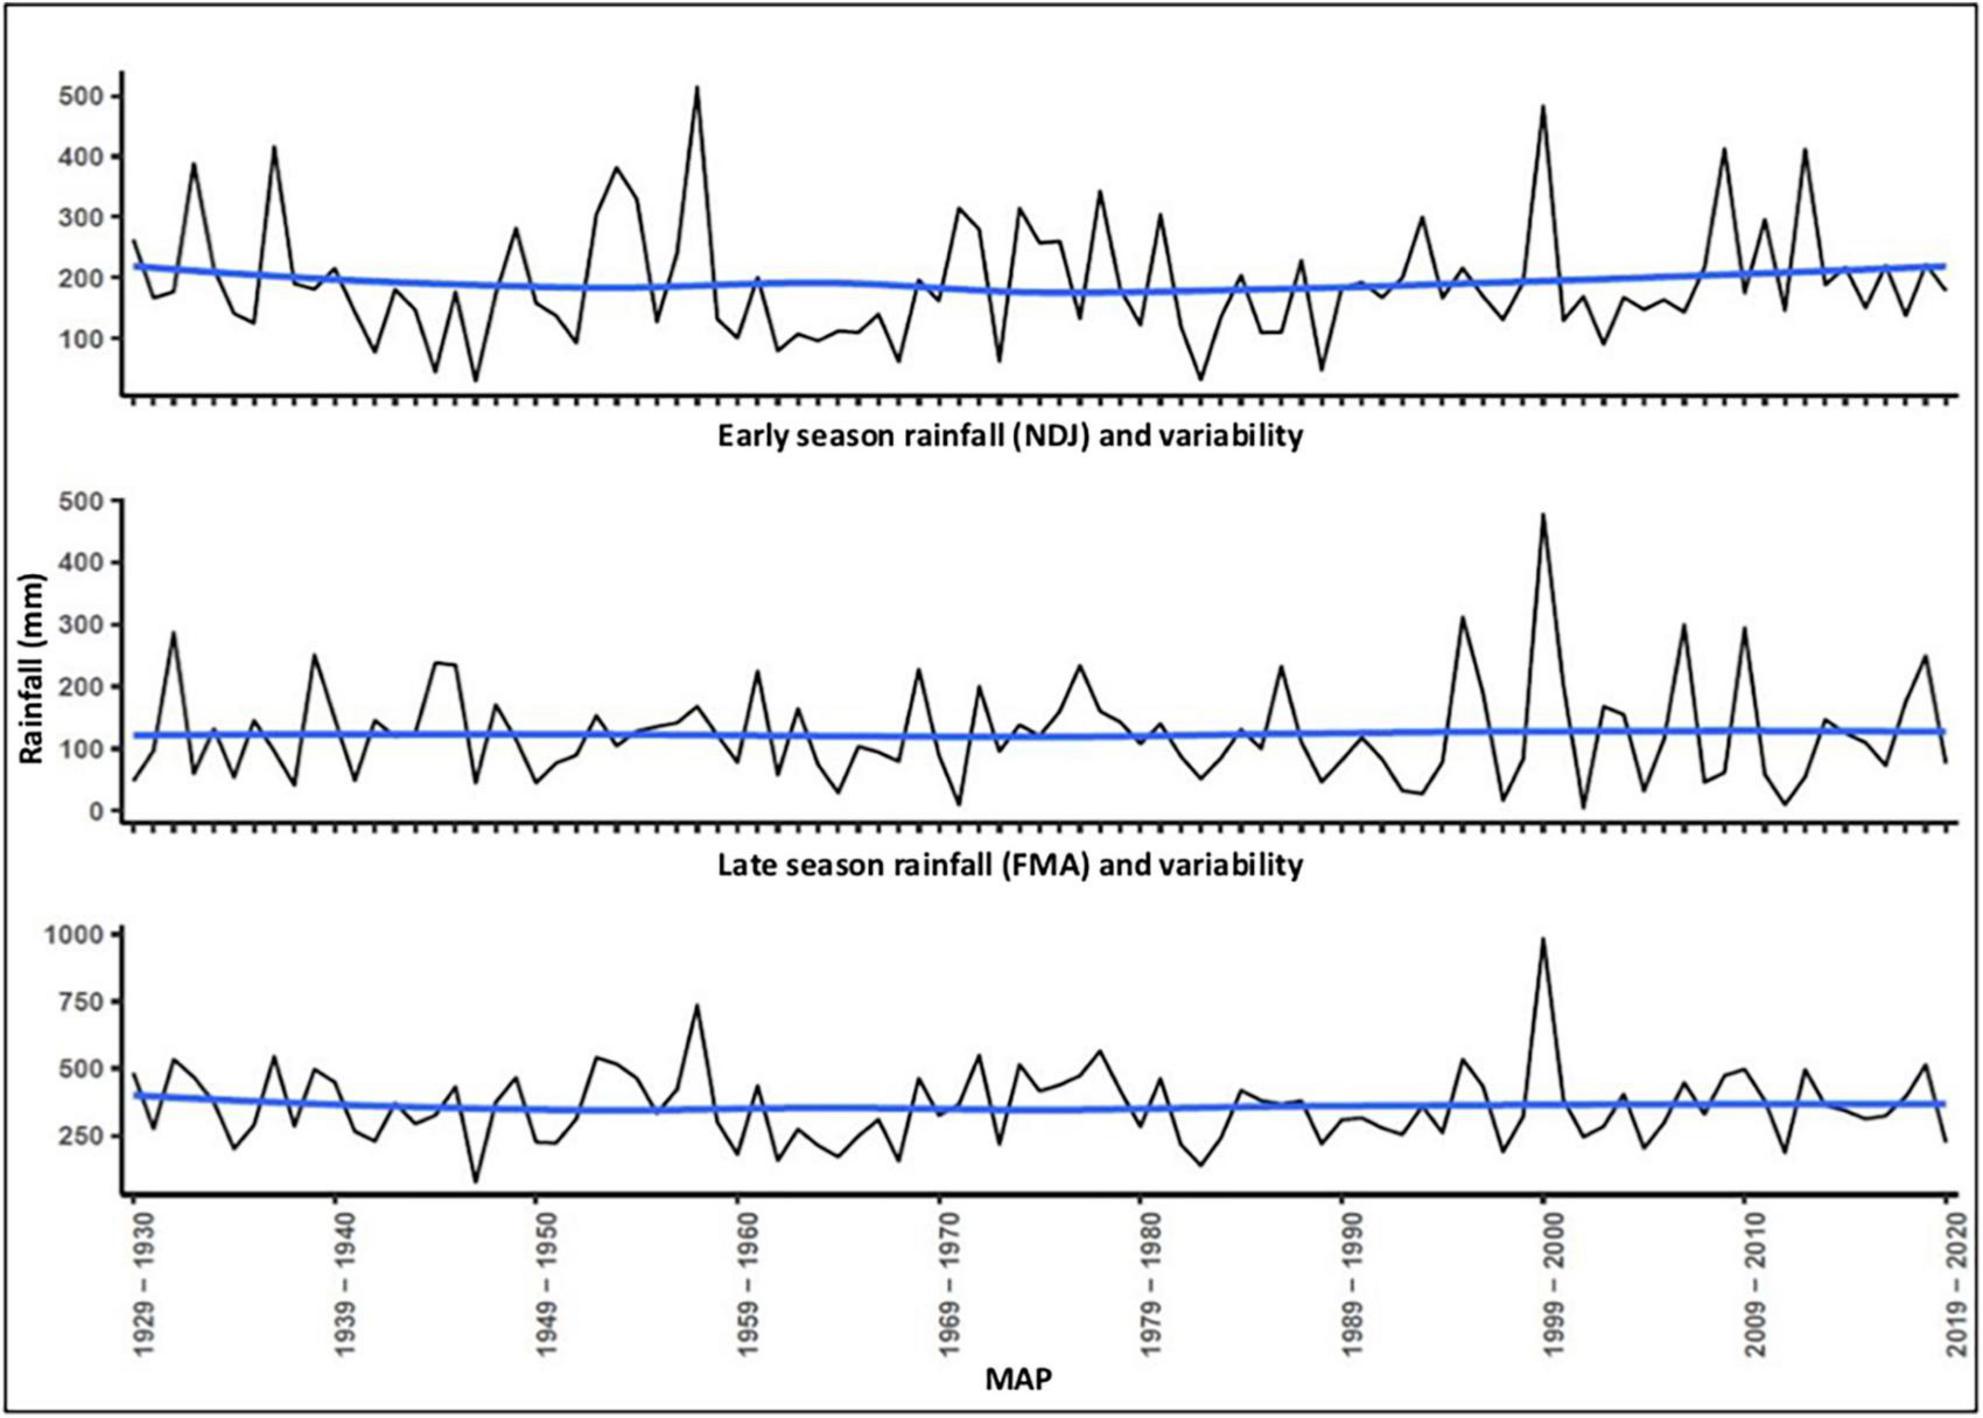
Figure 2. Interannual and intra-seasonal rainfall variability and trendlines 1929–2020.
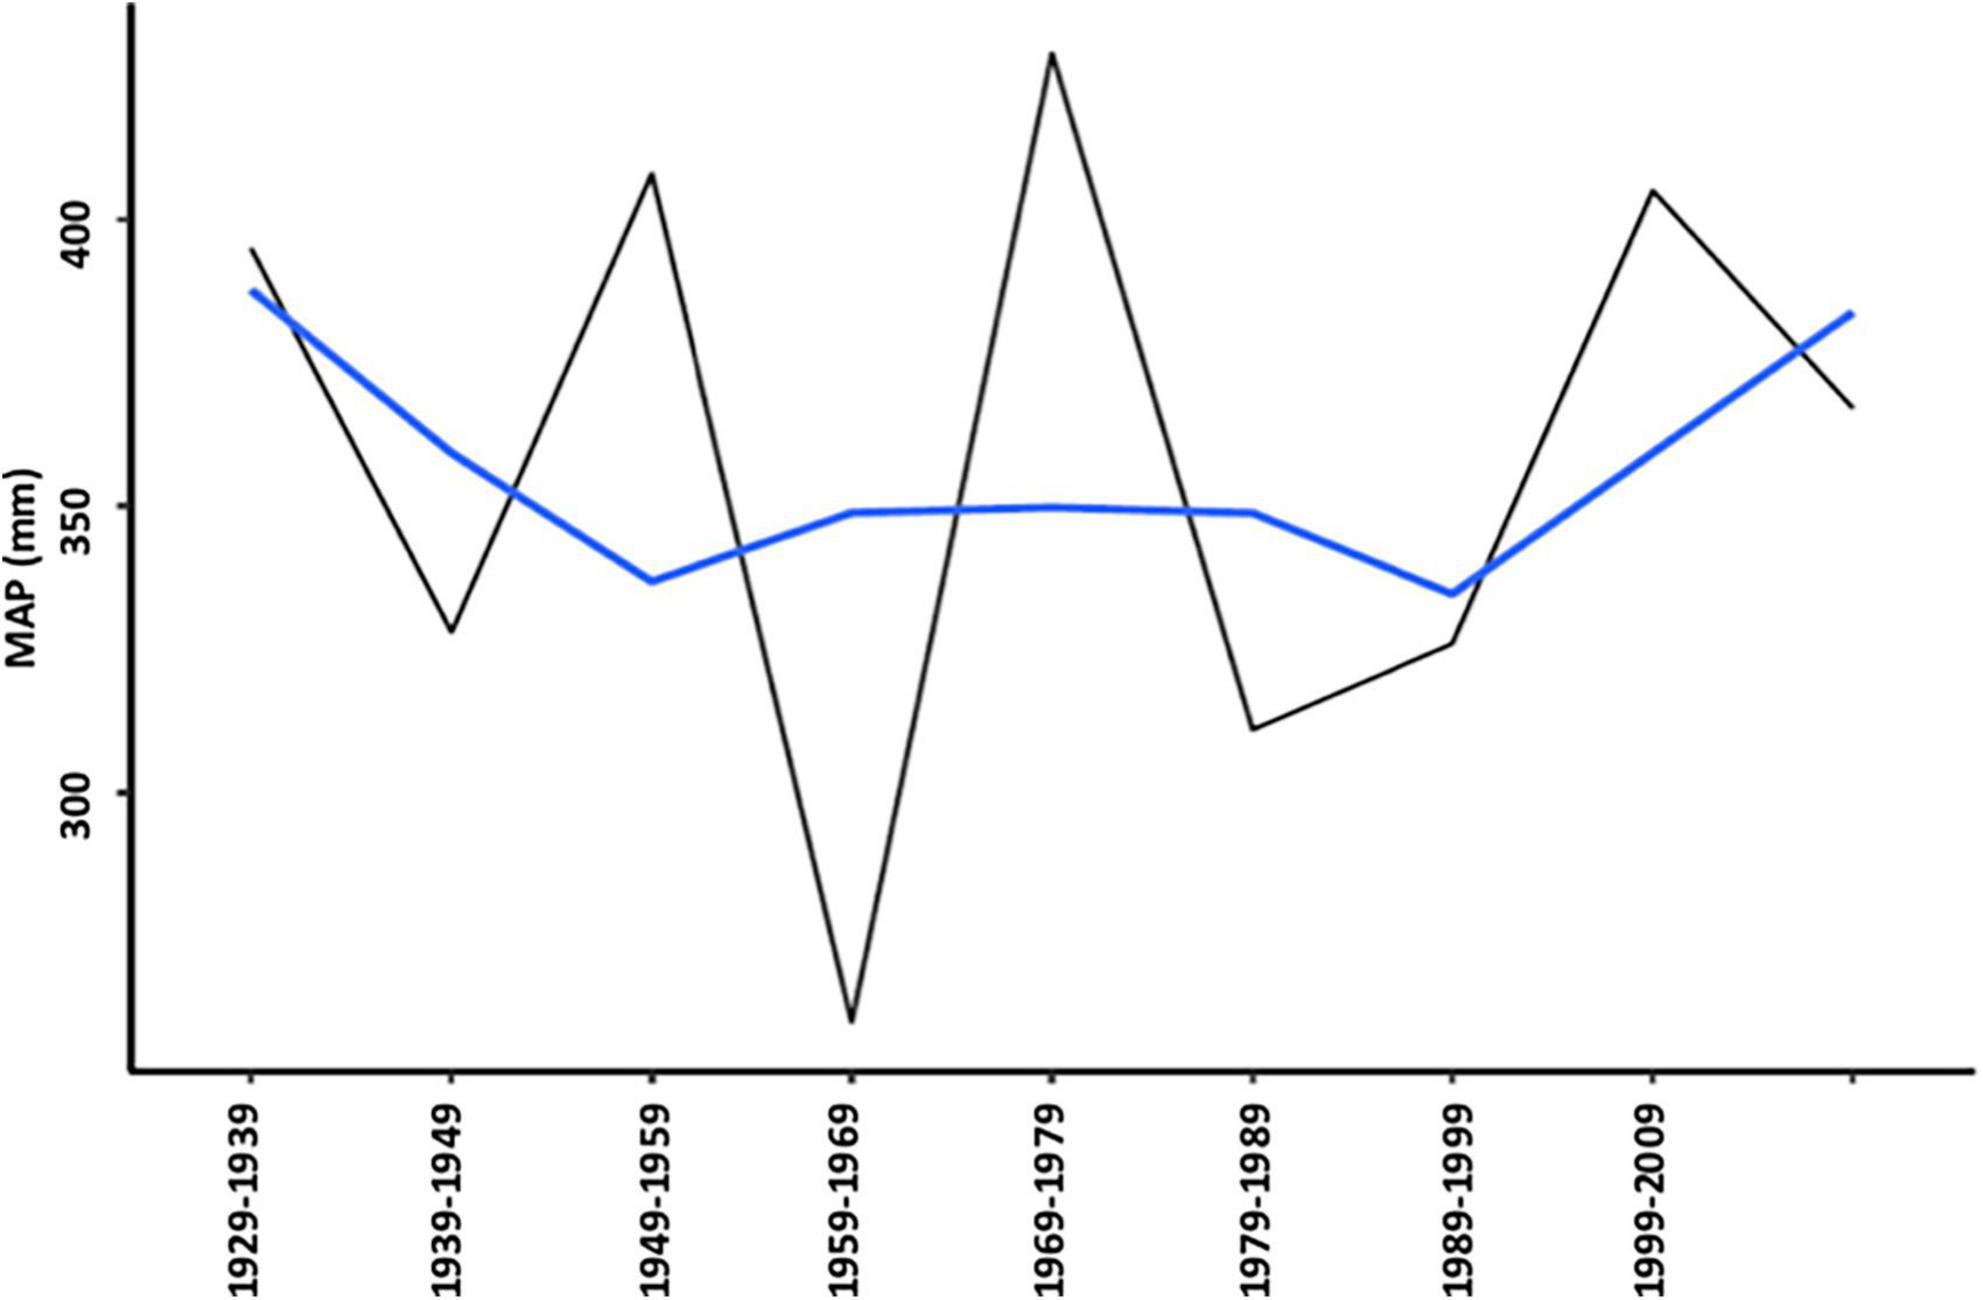
Figure 3. Interdecadal rainfall variability 1929–2020.
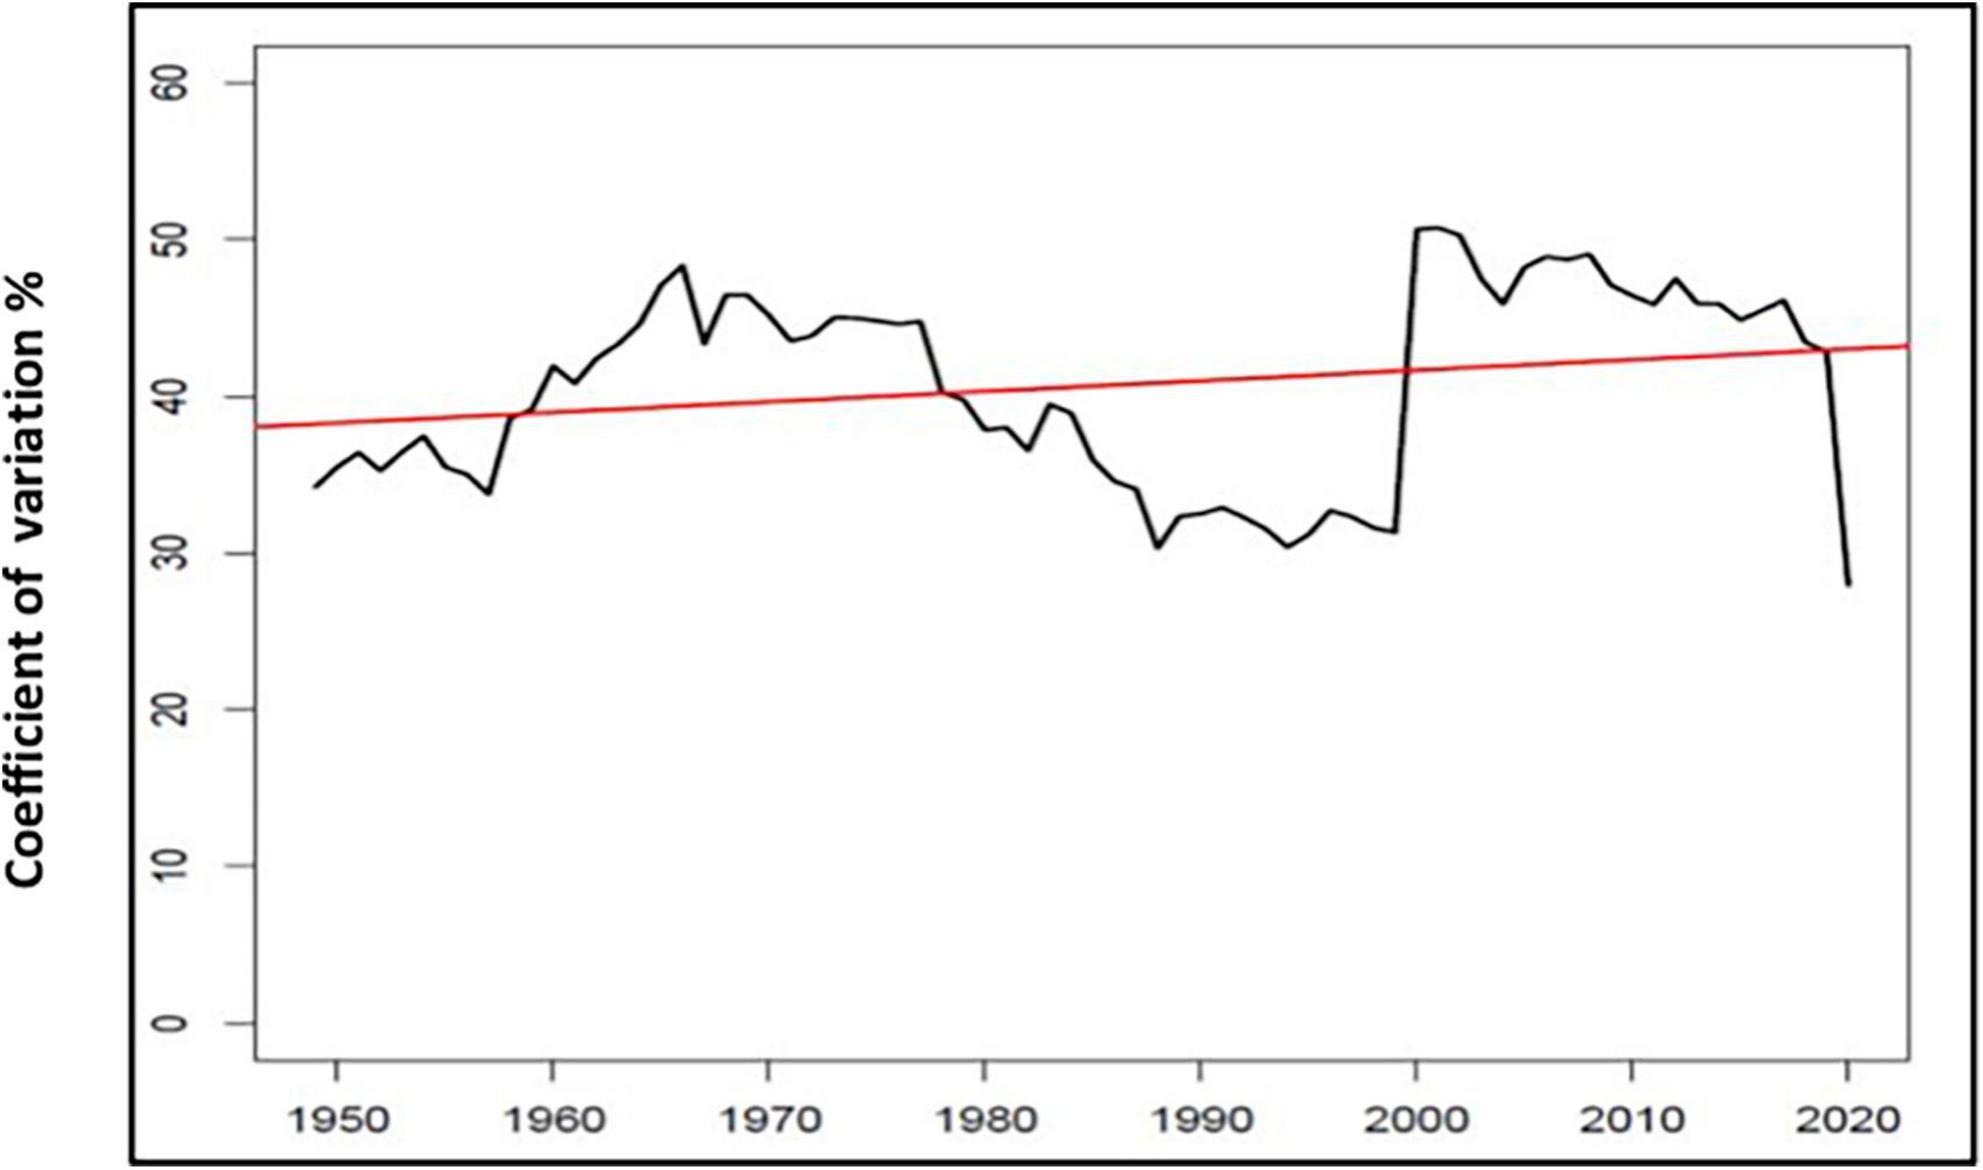
Figure 4. 20 year moving average of the coefficient of variation.
Growth response
Supplementary Figure 1 reflects the similar and consistent pattern of growth in the individual and cohort response to rainfall between 1930 and 2020. Figure 5 illustrates the correlations between the climate variables [Tmax, MAP, early season (NDJ), and late season (FMA)] rainfall and growth indices, determined by year of measurement for each tree. Growth indices reflected the strongest correlation with maximum temperature. Minimum temperature was strongly correlated with dead Trees 6, 14, 15, 16, and 17. Growth revealed a slightly higher correlation with MAP than early rainfall (EWS). All dead trees, especially Trees 14, 15, and 16 indicated a higher correlation with rainfall, primarily MAP followed by EWS and LWS. Growth showed the least correlation with late seasonal rainfall. Figure 6 illustrates the individual and cohort response linked to MAT between 1933 and 2020. Growth accelerated in all cohorts during warming with distinct dips in dry years. The mean annual increase in DBH was 0.2 cm.
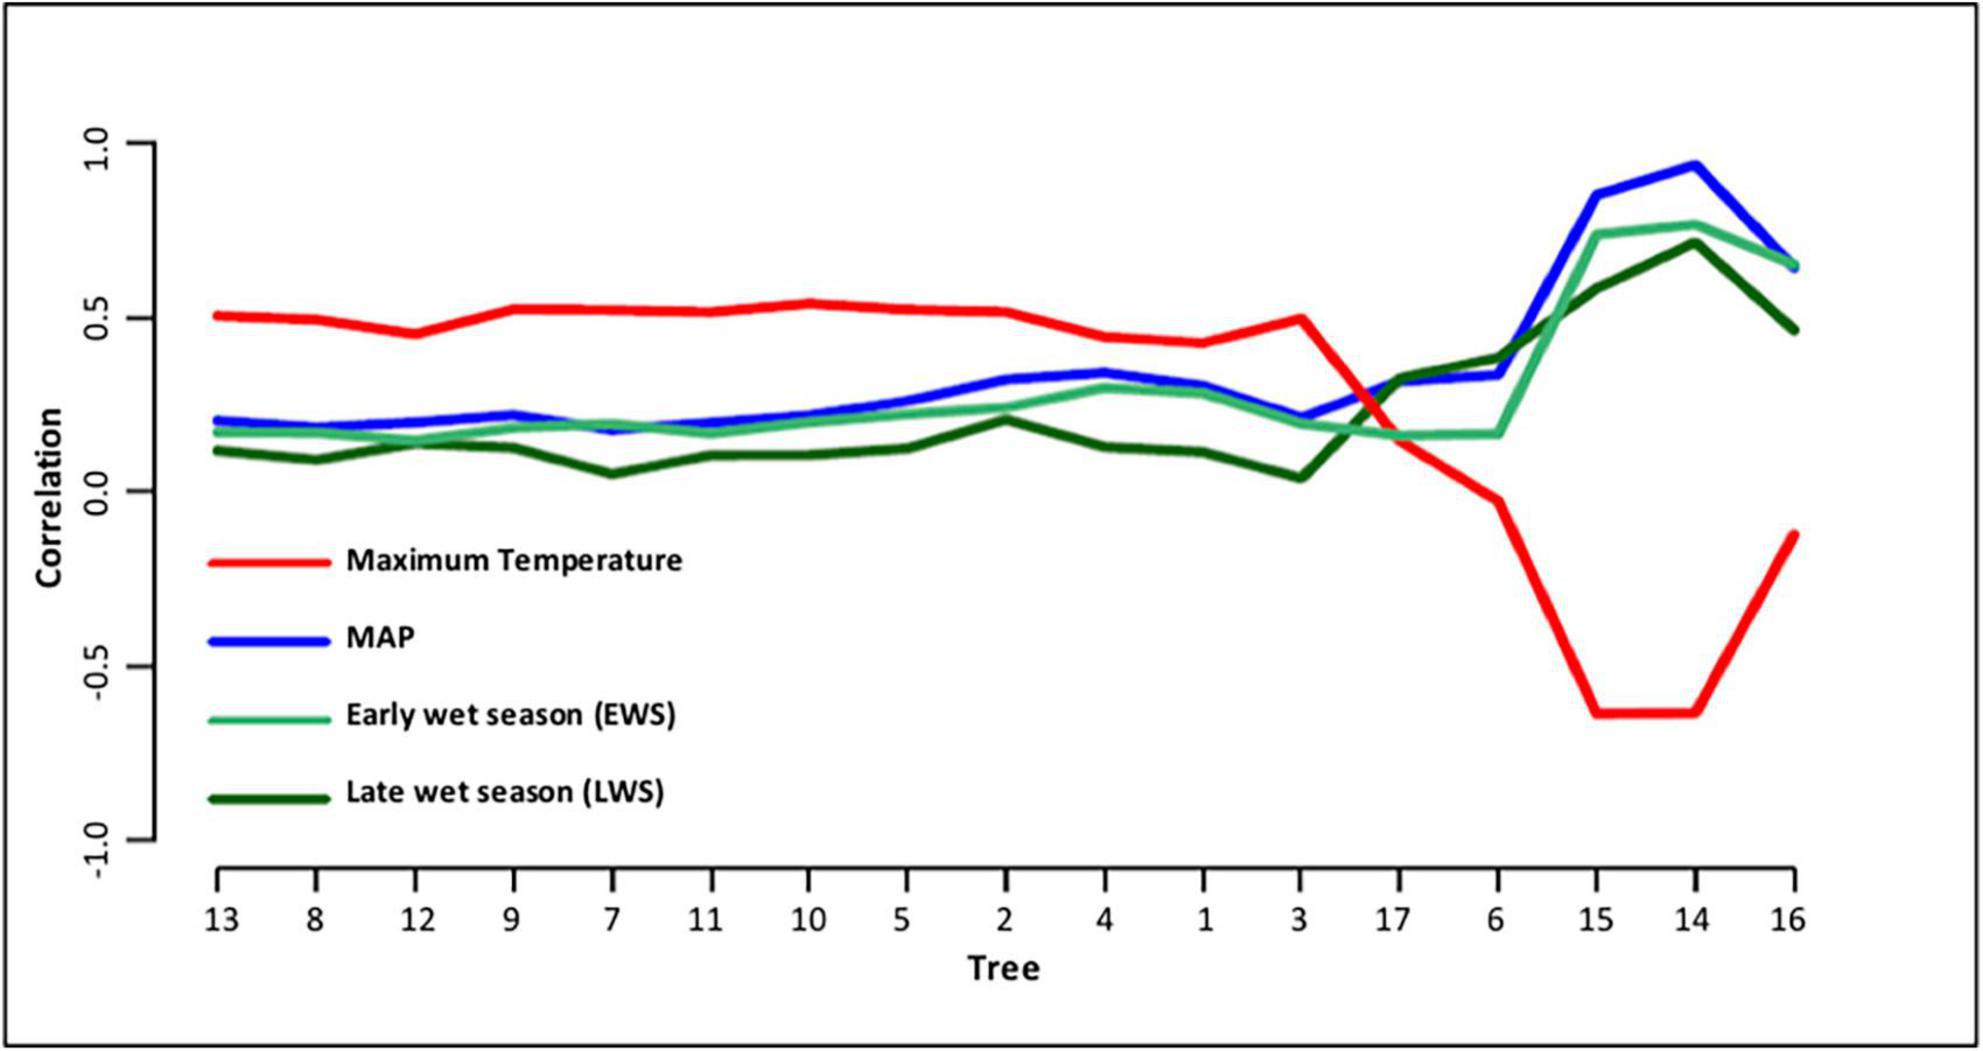
Figure 5. Correlation between climate and growth indices.
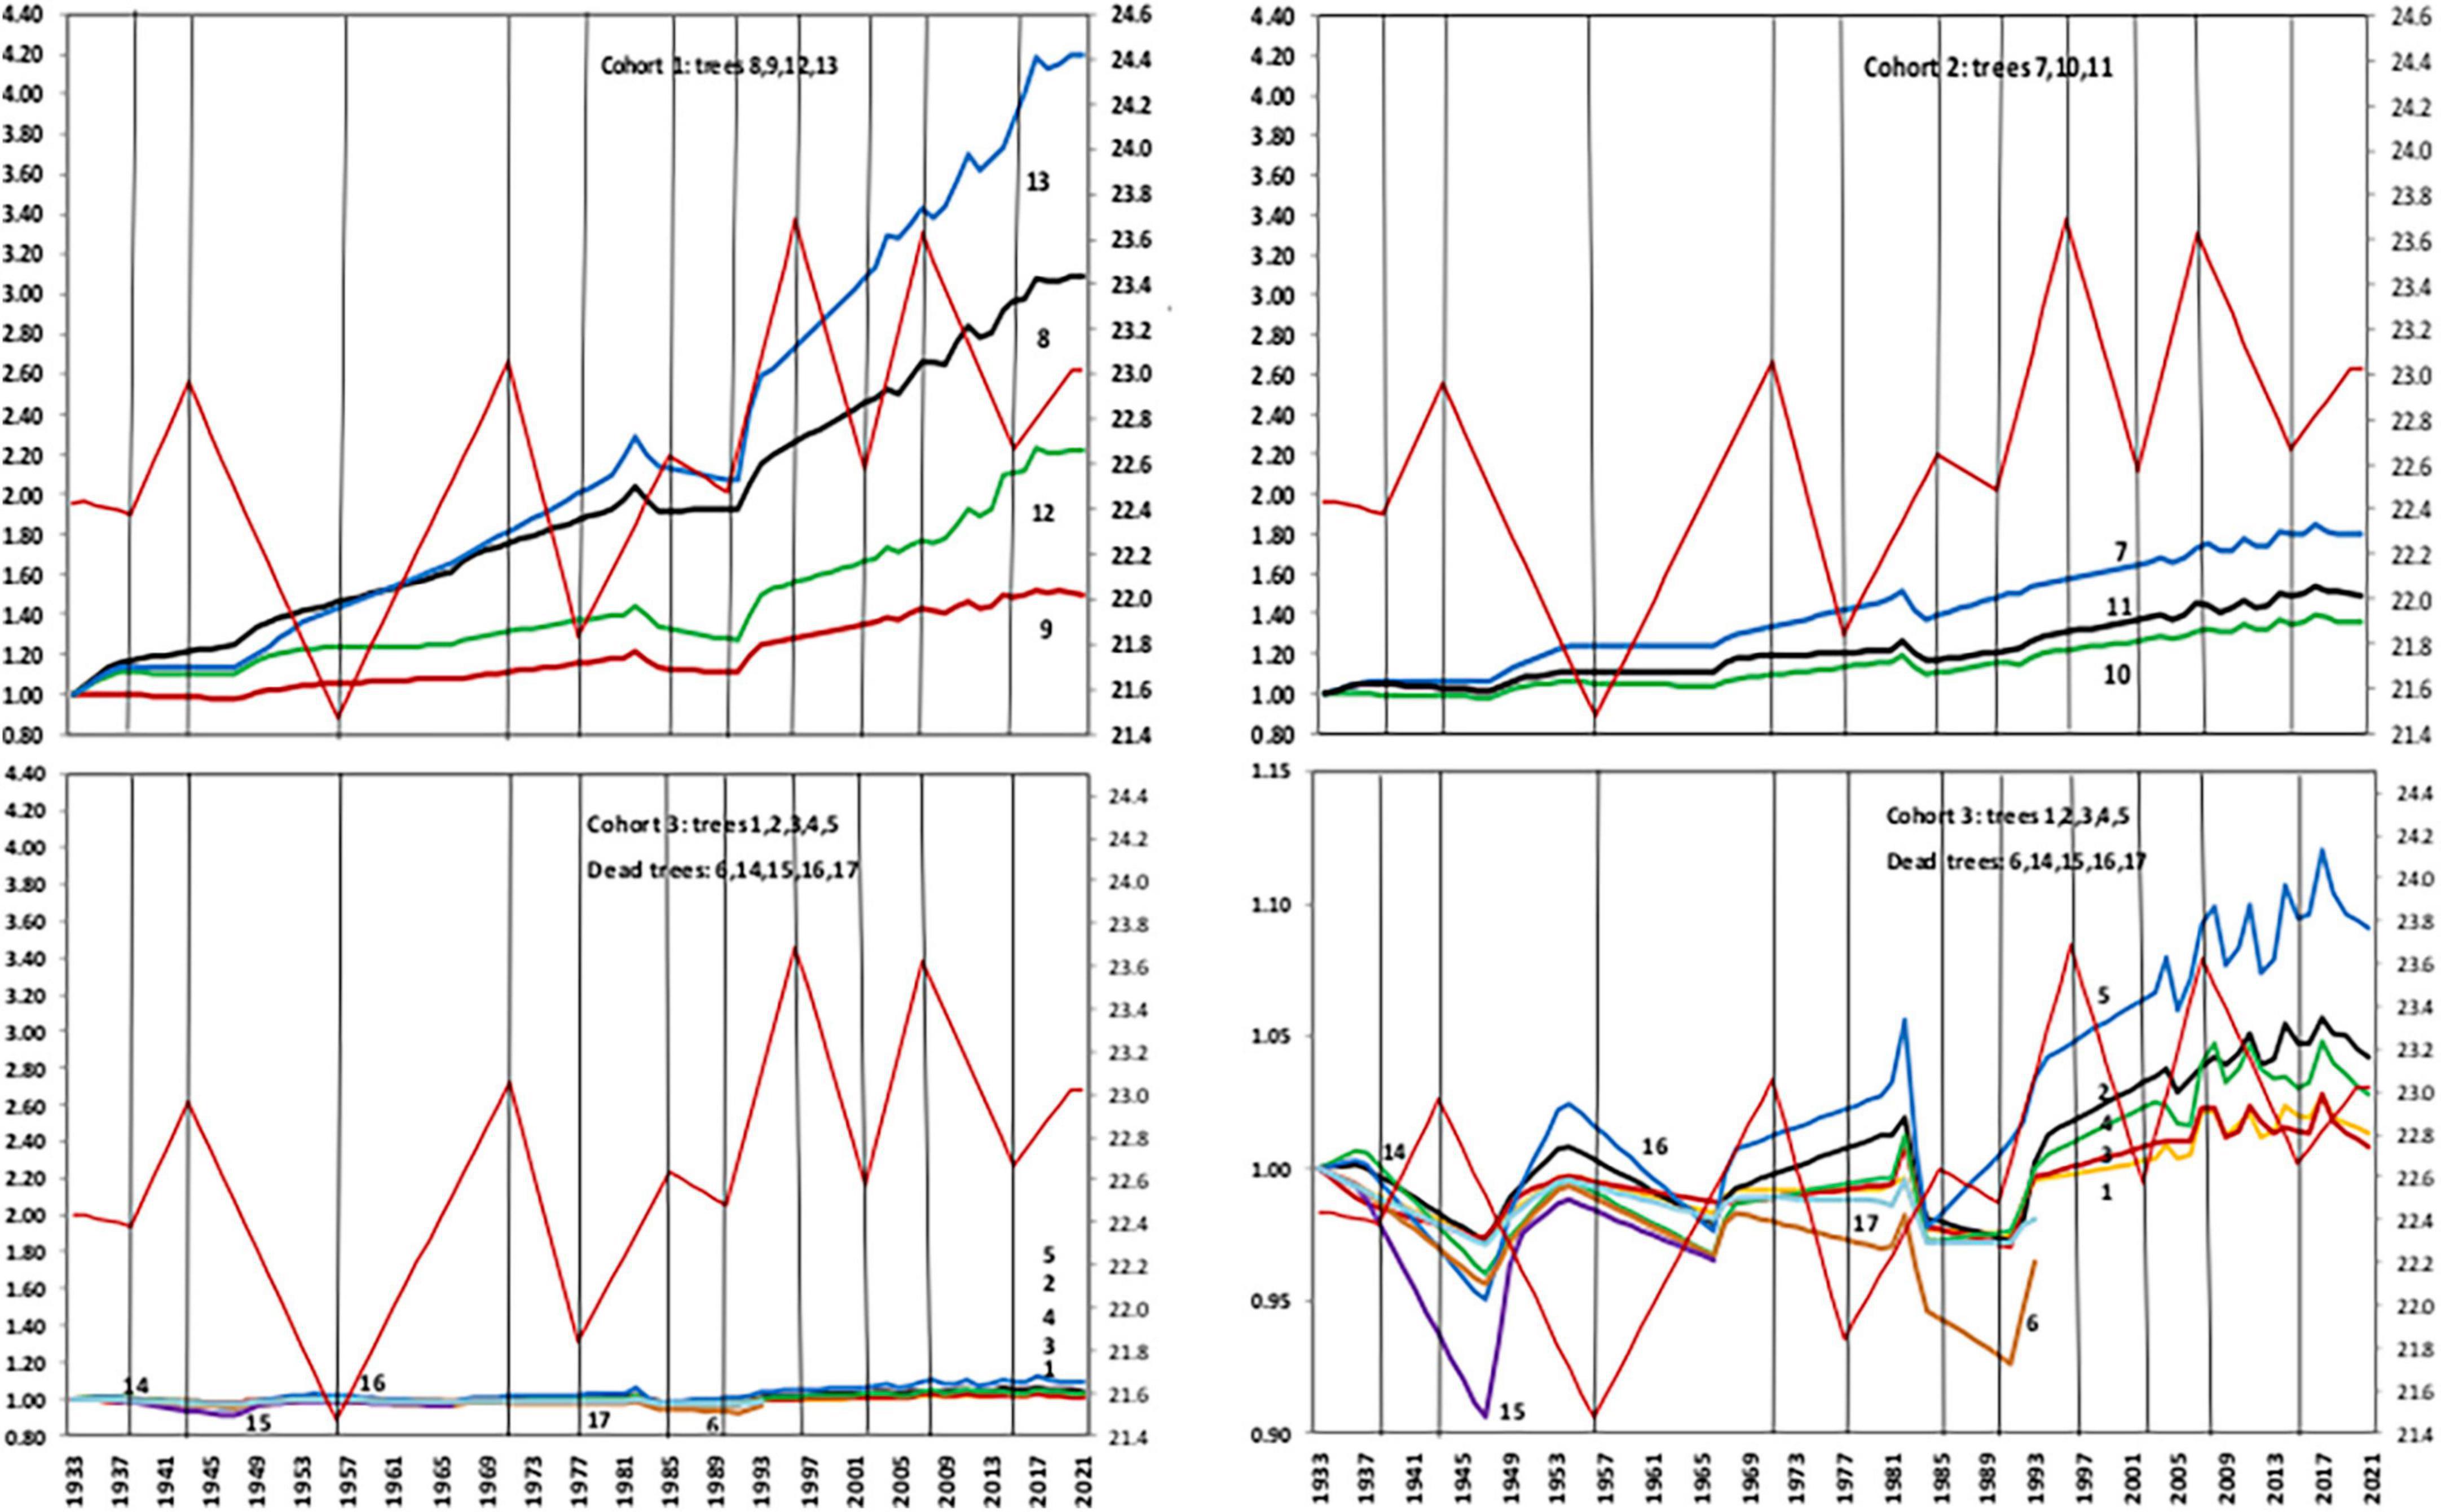
Figure 6. Growth response to MAT and warming (red graphs) with dips in dry years between 1933 and 2020.
Extreme events and mortality
Extreme climate events included combined drought and freezing events in 1946–1947, 1961–1968, and 1972–1973 and 100+ year, record rainfall in 2000. Trees 14 and Tree 15 on the lower slope (Supplementary Figure 2) contracted during the 1946–1947 drought (Supplementary Table 1) and died in 1965–1966 (Guy, 1970) following the most severe freezing spell on record in 1964 and during the longest drought. MAP averaged 260 mm with a mean deficit of 39% (Supplementary Table 4). Mortality followed in Tree 16 in 1978 possibly lagged from the severe droughts of the mid-1960s and 1972–1973. “Staghead” Tree 17 died after the protracted aridity and droughts in the 1980s and 1990s. All dead trees were located on the lower slope. In January and February 2000, record rainfall of 702 mm (equivalent to 98% of MAP for two years) from tropical cyclone Eline resulted in flooding of the Limpopo River and mortality of baobabs adjacent to rivers, drainage lines, or on fractures, which included Tree 6 at SNR.
Climate and cohort recruitment: Cohort 1 (Tree 13)
The youngest baobab at SNR was radiocarbon dated to between 1894 and 1904 using the IntCal09 calibration dataset (Reimer et al., 2009). The drought between 1892/3–1895/6 and an El Niño in 1903 optimised recruitment during the 1897–1902 wet period (Therrell et al., 2006) providing an age of 118–123 years in 2020. Based on DBH in 1930, recruitment of Cohort 1 occurred between 1870 and 1900, a period identified as the wettest in the region in the previous 200 years (Neukom et al., 2014a), and “significantly warm” (Zinke et al., 2014).
Cohort 2 (Tree 11)
The baobab was carbon dated to between 1815 and 1836 using both the SHCal04 (McCormac et al., 2004) and IntCal04 (Reimer et al., 2004) calibration datasets. The year 1815 coincided with a pronounced wet decade between 1810 and 1820 (Hannaford et al., 2015) before a severe regional drought during the 1820s and 1830s (Nicholson et al., 2018), suggesting that Tree 11 was ∼205 years in 2020. Based on DBH in 1930, we suspect that older Trees 7 and 10 recruited during the wetter and warming conditions between 1740 and 1800 (Zinke et al., 2014).
Cohort 3 (dead Tree 15)
Recalibration (updating) used the IntCal04 calibration dataset (Reimer et al., 2004) which dated the baobab to between 485 and 565 years at mortality in 1966 with recruitment estimated between 1440 and 1520 CE. The period coincided with a pulse of higher rainfall identified in the LRV between 1400 and 1480 CE (Huffman and Woodborne, 2021).
Warming
Increased temperature and growth at SNR coincided with the 1976–1977 Global Warming Shift (Box 2). Most heatwaves (86%) occurred in the subsequent warming while 90% of freezing episodes occurred before 1976. The amplitude of ENSO after the climate shift was the highest recorded since 1590 CE and resulted in unusually recurrent El Niño episodes (IPCC, 2021). Seasonal variability increased from 1929–1976 (CV value 40.74%) to 1976–2020 (CV value 45.79%) and further in 1999–2020 (CV value 49.1%). NDJ rainfall (crucial to phenology) was slightly more variable before 1976–1977 (CV value of 51.1%) than after the climate shift (CV value of 47.5%). In contrast, higher CV values for FMA rainfall (important for ripening fruit) increased from 52.3% (1929–1976) to 74.9% (1976–2020). Between 1999–2020 the CV value rose to an extreme 82.7%.
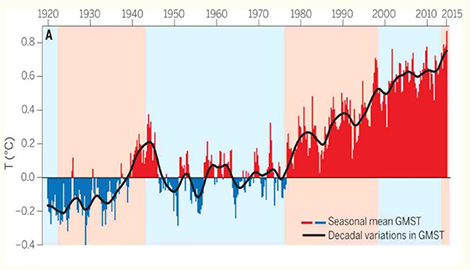
BOX 2 1976–1977 Global Warming Shift. Trenberth (2015). Reprinted with permission, AAAS.
Hydrological drought, topographic disturbance, and soils
Supplementary Figure 2 displays tree and cohort positions, topography, aspect, disturbance and hillslope profiles with slope and soil values. The hillslope toposequence consists of a main ridge and shoulder with the strongest growth (Trees 9, 10, 4, 8), backslope with the steepest gradient and runoff, and poorest growth (dead Trees 6, 15, 16, 17), deposition zone of quartz (dead Tree 14), and footslope (Tree 13) which extends off-site to the Sand River valley. Trees 5 and 7 lie off the main slope, Trees 1–3 lie on a secondary slope and Trees 11 and 12 lie on a steep side slope. Quartz outcrops along the main ridge and the sloping side ridges. Run-off has increased disturbance by transporting weather-resistant quartz rock and sediment downslope, exacerbating rock and soil displacement, erosion and gullying. The result is a central scour zone of sheet erosion bordered by gully erosion (Forestry Department Archives, 1967) and a deposition zone of quartz scree. Fractures that allow ponding were identified under dead Tree 6 and near Trees 5 and 7. Soil depths of between 330 and 700 mm indicate a shallow soil hydrology. Soil samples were analysed by Central Analytic Laboratories (CAL Lab), South Africa and identified as coarse-textured, stony, sandy, rapidly draining with decreased water retention and nutrient-poor. The alkaline soil with a pH of 7.93–8.38 is calcareous with low organic matter (Supplementary Figure 2). Calcium (Ca) levels were nearly double on the main ridge but phosphorous levels, typically prevalent in savannas according to CAL Labs, were low (P BRAY1 test).
Pests, pathogens, and dehydration
The largest group of cultures obtained resembled species of the Botryosphaeriaceae family and the genus Phoma obtained from diseased and healthy plant material. The Botryosphaeriaceae cultures were identified as Lasiodiplodia mahajangana based on sequencing of ITS and tef-1α. This latent pathogen is the most commonly isolated species from baobabs (Sakalidis et al., 2011; Cruywagen et al., 2017). It is mainly found in stems and can exist in healthy trees for long periods without causing any disease until the plant is stressed and is manifest in rotting of plant material (Cruywagen et al., 2017).
Other genera isolated include Microsphaeropsis, Paraconiothyrium, and Acremonium but none of these has been reported as causing disease on baobabs. None of the sampled baobabs hosted aggressive pathogens that could account for mortality. The same latent pathogens occurred in all trees (healthy, stressed, or diseased). Fungal infection was not the cause of the “powdery mildew” appearance on the sun-facing stem of Tree 3, observed from 2015, as initially suspected, but an unreported, possibly stress-related, physiological response. The cultures resembling Phoma sampled from Trees 2 and 3 were identified as a novel Didymella species. While the isolates collected were not able to cause significant disease when inoculated onto healthy trees in a greenhouse (data not shown), the species from this genus are well-known plant pathogens causing leaf blights (Moral et al., 2018) and stem cankers (Ahmadpour et al., 2017). The novel Didymella sp. may therefore still be classified as a potential pathogen able to cause disease when trees are stressed.
All trees at SNR displayed branch dieback. Discolouration of branch undersides was observed on-site during drought years and throughout the region at the end of the 2001–2007 drought. Dehydration was suspected as these areas had shrunk and the condition cleared in non-drought years.
Genetic diversity
Microsatellite loci are shown in Supplementary Table 3a (ST3a). The total number of alleles detected at each locus ranged from 10 to 24 (ST3b). Five loci were missing from the complete data matrix (one locus from three trees, two loci from a fourth tree). Observed heterozygosity was higher than expected for six out of the eight loci analysed with the overall heterozygosity for the population (0.935 ± SD 0.038) also slightly higher than expected (0.898 ± SD 0.014) (ST3c). Multi-locus inbreeding coefficients represent the degree of deviation from Hardy–Weinberg equilibrium, for both the total population (GIS = −0.033) and per cohort (GIS = −0.017 to −0.035), though only the measure of GIS for the total population and Cohort 03 are statistically significant (p = 0.006, p = 0.042, respectively) (ST3d). Individual heterozygosity (H) and d2 values for microsatellite loci are given in ST3e. The mean individual heterozygosity per cohort was 0.9018, 0.8606, and 0.9249 and d2 values were 14.2233, 12.1608, and 11.9953, respectively. Supplementary Figure 4 displays the range in cohorts and individual trees. The mean individual heterozygosity (H) per cohort was 0.9018, 0.8606, and 0.9249 and d2 values for microsatellite loci were 14.2233, 12.1608, and 11.9953, respectively. No correlation was found between individual heterozygosity and d2 values (r2 = 0.0476, F = 0.4997, p = 0.4958).
Discussion
The 90-year, daily and local climate-growth dataset provides a unique, long-term instrumental record of natural climate variability and response although it covered a fraction (∼11%) of the climate legacy of the oldest baobabs. Despite inconsistency in timing of tree measurements prior to 2003, data included all extreme climate events. The discussion evaluates response to climate variability, extreme climate and warming in dry conditions and the influence of genetic diversity and evolutionary legacy effects. It concludes by evaluating the two hypotheses: (1) The baobab is compromised by climate variability, extreme events, and climate change; (2) Depends for resilience primarily on higher genetic diversity and evolutionary legacy effects at the climate-variable, range edge in southern Africa.
Climate variability
Variability was primarily driven by ENSO (El Niño-Southern Oscillation) and the positive Indian Ocean Dipole (pIOD) (Supplementary Table 1). High interannual variability compounded risk from low rainfall. The pattern of decadal variability (Figure 3) contributed directly to the interdecadal droughts and disturbance from El Niño. The typically rain-bearing La Niña dominated LRV climate from 1999, driving 38% of ENSO events over the last 23 years, including the severe drought of 2011–2012 (Supplementary Table 1). In contrast to ENSO, the pIOD peaked in Austral spring, which co-occurred with baobab phenology in the study area, making it potentially another damaging driver. Temperature was far less variable than rainfall with CV values (1933–2020) of 2.7% for MAT and 1.8% per decade. Like rainfall, variability was higher during late rainfall (4.6%) than early rainfall (3.8%) seasons.
Recruitment, resource acquisition, and growth
Radiocarbon dating and paleoclimate suggest that recruitment was limited to infrequent wet and warm episodes estimated at between 60 and 160 years. Baobabs adopted an opportunistic fast-slow growth strategy dependent on resource acquisition. The finding mirrored other research in the genus where rainfall events allowed rapid water uptake and fast growth (Chapotin et al., 2006a) and early leaf flushing maximised photosynthesis (ibid). According to Chapotin et al. (2006b), “virtually no water was withdrawn to buffer water deficits.” A rare example of a dead but standing baobab without bark in the river valley below SNR is illustrated in Supplementary Figure 3 and would suggest that water reserves were not depleted even at mortality. Nonetheless, in the dry conditions at SNR, “contracting” and “cracking” soils around the base of baobabs and large roots in drought indicated water release from roots (Guy, 1970; Piearce et al., 1994). Late rainfall events extended canopy retention up to 6 weeks (Supplementary Figure 3) while reduced rainfall favoured a conservative, low growth-survival strategy. Vandegehuchte et al. (2015) found that the double syndrome of cortical photosynthesis in A. digitata increased carbohydrates during drought and high temperatures, or when trees were leafless.
Growth rates between 1930 and 2020 varied significantly between and within cohorts (Supplementary Table 1): Growth of Cohort 1 ranged between 53.8% (Tree 9) to 371% for youngest Tree 13. Growth of Cohort 2 ranged between 25.5% (Tree 10) to 64.4% (Tree 7). Largest Cohort 3 baobabs recorded lowest growth of between 1.2% (Tree 1) and 5.8% (Tree 5). The virtually stagnant growth in Tree 1 might have prevented the dieback observed in other baobabs over the past 20 years although historic dieback is evident (Supplementary Figure 3). The anomalous low growth of Trees 9 and 12 (Figure 6) in Cohort 1 was ascribed to a trade-off in Tree 9 from radial to height growth to increase the sunlight blocked by an adjacent tree (Nicolini et al., 2003; Supplementary Figure 3). The low growth of young Tree 12 was attributed to a trade-off with the resource-poor and steep mid-slope position (16.2%). Lacking the widespread, shallow root system found in mature baobabs, juveniles are less able to capture rainfall pulses.
Although growth is a standard measure for determining adaptation to a particular environment (Wieser et al., 2010), the accelerated growth over the past 20 years contrasted sharply with dehydration, canopy dieback and a novel Didymella pathogen. Growth was also moderated by topography and soils. All dead trees were located on the lower slope (Supplementary Figure 2). Baobabs grow best on the calcareous soils found on site (DAFF, 2012) but rapid draining, nutrient-poor and rocky soils support a relatively slow-growing vegetation (Lal, 2006). High phosphorous is a predictor of tropical deciduous species, including sister species, Cavanillesia platanifolia (Condit et al., 2013) but phosphorous levels at SNR were low for the African savanna and unavailable because of the high pH.
Extreme climate, dieback, and mortality risk
Extreme climate events over 90 years resulted in the highest mortality risk. “Numerous deaths” were observed during the combined drought and freezing events of the 1940s and 1960s (Guy, 1970), the coupled aridity-warming episodes during the 1980s and 1990s (Nicholson et al., 2018), record flooding in 2000 from Tropical Cyclone Eline (Reason and Keibel, 2004) and combined drought and heatwaves between 2001–2007; 2011–2012, and 2019–2020 (Supplementary Table 4). Meteorological drought was exacerbated by low temperatures, drought and disturbance as a result of hillslope runoff and erosion. Greatest mortality occurred on the lower slope (Supplementary Figure 2) which had the highest runoff and exposure to frost. Tropical baobabs are extremely vulnerable to frost (DAFF, 2012). The functional loss of relatively few and large xylem vessels (up to 346–364 μm) (Chapotin, 2005) would be unduly adverse (Chapotin et al., 2006b) as large vessel diameter is positively correlated with freezing-induced embolism (Hacke et al., 2017).
A trade-off between survival and growth at SNR is evident in the pervasive and progressive crown dieback and incomplete recovery (Supplementary Figure 3). Identified by White (1986), the process of dieback begins with low growth and progresses to root and crown dieback, epicormic growth (partial recovery) and ultimate stag-headedness (Supplementary Figure 3), but may lead to recovery at any stage, as Tree 5 confirms (Figure 6). Regarded as a sacrifice-survival response in diffuse-porous trees like baobabs (Piearce et al., 1994), dieback is poorly captured although prevalent in the region. It is historically linked to abrupt climate variations, progressive decline and pests and pathogens (ibid.). During periods of water stress, peripheral and replaceable parts of the tree (leaves and twigs) may be “sacrificed” to reduce xylem tension and delay embolism damage in the stem (Tyree et al., 1993). Guy (1970) predicted imminent mortality of Tree 5, but like the collapse of the apical branch in Tree 3 (Supplementary Figure 3), dieback is a trade-off that boosts hydraulic resistance by decreasing height, xylem tension and the costs of turgor maintenance (Zhang et al., 2009) as “highest leaves are the most expensive” (Zimmermann, 1978). The drought-adaptation strategy was evident in all baobabs at SNR as it reduces transpiration and reinstates a favourable water balance (homeostasis) to conserve water in the more vulnerable and costly stem (Zwieniecki and Secchi, 2014).
In contrast to global reports of increased mortality on ridgetops (McDowell et al., 2008), regional ridgetops and mid-to-upper hillslopes like SNR, were less affected than valleys (Piearce et al., 1994; Caplan, 1995). In the hot droughts during the late 1980s and 1990s and between 2001 and 2007, mortality was greater in the adjacent valleys (Caplan, 1995) and below the study site (Supplementary Figure 3). It would suggest that combined drought, frost and topography was a key factor in mortality.
Climate cycles and warming
Three prominent climate cycles occurred in the region during the life-history of the SNR baobabs. The first cycle between 880 to 1320 CE though variable, was wetter and slightly warmer than today (Tyson and Preston-Whyte, 2012). It coincided with the dominance of Cohort 3 in the region (Whyte et al., 1996). The second cycle, known as the “large cooling” between ∼1690 to 1720 CE (Sundqvist et al., 2013) was linked to the highest aridification over 6,600 years (Tyson and Preston-Whyte, 2012), decreased CO2 (Neukom et al., 2014b), and a gap in recruitment between Cohorts 2 and 3 determined by radiocarbon dating. The third and current cycle began with the abrupt warming shift in the tropical Pacific Ocean in 1976–1977 (Guilderson and Schrag, 1998; Trenberth, 2015), determined locally from coral oxygen isotopes (δ18O) (Zinke et al., 2014; Box 2). According to the IPCC (2021), the subsequent rate of warming exceeded any other 50-year period over the past 2000 years including the majority of heatwaves in the LRV (86%). The past four decades (1980–2020) were the hottest recorded since 1850. The aridity and warming between 1980 and 1998 following the climate shift had “no analogue” in the region (Nicholson et al., 2018). Although only “staghead” Tree 17 died at SNR (Supplementary Figure 3), mortality was reported in valleys adjacent to SNR (Caplan, 1995), Zimbabwe (Piearce et al., 1994), and the Kruger National Park (5.vegetation.pdf).4 Regional mortality from Tropical Cyclone Eline in 2000 indicated that risk factors included excessive moisture.
Baobabs responded to warming with higher overall growth and dips in dry or drought years (Figure 6) which indicates little or no climate lag as reported for other long-lived species (IPCC, 2014, quoted in Falk et al., 2019). The evolution of Adansonia digitata in the Pliocene (Zizka et al., 2020) suggests that the species likely survived temperatures at least as high, and possibly higher than predicted for the near future (Dick et al., 2013). Increased growth in warming reflects the strong correspondence between temperature and CO2 concentration (NOAA, 2022). Warming increased woody encroachment on site (Supplementary Figure 2). Multiple studies in the LRV report elevated CO2 (eCO2) fertilisation (Scheiter et al., 2018 and references therein), analogous to the denser tree cover recorded during warm and humid climate shifts in the LRV from the mid-Holocene (Lee-Thorp et al., 2001). Although higher temperatures may benefit baobabs which recycle carbon, as eCO2 promotes greater efficiency in water use (Vandegehuchte et al., 2015), observations during the protracted drought between 2001 and 2007 emphasised the threat of “hot drought” when water stress, dehydration, canopy dieback, pests and pathogens were identified at SNR and across the region (Cruywagen et al., 2017).
Resilience: High genetic diversity, evolutionary legacy effects, and regeneration
Adaptive capacity to environmental conditions, including high genetic diversity, evolutionary legacy effects and regeneration, was the primary contributor to resilience. Although the demographic history of the African baobab has not been thoroughly studied across the range, the higher than expected heterozygosity under Hardy–Weinberg equilibrium at SNR is consistent with baobab genetic diversity found in the LRV (Tivakudze, 2014; Venter et al., 2017), West Africa (Assogbadjo et al., 2005; Ndoye et al., 2013), and long-lived, outcrossing trees (Rodríguez-Quilón et al., 2015). It would suggest that climate variability and range shifts led to selection pressures (reviewed in Pauls et al., 2013). The adaptive trait may reflect increased fitness and response to environmental conditions and range shifts (Pauls et al., 2013; Engelhardt et al., 2014), Numerous empirical studies demonstrate correlations between heterozygosity and fitness (Shikano and Taniguchi, 2002; Da Silva et al., 2009) that allow higher resilience and wider ecological amplitude (Soltis and Soltis, 2000).
Evolutionary legacy effects included drought-avoidance traits of leaf shedding, water storage and retention, and cortical photosynthesis which are shared with the Neotropical genus, Cavanillesia (Wolfe et al., 2016; Wolfe, 2017, Wolfe, personal communication, 2021), and tolerance to warming (Dick et al., 2013). Baobabs share similar response to disturbance as Neotropical forests with longevity trade-offs with low growth and recruitment (Rüger et al., 2020). The additional trade-off between low growth and reproduction, or maturity, at SNR has not been reported. Stem water storage and retention provided the necessary turgor, as depletion of stem water reserves would result in structural failure, because of the weak, low-density wood (Piearce et al., 1994). A rare example of a dead but standing baobab without bark in the river valley below SNR is illustrated in Supplementary Figure 3, suggesting that water reserves were not depleted at mortality.
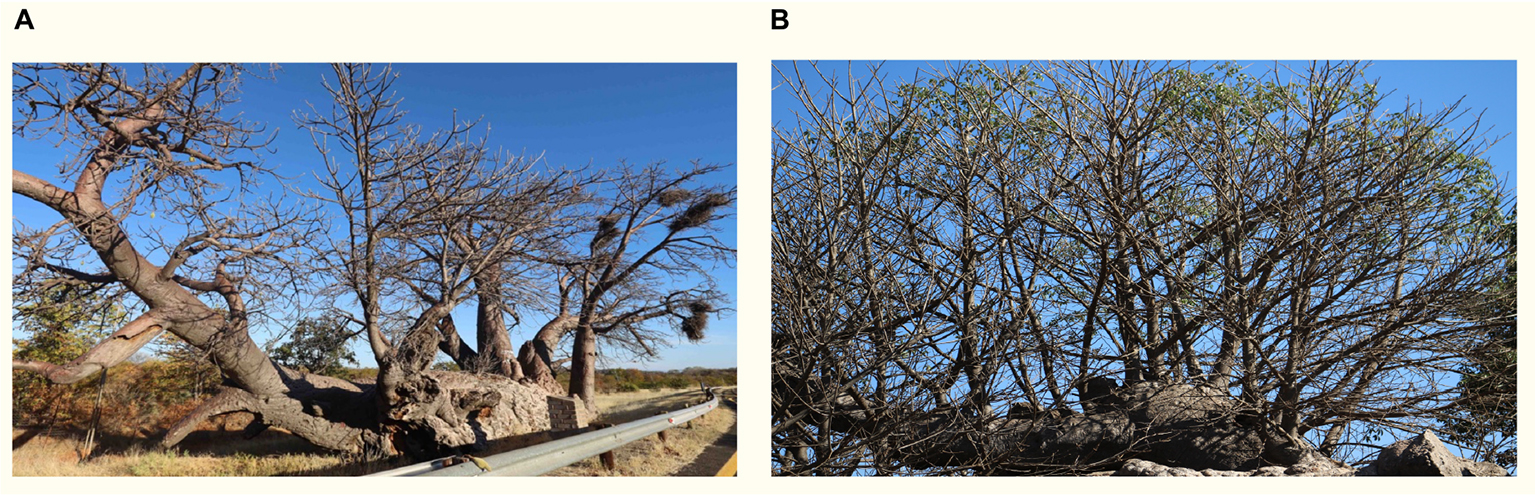
The African baobab evolved in disturbed, fire-prone ecosystems and is a resprouter (Wickens and Lowe, 2008; Supplementary Figure 3 and Box 3). Resprouting allows faster recovery from disturbance (Clarke et al., 2013) although trade-offs may be significant, for example, lower recruitment rates and longer time to maturity (ibid.) which our findings demonstrate. The persistence trait has substantial benefits: Resprouters produce new xylem conduits quickly (Gleason et al., 2014) and can maintain living tissue despite an almost complete loss of xylem conductance at least in the short-term (Blackman et al., 2019), which allows drought-adapted taxa with stored water to survive for months (Körner, 2019). The advantage of resprouting is that loss of biomechanical integrity and collapse may not imply mortality as suggested by the “demise” of large baobabs reported in southern Africa (Patrut et al., 2018). Only ∼4 of the 22 baobabs listed had died by 2020. Others, for example in Box 3, survived by resprouting.
BOX 3 Resilience through resprouting. (A) Lêboom, 8 km from Skelmwater, winter 2019. (B) Glencoe Baobab in 2018 after collapse in 2009.
Baobabs are the only known tree species to survive complete girdling (Fisher, 1981). Extensive scarring by elephants of Cohort 3 bark and human harvesting of Tree 7 (fully girdled) and Trees 9, 10, and 11 (at least halfway girdled) have regenerated from parenchyma below the exposed xylem.
Conclusion
Nearly a century of evidence confirmed the hypotheses that baobabs are compromised by climate variability, extreme events and climate change, and depend for resilience on higher genetic diversity and evolutionary legacy effects of stem water storage, longevity trade-offs of low growth and recruitment, as well as reproduction at SNR. Evolution of resprouting in disturbed, fire-prone ecosystems and bark regeneration increased recovery from disturbance. Adaptive capacity revealed why survival trumped growth and enabled colonisation at the edge of the range in the climate-variable, African drylands. Biogeographic origins in the Neotropical forest dispel the myth that the African baobab is a xeric succulent. Like other members of the Bombacoideae, the baobab is a woody tree species with origins in the Neotropics (Zizka et al., 2020). Higher mortality on lower slopes from combined frost and drought events prior to the 1976-1977 Global Warming Shift, contrasted with global findings of highest intraspecific tree mortality on dry, sun-facing ridgetops (McDowell et al., 2008). Although warming accelerated growth, hot droughts were a significant mortality risk in older trees.
Targeting future mortality risk should include the longevity cost of elevated CO2-driven growth and the consequences of heightened disturbance from increased climate variability. According to the IPCC (2021), “it is virtually certain” that El Niño–Southern Oscillation (ENSO) will remain the dominant mode of interannual variability in a warmer world where MAP will decrease up to 10% and MAT will rise by 2°–3°C (ibid). As the southern hemisphere tropics is one of two identified global hotspots with amplified hot years (Zeng et al., 2021), the potentially heightened disturbance from climate variability, hot droughts and increased landfalling tropical cyclones from the rapidly warming, tropical SWIO (Muthige et al., 2018; Cai et al., 2020), higher than the other oceans (IPCC, 2021), magnifies mortality risk for “Africa’s favourite tree” (New Scientist, 1991).
Data availability statement
All data are provided except for climate and radiocarbon data. The radiocarbon data analyzed in this study was obtained from NOSAMS, and 3rd party restrictions might apply. Requests to access these datasets should be directed to https://www2.whoi.edu/site/nosams/. Climate data requires official permission/authorization. The site for the authorized climate data is https://www.weathersa.co.za/home/aboutclimateatsaws.
Ethics statement
The sampling of material was collected under scientific research permit: 0090-MKT001-00003 issued by the Limpopo Provincial Government, South Africa.
Author contributions
DM: conception and drafts. DM, NK, and EC: fieldwork and data collection (2003–2020). NK: genetics. EC: pathology. PC: topography and site diagrams. VG and DM: statistics. All authors contributed to the article and approved the submitted version.
Acknowledgments
This article was dedicated to Graham Guy, a former forester in Rhodesia (Zimbabwe), whose voluntary assistance provided invaluable observations and data during the severe drought in the 1960s and enabled the radiocarbon dating of Tree 15. We thank the Department of Forestry, Georg von dem Bussche and the late Gerald Wickens for encouragement, Colleen de Villiers at the South African Weather Service (SAWS) for climate data, and those who assisted on-site, and with data or advice: Sarah Venter, Anthony Mayne, Peter Guy, David Baum, Chris Reason, Ed. Witkowski, Johan Wolfwaardt, Garry Paterson, Karen Burgers, Adrian Patrut, Paul Thomas, and Roger Wicks.
Conflict of interest
The authors declare that the research was conducted in the absence of any commercial or financial relationships that could be construed as a potential conflict of interest.
Publisher’s note
All claims expressed in this article are solely those of the authors and do not necessarily represent those of their affiliated organizations, or those of the publisher, the editors and the reviewers. Any product that may be evaluated in this article, or claim that may be made by its manufacturer, is not guaranteed or endorsed by the publisher.
Supplementary material
The Supplementary Material for this article can be found online at: https://www.frontiersin.org/articles/10.3389/ffgc.2022.1036636/full#supplementary-material
Footnotes
References
Abram, N. J., Wright, N. M., Ellis, B., Dixon, B. C., Wurtzel, J. B., England, M. H., et al. (2020). Coupling of Indo-Pacific climate variability over the last millennium. Nature 579, 385–392. doi: 10.1038/s41586-020-2084-4
Adams, H. D., Zeppel, M. J. B., Anderegg, W. R. L., Hartmann, H., Landhäusser, S. M., Tissue, D. T., et al. (2017). A multi-species synthesis of physiological mechanisms in drought-induced tree mortality. Nat. Ecol. Evol. 1, 1285–1291. doi: 10.1038/s41559-017-0248-x
Ahmadpour, S. A., Farokhinejad, R., and Mehrabi-Koushki, M. (2017). Further characterization and pathogenicity of Didymella microchlamydospora causing stem necrosis of Morus nigra in Iran. Mycosphere 8, 835–852. doi: 10.5943/mycosphere/8/7/3
Allen, C. D., Breshears, D. D., and McDowell, N. (2015). On underestimation of global vulnerability to tree mortality and forest die-off from hotter drought in the Anthropocene. Ecosphere 6, 1–55.
Assogbadjo, A. E., Sinsin, B., Codjia, J. T. C., and Van Damme, P. (2005). Ecological diversity and pulp, seed and kernel production of the baobab (Adansonia digitata) in Benin. Belg. J. Bot. 138, 47–56. doi: 10.1093/aob/mcl043
Baum, D. A. (1995). A systematic revision of Adansonia (Bombacaceae). Ann. Mo. Bot. Gard. 82, 440–470. doi: 10.2307/2399893
Baum, D. A., and Oginuma, K. (1994). A Review of Chromosome Numbers in Bombacaceae with New Counts for Adansonia. Taxon 43, 11–20. doi: 10.2307/1223456
Blackman, C. J., Creek, D., Maier, C., Aspinwall, M. J., Drake, J. E., Pfautsch, S., et al. (2019). Drought response strategies and hydraulic traits contribute to mechanistic understanding of plant dry-down to hydraulic failure. Tree Physiol. 39, 910–924. doi: 10.1093/treephys/tpz016
Borchert, R. (1994). Soil and stem water storage determine phenology and distribution of tropical dry forest trees. Ecology 75, 1437–1449.
Brodribb, T. J., Powers, J., Cochard, H., and Choat, B. (2020). Hanging by a thread? Forests and drought. Science 36, 261–266. doi: 10.1126/science.aat763
Cai, W., Wu, L., Li, T., Lengaigne, M., McGregor, S., Kug, J.-S., et al. (2019). Pantropical climate interactions. Science 363:eaav4236. doi: 10.1126/science.aav436
Cai, W., Yang, K., Wu, L., Huang, G., Santoso, A., and Ng, B. (2020). Opposite response of strong and moderate positive Indian Ocean Dipole to global warming. Nat. Clim. Change 11, 27–32. doi: 10.1038/s41558-020-00943-1
Carvalho-Sobrinho, J. G., Alverson, W. S., Alcantara, S., Queiroz, L., Mota, A. C., and Baum, D. A. (2016). Revisiting the phylogeny of Bombacoideae (Malvaceae): Novel relationships, morphologically cohesive clades, and a new tribal classification based on multilocus phylogenetic analyses. Mol. Phylogenet. Evol. 101, 56–74. doi: 10.1016/j.ympev.2016.05.006
Cavender-Bares, J., Ackerly, D., Hobbie, S., and Townsend, P. (2016). Evolutionary legacy effects on ecosystems: Biogeographic origins, plant traits, and implications for management in the era of global change. Annu. Rev. Ecol. Evol. Syst. 47, 433–462.
Cernusak, L. A., and Cheeseman, A. W. (2015). The benefits of recycling: How photosynthetic bark can increase drought tolerance. New Phytol. 208, 995–997. doi: 10.1111/nph.13723
Chapotin, S. M. (2005). Why are Baobab Trees so fat? Water relations and biomechanics in the genus Adansonia L. PhD thesis. Boston: Harvard University.
Chapotin, S. M., Razanameharizaka, J. H., and Holbrook, N. M. (2006a). Baobab trees (Adansonia) in Madagascar use stored water to flush new leaves but not to support stomatal opening prior to the rainy season. New Phytol. 169, 549–559. doi: 10.111/j.1469-8137.2005.01618.x
Chapotin, S. M., Razanameharizaka, J. H., and Holbrook, N. M. (2006b). A biomechanical perspective on the role of large stem volume and high water content in baobab trees (Adansonia spp). Am. J. Bot. 2006, 1251–1264. doi: 10.3732/ajb.93.9.1251
Choat, B., Jansen, S., Brodribb, T. J., Cochard, H., Delzon, S., Bhaskar, R., et al. (2012). Global convergence in the vulnerability of forests to drought. Nature 491, 752–755. doi: 10.1038/nature11688
Clarke, P. J., Lawes, M. J., Midgley, J. J., Lamont, B. B., Ojeda, F., Burrows, G. E., et al. (2013). Resprouting as a key functional trait: How buds, protection and resources drive persistence after fire. New Phytol. 197, 19–35. doi: 10.1111/nph.12001
Condit, R., Engelbrecht, B. M., Pino, D., Pérez, R., and Turner, B. L. (2013). Species distributions in response to individual soil nutrients and seasonal drought across a community of tropical trees. PNAS 110:13. doi: 10.1073/pnas.1218042110
Coulson, T. N., Pemberton, J. M., Albon, S. D., Beaumont, M., Marshall, T. C., Slate, J., et al. (1998). Microsatellites reveal heterosis in red deer. Proc. R. Soc. B 265, 489–495. doi: 10.1098/rspb.1998.0321
Cron, G. V., Karimi, N., Glennon, K. L., Udeh, C. A., Witkowski, E. T. F., Venter, S. M., et al. (2016). One African baobab species or two? Synonymy of Adansonia kilima and A. digitata. Taxon 5, 1037–1049. doi: 10.12705/655.6
Cruywagen, E. M., Crous, P., Roux, J., Slippers, B., and Wingfield, M. J. (2015). Fungi associated with black mould on baobab trees in southern Africa. Antonie Van Leeuwenhoe 108, 85–95. doi: 10.1007/s10482-015-0466-7
Cruywagen, E. M., Slippers, B., Roux, J., and Wingfield, M. J. (2017). Phylogenetic species recognition and hybridisation in Lasiodiplodia: A case study on species from baobabs. Fungal Biol. 121, 420–436. doi: 10.1016/j.funbio.2016.07.014
Da Silva, A., Gaillard, J. M., Yoccoz, N. G., Hewison, A. J., Galan, M., Coulson, T., et al. (2009). Heterozygosity-fitness correlations revealed by neutral and candidate gene markers in roe deer from a long-term study. Evolution 63, 403–417. doi: 10.1111/j.1558-5646.2008.00542.x
DAFF (Department of Agriculture, Forestry and Fisheries), South Africa (2012). Available online at: nda.agric.za/docs/Brochures/Baobab.pdf/www.daff.gov.za
Darriba, D., Taboada, G., Doallo, R., and Posada, D. (2012). jModelTest 2: More models, new heuristics and parallel computing. Nat Methods 9:772. doi: 10.1038/nmeth.2109
De Schepper, V., van Dusschoten, D., Copini, P., Jahnke, S., and Steppe, K. (2012). MRI links stem water content to stem diameter variations in transpiring trees. J. Exp. Bot. 63, 2645–2653. doi: 10.1093/jxb/err445
De Swaef, T., De Schepper, V., Vandegehuchte, M. W., and Steppe, K. (2015). Stem diameter variations as a versatile research tool in ecophysiology. Tree Physiol. 35, 1047–1061. doi: 10.1093/treephys/tpv080
De Villiers, P. C. (1951). Die Kremetartboom (Adansonia digitata). J. South Afr. For. Assoc. 29, 9–18.
Dick, C. W., Lewis, S. L., Maslin, M., and Bermingham, E. (2013). Neogene origins and implied warmth tolerance of Amazon tree species. Ecol. Evol. 3, 162–169. doi: 10.1002/ece3.441
Engelhardt, K. A., Lloyd, M. W., and Neel, M. C. (2014). Effects of genetic diversity on conservation and restoration potential at individual, population, and regional scales. Biol. Cons. 179, 6–16. doi: 10.1016/j.biocon.2014.08.011
Falk, D. A., Watts, A. C., and Thode, A. E. (2019). Conservation and restoration ecology. Front. Ecol. Evol. 7:275. doi: 10.3389/fevo.2019.00275
Fenner, M. (1980). Some measurements on the water-relations of baobab trees. Biotropica 12, 205–209. doi: 10.2307/2387972
Fisher, J. B. (1981). Wound healing by exposed secondary xylem in Adansonia (Bombacaceae). IAWA Bull. 2, 193–199.
Gleason, S. M., Blackman, C. J., Cook, A. M., Laws, C. A., and Westoby, M. (2014). Whole-plant capacitance, embolism resistance and slow transpiration times in woody angiosperms from arid and wet habitats. Tree Physiol. 34, 275–284. doi: 10.1093/treephys/tpu001
Guilderson, T. P., and Schrag, D. P. (1998). Abrupt shift in subsurface temperatures in the eastern tropical Pacific associated with recent changes in El Niño. Science 281, 240–243. doi: 10.1126/science.281.5374.240
Guindon, S., and Gascuel, O. (2003). A simple, fast and accurate method to estimate large phylogenies by maximum-likelihood. Syst. Biol. 52, 696–704. doi: 10.1080/10635150390235520
Gutschick, V. P., and BassiriRad, H. (2010). Biological extreme events: Theoretical and practical challenges. Trans. Am. Geophys. Union 91, 84–85. doi: 10.1098/rstb.2015.0274
Guy, G. L. (1970). Adansonia digitata and its rate of growth in relation to rainfall in south-central Africa. Proc. Trans. Rhodes. Sci. Assoc. 54, 68–84.
Guy, P. R. (1982). Baobabs and Elephants. Afr. J. Ecol. 20, 215–220. doi: 10.1111/j.13652028.1982.tb00295.x
Hacke, U. G., Spicer, R., Schreiber, S. G., and Plavcová, L. (2017). An ecophysiological and developmental perspective on variation in vessel diameter. Plant Cell Environ. 40, 831–845. doi: 10.1111/pce.12777
Hannaford, M., Jones, J., and Bigg, G. (2015). Early-nineteenth century southern African precipitation reconstructions from ships’ logbooks. Holocene 25, 379–390. doi: 10.1177/0959683614557573
Hartmann, H., Moura, C. F., Anderegg, W. R., Ruehr, N. K., Salmon, Y., Allen, C. D., et al. (2018). Research frontiers for improving our understanding of drought-induced tree and forest mortality. New Phytol. 218, 15–28. doi: 10.1111/nph.15048
Heisler, J. L., and Weltzin, J. F. (2006). Variability Matters: Towards a Perspective on the Influence of Precipitation on Terrestrial Ecosystems. New Phytol. 172, 189–192. doi: 10.1111/j.1469-8137.2006.01876.x
Huffman, T. N., and Woodborne, S. (2021). Implications of new AMS dates for the Khami Period in the Mapungubwe Landscape. S. Afr. J. Sci. 117, 7–8. doi: 10.17159/sajs.2021/9438
IPCC (2014). AR5 synthesis report of the contribution of working groups I, II and III to the fifth assessment report, intergovernmental panel on climate change. Geneva: IPCC.
IPCC. (2021). “Climate Change 2021: The Physical Science Basis,” in Contribution of Working Group I to the Sixth Assessment Report of the Intergovernmental Panel on Climate Change, eds V. Masson-Delmotte, A. Zhai, S. L. Pirani, C. Connors, S. Pean, N. Berger, et al. (Cambridge, MA: Cambridge University Press).
Jordaan, J. J., Wessels, D. C. J., Dannhauser, C. S., and Rootman, G. T. (2004). Secondary succession in the Mopani veld of the Limpopo Valley. South Afr. Afr. J. Range For. Sci. 21, 205–210.
Körner, C. (2019). No need for pipes when the well is dry—a comment on hydraulic failure in trees. Tree Physiol. 39, 695–700. doi: 10.1093/treephys/tpz030
Kotina, E. L., Oskolski, A. A., Tilney, P. M., and van Wyk, B.-E. (2017). Bark anatomy of Adansonia digitata L. (Malvaceae). Adansonia Sér. 3 39, 31–40. doi: 10.5252/a2017n1a3
Larsen, A. S., Vaillant, A., Verhaegen, D., and Kjær, E. D. (2009). Eighteen SSR-primers for tetraploid Adansonia digitata and its relatives. Conserv. Genet. Resour. 1, 325–328. doi: 10.1007/s12686-009-9095-y
Lee-Thorp, J. A., Holmgren, K., Lauritzen, S. E., Linge, H., Moberg, A., and Tyson, P. (2001). Rapid climate shifts in the southern African interior throughout the mid to Late Holocene. Geophys. Res. Lett. 28, 4507–4510. doi: 10.1029/2000GL012728
Leong Pock Tsy, J. M., Lumaret, R., Mayne, D. H., Vall, A. O., Abutaba, Y. I., and Danthu, P. (2009). Chloroplast DNA phylogeography suggests a West African centre of origin for the baobab, Adansonia digitata L. (Bombacoideae, Malvaceae). Mol. Ecol. 18, 1707–1715. doi: 10.1111/j.1365-294X.2009.04144.x
Linder, H. P. (2014). The evolution of African plant diversity. Front. Ecol. Evol. 2:38. doi: 10.3389/fevo.2014.00038
Linnakoski, R., de Beer, Z. W., Rousi, M., Niemelä, P., Pappinen, A., and Wingfield, M. J. (2008). Fungi, including Ophiostoma karelicum sp. nov., associated with Scolytus ratzeburgi infesting birch in Finland and Russia. Mycol. Res. 112, 1475–1488. doi: 10.3767/003158509X468038
Lopez, O. R., and Kursar, T. A. (2003). Does flood tolerance explain tree species distribution in tropical seasonally flooded habitats? Oecologia 136, 193–204. doi: 10.1007/s00442-003-1259-7
Manatsa, D., Chingombe, C. H., and Matarira, C. H. (2008). The impact of the positive Indian Ocean dipole on Zimbabwe droughts. Int. J. Climatol. 28, 2011–2029. doi: 10.1002/joc.1695
Matusick, G., Ruthrof, K. X., Kala, J., Brouwers, N. C., Breshears, D. D., and Hardy, G. E. S. J. (2018). Chronic historical drought legacy exacerbates tree mortality and crown dieback during acute heatwave-compounded drought. Environ. Res. Lett. 13:095002. doi: 10.1088/1748-9326/aad8cb
McCormac, F. G., Hogg, A. G., Blackwell, P. G., Buck, C. E., Higham, T. F. G., and Reimer, P. J. (2004). SHCal04 Southern Hemisphere calibration, 0-11.0 cal kyr BP. Radiocarbon 46, 1087–1092. doi: 10.1017/S0033822200033014
McDowell, N., Pockman, W. T., Allen, C. D., Breshears, D. D., Cobb, N., Kolb, T., et al. (2008). Mechanisms of plant survival and mortality during drought: Why do some plants survive while others succumb to drought? New Phytol. 178, 719–739. doi: 10.1111/j.1469-8137.2008.02436.x
McDowell, N. G., Allen, C. D., Anderson-Teixeira, K., Aukema, B. H., Bond-Lamberty, B., Chini, L., et al. (2020). Pervasive shifts in forest dynamics in a changing world. Science 368:eaaz9463. doi: 10.1126/science.aaz9463
Meirmans, P. G., and Van Tienderen, P. H. (2004). Genotype and Genodive: Two Programs for the analysis of genetic diversity of asexual organisms. Mol. Ecol. Notes 4, 792–794. doi: 10.1111/j.1471-8286.2004.00770.x
Moral, J., Lichtemberg, P. S. F., Papagelis, A., Sherman, J., and Michailides, T. J. (2018). Didymella glomerata causing leaf blight on pistachio. Eur. J. Plant Pathol. 151, 1095–1099. doi: 10.1007/s10658-018-1422-y
Muthige, M. S., Malherbe, J., Engelbrecht, F. A., Grab, S., Beraki, A., Maisha, T. R., et al. (2018). Projected changes in tropical cyclones over the South West Indian Ocean under different extents of global warming. Environ. Res. Lett. 13:065019.
Ndoye, A. L., Diome, T., Gueye, M. C., Sembene, M., and Sy, M. O. (2013). Genetic diversity and demographic evolution of baobab (Adansonia digitata L. Bombacoideae, Malvaceae) populations in Senegalese Sahelian areas. Afr. J. Biotechnol. 12, 5627–5639. doi: 10.5897/AJB2013.12431
Neukom, R., Nash, D., Endfield, G., Grab, S., Grove, C., Kelso, C., et al. (2014a). Multi-proxy summer and winter precipitation reconstruction for southern Africa over the last 200 years. Clim. Dyn. 42, 2713–2726. doi: 10.1007/s00382-013-1886-6
Neukom, R., Gergis, J., Karoly, D. J., Wanner, H., Curran, M., Elbert, J., et al. (2014b). Inter-hemispheric temperature variability over the last millennium. Nat. Clim. Change 4, 362–367. doi: 10.1038/NCLIMATE2174
New, M., Hulme, M., and Jones, P. (2000). Representing twentieth-century space–time climate variability, part II: Development of 1901–96 monthly grids of terrestrial surface climate. J. Clim. 13, 2217–2238. doi: 10.1175/1520-04422000013<2217:RTCSTC<2.0.CO;2
Nicholson, S. E., Funk, C., and Fink, A. H. (2018). Rainfall over the African continent from the 19th through the 21st century. Glob. Planet Change 165, 114–127. doi: 10.1016/j.gloplacha.2017.12.014
Nicolini, E., Caraglio, Y., Pélissier, R., Leroy, C., and Roggy, J.-C. (2003). Epicormic branches: A growth indicator for the tropical forest tree, Dicorynia guianensis Amshoff (Caesalpiniaceae). Ann. Bot. 92, 97–105. doi: 10.1093/aob/mcg119
NOAA (2022). Greenhouse gas pollution trapped 49% more heat in 2021 than in 1990, NOAA finds. Available online at: https://research.noaa.gov/article/ArtMID/587/ArticleID/2877
O’Brien, M. J., Leuzinger, S., Philipson, C. D., Tay, J., and Hector, A. (2014). Drought survival of tropical tree seedlings enhanced by non-structural carbohydrate levels. Nat. Clim. Change 4, 710–714. doi: 10.1038/nclimate2281
Patrut, A., von Reden, K., Mayne, D. H., Lowy, D., and Patrut, R. (2013). AMS radiocarbon investigation of the African baobab: Searching for the oldest tree. Nucl. Instrum. Methods Phys. Res. B 294, 622–626. doi: 10.1016/j.nimb.2012.04.025
Patrut, A., Woodborne, S., Patrut, R. T., Rakosy, L., Lowy, D. A., Hall, G., et al. (2018). The demise of the largest and oldest African baobabs. Nat. Plants 4, 423–426. doi: 10.1038/s41477-018-0170-5
Pauls, S. U., Nowak, C., Bálint, M., and Pfenninger, M. (2013). The impact of global climate change on genetic diversity within populations and species. Mol. Ecol. 22, 925–946. doi: 10.1111/mec.12152
Perez, T. M., Stroud, J. T., and Feeley, K. J. (2016). Thermal trouble in the tropics. Science 352, 1393–1393. doi: 10.1126/science.aaf3343
Piearce, G. D., Calvert, G. M., Sharp, C., and Shaw, P. (1994). Sooty Baobabs - Disease or Drought?. Zimbabwe: Zimbabwe Forestry Commission.
Rajput, K. R. (2004). Formation of unusual tissue complex in the stem of Adansonia digitata. Linn. Betr. Biol. Pflanzen 73, 331–342.
Rapolaki, R. S., Blamey, R. C., Hermes, J. C., and Reason, C. J. C. (2019). A classification of synoptic weather patterns linked to extreme rainfall over the Limpopo River Basin in southern Africa. Clim. Dyn. 53, 2265–2279. doi: 10.1007/s00382-019-04829-7
Reason, C. J. C., Hachigonta, S., and Phaladi, R. F. (2005). Interannual variability in rainy season characteristics over the Limpopo region of southern Africa. Int. J. Climatol. 25, 1835–1853. doi: 10.1002/joc.1228
Reason, C. J. C., and Keibel, A. (2004). Tropical cyclone eline and its unusual penetration and impacts over the southern african mainland. Weather Forecast. 19, 789–805. doi: 10.1175/1520-0434(2004)019<0789:TCEAIU>2.0.CO;2
Reason, C. J. C., and Smart, S. (2015). Tropical south east Atlantic warm events and associated rainfall anomalies over southern Africa. Front. Environ. Sci. 3:24. doi: 10.3389/fenvs.2015.00024
Reichstein, M., Bahn, M., Ciais, P., Frank, D., Mahecha, M. D., Seneviratne, S. I., et al. (2013). Climate extremes and the carbon cycle. Nature 500, 287–295. doi: 10.1038/nature12350
Reimer, P. J., Baillie, M. G. L., Bard, E., Bayliss, A., Beck, J. W., Bertrand, C. J. H., et al. (2004). IntCal04 Terrestrial Radiocarbon Age Calibration, 0–26 cal kyr BP. Radiocarbon 46, 1029–1058. doi: 10.1017/S0033822200032999
Reimer, P. J., Baillie, M. G. L., Bard, E., Bayliss, A., Beck, J. W., Bertrand, C. J. H., et al. (2009). IntCal09 and Marine09 radiocarbon age calibration curves, 0–50,000 years cal BP. Radiocarbon 51, 1111–1150. doi: 10.1017/S0033822200034202
Rodríguez-Quilón, I., Santos-del-Blanco, L., Grivet, D., Jaramillo-Correa, J. P., Majada, J., Vendramin, G. G., et al. (2015). Local effects drive heterozygosity–fitness correlations in an outcrossing long-lived tree. Proc. R. Soc. B 282:20152230. doi: 10.1098/rspb.2015.2230
Rüger, N., Condit, R., Dent, D. H., DeWalt, S. J., Hubbell, S. P., Lichstein, J. W., et al. (2020). Demographic trade-offs predict tropical forest dynamics. Science 360, 165–168. doi: 10.1126/science.aaz4797
Sakalidis, M. L., Hardy, G. E. S., and Burgess, T. I. (2011). Endophytes as potential pathogens of the baobab species Adansonia gregorii: A focus on Botryosphaeriaceae. Fungal Ecol. 4, 1–14. doi: 10.1016/j.funeco.2010.06.001
Scheiter, S., Gaillard, C., Martens, C., Erasmus, B. F. N., and Pfeiffer, M. (2018). How vulnerable are ecosystems in the Limpopo province to climate change? S. Afr. J. Bot. 116, 86–95. doi: 10.1016/j.sajb.2018.02.394
Schwalm, C. R., Anderegg, W. R. L., Michalak, A. M., Fisher, J. B., Biondi, F., Koch, G., et al. (2017). Global patterns of drought recovery. Nature 548, 202–205. doi: 10.1038/nature23021
Seddon, A., Macias-Fauria, M., and Long, P. (2016). Sensitivity of global terrestrial ecosystems to climate variability. Nature 531, 229–232. doi: 10.1038/nature16986
Shikano, T., and Taniguchi, N. (2002). Relationships between genetic variation measured by microsatellite DNA markers and a fitness-related trait in the guppy (Poecilia reticulata). Aquaculture 209, 77–90. doi: 10.1016/S0044-8486(01)00812-2
Simbo, D. J., Van den Bilcke, N., and Samson, R. (2013). Contribution of corticular photosynthesis to bud development in the African baobab (Adansonia digitata L.) and castor bean (Ricinus communis L.) seedlings. Environ. Expert Bot. 95, 1–5.
Smith, M. D. (2011). An ecological perspective on extreme climatic events: A synthetic definition and framework to guide future research. J. Ecol. 99, 656–663. doi: 10.1111/j.1365-2745.2011.01798.x
Soltis, P. S., and Soltis, D. E. (2000). The role of genetic and genomic attributes in the success of polyploids. PNAS 97, 7051–7057. doi: 10.1073/pnas.97.13.7051
Sundqvist, H. S., Holmgren, K., Fohlmeister, J., Zhang, Q., Bar Matthews, M., Spötl, C., et al. (2013). Evidence of a large cooling between 1690 and 1740AD in southern Africa. Sci. Rep. 3:1767. doi: 10.1038/srep01767
Swanepoel, C. M. (1993). Baobab phenology and growth in the Zambezi Valley. Zimbabwe. Afr. J. Ecol. 31, 84–86. doi: 10.1111/j.1365-2028.1993.tb00522.x
Therrell, M. D., Stahle, D. W., Ries, L. P., and Schugart, H. H. (2006). Tree-ring reconstructed rainfall variability in Zimbabwe. Clim. Dyn. 26, 677–685. doi: 10.1007/s00382-005-0108-2
Thomas, D. S. G., and Burrough, S. L. (2012). Interpreting geoproxies of late Quaternary climate change in African drylands: Implications for understanding environmental change and early human behaviour. Quat. Int. 253, 5–17.
Thomas, S. C. (2011). “Age-Related Changes in Tree Growth and Functional Biology: The Role of Reproduction,” in Size and Age-Related Changes in Tree Structure and Function, eds F. C. Meinzer, B. Lachenbruch, and T. E. Dawson (Dordrecht: Springer).
Tivakudze, R. (2014). Assessing ploidy-level and gene flow between baobab (Adansonia digitata) fruit producers and poor producers in Limpopo. Ph.D thesis. Johannesburg: University of the Witwatersrand.
Trenberth, K. E. (2015). Has there been a hiatus? Science 349, 691–692. doi: 10.1126/science.aac9225
Trenberth, K. E., Dai, A., Rasmusen, M., and Parsons, D. B. (2003). The changing character of precipitation. Bull. Am. Meteor. Soc. 84, 1205–1217. doi: 10.1175/BAMS-84-9-1205
Trenberth, K. E., Dai, A., van der Schrier, G., Jones, P. D., Barichivich, J., Briffa, K. R., et al. (2014). Global warming and changes in drought. Nat. Clim. Change 4, 17–22. doi: 10.1038/NCLIMATE2067
Tyree, M. T., Cochard, H., Cruiziat, P., Sinclair, B., and Ameglio, T. (1993). Drought-induced leaf shedding in walnut – evidence for vulnerability segmentation. Plant Cell Environ. 16, 879–882. doi: 10.1111/j.1365-3040.1993.tb00511.x
Tyson, P. D., and Preston-Whyte, R. A. (2012). The Weather & Climate of Southern Africa. Oxford: Oxford University Press.
Usman, M. T., and Reason, C. J. C. (2004). Dry spell frequencies and their variability over southern Africa. J. Clim. Res. 26, 199–211. doi: 10.3354/cr026199
Van de Peer, Y., Ashman, T. L., Soltis, P. S., and Soltis, D. E. (2021). Polyploidy: An evolutionary and ecological force in stressful times. Plant Cell. 33, 11–26. doi: 10.1093/plcell/koaa015
Van den Bilcke, N., Smedt, S., Simbo, D., and Samson, R. (2013). Sap flow and water use in the African baobab (Adansonia digitata L.) seedlings in response to drought stress. S. Afr. J. Bot. 88, 438–446. doi: 10.1016/j.sajb.2013.09.006
Van Wilgen, N. J., Goodall, V., Holness, S., Chown, S. L., and McGeoch, M. A. (2016). Rising temperatures and changing rainfall patterns in South Africa’s national parks. Int. J. Climatol. 36, 706–721. doi: 10.1002/joc.4377
Vandegehuchte, M. W., Bloemen, J., Vergeynst, L. L., and Steppe, K. (2015). Woody tissue photosynthesis in trees: Salve on the wounds of drought? New Phytol. 208, 998–1002. doi: 10.1111/nph.13599
Venter, S. M., Glennon, K. L., Witkowski, E. T. F., Baum, D., Cron, G. V., Tivakudze, R., et al. (2017). Baobabs (Adansonia digitata L.) are self-incompatible and ‘male’ trees can produce fruit if hand-pollinated. S. Afr. J. Bot. 109, 263–268. doi: 10.1016/j.sajb.2017.01.007
Wang, G., Cai, W., Yang, K., Santoso, A., and Yamagata, T. (2020). A unique feature of the 2019 extreme positive Indian Ocean Dipole event. Geophys. Res. Lett. 47:e2020GL088615. doi: 10.1029/2020GL088615
White, T. C. R. (1986). Weather, Eucalyptus dieback in New England (Australia) and a general hypothesis of the cause of dieback. Pac. Sci. 40, 58–78.
Whyte, I. J., Nel, P. J., Steyn, T. M., and Whyte, N. G. (1996). Baobabs and elephants in the Kruger National Park: Preliminary Report. Scientific Report Number 5/96. Skukuza: National Parks Board Scientific.
Wickens, G. E. (1982). The baobab - Africa’s upside-down tree. Kew Bull. 47, 173–209. doi: 10.2307/4109961
Wickens, G. E., and Lowe, P. (2008). The Baobabs: Pachycauls of Africa, Madagascar and Australia. Berlin: Springer.
Wieser, G., Holtmeier, F.-K., William, K., and Smith, W. K. (2010). “Treelines in a Changing Global Environment,” in Trees in a Changing Environment: Ecophysiology, Adaptation, and Future Survival, eds M. Tausz and N. Grulke (Dordrecht: Springer).
Willis, K. J., Jeffers, E. S., and Tovar, C. (2018). What makes a terrestrial ecosystem resilient? Science 359, 988–989. doi: 10.1126/science.aar5439
Wolfe, B. T. (2017). Retention of stored water enables tropical tree saplings to survive extreme drought conditions. Tree Physiol. 37, 469–480. doi: 10.1093/treephys/tpx001
Wolfe, B. T., Sperry, J. S., and Kursar, T. (2016). Does leaf shedding protect stems from cavitation during seasonal droughts? A test of the hydraulic fuse hypothesis. New Phytol. 212, 1007–1018. doi: 10.1111/nph.14087
World Meteorological Organization [WMO] (2017). WMO Guidelines on the calculation of climate normals. WMO-No.1203. Geneva: WMO.
Zeng, X., Reeves Eyre, J. E. J., Dixon, R. D., and Arevalo, J. (2021). Quantifying the occurrence of record hot years through normalized warming trends. Geophys. Res. Lett. 48:e2020GL091626. doi: 10.1029/2020GL091626
Zhang, Y., Meinzer, F. C., Hao, G., Scholz, F. G., Bucci, S. J., and Takahashi, F. S. C. (2009). Size-dependent mortality in a Neotropical savanna tree: The role of height-related adjustments in hydraulic architecture and carbon allocation. Plant Cell Environ. 32, 1456–1466.
Zimmermann, M. H. (1978). Hydraulic architecture of some diffuse-porous trees. Can. J. Bot. 56, 2286–2295. doi: 10.1139/b78-274
Zinke, J., Loveday, B., Reason, C., Dullo, W. C., and Kroon, D. (2014). Madagascar corals track sea surface temperature variability in the Agulhas Current core region over the past 334 years. Sci. Rep. 4:4393. doi: 10.1038/srep04393
Zizka, A., Carvalho-Sobrinho, J. G., Pennington, R. T., Queiroz, L. P., Alcantara, S., Baum, D. A., et al. (2020). Transitions between biomes are common and directional in Bombacoideae (Malvaceae). J. Biogeogr. 47, 1310–1321. doi: 10.1111/jbi.13815
Keywords: climate variability, growth, resilience, topography, evolutionary legacy effects
Citation: Mayne DH, Karimi N, Cruywagen EM, Cole P and Goodall V (2022) Baobabs at the edge: 90-year dynamics of climate variability, growth, resilience, and evolutionary legacy effects. Front. For. Glob. Change 5:1036636. doi: 10.3389/ffgc.2022.1036636
Received: 04 September 2022; Accepted: 17 October 2022;
Published: 16 November 2022.
Edited by:
Rambod Abiri, Universiti Putra Malaysia, MalaysiaReviewed by:
Achille Assogbadjo, Université d’Abomey-Calavi, BeninOvidiu Murarescu, Valahia University of Târgovişte, Romania
Copyright © 2022 Mayne, Karimi, Cruywagen, Cole and Goodall. This is an open-access article distributed under the terms of the Creative Commons Attribution License (CC BY). The use, distribution or reproduction in other forums is permitted, provided the original author(s) and the copyright owner(s) are credited and that the original publication in this journal is cited, in accordance with accepted academic practice. No use, distribution or reproduction is permitted which does not comply with these terms.
*Correspondence: Diana H. Mayne, YmFvYmFiQGljb24uY28uemE=
†ORCID: Diana H. Mayne, orcid/0000-0001-8086-640X; Nisa Karimi, orcid/0000-0003-3593-0390; Elsie M. Cruywagen, orcid/0000-0002-8515-0889; Patrick Cole, orcid/0000-0002-3563-8704; Victoria Goodall, orcid/0000-0002-9448-5664