 Kevin Barnett
 Gregory H. Aplet
 R. Travis Belote
- 1The Wilderness Society, Minneapolis, MN, United States
- 2The Wilderness Society, Denver, CO, United States
- 3The Wilderness Society, Bozeman, MT, United States
Because of its importance to both carbon storage and biodiversity, old forest has regained currency as a focus of forest management and policy. However, absence of a systematic approach to classifying stages of forest development across all forest types precludes our understanding of the current distribution of the mature and old-growth forest estate. Here, we propose functional definitions of mature and old-growth forests consistent with theories of forest stand development and evaluate the implications for assessing their spatial distribution nationwide. Using plot data from a national forest inventory and assuming space-for-time substitution, we modeled forest carbon accumulation over time using saturating, non-linear growth models. We define the onset of old-growth characteristics as occurring at the age when the density of total forest carbon stored in live and dead biomass reaches 95% of the empirically derived maximum, and the mature forest stage as occurring between the peak average carbon increment and the age of onset of old growth. We fit models within unique forest type-groups and, where possible, accounted for differences in site productivity. Population-level estimates of the mature and old-growth forest estate were calculated using sample design-based estimators. Across forest type-groups, the age at onset of old growth varied from 34 to 577 years, and the onset of mature forest conditions ranged between 16 and 313 years. Within forest type-groups, the effect of site quality on the age at onset of mature and old-growth forest varied but generally supported our hypothesis that high site quality accelerates forest development and increases forest carbon storage in old forests. We classified 6.3% of current forested lands in the United States as old growth and almost one-third as mature. Of the current old-growth forest estate, approximately 46% is found on federal public lands, and 11% is currently in congressional reserves. We posit that continued improvements to modeling the dynamic process of forest development and integration with structural definitions of old growth will be needed to ensure targets for old-growth retention and development are achieved.
Introduction
Late-successional (mature and old-growth) forests occupy a special place in our world. Characterized by a relatively long period of development since catastrophic disturbance, these forests offer unique benefits to ecosystems and people. By virtue of their advanced age, old trees develop features, such as thick, complex bark that offers protection from wildfires (Binkley et al., 2007) and distinct habitat for invertebrates and wildlife (Franklin et al., 2018). Pockets of decay in standing live and dead trees and down logs provide nest sites for cavity-nesting birds and den sites for mammals (Hunter and Schmieglow, 1990). Brooms from advanced mistletoe and fungal infections provide nesting sites for both birds and mammals (Hedwall and Mathiason, 2006; Paragi and Rodman, 2020). The complexity of the resulting forest canopy often supports the highest species diversity of any forest development stage after the post-disturbance, early-seral “preforest stage” (Franklin et al., 2018). Old forests store more carbon in live and dead material than young forests (Pregitzer and Euskirchen, 2004; Keeton, 2018), and the detritus built up on the forest floor filters and stores water better than young forests (Gordon et al., 2008). In addition to their critical role in the ecosystem, old forests provide unique recreational and spiritual experiences for people who revere the connection to deep time and awe-inspiring presence of big trees and silence (Hayward, 1991). Some of the most beloved recreational destinations in the country, places like Sequoia, Redwood, and Olympic National Parks, Hearts Content National Scenic Area, and the Joyce Kilmer Memorial Forest, offer special experiences to millions of people a year due, in part, to their remaining old-growth forests.
Conservation of late-successional forests in the U.S. has been an issue of management concern since at least the 1970s when discovery of their habitat value coincided with realization of their imminent disappearance (Forest Ecosystem Management Assessment Team [FEMAT], 1993). Liquidation of primary forests had occurred since settlement, moving from the Northeast to the Lake States to the South, and finally to the Pacific Northwest, where the last remaining stands were targeted early in the 20th century (Greeley, 1925). Years of controversy surrounding the appropriate use of public timberlands culminated in the creation of the Northwest Forest Plan (NWFP), an amendment to public forest management plans in Washington, Oregon, and northwestern California enacted in 1994, which reserved most of the remaining late-successional forest in the Pacific Northwest from timber harvesting (U.S. Department of Agriculture, Forest Service, and U.S. Department of the Interior, Bureau of Land Management, 1994). Following a subsequent period of relative calm, the issue has recently regained currency as awareness has grown of the value of old forests as carbon stores and their vulnerability to wildfire, climate change, and continued logging. On 22 April 2022, President Joseph R. Biden issued an executive order directing the Secretaries of Agriculture and the Interior, “within 1 year, to define, identify, and complete an inventory of old-growth and mature forests on Federal lands” in anticipation of the development of policies “to institutionalize climate-smart management and conservation strategies that address threats to mature and old-growth forests on Federal lands” (Biden, 2022).
Heretofore, no national inventory has ever been ordered or conducted. At the height of the controversy that led to the NWFP, the U.S. Forest Service did issue a formal position statement of its intention to manage the national forests to provide “old-growth values” and committed “Regions with support from Research [to] continue to develop forest type old growth definitions [and] conduct old growth inventories…” (U.S. Department of Agriculture, Forest Service, 1989). In subsequent years, much work was done to develop regional definitions of old growth (see e.g., Green et al., 1992; Mehl, 1992; Various authors, 1993; Gaines et al., 1997; Tyrell et al., 1998), but for various reasons, including inconsistencies in definitions from region to region, the challenge of matching definitions to standard inventory data, and, perhaps, waning interest on the part of the public in the wake of the NWFP, no national inventory was ever conducted in response to the position statement. Further obscuring a clear picture of the status of late-successional forests was the utter lack of a definition of mature forests, as referenced in the executive order. Completing the required inventory will require both clear definitions of mature and old-growth forests and the means to quantify and map them.
As forests age, they change in a number of important ways. First, and most obviously, the trees get older, and this characteristic can be used to distinguish late-successional forests. This was the approach taken in the NWFP where mature forest is recognized as any stand, irrespective of forest type, over 80 years beyond the stand-initiating disturbance (Forest Ecosystem Management Assessment Team [FEMAT], 1993). In setting this threshold, scientists relied on research that suggested that conditions associated with old-growth Douglas-fir forests of the Pacific Northwest began to develop at 80 years and are well developed by age 200 (Spies and Franklin, 1991). Similarly, the State of Minnesota uses 120 years as the age of onset of old growth for several forest types, which is believed to correspond to the age at which sugar maple stands transition from a homogeneous overstory to a more complex structure (Frelich and Reich, 2003). While a region-wide, uniform stand age provides a simple criterion for classifying mature and old-growth forest, it misses much of the variability in forest conditions resulting from forest composition, site quality, and disturbance history (Wirth et al., 2009).
Second, as a forest recovers following major disturbance, it typically changes from an open stand of young saplings, to a closed-canopied, relatively uniform forest, eventually transitioning into a dynamic system of horizontally and vertically diverse structure as trees die, fall over and are replaced by younger trees (Bormann and Likens, 1979; Oliver and Larson, 1996). Forests subject to frequent, non-catastrophic disturbances (e.g., surface fire) maintain old forest structure through different mechanisms, but both types of forest exhibit relatively large trees, decadence and decay, large snags, and spatial heterogeneity in the old-growth stage (Morgan, 1994; Kaufmann et al., 2007; Johnston et al., 2021). These structural characteristics can be used to classify late-successional forest, and in fact, structural definitions are by far the most common approach to classifying old growth (Hilbert and Wiensczyk, 2007). In response to the aforementioned U.S. Forest Service position statement, regional characterizations of minimum densities of large live trees, snags, and down wood, in addition to minimum ages of old growth, were developed for most forest types in the U.S. (Capp et al., 1992; Green et al., 1992; Mehl, 1992; Various authors, 1993; Gaines et al., 1997; Tyrell et al., 1998). Stands that meet all the minimum criteria may be recognized as old growth. Unfortunately, no similar definitions were developed to distinguish mature forests, making it impossible to use existing structural definitions to classify mature forest. Other authors have argued that no structural thresholds exist (Hunter and White, 1997) and that stands are better described by a continuous index of “old-growthness” (Spies and Franklin, 1988). In theory, index values pertaining to mature forest, as well as old growth, could be identified, as has been done in the monitoring of the NWFP (Davis et al., 2015), but such values for most of the rest of the U.S. would be arbitrary without more research into the structural characteristics of mature forests.
A third way in which forests change over time is in their function, including population processes (e.g., rates of recruitment, growth, and mortality) as well as important ecosystem services, such as soil stabilization, wildlife habitat, and, especially, carbon sequestration. When forests are young, their rates of biomass accumulation start out low but quickly rise as leaf area is built, reaching maximum values early in stand development (Kira and Shidei, 1967; Assmann, 1970; Smith and Long, 2001; Binkley et al., 2002; Gray et al., 2016). For reasons that are still not well-understood (see Gower et al., 1996; Xu et al., 2012; West, 2020; Binkley, 2021), further stand development sees the rate of accumulation drop from this peak and begin a long, steady decline. With enough time, stands approach a maximum biomass, as respiration and decomposition balance photosynthesis (Odum, 1969; Bormann and Likens, 1979). This tendency for biomass to stabilize over time has been recognized from the earliest days of forest science (Assmann, 1970; Davis and Johnson, 1987) and has been suggested as a characteristic of old-growth forests (Hayward, 1991; Hilbert and Wiensczyk, 2007; Wirth et al., 2009; Franklin et al., 2018). Ecologists have debated for years whether old forests truly reach a steady state, rising slowly to an asymptote, or whether they continue to add carbon at a modest rate, overshoot a maximum and relax to a reduced steady state, or even fluctuate around a mean based on population processes (Odum, 1969; Bormann and Likens, 1979; Peet, 1981; Aplet et al., 1989; Luyssaert et al., 2008, 2021; Keeton, 2018; Gunderson et al., 2021). In any case, as others have done, forest carbon accumulation can be modeled as following a sigmoid trajectory with an inflection point and an asymptote, reaching a maximum steady state (Janisch and Harmon, 2002; Hudiberg et al., 2009; Zhu et al., 2018). An age near the maximum forest biomass accumulation (e.g., 95% of the maximum) can be used to approximate the age at onset of old growth while allowing for subsequent carbon accumulation or loss during the old-growth phase. This “functional definition” of old-growth forest based on carbon accumulation represents a novel way of classifying the older forest stage that is distinct from those that utilize structural features of old-growth forest referred to above.
An additional benefit of this approach is that the dynamics of forest carbon accumulation can be used to identify the age at onset of mature forest conditions in addition to old growth. Foresters have long used changes in forest productivity to mark significant points in forest development and have recognized the point at which periodic productivity of live tree merchantable volume drops below average productivity (the so-called “culmination of mean annual increment” or CMAI) as the point at which the stand reaches maturity and should be harvested to maximize yield over time (Assmann, 1970; Davis and Johnson, 1987). In forestry, CMAI identifies biological maturity and is not necessarily correlated with the development of any structural attributes, but it is an objectively identifiable point in an otherwise continuous ecological process and has been recognized by others as the point beyond which occurs the mature seral stage and increasing stand diversity (Forest Ecosystem Management Assessment Team [FEMAT], 1993; Franklin et al., 2018). The same concept can be applied to the total biomass increment to identify the beginning of the mature seral stage from a forest carbon accumulation standpoint. To avoid confusion with the forestry application of CMAI, we call this point “peak average carbon increment.” As others have used periodic annual increment and CMAI to identify three “phases” of forest development (Assmann, 1970; Salas-Eljatib et al., 2021), we use these objectively defined transitions in carbon accumulation to identify four stages of forest maturation: (1) “early seral” from stand initiation to peak periodic carbon increment; (2) “young forest” from peak periodic carbon increment to peak average carbon increment; (3) “mature forest” from peak average carbon increment to the age at which 95% of maximum biomass is achieved; and (4) “old growth” (Figure 1).
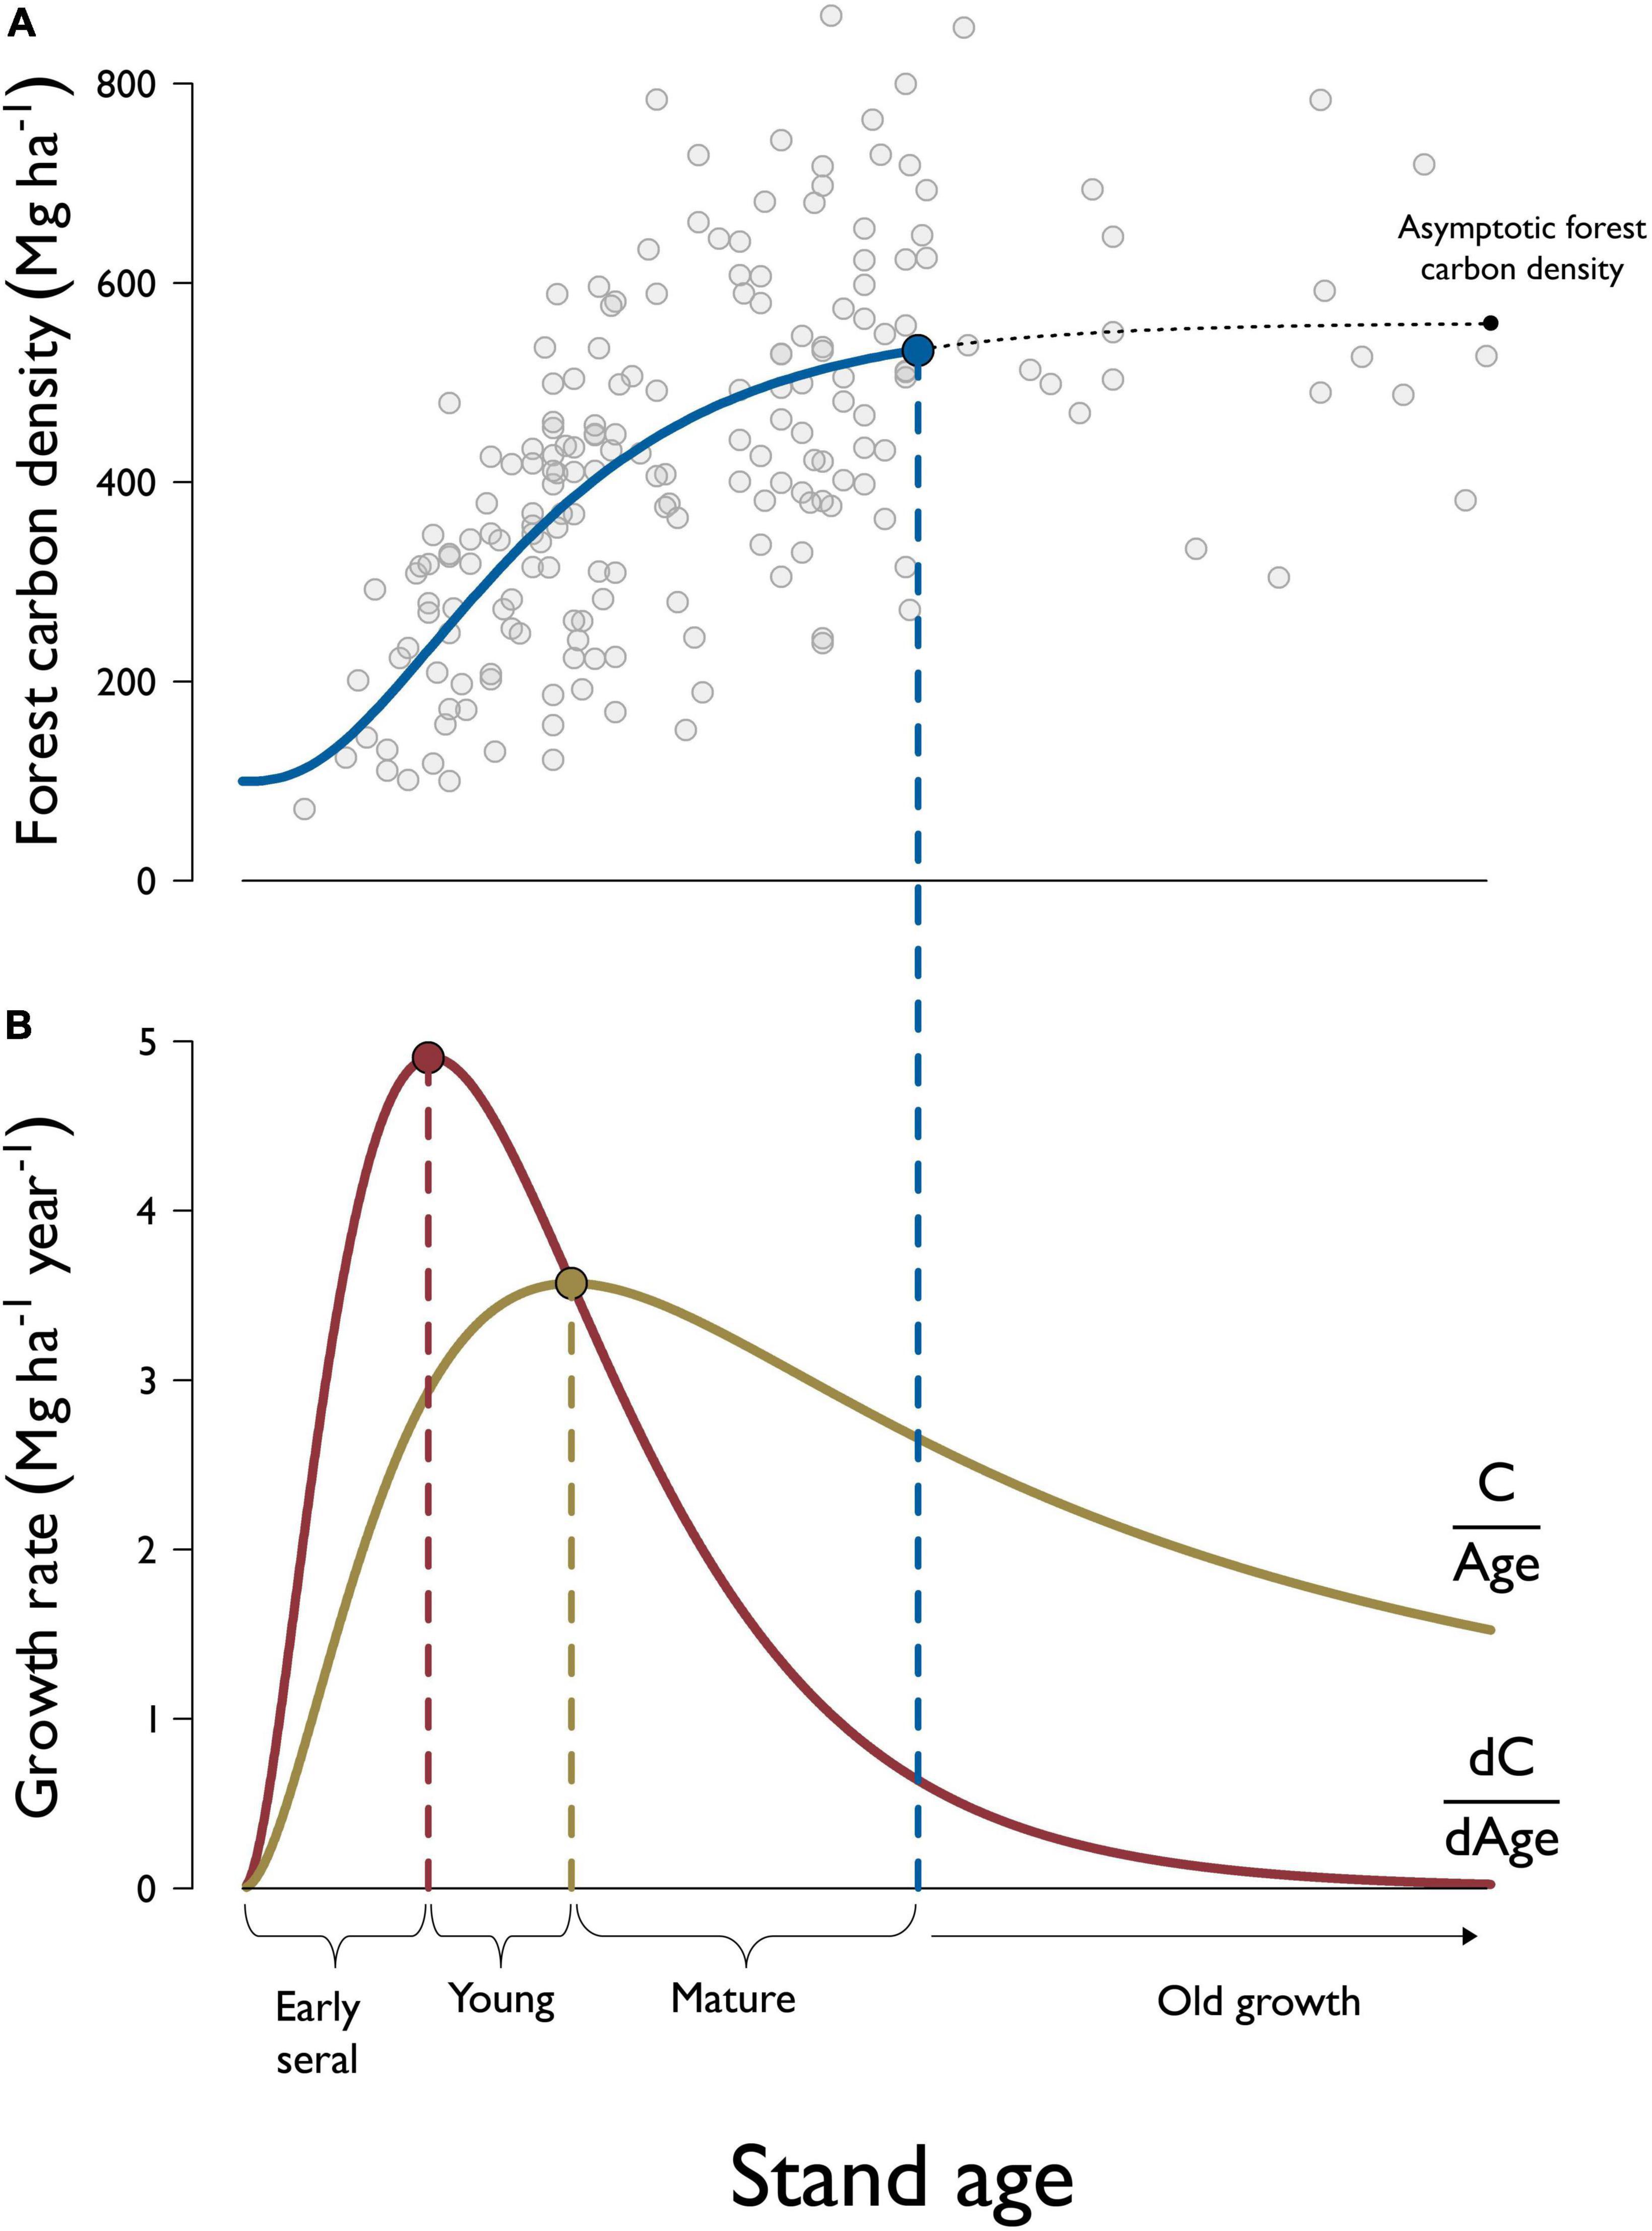
Figure 1. Example of forest stand development classification demonstrated using plots among the highest site productivity classes within the Douglas-fir forest type-group. Panel (A) shows a scatterplot of forest carbon density—including both live and dead components—against stand age. Forest carbon accumulation is estimated by a modified Chapman-Richards function that assumes forest carbon density is asymptotic with respect to stand age. We define the age at the onset of old growth forest as the point in stand development when forest carbon density reaches 95% of the asymptotic level. Panel (B) shows how the rate at which forest carbon accumulates over time, or “periodic carbon increment”, (dC/dAge) can be derived from the accumulation curve. The “average carbon increment” curve is derived by dividing forest carbon by stand age at each point in time (C/Age). “Early seral” stands are those with ages less than the peak periodic carbon increment (i.e., maximum growth rate), “young” stands are those with ages greater than age at peak periodic carbon increment and less than the age at peak average carbon increment, while “mature” forests are older than age at peak average carbon increment but haven’t reached the age at onset of old growth.
This functional model can be useful for describing the four stages of forest development, but it is complicated by a number of factors. First, productivity, or the rate of accumulation of biomass, is affected by site quality. High quality sites accumulate biomass more quickly than low quality sites and therefore reach peak productivity and maturity earlier (Assmann, 1970; Daniel et al., 1979; Peet, 1981; Gray et al., 2016). Larson et al. (2008) explored the relationship between site quality and forest structural development in Douglas-fir/western hemlock stands in the Pacific Northwest and concluded that high-quality sites do indeed reach old-growth structure more quickly. These differences suggest that stands of the same forest type may reach mature and old-growth phases at different times depending on site quality (Oliver and Larson, 1996), though a comprehensive investigation into the effects of site quality on rates of forest structural development remains absent. Figure 2 presents hypothetical relationships between site quality, rate of forest carbon accumulation, and final yield. Forest composition, initial conditions, and disturbance history can all have similar impacts, resulting in unique ages of onset of mature and old-growth conditions for each stand.
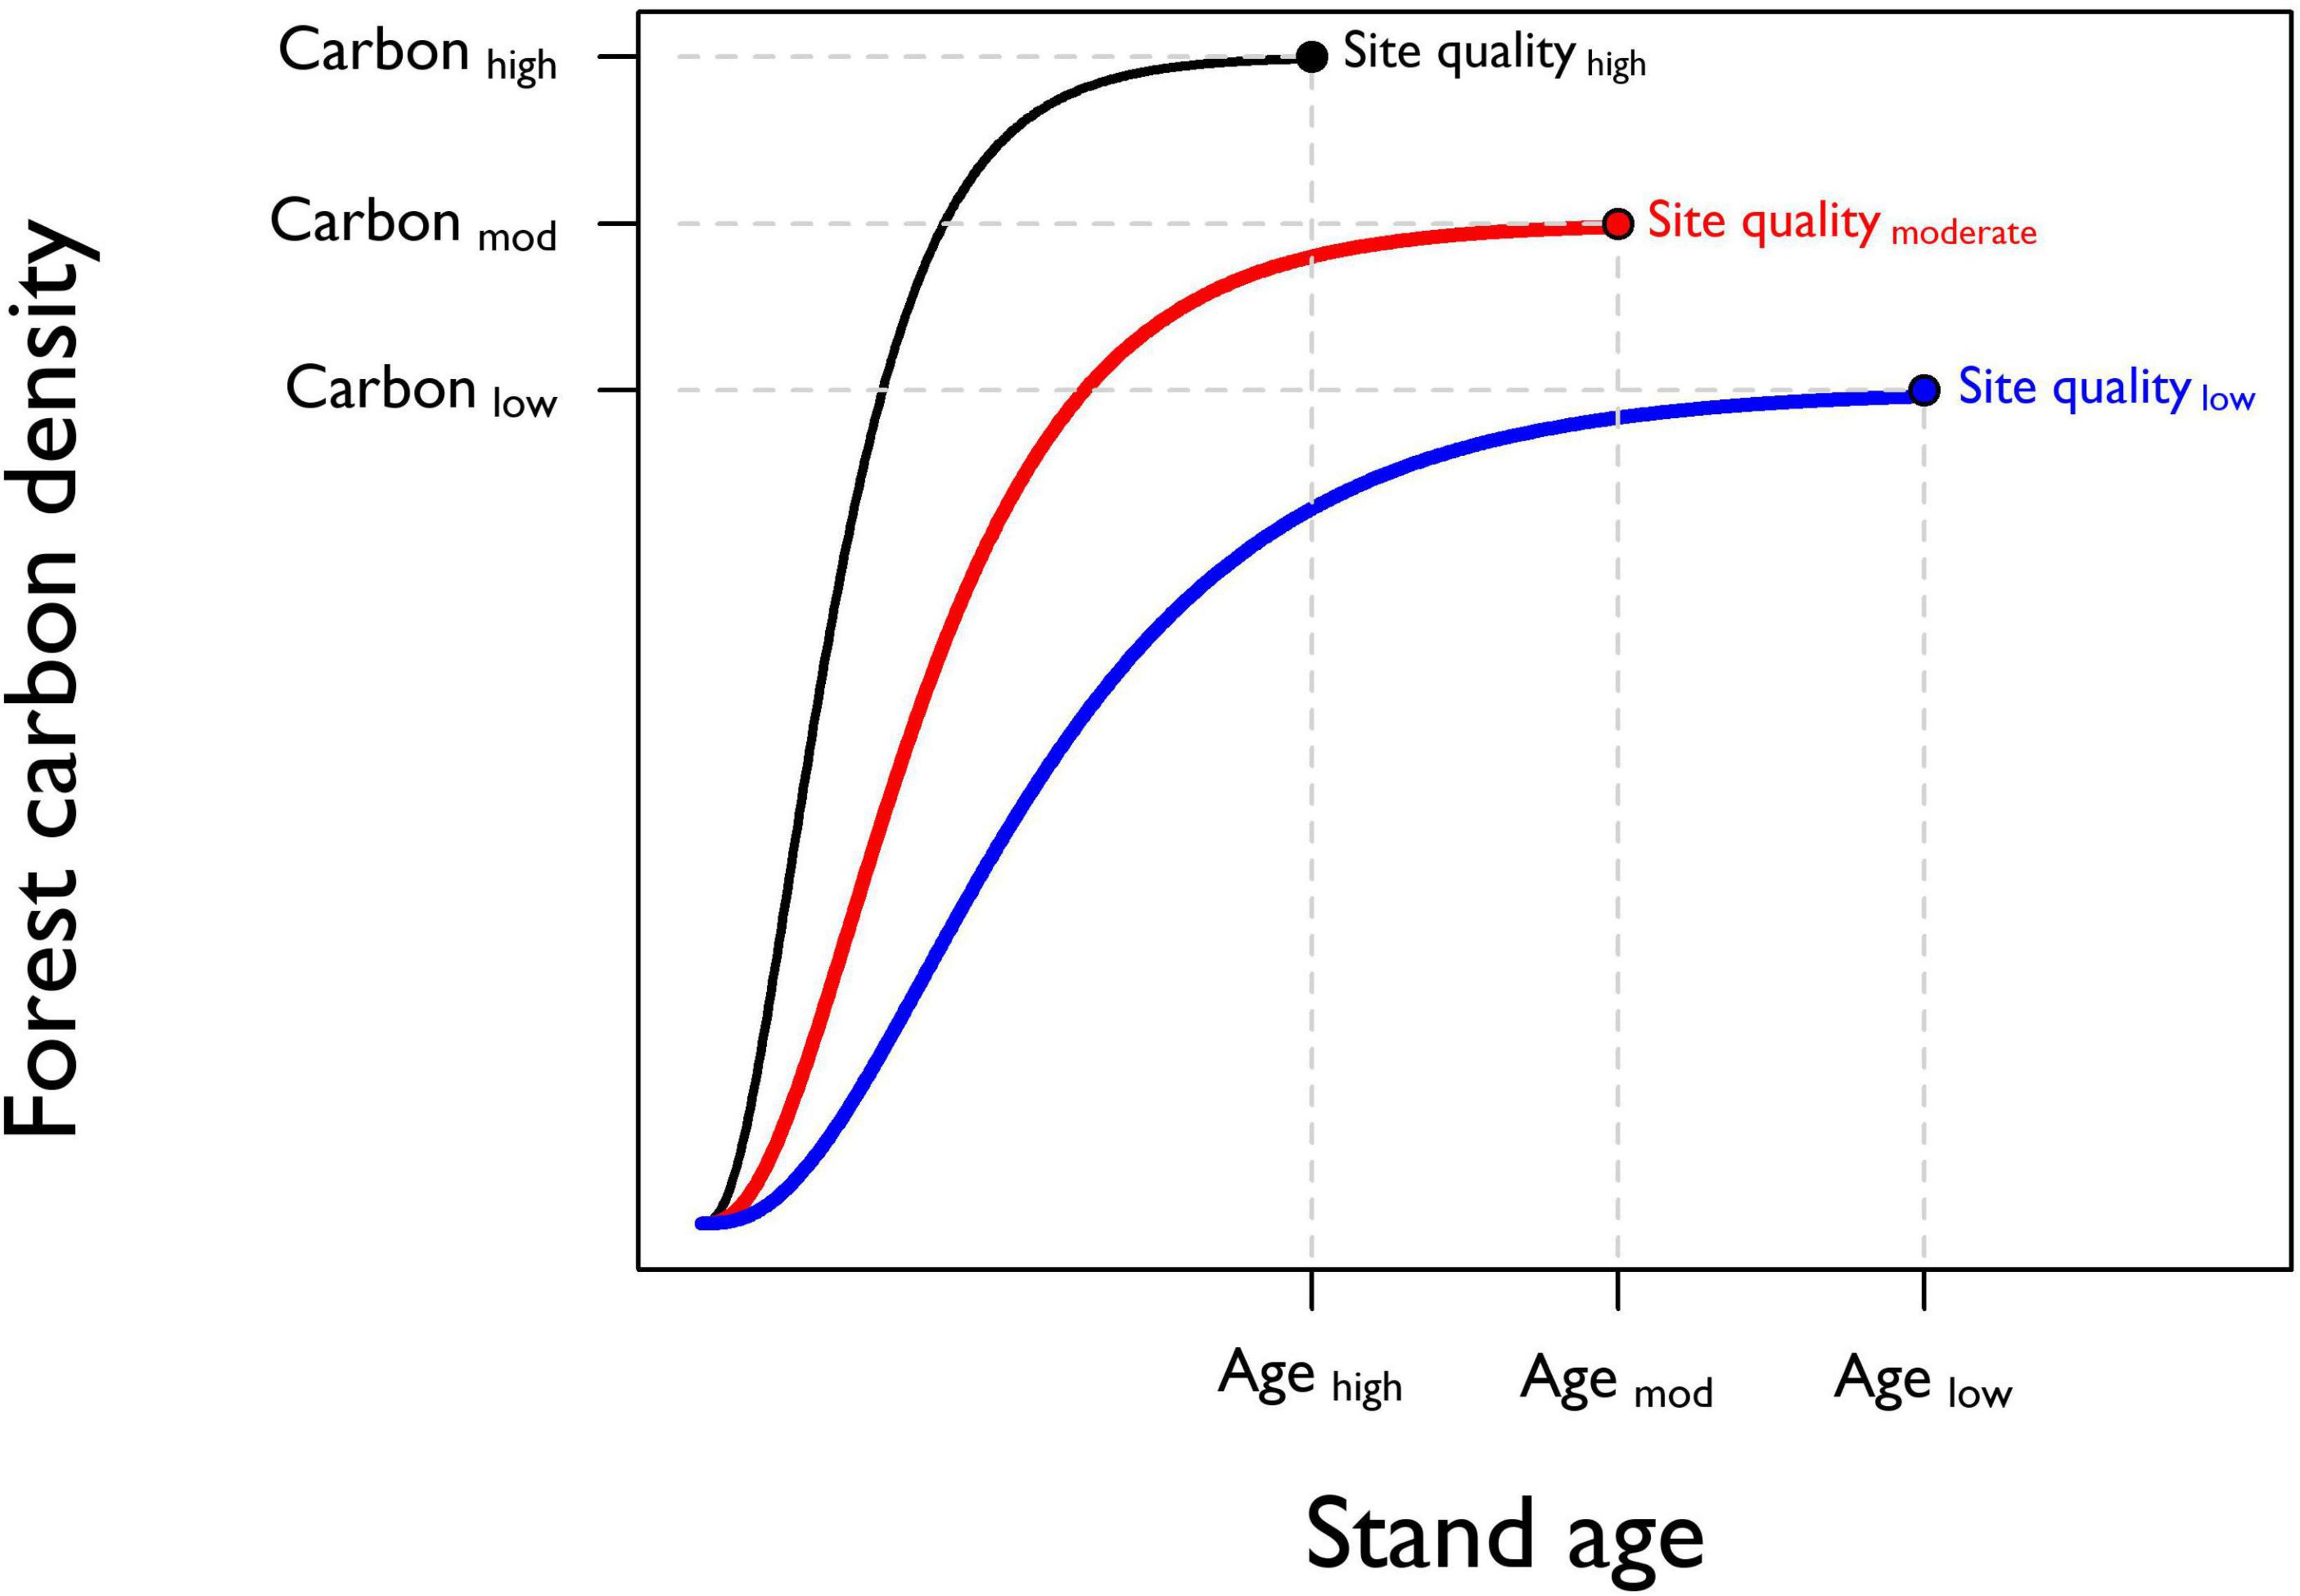
Figure 2. Prediction of how site quality affects forest carbon accumulation over time. At the stand level, site quality gradients influence the rate of forest carbon accumulation and constrain maximum forest carbon density. Stands with higher site quality are predicted to reach the age at the onset of old growth (Agehigh) more rapidly than lower quality sites (Agelow). High-quality sites are also predicted to support a greater density of forest carbon at the age of the onset of old growth (Carbonhigh) compared to lower quality sites (Carbonlow).
Mapping of mature and old-growth forest in the U.S. has evolved considerably over time. The first effort to depict the remaining “virgin forest” was published in 1925 by Forest Service Chief William Greeley using hand-drawn dots to represent the area of remaining forest “based on estimates by states,” which were “not all correctly located” (Greeley, 1925). The earliest efforts to map old growth in California, Oregon, and Washington were completed in the 1930s and 1940s, but those inventories employed no consistent definition or methodology and relied mostly on distinctions between “large” and “small” timber for classifying old growth (Bolsinger and Waddell, 1993). Use of inventory data and remote sensing to map old-growth forests first occurred in the Pacific Northwest in the lead-up to the Northwest Forest Plan (Morrison et al., 1991; Pacific Meridian Resources, 1991). Shortly thereafter, Johnson et al. (1991) combined past inventories, forest plans, and expert opinion to produce the first consistent spatial inventory of late successional and old-growth (LS/OG) forests on national forest and Bureau of Land Management lands throughout the range of the northern spotted owl. Two years later, the Forest Ecosystem Management Assessment Team used existing timber inventory maps of tree diameter and canopy complexity to distinguish late-successional from old-growth forests (Forest Ecosystem Management Assessment Team [FEMAT], 1993).
By the time of the first monitoring report of the NWFP, methods had improved to allow scientists to distinguish mature and old-growth forests from remote sensing (Moeur et al., 2005), and Strittholt et al. (2006) analyzed satellite data to identify “old conifer forest” (>150 years old) and “mature conifer forest” (50–150 years old). By the publication of the 15-year NWFP monitoring report, improvements in remote sensing methods spurred development of a new approach called “gradient nearest neighbor imputation” (Ohmann and Gregory, 2002) in which detailed plot data, including tree and snag size and density, can be assigned to locations not covered by plot-based inventories (Moeur et al., 2011).
In the third (20 year) NWFP monitoring report, Davis et al. (2015) improved on these methods by employing an Old-Growth Structure Index (OGSI) capable of accounting for more attributes of old growth and the nuances of their gradual development over time (Spies and Franklin, 1988; Franklin and Spies, 1991). By calculating OGSI for a large sample of forest inventory plots, then imputing those plots out across the entire region, the monitoring team was able to distinguish old-growth forest (OGSI-200) from all older forest (OGSI-80). They also used maps made by the Forest Service in the 1940s to allow comparison of current conditions to those prior to the post-war logging boom. Other imputation methods have been developed by Wilson et al. (2012) and Riley et al. (2021) for the continental U.S., but neither has yet been applied to the mapping of old growth. In Europe, Sabatini et al. (2021) used satellite imagery and boosted regression tree analysis to identify likely locations of the continent’s last remaining primary forest, and most recently, DellaSala et al. (2022) used global data on canopy height, canopy cover, and above ground living biomass to identify what they called “mature and old-growth forest (MOG)” of the United States but did not distinguish between the two.
The challenge before the scientific community is to develop a coherent and consistent framework to classify, inventory, and map mature and old-growth forests. Here, we use functional definitions outlined in Figure 1 to classify the age at onset of mature and old-growth forest conditions across the United States. We demonstrate how this definition can be integrated with the nation’s forest inventory framework to produce sample design-based estimates of the mature and old-growth forest estate. To do so, we modeled the age at onset of mature and old-growth forest conditions using a spatially balanced, national forest inventory data set and accounted for variability within and among forest type-groups. These plot-based estimates of the time until forests reach the age of mature and old-growth conditions were then paired with a plot imputation approach to map a continuous spatial coverage of forest maturity across the contiguous United States. In so doing, we endeavored to answer three primary questions:
1) How does the age at onset of mature and old-growth forest conditions vary among unique forest type-groups, and how do differences in site productivity affect these ages within forest type-groups?
2) How is the current mature and old-growth forest estate distributed in terms of forest type-groups, land ownership, conservation reserve status and site productivity?
3) How might plot imputation approaches be used to represent the geographical distribution of mature and old-growth forests at spatial resolutions relevant to landscape and regional-level forest management planning?
Materials and methods
Modeling forest carbon accumulation over time
Recognizing that several non-linear growth models are present in the forestry literature (Fekedulegn et al., 1999), we elected to use a modified Chapman-Richards growth model to explain patterns of forest carbon development over time:
where y is the density of carbon stored in live and dead forest biomass, c is an intercept representing initial stand-level carbon density when stand age equals zero, a is the difference between the asymptotic carbon density level and initial stand-level carbon density such that (a+c) represents the asymptotic carbon density level, b is a slope parameter describing the shape of the accumulation curve, and STDAGE represents the age of the stand as defined by the Forest Inventory and Analysis (FIA) program of the United States Department of Agriculture Forest Service (described below). We follow Sleeter et al. (2022) who chose to fix the parameter d to 3 in a recent national assessment of forest carbon flux and stocks of U.S. forests. This decision ensures that the forest carbon accumulation curve will have an inflection point and is asymptotic with respect to stand age as has been assumed by others exploring carbon accumulation in forest stands (Janisch and Harmon, 2002; Hudiberg et al., 2009; Zhu et al., 2018; Bukoski et al., 2022). We estimated models for each FIA forest type-group and accounted for within-group variation by fitting separate models based on potential site productivity class described below. All models were estimated using non-linear least squares techniques implemented in R version 4.1.2. Starting values were selected using information provided in Sleeter et al. (2022).
We evaluated model performance using the root mean square error (RMSE) metric. RMSE characterizes the average difference between a model’s predictions and the observed values. Because RMSE is scale-dependent, we normalized the RMSE metric (NRMSE) for each model by the sample’s mean forest carbon density to compare NRMSE across models.
Forest inventory data
We acquired national forest inventory data from FIA, a program which has a long history of serving as the nation’s premier resource for information on the status and trends of forest conditions (Tinkham et al., 2018). The current FIA sampling design is intended to support strategic-level decision-making across the National Forest System through nationally consistent, annual sampling efforts in each state. In addition, these data serve as primary inputs into the nation’s carbon accounting framework in accordance with international reporting standards (Heath, 2013). Permanent plots are located within a hexagonal tessellation covering the entire nation and resulting in approximately one FIA plot located every 2,428 hectares, thus ensuring the plot network is spatially balanced and located irrespective of land ownership. Plots are scheduled for remeasurement every 5 and 10 years in the eastern and western United States, respectively. Field crews visit each forested plot location and, at a minimum, collect a set of core attributes using consistent protocols and definitions that facilitate robust, national-level monitoring of forest conditions.
The FIA plot design consists of four points arranged as one center point with three additional points distributed every 120o and spaced 36.6 m from the center point. Each point is surrounded by three plots of different sizes where information on trees of different size classes is measured. Saplings and seedlings with diameter at breast height (dbh) between 2.54 and 12.45 cm are measured on microplots (diameter = 2.07 m). Trees larger than 12.45 cm are measured on subplots (diameter = 7.32 m). A third, optional macroplot (diameter = 17.95 m) surrounds the subplot and is where rare, large trees may be sampled. One or multiple “conditions” representing distinct domains based on land use, forest type, stand size, regeneration status, tree density, stand origin, ownership group and disturbance history are mapped within each subplot. Each condition occurring on the subplot is assigned a condition proportion that is used to weight observations during population estimation. Where more than one condition exists per subplot, condition-specific information is maintained in the data.
Developing plot-level estimates of forest carbon density, stand age, and site productivity
We obtained the most recent plot data for all FIA plots located throughout CONUS. Our response variable—plot-level density of forest carbon stored in live and dead biomass—was constructed using data collected at the condition level. Carbon pools included: (1) down and dead, (2) litter, (3) standing dead (i.e., snags), (4) belowground understory vegetation, (5) aboveground understory vegetation, (6) belowground live tree, and (7) aboveground live tree. Carbon in fine organic material below the soil surface to a depth of 1 m is also estimated at the condition level (O’Connell et al., 2017, p. 2–47) but was excluded from this analysis because the effect of stand development and disturbance on soil carbon has been found to be equivocal (Johnson and Curtis, 2001; Overby et al., 2002). The carbon density pools observed at the condition level include those that are estimates based on models that include direct measurements (e.g., aboveground live tree, standing dead) and some based on models that do not include direct measurements (e.g., litter). Similar to Wilson et al. (2013) and Bell et al. (2022), we assume these estimates represent true observations but acknowledge they contain measurement error (Clough et al., 2016).
Stand age is calculated by FIA at the condition level using tree cores collected by field crews. Cores are extracted from trees representing the “predominant (based on stocking) diameter class of live trees within the condition…” (O’Connell et al., 2017, p. 2–33). Stand age represents the mean value of the field recorded age of all cored trees in the predominant diameter class. As Stevens et al. (2016) has shown, FIA stand age does not reliably describe the time since stand-initiating disturbance. Rather, it simply indicates the length of time that the predominant diameter class has been present on the site. Stands can be even-aged or uneven-aged with trees older or younger than the stand age. Stand age in uneven-aged stands often reflects an average of multiple cohorts, which can be affected by stand history (e.g., fires that kill smaller trees or wind storms that kill larger ones). Older stand ages indicate older stands, not necessarily anything about their developmental history.
Site quality was captured by a categorical site productivity variable measured at the condition level. Site productivity class is determined by estimates of the culmination of mean annual increment of merchantable wood. Our approach employed site productivity class because it provides a consistent metric for describing site quality, as opposed to site index, which is conditional upon a “base age” that can vary within forest type-groups as well as upon site index curves unique to each species. Preliminary analyses revealed that the frequency of plots and distribution of stand ages observed in each site productivity class was not even within forest type-groups. Because these limitations could bias the effect of site productivity on patterns of forest carbon accumulation within forest type-groups, we aggregated the seven classes of site productivity to produce more balanced classes within each forest type-group (see Supplementary Table 1). In general, when a site productivity class had less than approximately 100 observations, the plots were lumped with the adjacent site productivity class.
To assign forest types to each plot, FIA uses a hierarchical decision-tree that is based on trees sampled within each condition. According to the FIA database user’s guide (O’Connell et al., 2017, p. 2–24):
“The algorithm begins by comparing the live tree stocking of softwoods and hardwoods and continues in a stepwise fashion comparing successively smaller subgroups of the preceding aggregation of initial type groups, selecting the group with the largest aggregate stocking value. The comparison proceeds in most cases until a plurality of a forest type is identified.”
Each of the forest types are associated with one higher level forest type-group (n = 31 including “Nonstocked” forest) that represents an aggregation of like forest types (Costanza et al., 2018). We used the forest type-group classification rather than individual forest types to account for differences in species composition in a tractable number of classes while maintaining a sufficient sample size to analyze effects of site quality in most forest type-groups. We removed FIA plots where multiple conditions were observed in an effort to minimize model variability that may be accentuated by plots with multiple forest types or land use histories. Preliminary analyses revealed unstable model performance for forest type-groups with less than 50 FIA plots, so three forest type-groups with limited information were removed from the analysis (i.e., Redwood, Exotic softwoods, and Western white pine forest type-groups). The final sample included 75,159 plots measured between 2004 and 2021.
Classifying phases of stand development and population estimation
For each forest type-group and site productivity class, we solved for the age at the onset of old growth by substituting estimated model parameters into Equation 1 and setting y equal to 95% of the asymptotic carbon density level. We set the age of a mature forest stand as the age at which the instantaneous carbon accumulation rate equals the mean annual rate (i.e., the “culmination of mean annual increment” of forest carbon). The age at which stands transition from early seral to young was found by taking the second derivative of the modified Chapman-Richards growth model with respect to stand age and setting it equal to zero (i.e., peak instantaneous carbon accumulation rate).
The FIA program uses post-stratification to reduce the variance when estimating the aerial extent of populations of interest (Bechtold and Patterson, 2005). We used these sample design-based estimators to calculate the area of each modeled stand development phase and summarized these estimates in terms of forest type-group, ownership, reserve status, and site productivity. All FIA database queries and population estimation were performed in R version 4.1.2 using the rFIA package (Stanke et al., 2020).
Mapping mature and old-growth forest
We merged plot-level estimates of the classified stages of forest development with TreeMap (Riley et al., 2021), a model of FIA plot locations imputed throughout forested areas of the conterminous United States at 30 m spatial resolution. TreeMap was conceived in the context of supporting wildland fire and fuels management (Riley et al., 2021), and as such, the imputation approach and technical validation differ from existing and ongoing efforts to impute FIA plot locations at regional (Ohmann and Gregory, 2002) and continental (Wilson et al., 2012) scales using nearest neighbor methods. TreeMap employed a random forest machine learning algorithm to develop relationships between information collected in the FIA plots and geospatial data produced by the LANDFIRE project (Riley et al., 2021). The final TreeMap product is a raster grid populated with unique identifiers which can be crosswalked to FIA plot identifiers, thus establishing a spatially explicit relational database wherein forest attributes collected by FIA can be readily mapped. This merger facilitated a landscape-level spatial representation of our modeled stages of forest development, which, conceptually, could be used to support and monitor landscape-level forest management in the context of mature and old-growth retention and development.
Results
A total of 60 forest carbon accumulation models were fit to unique combinations of forest type-groups and site productivity classes, with multiple models fit to site productivity classes for 14 of 27 forest type-groups. The NRMSE ranged from 0.26 to 0.77, with accuracy lowest in models with fewer samples (Table 1). This approach yielded highly variable ages at the onset of old growth within and among forest type-groups, ranging from 34 to 577 years (Table 2). The age at onset of old growth was estimated to be less than 100 in 10 of 60 models, half of which were in gymnosperm forest type-groups found in the eastern United States (Figure 3). The age at onset of old growth for western gymnosperm forest type-groups (e.g., Hemlock/Sitka spruce, Lodgepole pine, Douglas-fir, Fir/spruce/mountain hemlock, and Other western softwoods) tended to be the most delayed. Age at onset of old growth was variable for angiosperm forest type-groups, with those found in the western US reaching this threshold relatively quickly (e.g., Alder/maple, Tanoak/laurel) and slowly (e.g., Western oak). Eastern angiosperm forest type-groups tended to be in the range of 100–200 years. Not surprisingly, the age at onset of mature forest conditions followed the same pattern, with maturity reached as early as 16 years in some Loblolly/shortleaf pine forests, and as late as 313 years in Other western softwoods (Table 2).
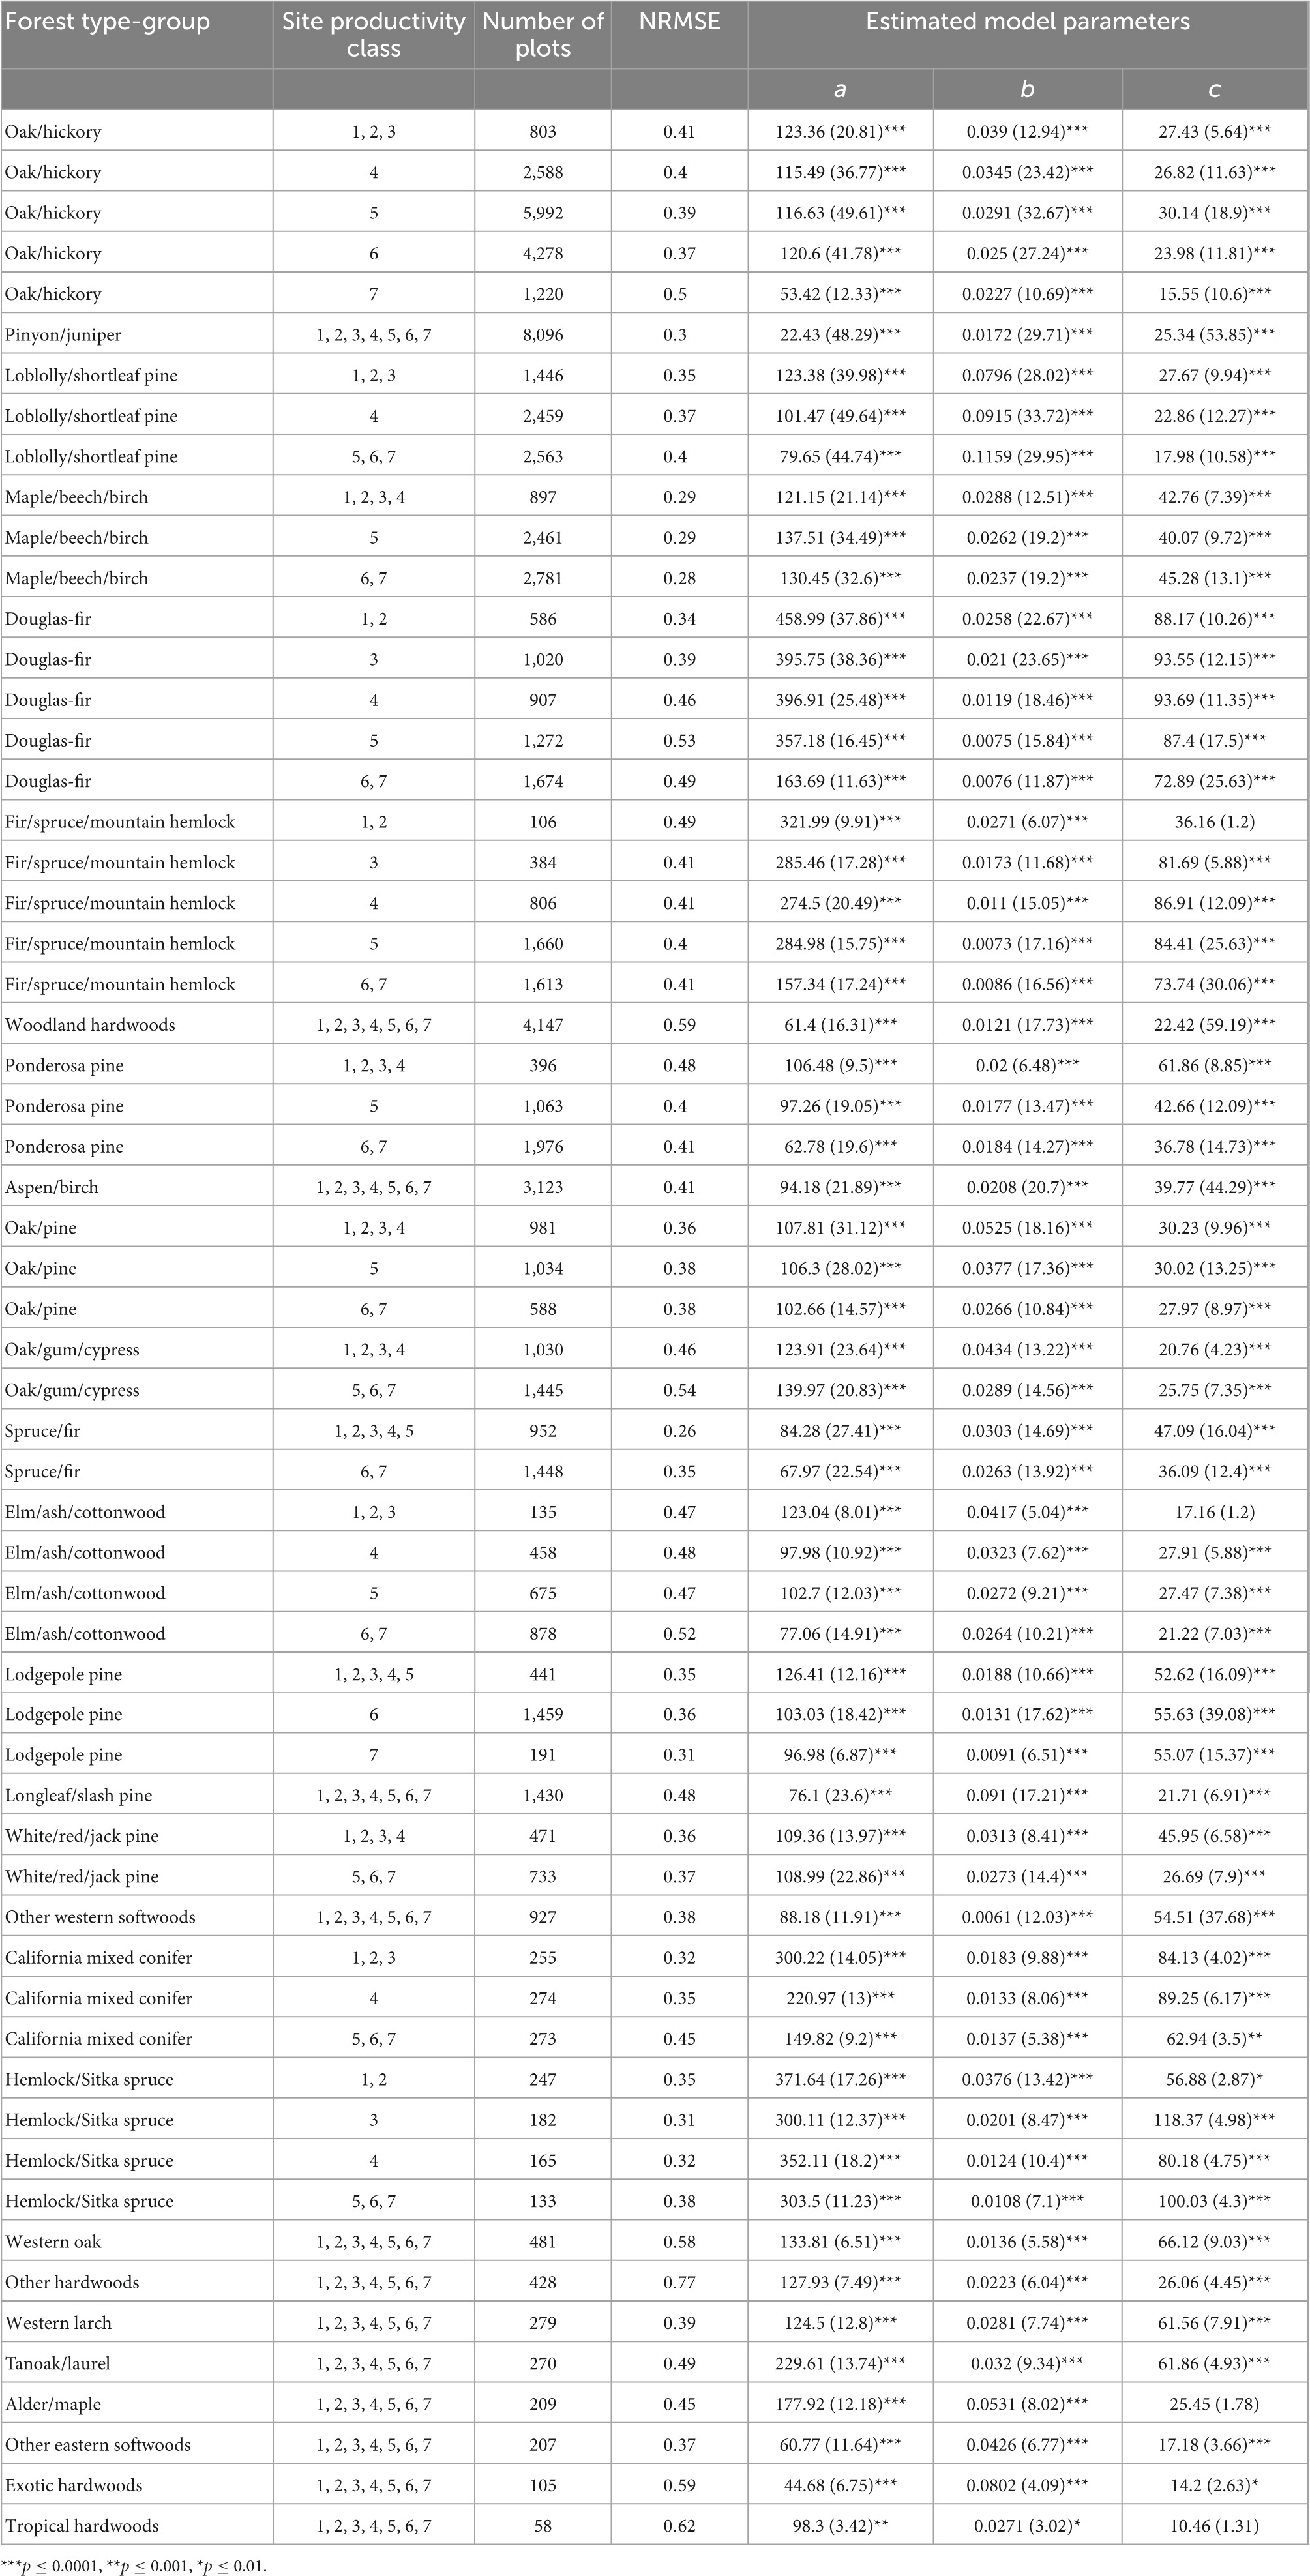
Table 1. Summary of sample size, accuracy, and estimated model parameters from the modified Chapman-Richards growth models within and among forest type-groups.
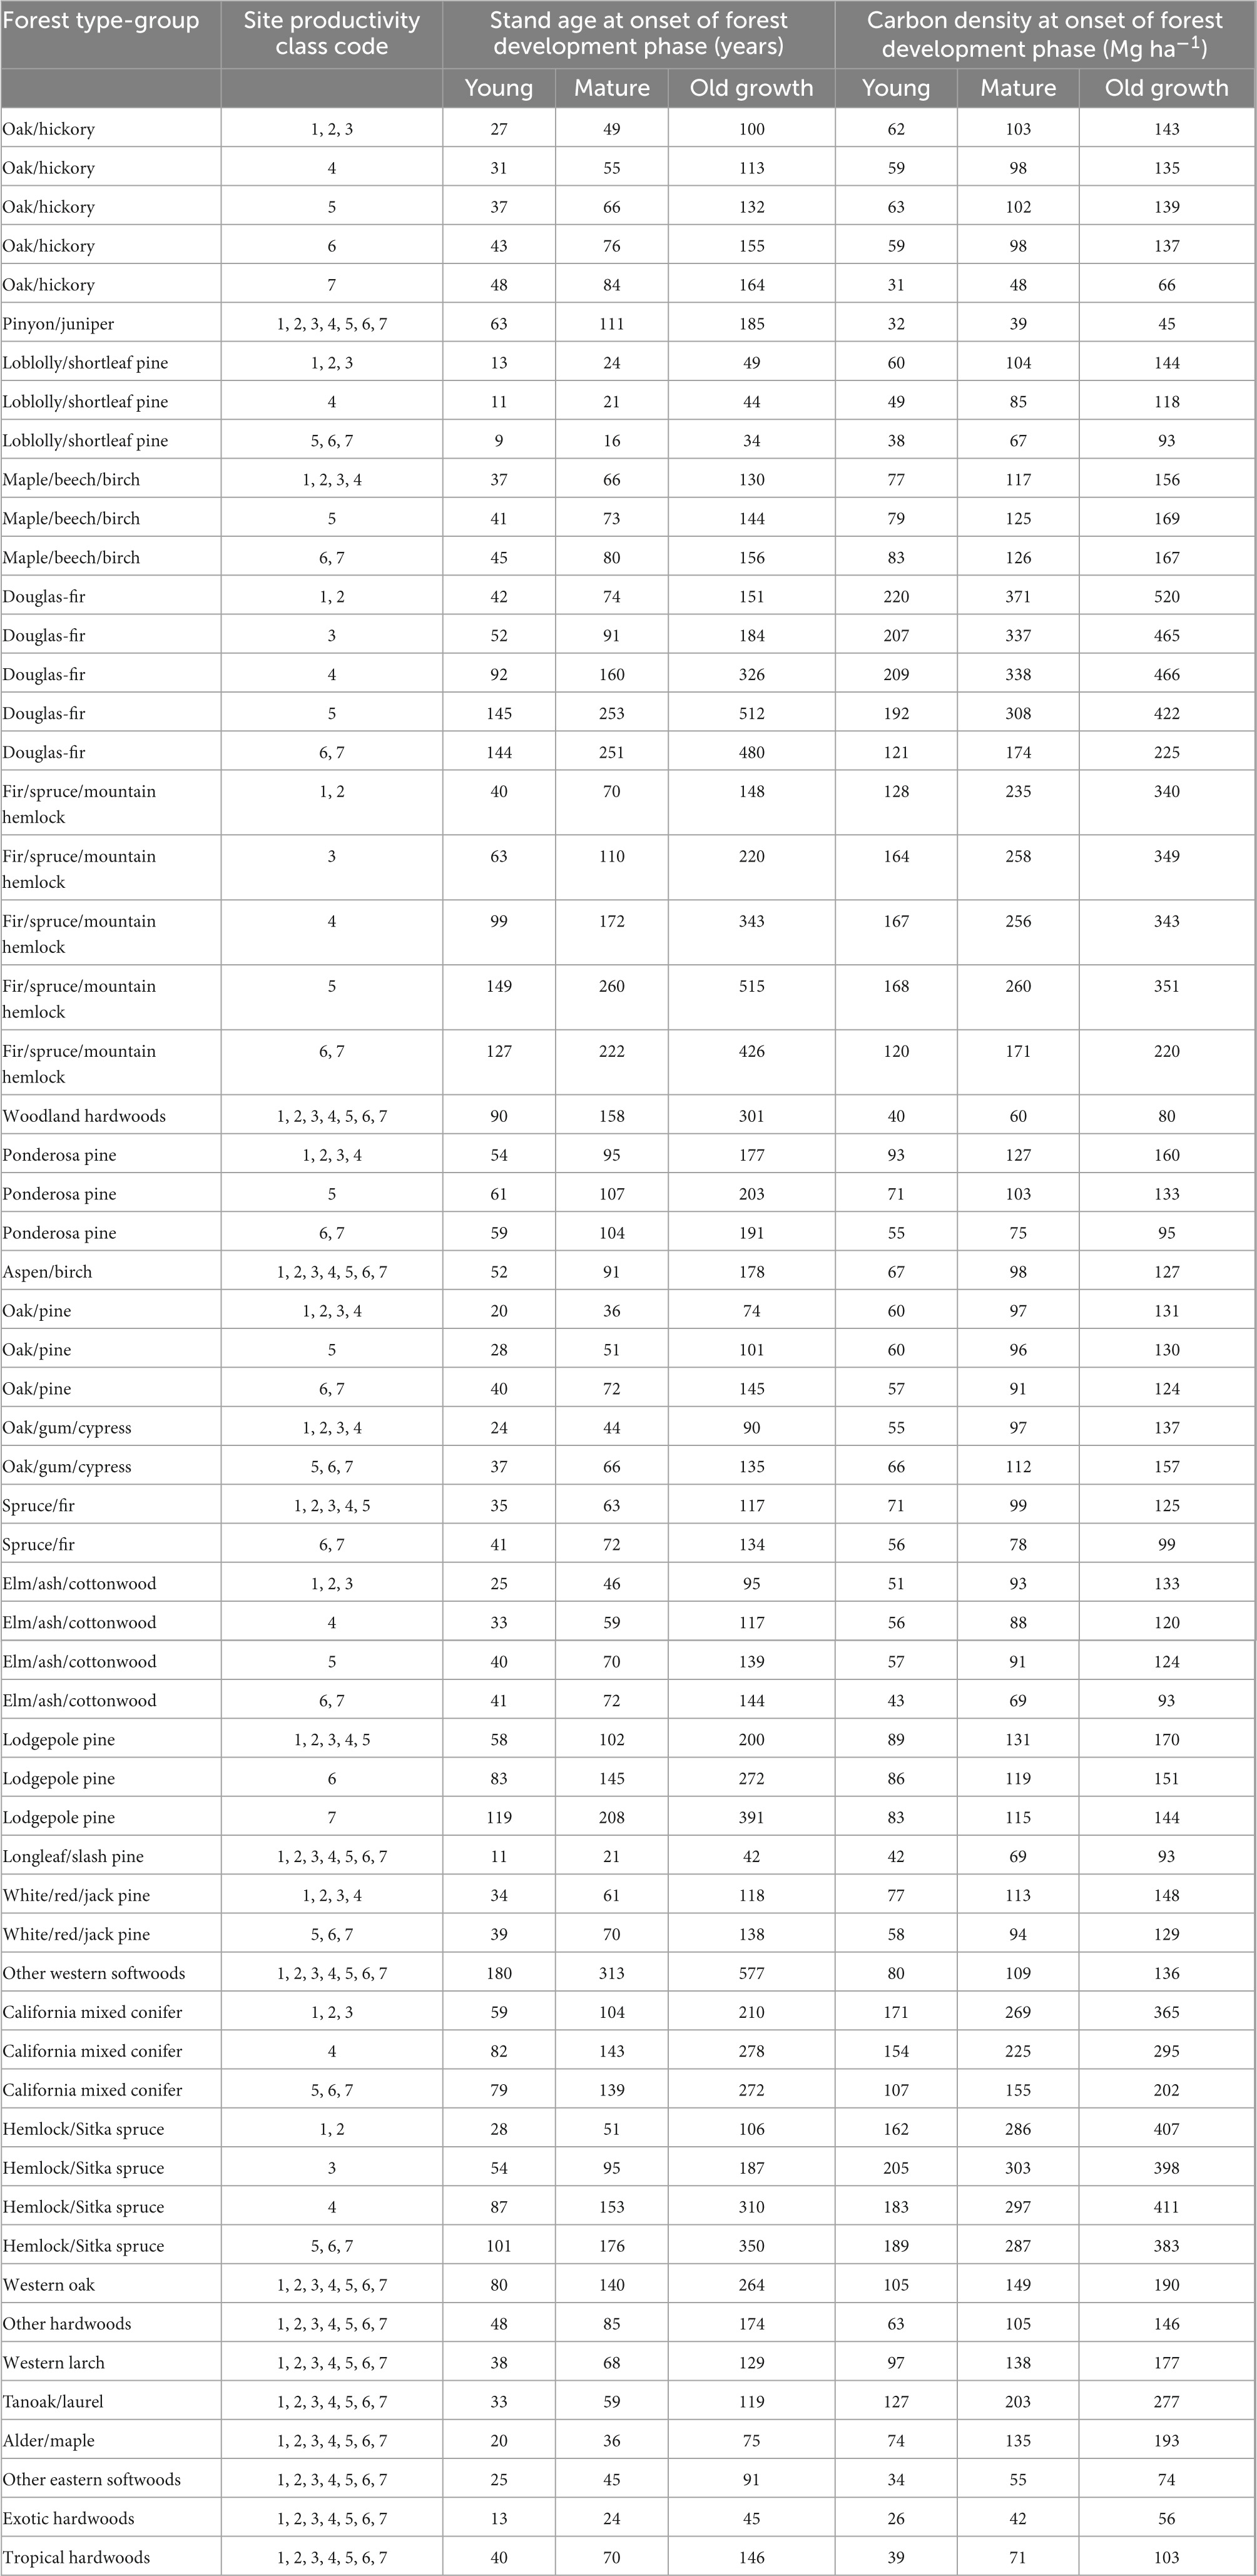
Table 2. Age and forest carbon density associated with the estimated age at transitions between stand development phases.
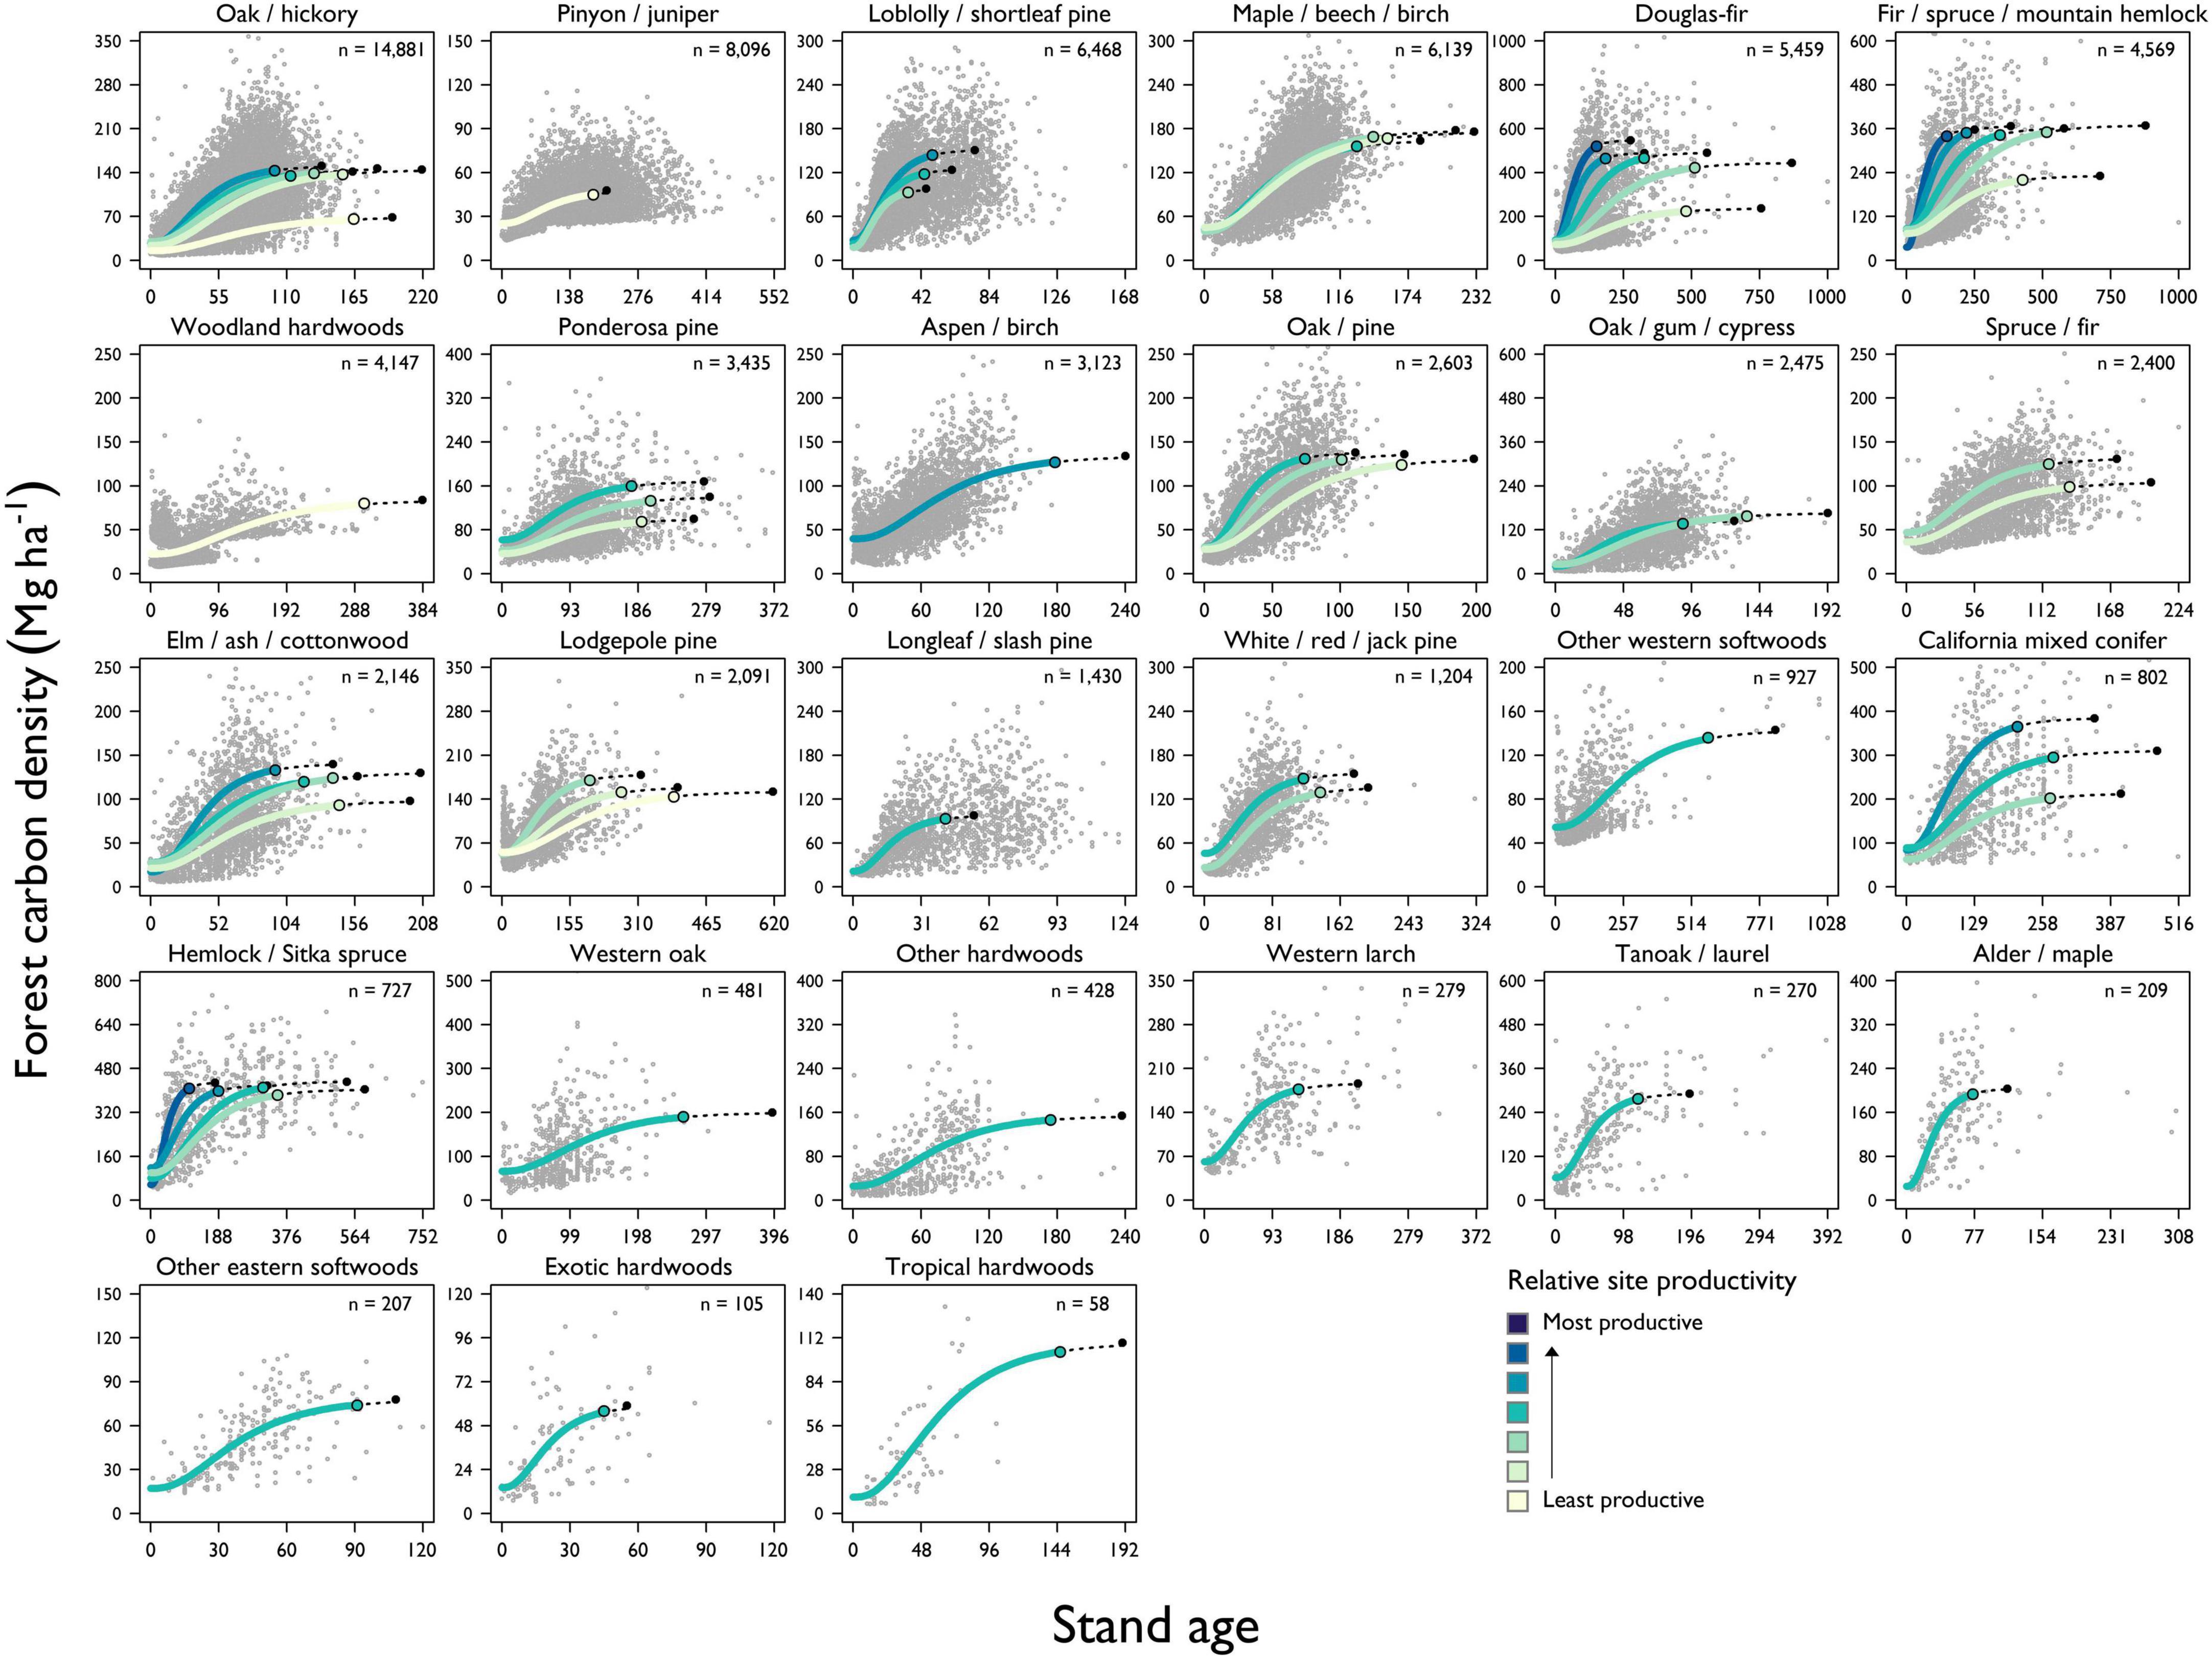
Figure 3. Model results of forest carbon accumulation for forest type-groups in the United States. When feasible, multiple forest carbon accumulation curves along a gradient of site productivity were fit to the forest inventory data. Each point in the scatter plot represents a unique FIA plot and the total number of plots within each forest type-group used in model fitting is presented in the panel’s upper right. The point at which the forest carbon accumulation curves reach 95% of the modeled asymptotic level is represented by the colored, filled circles. This point is used to derive the age at the onset of old-growth forest characteristics. The forest carbon accumulation curves are extended with dashed lines from the age at the onset of old growth to the modeled asymptotic level of forest carbon density.
Asymptotic forest carbon density ranged from a low of 45 Mg ha–1 in Pinyon/juniper to 520 Mg ha–1 in high-site Douglas-fir (Table 2). Some forest type-groups demonstrated very little difference in asymptotic carbon density across the site productivity gradient (e.g., Maple/beech/birch, Oak/pine, and Hemlock/Sitka spruce), while others differed significantly from the least to most productive sites (e.g., Douglas-fir, California mixed conifer, Ponderosa pine, Loblolly/shortleaf pine, and Elm/ash/cottonwood).
Estimates from the most recent FIA inventory indicate there are 263,989,190 hectares of forested land in CONUS after excluding forest type-groups for which we did not model forest carbon accumulation (mostly “Nonstocked” forest). Excluded forest type-groups equaled 12,034,831 hectares or roughly 4% of the estimated total forestland. We classified 6.3% of forests as old growth, 32.4% as mature, 31.4% as young and 29.9% as early seral. Just three forest type-groups, Loblolly/shortleaf pine, Longleaf/slash pine, and Pinyon/juniper, contribute approximately 77% of the current old-growth forest estate (Table 3). The average proportion of each forest type-group currently in the old-growth phase is 7.46%, but this varies widely among forest type-groups from zero in the Tropical hardwoods to 22.6% of the Loblolly/shortleaf pine forest, which, at 5.7 million hectares, is the most abundant old-growth type (Figure 4). The most abundant mature forest type is Oak/hickory at 27.7 million hectares, which, like Maple/beech/birch, Oak/gum/cypress, Spruce/fir, White/red/jack pine, Alder/maple, Other eastern softwoods, and Western larch, has over 40% of its area in the mature forest stage. Figure 4 shows that seven forest type-groups, including Fir/spruce/mountain hemlock, Woodland hardwoods, and Douglas-fir, have less than 15% of their area in the mature stage or older, while six forest type-groups have more than half of their area in the mature or old-growth stages. Mature forest is the most common stage in 14 of 27 forest type-groups (Figure 5).
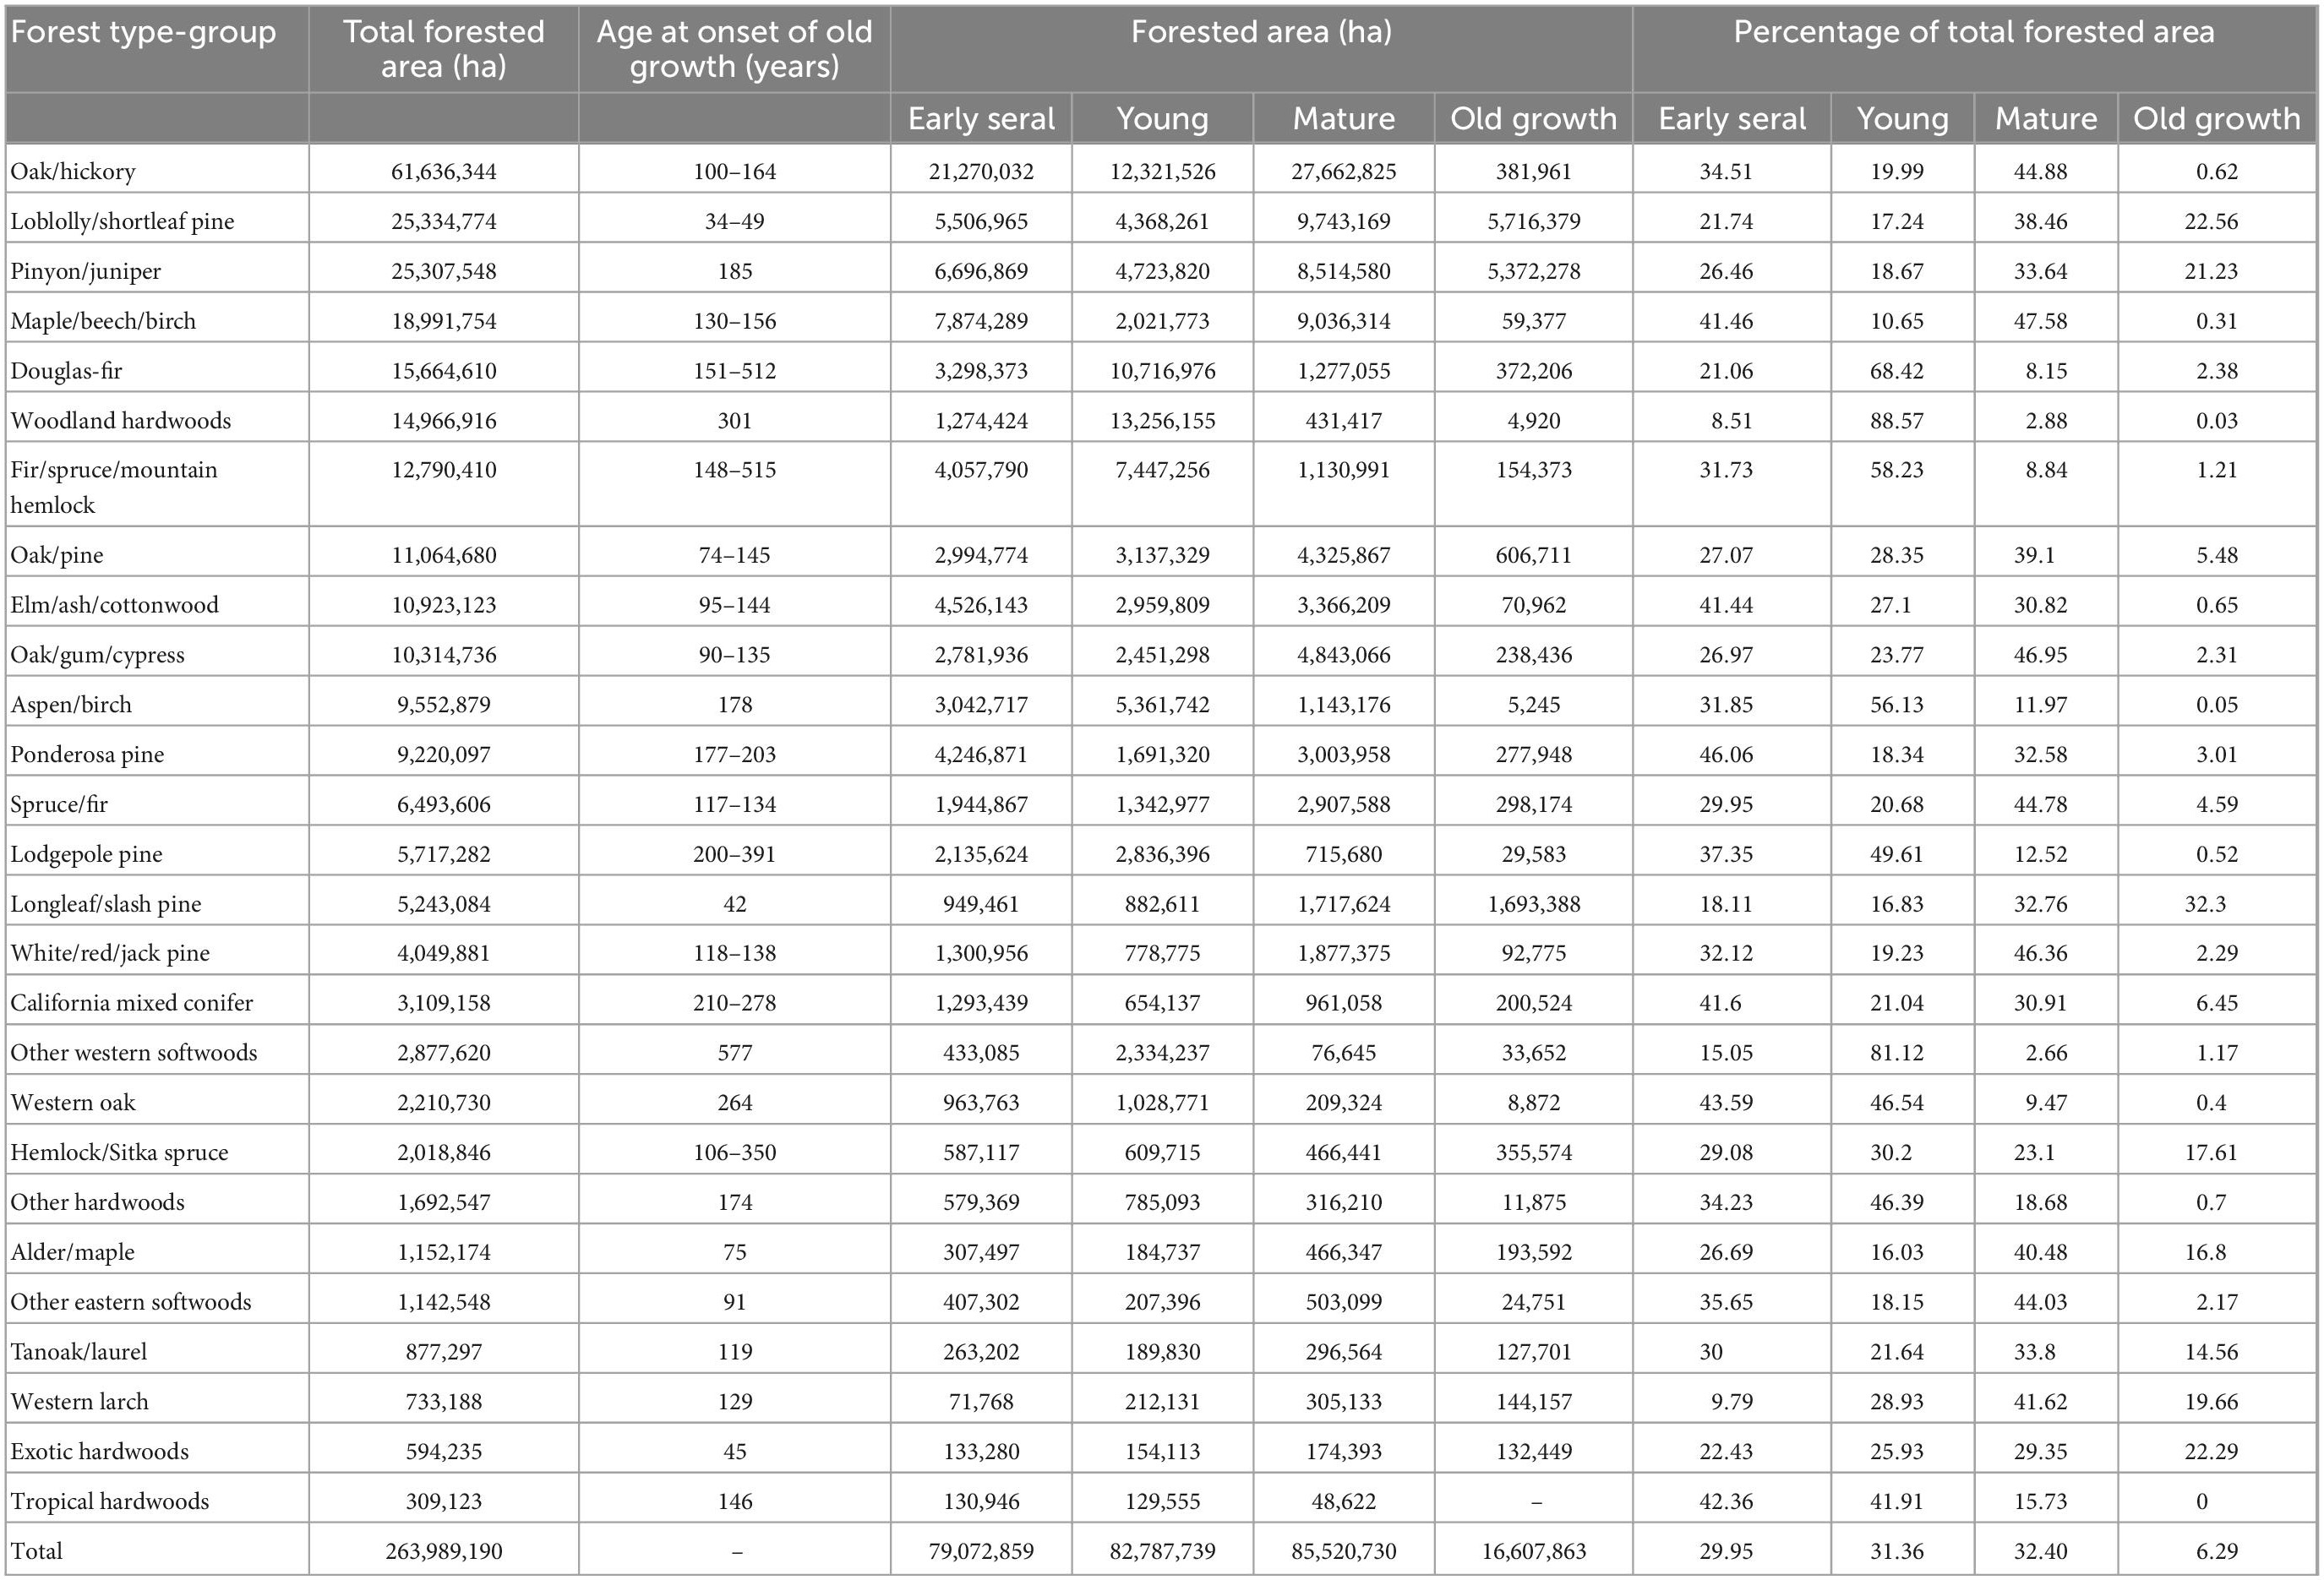
Table 3. Estimates of total forest area, range of age at onset of old growth, forested area by stand development phase, and proportion of total forest area in each stand development phase across forest type-groups.
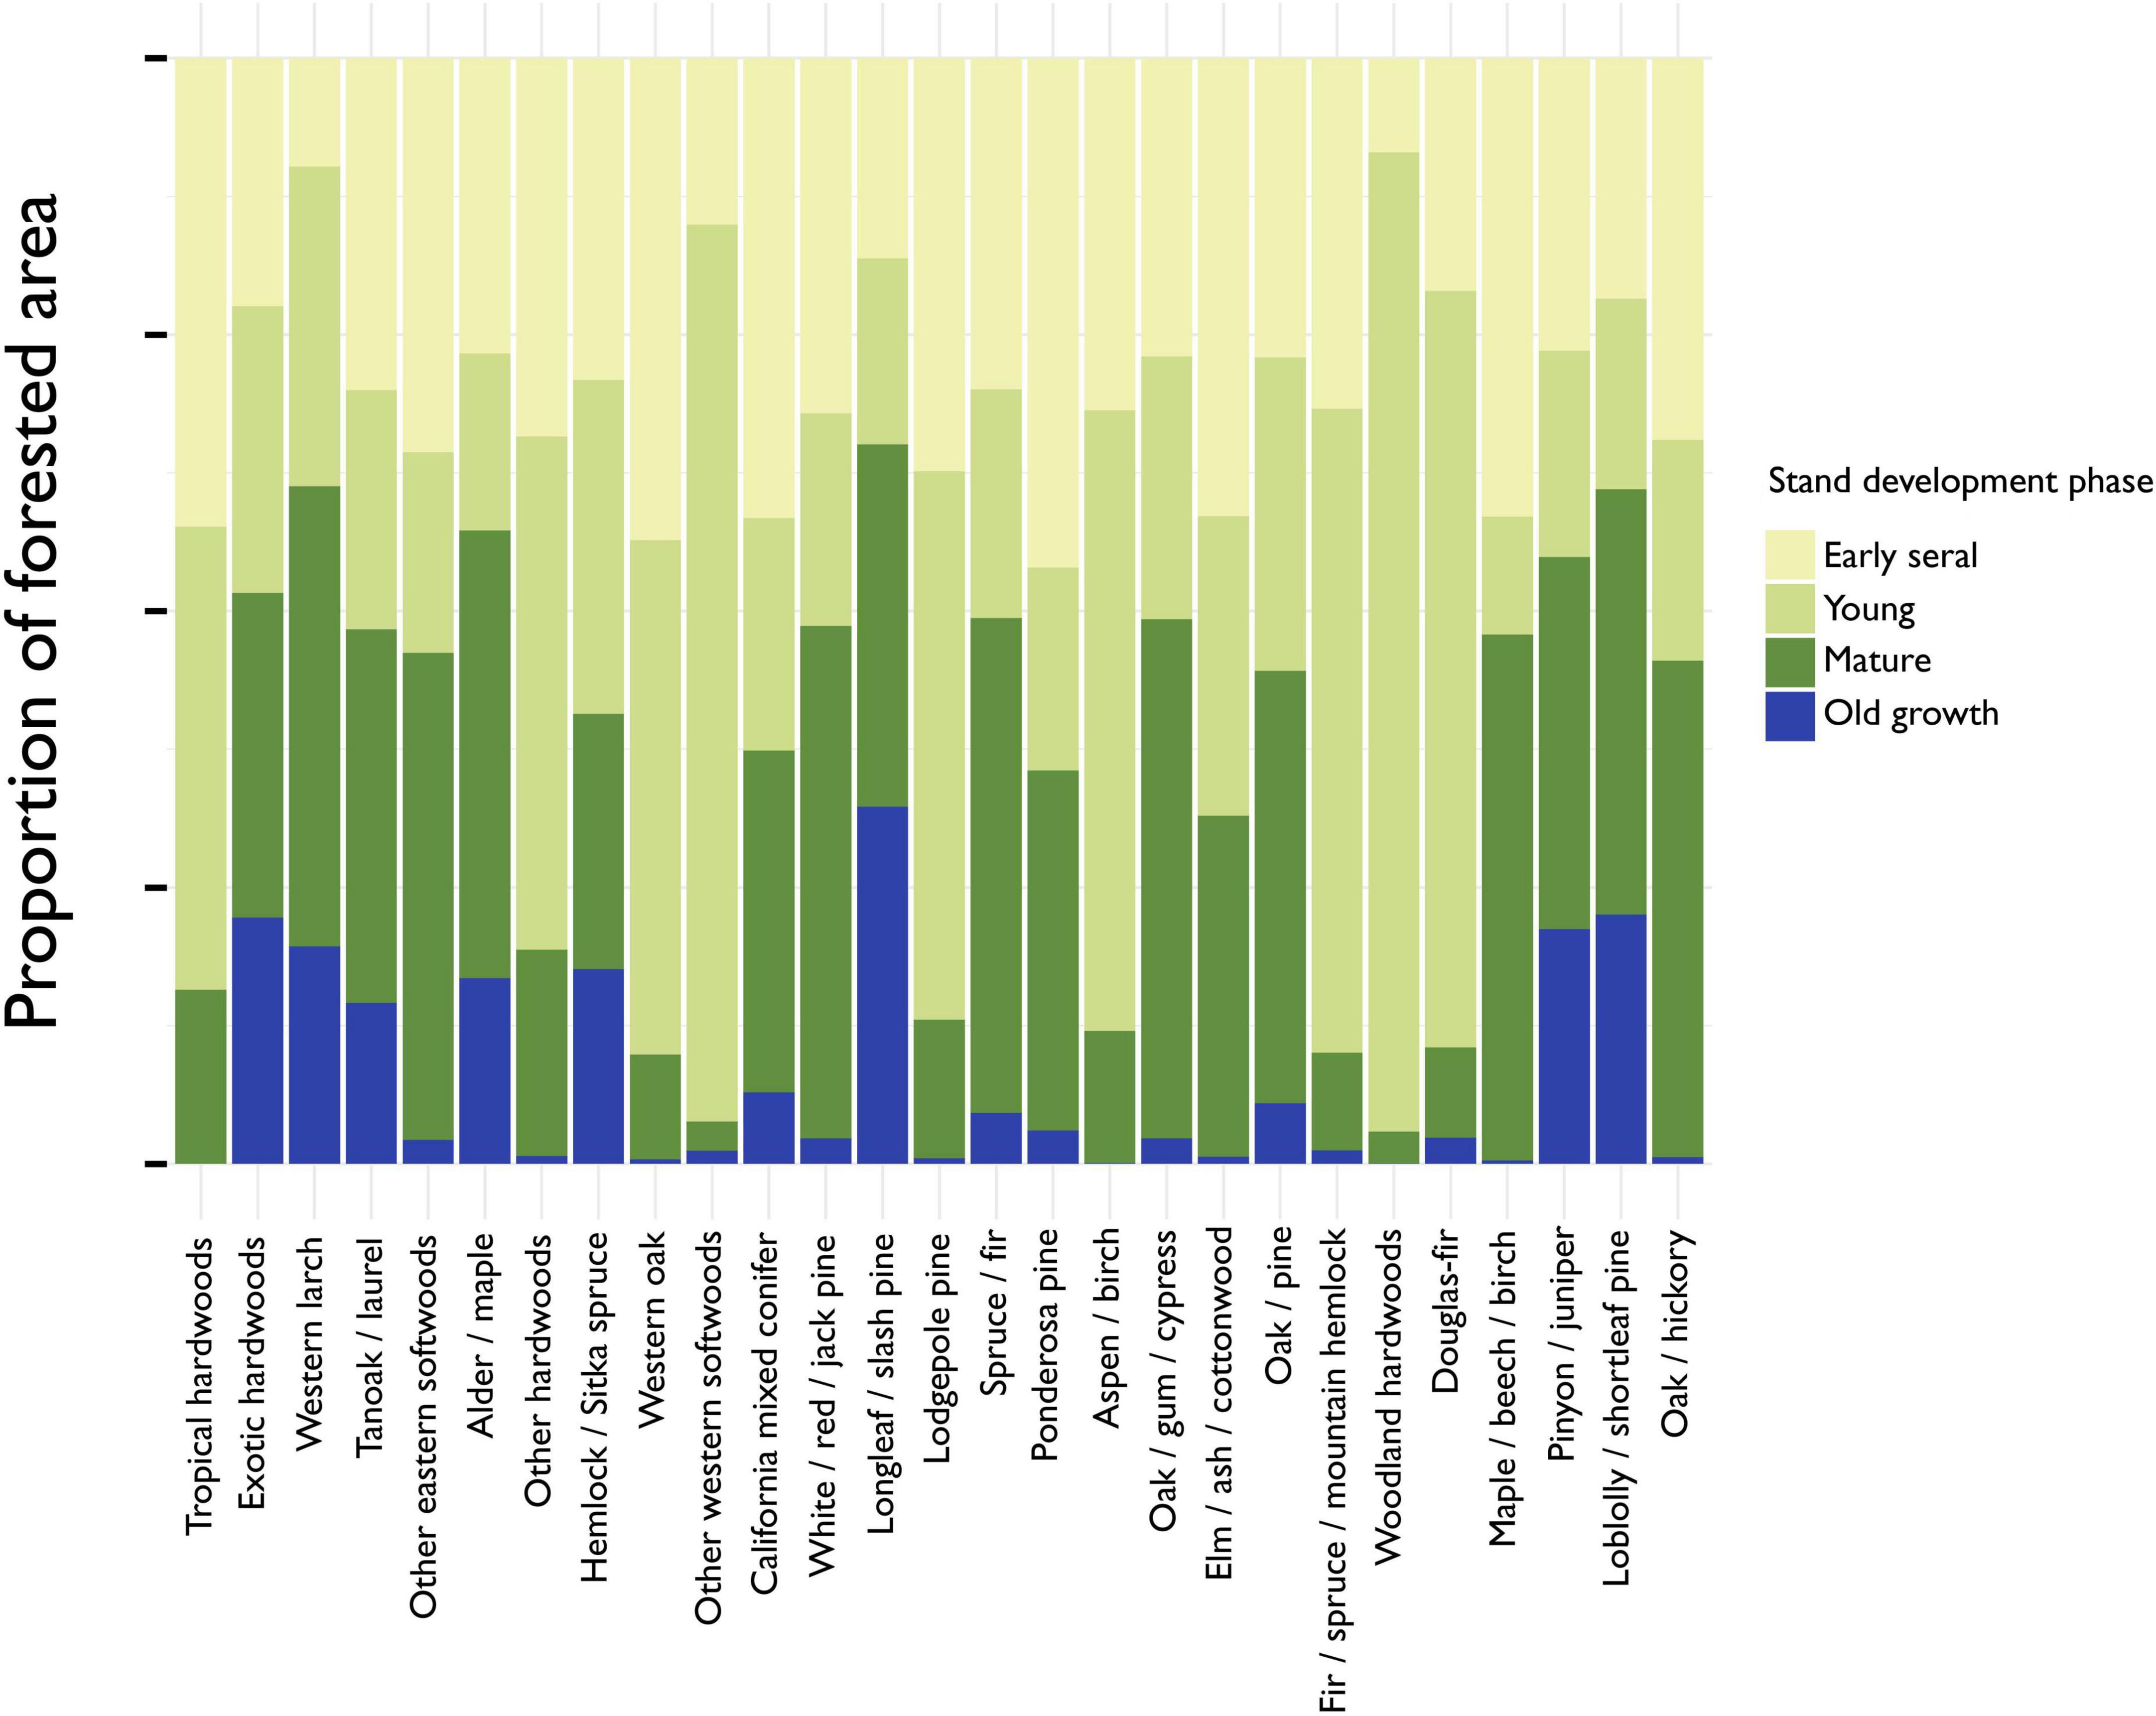
Figure 4. The proportion of total forested area by forest type-group and stand development phase. Forested area is estimated using standard, post-stratification estimators developed by the Forest Inventory and Analysis program. Forest type-groups are ordered along the x-axis in terms of increasing forest extent.
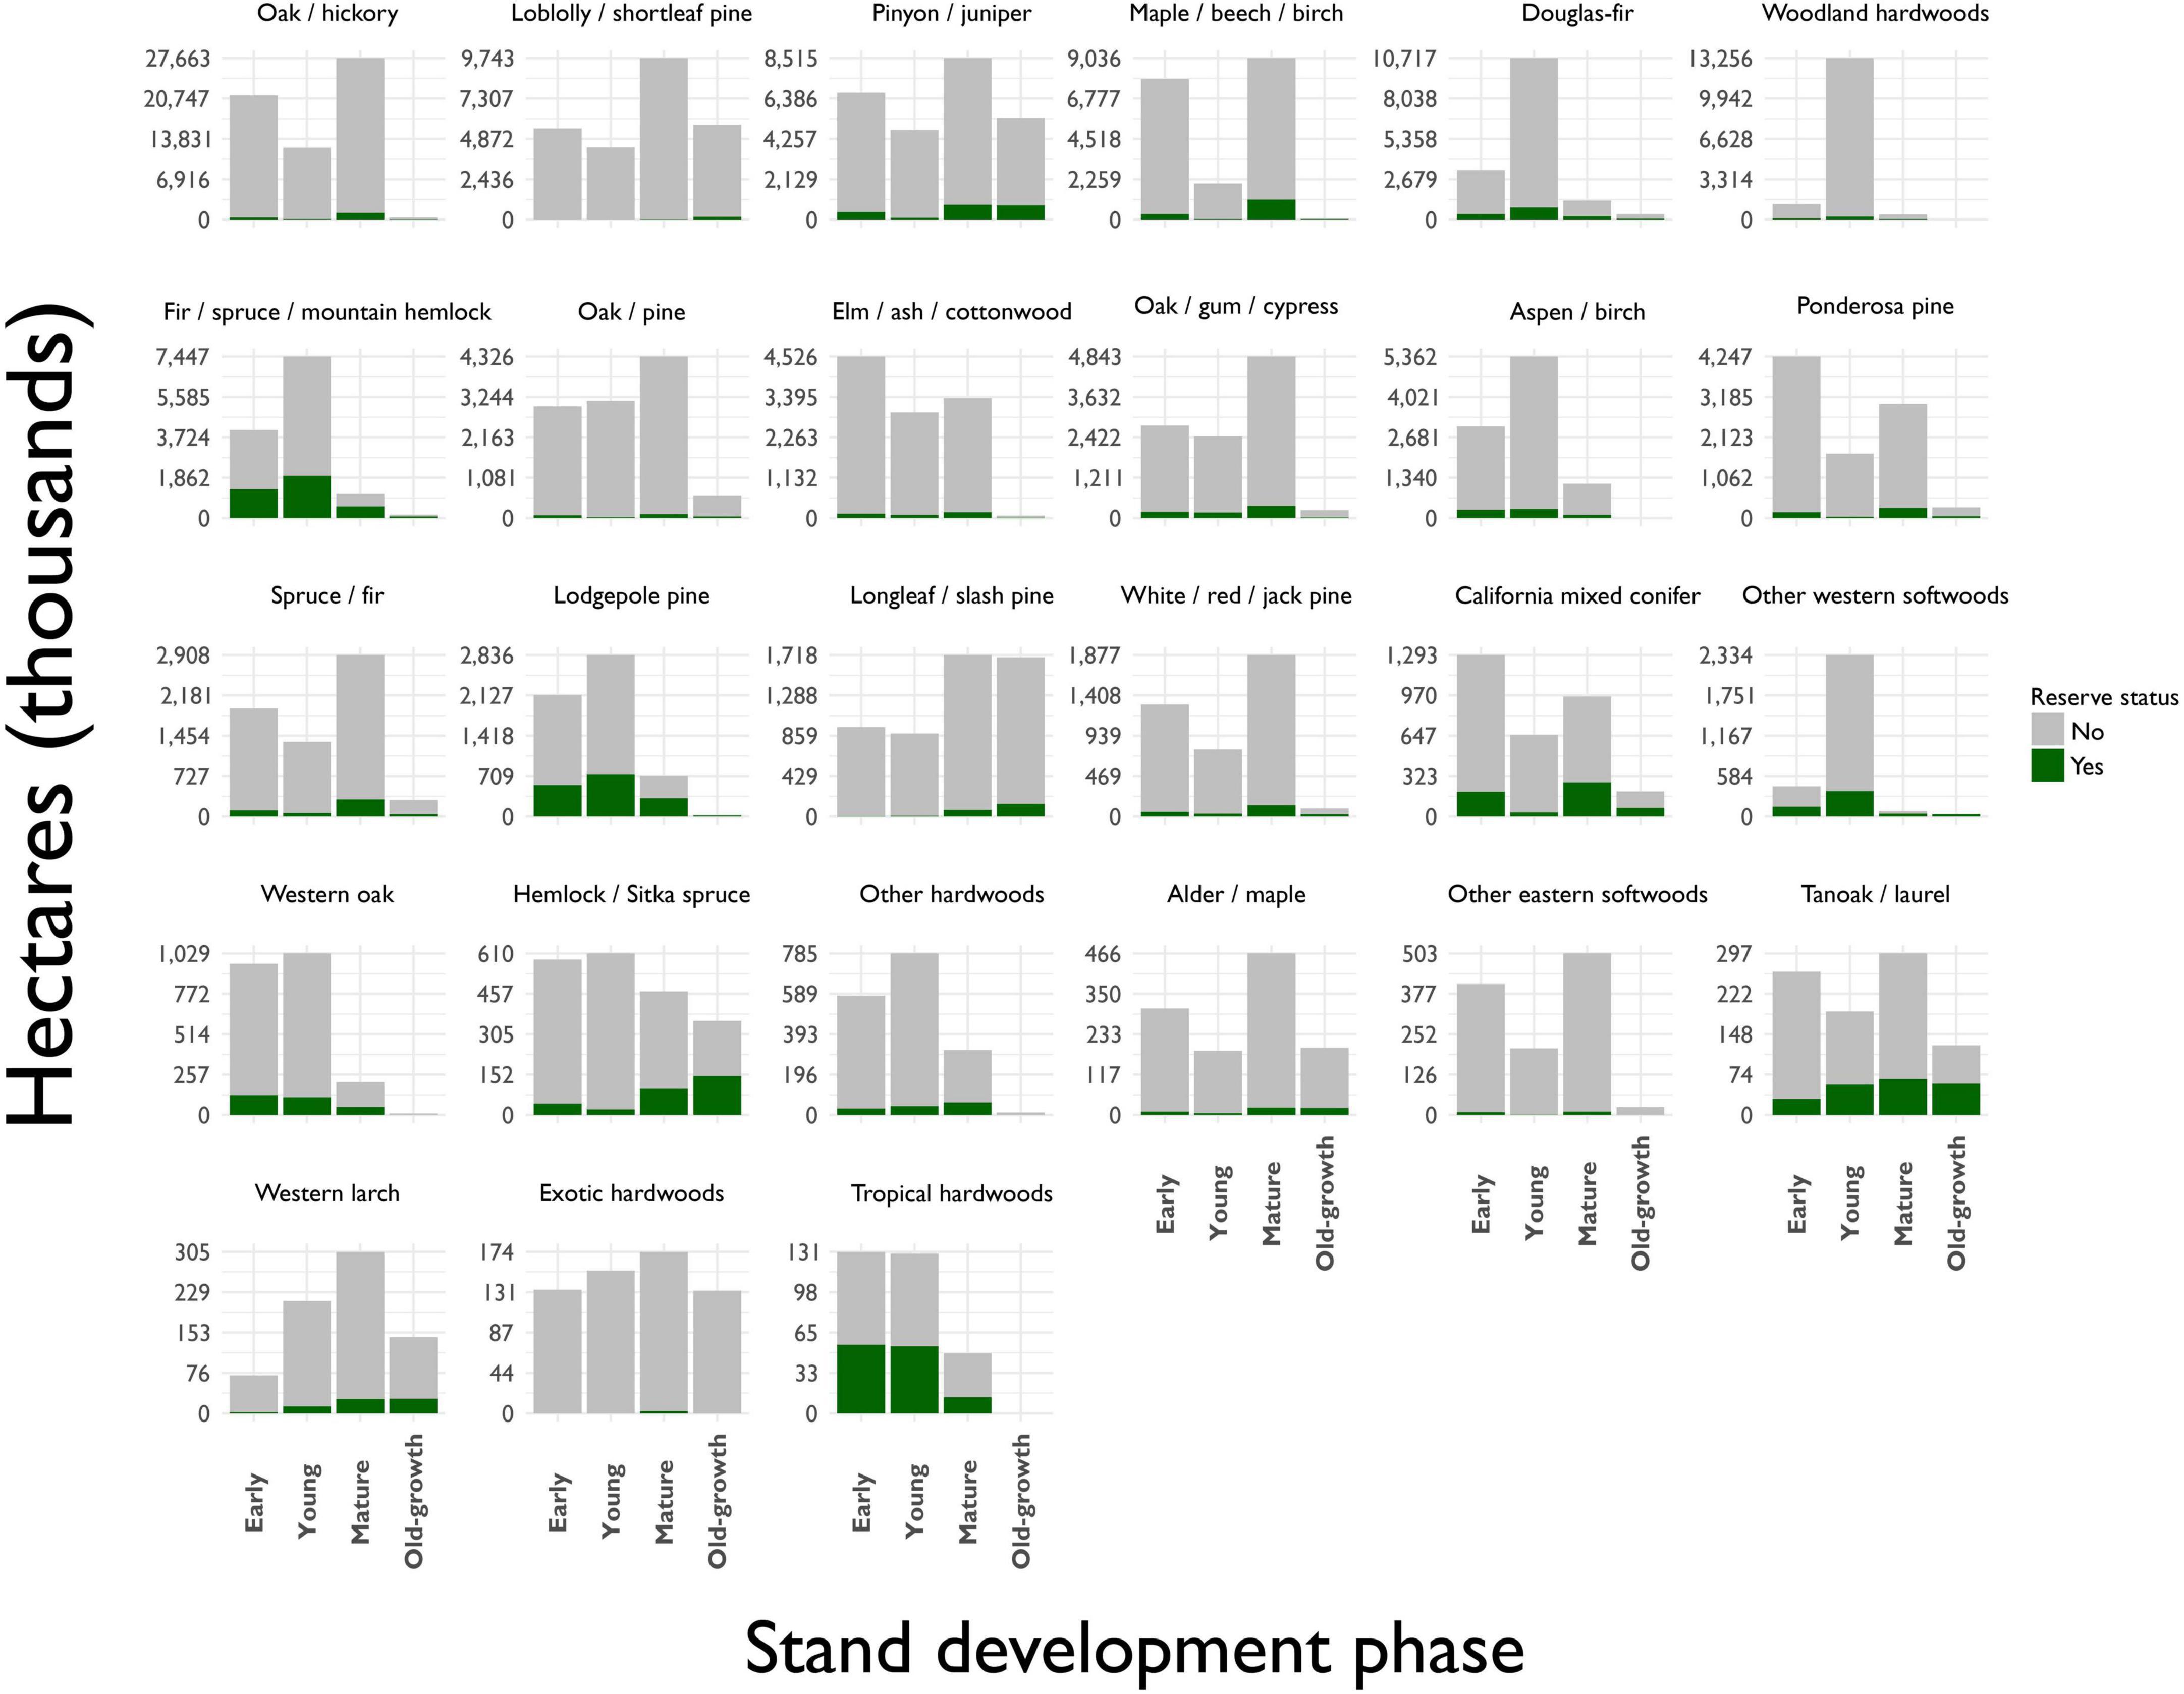
Figure 5. Distribution of forested area by forest type-group, stand development phase and reserve status. Reserves are defined by FIA as public lands permanently prohibited from being managed for wood production through statute or agency mandate, including wilderness areas, national parks and monuments, and most state parks.
Of the current old-growth forest estate, we found that approximately 11% is located within congressionally designated conservation reserves (Table 4). The proportion of current old-growth forests found within reserves varies among forest type-groups (Figure 5). For several western gymnosperm forest type-groups (e.g., California mixed conifer, Hemlock/Sitka spruce, Lodgepole pine, and Fir/spruce/mountain hemlock), more than one-third of current old-growth forests is found in reserves. For several eastern forest type-groups with relatively appreciable amounts of old growth (i.e., Longleaf/slash pine, Loblolly/shortleaf pine, and Oak/pine), less than 10% of current old growth is found in reserves.
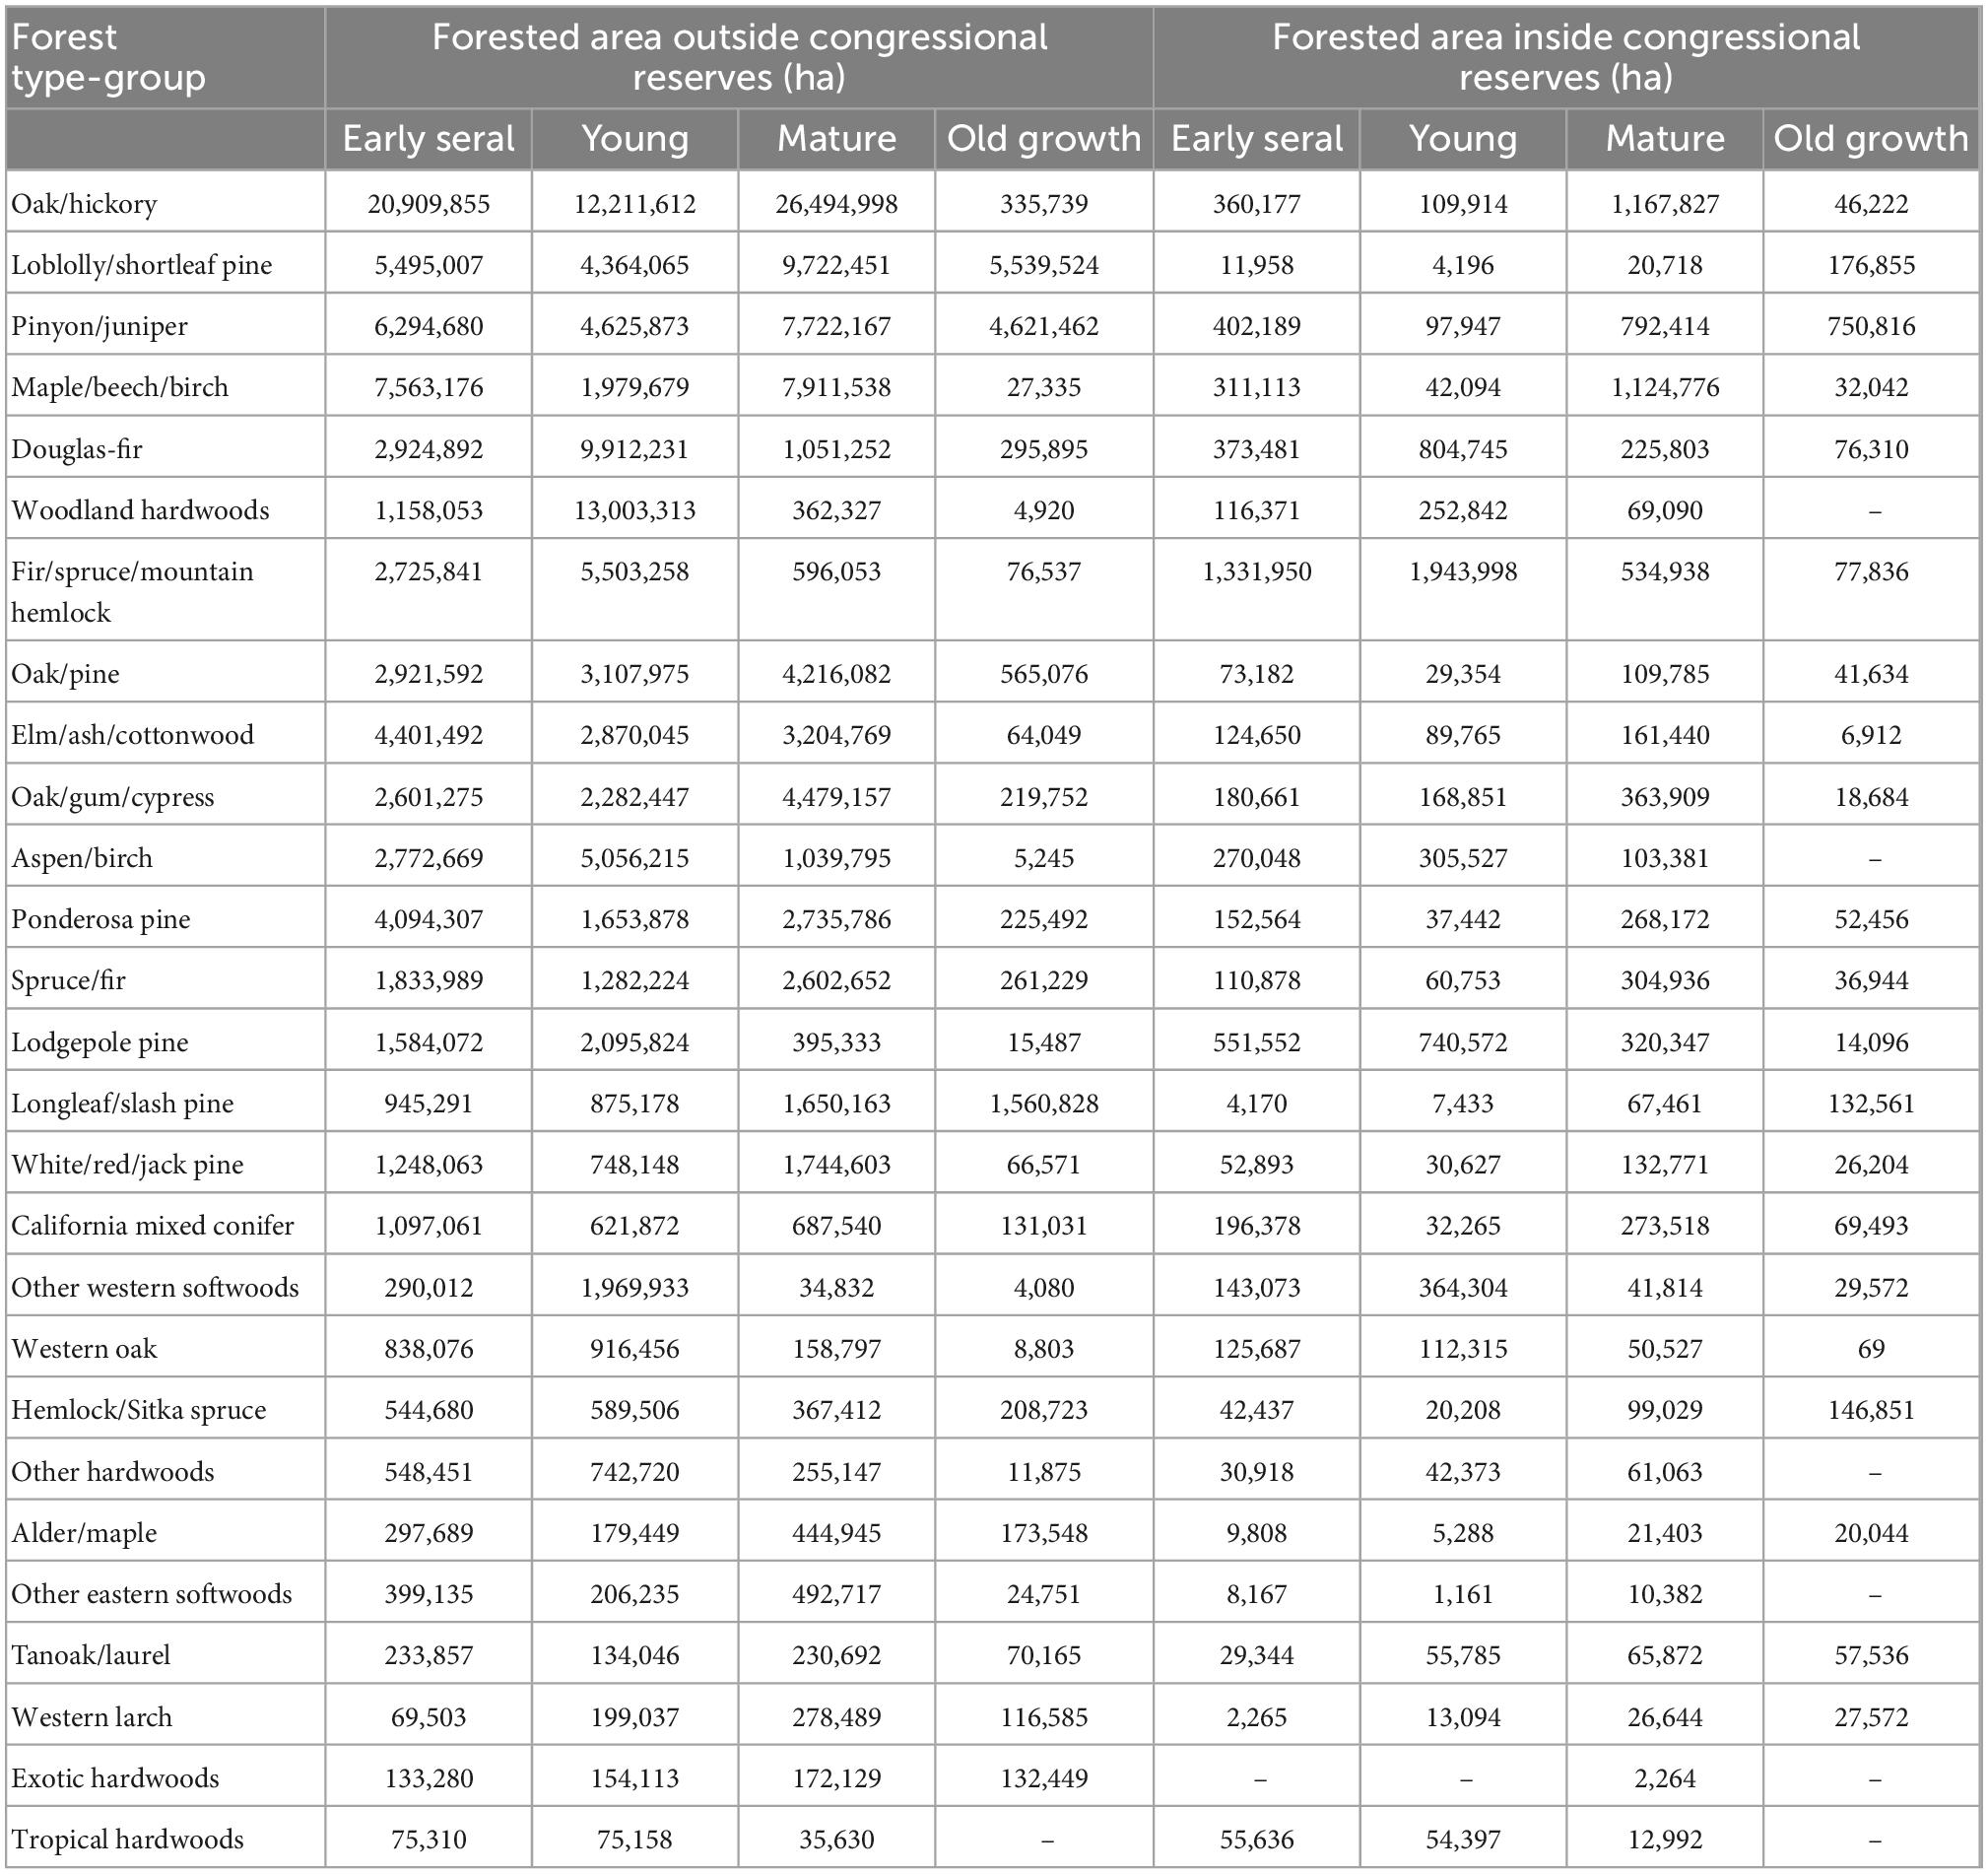
Table 4. Forested area outside and within congressionally designated reserved lands across forest type-groups.
With the exception of the Pinyon/juniper-dominated Bureau of Land Management lands, old growth is the least abundant stand development phase across all ownership categories (Figure 6 and Supplementary Table 2). Mature forests are the most abundant stand development phase in all ownership classes except USFS land, where young forest is most common. Overall, about 45% of all old growth occurs on Private/Native American land, despite being only 4.4% old growth. Another 23.7% of old growth in CONUS occurs on USFS land, which is 7.5% old growth.
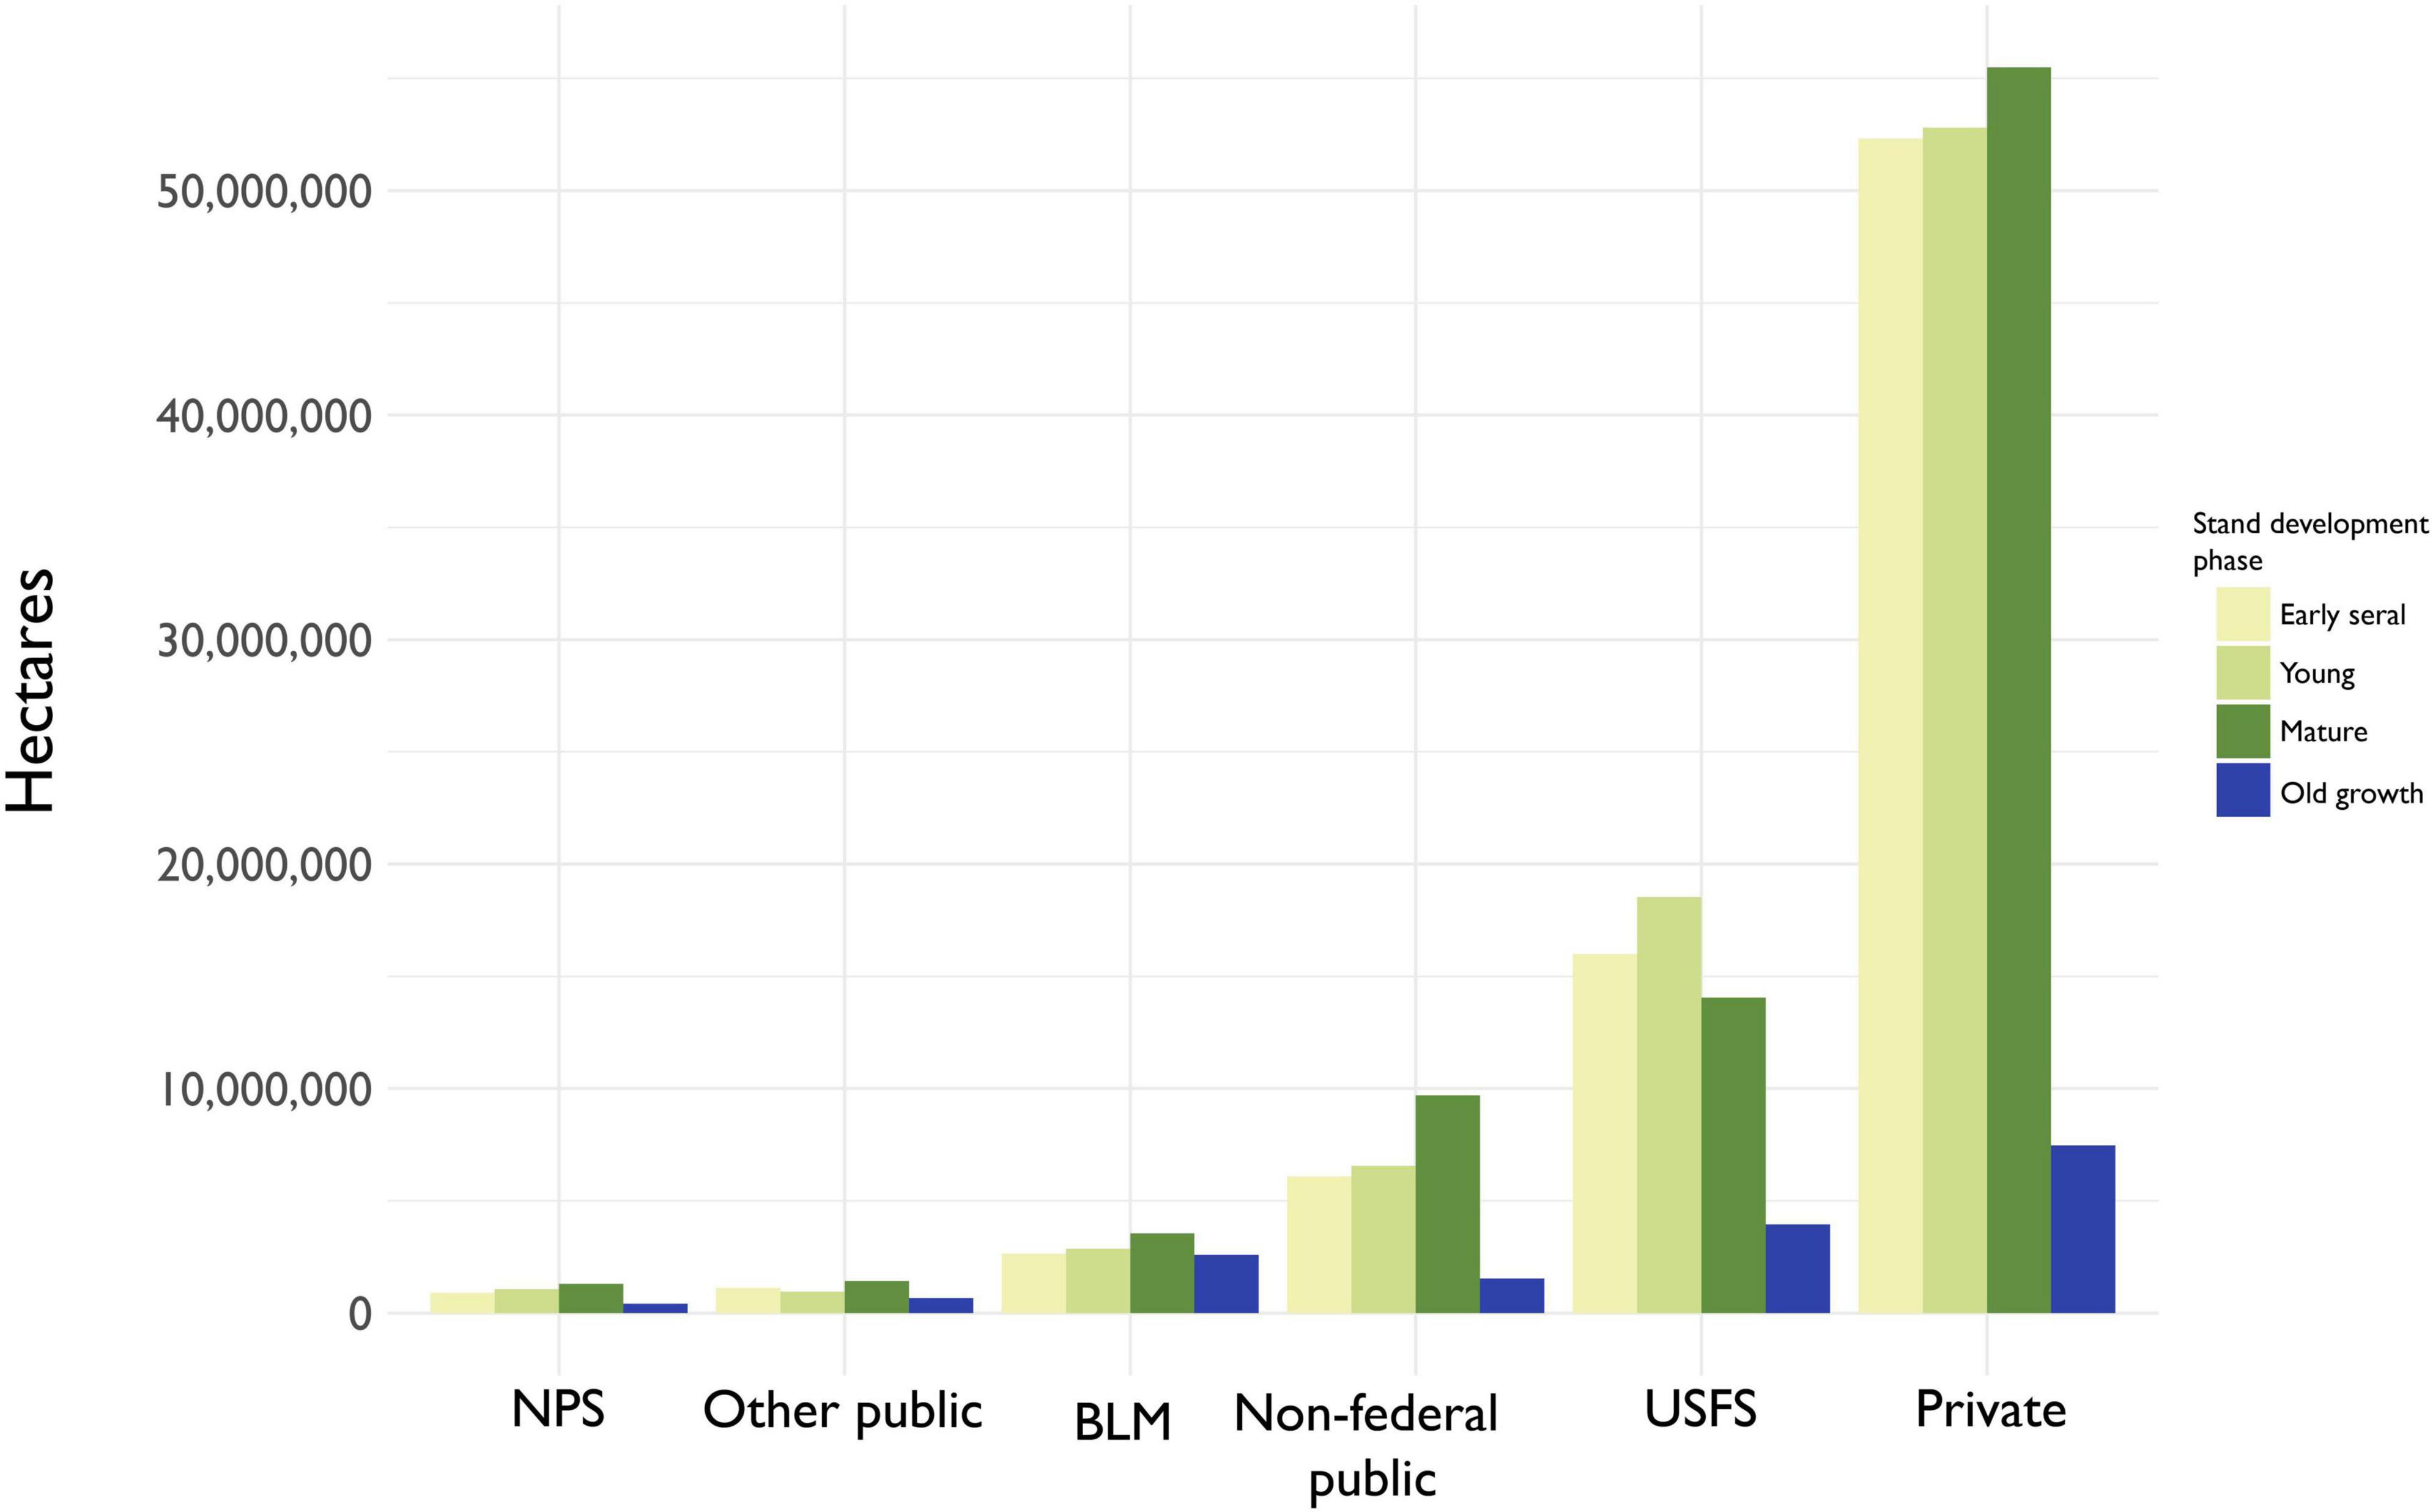
Figure 6. Estimates of forested area by ownership groups and stand development phase. “NPS”, National Park Service; “Other federal”, Fish and Wildlife Service, Department of Defense, Department of Energy, and other federal agencies; “BLM”, Bureau of Land Management; “Non-federal public”, state/local governments or other non-federal public institutions; “USFS”, United States Forest Service; “Private”, undifferentiated private and Native American reservation lands.
Site quality is unevenly distributed across forest land and across ownerships (Figure 7). The vast majority of BLM land is in the lowest site productivity class, as is almost all of its old growth. Old growth tends to be most common in the lowest site productivity classes of other ownerships, as well, though the national parks, which mostly occur on lower quality sites, are rich in old growth where site quality is relatively high. Approximately 3% of the current old-growth forest estate can be found in the two most productive site classes, while approximately 33% can be found in the lowest site productivity class (Table 5).
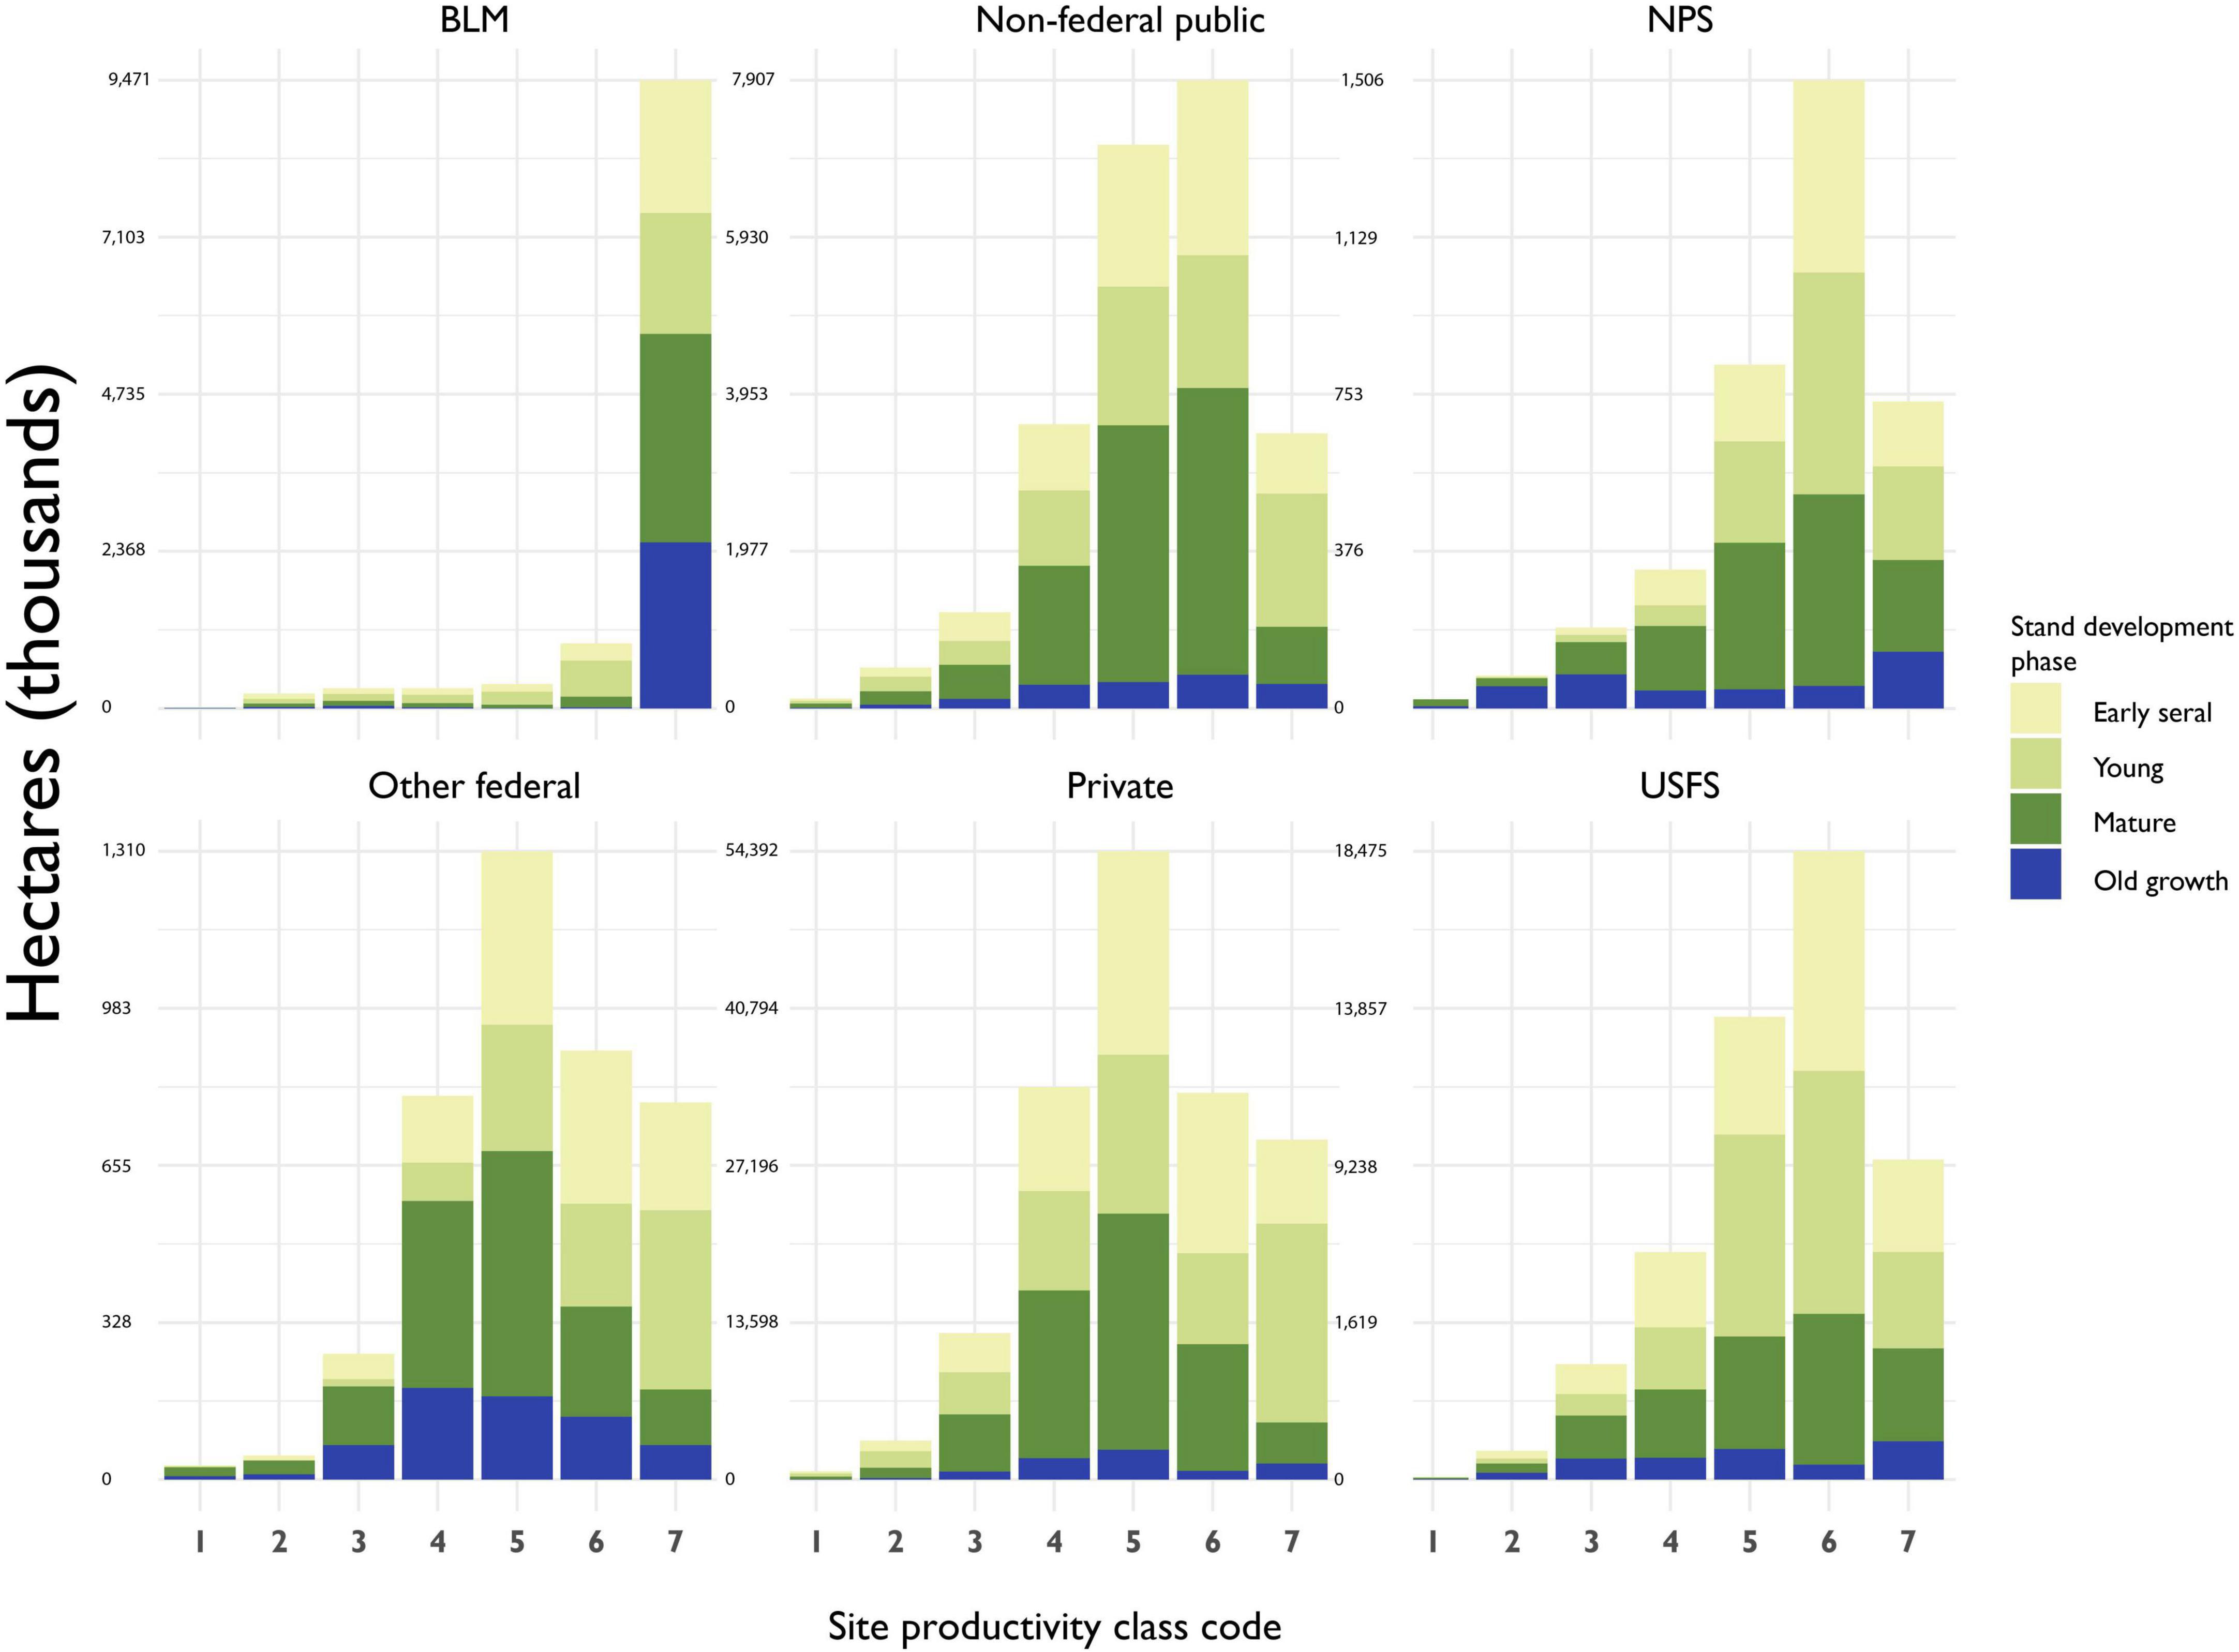
Figure 7. Estimates of forested area by ownership groups, site productivity class and stand development phase. “NPS”, National Park Service; “Other federal”, Fish and Wildlife Service, Department of Defense, Department of Energy, and other federal agencies; “BLM”, Bureau of Land Management; “Non-federal public”, state/local governments or other non-federal public institutions; “USFS”, United States Forest Service; “Private”, undifferentiated private and Native American lands.
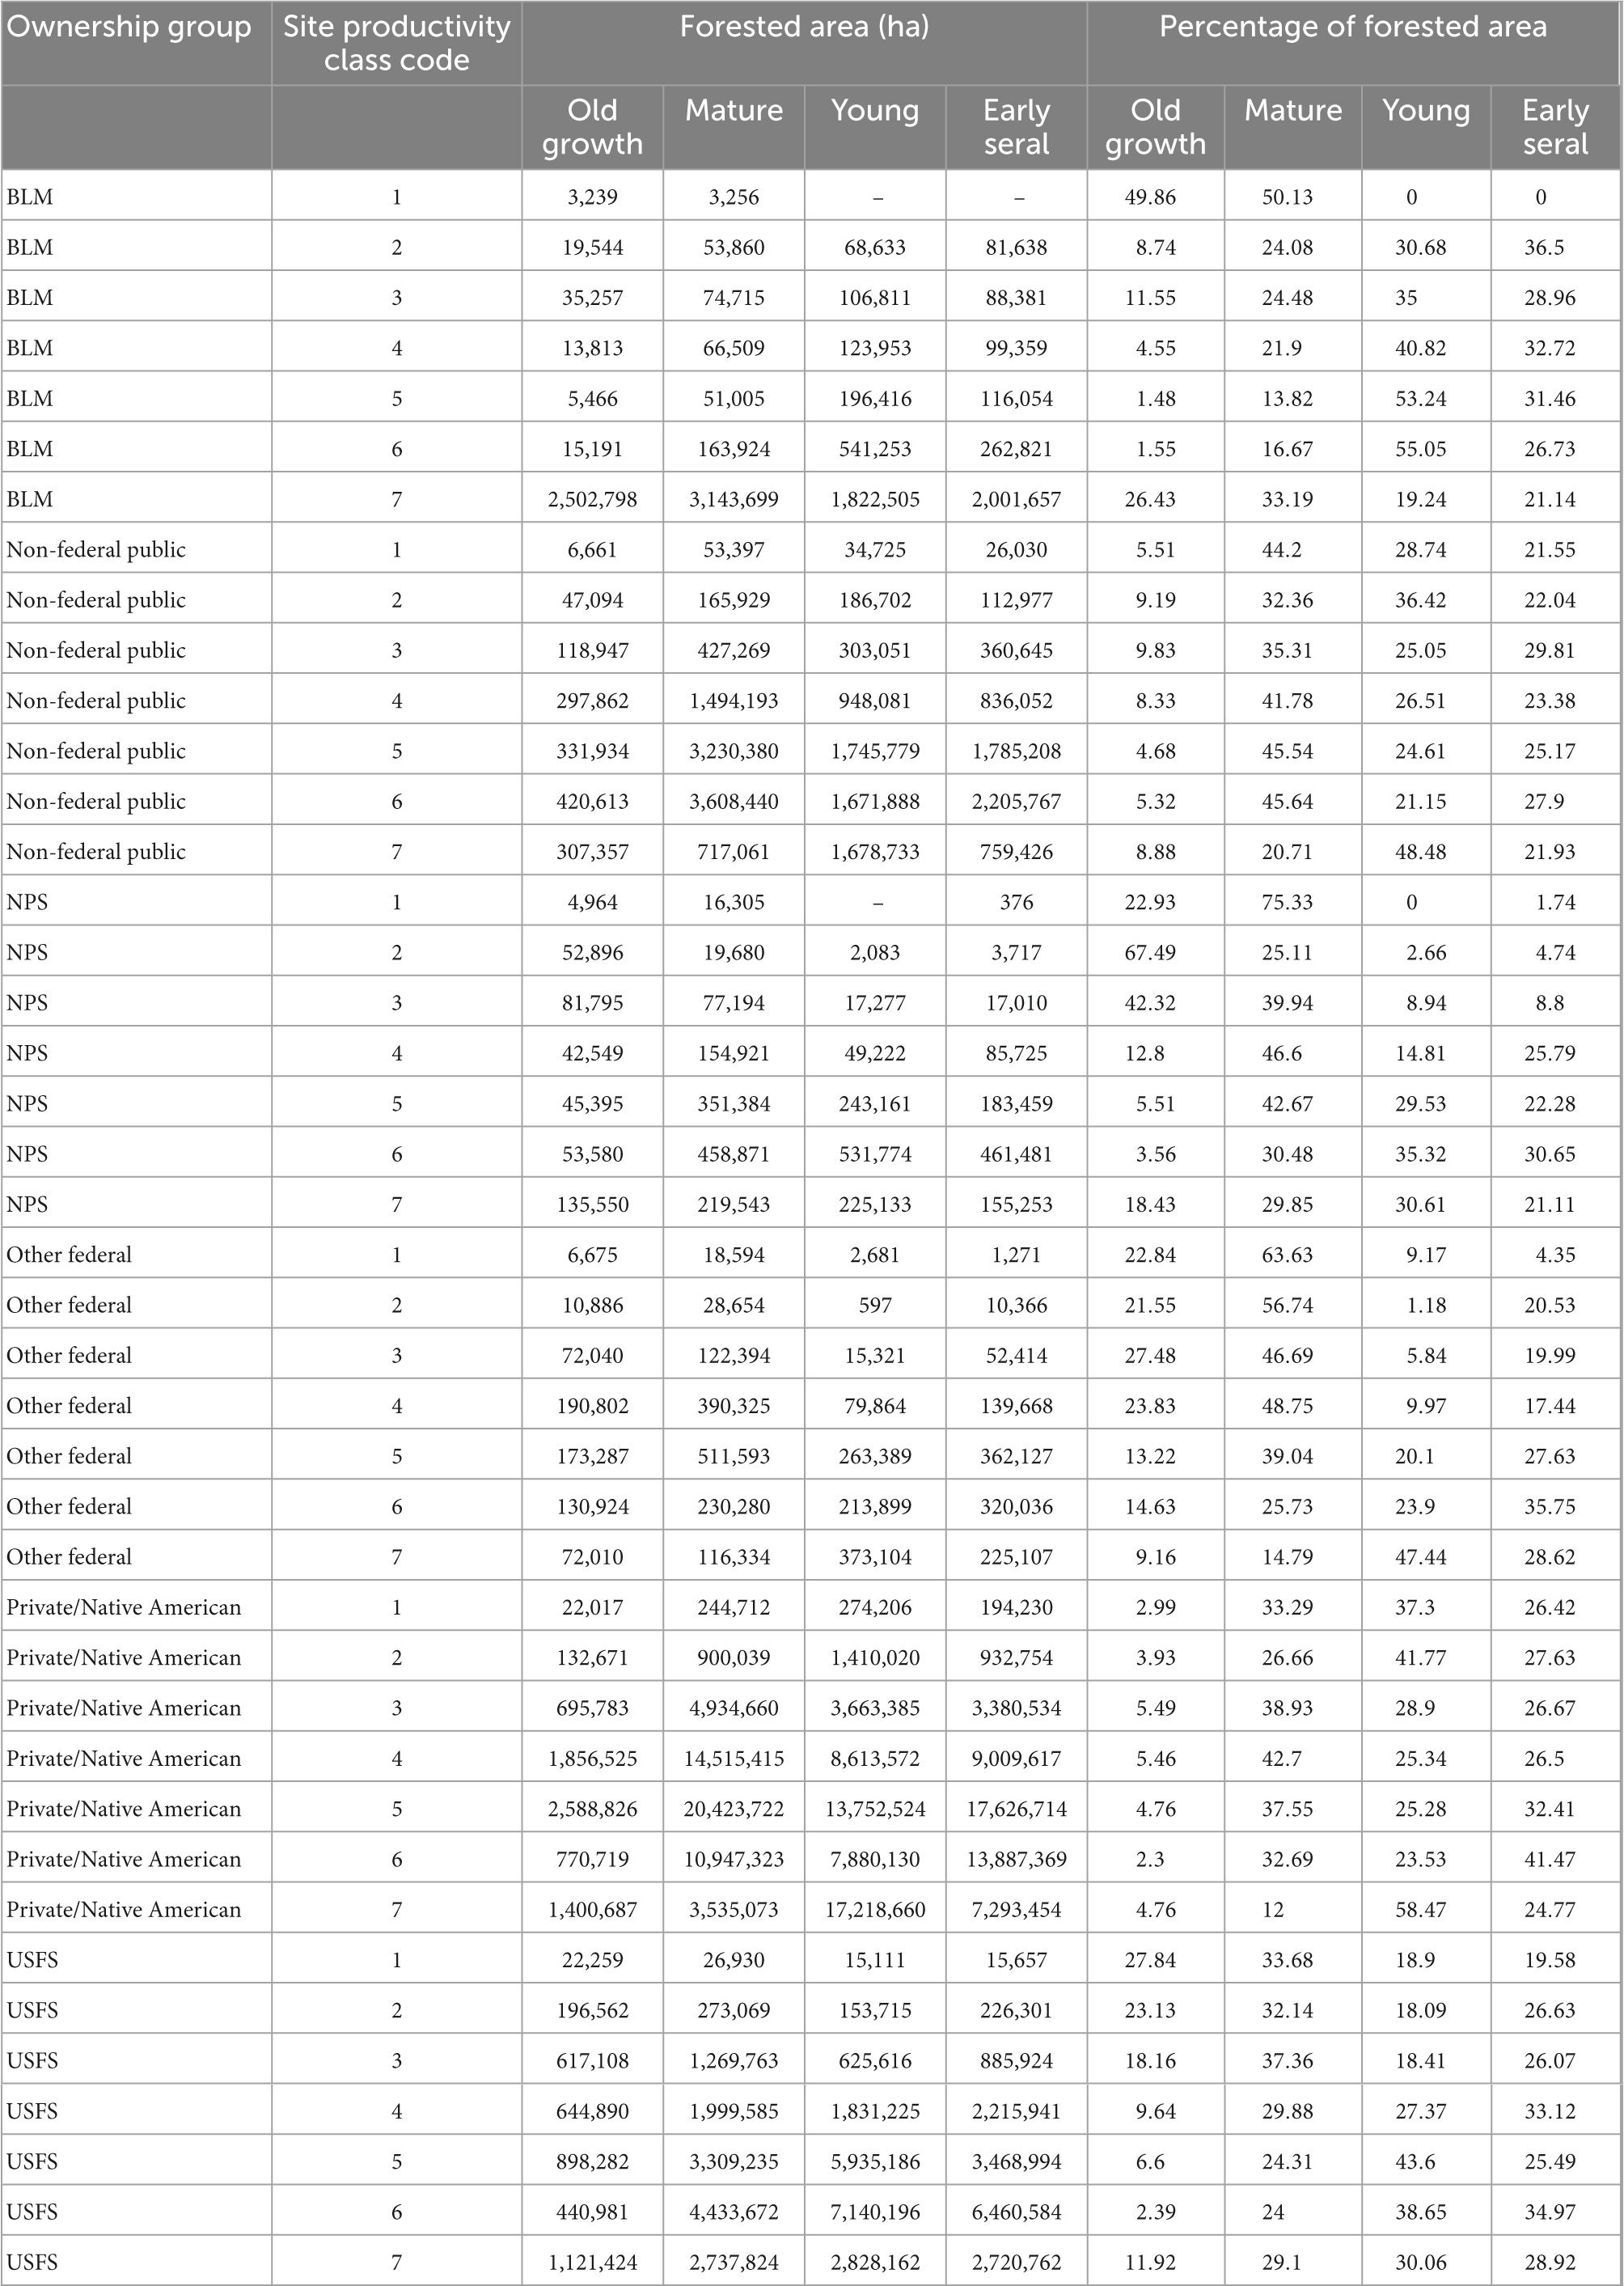
Table 5. Forested area and proportion of total forested area summarized by stand development phase, site productivity class code, and ownership group.
The map of forest stand development phase reveals spatial patterns in forest maturity across the contiguous United States (Figure 8). Even at the national extent, significant old-growth forests appear at landscape scales, particularly the Olympic Peninsula and northern Cascades of Washington state and pinyon/juniper forests of the “Four Corners” region of the desert southwest. Notable hotspots of mature forests appear throughout the eastern United States, including southeastern Missouri and northern Arkansas, along the Tennessee-North Carolina border in the Great Smoky Mountains, West Virginia, northern portions of Pennsylvania and New York, and much of New England. In the western United States, mature forests appear more concentrated in the mountainous terrain, including the Sierra Nevada of California and the Mogollon Rim of Arizona and New Mexico. Mature and old-growth forests also appear throughout eastern Nevada and the southern Pine Belt from the East Texas Piney Woods across the Gulf Coast to the Carolina Piedmont.
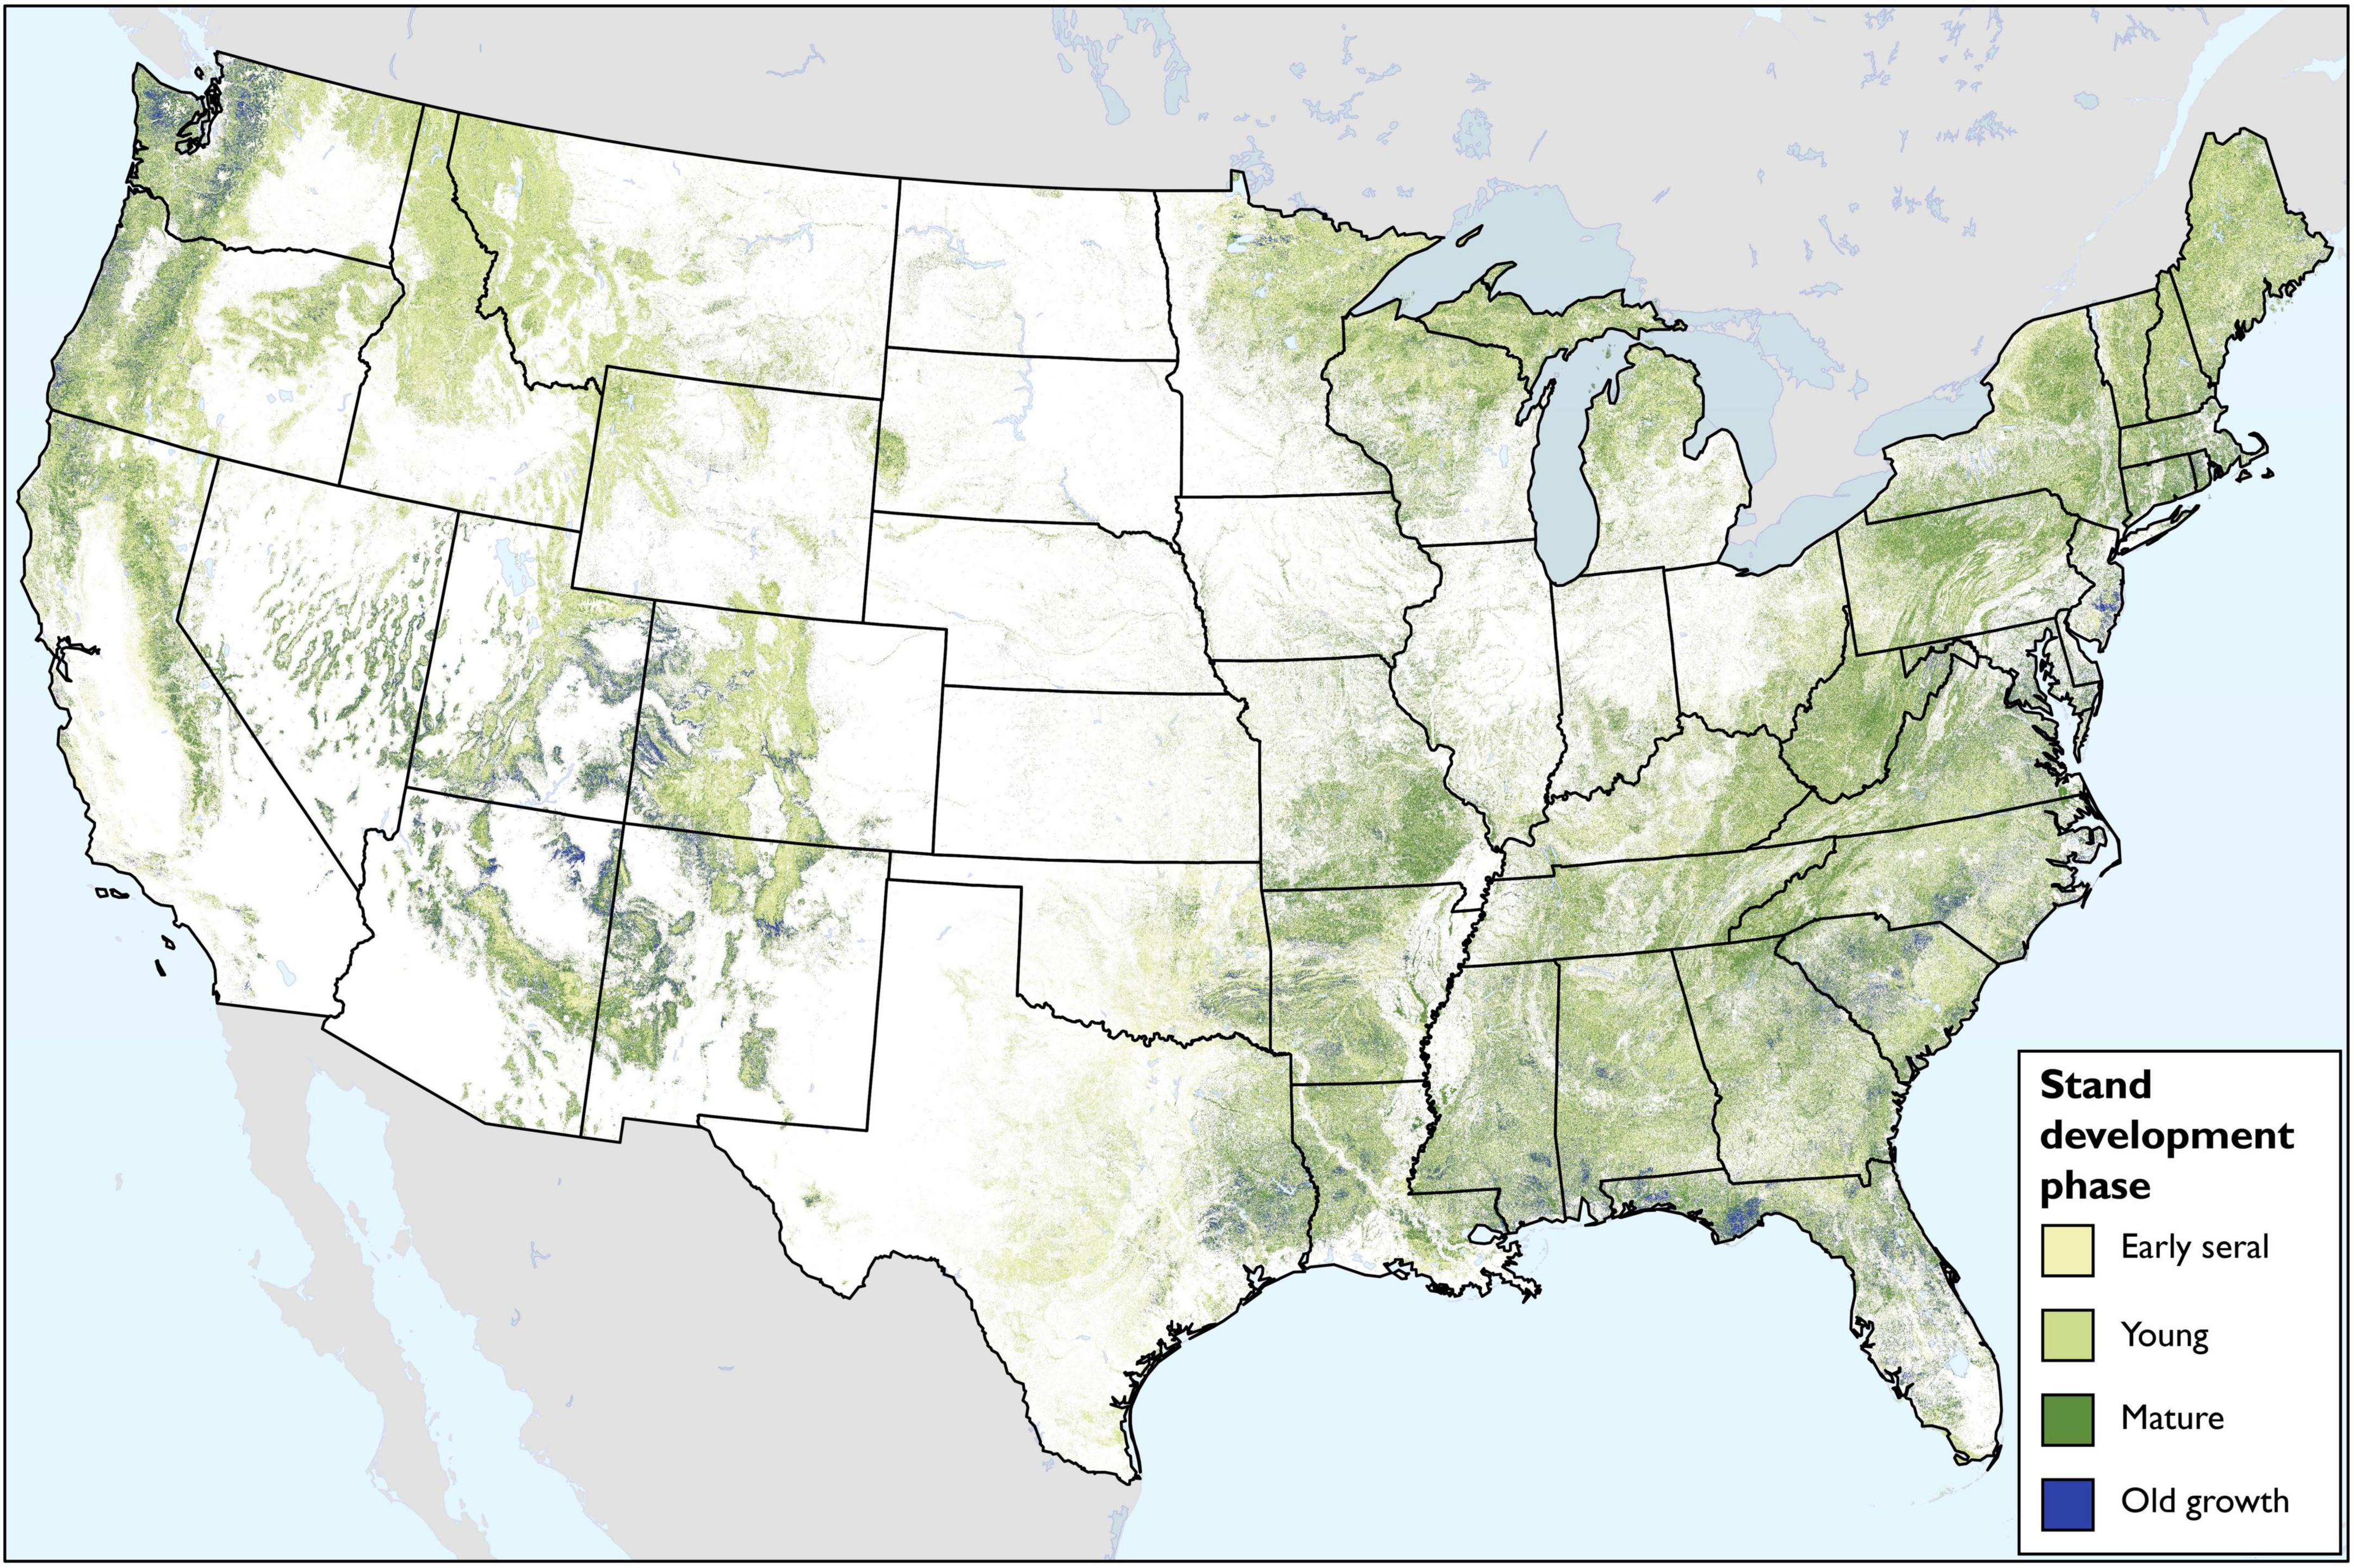
Figure 8. Map of stand development phases across the contiguous United States.
Discussion
Interest in developing public forest management policies that conserve and promote the recruitment of mature and old-growth forests has been hampered by the lack of a unifying framework to classify, inventory and map their extent. By integrating concepts of forest stand development with standard modeling frameworks used to quantify patterns of forest carbon accumulation over time, we provide a first approximation of the distribution of mature and old-growth forests in the contiguous United States based on a functional definition of mature and old-growth forest. Like previous studies of forest carbon accumulation conducted across large spatial extents (e.g., Hudiberg et al., 2009; Zhu et al., 2018; Repo et al., 2021), our analysis relies upon high-quality national forest inventory data representative of forested conditions throughout the United States with different land use histories and across site productivity gradients. Importantly, our estimates of the mature and old-growth forest estate, and its distribution across ownership groups and conservation reserves, make use of sample design-based estimators with known properties (Bechtold and Patterson, 2005). Nonetheless, we demonstrate how our plot-based estimates of mature and old-growth forest area could be spatially represented at the national extent and at a spatial resolution consistent with other geospatial products that inform landscape-scale management and decision-making (e.g., LANDFIRE,1 National Land Cover Database2). Recognizing myriad limitations and assumptions, we believe our modeling framework contributes to the scientific understanding of mature and old-growth forests throughout the United States.
Comprising 6.3% of the forests we examined, our first approximation indicates that old-growth forest is rare, as has been suggested by others for decades (Greeley, 1925; Gordon et al., 2008; Barton and Keeton, 2018). This total includes the fast-growing Loblolly/shortleaf pine and Longleaf/slash pine forest type-groups that reach the age at onset of old growth in less than 100 years and may, with time, succeed to other forest types. Classifying these types as old growth may be surprising to those accustomed to thinking of old growth as “ancient,” but the dynamics are consistent with observations from these forests. The ages of onset of old growth for these two type-groups are similar to the 35 years that Christensen and Peet (1981) found for achievement of maximum volume in loblolly pine but are considerably less than the 79–112 years reported by Gaines et al. (1997) as the minimum age of old growth in these types. Excluding these two pine groups, other eastern type-groups averaged just 2.3% old growth. The most abundant forest type-group in the U.S., Oak/hickory, is less than one percent old growth. The same pattern does not hold for mature forest, where most forest type-groups have a quarter or more of their area in the mature stage, and overall, mature forest constitutes 32.4% of the forest estate, representing considerable opportunity for recruitment of future old growth. The 38.7% of the forest estate in mature and old-growth stages, combined, is remarkably close to the 35.9% estimated by DellaSala et al. (2022), despite the use of very different classification and mapping methods.
One possible concern about our approach is that by fitting asymptotic growth curves and defining old growth as the age at which forest carbon accumulation saturates, our method may result in biased age-based transitions in forest development in forest type-groups for which the age class distribution of extant forest has been severely truncated by past logging and land clearing. To test whether this may have happened here, we compared our ages at onset of old growth with previous efforts to identify minimum ages for old growth. In the late 1980s and early 1990s, spurred by the Chief of the Forest Service’s position statement on old-growth values (U.S. Department of Agriculture, Forest Service, 1989), researchers and managers in every Forest Service region developed minimum criteria for the identification of old growth, including stand age. Direct comparisons are difficult because the forest type classification systems do not match perfectly with the FIA forest type-groups used here, and differences in how stand age and site quality are defined likely further confound their correspondence. After attempting to crosswalk the systems and compare their minimum ages with our ages of onset of old growth (See Supplementary Figure 3-1), we found the ranges to largely overlap within forest type-groups with a few exceptions. Our estimates of the age of onset of old growth were considerably higher for Aspen/birch, the highly diverse Other western hardwoods group, and the Western oak group, which includes a variety of live and deciduous oaks as well as gray pine (Pinus sabiniana). In contrast, our estimates for White/red/jack pine, Tanoak/laurel, and the two southern pine groups were considerably lower.
Comparison of age at maturity is even more challenging, as no standard definition of maturity exists, except in the Pacific Northwest, where the Northwest Forest Plan has utilized 80 years as a threshold for all forest types (U.S. Department of Agriculture, Forest Service, and U.S. Department of the Interior, Bureau of Land Management, 1994). Very recently, Kerr (2021) assembled a variety of estimates of the culmination of mean annual increment of timber volume from around the country, which he believes can serve as a useful estimate of maturity. Though our estimated ages account for total forest carbon and not timber volume, estimates align well (see Supplementary Figure 3–2); our estimates of age at maturity are slightly biased upward, though there is clearly a correlation between what we estimate as the age of onset of maturity with respect to total forest carbon and traditional estimates of biological maturity. Our bias toward older ages of onset at maturity may reflect how biomass accumulation in the standing dead and coarse woody debris pools continues later into stand development beyond the culmination of mean annual increment of sawlog volume, such as in high biomass forests where the density of coarse woody debris can continue to increase for 450 years (Spies et al., 1988). These comparisons, though imperfect, appear to dispel concern that the ages we identified for onset of mature and old-growth conditions are affected by censored stand age in the FIA data.
While foresters have long understood the importance of site quality to the rate of forest development (Assmann, 1970), site quality has not factored much into historical classifications of late successional forests (but see Stewart, 1992; Beardsley et al., 1999). Oliver and Larson (1996) note that the effect of site quality can differentially affect the transition timing of old-growth forest development depending on species’ intolerance or adaptation to site quality. Given that our approach is based upon forest type-group classifications that have a relatively coarse taxonomic resolution and can have wide geographic distributions (e.g., Oak/Hickory), accounting for differences in site quality may be especially warranted. Our modeled forest carbon accumulation curves largely adhered to the patterns predicted in Figure 2 for sites of different productivity. In all but two forest type-groups (i.e., Maple/beech/birch and Oak/gum/cypress) for which we modeled separate site productivity curves, the asymptotic forest carbon density of the highest site productivity class was greater than that of the lowest class. Similarly, age at onset of old growth increased with decreasing site quality for all forest type-groups except Loblolly/shortleaf pine and Maple/beech/birch. The relative consistency of these patterns among forest type-groups provides preliminary evidence that site quality should factor into the estimation of age at onset of mature and old-growth forest conditions.
Even so, we found that limitations to the data can make it difficult to account for site quality. For example, despite the large number of plots in the Aspen/birch forest type-group, fitting multiple models resulted in ages of old-growth onset far beyond the age range of the data (Supplementary Figure 4). Whether this reflects the real trajectory of Aspen/birch, a peculiarity of extremely short-lived or clonal species, the influence of outliers, censored stand ages across site productivity classes, or the consequences of imposing a model form to which the data do not adhere remains unknown. One effort to model total forest carbon accumulation with stand age in Aspen/birch stands in northern Minnesota had success fitting a quadratic function (Bradford and Kastendick, 2010). We chose to conservatively aggregate plots across site quality classes out of an abundance of caution to avoid extrapolating beyond the data and overextending the influence of site quality on the rate and carrying capacity of forest carbon (see Supplementary Figures 4-1, 4-2). Lastly, it remains unclear whether truncated stand ages in higher site productivity classes due to past management practices influence our model results.
Our development of a functional definition of mature and old-growth forests based on forest carbon dynamics was motivated, in part, by a dearth of information describing various stand-level characteristics of mature forests throughout the country. Defining mature forests as those with stand age beyond peak average carbon increment can provide an objective starting point in a subsequent ex post evaluation of their structural, compositional, and demographic characteristics. By screening FIA plots that meet our classification criteria for maturity based on forest type-group, site productivity class and stand age, it may be possible to detect unique structural elements that distinguish them from young and old-growth forests of the same type using tree-level data collected by FIA (e.g., diameter class distributions, diversity of height classes, density of snags). In some forest types, the understory vegetation community structure and composition may differ significantly between stand development phases (Scheller and Mladenoff, 2002), especially at the transition between mature and old growth (D’Amato et al., 2009). Fortunately, FIA collects detailed understory vegetation data on graminoids, forbs, and shrubs in each of the four subplots, and saplings and seedlings in the microplots (Bechtold and Patterson, 2005). In addition, mortality dynamics of certain tree species in particular size classes may further help discriminate between stand development phases. While information on the spatial aspect of mortality (i.e., canopy gap formation) may yield additional insight into stages of forest development (Das et al., 2011; Aakala et al., 2012; Larson et al., 2015), it is unlikely that the FIA plot footprints are sufficiently large to detect these patterns. Regardless, such demographic analyses within stand development phases and among forest types may prove especially useful in translating age-based thresholds of maturity into population-level processes (Hayward, 1991). As the collection of permanent FIA plots that have been remeasured is continually increasing over time, scientists are afforded a unique opportunity to monitor such population processes over large spatial extents using rich, longitudinal data (Stanke et al., 2021).
The modified Chapman-Richards function used to model forest carbon accumulation was selected for its ability to emulate growth in developing stands. The logic holds well for forest types that follow the typical trajectory of a forest stand after major disturbance (e.g., Douglas-fir, Fir/spruce/mountain hemlock, Lodgepole pine), but it may not hold as well for forest types that develop through chronic, non-catastrophic disturbances, such as ponderosa pine or longleaf pine, where biomass accumulation is affected by exogenous forces. Under their historical disturbance regimes, such forests sustain an old-growth structure over time through the interaction of fine-grained mortality and recruitment events and low-severity fire (Morgan, 1994; Van Lear et al., 2005). Despite these differences, there is nothing about the Chapman-Richards function that requires older forests to adhere to an even-aged structure. Stands that develop following catastrophic disturbance can develop uneven-aged structure (e.g. Douglas-fir/hemlock or Engelmann spruce/subalpine fir forest), even as they add biomass with stand age. Nevertheless, there are alternative functional forms akin to the sigmoidal shape of Chapman-Richards (e.g., Weibull, logistic, Gompertz) that warrant future evaluation (Salas-Eljatib et al., 2021). For example, a more flexible function could model the post-disturbance drop in total forest carbon that the Chapman-Richards function cannot. Ensemble models that incorporate predictions from multiple functional forms may help to reduce model variance (Burnham and Anderson, 2002). Recent efforts have assumed that the relationship between forest carbon accumulation and stand age is dependent upon climatic factors that can be accounted for via a hierarchical Bayesian framework and nested random effects (sensu Zhu et al., 2018). Such alternative modeling frameworks should be considered alongside alternative functional forms in future work, in addition to understanding the uncertainty surrounding our ages at onset of old-growth due to sample error, the thresholds assigned to different phases of stand development, and their potential interactions.
Forest Inventory and Analysis forest type-groups served well to stratify the inventory data into a manageable number of taxonomic strata where differences in forest carbon accumulation due to environmental (e.g., climate, soils, and disturbance regimes) and biological (e.g., competitive interactions, life history, pathogens) mechanisms can be accounted for. As evidenced by the unique rates and ultimate trajectories of forest carbon accumulation among the forest type-groups (Figure 3), this logical stratification appears supported by the data. Nevertheless, the diversity of forest types within some forest type-groups may contribute to model uncertainty. Presumably, segregating the data by site productivity class helped ensure that models were developed for like forest types (e.g., Rocky Mountain Douglas-fir is likely to occur on lower sites than western Cascades Douglas-fir). Still, the diversity within some forest type-groups may be so great as to cast doubt on the appropriateness of some models. For example, Oak/hickory, the most common forest type-group, contains 19 different forest types that vary widely in their growth rates, from bur oak (Quercus macrocarpa) to yellow-poplar (Liriodendron tulipifera). One logical advance from our methods would be to segregate forest types within forest type-groups and, assuming a sufficient sample of plots, fit new models. These nested classifications of forest type can be developed within a hierarchical framework at ecologically meaningful scales (e.g., ecological province, section and subsection) and guided by regional, expert opinion. So long as there are sufficient inventory data across a range of stand ages within each potential forest type classification, a national accounting of mature and old-growth forest like we have presented here is feasible. Alternative representations of constraints to site productivity (e.g., climatic water balance) may help to better understand mechanistic relationships between tree growth, mortality, and stand development through time.
Merging our FIA plot-based classified stages of stand development with TreeMap produced a higher resolution spatial representation of forest maturity compared to areal sampling units used by FIA (e.g., county). Conceptually, such maps could be used to support regional or landscape-level forest management in the context of mature and old-growth retention, development and monitoring. Our map of the mature and old-growth forest estate highlights locations throughout the nation where concentrations of old-growth and mature forest may be high (Figure 8). In some places, such as the Olympic Peninsula and northern Cascade mountains in Washington State, the imputed map affirms well-understood spatial distributions of remaining late-successional forests (Davis et al., 2015). In other regions where old-growth forests may be less heralded, such as the Ozark Mountains of Arkansas, our map suggests old-growth forest characteristics may be present. Similarly, while old growth may be rare throughout the East, our map suggests significant concentrations of mature forest in places like the Allegheny Mountains of West Virginia, the Allegheny Plateau of Pennsylvania, and the Adirondacks, indicating significant potential for old growth recruitment across large geographies. Currently, TreeMap is the only publicly available FIA plot imputation grid at 30 m resolution. Model accuracy of TreeMap was assessed in terms of tree cover, tree height, and existing vegetation cover as defined by LANDFIRE (Riley et al., 2021), so it remains unknown how well the model predicts the FIA attributes necessary to map our classification (i.e., forest type-group, site productivity class and stand age). We are aware that plot imputation methods are evolving rapidly (Barry T. Wilson, pers. comm.), and we encourage use of new and improved methods as they develop. Even so, ongoing work remains to understand uncertainty in distance-based imputation approaches across scales and forest types (Bell et al., 2022). Ultimately, any inventory of late-successional forest should be subjected to a thorough field-based accuracy assessment. Until then, we view our map as suggestive rather than authoritative. The emphasis should be on the conceptual advancement that integrates FIA plot-based estimates of forest developmental stage with a national plot imputation grid, rather than on specific locations.
In conclusion, we have shown that by applying a functional classification of mature and old-growth forest based on forest carbon dynamics, fitting forest carbon accumulation models to inventory data and deriving ecologically significant transition points, we can identify the age at onset of young, mature, and old-growth conditions for most forest type-groups. Insufficient inventory data for some forest type-groups prevented their inclusion, and a complete evaluation of how site productivity affects stand development within forest type-groups remains for future work. Importantly, by taking advantage of sample design-based estimators developed by FIA, we can calculate the area of each modeled stand development phase without the need of a mapped product. Given the ongoing development of techniques to improve upon the mapping of inventory-based forest attributes at large spatial extents, we caution against using these products to inform place-based decision making in the context of mature and old-growth forest management. We demonstrate how rich data summaries can be generated using auxiliary information in the FIA database, such as ownership and reserve status. We have estimated that old-growth forest represents approximately 6.3% of the nation’s forest estate, with 32.4% in the mature phase, and that late-successional forest is unevenly distributed with respect to forest type, ownership, site quality, and geography. Our framework of classifying, inventorying, and mapping mature and old-growth forests acknowledges the dynamic nature of forest development and contextualizes mature and old-growth forests within that dynamic process. Old forest isn’t a static object to freeze in time but a process to maintain where currently present and to restore where degraded. While protection of rare old-growth forest appears to be warranted, even relatively abundant mature forest must be managed in a way that assures the restoration and maintenance of future old growth for the climate, biodiversity, and esthetic benefits it provides.
Data availability statement
Publicly available datasets were analyzed in this study. This data can be found here: https://apps.fs.usda.gov/fia/datamart/datamart.html.
Author contributions
KB, GHA, and RTB conceived of this study and edited and finalized the manuscript. KB performed all the analyses. KB and GHA wrote the manuscript. All authors contributed to the article and approved the submitted version.
Conflict of interest
The authors declare that the research was conducted in the absence of any commercial or financial relationships that could be construed as a potential conflict of interest.
Publisher’s note
All claims expressed in this article are solely those of the authors and do not necessarily represent those of their affiliated organizations, or those of the publisher, the editors and the reviewers. Any product that may be evaluated in this article, or claim that may be made by its manufacturer, is not guaranteed or endorsed by the publisher.
Supplementary material
The Supplementary Material for this article can be found online at: https://www.frontiersin.org/articles/10.3389/ffgc.2022.1070372/full#supplementary-material
Footnotes
References
Aakala, T., Fraver, S., Palik, B. J., and D’Amato, A. W. (2012). Spatially random mortality in old-growth red pine forests of northern Minnesota. Can. J. For. Res. 42, 899–907. doi: 10.1139/x2012-044
Aplet, G. H., Smith, F. W., and Laven, R. D. (1989). Stemwood biomass and production during spruce-fir stand development. J. Ecol. 77, 70–77. doi: 10.2307/2260917
Assmann, E. (1970). Principles of forest yield study: Studies in organic production, structure, increment and yield of forest stands. Oxford: Pergamon Press. doi: 10.1016/B978-0-08-006658-5.50004-2
Barton, A. M., and Keeton, W. S. (eds) (2018). Ecology and recovery of eastern old-growth forests. Washington, DC: Island Press. doi: 10.5822/978-1-61091-891-6
Beardsley, D., Bolsinger, C., and Warbington, R. (1999). Old-growth forests in the Sierra Nevada by type in 1945 and 1993 and ownership in 199 (sic). USDA Forest Service Pacific Northwest Research Station Research Paper PNW-RP-516. Portland, OR: USDA Forest Service Region. doi: 10.2737/PNW-RP-516
Bechtold, W. A., and Patterson, P. L. (2005). The enhanced forest inventory and analysis program—National sampling design and estimation procedures. General Technical Report SRS-80. Asheville, NC: US Department of Agriculture Forest Service, Southern Research Station.
Bell, D. M., Wilson, B. T., Werstak, C. E. Jr., Oswalt, C. M., and Perry, C. H. (2022). Examining k-nearest neighbor small area estimation across scales using national forest inventory data. Front. For. Glob. Change 5:763422. doi: 10.3389/ffgc.2022.763422
Biden, J. R. (2022). Executive order strengthening the Nation’s forests, communities, and local economies. Washington, DC: The White House.
Binkley, D., Sisk, T., Chambers, C., Springer, J., and Block, W. (2007). The role of old-growth forests in frequent-fire landscapes. Ecol. Soc. 12:18. doi: 10.5751/ES-02170-120218
Binkley, D., Stape, J. L., Ryan, M. G., Barnard, H. R., and Fownes, J. (2002). Age-related decline in forest ecosystem growth: An individual tree, stand-structure hypothesis. Ecosystems 5, 58–67. doi: 10.1007/s10021-001-0055-7
Bolsinger, C. L., and Waddell, K. L. (1993). Area of old-growth forests in California, Oregon, and Washington. Resour. Bull. PNW-RB-197. Portland, OR: U.S. Department of Agriculture, Forest Service. doi: 10.2737/PNW-RB-197
Bormann, F. H., and Likens, G. E. (1979). Pattern and process in a forested ecosystem. New York, NY: Springer-Verlag. doi: 10.1007/978-1-4612-6232-9
Bradford, J. B., and Kastendick, D. N. (2010). Age-related patterns of forest complexity and carbon storage in pine and aspen/birch ecosystems of northern Minnesota, USA. Can. J. For. Res. 40, 401–409. doi: 10.1139/X10-002
Bukoski, J. J., Cook-Patton, S. C., Melikov, C., Ban, H., Chen, J. L., Goldman, E. D., et al. (2022). Rates and drivers of aboveground carbon accumulation in global monoculture plantation forests. Nat. Commun. 3:4206. doi: 10.1038/s41467-022-31380-7
Burnham, K. P., and Anderson, D. R. (2002). Model selection and multimodel inference: A practical information-theoretic approach. New York, NY: Springer.
Capp, J., Van Zee, B., Alaback, P., Boughton, J., Copenhagen, M., and Martin, J. (1992). Ecological definitions for old-growth forest types in Southeast Alaska. USDA Forest Service Alaska Region R10-TP-28. Portland, OR: USDA Forest Service Region.
Christensen, N. L., and Peet, R. K. (1981). “Secondary forest succession on the North Carolina Piedmont,” in Forest succession: Concepts and application, eds D. C. West, H. H. Shugart, and D. B. Botkin (New York, NY: Springer), 230–245. doi: 10.1007/978-1-4612-5950-3_15
Clough, B. J., Russell, M. B., Domke, G. M., and Woodall, C. W. (2016). Quantifying allometric model uncertainty for plot-level live tree biomass stocks with a data-driven, hierarchical framework. For. Ecol. Manage. 372, 175–188. doi: 10.1016/j.foreco.2016.04.001
Costanza, J. K., Faber-Langendoen, D., Coulston, J. W., and Wear, D. N. (2018). Classifying forest inventory data into species-based forest community types at broad extents: Exploring tradeoffs among supervised and unsupervised approaches. For. Ecosyst. 5:8. doi: 10.1186/s40663-017-0123-x
D’Amato, A. W., Orwig, D. A., and Foster, D. R. (2009). Understory vegetation in old-growth and second-growth Tsuga canadensis forests in Western Massachusetts. For. Ecol. Manage. 257, 1043–1052. doi: 10.1016/j.foreco.2008.11.003
Daniel, T. W., Helms, J. A., and Baker, F. S. (1979). Principles of silviculture. New York, NY: McGraw-Hill.
Das, A., Battles, J., Stephenson, N. L., and van Mantgem, P. J. (2011). The contribution of competition to tree mortality in old-growth coniferous forests. For. Ecol. Manage. 261, 1203–1213. doi: 10.1016/j.foreco.2010.12.035
Davis, R. J., Ohmann, J. L., Kennedy, R. E., Cohen, W. B., Gregory, M. J., Yang, Z., et al. (2015). Northwest Forest Plan–the first 20 years (1994-2013): Status and trends of late-successional and old-growth forests. Gen.Tech. Rep. PNW-GTR-911. (Portland, OR: U.S. Department of Agriculture, Forest Service), 112. doi: 10.2737/PNW-GTR-911
DellaSala, D., Mackey, B. G., Norman, P., Campbell, C., Comer, P., Kormos, C., et al. (2022). Mature and old-growth forests contribute to large-scale conservation targets in the conterminous USA. Front. For. Glob. Change 28:979528. doi: 10.3389/ffgc.2022.979528
Fekedulegn, D., Mac Siurtain, M. P., and Colbert, J. J. (1999). Parameter estimation of nonlinear growth models in forestry. Silva Fennica 33:653. doi: 10.14214/sf.653
Forest Ecosystem Management Assessment Team [FEMAT] (1993). Forest ecosystem management: An ecological, economic, and social assessment. Washington, DC: US Government Printing Office.
Franklin, J. F., Johnson, K. N., and Johnson, D. L. (2018). Ecological forest management. Long Grove, IL: Waveland Press.
Franklin, J. F., and Spies, T. A. (1991). “Ecological definitions of old-growth Douglas-fir forests,” in Wildlife and vegetation of unmanaged Douglas-fir forests. General Technical Report PNW-285, eds L. F. Ruggiero, K. B. Aubry, A. B. Carey, and M. H. Huff (Portland, OR: U.S. Department of Agriculture, Forest Service), 61–69.
Frelich, L. E., and Reich, P. B. (2003). Perspectives on development of definitions and values related to old-growth forests. Environ. Rev. 11, S9–S22. doi: 10.1139/a03-011
Gaines, G., Arndt, P., Croy, S., Devall, M., Greenberg, C., Hooks, S., et al. (1997). Guidance for conserving and restoring old-growth forest communities on national forests in the Southern Region. (Atlanta, GA: U.S. Department of Agriculture, Forest Service), 121.
Gordon, J. M., Hagan, J. A., Langston, N., Mitchell, R. J., Spies, T. A., Covington, W. W., et al. (2008). Beyond old growth: Older forests in a changing world, a synthesis of five regional workshops. Washington, DC: National Commission on Science for Sustainable Forestry.
Gower, S. T., McMurtie, R. E., and Murty, D. (1996). Aboveground net primary production decline with stand age: Potential causes. TREE 11, 378–382. doi: 10.1016/0169-5347(96)10042-2
Gray, A. N., Whittier, T. R., and Harmon, M. E. (2016). Carbon stocks and accumulation rates in Pacific Northwest forests: Role of stand age, plant community, and productivity. Ecosphere 7:e01224. doi: 10.1002/ecs2.1224
Greeley, W. B. (1925). The relation of geography to timber supply. Econ. Geogr. 1, 1–14. doi: 10.2307/140095
Green, P., Joy, J., Sirucek, D., Hann, W., Zack, A., and Naumann, B. (1992). Old-growth forest types of the Northern Region. (Missoula, MT: U.S. Department of Agriculture, Forest Service), 58.
Gunderson, P., Thybring, E. E., Nord-Larson, T., Vesterdal, L., Nadelhofer, K. J., and Johannsen, V. K. (2021). Old-growth forest carbon sinks overestimated. Nature 591, E21–E23. doi: 10.1038/s41586-021-03266-z
Hayward, G. D. (1991). Using population biology to define old-growth forests. Wildl. Soc. Bull. 19, 111–116.
Heath, L. S. (2013). “Using FIA data to inform United States forest carbon national-level accounting needs 1990-2010,” in Long-term silvicultural and ecological studies: Results for science and management, Vol. 2, eds A. E. Camp, L. C. Irland, and C. J. W. Carroll (New Haven, CT: Yale University School of Forestry and Environmental Studies), 149–160.
Hedwall, S. J., and Mathiason, R. L. (2006). Wildlife use of Douglas-fir dwarf mistletoe witches’ brooms in the Southwest. West. N. Am. Nat. 66, 450–455. doi: 10.3398/1527-0904(2006)66[450:WUODDM]2.0.CO;2
Hilbert, J., and Wiensczyk, A. (2007). Old-growth definitions and management: A literature review. BC J. Ecosyst. Manage. 8, 15–31. doi: 10.22230/jem.2007v8n1a360
Hudiberg, T. L., Law, B., Turner, D. P., Campbell, J., Donato, D., and Duane, M. (2009). Carbon dynamics of Oregon and Northern California forests and potential land-based carbon storage. Ecol. Appl. 19, 163–180. doi: 10.1890/07-2006.1
Hunter, M. L. Jr., and Schmieglow, F. K. (1990). Wildlife, forests, and forestry: Principles for managing forests for biodiversity, 2nd Edn. Boston, MA: Prentice Hall.
Hunter, M. L. Jr., and White, A. S. (1997). Ecological threshold and the definition of old-growth forest stands. Nat. Areas J. 17, 292–296.
Janisch, J. E., and Harmon, M. E. (2002). Successional changes in live and dead wood carbon stores: Implications for net ecosystem productivity. Tree Physiol. 22, 77–89. doi: 10.1093/treephys/22.2-3.77
Johnson, D. W., and Curtis, P. S. (2001). Effects of forest management on soil C and N storage: Meta analysis. For. Ecol. Manage. 140, 227–238. doi: 10.1016/S0378-1127(00)00282-6
Johnson, K. N., Franklin, J. F., Thomas, J. W., and Gordon, J., and The Scientific Panel on Late-Successional Forest Ecosystems (1991). Alternatives for management of late-successional forest ecosystems of the Pacific Northwest. A Report to the U.S. House of Representatives, Committee on Agriculture, Subcommittee on Forests, Family Farms and Energy, and Committee on Merchant Marine and Fisheries, Subcommittee on Fisheries and Wildlife, Conservation, and the Environment. Corvallis, OR: Oregon State University.
Johnston, J. D., Greenler, S. M., Reilly, M. J., Webb, M. R., Merschel, A. G., Johnson, K. N., et al. (2021). Conservation of dry forest old growth in eastern Oregon. J. Forestry 119, 647–659. doi: 10.1093/jofore/fvab016
Kaufmann, M. R., Binkley, D., Fulé, P. Z., Johnson, M., Stephens, S. L., and Swetnam, T. W. (2007). Defining old growth for fire-adapted forests of the western United States. Ecol. Soc. 12:15. doi: 10.5751/ES-02169-120215
Keeton, W. S. (2018). “Source or sink? Carbon dynamics in eastern old-growth forests and their role in climate change mitigation,” in Ecology and recovery of eastern old-growth forests, eds A. M. Barton and W. S. Keeton (Washington, DC: Island Press), 267–288. doi: 10.5822/978-1-61091-891-6_14
Kerr, A. (2021). Defining the minimum age of a mature forest in either legislation or regulation. Ashland, OR: The Larch Company.
Kira, T., and Shidei, T. (1967). Primary production and turnover of organic matter in different forest ecosystems of the western Pacific. Jpn. J. Ecol. 17, 70–87.
Larson, A. J., Lutz, J. A., Donato, D. C., Freund, J. A., Swanson, M. E., HilleRisLambers, J., et al. (2015). Spatial aspects of tree mortality strongly differ between young and old-growth forests. Ecology 96, 2855–2861. doi: 10.1890/15-0628.1
Larson, A. J., Lutz, J. A., Gersonde, R. F., Franklin, J. F., and Hietpas, F. F. (2008). Potential site productivity influences the rate of forest structural development. Ecol. Appl. 18, 899–910. doi: 10.1890/07-1191.1
Luyssaert, S., Detlef-Schulze, A., Knohl, A., Law, B. E., Ciais, P., and Grace, J. (2021). Reply to: Old-growth forest carbon sinks overestimated. Nature 591, E24–E25. doi: 10.1038/s41586-021-03267-y
Luyssaert, S., Detlef-Schulze, E., Börner, A., Knohl, A., Hessenmöller, D., Law, B. E., et al. (2008). Old-growth forests as global carbon sinks. Nature 455, 213–215. doi: 10.1038/nature07276
Mehl, M. S. (1992). “Old-growth descriptions for the major forest cover types in the rocky mountain region,” in Old growth forests in the southwest and rocky mountain regions. General Technical Report RM-213, eds M. R. Kaufmann, W. H. Moir, and R. L. Barrett (Fort Collins, CO: U.S. Department of Agriculture, Forest Service), 106–120.
Moeur, M., Ohmann, J. L., Kennedy, R. E., Cohen, W. B., Gregory, M. J., Yang, Z., et al. (2011). Northwest Forest Plan–the first 15 years (1994–2008): Status and trends of late-successional and old-growth forests. Gen. Tech. Rep. PNW-GTR-853. (Portland, OR: U.S. Department of Agriculture, Forest Service), 48. doi: 10.2737/PNW-GTR-853
Moeur, M., Spies, T. A., Hemstrom, M., Martin, J. R., Alegria, J., Browning, J., et al. (2005). Northwest Forest Plan–The first 10 years (1994-2003): Status and trend of late-successional and old-growth forest. Gen. Tech. Rep. PNW-GTR-646. (Portland, OR: U.S. Department of Agriculture, Forest Service), 142. doi: 10.2737/PNW-GTR-646
Morgan, P. (1994). “Dynamics of ponderosa and Jeffrey pine forests,” in Flammulated, boreal, and great gray owls in the United States: A technical conservation assessment. General Technical Report RM-253, eds G. D. Hayward and J. Verner (Fort Collins, CO: U.S. Department of Agriculture, Forest Service), 47–73.
Morrison, P. H., Kloepfer, D. A., Leversee, D. A., Socha, C. M., and Ferber, D. L. (1991). Ancient forests in the Pacific Northwest: Analysis and maps of twelve national forests. Washington, DC: The Wilderness Society.
O’Connell, B. M., Conkling, B. L., Wilson, A. M., Burrill, E. A., Turner, J. A., Pugh, S. A., et al. (2017). The forest inventory and analysis database: Database description and user guide Version 7.0 for Phase 2. Fort Collins, CO: U.S. Department of Agriculture, Forest Service, 830.
Odum, E. P. (1969). The strategy of ecosystem development. Science 164, 262–270. doi: 10.1126/science.164.3877.262
Ohmann, J. L., and Gregory, M. J. (2002). Predictive mapping of forest composition and structure with direct gradient nearest-neighbor imputation in coastal Oregon, USA. Can. J. For. Res. 32, 725–741. doi: 10.1139/x02-011
Oliver, C. D., and Larson, B. C. (1996). Forest stand dynamics updated edition. New York, NY: John Wiley and Sons.
Overby, S. T., Hart, S. C., and Neary, D. G. (2002). “Impacts of natural disturbance on soil carbon dynamics in forest ecosystems,” in The potential of U.S. Forest soils to sequester carbon and mitigate the greenhouse effect, eds J. M. Kimble, L. S. Heath, R. A. Birdsey, and R. Lal (Boca Raton, FL: CRC Press).
Pacific Meridian Resources (1991). Old growth maps: Douglas-fir region (Region 6 national forests and national parks). 14 map sheets. Portland, OR: USDA Forest Service Region.
Paragi, T., and Rodman, S. (2020). Maintaining wildlife habitat in the boreal forest of Alaska: A guide for land owners, developers, and timber harvesters. Juneau, AK: Alaska Department of Fish and Game Division of Wildlife Conservation.
Peet, R. K. (1981). “Changes in biomass and production during secondary forest succession,” in Forest succession: Concepts and application, eds D. C. West, H. H. Shugart, and D. B. Botkin (New York, NY: Springer), 324–338. doi: 10.1007/978-1-4612-5950-3_20
Pregitzer, K. S., and Euskirchen, E. S. (2004). Carbon cycling and storage in world forests: Biome patterns related to forest age. Glob. Change Biol. 10, 2052–2077. doi: 10.1111/j.1365-2486.2004.00866.x
Repo, A., Rajala, T., Henttonen, H. M., Lehtonen, A., Peltoniemi, M., and Heikkinen, J. (2021). Age-dependence of stand biomass in managed boreal forests based on the Finnish National Forest Inventory data. For. Ecol. Manage. 9:119507. doi: 10.1016/j.foreco.2021.119507
Riley, K. L., Grenfell, I. C., Finney, M. A., and Wiener, J. M. (2021). TreeMap, a tree-level model of coterminous US forests circa 2014 produced by imputation of FIA plot data. Sci. Data 8:11. doi: 10.1038/s41597-020-00782-x
Sabatini, F. M., Bluhm, H., Kun, Z., Aksenov, D., Atauri, J., Buchwald, E., et al. (2021). European primary forest database v2.0. Sci. Data 8:20. doi: 10.1038/s41597-021-00988-7
Salas-Eljatib, C., Mehtätalo, L., Gregoire, T. G., Soto, D. P., and Vargas-Gaete, R. (2021). Growth equations in forest research: Mathematical basis and model similarities. Curr. Forestry Rep. 7, 230–244. doi: 10.1007/s40725-021-00145-8
Scheller, R. M., and Mladenoff, D. J. (2002). Understory species patterns and diversity in old-growth and managed northern hardwood forests. Ecol. Appl. 12, 1329–1343. doi: 10.1890/1051-0761(2002)012[1329:USPADI]2.0.CO;2
Sleeter, B. M., Frid, L., Rayfield, B., Daniel, C., Zhu, Z., and Marvin, D. C. (2022). Operational assessment tool for forest carbon dynamics for the United States: A new spatially explicit approach linking the LUCAS and CBM-CFS3 models. Carbon Balance Manage. 17:1. doi: 10.1186/s13021-022-00201-1
Smith, F. W., and Long, J. N. (2001). Age-related decline in forest growth: An emergent property. For. Ecol. Manage. 144, 175–181. doi: 10.1016/S0378-1127(00)00369-8
Spies, T. A., and Franklin, J. F. (1988). Old growth and forest dynamics in the Douglas-fir region of western Oregon and Washington. Nat. Areas J. 8, 190–201.
Spies, T. A., and Franklin, J. F. (1991). “The structure of natural young, mature, and old-growth Douglas-fir forests in oregon and washington,” in Wildlife and vegetation of unmanaged Douglas-fir forests. General Technical Report PNW-285, eds L. F. Ruggiero, K. B. Aubrey, A. B. Carey, and M. H. Huff (Portland, OR: USDA Forest Service Pacific Northwest Research Station), 91–109.
Spies, T. A., Franklin, J. F., and Thomas, T. B. (1988). Coarse woody debris in Douglas-fir forests of western Oregon and Washington. Ecology 69, 1689–1702. doi: 10.2307/1941147
Stanke, H., Finley, A. O., Domke, G. M., Weed, A. S., and MacFarlane, D. W. (2021). Over half of western United States’ most abundant tree species in decline. Nat. Commun. 12:451. doi: 10.1038/s41467-020-20678-z
Stanke, H., Finley, A. O., Weed, A. S., Walters, B. F., and Domke, G. M. (2020). rFIA: An R package for estimation of forest attributes with the US Forest Inventory and Analysis database. Environ. Model. Softw. 127:104664. doi: 10.1016/j.envsoft.2020.104664
Stevens, J. T., Safford, H. D., North, M. P., Fried, J. S., Gray, A. N., Brown, P. M., et al. (2016). Average stand age from forest inventory plots does not describe historical fire regimes in ponderosa pine and mixed-conifer forests of western North America. PLoS One 11:e0147688. doi: 10.1371/journal.pone.0147688
Stewart, R. E. (1992). Old growth definitions/characterizations for eleven forest cover types. San Francisco, CA: Pacific Southwest Region.
Strittholt, J., DellaSala, D. A., and Jiang, H. (2006). Status of mature and old-growth forests in the Pacific Northwest. Conserv. Biol. 20, 363–374. doi: 10.1111/j.1523-1739.2006.00384.x
Tinkham, W. T., Mahoney, P. R., Hudak, A. T., Domke, G. M., Falkowski, M. J., Woodall, C. W., et al. (2018). Applications of the United States Forest Inventory and Analysis dataset: A review and future directions. Can. J. For. Res. 48, 1251–1268. doi: 10.1139/cjfr-2018-0196
Tyrell, L. E., Nowacki, G. J., Crow, T. R., Buckley, D. S., Nauertz, E. A., Niese, J. N., et al. (1998). Information about old growth for selected forest type groups in the Eastern United States. Gen. Tech. Rep. NC-197. (St. Paul, MN: U.S. Department of Agriculture, Forest Service), 507. doi: 10.2737/NC-GTR-197
U.S. Department of Agriculture, Forest Service (1989). Position statement on national forests old-growth values. Unnumbered internal memo to regional foresters, station directors, and Washington Office staff, October 11, 1989. Washington, DC: U.S. Department of Agriculture Forest Service.
U.S. Department of Agriculture, Forest Service, and U.S. Department of the Interior, Bureau of Land Management (1994). Final supplemental environmental impact statement on management of habitat for late-successional and old-growth forest related species within the range of the northern spotted owl. Portland, OR:U.S. Department of Agriculture Forest Service.
Van Lear, D. H., Carroll, W. D., Kapeluck, P. R., and Johnson, R. (2005). History and restoration of the longleaf pine-grassland ecosystem: Implications for species at risk. For. Ecol. Manage. 211, 150–165. doi: 10.1016/j.foreco.2005.02.014
Various authors (1993). Interim old growth definitions for Douglas-fir, grand fir/white fir, interior Douglas-fir, lodgepole pine, Pacific silver fir, ponderosa pine, Port Orford-cedar and tanoak, subalpine fir, and western hemlock series. (Portland, OR: U.S. Department of Agriculture, Forest Service), 124.
West, P. W. (2020). Do increasing respiratory costs explain the decline with age of forest growth rate? J. For. Res. 31, 693–712. doi: 10.1007/s11676-019-01020-w
Wilson, B. T., Lister, A. J., and Riemann, R. I. (2012). A nearest-neighbor imputation approach to mapping tree species over large areas using forest inventory plots and moderate resolution raster data. For. Ecol. Manage. 271, 182–198. doi: 10.1016/j.foreco.2012.02.002
Wilson, B. T., Woodall, C. W., and Griffith, D. M. (2013). Imputing forest carbon stock estimates from inventory plots a nationally continuous coverage. Carbon Balance Manage. 8, 1–15. doi: 10.1186/1750-0680-8-1
Wirth, C., Messier, C., Bergeron, Y., Frank, D., and Fankhänel, A. (2009). “Old-growth forest definitions: A pragmatic view,” in Old-growth forests: Function, fate, and value (Ecological Studies 207), eds C. Wirth, G. Gleixner, and M. Heimann (New York, NY: Springer). doi: 10.1007/978-3-540-92706-8
Xu, C. Y., Turnbull, M. H., Tissue, D. T., Lewis, J. D., Carson, R., Schuster, W. S. F., et al. (2012). Age-related decline of stand biomass accumulation is primarily due to mortality and not to reduction in NPP associated with individual tree physiology, tree growth or stand structure in a Quercus-dominated forest. J. Ecol. 100, 428–440. doi: 10.1111/j.1365-2745.2011.01933.x
Keywords: biomass, succession, chronosequence, carbon, stable state
Citation: Barnett K, Aplet GH and Belote RT (2023) Classifying, inventorying, and mapping mature and old-growth forests in the United States. Front. For. Glob. Change 5:1070372. doi: 10.3389/ffgc.2022.1070372
Received: 14 October 2022; Accepted: 19 December 2022;
Published: 09 January 2023.
Edited by:
Steve Prisley, National Council for Air and Stream Improvement, Inc. (NCASI), United StatesReviewed by:
Andrew Gray, Pacific Northwest Research Station, United StatesCraig Loehle, National Council for Air and Stream Improvement, Inc. (NCASI), United States
Copyright © 2023 Barnett, Aplet and Belote. This is an open-access article distributed under the terms of the Creative Commons Attribution License (CC BY). The use, distribution or reproduction in other forums is permitted, provided the original author(s) and the copyright owner(s) are credited and that the original publication in this journal is cited, in accordance with accepted academic practice. No use, distribution or reproduction is permitted which does not comply with these terms.
*Correspondence: Gregory H. Aplet,  Z3JlZ19hcGxldEB0d3Mub3Jn
†These authors have contributed equally to this work and share first authorship