 Charles J. Maxwell
 Robert M. Scheller
 Kristen N. Wilson
 Patricia N. Manley
- 1Institute for Natural Resources, Oregon State University (OSU), Corvallis, OR, United States
- 2Department of Forestry and Environmental Resources, North Carolina State University (NCSU), Raleigh, NC, United States
- 3The Nature Conservancy, San Francisco, CA, United States
- 4Pacific Southwest Research Station, Placerville, CA, United States
Climate change will increase disturbance pressures on forested ecosystems worldwide. In many areas, longer, hotter summers will lead to more wildfire and more insect activity which will substantially increase overall forest mortality. Forest treatments reduce tree density and fuel loads, which in turn reduces fire and insect severity, but implementation has been limited compared to the area needing treatment. Ensuring that forests remain near their reference conditions will require a significant increase in the pace and scale of forest management. In order to assess what pace and scale may be required for a landscape at risk, we simulated forest and disturbance dynamics for the central Sierra Nevada, USA. Our modeling framework included forest growth and succession, wildfire, insect mortality and locally relevant management actions. Our simulations accounted for climate change (five unique global change models on a business-as-usual emissions pathway) and a wide range of plausible forest management scenarios (six total, ranging from less than 1% of area receiving management treatments per year to 6% per year). The climate projections we considered all led to an increasing climatic water deficit, which in turn led to widespread insect caused mortality across the landscape. The level of insect mortality limited the amount of carbon stored and sequestered while leading to significant composition changes, however, only one climate change projection resulted in increased fire over contemporary conditions. While increased pace and scale of treatments led to offsets in fire related tree mortality, managing toward historic reference conditions was not sufficient to reduce insect-caused forest mortality. As such, new management intensities and other adaptation actions may be necessary to maintain forest resilience under an uncertain future climate.
Introduction
Forests reflect the disturbances that have shaped them: fires, droughts, insect outbreaks, and harvesting all shape forest composition and structure (White and Jentsch, 2001). But under climate change, disturbance regimes will shift, and current forest conditions may no longer be in a “safe-operating space” and can change rapidly (Johnstone et al., 2016; Serra-Diaz et al., 2018). Across California climate change is projected to increase drought (Diffenbaugh et al., 2015; Crockett and Westerling, 2018), forest fire activity (Westerling, 2016), and insect outbreaks (Fettig et al., 2019). With such disturbance pressures, shifts in forest composition and structure will have long-term consequences for the types and levels of ecosystem services provided by future forests.
The 2012–2015 drought in California led to a mass tree mortality event in the southern Sierra Nevada caused by direct water stress (via C storage, hydrologic cavitation, or both; Sevanto et al., 2014), insect attacks on drought stressed trees, and increased fire activity. Historically, pre-European settlement forests across the Sierras were of lower density and experienced a short fire return interval (FRI) marked by frequent fires (every 11–16 years), but low to moderate fire severity (Hessburg et al., 2019). A history of fire suppression and timber harvesting over the past century resulted in a denser forest as shade tolerant species filled in, leading to anomalously high fuel loadings and larger, more severe fire patterns (Keeley and Syphard, 2019). While current forests are at or near a self-thinning phase due to the forest densification, pre-European settlement forests were likely sufficiently sparse that trees experienced little resource competition (North et al., 2022). Forest densification amplified the mass tree mortality event by increasing competition for soil water leading to increased insect outbreak severity (Safford and Stevens, 2017). Forest treatments reduce stand density and fuel loads and increase spatial and structural heterogeneity, which increases the capacity of the forest to resist mortality events (Restaino et al., 2019; Knapp et al., 2020) and can further enhance the resilience of the forest by allowing it to recover after a fire to pre-suppression conditions (Coop et al., 2020).
Because of budget limitations and competing objectives, there has been limited opportunity to implement widespread thinning and prescribed fire treatments despite the compelling need. As such, managers will need to rely on wildfires to reduce fuels and stand density (North et al., 2012). It is, however, unknown whether such treatments can sufficiently tame wildfire to effectively contribute to the objectives of a lower severity fire regime, improved drought and insect mortality resistance, and resilience in response to disturbance. Previous studies have suggested that early and aggressive, large-scale thinning treatments can reduce fire severity and increase carbon storage across the whole Sierra Nevada range (Liang et al., 2018). Accelerated forest treatments on 14% of the Sierra Nevada ecoregion per decade reduced the risk of tree mortality from fire and held more carbon (Liang et al., 2018). Within the Lake Tahoe Basin (a subset of the larger Sierra Nevada), Loudermilk et al. (2017) found that strategically placed fuel treatments in high ignition areas covering less than 7% of the forested area can reduce wildfire risk, increased the fire resiliency of forest, and benefitted carbon storage. However, Scheller et al. (2018) found that fuel management practices in Lake Tahoe based on Loudermilk et al. (2017) would not reduce landscape-scale forest mortality from beetle outbreaks.
We hypothesized that mimicking the historic fire-return interval, by matching it with the combined frequency of natural disturbances (wildfire) and management (i.e., thinning and prescribed fire), will maintain forest resilience despite a changing climate. We measured this resilience by tracking several metrics through time: (1) tree-mortality due to wildfire, (2) tree mortality due to insect outbreaks, (3) carbon storage and sequestration, and (4) avoidance of forest conversion to shrub. To test our hypothesis, we deployed a forest landscape simulation model, LANDIS-II, to test a broad range of management scenarios under climate change. LANDIS-II is able to simulate multiple processes within forests, including forest growth and succession, wildfire, insects, management, and climate change. This allowed us to test a variety of management scenarios ranging in intensity and methodology. We specifically focused on scenarios that encapsulated a range of proposed actions for returning the landscape to the historic disturbance interval. Our scenarios allowed us to parse the contributions of specific and plausible management actions and therefore to evaluate their relative performance at maintaining forest resilience over the 21st century. Those management scenarios were paired with climate change projections selected to highlight a broad range of potential future climate conditions.
Materials and methods
Study area
The study area which represents the area covered by the Tahoe Central Sierra Initiative (TCSI), covers 978,381 hectares (2,416,000 acres) of the central Sierra Nevada and has over 3000 m of topographic relief (Figure 1). The primary forest type is Sierra mixed conifer, which includes such species as ponderosa pine (Pinus ponderosa), Douglas-fir (Pseudotsuga menziesii), incense-cedar (Calocedrus decurrens), and white fir (Abies concolor) at mid-elevations. The types range from low elevation oak woodlands (Quercus spp.) to mixed conifer to high elevation montane conifers (Abies magnifica, Pinus albicaulis, Pinus monticola). The climate is generally Mediterranean, Koppen climate classification of Csa to Dsa, with warm, dry summers and cool, wet winters. The region receives approximately 1300 mm of precipitation a year, mostly as snow. Annual mean maximum temperatures are about 17°C and minimums are about 3°C. The region was largely spared from the insect outbreaks that contributed to the mass mortality event in the southern Sierras, but it still has seen large areas affected by insect outbreaks (USFS Aerial Detection Survey).
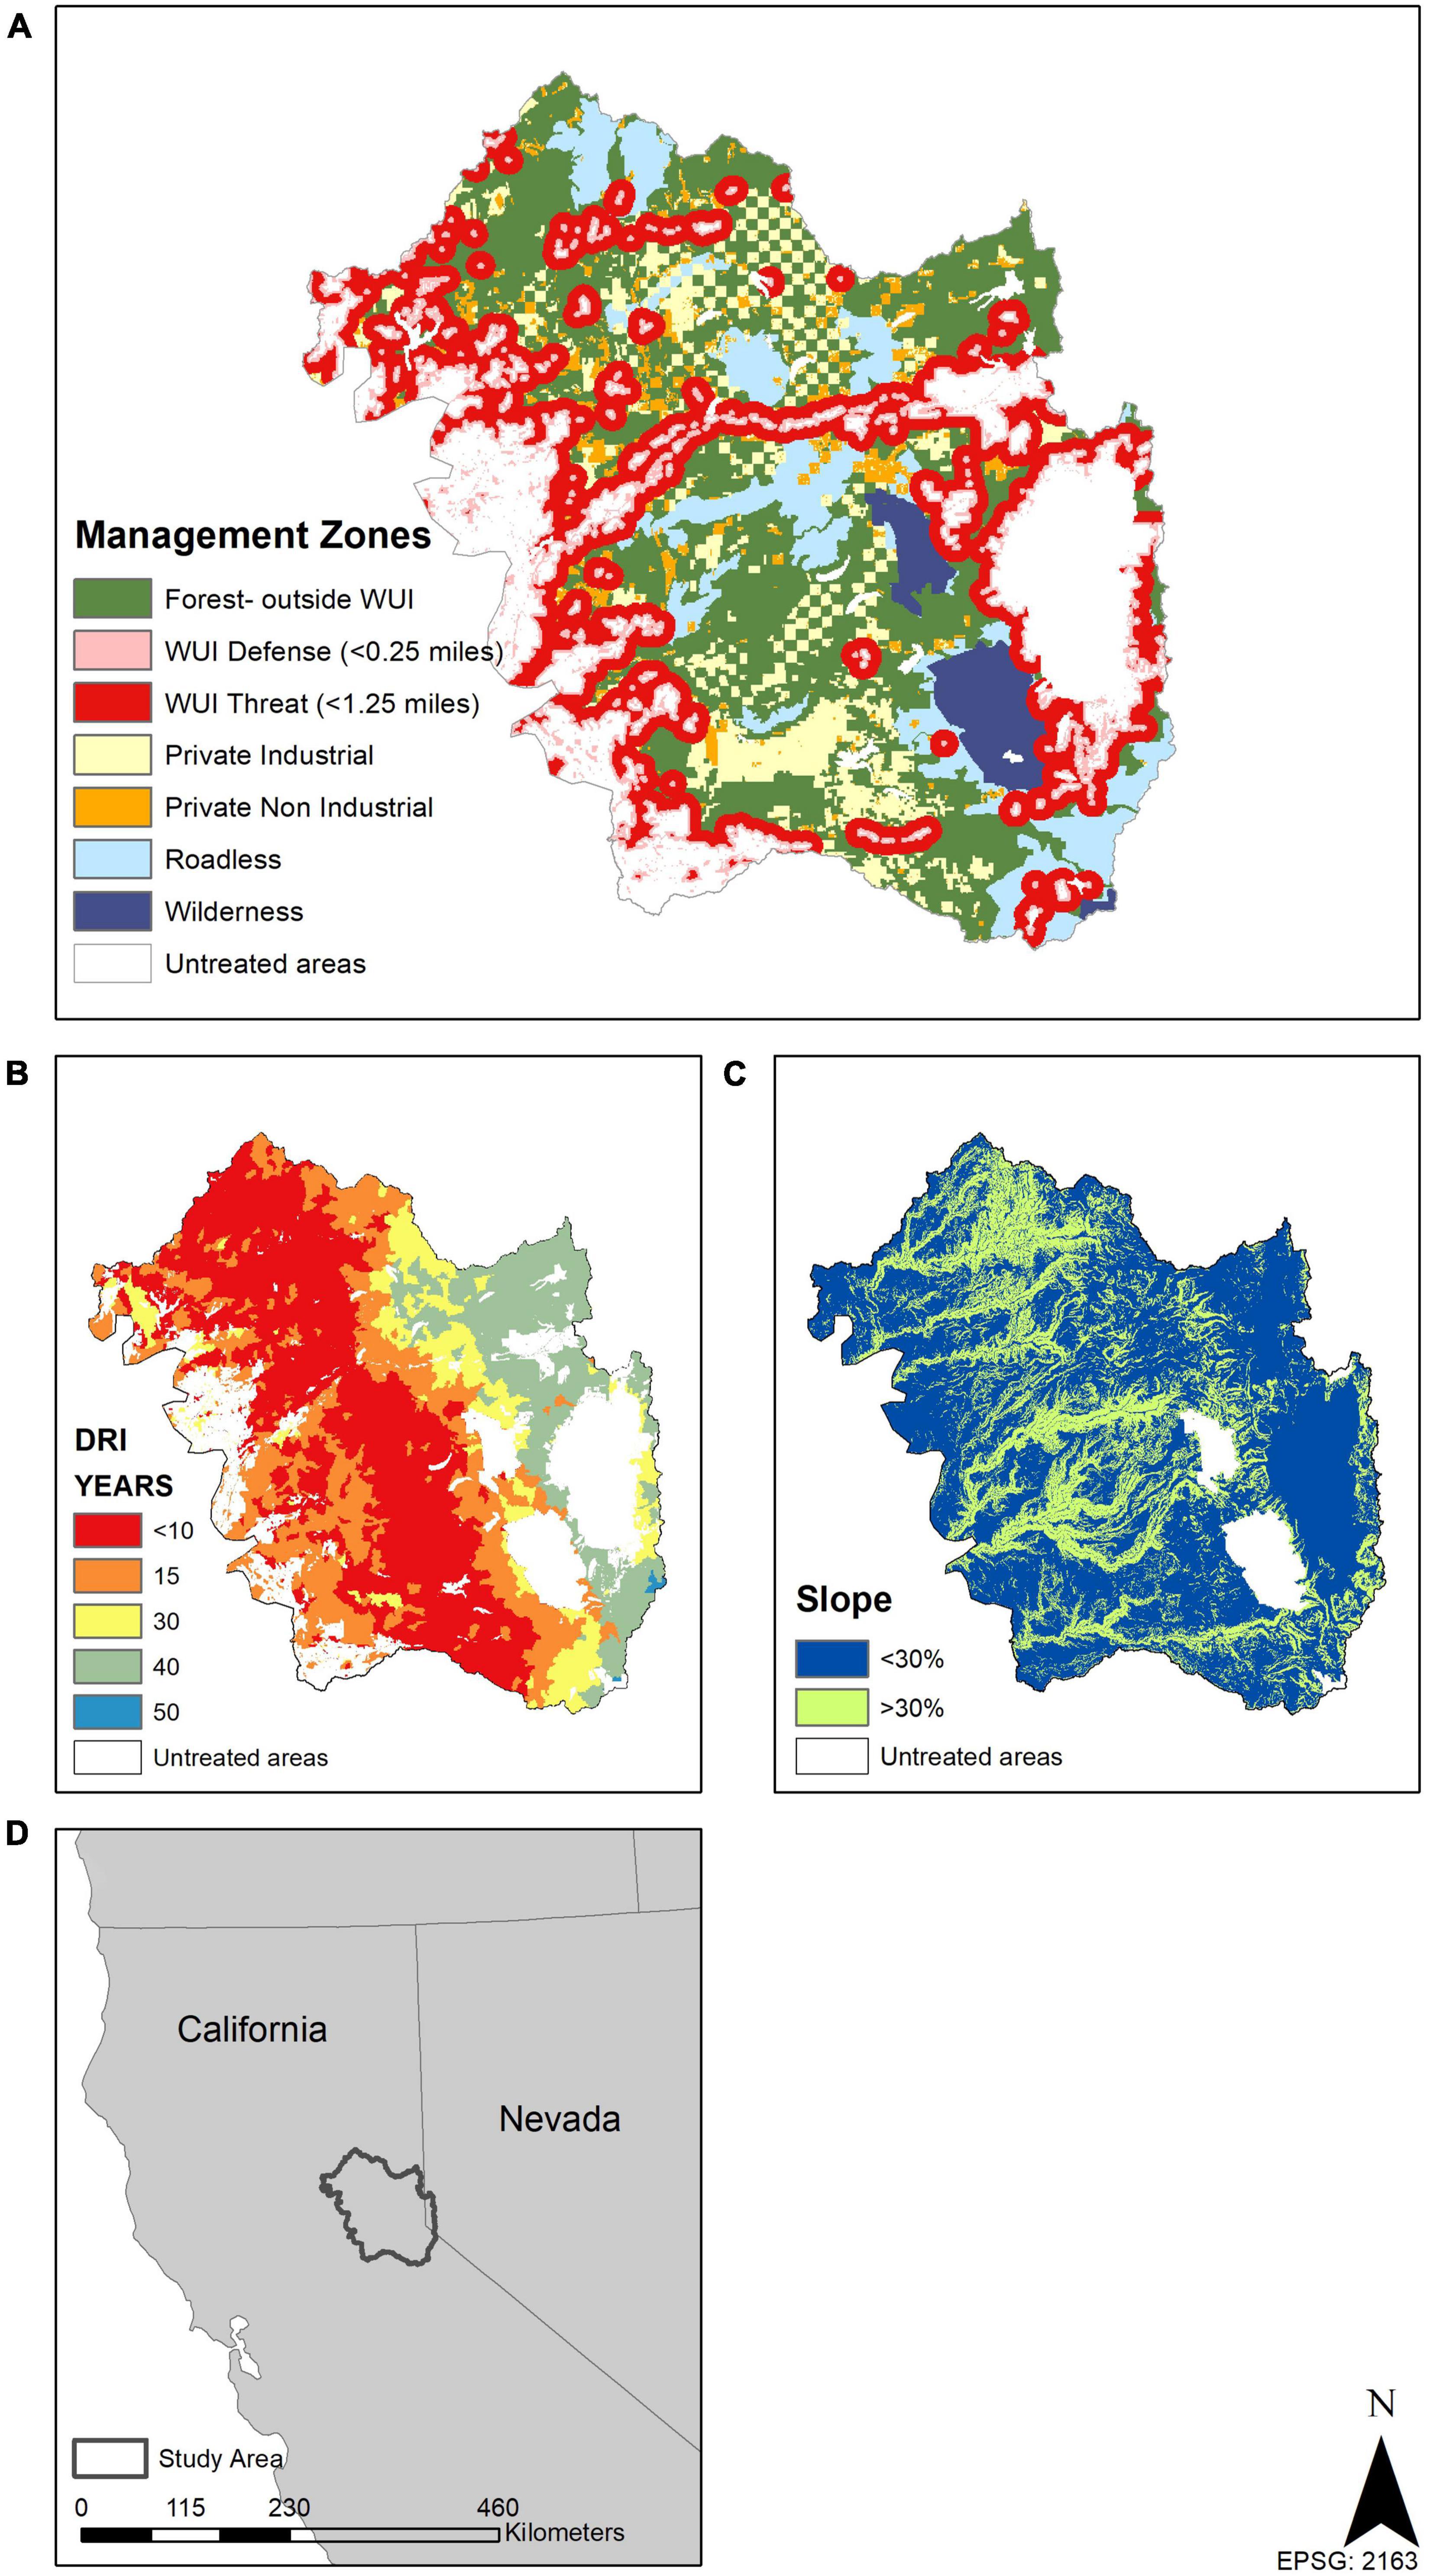
Figure 1. Management zones (A), historic fire return intervals (B) lumped by climate class and used to set scenario treatment amounts; and slopes (C) all influenced treatment prescriptions. Study area location within the USA (D). Forested areas that are within 400 m of urban areas are called wildland urban interface (WUI) Defense areas, and those within 2000 m are WUI Threat areas. Forests outside of WUI areas in public ownership that were not legislatively restricted in some way are considered general forests, while roadless and wilderness areas are not allowed to have roads built within them and wilderness areas cannot have any mechanized equipment within them.
The predominant landowner in this region is the Federal Government, with approximately 687,967 ha of National Forest System lands, 41% of which is within 2.4 km of houses or other buildings (i.e., the wildland urban interface, or WUI). There are four National Forests with lands in the study area: Tahoe, Eldorado, Lake Tahoe Basin Management Unit, and Plumas. Private ownership, either non-industrial forestland or industrial forestland, covers 143,549 ha, 11% of which is within the WUI. The remainder (146,865 ha) is either developed land or water bodies.
Model description
LANDIS-II simulates forests as tree or shrub species-age cohorts within a grid of interacting cells, allowing spatial interactions among processes (e.g., management, growth and succession, and disturbance) over many decades and across large landscapes. Individual cohorts compete for resources (e.g., soil moisture, nitrogen, and growing space) among the different species-age cohorts within each cell, and within LANDIS-II, disturbances and succession interact via the species-age cohorts. For example, cohorts killed by wildfire are not subsequently available to serve as hosts for insects; if management substantially reduces insect-susceptible cohorts, the likelihood of outbreaks is subsequently reduced; prescribed fires reduce ladder fuels that co-determine fire severity; etc. As such, the landscape is an evolving spatial representation of forest demographics, capturing regeneration and mortality that respond dynamically to climate change-driven disturbance events. We modeled from 2020 to 2100 using future climate projections with at least five replicates of each climate projection to capture stochastic variation in disturbances. To isolate the effect of climate projections, we modeled one management scenario under historical climate by resampling random weather years from 1990 to 2019. We divided the landscape into a 180-m (3.24 ha) grid. All model parameters, and the model and extension versions used, are available on github at: https://github.com/LANDIS-II-Foundation/Project-Tahoe-Central-Sierra-2019. This repository will also be archived on Zenodo.
Succession and carbon dynamics
Forest succession and carbon dynamics were simulated using the Net Ecosystem Carbon and Nitrogen (NECN) succession extension (v6.5) (Scheller et al., 2011a). NECN simulates both above and belowground processes, tracking C and N through multiple live and dead pools, as well as tree growth (as a function of age, climate, and competition for available water and N) and landscape carbon sequestration [as net ecosystem carbon balance (NECB)–a function of growth, decomposition, and disturbance]. Soil, wood, and litter decomposition are based on the CENTURY soil model (Parton et al., 1988; Scheller et al., 2011a). Daily weather inputs of precipitation and temperature drive forest growth, regeneration and decay, with each species responding uniquely to those inputs. Seeding is based on several factors: (1) cohorts can only create seeds when they have reached sexual maturity; (2) dispersal distance follows a double-exponential distribution. Regeneration specifically is bounded by growing season and must fall within a range of growing degree days above 5°C, and have sufficient water, see Supplementary Appendix 1; Supplementary Table 1 for the full list of species parameters. Shrub groups based on functional type groupings (N-fixing and resprouting versus seeding) were included within the model in order to serve as a competitor to tree species during post-fire regeneration (Serra-Diaz et al., 2018).
Net Ecosystem Carbon and Nitrogen inputs and parameters were based on a suite of forest inventory, satellite data, and literature sources (see section “Model Calibration and Evaluation,” and Supplementary Appendix 1). Soil data, such as soil depth, field capacity, and percent clay among others, were from a gridded SSURGO product of California (Soil Survey Staff, 2017). Duff, litter, and deadwood layers were derived from interpolated FIA data (Wilson et al., 2013). Initial communities were derived from FIA plots that were interpolated using a series of algorithms and LANDSAT imagery with total forest cover aligning with the LANDSAT derived Dewitz and U. S. Geological Survey (2021). We simulated 39 tree and shrub species; species traits were derived from literature sources [Liang et al., 2017, USFS Silvics Manual (Burns and Honkala, 1990), USFS Fire Effects Information System (FEIS)].
Wildfire disturbances
Wildfire was simulated as a function of ignition (human or lightning), fuels, topography, and fire weather using the SCRPPLE extension (v.2.2) (Scheller et al., 2019). Ignitions themselves are stochastic within the model but use a probability surface based on prior wildfire ignition data to distribute the ignitions across the study area and rely on the calculated Canadian Fire Weather Index (FWI) from the input climate to determine the general timing pattern (e.g., the number of ignitions trend upwards during summer months) which is calculated by a poisson regression with FWI as an independent variable. Human caused ignition probability surfaces were derived from Short (2021) wildfire occurrence data (Supplementary Appendix 1; Supplementary Figure 4). Lightning caused ignition probability surfaces were derived from 15-year lightning strike records (Supplementary Appendix 1; Supplementary Figure 5).
Within the model, increasing fire intensity is based three conditions: (1) if the amount of fine fuels [litter, duff, and small down woody debris (< 7.6 cm)] within a cell crosses a set threshold, (2) if the amount of ladder fuels within a cell crosses a set threshold, and (3) if a neighboring cell is experiencing high intensity fire. For high intensity fire to occur, two of those three conditions need to be met, and for moderate intensity fire, just one of those conditions need to be met. Because fire severity is dependent on fine and ladder fuel accumulation, it therefore reflects events on the landscape including management like prescribed fire (reducing fine fuels) or thinning (reducing ladder fuels), prior fire events (reducing fine and ladder fuels), and insect outbreaks (increasing fine fuels). To translate fire intensity into fire severity, as measured by tree mortality, we used data from the Cansler et al. (2020) Fire and Tree mortality database to calculate what percent of a species-age cohort would die from a certain fire intensity.
Bark beetle disturbances
Four of the most prevalent insects to conifer trees in the Sierra Nevada were simulated using a modified version of the BDA extension (v2.1) (Sturtevant et al., 2004): fir engraver (Scolytus ventralis), Jeffrey pine beetle (Dendroctonus jeffreyi), mountain pine beetle (Dendroctonus ponderosae), and western pine beetle (Dendroctonus brevicomis). Insect outbreaks were simulated as a function of drought stress, as measured by climatic water deficit, and warm winter temperatures. The probability of bark beetle outbreak spread and outbreak severity reflect the neighborhood density of hosts, which is calculated from the amount of biomass of a specific host in a given cell (Sturtevant et al., 2004). Changes in levels of the host species biomass—whether from past occurrences of wildfires or forest management—would reduce spread and intensity.
Outbreak thresholds (CWD and minimum winter temperatures as averaged across the landscape) were derived from the presence of outbreaks greater than 400 ha (> 1000 acres) in the USFS Aerial Detection Survey (ADS) dataset for 1992–2017. This was done to try to match the temporal occurrence of outbreaks; however, this resulted in an overall accuracy of 54% of outbreak years (i.e., where outbreak and non-outbreak years coincided) but still underestimated the total frequency of outbreak incidence in the ADS dataset. This underestimate is likely the result of only capturing the potential climate signal and specific host presence rather than insect ecology. Tree susceptibility to insects was based on age values taken from the literature (Supplementary Appendix 1; Supplementary Table 1) and then was further adjusted to match landscape-scale field data using Fettig et al.’s (2019) plots in the Stanislaus National Forest, which are located immediately to the south of the study area.
Forest management scenarios
Forest management scenarios and treatment prescriptions were developed based on expert-opinion from National Forest silviculturalists and managers, along with input from private timber industry, US Forest Service scientists, academics, and The Nature Conservancy ecologists. We developed six scenarios to forecast how increasing the scale of forest management and greater use of prescribed fire would improve resilience outcomes under climate change.
To implement our six scenarios, we assigned target disturbance return intervals (DRI), the time in years between a management action (e.g., thinning or prescribed fire), wildfire, or insect outbreak, to every cell (Figure 1). The target DRI was a 10–20 year range centered on mean historic fire return intervals (van Wagtendonk et al., 2018) associated with climate zones (climate classes as defined by Jeronimo et al., 2019) (Table 1 and Figure 1E). Harvest rates across the landscape were then based on the frequency necessary to maintain that respective return interval target (Supplementary Appendix 2; Supplementary Table 3). We delineated seven management zones and two slope classes to reflect land ownership, administrative restrictions, and slope limitations on forest prescriptions (Figure 1). We defined the WUI Defense and Threat zones as 402 m (< 0.25 miles) and 2,012 m (< 1.25 miles) from development, respectively. Developed areas represented more than two dwelling units per 40 hectares, or commercial, industrial, institutional, transportation, or golf course land use types using the ICLUS v.2.1 dataset (HadGEM2-ES RCP8.5 SSP2 2020, U.S.EPA, 2017). Forest treatment on public forest lands outside the Defense and Threat zones (i.e., General Forest) was triggered by a stand meeting two conditions: (1) a minimum time since disturbance threshold based on the most recent forest treatment or disturbance (mean of the DRI range); and (2) a minimum biomass threshold (which was based on the conversion of the minimum mean basal area from contemporary reference forest structure associated with a climate class) (Table 1). These conditions were set to push stands toward their historic fire return interval while also ensuring sufficient time for a stand to recover from disturbance before any management activity took place.
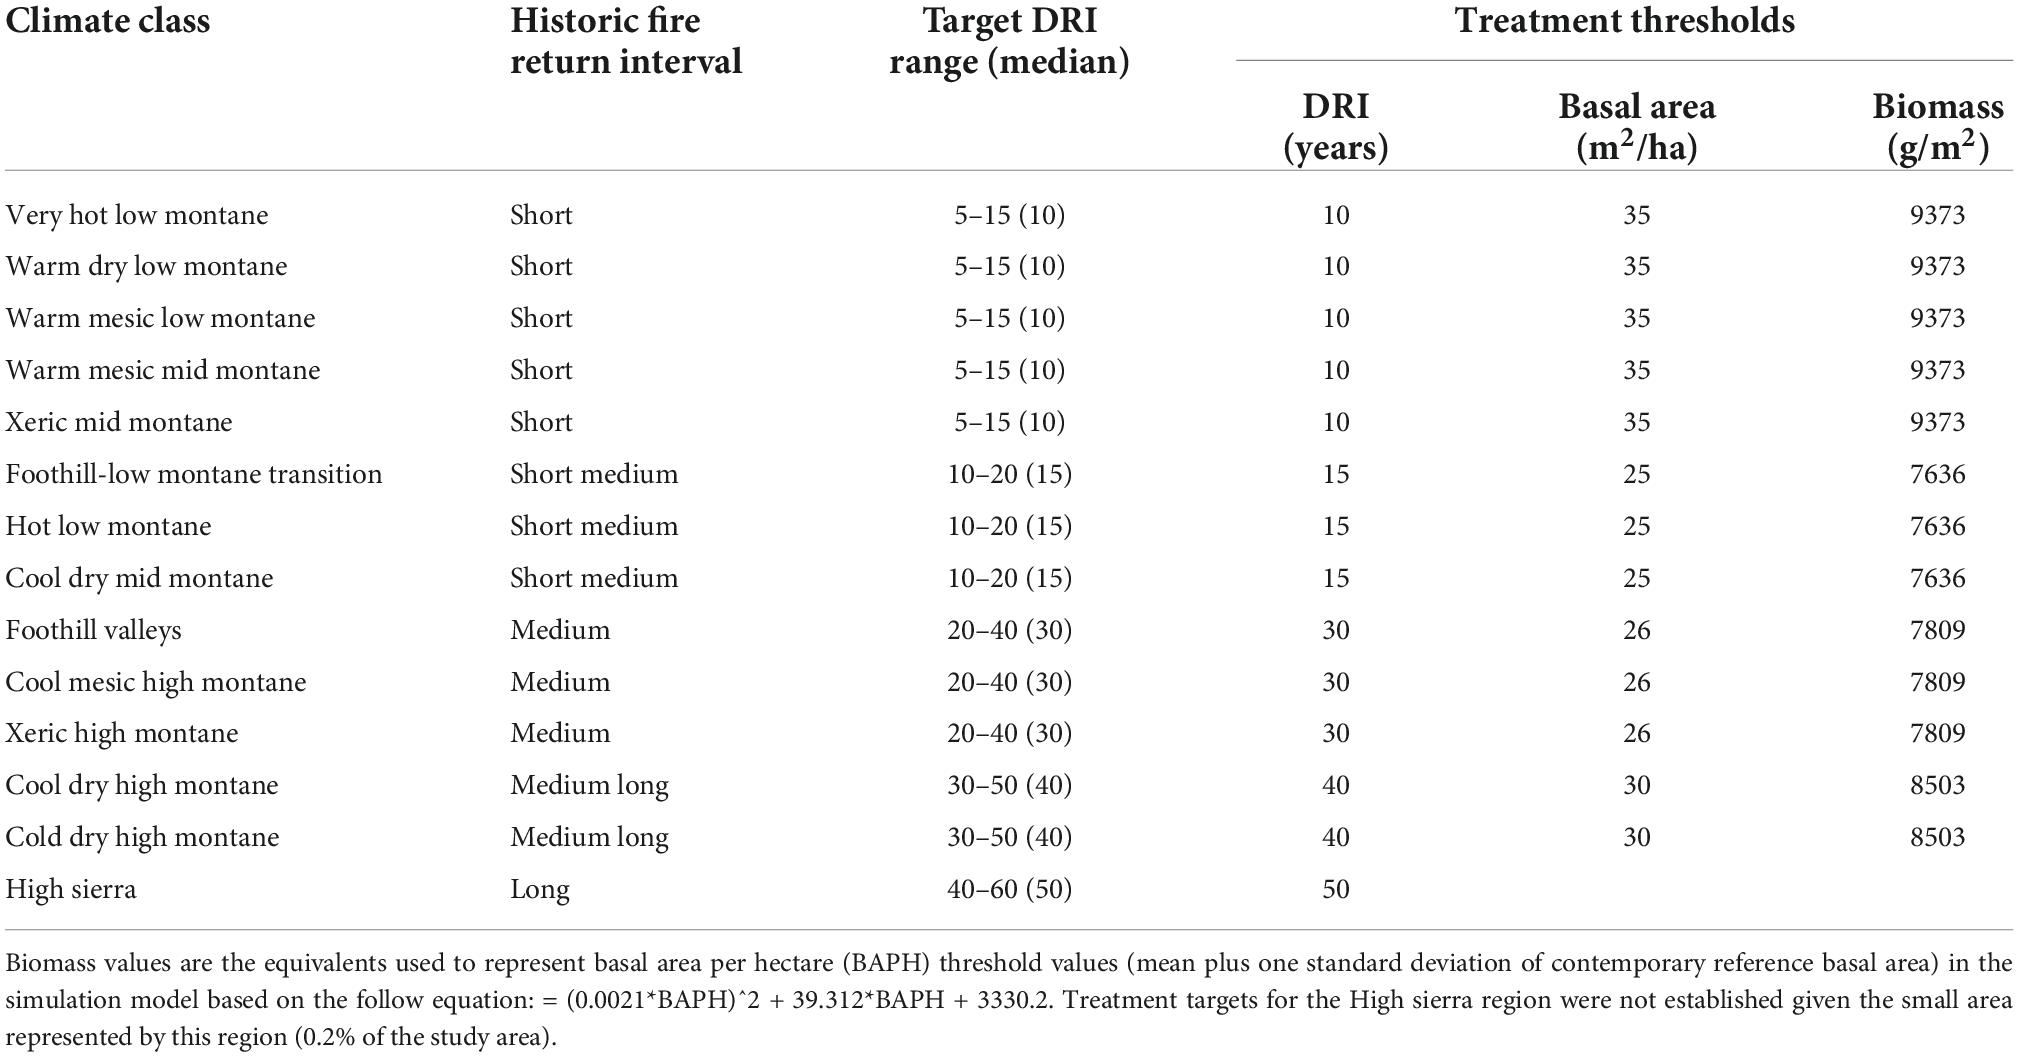
Table 1. Climatic zones, their historic fire return intervals, the targeted disturbance return intervals (DRIs) and the thresholds for conducting treatment, as simulated.
Our six scenarios were derived from the variable application of four treatment prescriptions: clearcutting, mechanical thinning in mature stands, mechanical thinning in young stands, and hand-thinning (Supplementary Appendix 2; Supplementary Table 4). Mechanical thinning treatments encompass a range of possible activities depending on tree size, but can include harvesting, mastication, and drumming amongst other methods. Hand thinning treatments are crew and chainsaw based, and while able to work on a wider range of slopes, cannot remove as large of trees or as much material as mechanical thinning methods. Except for clear cutting on private lands, 14 of the 39 tree species were thinned at a range of intensities spanning a range of diameter classes based on existing forest practices (Table 2). These thinnings targeted all diameter classes of more shade-tolerant and less fire-intolerant species: white fir, red fir, incense cedar, juniper, Douglas-fir, and mountain hemlock. Pines were also targeted, but only up to 76.2 cm (30 in) in diameter, with greater removal of lodgepole pine, whitebark pine, and western white pine and lesser treatment of Jeffrey pine, sugar pine, ponderosa pine, Washoe pine, and gray pine (Supplementary Appendix 2; Supplementary Table 4). Mechanical thinning of young stands, or pre-commercial thinning, and hand thinning removed understory trees up to 25.4 cm (10 in) diameter of all species. We did not simulate salvage logging following wildfire or insect outbreaks. We set the model to have two thresholds for treatment - time since significant disturbance set at a minimum value of based on FRI, and stand condition, based on exceeding the upper end of the desired range of biomass. We designed treatments to remove sufficient material by age class to bring the stand into desired condition. The end result of each management action was unique to each stand and each stand entry based on the dynamic nature of the modeling.
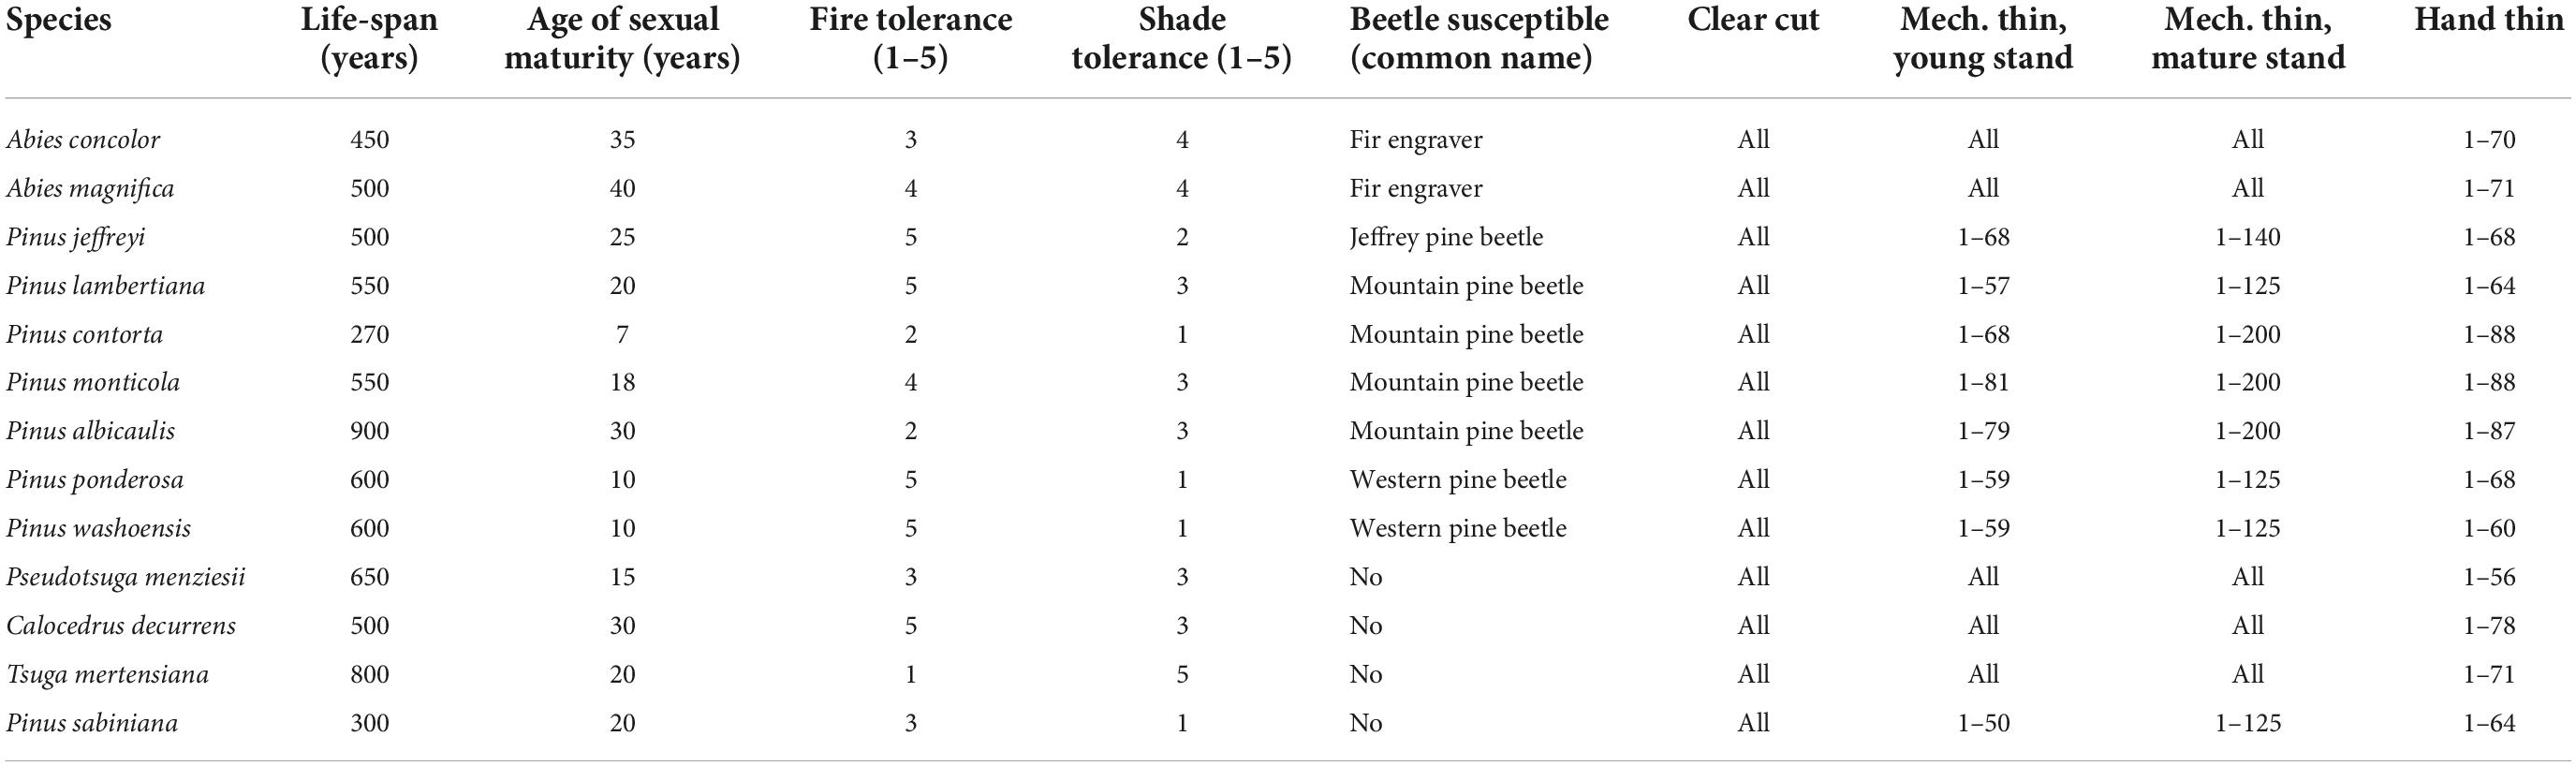
Table 2. Parameters for major tree species that were modeled, beetle susceptibility of those species, and forest treatments that remove cohorts within the listed specific age range.
Across all six scenarios, the treatment interval and prescription were held constant for three management zones: Private Industrial (every 25 years), Private Non-industrial (every 40 years), and Defense (matched to the DRI). The Defense zone is the zone where fires often start and is a priority for reducing wildfire risk to people and infrastructure. There was no prescribed fire in these three zones, and clearcuts only occurred on Private Industrial land. On National Forest lands with slopes > 30% all prescriptions were hand thinning or prescribed fire. There was no treatment in the Wilderness zone.
The treatment goal for Scenario 1 for private land and the Defense zone was 9,300 ha (23,000 acres) per year. In Scenario 2, which is equivalent to the “business as usual” management scenario, we added treatments in the Threat zone [16,600 ha (41,000 acres) per year]. The treatment area in Scenario 2 is designed to be close to the average annual forest treatment by public and private land managers in the study area. In 2018, the treatment in the area was 15,469 ha (38,226 acres) per year based on the U.S. Forest Service FACTs database and CALFIRE treatment database for private land. In Scenario 3, we added treatment in the General Forest, Roadless, and Wilderness management zones [32,780 ha (81,000 acres) per year]. In Scenario 3, the General Forest and Roadless zones received 5 and 20% of the total treatment was prescribed fire, respectively. The percent of mechanical thinning treatment varied across scenarios depending on the balance with the percent of prescribed fire for Scenarios 3–6, with the total adding up to 100% for both < 30% and > 30% slopes (Table 3). In Scenario 4, the Threat zone treatment interval was lowered to match the historic FRI and prescribed fire represented 20% of the total treatment for all slopes [39,250 ha (97,000 acres) per year]. In Scenario 5 and Scenario 6, we set the treatment interval equal to the historic FRI for the General Forest and Roadless management zones [51,400 ha (127,000 acres) per year, Supplementary Appendix 2]. The total treatment goal in Scenarios 5 and 6 was the same, however, scenario 6 included more prescribed fire in the General Forest and Roadless zones, 30% of the total treatment for both zones. The treatment goal for Scenarios 1 through 6 was to treat 1–6% of the forested landscape per year, with Scenarios 5 and 6 matching the historic fire return interval, or 11–63% per decade.
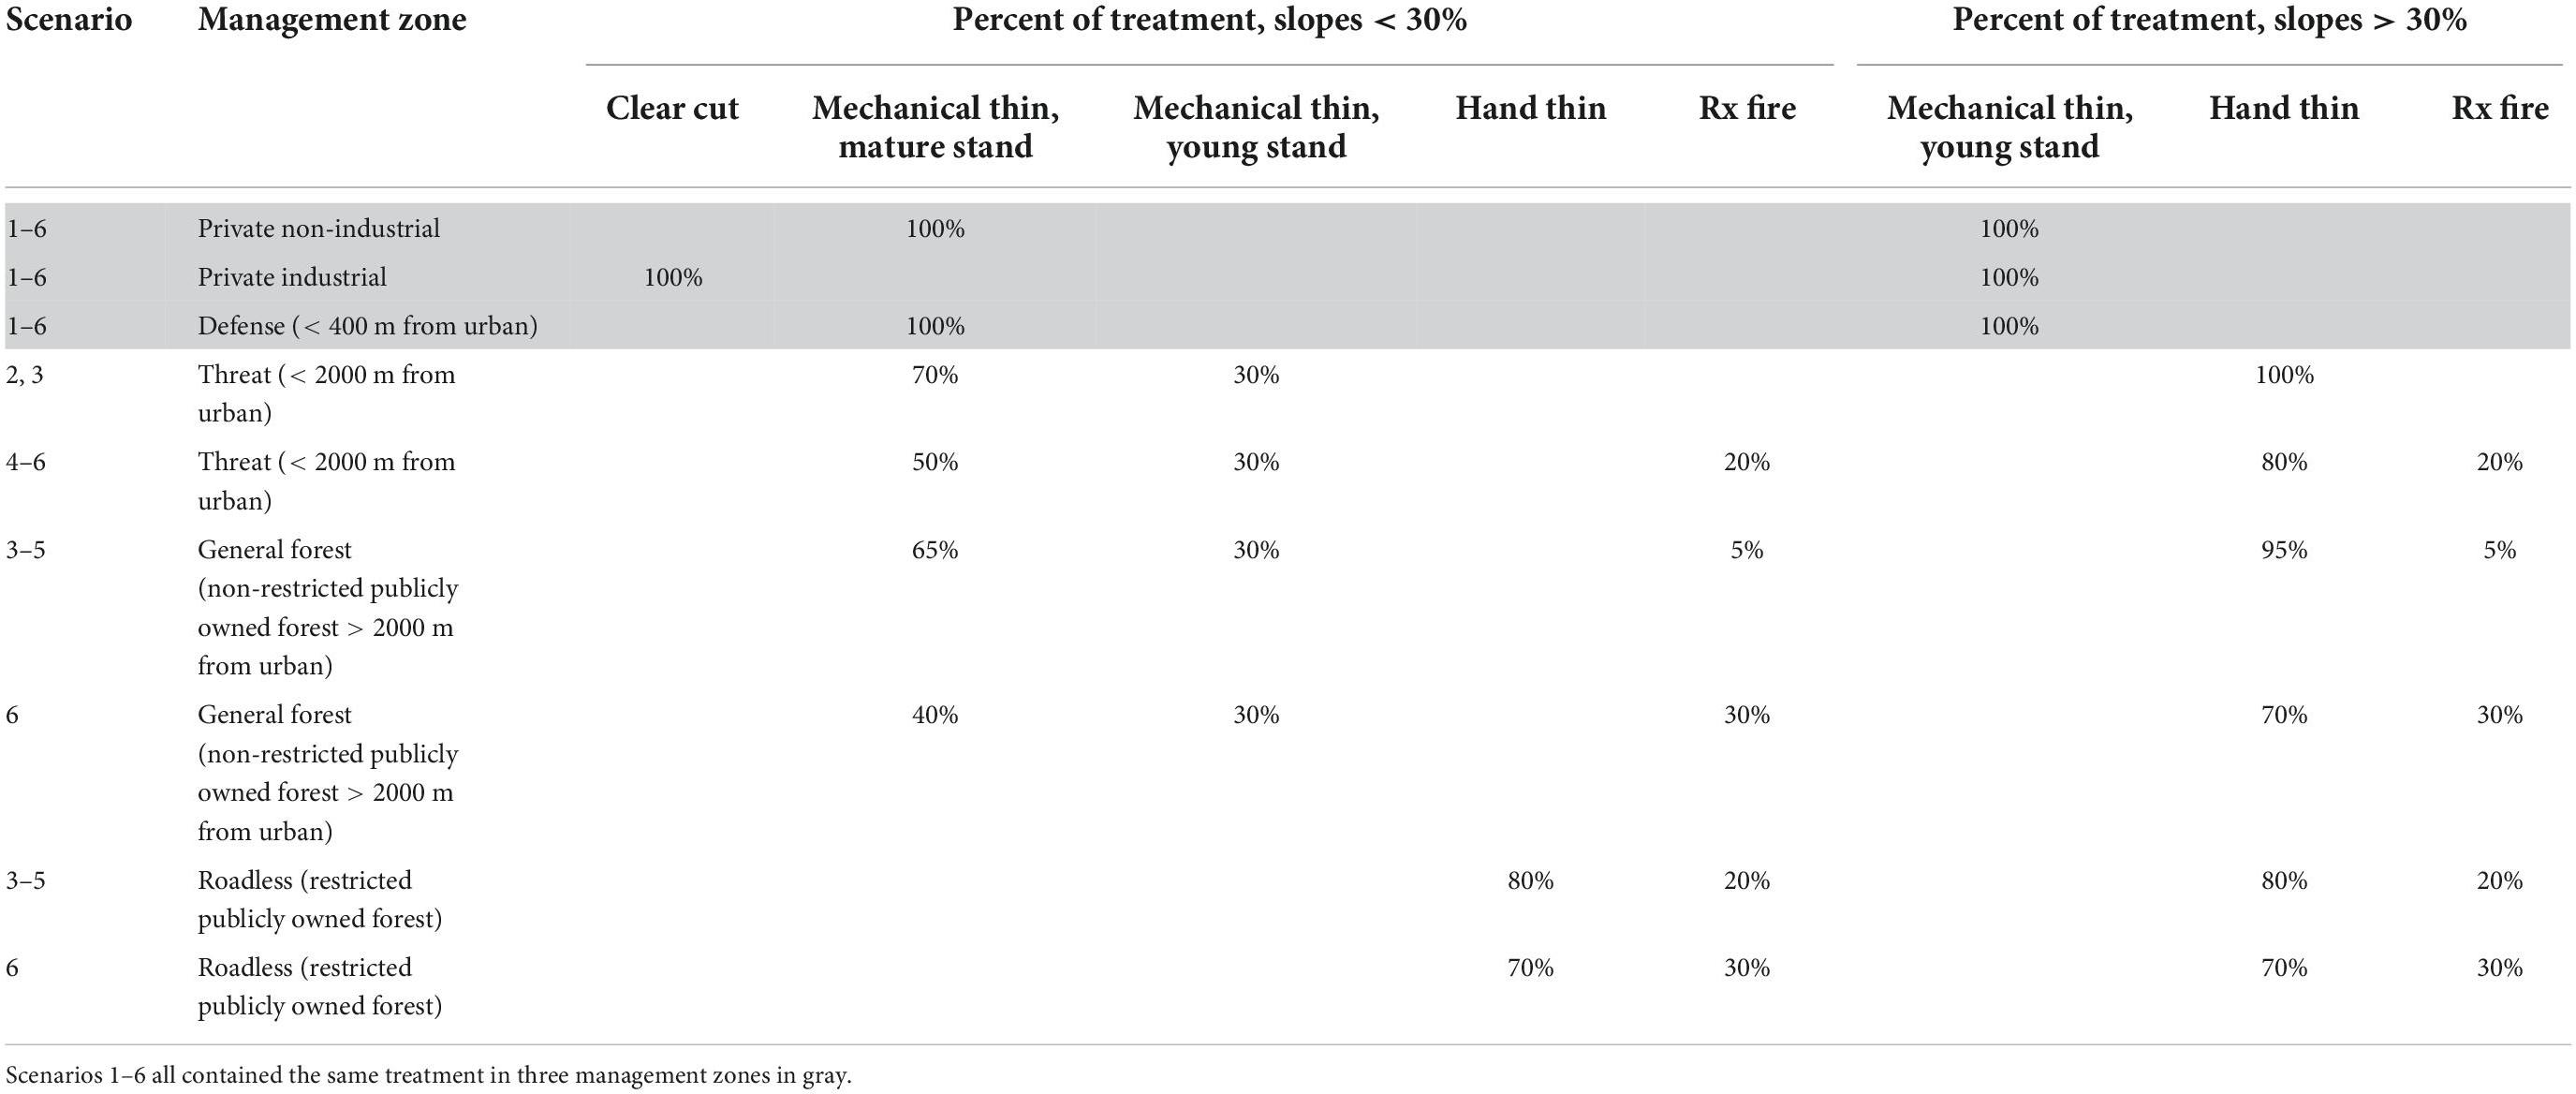
Table 3. Percent of different treatment prescriptions by scenario, management zone, and slope.
Climate projections
We simulated the six management scenarios under five climate futures from the Coupled Model Intercomparison Project Phase 5. We selected five climate models based on the recommended subset from California’s Fourth Climate Change Assessment, plus one additional model (Pierce et al., 2018): HadGEM2-ES, CNRM-CM5, CanESM2, MIROC5, plus GFDL-ESM2. These models were identified by the California Department of Water Resources as some of the best models to use for water resource planning in California (Department of Water Resources [DWR], 2015). Only the relative concentration pathway (RCP) 8.5 projections were chosen for each climate model, given that RCP 8.5 best represents current and expected near term emissions levels (Schwalm et al., 2020). These five models ranged from a 5% increase in annual precipitation relative to the 2000–2009 decade by end of century (MIROC5) to a > 50% increase by the end of century (CNRM-CM5). Maximum daily temperature increased from > 20% (CNRM-CM5) to > 30% (GFDL-ESM2) (see Supplementary Appendix 1 for more details). All projections were downscaled using the MACA methodology to a 4 km grid (Abatzoglou and Brown, 2012) available through the USGS Geo Data Portal,1 before being averaged across ten ecoregions that were delineated by elevation to improve computational tractability.
Model calibration and evaluation
We calibrated the LANDIS-II model using 1990–2019 gridMET historical climate data (Abatzoglou, 2013). We were able to recreate similar levels of forest growth, net ecosystem exchange, fire size and beetle mortality compared to other sources. We first compared the initial forest biomass conditions that served as inputs into the model to other landscape scale biomass imputation estimates such as TREE MAP (Riley et al., 2021). The modeled average biomass (mean 218 Mg/ha, sd 91 Mg/ha) was 33–71 Mg/ha higher but fell within a standard deviation of other estimates (see Supplementary Appendix 2; Supplementary Figure 1).
Forest growth was calibrated based on a 15-year average (2000–2015) of the MODIS 17A3 annual net primary productivity (NPP) product and the calculated net ecosystem exchange (NEE) measured by an eddy-covariance flux tower located within the study area. Modeled NPP was 535 g C m–2 (sd 145 g C m–2), which is comparable to the MODIS value of 506 g C m–2 (sd 145 g C m–2), see Supplementary Appendix 2; Supplementary Figure 3 (Running and Mu, 2015). Modeled NEE for the flux tower location was 60 (sd 140) g C m–2 between 2015 and 2019, similar to the measured value of 66 (sd 72) g C m–2 at the tower (ORNL DAAC, 2018; Kimball et al., 2021).
Fire size was calibrated using historical fire perimeter data from the Monitoring Trends in Burn Severity (MTBS) (Eidenshink et al., 2007) and the California Department of Fire Resource Assessment Program’s (FRAP) fire data. The average annual fire area based on five replicate model runs was 3,857 ha/year (sd 6,484 ha/year, maximum: 40,223 ha/year) while the mean annual area burned based on MTBS and FRAP was 3,375 ha (sd 7,722 ha, maximum: 40,105 ha, Supplementary Appendix 2; Supplementary Figures 6, 7). We calibrated average annual fire severity to the average annual thematic fire severity data from MTBS. The percentage of area that burned at high severity was 12% in the model compared to 16% in MTBS. From 2010 to 2020, the percentage of high severity fire increased, accounting for up to 35% of fire area, and the model matched this increase, 30% of fire area was high severity over the past decade.
To calibrate insect mortality, it was necessary to find vegetation inputs that predated the recent mass mortality event that occurred in California due to the extreme drought conditions of 2012–2015 so as to avoid the forest compositional and structural changes that resulted from that event. As such, we used the initial species-age vegetation data from Syphard et al. (2011) from the nearby Stanislaus National Forest, which is immediately to the south of the study area. We then calibrated insect mortality to the observed mortality rates in Fettig et al. (2019) (Supplementary Appendix 2; Supplementary Table 2). Under these conditions the modeled mortality was higher than Fettig et al. (2019) findings for ponderosa pine mortality (range 63–99% modeled vs. 45–85% observed), but lower for white fir (range 0–25% modeled vs. 15–50% observed), and sugar pine (0–39% modeled vs. 20–70% observed).
Results
While the management scenarios were designed to integrate management activities with wildfire to achieve a disturbance return interval that matched the historic fire return interval, the target historic interval was not achieved (Figure 2). These differences are due in part to restrictions on management activities. Scenarios that used high levels of thinning (like Scenario 5) were further restricted by other disturbance processes (mainly insects) that were dispersed across the landscape resulting in a decline in the amount of area harvested or thinned through time as those stands were not eligible to be treated. Between the first decade, 2020–2030, and the last decade, 2090–2100, the area treated by management declined by 60% for scenario one and 40% for scenario six (Supplementary Appendix 2; Supplementary Figure 9). The forest treatment goal for scenarios one through six was 11–63% of the landscape per decade, while the actual treatment modeled was 4–59%. Moreover, as the amount of wildfire increased over time, especially around model year 2050, the treatment area (thinning and prescribed fire) declined because individual cells were already disturbed and within their historic disturbance return interval and therefore not eligible to be treated.
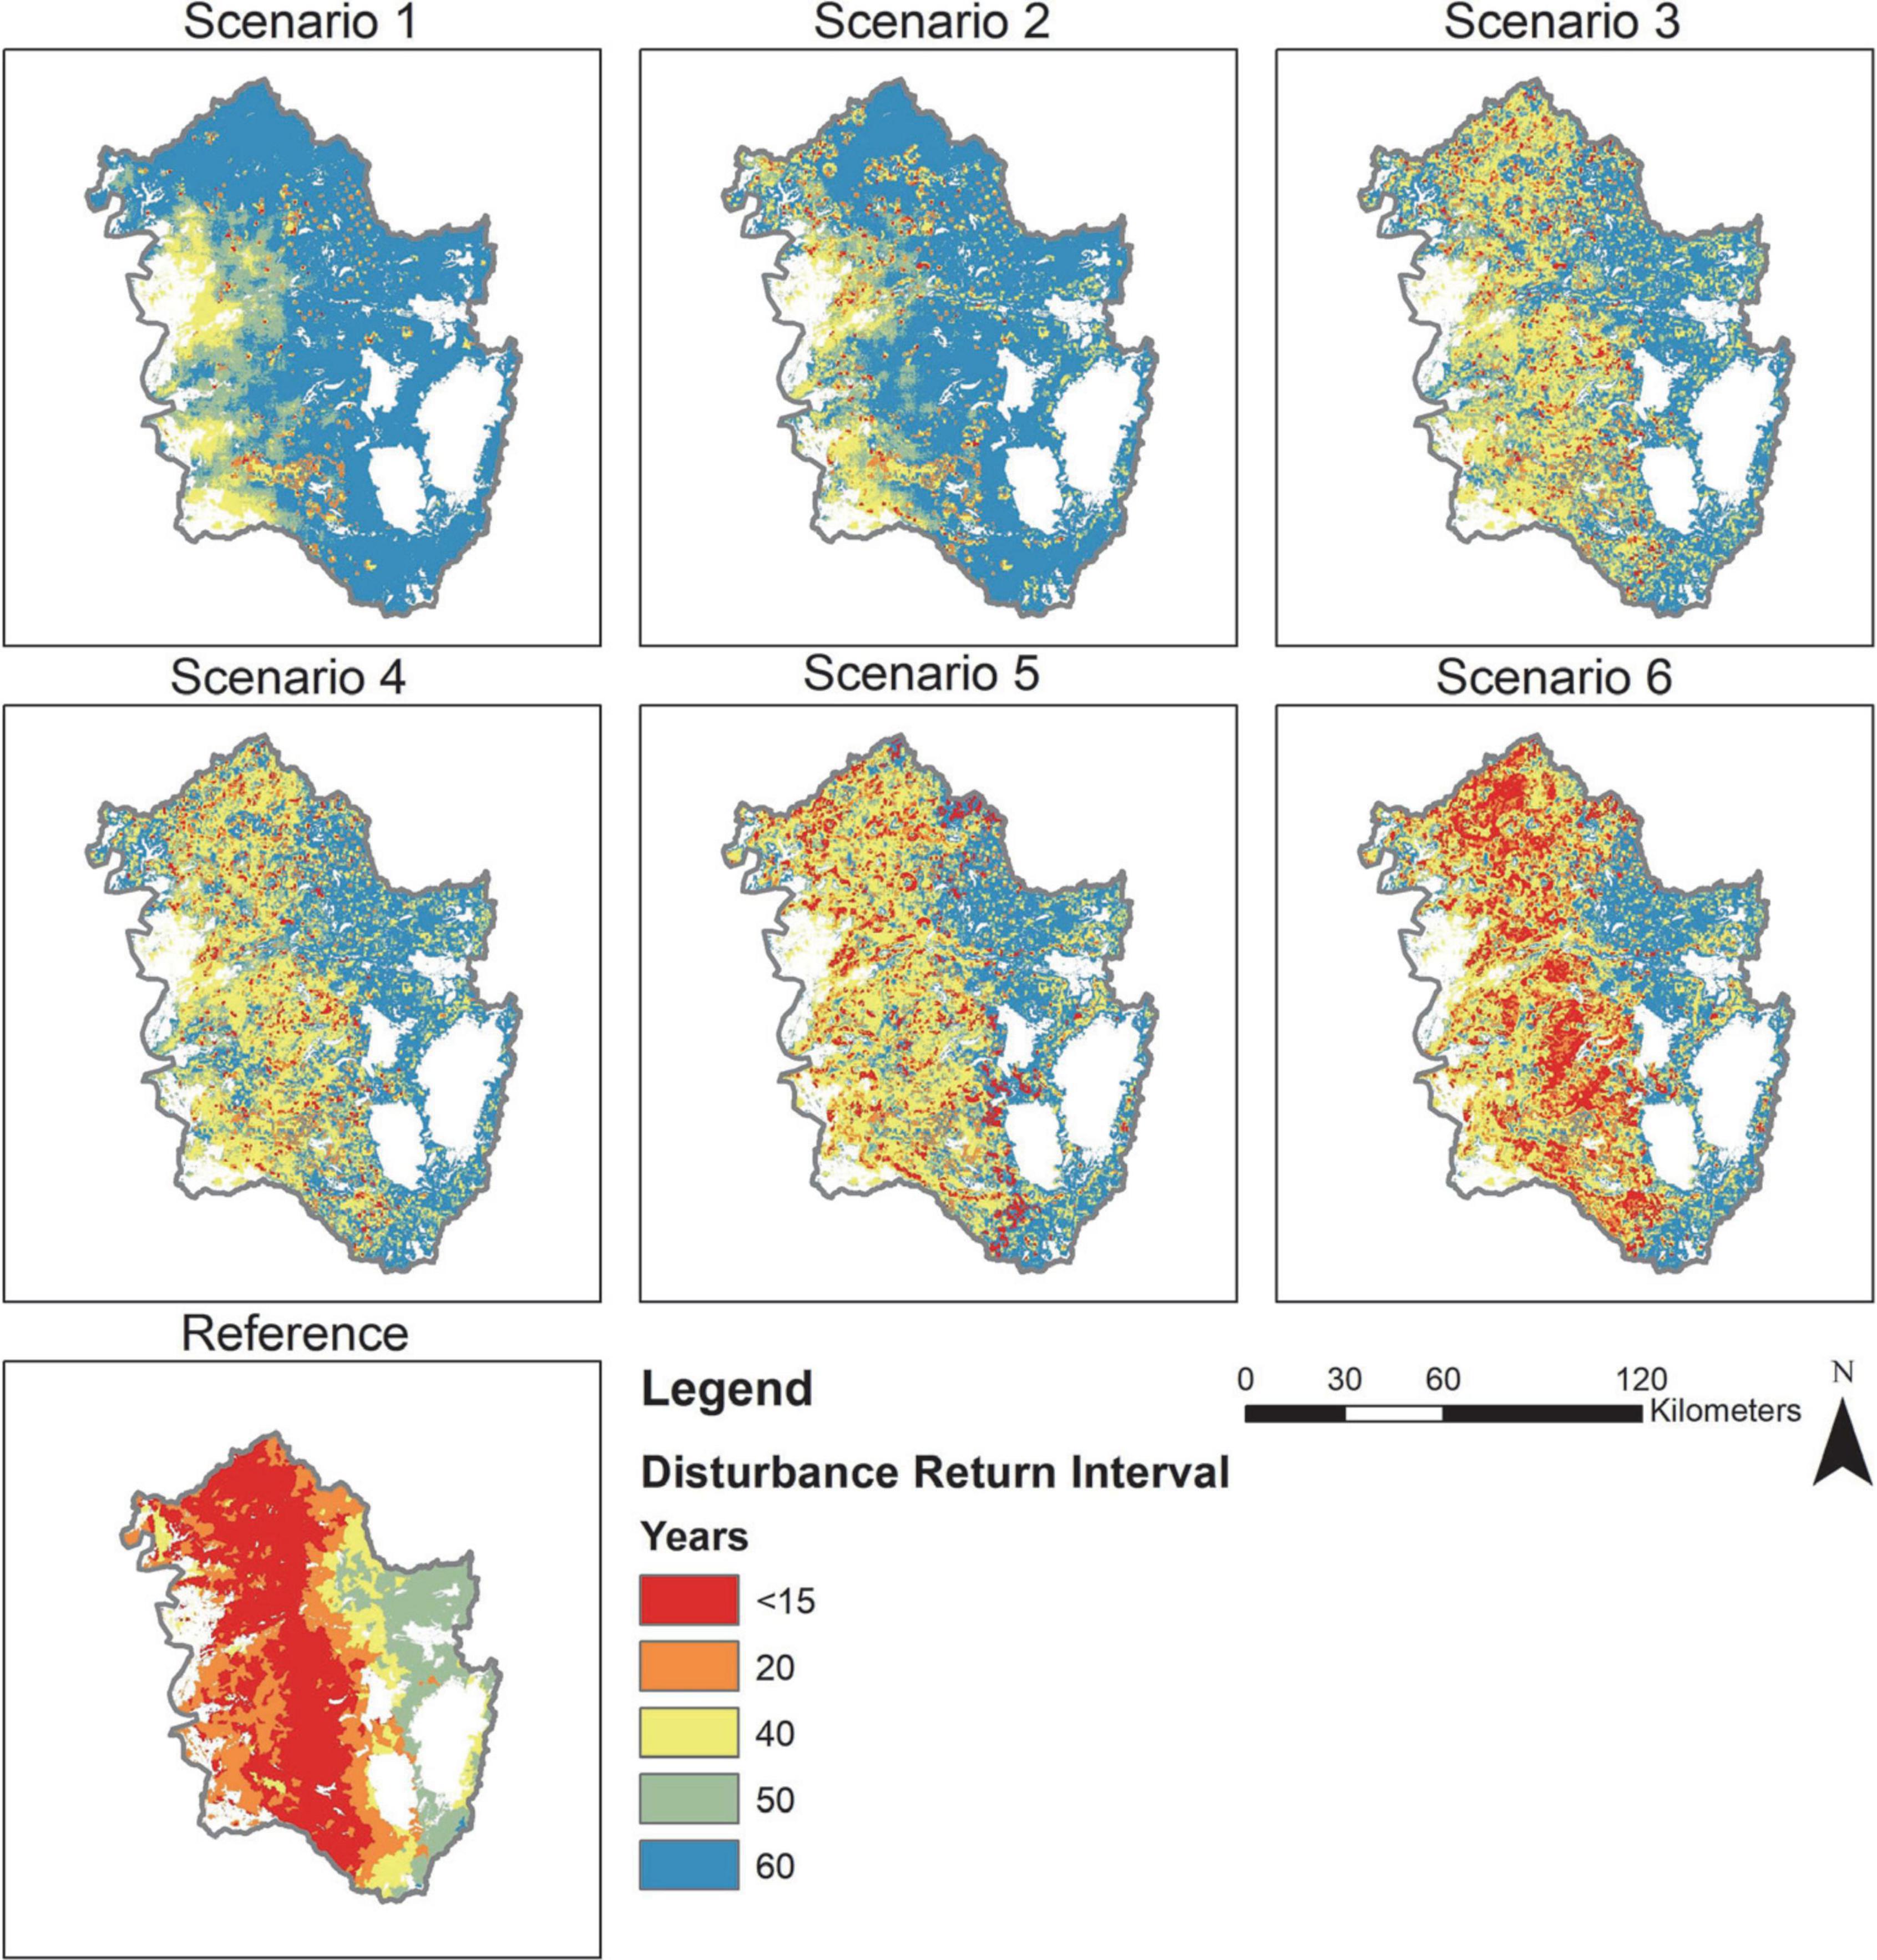
Figure 2. The frequency of disturbance by management or wildfire (of any severity) over the 2020–2100 time period by scenario averaged over all replicates compared to the reference fire return interval. The disturbance return interval is the number of modeled years (80 years total), divided by the number of disturbances plus one. Only Scenario 6 approaches recreating the reference fire return interval. White areas in the reference map are not available for forest treatment or water bodies.
Future forest change will depend on the climatic stressors going forward. Our climate projections indicate that the climatic water deficit will increase, driven mainly by increases in temperature. However, in four out of the five future climate projections selected, despite those increases in temperature, there was also a moderate to substantial increase in projected precipitation, which lowers the likelihood of extreme fire weather conditions (Supplementary Appendix 1; Supplementary Figures 1–4). Recent droughts (2003–2004, 2012–2015, 2020+) are exceptional and are not recreated in any of our climate projections, with the MIROC5 projection coming closest in the 2050s. While projected climatic water deficit increased into the future, this did not necessarily translate to increases in projected fire weather due to timing of the precipitation. As a result, area burned did not exceed recent trends until the end of the century under the non-MIROC5 projections; but extreme fire events (events greater than 100,000 ha), which is only slightly larger than a fire that happened in the study area in the fall of 2021 (Caldor Fire at 90,000 ha) had a chance of occurring with the MIROC5 projection. Regardless of climate projection, and even for historic climate, insect outbreaks were spatially pervasive and the leading source of forest mortality (Figure 3 and Supplementary Appendix 1; Supplementary Figure 6). Only the MIROC5 future climate projection had increases in fire mortality beyond the levels generated from the historic contemporary climate and projected resampled contemporary climate. Repeating historic climate into the future produced more variability in tree mortality and source of mortality given the random resampling of the climate data.
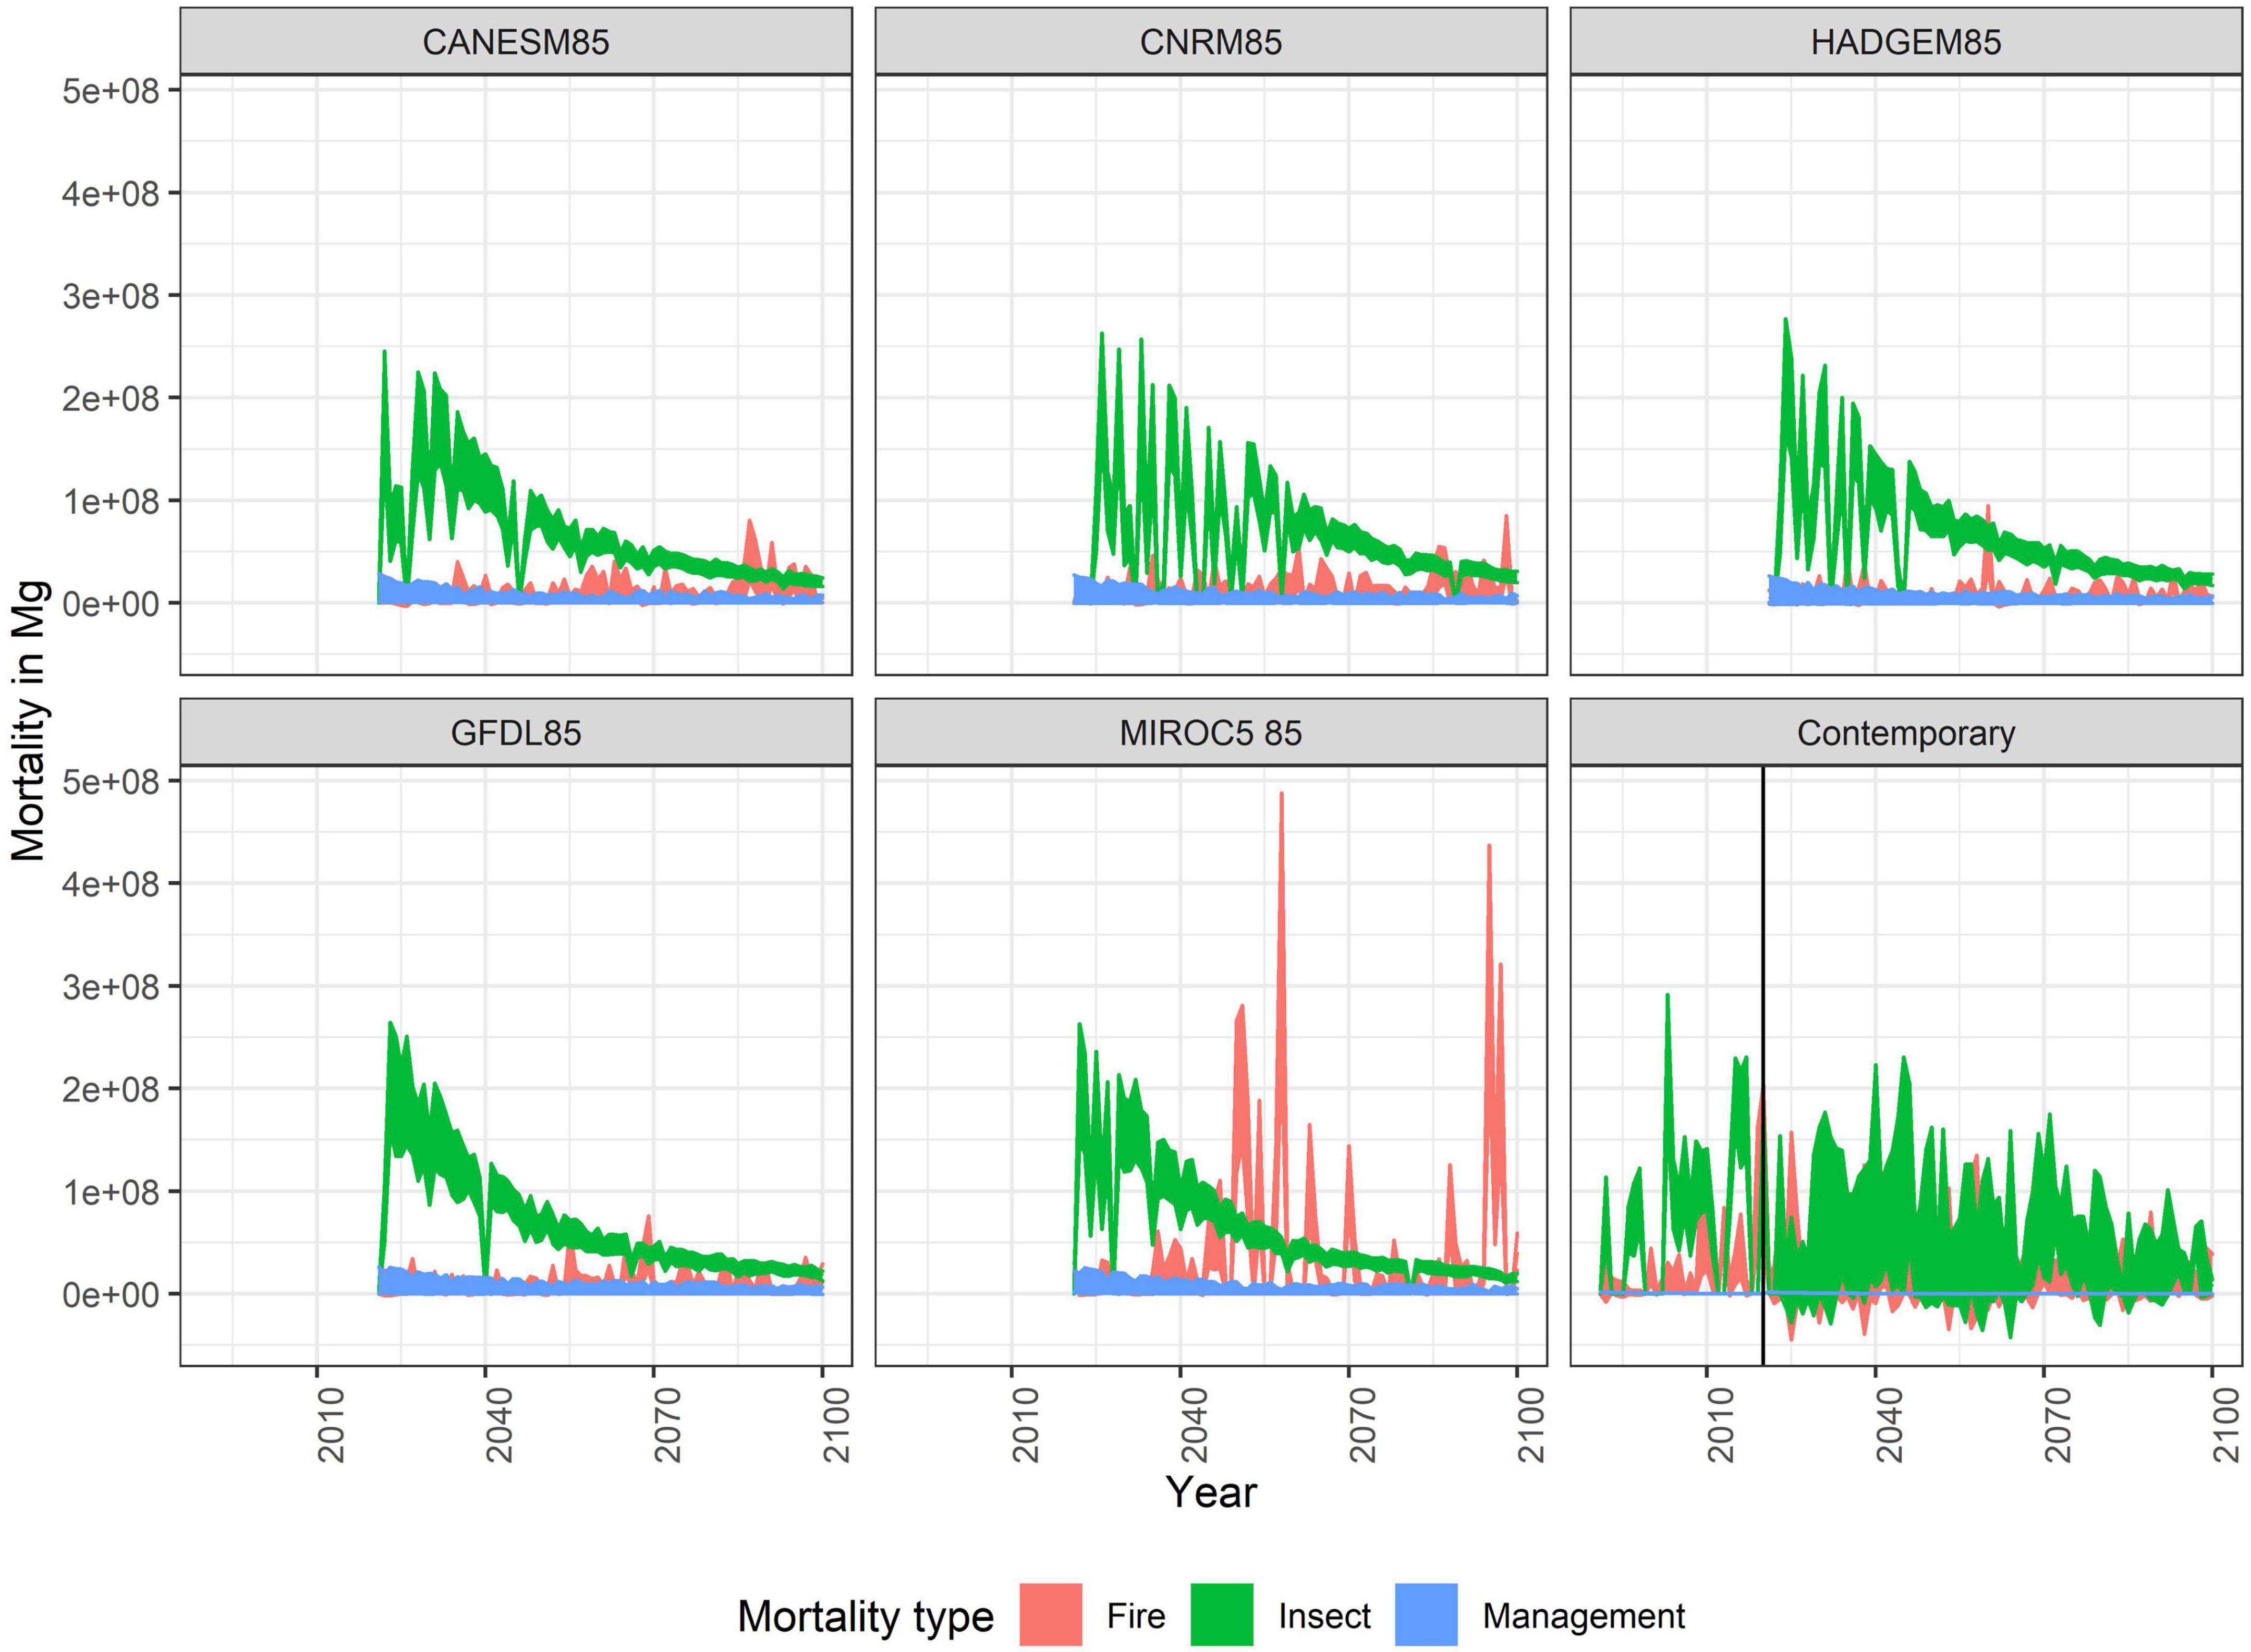
Figure 3. Cumulative forest mortality by disturbance type in Mg Biomass. Management includes harvesting, thinning, and prescribed fire.
Because of the rapid onset of outbreaks, regardless of treatments conducted prior to the period simulated, simulated forest management had limited effect on reducing insect caused forest mortality (Figure 3). While insect mortality rapidly increases flammable fuels (duff, litter, and dead wood), the limited frequency of wildfire meant that large patches of high severity fires were rare except under the MIROC5 projection (Supplementary Appendix 1; Supplementary Figure 7). The primary effect of higher intensity management scenarios (Scenarios 3–6, beyond the business-as-usual Scenario 2) was lowering the cumulative mortality by end of century caused by wildfires compared to Scenarios 1 and 2 for only the MIROC5 climate projection due to the overall higher levels of area burned in that projection (Figure 4) and those differences were statistically significant (Supplementary Appendix 1; Supplementary Table 2).
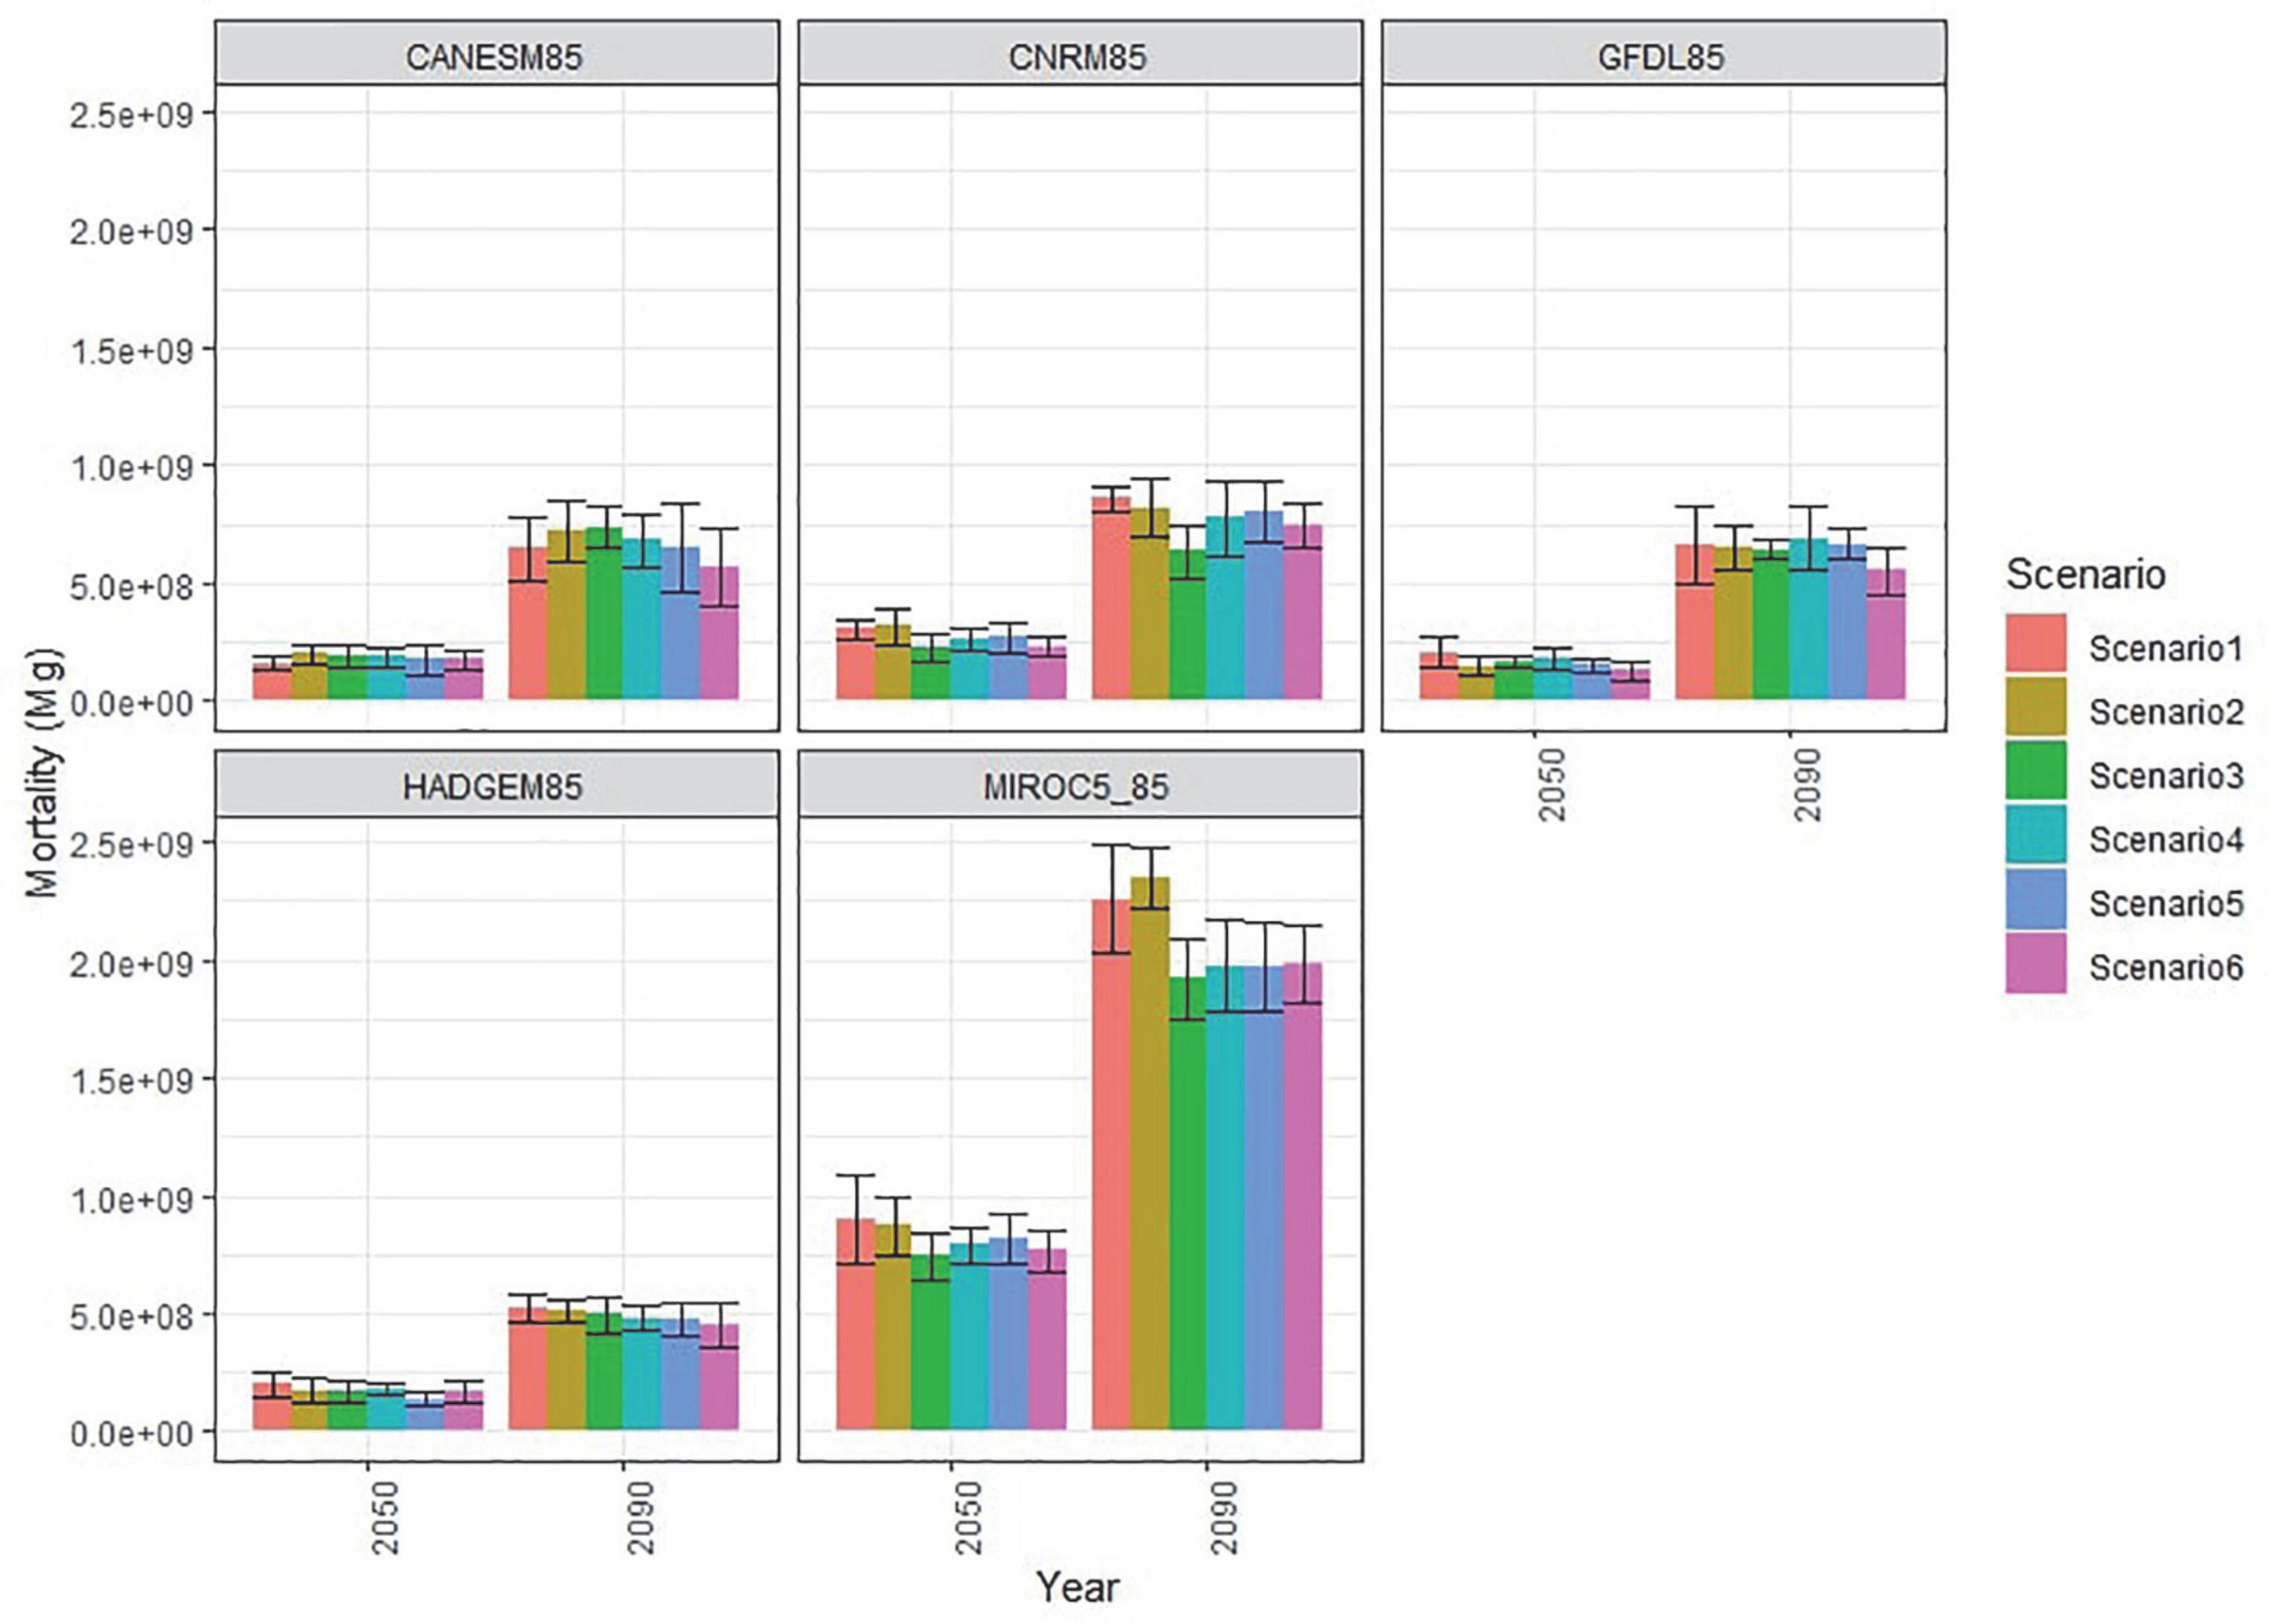
Figure 4. Cumulative fire mortality, in megagrams of biomass, in model years 2050 and 2090. Error bars represent ±1 standard deviation among the model replicates.
Simulated forest composition change was substantial and rapid due to disturbance and climate change. Most of the insects we modeled have various species of the genus Pinus as their preferred host, and because of the high mortality rate from these insects, other tree species from within the Sierran mixed conifer forest type (Douglas-fir, incense-cedar) that were already extant in those cells became the dominant tree species in outbreak-prone areas (Figure 5 and Supplementary Appendix 1; Supplementary Figure 8). At higher elevations, tree species such as mountain hemlock and red fir declined due to reduced regeneration as they were no longer in their ideal climate envelope by the end of the century (Supplementary Appendix 1; Supplementary Figure 9) but this was balanced by upslope movement of the mixed conifer type by end of century (Supplementary Appendix 1; Supplementary Figure 10). Tree cover was generally maintained as a result—only a small percentage of cells in the modeled forested landscape converted to non-forested (shrub dominated)—and mainly in areas that had experienced high severity fire rather than insect mortality (Figure 5). For historic climate projected into the future, there was a 2% increase in non-forested area after 30 years (from 2% of the landscape to 4%). For the non-MIROC5 future climate projections, there was a 4–6% increase, depending on management scenario by end-of-century. And for the MIROC5 climate projection, there was an 8% increase of non-forested area.
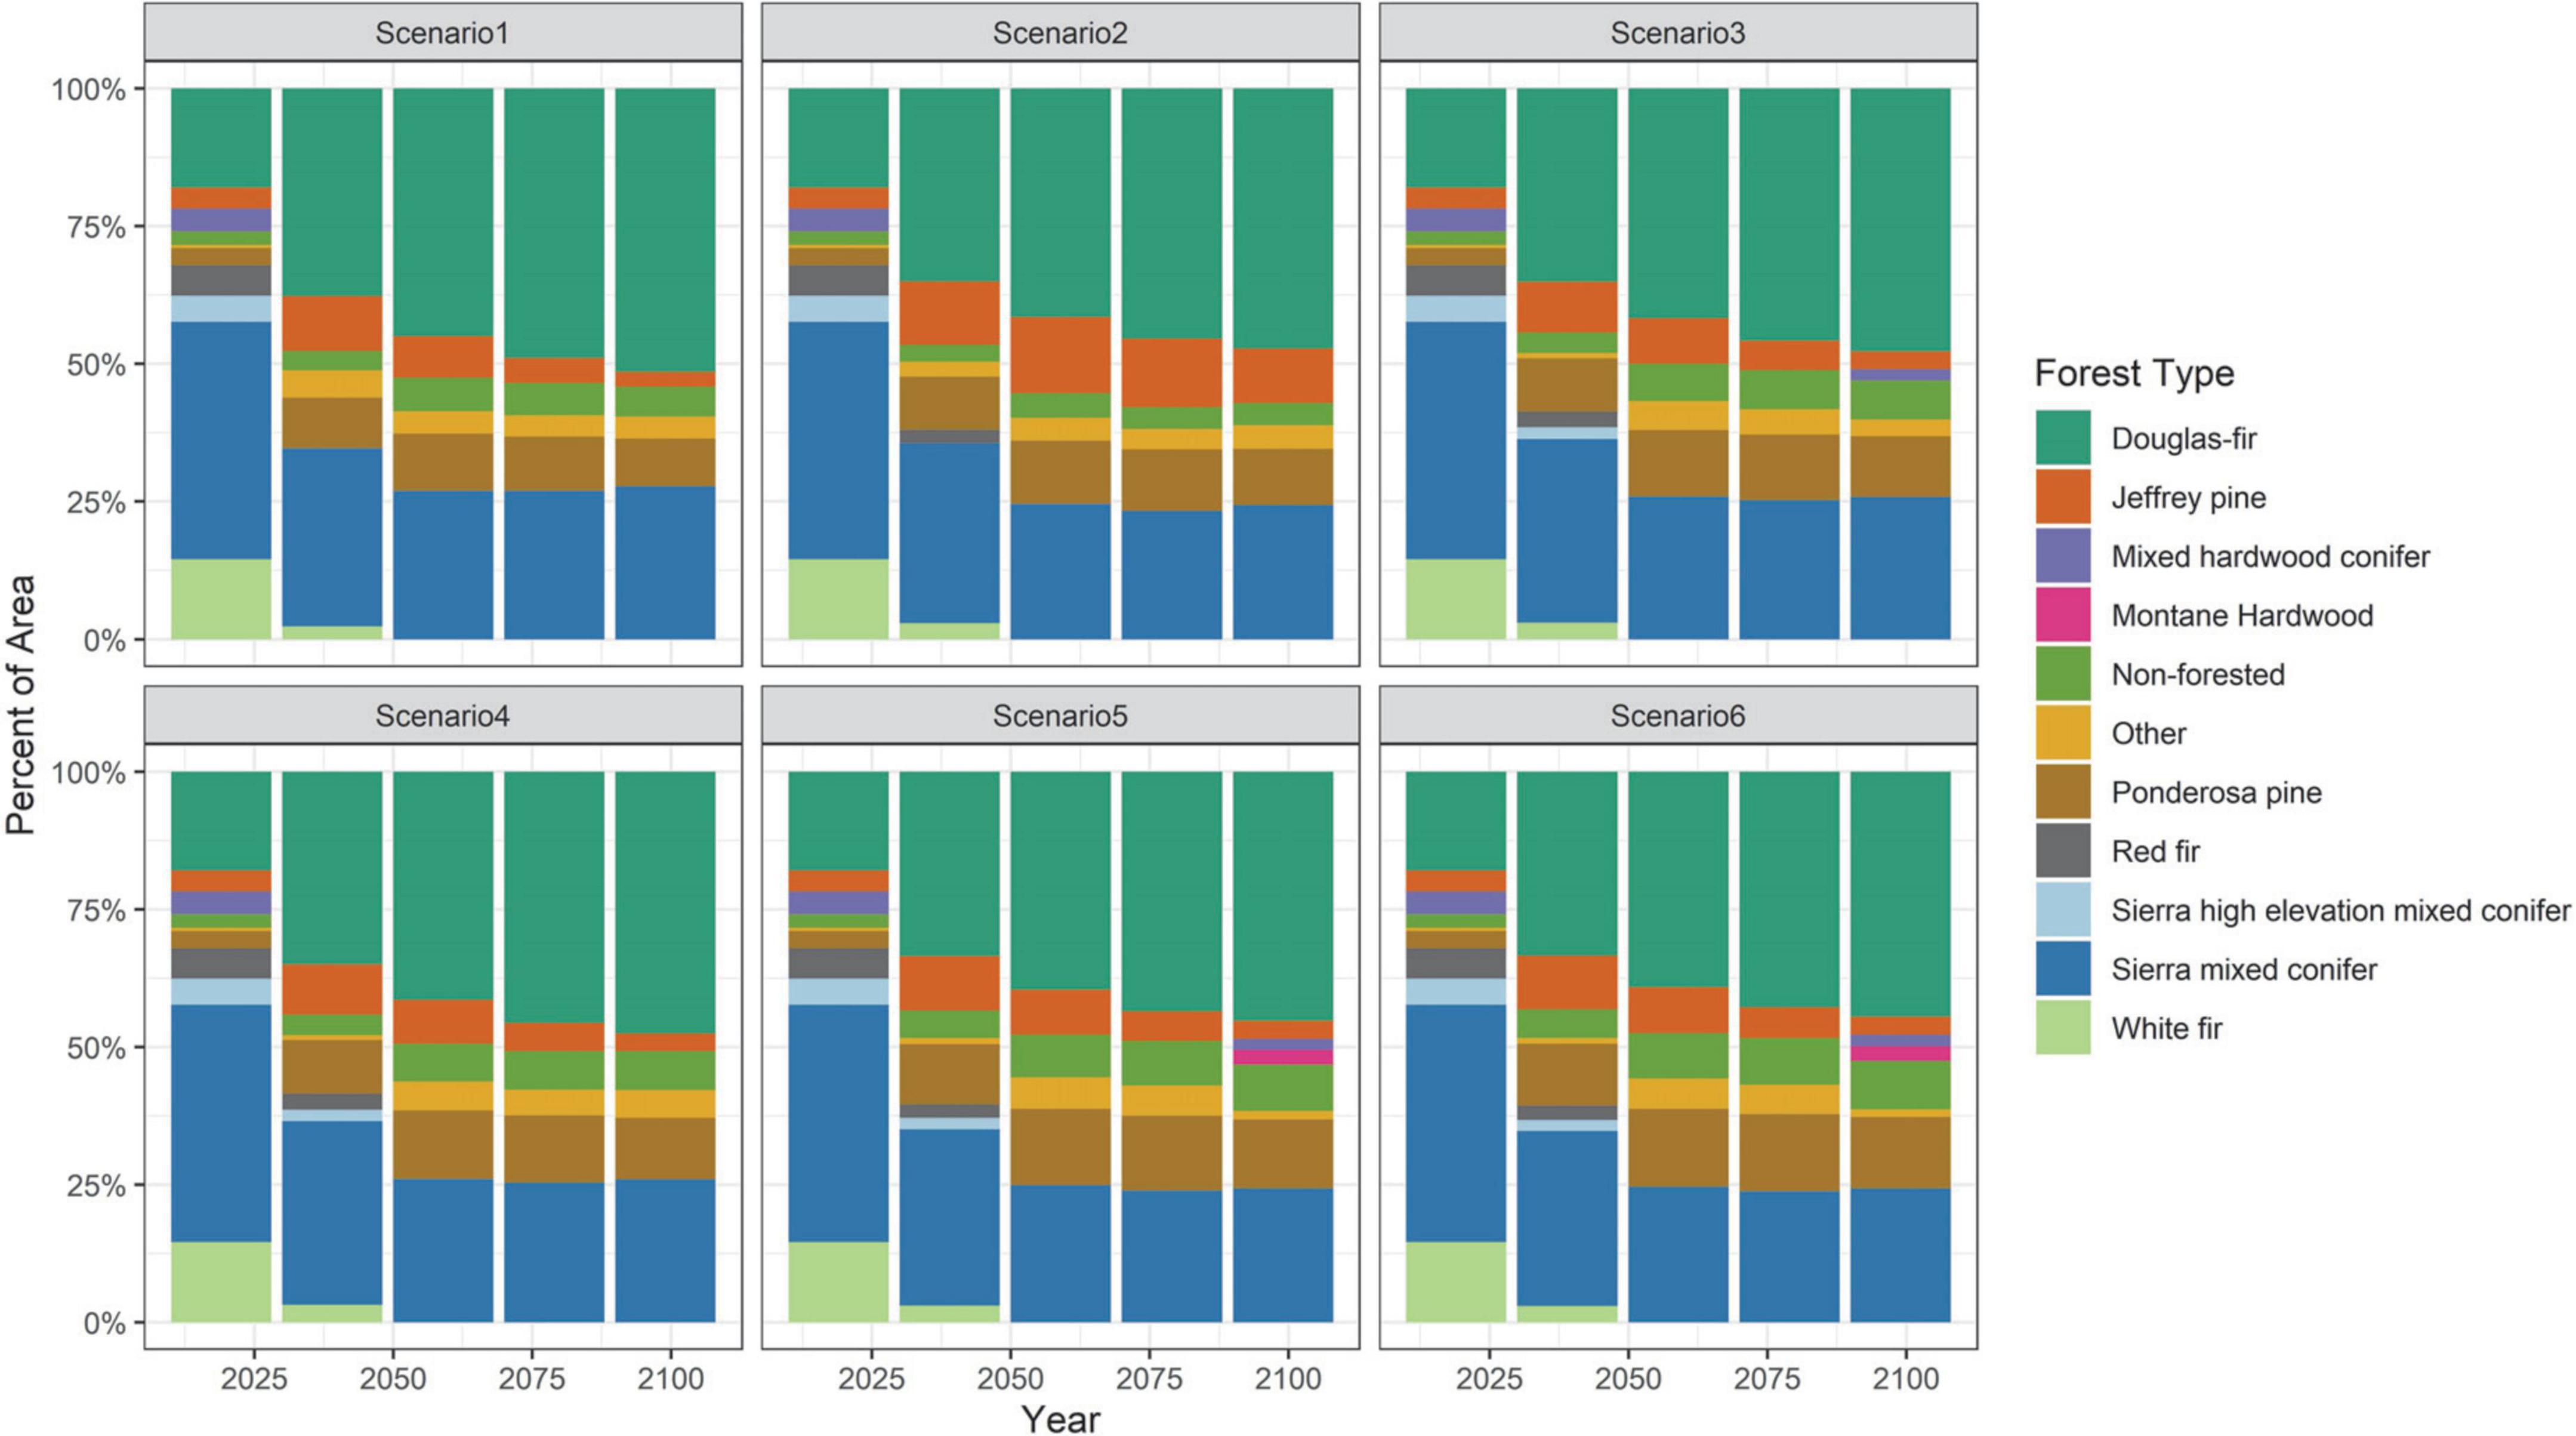
Figure 5. Percent cover for the dominant forest types by management scenario using all replicates averaged across all climate projections.
In spite of the compositional shift of forest cover, the total amount of carbon in the forest remained relatively stable across the duration of our simulations, except for a modest decline under the MIROC5 projection (Figures 6, 7). With prescribed fire being the central treatment in Scenario 6, and prescribed fire removing more down and dead material, Scenario 6 maintained less total C overall compared to the other management scenarios. Nevertheless, the landscape switched from being a moderate carbon sink in 2020 to becoming a carbon source by year 2050, regardless of management scenario.
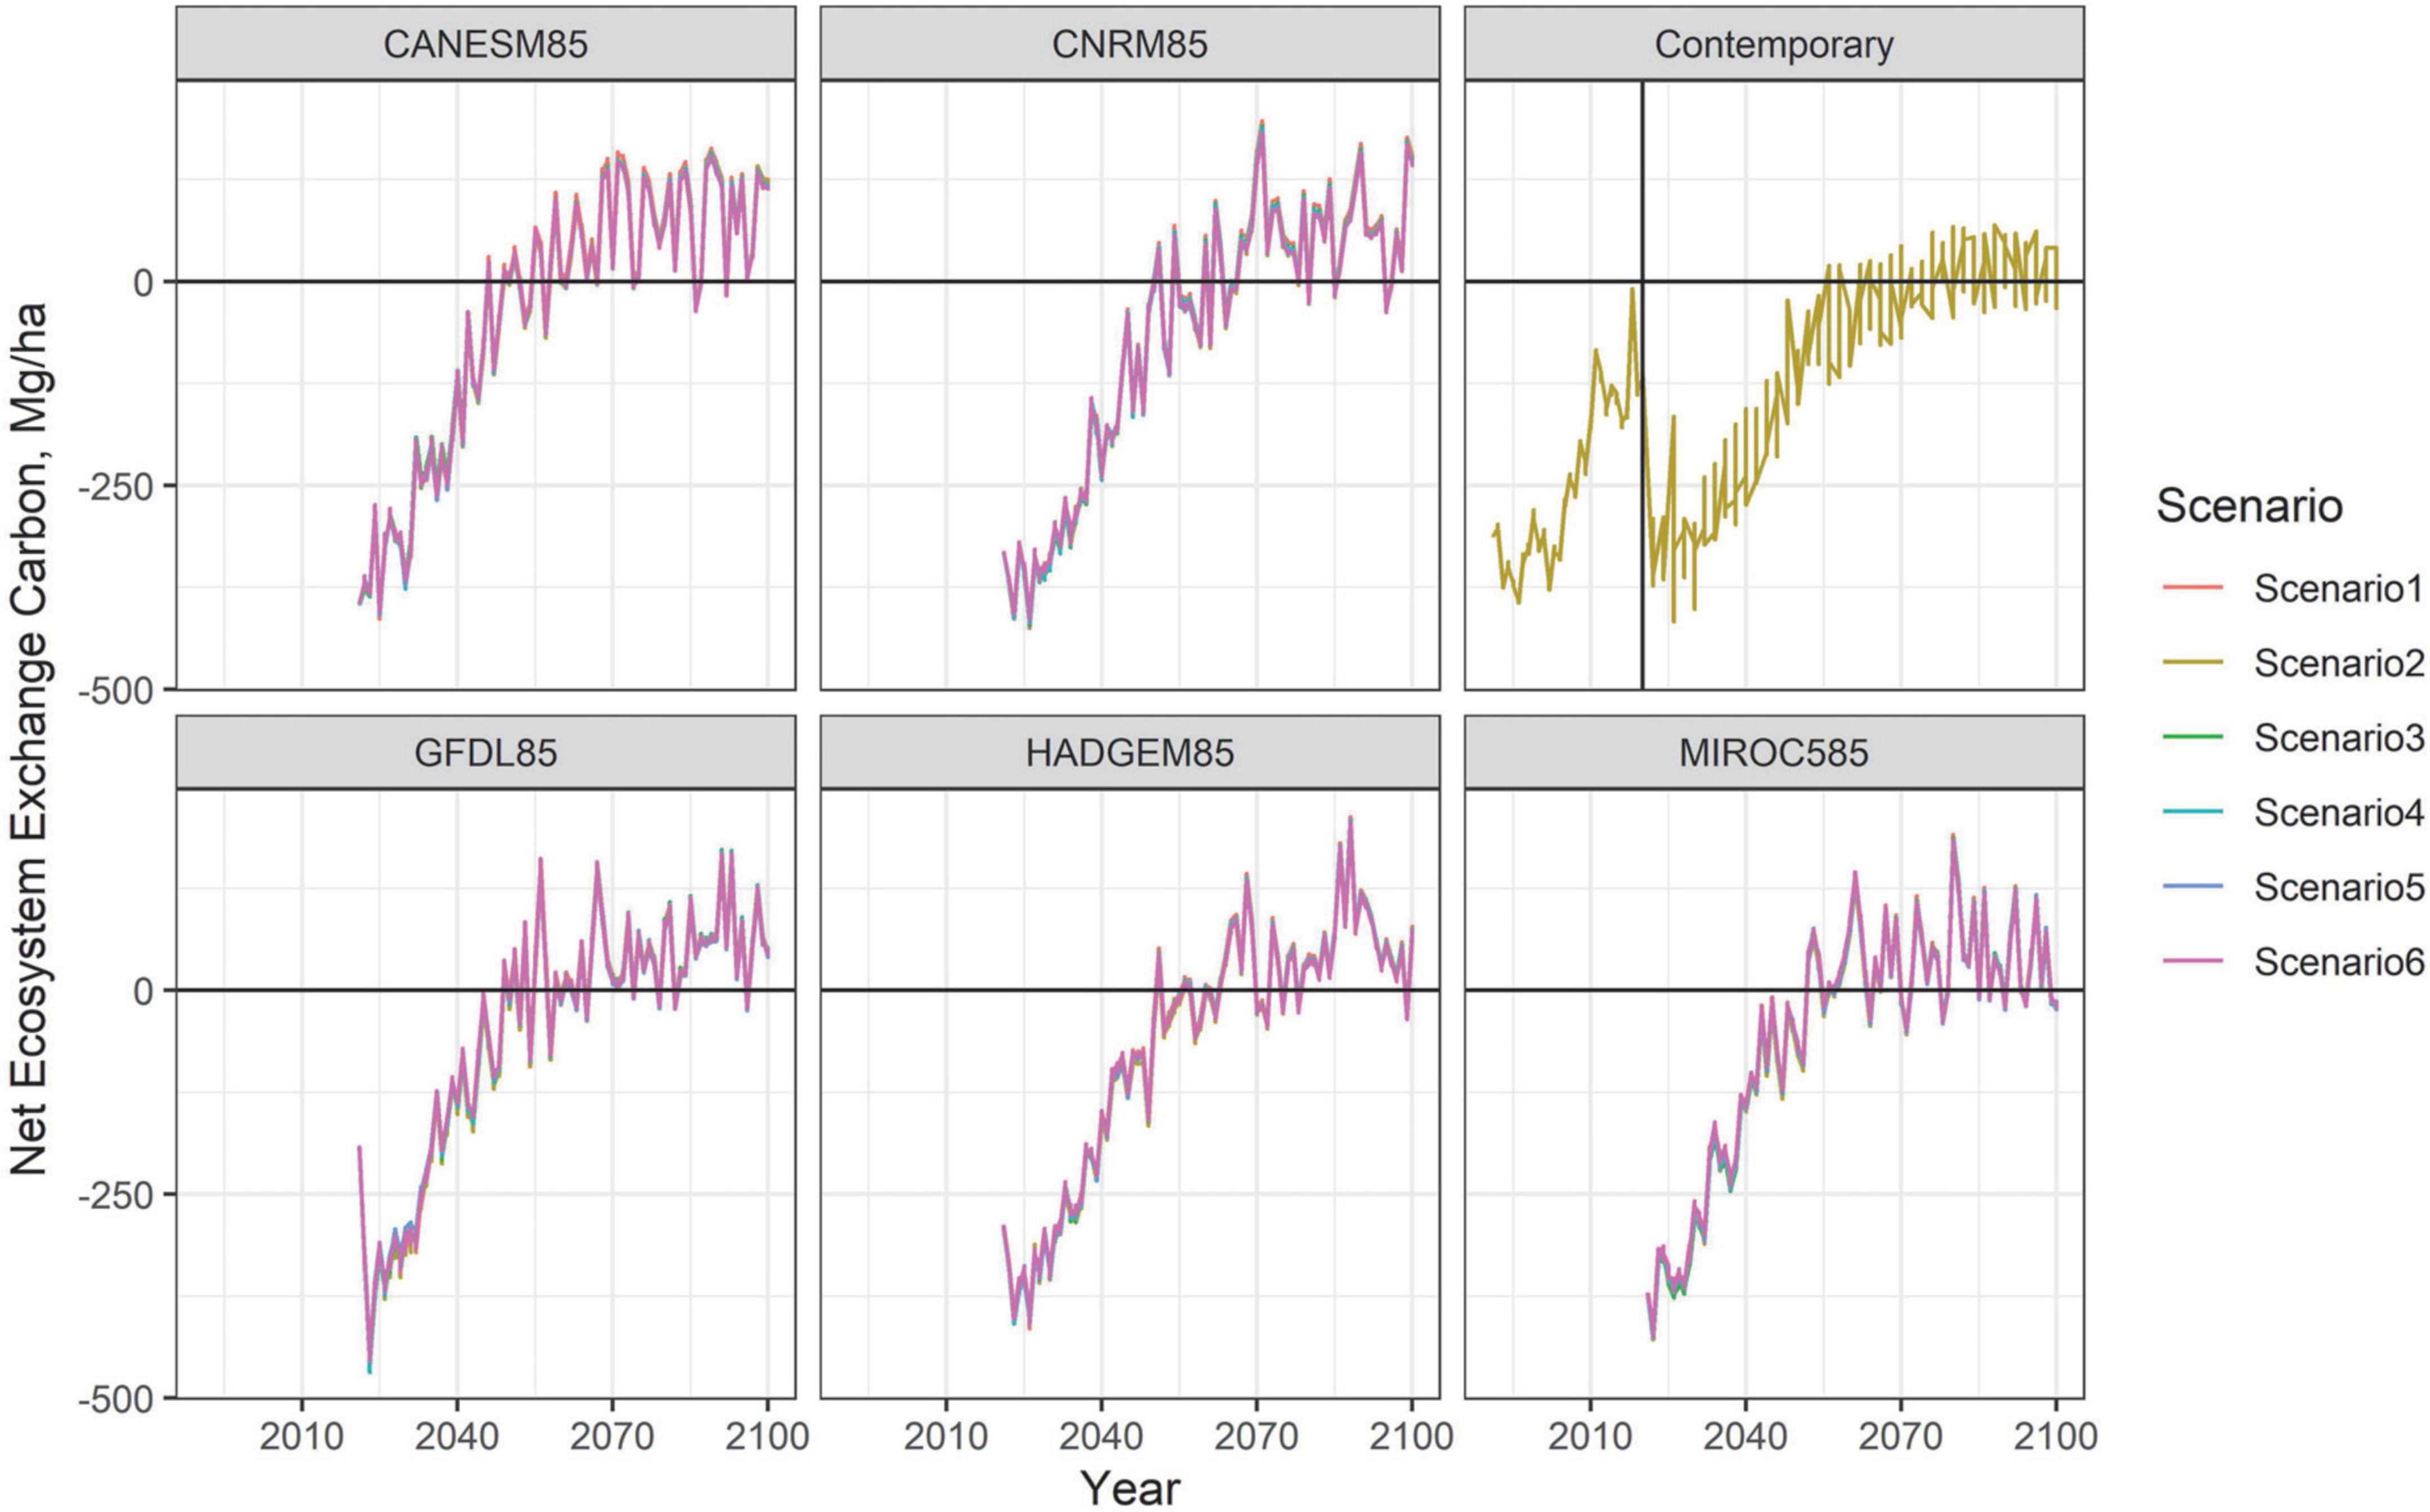
Figure 6. Carbon: Net Ecosystem Exchange averaged across model replicates by climate projection and management scenario.
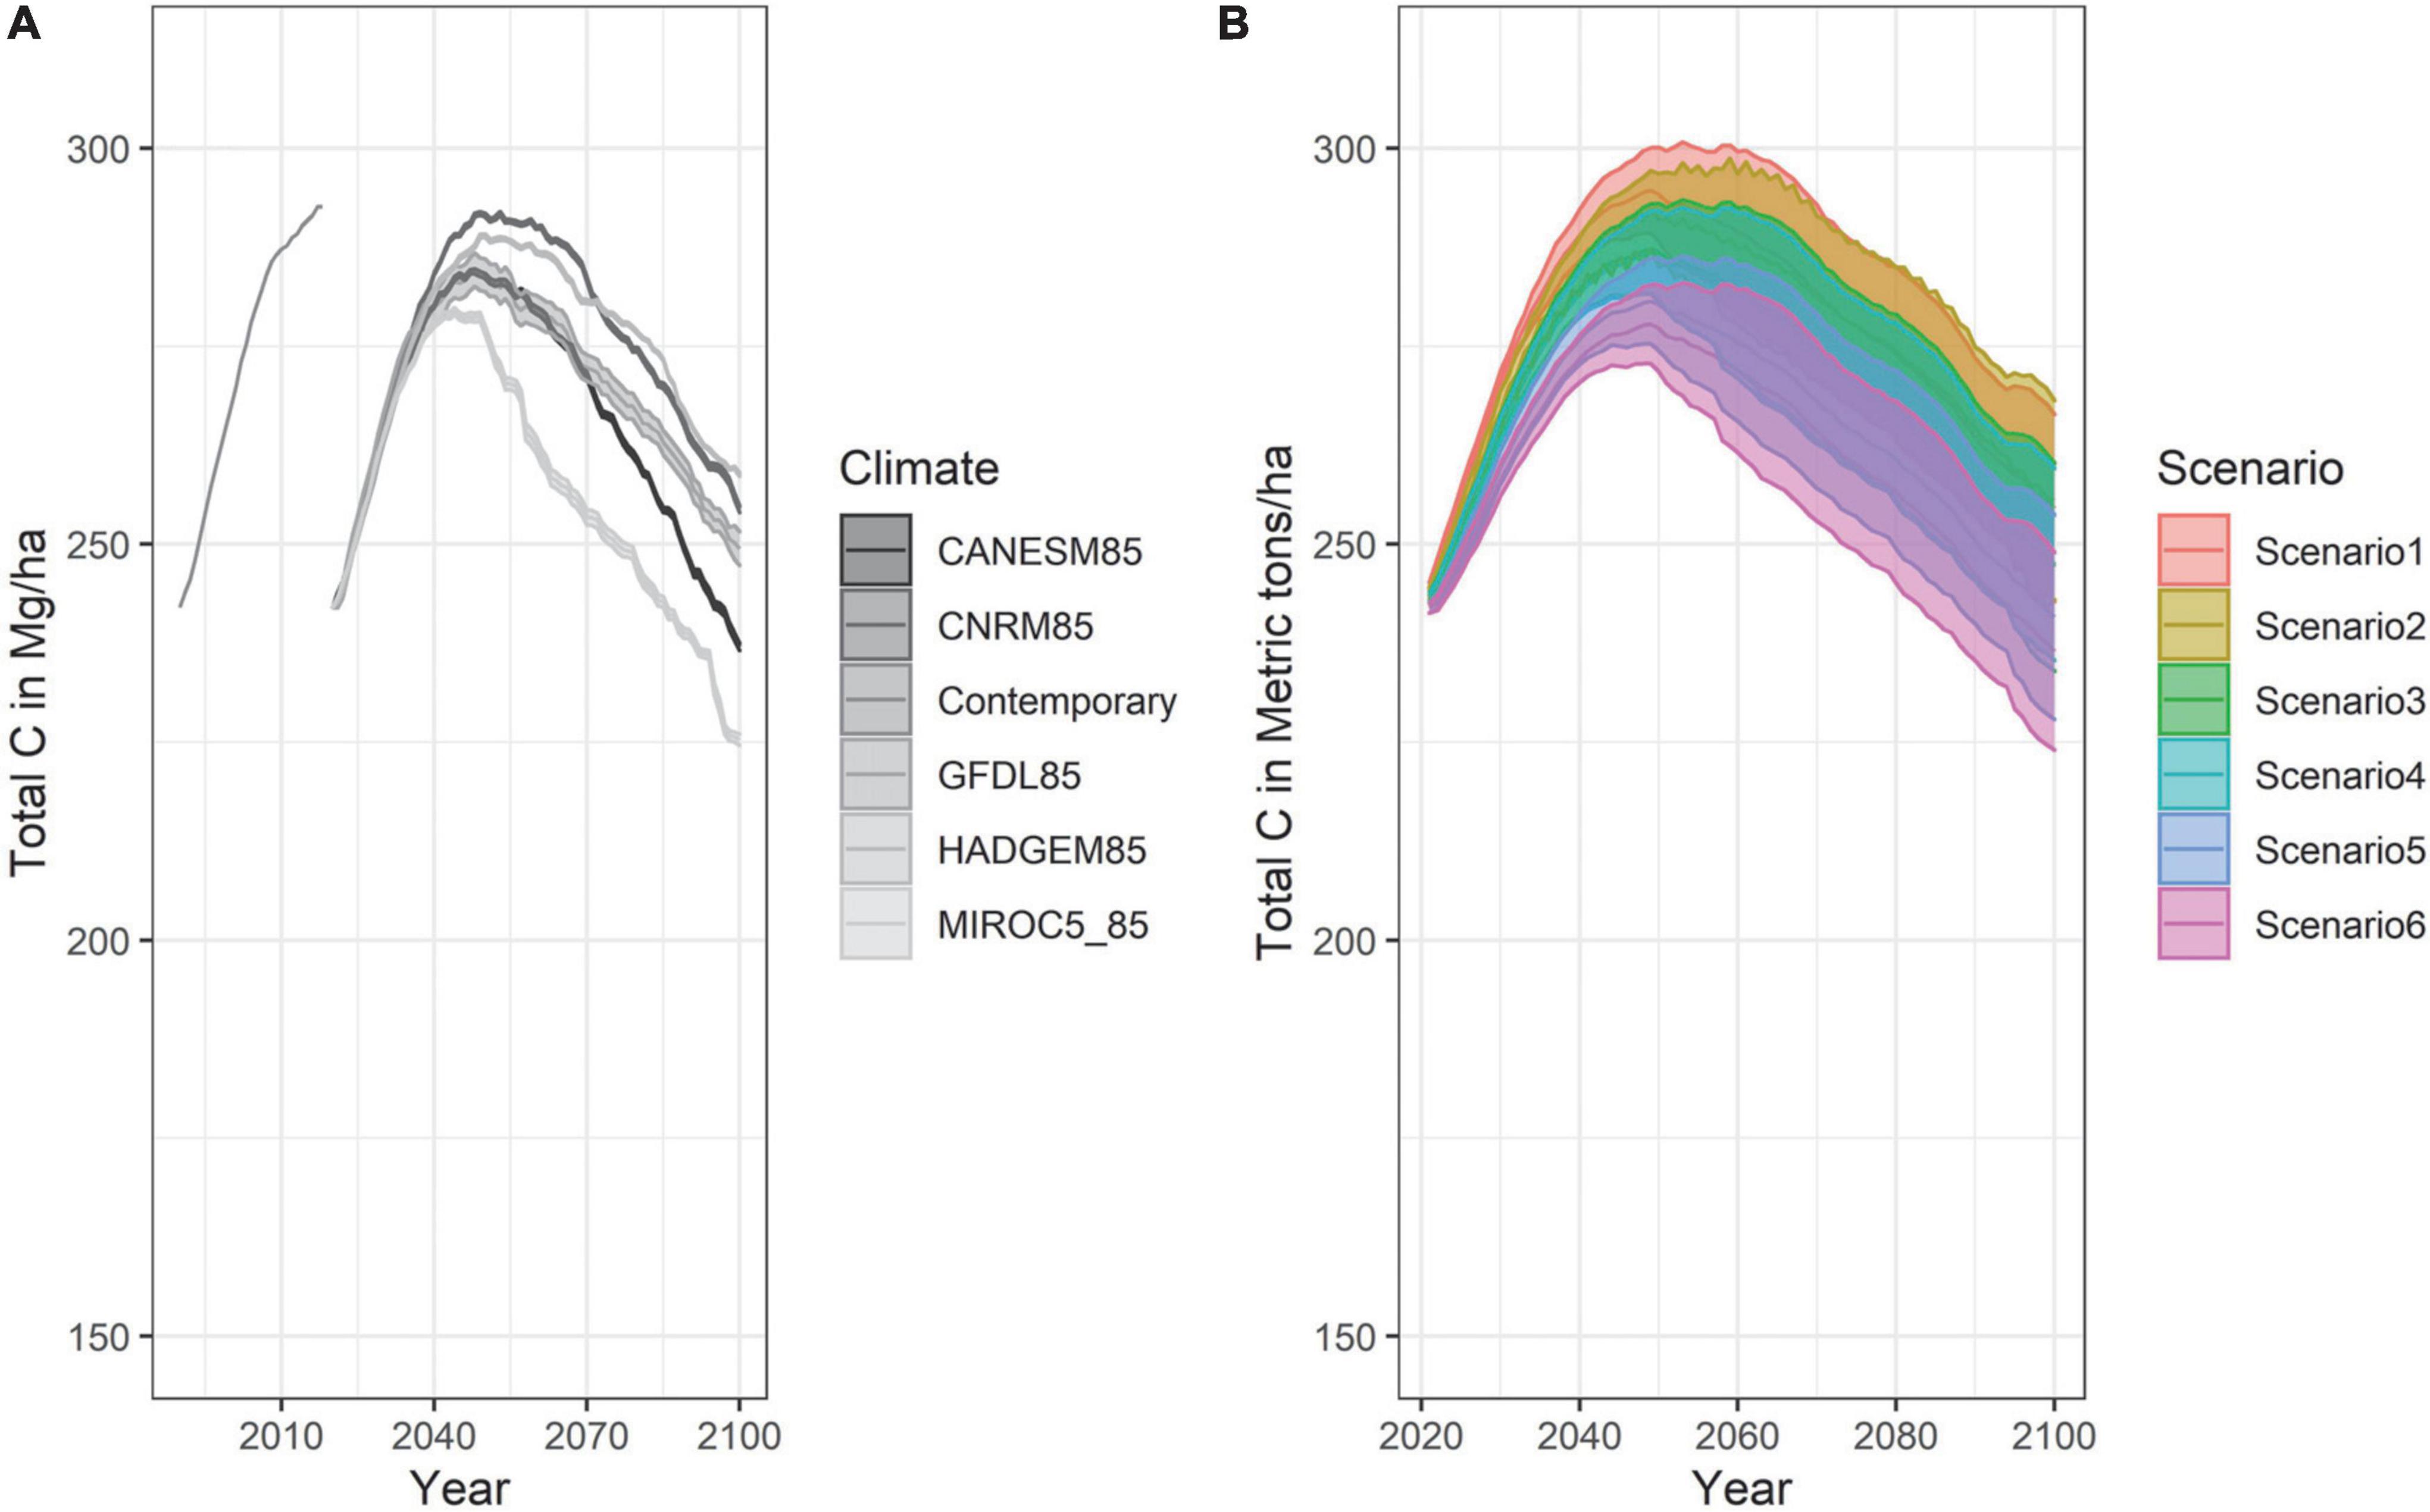
Figure 7. Total Carbon in Mg ha– 1 for all scenarios averaged across climate projection (A) and for all climates averaged across management scenarios (B).
Discussion
We hypothesized that mimicking the historic fire-return interval by combining natural disturbances (wildfire) and management (i.e., thinning and prescribed fire) will maintain forest resilience despite a changing climate. We assessed our hypothesis by tracking: (1) tree mortality due to wildfire, (2) tree mortality caused by insect outbreaks, (3) carbon storage and sequestration, and (4) the maintenance of tree cover.
Our simulations show that tree mortality due to wildfire can be reduced by management, particularly under more extreme weather conditions, as expressed by MIROC5. Under this climate future, Scenarios 3 and 4 reduced tree mortality and this reduction exceeded the mortality generated by management itself, while Scenario 5 was a more even substitution of mortality agents and Scenario 6 had a net increase in mortality due to higher mortality associated with prescribed fires over thinning. The other climate scenarios generally did not show a strong effect of management. Our MIROC5 results are consistent with prior research that suggested that fuels management would become more effective as with climate change due to more frequent intersections between wildfire and treated areas (Syphard et al., 2011; Loudermilk et al., 2014).
Our simulations further suggest that insect mortality was not substantially affected by management as was simulated. Regardless of management scenario, and with little variation among climate futures, our simulations indicate that insect mortality will become the dominant disturbance agent over the next century. While these treatments were in line with current levels of removal, treatments specifically designed to mitigate wildfire hazard may not confer drought or insect resistance. Modeling the impact of more aggressive treatments to reduce insect mortality by thinning the overstory, up to 75% rather than the ∼20% currently in the model (Fettig et al., 2007), and intentionally creating structural forest diversity over large areas (Fettig et al., 2012) with greater biomass removed per hectare could provide insights into how management may affect insect mortality.
Carbon storage in this landscape will be limited by the frequency, severity, and type of future disturbances as well as the potential interactions among disturbances. While forest management activities can offset the potential C losses from wildfire (Liang et al., 2017), the high levels of projected insect mortality are not offset by the simulated management activities (Figure 3). Unlike fire, where C is released through combustion, the dead materials resulting from insect outbreaks remain in the forest until they decompose, though it is at risk of combustion at a later point. The timing of fire after the insect disturbance is important. Meigs et al. (2016) found that fire mortality eventually declined due to reductions in the live vegetation that was susceptible to fire, though this effect was most pronounced several years after fire, while Hart et al. (2015) found negligible links between insect mortality and fire area. This process of insect mortality offsetting future fire mortality might explain why C stocks were able to increase even under the MIROC5 projection through 2040. Later in our simulations, as the effects of climate change intensify in the latter half of the century, C stocks declined as disturbances increased (Figure 6).
Finally, our hypothesis that forest management would increase the retention of tree cover was not confirmed. Although there has been concern over the possible loss of forest to shrub or grassland due to large high severity fire events (Serra-Diaz et al., 2018; Coop et al., 2020), we found only a limited area of conversion from forest to shrub (Figure 5). This has been noted in certain environments due to large patches of high severity fire and the climatic conditions post-fire that limit successful establishment (Harvey et al., 2016; Coop et al., 2020). Such conversions were not found in our results at scale (Figure 5), mainly because of the limited increase in proportion of high severity fire within the model. Although our wildfire sub-model simulated large, high-severity fires under the MIROC5 projection, in aggregate they were not a large driver of forest conversion. Because insect outbreaks are the dominant mortality agent into the future but do not result in 100% mortality, the remaining understory allowed for the maintenance of forest cover and depending on the dominant species and presence of remaining adult trees after a wildfire or insect outbreak, such as yellow pines in the Sierra Nevada, the potential for a drought induced forest conversion to shrubland (Young et al., 2019) may be limited.
Climate change will drive direct and indirect substantial changes to forest composition and structure. It may not be possible to maintain the forest as we know it today (Schoennagel et al., 2017). Fettig et al. (2019) found in the southern Sierras that, after the insect outbreaks in response to the 2012–2015 drought, there was a shift in the understory competition toward more shade tolerant species in mixed conifer stands, similar to our findings of a transition from mixed conifer to increasing dominance by Douglas-fir at low to mid-elevations (Figure 5). This trend also reflects historical trends based on climate envelope modeling: from 1930–1996 a 240,800-hectare area within the study area increased in cover of Douglas-fir, hardwoods, and grassland, while upper elevation conifers decreased (Thorne et al., 2008); and from 2001 to 2018, Douglas-fir saw an increase in population expansion within the Sierra Nevada (Stanke et al., 2021). In looking at potential future climate refugia, Thorne et al. (2020) found that 27% of Douglas-fir forest in Sierra Nevada was within a climate refugia compared to just 2% of red fir. This decline in red fir and other montane species is reflected in our findings (Figure 5) and moving upslope to occupy that space were primarily Douglas-fir and other components of the Sierra mixed conifer forest type.
Study limitations
There may be an interaction between insect mortality and future wildfire that is not sufficiently understood (or represented within our forecasting framework) given the recent occurrence of the mass insect outbreaks. Because of the high levels of mortality and the large pulse of fine and coarse materials onto the forest floor, this may result in landscape-scale fire severity that vastly exceeds the historical record. With large enough fuel loadings over a large enough area, it is possible to develop mass fires, which result in fires that have complicated spread patterns and extreme growth that are not predictable with existing Rothermel based fire models (Stephens et al., 2018).
Given the high levels of variation in the past three decades in fire weather for the region and its relative stability under the future climate projections (Supplementary Appendix 1; Supplementary Figure 3), there is a question of whether these downscaled future projections adequately reflect the rate that climate is changing in California. California is currently in a megadrought and in the past 20 years has been the driest it has been since 800 CE, with the drought likely persisting beyond 2021 (Williams et al., 2022). Only the MIROC projection contained drought events (at mid-century) that are close to the ongoing drought conditions in the state, and so model results with that particular projection are going to be the most informative to present landscape management.
In addition to potential limitations of climate projections, calibrating the wildfire model to the TCSI region and the 1990–2018 period likely did not capture recent fire trends in the State of California from 2019 to 2021 and so may underestimate annual area burned. Ultimately, novel and uncertain future climatic conditions make it challenging to predict future forests and conditions (Scheller, 2018). As such it is important for forest managers to implement treatments that maintain and enhance tree species richness over as wide a range as possible, including moving species outside existing or even historical distributions where appropriate, as well as conserving old trees and spatial heterogeneity as a hedge against such uncertainty (Knapp et al., 2020).
Recommendations for improving forest management
Our results suggest that the management scenarios we modeled that go beyond the business-as-usual annual treatment area could reduce tree mortality from fire if they reached across the entire landscape beyond the WUI and highlight the potential for beetle-caused mortality in the future. As such, management activity on the landscape may need to be far more intensive than what was modeled here based on the historic fire interval in order to build resilience (North et al., 2022). The range of management we tested has only a minor effect relative to the indirect effects of climate on insect outbreaks. Variation among climate projections obfuscated whatever tangible differences may result from the management actions tested. The Sierra Nevada is a highly stochastic system (Scheller et al., 2011b) with large mega-fires resulting from unpredictable combinations of fuel moisture, topography, and wind speeds. Although management may be highly effective locally and in the near-term, at the landscape-scale and at long durations, these positive outcomes may be obfuscated by the long-term trajectories generated by climate change.
Finally, our results suggest that forest carbon storage and forest cover could be resilient despite climate change. The spatial reallocation of forest types is one of the primary climate adaptive capacities of forests and future management activities should consider facilitating this transformation through reforestation practices that promote more climate tolerant species in greater diversity in order to maintain long-term functioning (Millar et al., 2007; Folke et al., 2010; McWethy et al., 2019). Such adaptation actions are expected be more effective at mid- to high-elevations where species were already moving upslope; however, at low elevations, a trend toward less diverse forests seems likely due to pressures exerted by bark beetles. In the instances that occurred, at low and mid-elevations, conversion to shrub and chaparral types may be unavoidable for areas that eventually do experience high severity fire.
Data availability statement
The datasets presented in this study can be found in online repositories. The names of the repository/repositories and accession number(s) can be found below: https://github.com/LANDIS-II-Foundation/Project-Tahoe-Central-Sierra-2019 and archived through zenodo at: doi: 10.5281/zenodo.7199459.
Author contributions
RS designed the model. CM implemented the simulations and took the lead in writing the manuscript. CM and KW analyzed the data. All authors provided critical feedback and helped shape the research, analysis, and manuscript.
Funding
This research was funded by a grant from an anonymous foundation.
Conflict of interest
The authors declare that the research was conducted in the absence of any commercial or financial relationships that could be construed as a potential conflict of interest.
Publisher’s note
All claims expressed in this article are solely those of the authors and do not necessarily represent those of their affiliated organizations, or those of the publisher, the editors and the reviewers. Any product that may be evaluated in this article, or claim that may be made by its manufacturer, is not guaranteed or endorsed by the publisher.
Supplementary material
The Supplementary Material for this article can be found online at: https://www.frontiersin.org/articles/10.3389/ffgc.2022.740869/full#supplementary-material
Footnotes
References
Abatzoglou, J. T. (2013). Development of gridded surface meteorological data for ecological applications and modelling. Int. J. Climatol. 33, 121–131.
Abatzoglou, J. T., and Brown, T. J. (2012). A comparison of statistical downscaling methods suited for wildfire applications. Int. J. Climatol. 32, 772–780. doi: 10.1002/joc.2312
Burns, R. M., and Honkala, B. H. (1990). “Silvics of North America: Volume 1 Conifers,” in United States Department of Agriculture (USDA), Forest Service, Agriculture Handbook, (Washington, D.C) 654.
Cansler, C. A., Hood, S. M., Varner, J. M., van Mantgem, P. J., Agne, M. C., Andrus, R. A., et al. (2020). The Fire and Tree Mortality Database, for empirical modeling of individual tree mortality after fire. Sci. Data 7:194. doi: 10.1038/s41597-020-0522-7
Coop, J. D., Parks, S. A., Stevens-Rumann, C. S., Crausbay, S. D., Higuera, P. E., Hurteau, M. D., et al. (2020). Wildfire-driven forest conversion in western North American landscapes. BioScience 70, 659–673. doi: 10.1093/biosci/biaa061
Crockett, J. L., and Westerling, A. L. (2018). Greater temperature and precipitation extremes intensify Western US droughts, wildfire severity, and Sierra Nevada tree mortality. J. Climate 31, 341–354. doi: 10.1175/JCLI-D-17-0254.1
Department of Water Resources [DWR] (2015). Perspectives and Guidance for Climate Change Analysis. Sacramento, CA: Department of Water Resources.
Dewitz, J., and U. S. Geological Survey (2021). National land cover database (NLCD) 2019 products (ver. 2.0, June 2021): U.S. Geological Survey data release. doi: 10.5066/P9KZCM54
Diffenbaugh, N. S., Swain, D. L., and Touma, D. (2015). Anthropogenic warming has increased drought risk in California. Proc. Natl. Acad. Sci. U.S.A. 112, 3931–3936. doi: 10.1073/pnas.1422385112
Eidenshink, J., Schwind, B., Brewer, K., Zhu, Z. L., Quayle, B., and Howard, S. (2007). A project for monitoring trends in burn severity. Fire Ecol. 3, 3–21. doi: 10.4996/fireecology.0301003
Fettig, C. J., Hayes, C. J., Jones, K. J., Mckelvey, S. R., Mori, S. L., and Smith, S. L. (2012). Thinning Jeffrey pine stands to reduce susceptibility to bark beetle infestations in California. USA. Agricult. For. Entomol. 14, 111–117. doi: 10.1111/j.1461-9563.2011.00543.x
Fettig, C. J., Klepzig, K. D., Billings, R. F., Munson, A. S., Nebeker, T. E., Negrón, J. F., et al. (2007). The effectiveness of vegetation management practices for prevention and control of bark beetle infestations in coniferous forests of the western and southern United States. For. Ecol. Manag. 238, 24–53. doi: 10.1016/j.foreco.2006.10.011
Fettig, C. J., Mortenson, L. A., Bulaon, B. M., and Foulk, P. B. (2019). Tree mortality following drought in the central and southern Sierra Nevada, California, US. For. Ecol. Manag. 432, 164–178. doi: 10.1016/j.foreco.2018.09.006
Folke, C., Carpenter, S. R., Walker, B., Scheffer, M., Chapin, T., and Rockström, J. (2010). Resilience thinking: Integrating resilience, adaptability and transformability. Ecol. Soc. 15:art20. doi: 10.5751/ES-03610-150420
Hart, S. J., Schoennagel, T., Veblen, T. T., and Chapman, T. B. (2015). Area burned in the western United States is unaffected by recent mountain pine beetle outbreaks. Proc. Natl. Acad. Sci. 112, 4375–4380. doi: 10.1073/pnas.1424037112
Harvey, B. J., Donato, D. C., and Turner, M. G. (2016). High and dry: Post-fire tree seedling establishment in subalpine forests decreases with post-fire drought and large stand-replacing burn patches. Glob. Ecol. Biogeogr. 25, 655–669. doi: 10.1111/geb.12443
Hessburg, P. F., Miller, C. L., Parks, S. A., Povak, N. A., Taylor, A. H., Higuera, P. E., et al. (2019). Climate, environment, and disturbance history govern resilience of western North American forests. Front. Ecol. Evol. 7:239. doi: 10.3389/fevo.2019.00239
Jeronimo, S. M., Kane, V. R., Churchill, D. J., Lutz, J. A., North, M. P., Asner, G. P., et al. (2019). Forest structure and pattern vary by climate and landform across active-fire landscapes in the montane Sierra Nevada. For. Ecol. Manage. 437, 70–86. doi: 10.1016/j.foreco.2019.01.033
Johnstone, J. F., Allen, C. D., Franklin, J. F., Frelich, L. E., Harvey, B. J., Higuera, P. E., et al. (2016). Changing disturbance regimes, ecological memory, and forest resilience. Front. Ecol. Environ. 14, 369–378. doi: 10.1002/fee.1311
Keeley, J. E., and Syphard, A. D. (2019). Twenty-first century California, USA, wildfires: Fuel-dominated vs. wind-dominated fires. Fire Ecol. 15:24. doi: 10.1186/s42408-019-0041-0
Kimball, J. S., Jones, L. A., Endsley, A., Kundig, T., and Reichle, R. (2021). SMAP L4 Global Daily 9 km EASE-Grid Carbon Net Ecosystem Exchange, Version 6. Boulder, Colorado USA. Boulder, CO: NSIDC DAAC, doi: 10.5067/L6C9EY1O8VIC
Knapp, E. E., Bernal, A. A., Kane, J. M., Fettig, C. J., and North, M. P. (2020). Variable thinning and prescribed fire influence tree mortality and growth during and after a severe drought. For. Ecol. Manag. 479:118595. doi: 10.1016/j.foreco.2020.118595
Liang, S., Hurteau, M. D., and Westerling, A. L. (2017). Response of Sierra Nevada forests to projected climate–wildfire interactions. Glob. Chan. Biol. 23, 2016–2030. doi: 10.1111/gcb.13544
Liang, S., Hurteau, M. D., and Westerling, A. L. (2018). Large-scale restoration increases carbon stability under projected climate and wildfire regimes. Front. Ecol. Environ. 16:207–212.
Loudermilk, E. L., Scheller, R. M., Weisberg, P. J., and Kretchun, A. (2017). Bending the carbon curve: Fire management for carbon resilience under climate change. Land. Ecol. 32, 1461–1472. doi: 10.1007/s10980-016-0447-x
Loudermilk, E. L., Stanton, A., Scheller, R. M., Dilts, T. E., Weisberg, P. J., Skinner, C., et al. (2014). Effectiveness of fuel treatments for mitigating wildfire risk and sequestering forest carbon: A case study in the Lake Tahoe Basin. For. Ecol. Manag. 323, 114–125. doi: 10.1016/j.foreco.2014.03.011
McWethy, D. B., Schoennagel, T., Higuera, P. E., Krawchuk, M., Harvey, B. J., Metcalf, E. C., et al. (2019). Rethinking resilience to wildfire. Nat. Sustain. 2, 797–804. doi: 10.1038/s41893-019-0353-8
Meigs, G. W., Zald, H. S., Campbell, J. L., Keeton, W. S., and Kennedy, R. E. (2016). Do insect outbreaks reduce the severity of subsequent forest fires? Environ. Res. Lett. 11:045008. doi: 10.1088/1748-9326/11/4/045008
Millar, C. I., Stephenson, N. L., and Stephens, S. L. (2007). Climate change and forests of the future: Managing in the face of uncertainty. Ecol. Appl. 17, 2145–2151. doi: 10.1890/06-1715.1
North, M. P., Tompkins, R. E., Bernal, A. A., Collins, B. M., Stephens, S. L., and York, R. A. (2022). Operational resilience in western US frequent-fire forests. For. Ecol. Manag. 507:120004. doi: 10.1016/j.foreco.2021.120004
North, M., Collins, B. M., and Stephens, S. (2012). Using fire to increase the scale, benefits, and future maintenance of fuels treatments. J. For. 110, 392–401. doi: 10.5849/jof.12-021
ORNL DAAC. (2018). Fixed Sites Subsetting and Visualization Tool. Oak Ridge, TN: ORNL DAAC, doi: 10.3334/ORNLDAAC/1567
Parton, W. J., Stewart, J. W., and Cole, C. V. (1988). Dynamics of C, N, P and S in grassland soils: A model. Biogeochemistry 5, 109–131. doi: 10.1007/BF02180320
Pierce, D. W., Kalansky, J. F., and Cayan, D. R. (2018). Climate, Drought, and Sea Level Rise Scenarios for California’s Fourth Climate Change Assessment. Sacramento, CA: California Energy Commission and California Natural Resources Agency.
Restaino, C., Young, D. J., Estes, B., Gross, S., Wuenschel, A., Meyer, M., et al. (2019). Forest structure and climate mediate drought-induced tree mortality in forests of the Sierra Nevada. USA. Ecol. Appl. 29:e01902. doi: 10.1002/eap.1902
Riley, K. L., Grenfell, I. C., Finney, M. A., and Wiener, J. M. (2021). TreeMap, a tree-level model of conterminous US forests circa 2014 produced by imputation of FIA plot data. Sci. Data 8:11. doi: 10.1038/s41597-020-00782-x
Running, S., and Mu, Q. (2015). MOD17A3 MODIS/Terra Gross Primary Productivity Yearly L4 Global 1km SIN Grid. Sioux Falls: NASA LP DAAC, doi: 10.5067/MODIS/MOD17A3.006
Safford, H. D., and Stevens, J. T. (2017). Natural range of variation for yellow pine and mixed-conifer forests in the Sierra Nevada, southern Cascades, and Modoc and Inyo National Forests, California, USA. Gen. Tech. Rep. PSW-GTR-256. Albany, CA: US Department of Agriculture, 256.
Scheller, R. M. (2018). The challenges of forest modeling given climate change. Land. Ecol. 33, 1481–1488. doi: 10.1007/s10980-018-0689-x
Scheller, R. M., Kretchun, A. M., Loudermilk, E. L., Hurteau, M. D., Weisberg, P. J., and Skinner, C. (2018). Interactions among fuel management, species composition, bark beetles, and climate change and the potential effects on forests of the Lake Tahoe Basin. Ecosystems 21, 643–656.
Scheller, R. M., Hua, D., Bolstad, P. V., Birdsey, R. A., and Mladenoff, D. J. (2011a). The effects of forest harvest intensity in combination with wind disturbance on carbon dynamics in Lake States Mesic Forests. Ecol. Model. 222, 144–153. doi: 10.1016/j.ecolmodel.2010.09.009
Scheller, R. M., Spencer, W. D., Rustigian-Romsos, H., Syphard, A. D., Ward, B. C., and Strittholt, J. R. (2011b). Using stochastic simulation to evaluate competing risks of wildfires and fuels management on an isolated forest carnivore. Land. Ecol. 26, 1491–1504. doi: 10.1007/s10980-011-9663-6
Scheller, R., Kretchun, A., Hawbaker, T. J., and Henne, P. D. (2019). A landscape model of variable social-ecological fire regimes. Ecol. Model. 401, 85–93. doi: 10.1016/j.ecolmodel.2019.03.022
Schoennagel, T., Balch, J. K., Brenkert-Smith, H., Dennison, P. E., Harvey, B. J., Krawchuk, M. A., et al. (2017). Adapt to more wildfire in western North American forests as climate changes. Proc. Natl. Acad. Sci. U.S.A. 114, 4582–4590. doi: 10.1073/pnas.1617464114
Schwalm, C. R., Glendon, S., and Duffy, P. B. (2020). RCP8.5 Tracks cumulative CO2 emissions. Proc. Natl. Acad. Sci. U.S.A. 117, 19656–19657. doi: 10.1073/pnas.2007117117
Serra-Diaz, J. M., Maxwell, C., Lucash, M. S., Scheller, R. M., Laflower, D. M., Miller, A. D., et al. (2018). Disequilibrium of fire-prone forests sets the stage for a rapid decline in conifer dominance during the 21st century. Sci. Rep. 8:6749. doi: 10.1038/s41598-018-24642-2
Sevanto, S., Mcdowell, N. G., Dickman, L. T., Pangle, R., and Pockman, W. T. (2014). How do trees die? A test of the hydraulic failure and carbon starvation hypotheses. Plant Cell Environ. 37, 153–161. doi: 10.1111/pce.12141
Short, K. C. (2021). Spatial wildfire occurrence data for the United States, 1992-2018 [FPA_FOD_20210617], 5th Edn. Fort Collins, CO: Forest Service Research Data Archive, doi: 10.2737/RDS-2013-0009.5
Soil Survey Staff (2017). Gridded National Soil Survey Geographic (gNATSGO) Database for California. Washington DC: United States Department of Agriculture.
Stanke, H., Finley, A. O., Domke, G. M., Weed, A. S., and MacFarlane, D. W. (2021). Over half of western United States’ most abundant tree species in decline. Nat. Commun. 12:451. doi: 10.1038/s41467-020-20678
Stephens, S. L., Collins, B. M., Fettig, C. J., Finney, M. A., Hoffman, C. M., Knapp, E. E., et al. (2018). Drought, tree mortality, and wildfire in forests adapted to frequent fire. BioScience 68, 77–88. doi: 10.1093/biosci/bix146
Sturtevant, B. R., Gustafson, E. J., Li, W., and He, H. S. (2004). Modeling biological disturbances in LANDIS: A module description and demonstration using spruce budworm. Ecol. Model. 180, 153–174. doi: 10.1016/j.ecolmodel.2004.01.021
Syphard, A. D., Scheller, R. M., Ward, B. C., Spencer, W. D., and Strittholt, J. R. (2011). Simulating landscape-scale effects of fuels treatments in the Sierra Nevada, California, USA. Int. J. Wildland Fire 20, 364–383. doi: 10.1071/WF09125
Thorne, J. H., Gogol-Prokurat, M., Hill, S., Walsh, D., Boynton, R. M., and Choe, H. (2020). Vegetation refugia can inform climate-adaptive land management under global warming. Front. Ecol. Environ. 18, 281–287. doi: 10.1002/fee.2208
Thorne, J. H., Morgan, B. J., and Kennedy, J. A. (2008). Vegetation change over sixty years in the Central Sierra Nevada, California, USA. Madrono 55, 223–237. doi: 10.3120/0024-9637-55.3.223
U.S. EPA (2017). Updates To The Demographic And Spatial Allocation Models To Produce Integrated Climate And Land Use Scenarios (Iclus) (Final Report, Version 2). Washington, DC: U.S. Environmental Protection Agency.
van Wagtendonk, J. W., Fites-Kaufman, J. A., Safford, H. D., North, M. P., and Collins, B. (2018). “Sierra Nevada Bioregion,” in Fire in California’s Ecosystems, eds J. W. van Wagtendonk, N. G. Sugihara, S. L. Stephens, A. E. Thode, K. E. Shaffer, and J. A. Fites-Kaufman (Oakland, CA: University of California Press), 249–278.
Westerling, A. L. (2016). Increasing western US forest wildfire activity: Sensitivity to changes in the timing of spring. Philos. Trans. R. Soc. B 371:20150178. doi: 10.1098/rstb.2015.0178
White, P. S., and Jentsch, A. (2001). “The Search for Generality in Studies of Disturbance and Ecosystem Dynamics,” in Progress in Botany, vol 62, eds K. Esser, U. Lüttge, J. W. Kadereit, and W. Beyschlag (Berlin: Springer), doi: 10.1007/978-3-642-56849-7_17
Williams, A. P., Cook, B. I., and Smerdon, J. E. (2022). Rapid intensification of the emerging southwestern North American megadrought in 2020–2021. Nat. Climate Change 12, 232–234.
Wilson, B. T., Woodall, C. W., and Griffith, D. M. (2013). Imputing forest carbon stock estimates from inventory plots to a nationally continuous coverage. Carbon Balance Manag. 8:1. doi: 10.1186/1750-0680-8-1
Keywords: forest ecology, climate change, wildfire, disturbance return interval, insect mortality
Citation: Maxwell CJ, Scheller RM, Wilson KN and Manley PN (2022) Assessing the effectiveness of landscape-scale forest adaptation actions to improve resilience under projected climate change. Front. For. Glob. Change 5:740869. doi: 10.3389/ffgc.2022.740869
Received: 13 July 2021; Accepted: 10 October 2022;
Published: 08 November 2022.
Edited by:
Mark Andrew Adams, Swinburne University of Technology, AustraliaReviewed by:
Mathias Neumann, University of Natural Resources and Life Sciences Vienna, AustriaManfred J. Lexer, University of Natural Resources and Life Sciences Vienna, Austria
Copyright © 2022 Maxwell, Scheller, Wilson and Manley. This is an open-access article distributed under the terms of the Creative Commons Attribution License (CC BY). The use, distribution or reproduction in other forums is permitted, provided the original author(s) and the copyright owner(s) are credited and that the original publication in this journal is cited, in accordance with accepted academic practice. No use, distribution or reproduction is permitted which does not comply with these terms.
*Correspondence: Charles J. Maxwell, Y2hhcmxlc2ptYXh3ZWxsQGdtYWlsLmNvbQ==