 Marius G. Heidenreich
 Dominik Seidel
- Department of Spatial Structures and Digitization of Forests, Georg August University of Göttingen, Göttingen, Germany
The adaptation of forest management to changing environmental conditions due to climate change relies on information on the current forest and tree vitality. In common practice, the percentage of crown defoliation is used as a proxy for tree vitality, an approach that has several drawbacks. By performing laser scanning on a forest plot in the Hainich National Park, we tested a new approach to quantifying tree vitality. Based on the difference in structural complexity measured between summer and winter, assessed via the box-dimension, the new approach provides an objective and reproducible method that does not only allow the quantification of the defoliation, but also includes the effects of branch diebacks. In addition, we assessed the change in box-dimension and branch lengths between 2013 and 2021 and studied the overall structural development of the trees to analyze the alteration of their vitality. On average, we found a decrease in overall structural complexity, as well as in branch lengths for most trees in the investigated forest. Further, the mean difference in box-dimension (summer minus winter) decreased with ascending vitality class. We conclude that the vitality of the trees was negatively affected over the period of 8 years, and we argue the newly proposed method based on the box-dimension holds potential to be used as a measure for tree vitality in deciduous forests.
Introduction
Forest management traditionally has been based on the assumption that site conditions are more or less constant (Brang et al., 2014). With climate change, site conditions and hence tree growth and vitality are affected, and this prevailing silvicultural assumption no longer appears to be suitable (e.g., Brang et al., 2014). With changing precipitation patterns, increased mean annual temperatures (e.g., Solomon et al., 2007; Allen et al., 2010; Orlowsky and Seneviratne, 2012; Rummukainen, 2012), increased occurrence of calamities (Allen et al., 2015; Kautz et al., 2017; Venäläinen et al., 2020), and more frequent climate extremes (Orlowsky and Seneviratne, 2012; Rummukainen, 2012), climate change will affect tree vitality (van Mantgem et al., 2009; Allen et al., 2010). Changes in vitality, in turn, directly affect tree growth (e.g., Vicente-Serrano et al., 2010; Piao et al., 2011; Sarris et al., 2011), may cause tree death or, in extreme cases, the dieback of complete forest areas (e.g., Adams et al., 2009; Allen et al., 2010). Therefore, the effect of climate change on forest and tree vitality needs to be understood to facilitate adapted management or for improved forest growth modeling (Boisvenue and Running, 2006; Bonan, 2008; Ammer et al., 2018).
To do so, it is useful to analyze the forest structure and its change, as the structure of a forest is closely linked to growth processes (e.g., Seidel et al., 2015) that are a result of tree and stand dynamics (Gadow et al., 2012). These dynamics, in turn, are influenced by the resource availability in general and resource allocation between the individuals as a result of competition. Dynamics also change due to the effect of biotic and abiotic disturbances (Saarinen et al., 2021), which also determine tree vitality. In this respect, we can assume that the impact of climate change on forests can be analyzed by looking at the development of forest structure over time. To analyze forest structure, it is useful to look at the structure of the individual trees since they are the components determining the structure of the forest as a “higher unit of organization” (Tomlinson, 1983; Seidel, 2018). Tree structure in turn is characterized by a quantity of architectural attributes, addressing the overall size, for example, tree height, stem characteristics like the diameter in a specific height, and the structure of the crown, including properties like the crown radius and branching pattern (Pretzsch, 2014). While in the past simple structural attributes have been determined within forest inventories using specific instruments (Liang et al., 2016), such as the caliper for diameter measurements or the Blume-Leiss for height measurements, three-dimensional laser scanning approaches have been constantly improved and can be used for the purpose of recording forest structural data efficiently nowadays (Seidel et al., 2015). Several studies have demonstrated that terrestrial laser scanning (TLS) is also able to effectively determine various new crown and stem characteristics that could not or not efficiently be recorded so far (Seidel et al., 2011; Bayer et al., 2013; Metz et al., 2013; Saarinen et al., 2017, 2020). Particularly, the structure of the crown is critical for stand dynamics, tree growth (e.g., Seidel et al., 2015; Pretzsch, 2019), and a tree’s fitness (Pretzsch, 2019). By looking at the crown structure and targeting the crown defoliation percent, defined as the percentage of foliage loss in relation to a fully foliated crown, tree vitality can be approximated (Dobbertin et al., 2009). This approach is common for determining tree vitality in large-scale terrestrial surveys in Europe (Bussotti and Pollastrini, 2017), but has the drawback of being qualitative and prone to observer bias. Furthermore, it is difficult to distinguish between the loss of foliage due to stress and an intrinsically poor condition of the respective tree (Dobbertin and Brang, 2001). Other drought stress indicators of trees are the dieback of twigs and branches occurring with increasing stress, as well as a decrease in shoot and stem growth (Coder and Warnell, 1999). Thus, it is promising to look into fine-scale tree and forest structure if the vitality of the forest is to be assessed.
Today, a holistic measure of tree structural complexity exists in the form of the box-dimension (Db; cf. Mandelbrot, 1977). This measure can easily be derived from laser scanning data (Seidel, 2018), and it considers all above-ground structural elements of a tree to quantify its structural complexity. Thereby, both the amount and spatial arrangement of the plant material are considered simultaneously using fractal analysis (Mandelbrot, 1977; Stiers et al., 2020; Willim et al., 2020). Recent studies showed that the box-dimension relates to a number of individual structural attributes of a tree (Seidel et al., 2019a,c) and that it is also responsive to factors affecting tree growth, such as competition (Seidel, 2018; Dorji et al., 2019; Seidel et al., 2019a) and management (Saarinen et al., 2020; Stiers et al., 2020). It was also shown that the box-dimension is related to the seed dispersal strategy of a tree (Dorji et al., 2021). Unsurprisingly, the amount and distribution of the tree organs, as described by the box-dimension, also relate to tree growth (Seidel, 2018; Dorji et al., 2019). This could be explained by a positive relationship between the box-dimension of a tree and its architectural benefit-to-cost ratio (Seidel et al., 2019a). However, while laser scanning was used before to assess tree vitality (Jacobs et al., 2021), to our knowledge no approaches exist that directly used a measure of whole-tree architectural complexity as a proxy for the vitality of an individual tree.
Underlying the research presented here is the assumption that in deciduous forests, the percentage difference in the box-dimension of a tree that occurs between a measurement before (winter) and after (summer) leaf emergence in spring can be used as an indicator for the vitality of trees. In analogy to the conventional assessment of crown defoliation percentage, the box-dimension difference between the foliated and defoliated condition of a tree should relate to the vitality of a deciduous tree. The approach does not only consider the leave effect but at the same time potential branch dieback or branch growth between the two measurement dates. In contrast to the crown defoliation percentage obtained from visually assessing the tree crown, the new approach would be reproducible and objective, thereby offering the possibility for automatization in future.
In our study, we looked at structural properties known to be indicators for drought stress to determine and quantify possible changes in tree vitality. Due to the intense droughts of 2018 and 2019 (e.g., Boergens et al., 2020; Hari et al., 2020) in the area under investigation, we expected a reduction in the complexity due to dieback effects frequently observed in beech forests in Germany (Kohler et al., 2006; Chakraborty, 2010; Chakraborty et al., 2013; Obladen et al., 2021) during these exceptionally dry and hot years (e.g., Boergens et al., 2020; Hari et al., 2020). We also expected that individual trees have different vitality conditions. As a vitality classification, we used laser scanning data to calculate the difference in complexity between summer and winter 2021. We compared this automatic classification with the visual classification based on the estimated percentage of crown defoliation.
Our hypotheses were that (i) changes in structural complexity occurred on plot and tree level between 2013 and 2021 and (ii) that these potentially drought-related changes differ depending on the canopy position of the trees. Furthermore, we hypothesized that (iii) the extent of relative changes between leaf-off complexity and leaf-on complexity of deciduous trees relates to the vitality of the trees.
Materials and Methods
Study Site and Objective
The study site lies in the UNESCO World Heritage National Park Hainich in Thuringia, Germany, which is an unmanaged forest area since 1997, in the previous 32 years only some valuable trees were removed (Mund, 2004). A quadratic plot of an area of 80 by 80 m including a micro-climatological tower was chosen since it facilitates a good research infrastructure (electricity is available on site) and it has been used in earlier studies (e.g., Knohl et al., 2003; Seidel et al., 2019b,c). The coordinates of the tower are 51°4′45.18′′ North and 10°27′7.62′′ East, indicating the center of the plot. The terrain is mostly flat, and the site is situated around 440 m above sea level, whereby the soil type is characterized as brown calcareous soil according to AG Boden classification of 1994 (Mund, 2004). The mean annual temperature for the region is 6.8°C (TLWF, 1997), and a mean annual precipitation of 872 mm was observed from 2000 to 2002 (Knohl et al., 2003). The studied plot is an uneven-aged stand that is dominated by European beech (Fagus sylvatica L.) and includes scattered individuals from other deciduous broadleaf species, such as ash (Fraxinus excelsior L.) and maple (Acer spp.). Based on estimations of Mund (2004) in the surrounding area, the total mean age of all trees amounts to 91 years, the mean age of the 20% largest trees to 170 years, and the maximum age of the oldest tree to 219 years. A total of 107 trees, mainly beech, but also some ash and maple trees, were identified on the site. Still, only the beeches (n = 79) were further investigated in this study.
Data Acquisition and Processing
Existing data from March 2013 were available in the form of a unified point cloud of the plot, recorded by performing 35 terrestrial laser scans in a leafless state with a Z+F Imager 5006 laser scanner (Zoller & Fröhlich GmbH, Wangen im Allgäu, Germany) as described in Seidel et al. (2019a; 2019b). These data served as comparative data to analyze the growth and structural changes of the trees over the period of 8 years until now. For the current condition of the trees, again 35 terrestrial scans were performed on March 13, 2021, with a Faro Focus M70 laser scanner (FARO Technologies, Inc., Lake Mary, FL, United States) on the same plot with the same scan design as in 2013 in a leafless state. We used a spiral pattern of consecutive scans around the climate tower. Artificial chessboard targets were placed on several trees to co-register the scans with a semi-automatically registration with the FARO Scene software (FARO Technologies, Inc., Lake Marry, FL, United States), resulting in a single point cloud of the plot. In addition, we scanned the stand in summer 2021 with a mobile terrestrial laser scanner to capture the leafy conditions of the trees by walking the same spiral pattern around the climate tower as in the winter. Using the open-source software Cloud Compare,1 both clouds of 2021 were rotated and translated to fit the position of the point cloud of 2013 in order to achieve a match of coordinates for subsequent calculations. Only the well-resolved parts from the center of the three points clouds [2013, 2021 (summer and winter)] were selected (core area of the 80 × 80 m plot) for further investigation. In preparation of the calculation of the structural complexity of the plots, a central square of 45 × 45 m with the same extension for both winter datasets (2013 and 2021) was additionally chosen and cut out. Both datasets had a registration error of less than 2 cm, were subsampled to a common resolution of 1 cm, and noise-filtered including removal of isolated points, resulting in 7,742,889 points in the 2013 dataset and 8,344,805 points in the 2021 dataset, respectively.
For single tree analysis, existing single tree point clouds from 2013 (Seidel et al., 2019a,b) were imported to the stand-level point clouds of 2021. Through visual assessment, all trees of 2013 which were fully contained in the well-resolved part of both point clouds of 2021 were selected step by step. Each of these trees was roughly extracted using a manual approach by cutting it using the clipping tool in Cloud Compare. In the next step, a manual high-resolution “fine cut” of each tree was performed by an overlapping display of the rough cutout and the respective tree cloud of 2013, providing an accurate single tree point cloud for each tree in 2021, once in winter shape and once in summer shape. Though somewhat subjective, this procedure is currently without alternative in its accuracy, since the human visual apparatus performs 3D classification and segmentation tasks with little error (e.g., Todd, 2004) and highest reliability (e.g., Metz et al., 2013).
Furthermore, the vitality of the trees was assessed in situ using the conventional approach estimating the percentage of defoliation (BMEL, 2020). Based on the defoliation percent, five classes were formed, presented in Table 1.
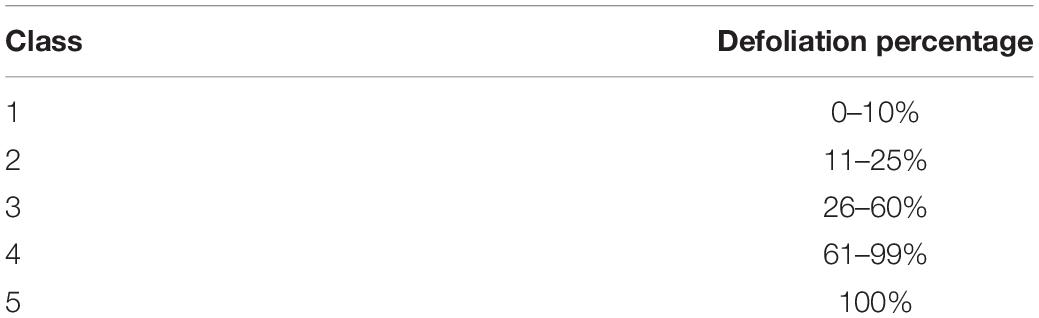
Table 1. Tree vitality classification based on the crown defoliation percentage (BMEL, 2020).
In addition, we evaluated the new measure of tree vitality for deciduous trees by calculating the percentage difference between the structural complexity (Db) of the leaf-on and leaf-off point cloud of an individual, Db summer–Db winter divided by Db winter. We assumed that healthy trees would reveal larger percentage differences than trees suffering from crown dieback or dead trees, appearing without foliage in both seasons.
In order to relate individual tree complexity to the vertical position of the tree crowns, and thus to the social position in the stand, the individual trees of winter 2013 and winter 2021 were divided into three different vertical layers. Three different classes were formed: The first includes the dominant and co-dominant trees which are located in the leading crown layer of the stand under investigation. The second one includes trees whose crowns are in contact with the leading crown layer but being classified as intermediate trees. The third class includes trees that are not in touch with the leading crown layer and that are therefore suppressed trees. This classification is based on a standardized procedure in forest science (e.g., Bountis and Milios, 2017).
Calculation of Point Cloud Attributes
Using the single tree point clouds, several structural attributes were computed. The analysis was restricted to beech in this case study because of known structural differences between the different tree species (Seidel, 2018; Seidel et al., 2019a; Dorji et al., 2021), except for the plot-level complexity calculations. The complexity of each tree was determined by using the algorithm of Seidel (2018) in Mathematica (Wolfram Research, Champaign, IL, United States). The calculation is inspired by Sarkar and Chaudhuri (1994) and goes back to Mandelbrot’s box-counting method (Mandelbrot, 1977), here defining a box which exactly includes all points of the respective tree, having a dimension (edge length) r. The box gets decomposed into smaller boxes by reducing the edge length of each existing box (N) in half in each step, resulting in eight smaller box per initial box in the first step, and so on. The slope of the adjusted linear line (least square fit) of the graph ln(N) over ln(1/r) defines the target variable called the box-dimension Db (Mandelbrot, 1977; Sarkar and Chaudhuri, 1994). The starting size of r is the longest side of that box that is just big enough to enclose all points of a tree. This r is repeatedly divided by half until the remaining edge length is not larger than 10 cm anymore (lower cutoff), which is the assumed minimum spatial resolution available throughout the entire point cloud. Using the same approach, the complexity on plot level was calculated by taking the whole plot into account. Here, the soil layer was removed (only points above 1 m considered) to avoid effects of changes at the ground floor, for example, downed branches, and an identical core area of 45 × 45 m was cut out of the stand-level point clouds of 2013 (winter) and 2021 (winter). The box-dimension algorithm used here was made available as Supplementary Material to Arseniou et al. (2021).
Finally, tree height was calculated as the vertical distance between the lowest and the highest point of each tree cloud using Mathematica, as described in Seidel et al. (2011).
Quantitative Structure Model Modeling and Analysis
Quantitative structure models (QSMs) (Kaasalainen et al., 2014; Hackenberg et al., 2015b; Raumonen et al., 2015) were developed by processing the single tree point clouds using the software CompuTree, initially presented in Hackenberg et al. (2014), with the SimpleTree Plugin (Hackenberg et al., 2015a). QSMs describe the woody above-ground structure of a tree as hierarchically ordered cylinders which are characterized by certain attributes, for instance the orientation based on start and end x-y-z coordinates at both faces, the size, and the branching order (Hackenberg et al., 2015a). Here, we used QSM-derived data to better understand possible causes for changes in the box-dimension of the individual trees. To do so, an exported list of all cylinder’s attributes of each tree served as the basis for a function which allowed for a tree-wise analysis of the total branch length divided into orders (sumBL) in relation to the vertical position of the branches, expressed as the percentage of the tree’s height. According to literature, the dying of branches (branch dieback) often relates to drought stress (e.g., Coder and Warnell, 1999) and might therefore be a useful indicator for tree vitality. The R (R Core Team, 2021) function programmed for this purpose is using the R package tidyverse (Wickham et al., 2019). A total of 100 vertical classes were formed, each having a length of 1 and corresponding to one percent of the tree height. By setting each tree’s lowest z-coordinate to zero, the highest to 100 and adjusting all other cylinder coordinates to it, all trees were made comparable in order to enable the analysis of the location of branch loss in the predetermined classes on plot level. In Figure 1, the successive cylinder-wise calculation steps are graphically presented for a better understanding of the method. For each cylinder of a tree’s QSM, a vector was defined based on the position of the start and end coordinate and its angle to an infinite horizontal plane could be determined. An assignment to the lowest height class, each cylinder lied in, was determined by rounding off its lower z-coordinate to the nearest integer. By using the cylinder vectors’ angle to the horizontal plane and the difference between the actual start z-coordinate of the cylinder and the z-coordinate of the next class’ threshold (adjacent leg of a right-angled triangle), the branch length in each height class (hypotenuse) was calculated. In turn, the length of the hypotenuse was assigned to the predetermined height class in which the cylinder started. If the cylinder extended beyond that class, the remaining length reaching into the following height layer (next height class) was calculated, using the same trigonometric approach. While the angle remained the same, the length of the adjacent leg of the triangle was calculated by the difference of the larger z-coordinate of the cylinder and the classes’ start value. In the case that the cylinder extended across the entire class height, the length was set to one and the procedure was repeated for the following class. This method can be used to calculate the branch length over any number of classes. The algorithm was applied to each QSM with a differentiation between the different branch orders one, two, and all orders together. At the end, the values were summed up for each tree for the respective order.
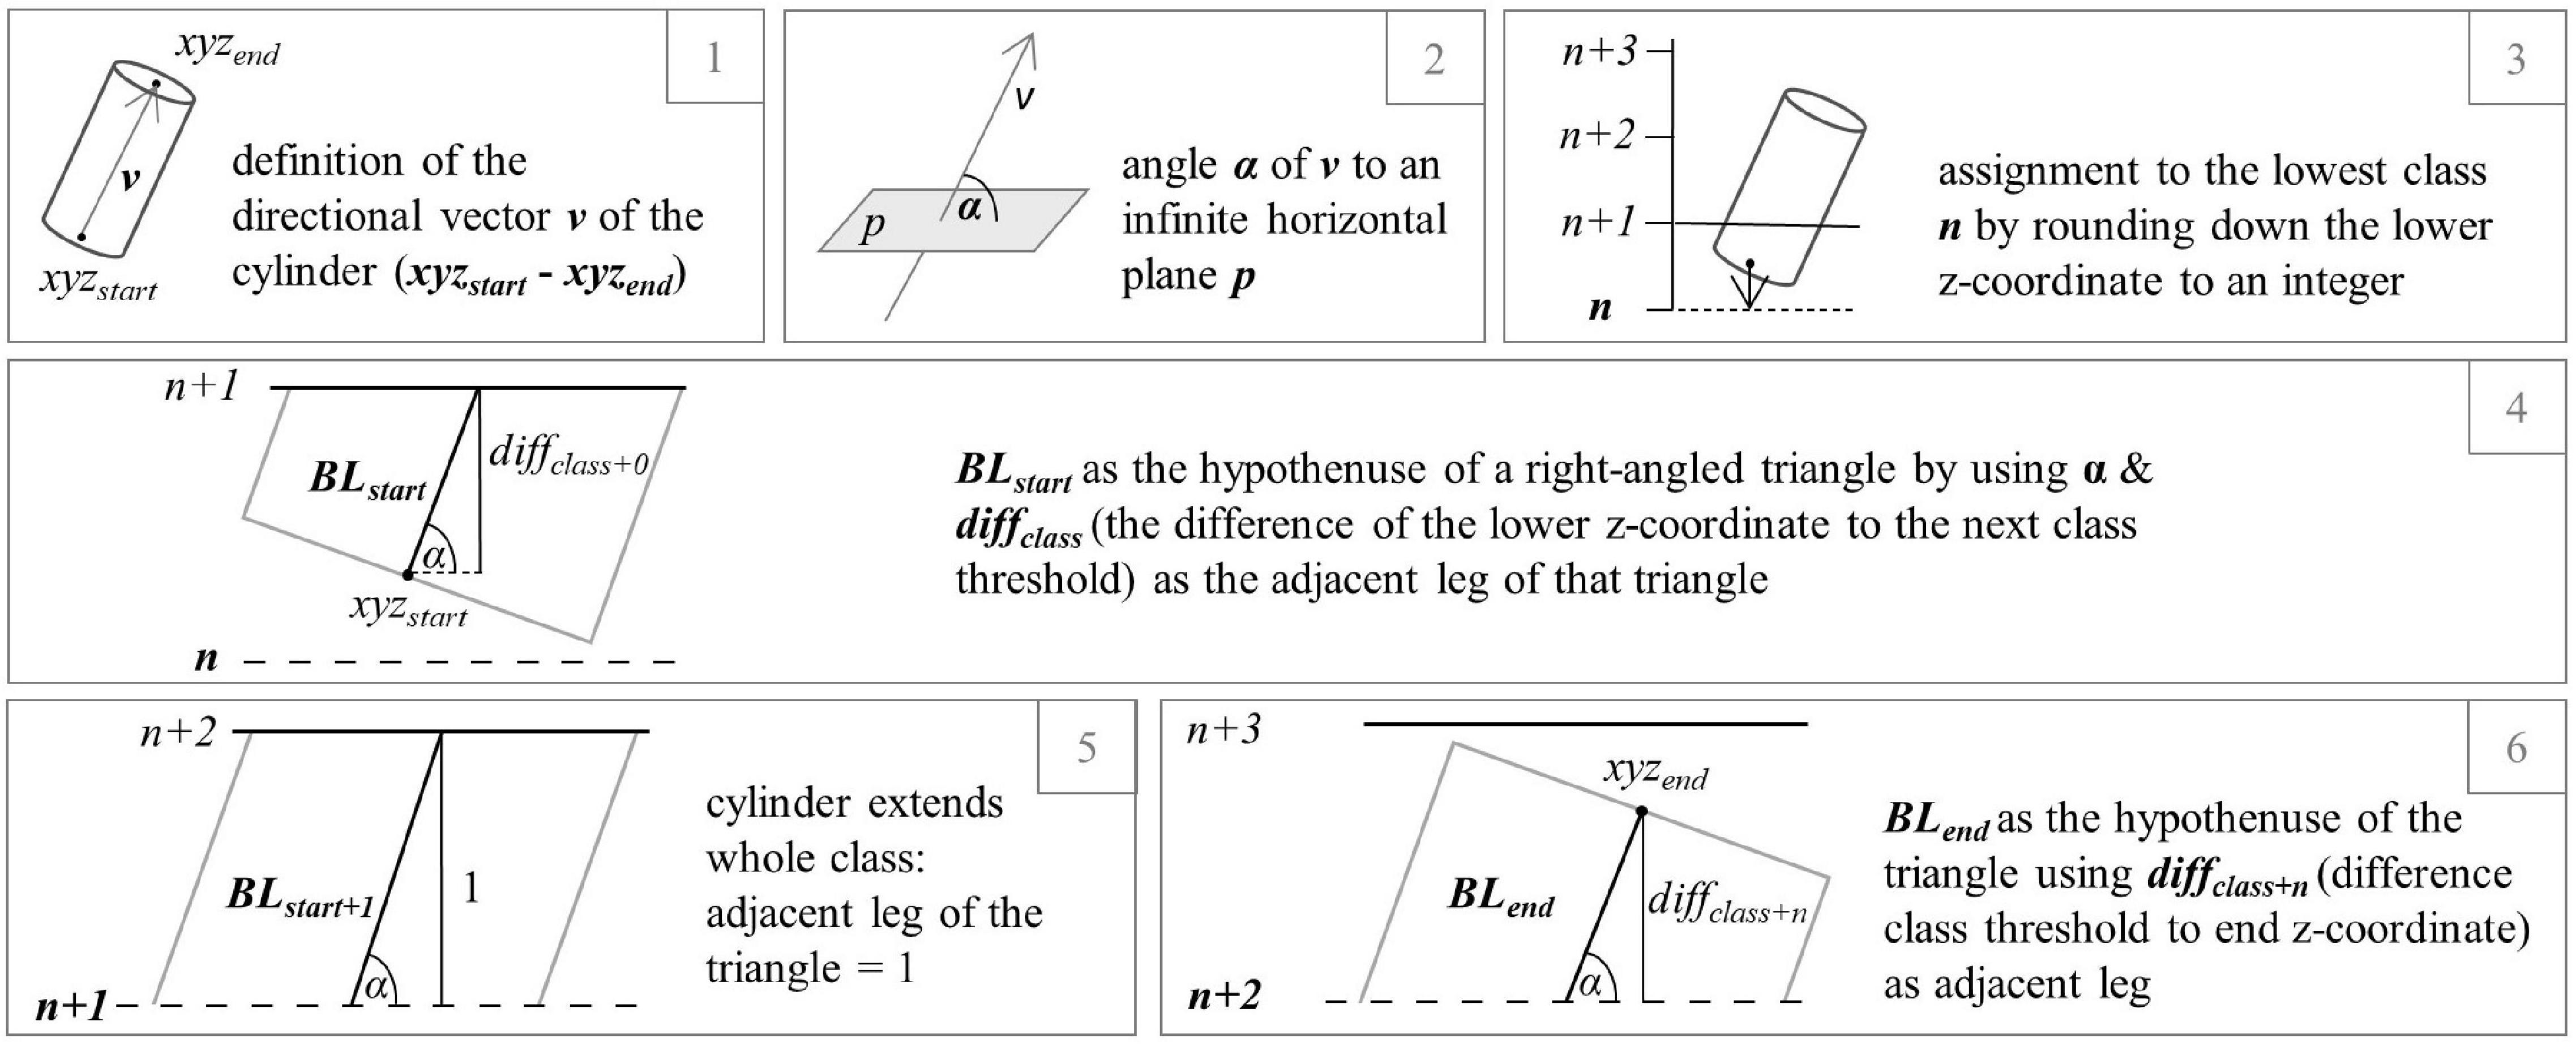
Figure 1. Exemplary processing steps (1–6) to calculate the partial length of a cylinder (branch segment) extending over three height percentages.
Statistical Analysis
All statistics were performed in R (R Core Team, 2021). The data on structural complexity (box-dimension) were tested for normal distribution (Shapiro and Wilk, 1965) and variance homogeneity (Bartlett, 1937). To analyze whether there are significant differences in the means of the box-dimension between winter 2013 and winter 2021 within the different layer groups, a repeated measures ANOVA (Girden, 1992) has been performed in the case of normally distributed values. If there was no normal distribution, we performed the non-parametric Friedman’s test. To test whether there were significant differences between vitality classes in mean percent changes in box-dimension between summer and winter 2021, we performed a Kruskal–Wallis test (Kruskal and Wallis, 1952) because no normal distribution could be assumed. In addition, pairwise comparisons between vitality groups were performed using Dunn’s test (Dunn, 1964).
Results
Plot and Tree Complexity
In winter 2013, the structural complexity, quantified based on the box-dimension (Db), was 1.9896 (unitless) for the central square of the plot and dropped to 1.8125 in 2021. Thus, the complexity of the stand in terms of Db decreased by 0.1771 (8.90 %) units over the observed period of 8 years. On basis of the individual tree point clouds, the mean Db of all analyzed trees (n = 105; including species other than beech) in winter 2013 was 1.6524 ± 0.1401 (mean ± standard deviation) and dropped to 1.4938 ± 0.1523 in 2021. This corresponds to an average decrease at individual tree level of 0.1586 (9.60%) units. The difference in box-dimension Db of the totality of the trees between the years was highly significant (p < 0.001).
The change in tree complexity over height between winter 2013 and winter 2021 for each individual is presented in Figure 2. It is visible that losses in Db occurred regardless of tree height, with no clear trend visible. Overall, just a few trees showed a slight overall increase in box-dimension.
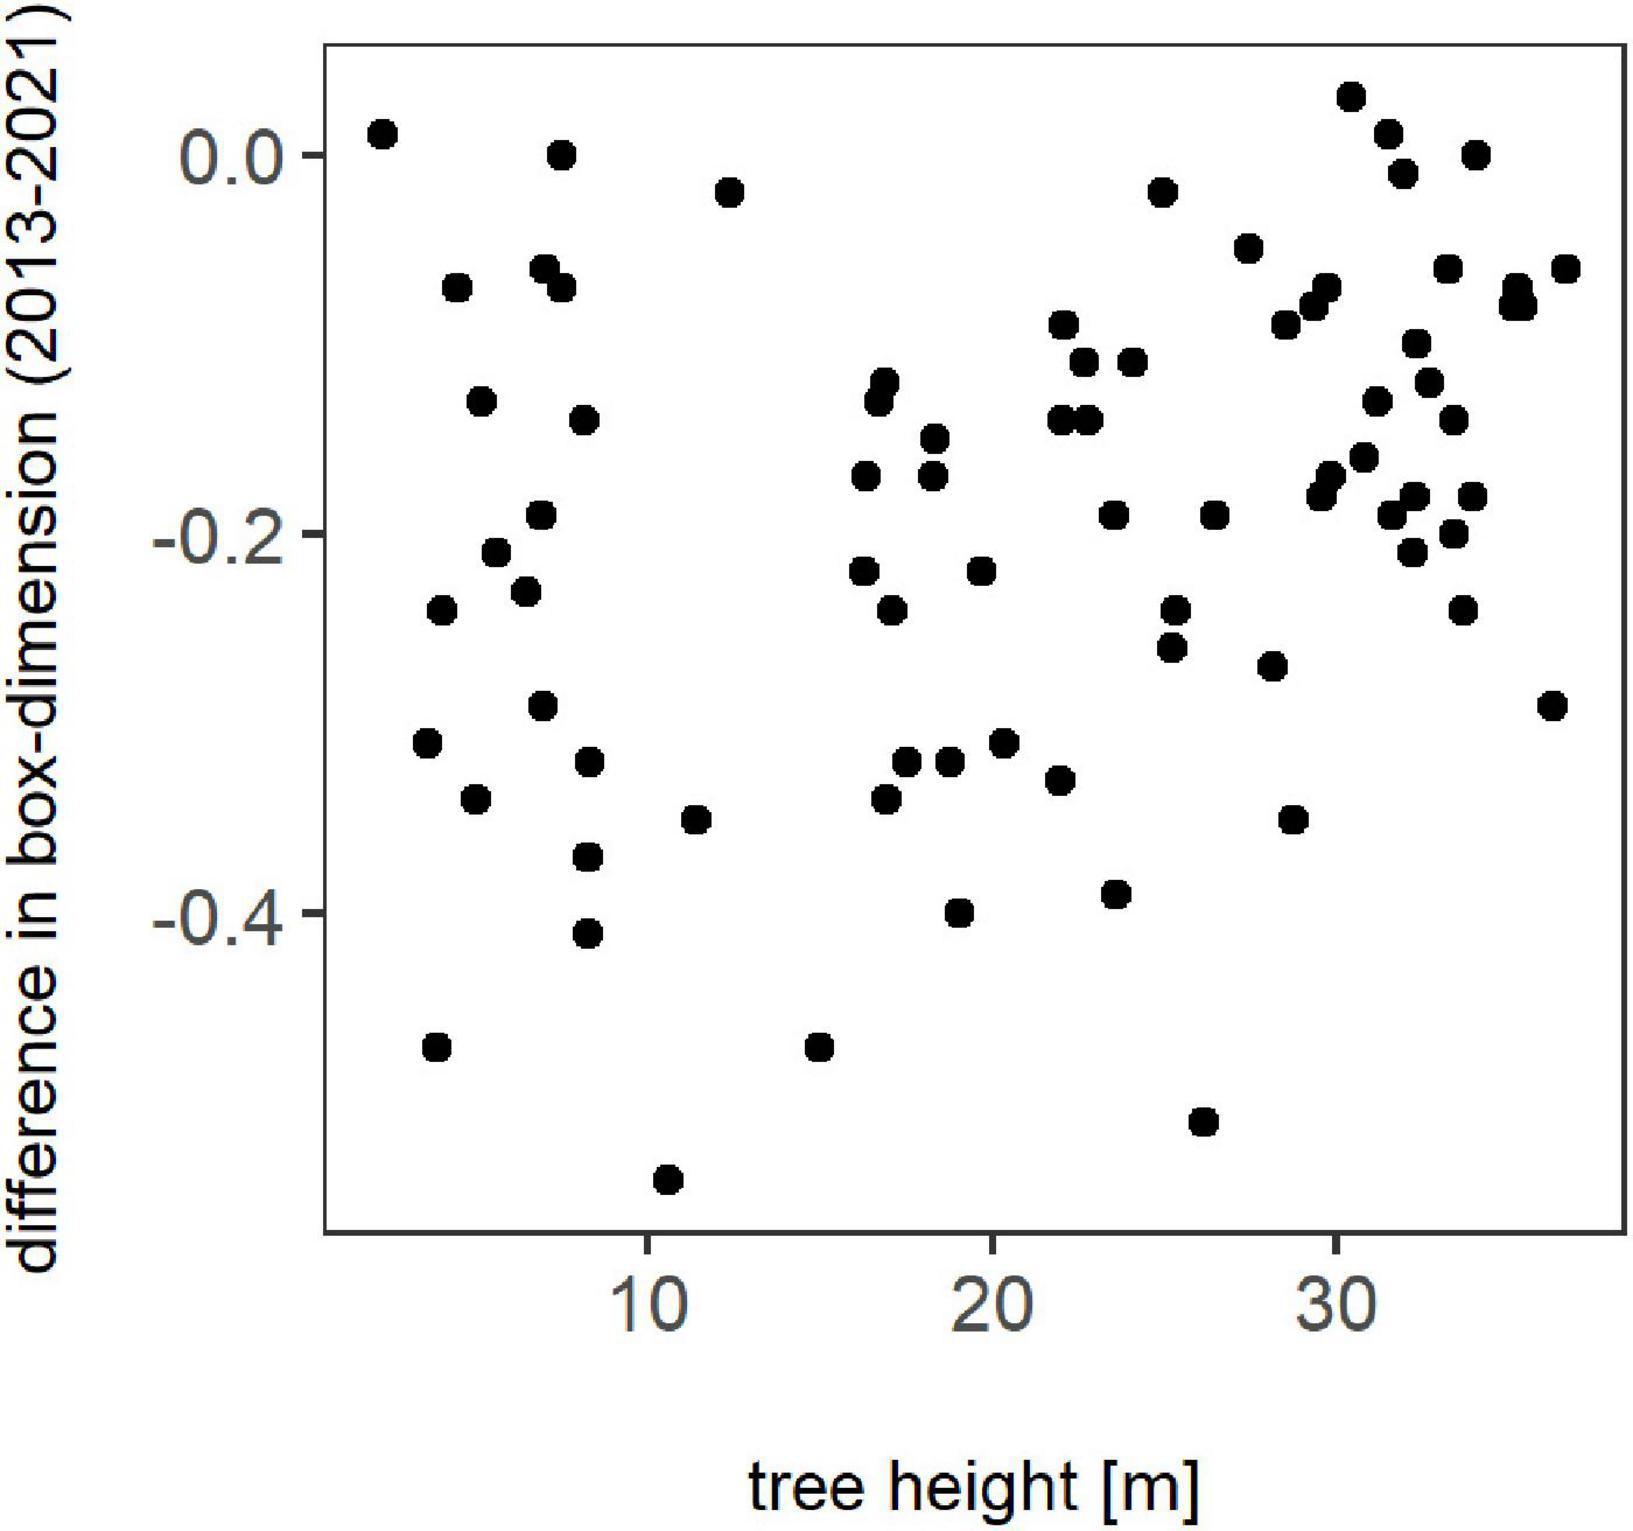
Figure 2. Difference in box-dimension between winter 2013 and winter 2021 for all trees in relation to their height in meter.
The mean complexity of the trees (n = 78; only beeches) in relation to their social positions, regarding the canopy layer the crowns occupy, is highlighted in Figure 3. It is shown that the most complex trees are located in the upper canopy and the least complex ones in the lowest canopy layer. This is also expressed by the mean Db of the trees in winter 2013 with 1.8121 ± 0.088 for the top crown layer, including 14 trees, 1.6839 ± 0.1117 for the middle crown layer with 39 observations, and 1.5732 ± 0.1361 for the lowest crown layer containing 25 trees. For winter 2021, the respective means are 1.6736 ± 0.0848 for the top crown layer with a total of 14 observations, 1.5144 ± 0.0976 for the middle crown layer with 36 observations, and 1.3418 ± 0.1252 for the lowest crown layer with 28 observations, showing the same pattern as in winter 2013. A decrease in complexity of the individual trees in the period of 8 years is visible in each layer (p < 0.001). The effect is lowest for the top crown layer with a difference in mean Db of −0.1386 corresponding to a relative difference of −7.65% in relation to the Db of winter 2013, intermediate for the middle crown layer with a difference in mean of −0.1694 (relative difference of −10.06 %), and highest for the lowest crown layer, as shown by a difference in mean of −0.2314 (relative difference of −14.71%).
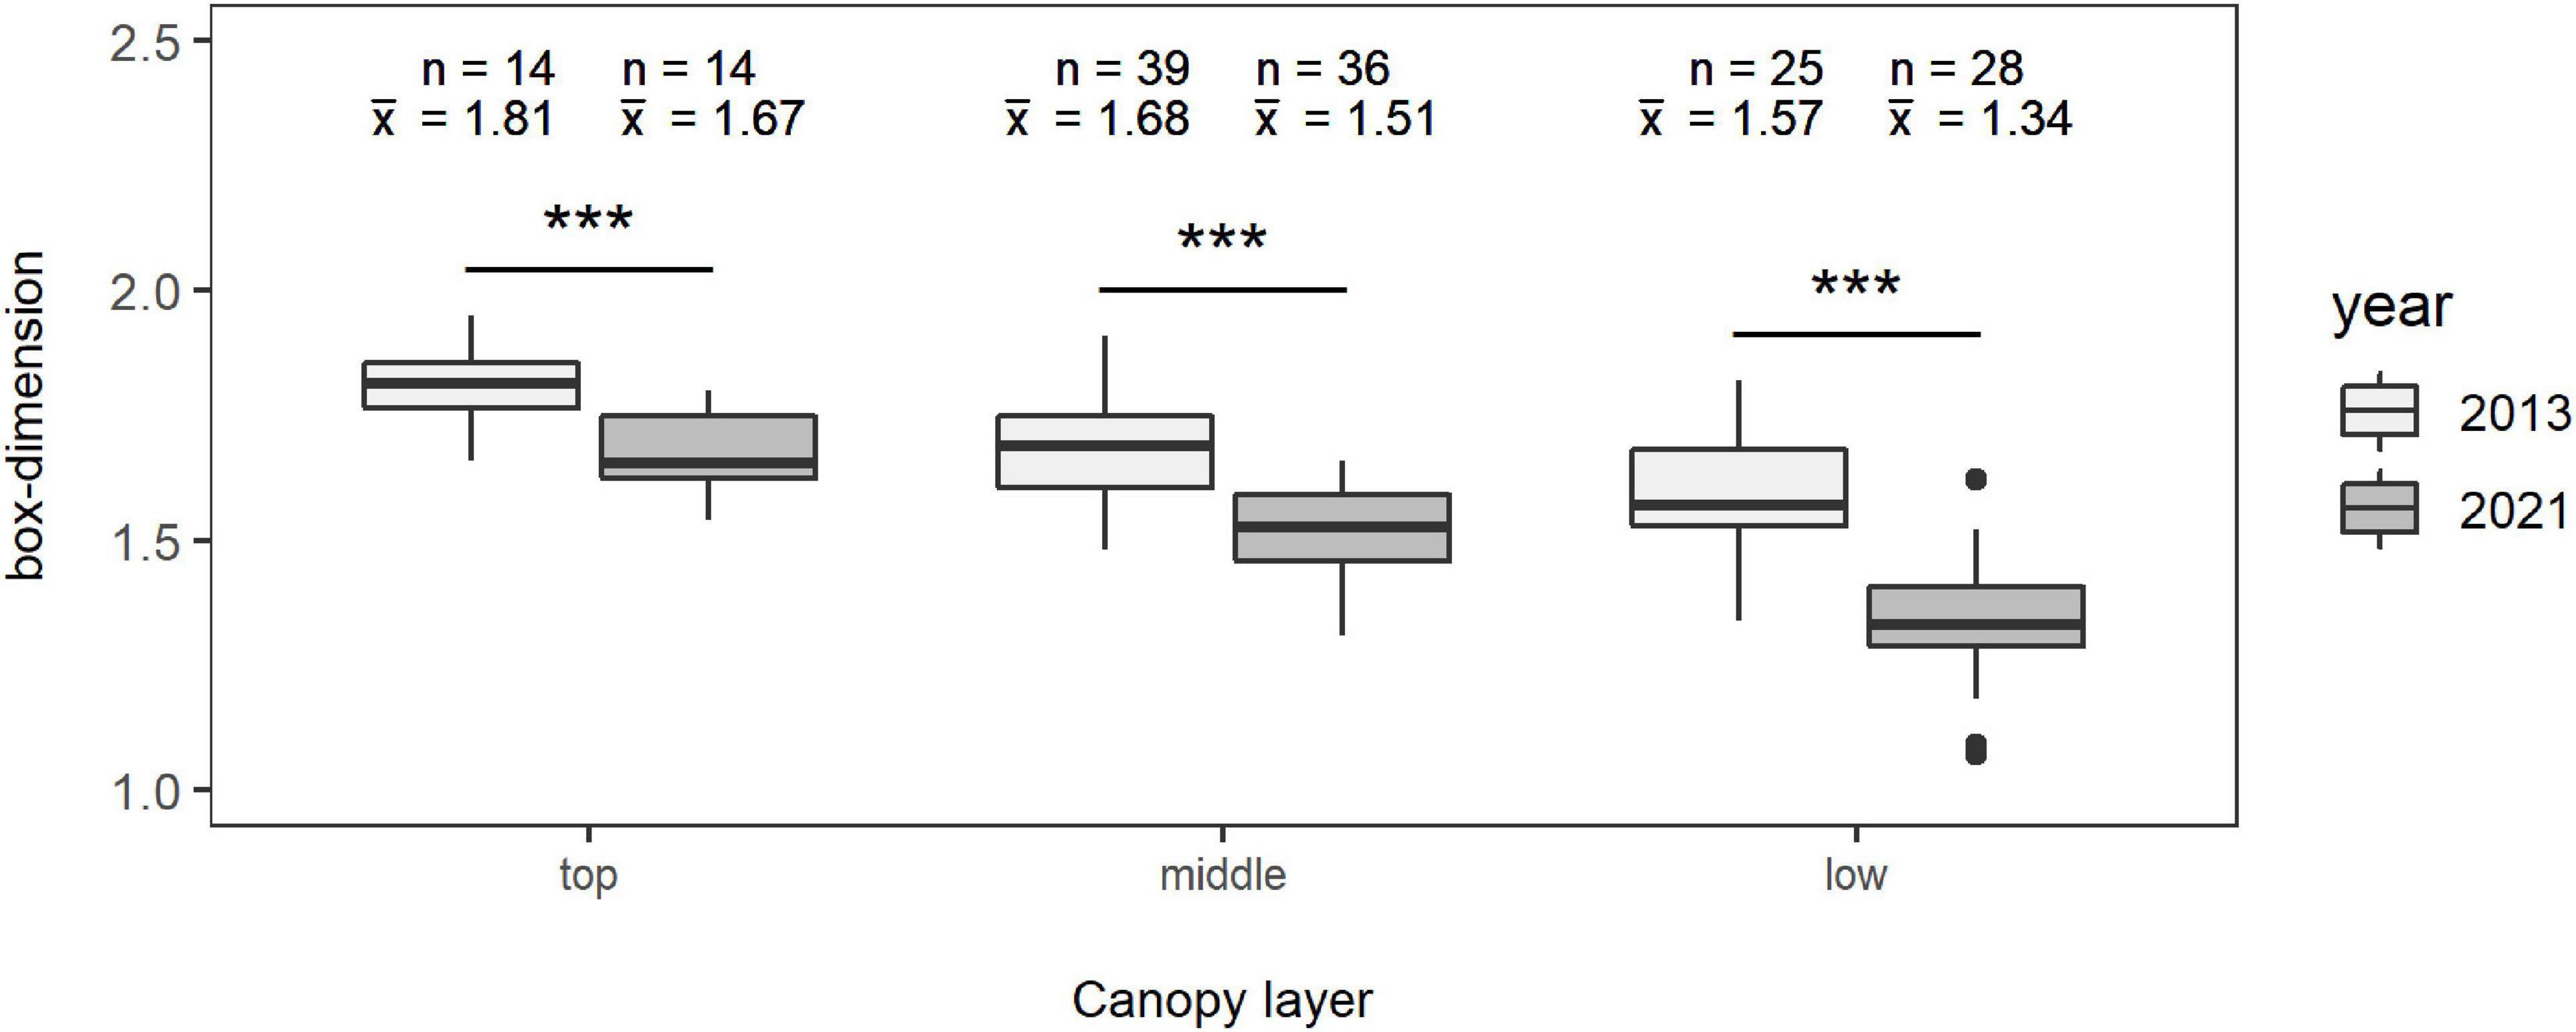
Figure 3. Mean box-dimension of the trees in winter 2013 (light gray) and winter 2021 (gray) in the different canopy layers “top” (left), “middle” (middle), and “low” (right) for a total of 78 observations. The bold black lines mark the median of the boxes in the box-and-whisker charts, “n” represents the number of observations, and “x̄” represents the arithmetic mean value of the respective layer in the specific year. Significant differences between the years of each layer are shown: ***p < 0.001.
Branch Lengths per Height Class
Figure 4 shows the sums of the branch lengths for all trees (relative heights) from zero to 100% in one-percent increments. The development of sumBL of all analyzed orders over the height percentages shows the same curve shape for winter 2013 as for winter 2021 by having relatively low values up to a relative height of 50%, with a following increase until the maximum which is located at around 75% of the total height and followed by a decrease for the remaining percentage. Resulting from that, most of the branches are located within the upper 50% of the trees. Overall, for almost every height percent regardless of the order, sumBL of 2021 is lower than for 2013, and a decrease in branch lengths over 8 years is visible. This is also expressed in the total values of each year for all analyzed orders, shown in Table 2.
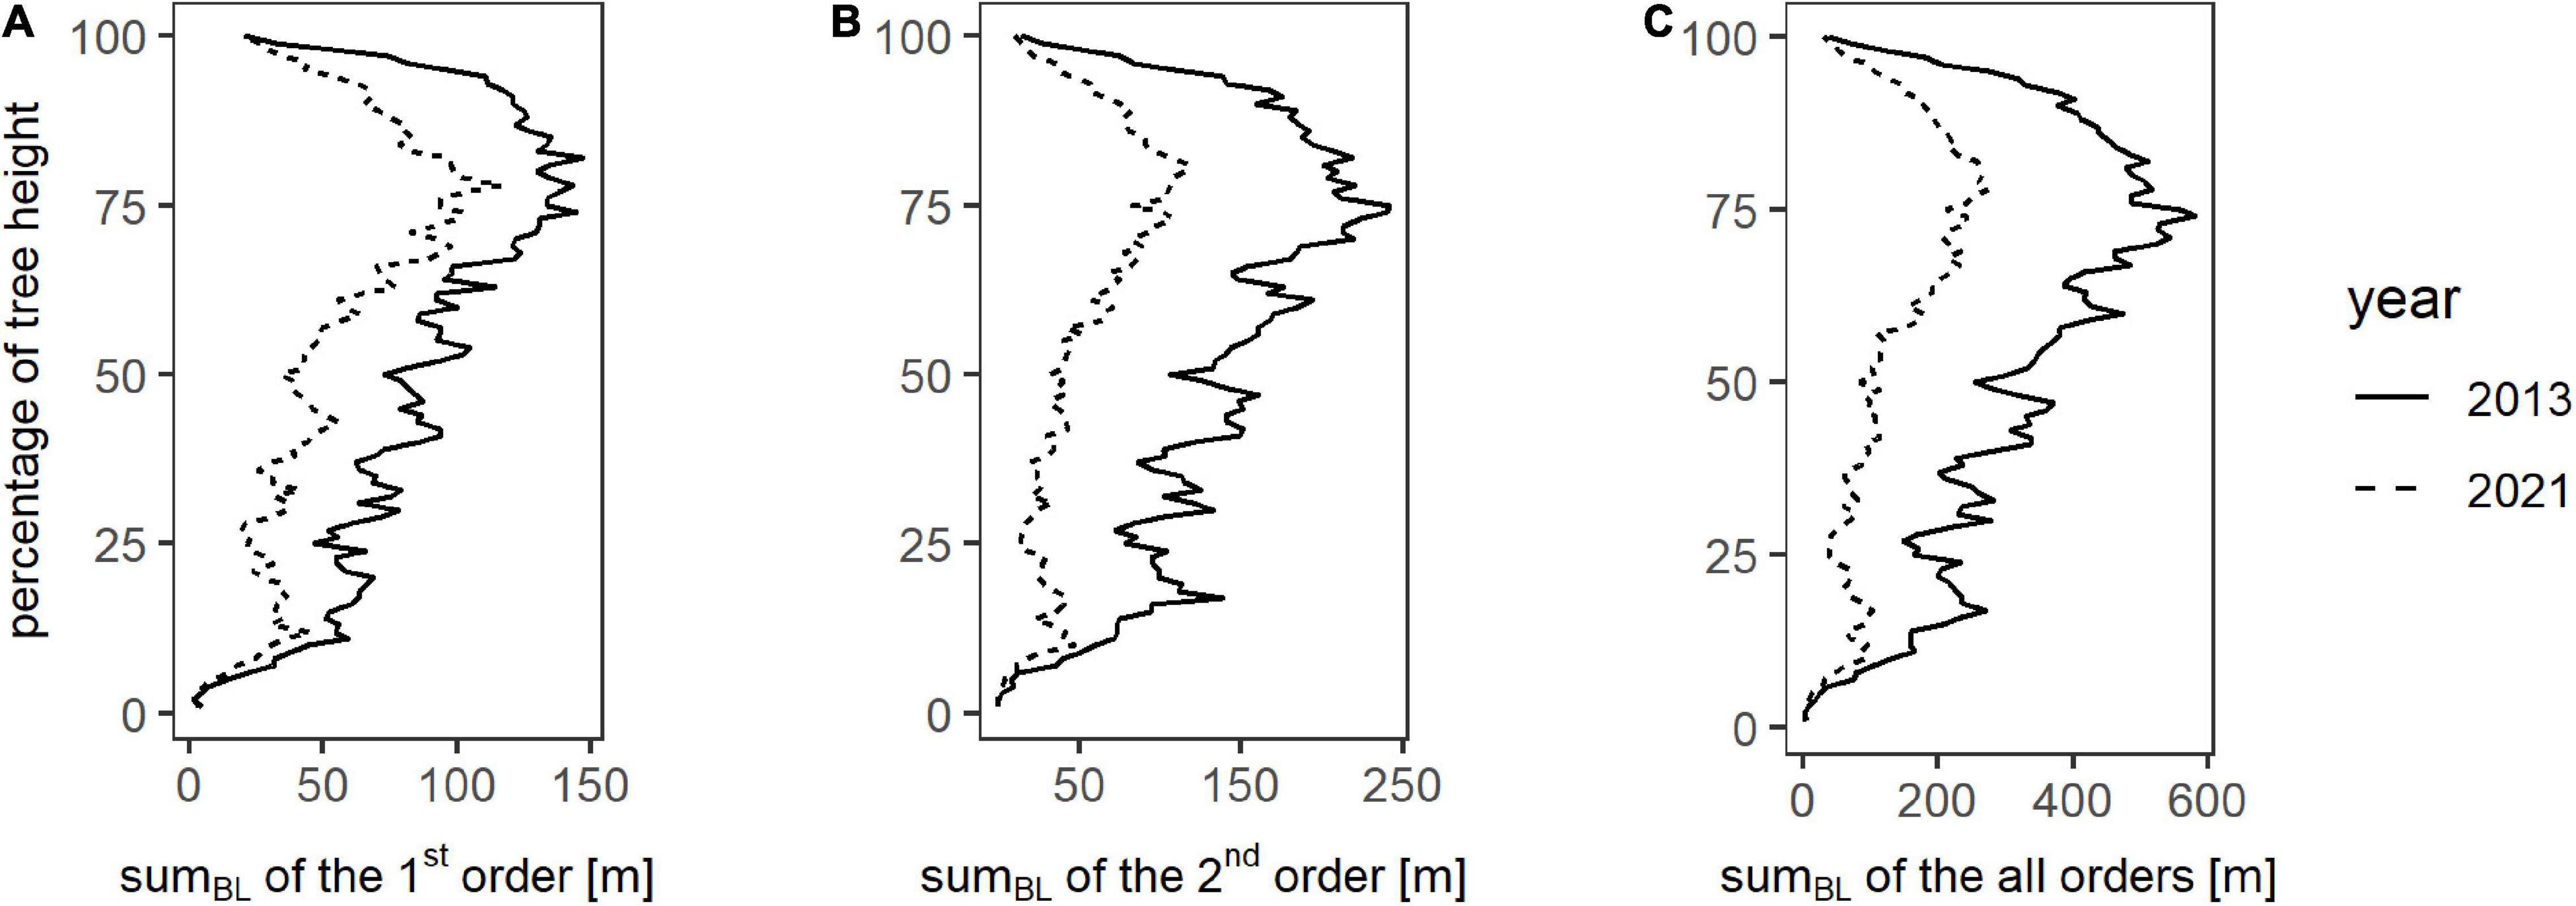
Figure 4. Total branch lengths (sumBL) over one percent steps of the respective tree height on plot level for winter 2013 (dotted line) and winter 2021 (continuous line) for the branch orders one (A), two (B), and all branch orders combined (C).
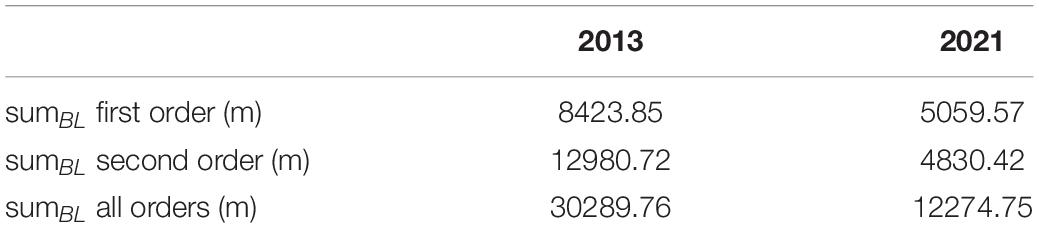
Table 2. Total length of the branches of the orders one, two, and the sum of all orders for winter 2013 and winter 2021.
To quantify the reduction in branch lengths based on the location, Figure 5 depicts the change in sumBL from winter 2013 to winter 2021, referred to as diffBL2021–2013, for each height percentage and for different branch orders. For the first order, diffBL2021–2013 is largest for the top parts of the trees, with an additional peak at around 50% of the tree’s heights. The difference over all classes of the first order is −3364.28 m. The class-wise difference diffBL2021–2013 of the second order shows a maximum decrease at 75% of the tree’s heights, a slightly lower decrease between 25 and 100% of the tree heights, and a minimum decrease for the lowest height percentages. The total difference diffBL2021–2013 of the second order amounts to −8150.30 m. The difference diffBL2021–2013 for all orders also has the maximum at the relative height of 75%. Between 50 and 100%, the values are slightly smaller, and beneath 50% of the relative height, the difference is decreasing with decreasing relative height. Overall, diffBL2021–2013 of all orders amounts to −18015.01 m between winter 2013 and winter 2021. Summarized, branch loss took place over the whole height range of the trees, the strongest reduction in the upper parts of the trees, especially in a relative height of around 75% of the trees’ total heights.
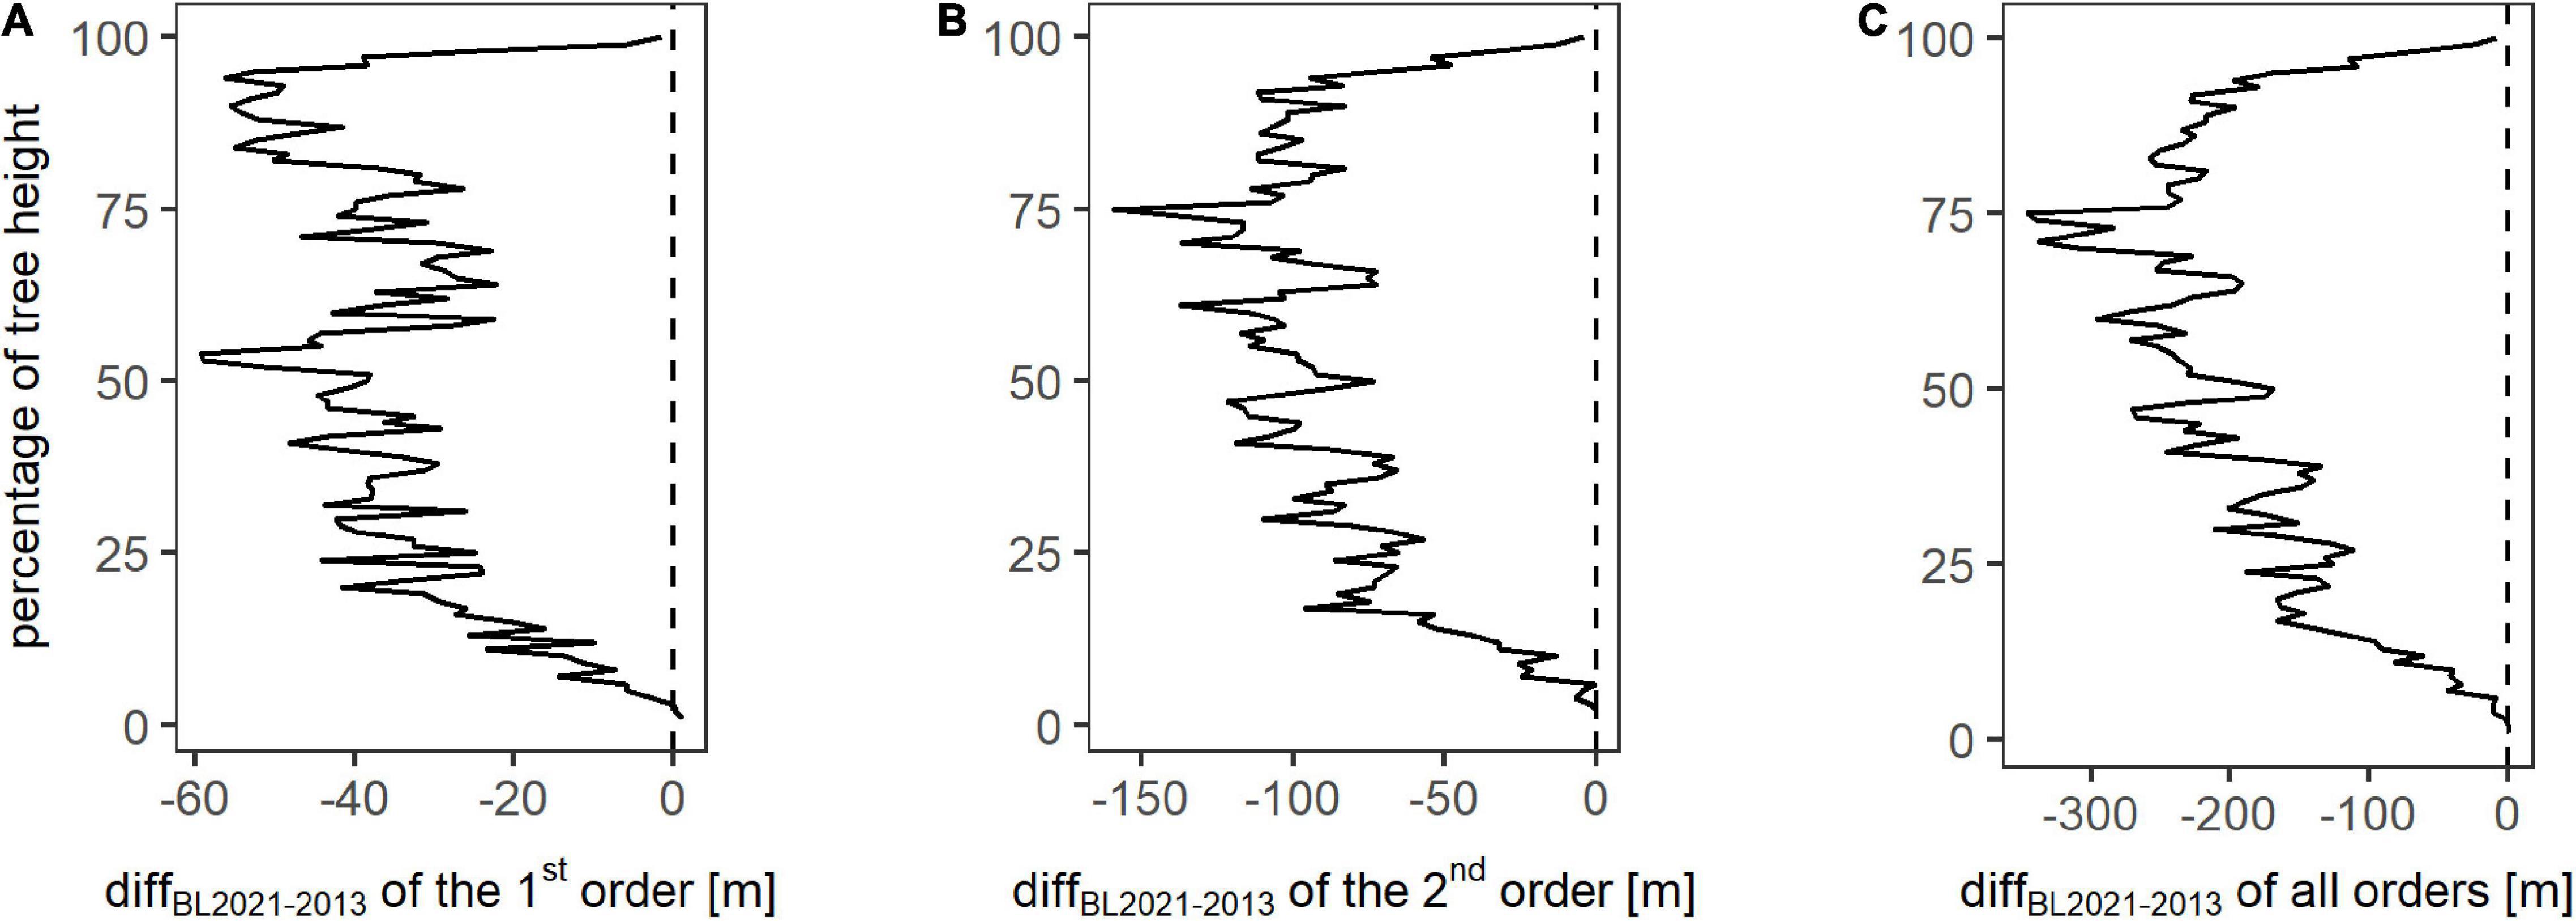
Figure 5. Change in the total branch length between winter 2013 and winter 2021 (diffBL2021–2013) for each height percent on plot level for the analyzed branch orders one (A), two (B), and all orders combined (C). The vertical dotted line represents zero change in the total of branch length per height class.
Despite most of the trees’ branch lengths decreased which resulted in an overall decrease on plot level, some trees actually showed an increase. To show the different alteration of the individuals over the analyzed period, Table 3 shows the maximum increase and maximum decrease of the total branch lengths per order over the total tree height from the totality of the trees (n = 79; only beeches), as well as the number showing an order-wise increase or decrease, respectively. In each order, the maximum decrease is much larger than the maximum increase, as well as there are more trees showing a decrease than an increase.
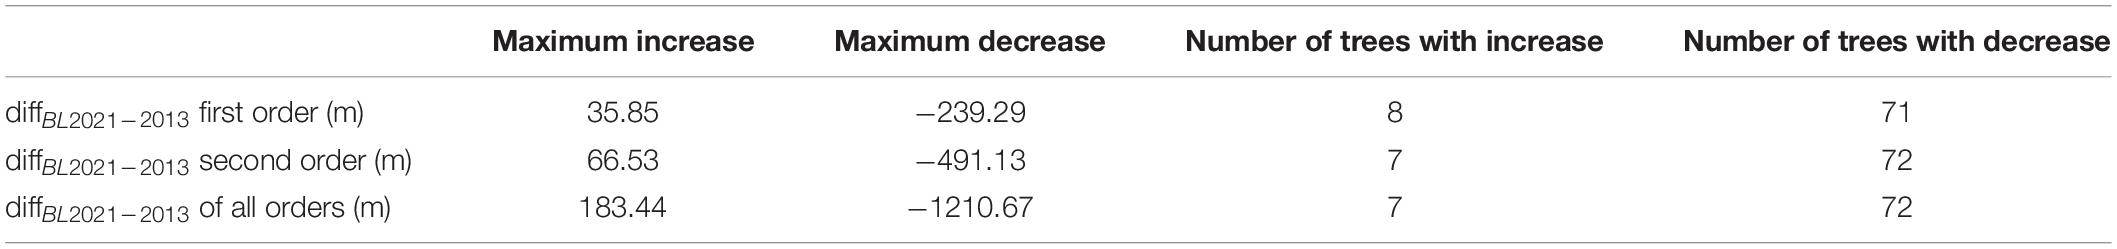
Table 3. Maximum increase and decrease in branch lengths on single tree basis between winter 2013 and winter 2021, as well as number of trees showing an increase and a decrease of the orders one, two, and all order combined for a total of 79 observations.
Quantifying Vitality Using the Box-Dimension
To evaluate the suitability of the complexity-based tree vitality assessment, we compared the conventional tree vitality assessment based on the visual estimation of crown defoliation percentage and rel. Db-diffs–w, the relative difference between the individual’s structural complexity in summer and winter (n = 77; only beeches) (Figure 6). The summer-to-winter percentage difference in Db ranged between 0.0332 and 0.6656 units. Overall differences between vitality classes were highly significant (p < 0.001). The following Dunn’s test revealed the following: Class one differed significantly from all other classes, except the fourth. Despite there was no significant difference between the other classes, an overall trend of decreasing means in the percentage of Db with increasing vitality class could be observed. Therefore, it can be seen that there was a clear signal toward lower differences in the box-dimension between leaf-on and leaf-off condition of a tree and the vitality class.
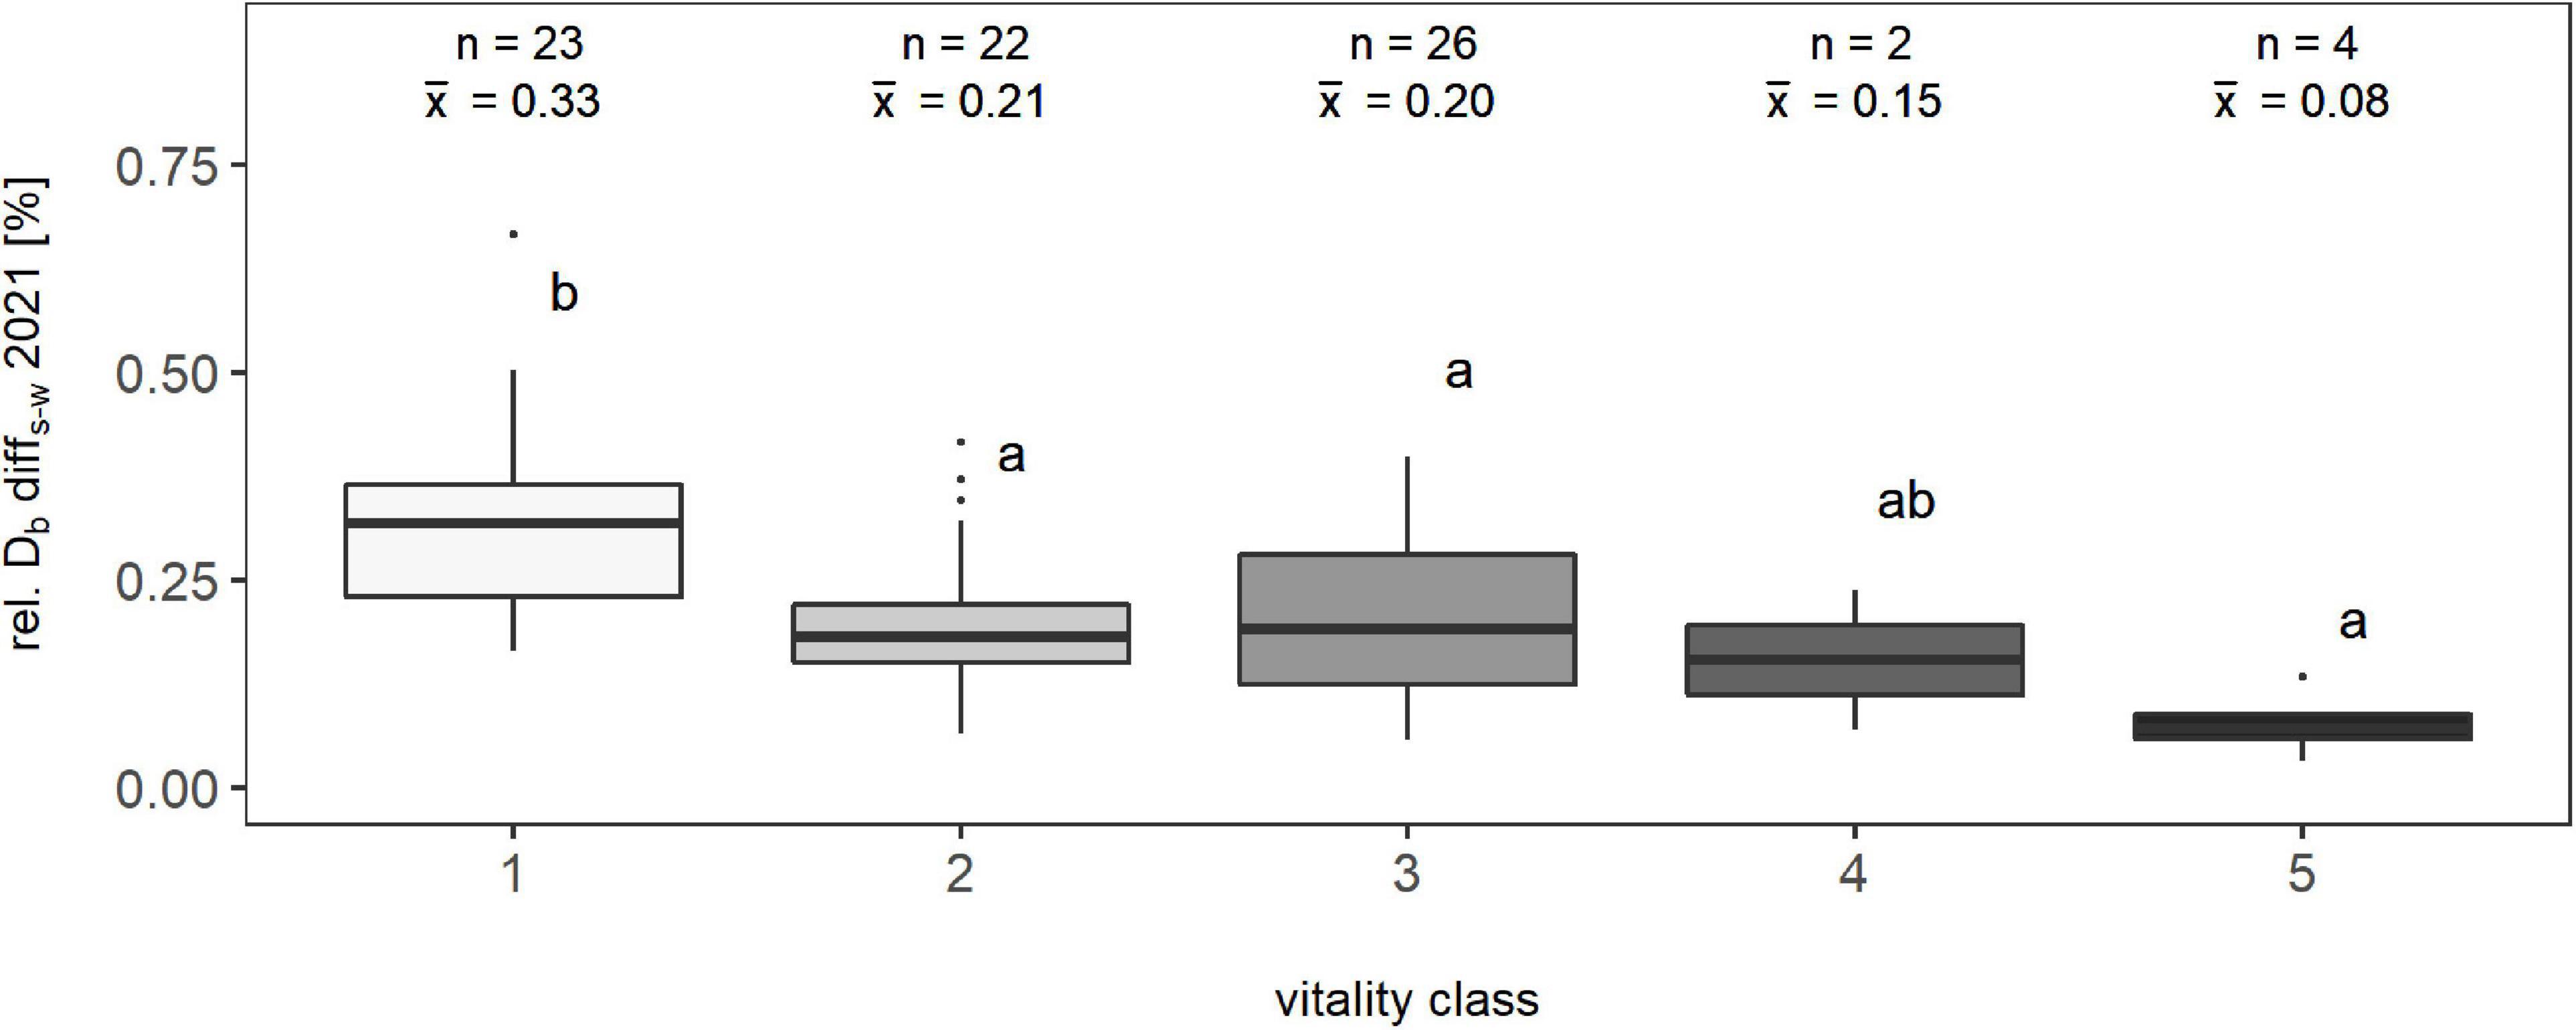
Figure 6. Relationship between the percentage difference of the box-dimension between summer and winter of one year (2021) and a visual classification of trees into vitality classes based on their percentage of crown defoliation for a total of 77 observations; “n” represents the number of observations, and “x̄” represents the arithmetic mean value of the respective class. Means that do not share a common letter are significantly different by Dunn’s test at a 5% significance level.
Discussion
Structural Development of the Plot and the Individual Trees
The structural complexity on plot level, quantified using the box-dimension, has decreased by 0.1771 units between winter 2013 and winter 2021, corresponding to a relative decrease of 8.90%. It is important to clarify that we have confidence that the observed structural changes are due to actual changes in the stand that occurred during the period of 8 years, including those related to several severe droughts, and not due to the methodology itself. This is for several reasons: We used 35 scans during both campaigns, distributed in a similar pattern, and both scanners have a similar range (79 m for the Imager, 70 m for the Faro Focus M70). As shown by Neudam et al. (2022), repeated laser scanning measurements that are based on similar scan designs result in comparable measures of structural complexity (box-dimension) if the resolution is not too fine. Here, we used a lower cutoff of 10 cm for the calculation of the box-dimension, thereby minimizing its dependency on the scanner’s resolution (10,000 points per 360° for the Z+F Imager in winter 2013, 10,240 points per 360° for the Faro in winter 2021). The lower cutoff reduces the residual uncertainties to a minimum which reduces the overall resolution of our structural assessment but standardizes the overall approach and ensures minimum variation between the two measurements related to the methodology. In addition, the overall point cloud consisted of more points in winter 2021 than in winter 2013, indicating that the reduction in the box-dimension in 2021 is not due to a lower point density as a result of a bias not accounted for. Still, we observed a negative temporal trend of tree and plot complexity (Figures 1–3).
We were able to explain the decrease in structural complexity with a decreasing total branch length for many of the trees and across branch orders (Figures 4, 5). Branch length relates to crown radius which in turn was shown to relate to the complexity of a tree already in earlier studies (Seidel et al., 2019c). Therefore, it is little surprising that changes in branch length relate to changes in complexity. We would not expect a healthy forest to show a decrease in complexity over time (8 years) and in absence of management as aging should be positively related to the structural complexity in this phase of development of a beech-dominated forest (e.g., Stiers et al., 2018). Since negative branch growth is not possible, the decrease in the total branch length must be a result of branch diebacks, either caused by drought or due to natural pruning. Natural pruning occurs in the lower and intermediate forest strata and might very well contribute to the observed decreases in total branch length in these strata (Figure 5). In the intermediate and higher strata, however, dieback is the more likely explanation for reduced branch length.
Despite actual height growth, the trees still showed lower complexity on average, which again points to branch dieback as an explanation. For the trees in the stand investigated here, earlier studies observed a significant positive relationship between structural complexity and tree height (r = 0.29) and between crown radius and complexity (r = 0.77) (Seidel et al., 2019c), supporting the claim that the trees must have actually lost structural complexity despite some lateral growth between winter 2013 and winter 2021. Natural pruning should hence be considered an unlikely explanation of the reduced overall complexity. Instead, we argue that we here see clear evidence for a dieback of branches as a common reaction to the influence of the severe droughts, with 2018 and 2019 being two of the three warmest summers in 254 years (Hari et al., 2020). Furthermore, this is interpreted as indicator for a reduced vitality of the trees (e.g., Coder and Warnell, 1999; Brück-Dyckhoff et al., 2019; Walthert et al., 2021).
We also compared the development of the structural complexity of the individual trees within different social positions and found the strongest reduction in the lowest layer (suppressed trees), a moderate reduction within the middle layer (intermediate trees), and the smallest reduction for the top layer (dominant and co-dominant trees), including some increase in total branch length at the very top crown strata of these individuals (Figure 3). This is quite interesting since previous findings are controversial regarding the development of trees with different social status under drought. On the one hand, it was found that larger trees are more affected in their vitality than suppressed ones (Mueller et al., 2005; Nepstad et al., 2007; Floyd et al., 2009). On the other hand, a study of Orwig and Abrams (1997) found a stronger growth reduction response of shaded canopy oaks under drought compared to dominant oaks. Especially a study of Meyer et al. (2022) supports our findings of a higher reduction in complexity for suppressed trees compared to others due to the finding of an increased dieback probability for trees with decreasing dominance status. However, these studies were conducted within different ecosystems and with other tree species, and therefore, it is not clear whether the results can be directly contrasted to our findings, particularly since tree species differ in their susceptibility to drought-induced mortality (Elliott and Swank, 1994; Kloeppel and Clinton, 2003). Since the studied stand is beech-dominated and beech is known to be a species which closes its stomata rather late compared to other species when exposed to drought (Pretzsch, 2017), moderate drought would lead to a competitive advantage for big trees due to their higher capability to access water. This assumption is supported by Moore et al. (2004) stating that increasing tree size results in a greater capacity for nutrient acquisition which leads to a competitive ability of large trees. Not only the amount but also the vertical position of the water within the soil could play a key role for the drought-induced change in the tree structure. Climate data from Hari et al. (2020) showed that in central Europe, the precipitation was not lower for 2018 and 2019 than for many other years, but the mean summer temperature reached maximum values. In that case, the upper soil layer might be dried out due to the high temperatures while the deeper soil layers still contained water. Appropriately, the study of Yeakly (1993) showed that the soil water content is more stable in deeper soil layers (30- to 90-cm depth) than in shallow soil layers (0- to 30-cm depth). Considering this, the water limitation might not have been as large for the dominant trees with deep root systems as for the smaller individuals, resulting in a stronger drought reaction of smaller trees, which in turn expressed in a loss of complexity. This might be further supported by the fact that most trees were intensively affected by branch dieback across most vertical layers, while a few trees, mostly dominant ones, showed an increase in structural complexity and branch length. Fine branches typically get lost as a response to drought and are therefore an indicator for reduced tree vitality (e.g., Coder and Warnell, 1999; Worrall et al., 2008).
Tree Vitality Assessment Based on Box-Dimension
The approach of using the visually estimated crown defoliation as an indicator for tree vitality is common practice, for example, applied in the federal assessment of forest health in Germany (BMEL, 2020). It relates the possible foliation (100%) to actually realized foliation (Dobbertin et al., 2009), thereby indicating the percentage of leaves that have not developed or have poorly developed within the present vegetation period (BMEL, 2020). A drawback of the method is that an intrinsically poor condition cannot be differentiated from an active crown defoliation as a consequence of immediate stress. Furthermore, the approach is subject to a certain extent of subjectivity, even if done by experts (Dobbertin and Brang, 2001). On the contrary, our approach, comparing summer’s and winter’s box-dimension, is solely based on computer routines, therefore being objective and reproducible. We tested our approach against the visual assessment and the observed a decrease in the percentage difference in mean box-dimension with ascending vitality class (indicating a decreasing vitality; Figure 6), supporting the claim that the approach holds potential. The performed Kruskal–Wallis test revealed significant differences in the Db measure (Db summer–Db winter divided by Db winter) comparing all vitality groups with each other. Since the box-dimension can be derived from repeated measurements and for large areas, for example, using airborne laser scanning as shown in the previous studies (Seidel et al., 2020; Camarretta et al., 2021), it might be a useful tool to derive objective forest vitality estimates in deciduous forests. Following our case study, we suggest further research that compares the results of the leaf-on vs. leaf-off difference in box-dimension to more objective vitality indicators than the visually assessed crown defoliation. Despite its wide application, the latter is subjective and therefore not the best reference. Instead, physiological indicators of tree vitality, as a decrease in sap flow (e.g., Nadezhdina, 1999; Stöhr and Lösch, 2004; Ježík et al., 2015) or variations in stem diameter growth (e.g., Zweifel et al., 2006; Ježík et al., 2015), might be more suitable references.
Conclusion
Our comparison of tree and forest structure in winter 2013, winter 2021, and summer 2021 revealed that both the forest plot and the average individual tree’s complexity developed negatively during this time. We argue this was due to the negative effect of severe droughts on tree vitality, clearly expressed in the form of severe branch dieback. Based on a holistic measure of structural complexity, namely the box-dimension, we introduced a new objective and structure-based measure of tree vitality for deciduous trees that quantifies the foliage contribution to complexity. Thereby, a lack of foliage development is used as a proxy for tree vitality. Overall, the study has shown the potential of 3D data from laser scanning to analyze the impact of stressors on the vitality of forests based on changes in tree and forest structure.
Data Availability Statement
The original contributions presented in this study are included in the article/supplementary material, further inquiries can be directed to the corresponding author.
Author Contributions
MH and DS: conceptualization, methodology, validation, data curation, and writing—review and editing. DS: resources, supervision, and funding acquisition. MH: writing—original draft preparation and visualization. Both authors have read and agreed to the published version of the manuscript.
Funding
This study was financially supported by Niedersächsisches Vorab (ZN 3679), Ministry for Science and Culture of Lower Saxony (MWK). Parts of this work were supported by the Heisenberg Program of the German Research Foundation (DFG) based on a fellowship provided to DS (Se2382/7-1).
Conflict of Interest
The authors declare that the research was conducted in the absence of any commercial or financial relationships that could be construed as a potential conflict of interest.
Publisher’s Note
All claims expressed in this article are solely those of the authors and do not necessarily represent those of their affiliated organizations, or those of the publisher, the editors and the reviewers. Any product that may be evaluated in this article, or claim that may be made by its manufacturer, is not guaranteed or endorsed by the publisher.
Acknowledgments
We thank the administration of the Hainich National Park for the opportunity to research within the National Park. We acknowledged the support by the Open Access Publication Funds of the University of Göttingen.
Footnotes
References
Adams, H. D., Guardiola-Claramonte, M., Barron-Gafford, G. A., Villegas, J. C., Breshears, D. D., Zou, C. B., et al. (2009). Temperature sensitivity of drought-induced tree mortality portends increased regional die-off under global-change-type drought. Proc. Natl. Acad. Sci. U S A. 106, 7063–7066. doi: 10.1073/pnas.0901438106
Allen, C. D., Breshears, D. D., and McDowell, N. G. (2015). On underestimation of global vulnerability to tree mortality and forest die-off from hotter drought in the Anthropocene. Ecosphere 6, 1–55. doi: 10.1890/ES15-00203.1
Allen, C. D., Macalady, A. K., Chenchouni, H., Bachelet, D., McDowell, N., Vennetier, M., et al. (2010). A global overview of drought and heat-induced tree mortality reveals emerging climate change risks for forests. For. Ecol. Manag. 259, 660–684. doi: 10.1016/j.foreco.2009.09.001
Ammer, C., Fichtner, A., Fischer, A., Gossner, M. M., Meyer, P., Seidl, R., et al. (2018). Key ecological research questions for Central European forests. Basic Appl. Ecol. 32, 3–25. doi: 10.1016/j.baae.2018.07.006
Arseniou, G., MacFarlane, D. W., and Seidel, D. (2021). Measuring the contribution of leaves to the structural complexity of urban tree crowns with terrestrial laser scanning. Remote Sens. 13:2773. doi: 10.3390/rs13142773
Bartlett, M. S. (1937). Properties of sufficiency and statistical tests. Proc. R. Soc. Lond. Ser. -Math. Phys. Sci. 160, 268–282. doi: 10.1098/rspa.1937.0109
Bayer, D., Seifert, S., and Pretzsch, H. (2013). Structural crown properties of Norway spruce (Picea abies [L.] Karst.) and European beech (Fagus sylvatica [L.]) in mixed versus pure stands revealed by terrestrial laser scanning. Trees 27, 1035–1047. doi: 10.1007/s00468-013-0854-854
BMEL (2020). Ergebnisse der Waldzustandserhebung 2019. Bonn: Bundesministerium für Ernährung und Landwirtschaft.
Boergens, E., Güntner, A., Dobslaw, H., and Dahle, C. (2020). Quantifying the central european droughts in 2018 and 2019 with GRACE follow-On. Geophys. Res. Lett. 47:e2020GL087285. doi: 10.1029/2020GL087285
Boisvenue, C., and Running, S. W. (2006). Impacts of climate change on natural forest productivity - evidence since the middle of the 20th century: climate change impacts on forest vegetation. Glob. Change Biol. 12, 862–882. doi: 10.1111/j.1365-2486.2006.01134.x
Bonan, G. B. (2008). Forests and climate change: forcings, feedbacks, and the climate benefits of forests. Science 320, 1444–1449. doi: 10.1126/science.1155121
Bountis, D., and Milios, E. (2017). Does crown class classification improve the initiation and development analysis of post-fire Pinus Brutia stands? Cerne 23, 61–68. doi: 10.1590/01047760201723012260
Brang, P., Spathelf, P., Larsen, J. B., Bauhus, J., Boncina, A., Chauvin, C., et al. (2014). Suitability of close-to-nature silviculture for adapting temperate European forests to climate change. Forestry 87, 492–503. doi: 10.1093/forestry/cpu018
Brück-Dyckhoff, C., Petercord, R., and Schopf, R. (2019). Vitality loss of European beech (Fagus sylvatica L.) and infestation by the European beech splendour beetle (Agrilus viridis L., Buprestidae, Coleoptera). For. Ecol. Manag. 432, 150–156. doi: 10.1016/j.foreco.2018.09.001
Bussotti, F., and Pollastrini, M. (2017). Traditional and novel indicators of climate change impacts on european forest trees. Forests 8:137. doi: 10.3390/f8040137
Camarretta, N., Ehbrecht, M., Seidel, D., Wenzel, A., Zuhdi, M., Merk, M. S., et al. (2021). Using airborne laser scanning to characterize land-use systems in a tropical landscape based on vegetation structural metrics. Remote Sens. 13:4794. doi: 10.3390/rs13234794
Chakraborty, T. (2010). Effect of Soil Drought on Vitality and Growth on Juvenile and Understorey Beech (Fagus sylvatica L.) Trees?: Case Study from a Rocky Gneiss Outcrop Near Freiburg. Master’s thesis, Freiburg: Albert-Ludwigs-Universität Freiburg.
Chakraborty, T., Saha, S., and Reif, A. (2013). Decrease in available soil water storage capacity reduces vitality of young understorey european beeches (Fagus sylvatica L.)—a case study from the black forest, Germany. Plants 2, 676–698. doi: 10.3390/plants2040676
Dobbertin, M., and Brang, P. (2001). Crown defoliation improves tree mortality models. For. Ecol. Manag. 141, 271–284. doi: 10.1016/S0378-1127(00)00335-332
Dobbertin, M., Hug, C., and Waldner, P. (2009). Kronenverlichtung, sterberaten und waldwachstum in langzeitstudien - welche indikatoren beschreiben den waldzustand am besten? Forum Für Wissen 2009, 7–20.
Dorji, Y., Annighöfer, P., Ammer, C., and Seidel, D. (2019). Response of beech (Fagus sylvatica L.) trees to competition—new insights from using fractal analysis. Remote Sens. 11:2656. doi: 10.3390/rs11222656
Dorji, Y., Schuldt, B., Neudam, L., Dorji, R., Middleby, K., Isasa, E., et al. (2021). Three-dimensional quantification of tree architecture from mobile laser scanning and geometry analysis. Trees 35, 1385–1398. doi: 10.1007/s00468-021-02124-2129
Dunn, O. J. (1964). Multiple comparisons using rank sums. Technometrics 6, 241–252. doi: 10.1111/joor.12521
Elliott, K. J., and Swank, W. T. (1994). Impacts of drought on tree mortality and growth in a mixed hardwood forest. J. Veg. Sci. 5, 229–236. doi: 10.2307/3236155
Floyd, M. L., Clifford, M., Cobb, N. S., Hanna, D., Delph, R., Ford, P., et al. (2009). Relationship of stand characteristics to drought-induced mortality in three Southwestern piñon juniper woodlands. Ecol. Appl. 19, 1223–1230.
Gadow, K. V., Zhang, C. Y., Wehenkel, C., Pommerening, A., Corral-Rivas, J., Korol, M., et al. (2012). “Forest structure and diversity,” in Continuous Cover Forestry Managing Forest Ecosystems, eds T. Pukkala and K. von Gadow (Dordrecht: Springer), 29–83. doi: 10.1007/978-94-007-2202-6_2
Hackenberg, J., Morhart, C., Sheppard, J., Spiecker, H., and Disney, M. (2014). Highly accurate tree models derived from terrestrial laser scan data: a method description. Forests 5, 1069–1105. doi: 10.3390/f5051069
Hackenberg, J., Spiecker, H., Calders, K., Disney, M., and Raumonen, P. (2015a). SimpleTree —an efficient open source tool to build tree models from TLS clouds. Forests 6, 4245–4294. doi: 10.3390/f6114245
Hackenberg, J., Wassenberg, M., Spiecker, H., and Sun, D. (2015b). Non destructive method for biomass prediction combining TLS derived tree volume and wood density. Forests 6, 1274–1300. doi: 10.3390/f6041274
Hari, V., Rakovec, O., Markonis, Y., Hanel, M., and Kumar, R. (2020). Increased future occurrences of the exceptional 2018-2019 Central European drought under global warming. Sci. Rep. 10:12207. doi: 10.1038/s41598-020-68872-68879
Jacobs, M., Rais, A., and Pretzsch, H. (2021). How drought stress becomes visible upon detecting tree shape using terrestrial laser scanning (TLS). For. Ecol. Manag. 489:11. doi: 10.1016/j.foreco.2021.118975
Ježík, M., Blaženec, M., Letts, M. G., Ditmarová, L’, Sitková, Z., and Støelcová, K. (2015). Assessing seasonal drought stress response in Norway spruce (Picea abies (L.) Karst.) by monitoring stem circumference and sap flow. Ecohydrology 8, 378–386. doi: 10.1002/eco.1536
Kaasalainen, S., Krooks, A., Liski, J., Raumonen, P., Kaartinen, H., Kaasalainen, M., et al. (2014). Change detection of tree biomass with terrestrial laser scanning and quantitative structure modelling. Remote Sens. 6, 3906–3922. doi: 10.3390/rs6053906
Kautz, M., Meddens, A. J. H., Hall, R. J., and Arneth, A. (2017). Biotic disturbances in Northern Hemisphere forests - a synthesis of recent data, uncertainties and implications for forest monitoring and modelling: biotic disturbances in Northern Hemisphere forests. Glob. Ecol. Biogeogr. 26, 533–552. doi: 10.1111/geb.12558
Kloeppel, B. D., and Clinton, B. D. (2003). “Drought impacts on tree growth and mortality of southern appalachian forests,” in Climate Variability and Ecosystem Response in Long-Term Ecological Research Sites, eds D. Greenland, D. G. Gooding, and R. C. Smith (Oxford: Oxford University Press), 43–55. doi: 10.1093/oso/9780195150599.003.0009
Knohl, A., Schulze, E.-D., Kolle, O., and Buchmann, N. (2003). Large carbon uptake by an unmanaged 250-year-old deciduous forest in Central Germany. Agric. For. Meteorol. 118, 151–167. doi: 10.1016/S0168-1923(03)00115-111
Kohler, M., Köckemann, B., Peichl, M., Schmitt, J., and Reif, A. (2006). Impacts of the drought 2003 on the crown condition of suppressed and intermediate beech trees (Fagus sylvatica L.) at the ecotone between beech and downy oak forest in the nature reserve Innerberg. Sudbaden. Allg. Forst Jagdztg. 177, 86–91.
Kruskal, W. H., and Wallis, W. A. (1952). Use of ranks in one-criterion variance analysis. J. Am. Stat. Assoc. 40, 583–621.
Liang, X., Kankare, V., Hyyppä, J., Wang, Y., Kukko, A., Haggrén, H., et al. (2016). Terrestrial laser scanning in forest inventories. ISPRS J. Photogramm. Remote Sens. 115, 63–77. doi: 10.1016/j.isprsjprs.2016.01.006
Metz, J., Seidel, D., Schall, P., Scheffer, D., Schulze, E.-D., and Ammer, C. (2013). Crown modeling by terrestrial laser scanning as an approach to assess the effect of aboveground intra- and interspecific competition on tree growth. For. Ecol. Manag. 310, 275–288. doi: 10.1016/j.foreco.2013.08.014
Meyer, P., Spînu, A. P., Mölder, A., and Bauhus, J. (2022). Management alters drought-induced mortality patterns in European beech (Fagus sylvatica L.) forests. Plant Biol. 13396. doi: 10.1111/plb.13396
Moore, J. A., Hamilton, D. A., Xiao, Y., and Byrne, J. (2004). Bedrock type significantly affects individual tree mortality for various conifers in the inland Northwest, U.S.A. Can. J. For. Res. 34, 31–42.
Mueller, R. C., Scudder, C. M., Porter, M. E., Talbot Trotter, R., Gehring, C. A., and Whitham, T. G. (2005). Differential tree mortality in response to severe drought: evidence for long-term vegetation shifts. J. Ecol. 93, 1085–1093. doi: 10.1111/j.1365-2745.2005.01042.x
Mund, M. (2004). Carbon Pools of European Beech (Fagus sylvatica) Forests Under Different Silvicultural Management. Dissertation, Göttingen: Georg-August-Universität Göttingen.
Nadezhdina, N. (1999). Sap flow index as an indicator of plant water status. Tree Physiol. 19, 885–891. doi: 10.1093/treephys/19.13.885
Nepstad, D. C., Tohver, I. M., Ray, D., Moutinho, P., and Cardinot, G. (2007). Mortality of large trees and lianas following experimental drought in an Amazon forest. Ecology 88, 2259–2269. doi: 10.1890/06-1046.1
Neudam, L., Annighöfer, P., and Seidel, D. (2022). Exploring the potential of mobile laser scanning to quantify forest structural complexity. Front. Remote Sens. 3:861337. doi: 10.3389/frsen.2022.861337
Obladen, N., Dechering, P., Skiadaresis, G., Tegel, W., Keßler, J., Höllerl, S., et al. (2021). Tree mortality of European beech and Norway spruce induced by 2018-2019 hot droughts in central Germany. Agric. For. Meteorol. 307:108482. doi: 10.1016/j.agrformet.2021.108482
Orlowsky, B., and Seneviratne, S. I. (2012). Global changes in extreme events: regional and seasonal dimension. Clim. Change 110, 669–696. doi: 10.1007/s10584-011-0122-129
Orwig, D. A., and Abrams, M. D. (1997). Variation in radial growth responses to drought among species, site, and canopy strata. Trees 11, 474–484. doi: 10.1007/s004680050110
Piao, S., Wang, X., Ciais, P., Zhu, B., Wang, T., and Liu, J. (2011). Changes in satellite-derived vegetation growth trend in temperate and boreal Eurasia from 1982 to 2006. Glob. Change Biol. 17, 3228–3239. doi: 10.1111/j.1365-2486.2011.02419.x
Pretzsch, H. (2014). Canopy space filling and tree crown morphology in mixed-species stands compared with monocultures. For. Ecol. Manag. 327, 251–264. doi: 10.1016/j.foreco.2014.04.027
Pretzsch, H. (2017). Einfluss der Trockenheit auf die Zuwachsverteilung Zwischen den Bäumen in Waldbeständen. Germany: DVFFA.
Pretzsch, H. (2019). The effect of tree crown allometry on community dynamics in mixed-species stands versus monocultures. a review and perspectives for modeling and silvicultural regulation. Forests 10:810. doi: 10.3390/f10090810
R Core Team (2021). R: A Language and Environment for Statistical Computing. Vienna: R Foundation for Statistical Computing.
Raumonen, P., Casella, E., Calders, K., Murphy, S., Åkerblom, M., and Kaasalainen, M. (2015). Massive-scale tree modelling from tls data. ISPRS Ann. Photogramm. Remote Sens. Spat. Inf. Sci II-3/W4, 189–196. doi: 10.5194/isprsannals-II-3-W4-189-2015
Rummukainen, M. (2012). Changes in climate and weather extremes in the 21st century. Wiley Interdiscip. Rev. Clim. Change 3, 115–129. doi: 10.1002/wcc.160
Saarinen, N., Calders, K., Kankare, V., Yrttimaa, T., Junttila, S., Luoma, V., et al. (2021). Understanding 3D structural complexity of individual Scots pine trees with different management history. Ecol. Evol. 11, 2561–2572. doi: 10.1002/ece3.7216
Saarinen, N., Kankare, V., Vastaranta, M., Luoma, V., Pyörälä, J., Tanhuanpää, T., et al. (2017). Feasibility of Terrestrial laser scanning for collecting stem volume information from single trees. ISPRS J. Photogramm. Remote Sens. 123, 140–158. doi: 10.1016/j.isprsjprs.2016.11.012
Saarinen, N., Kankare, V., Yrttimaa, T., Viljanen, N., Honkavaara, E., Holopainen, M., et al. (2020). Assessing the effects of thinning on stem growth allocation of individual Scots pine trees. For. Ecol. Manag. 474:118344. doi: 10.1016/j.foreco.2020.118344
Sarkar, N., and Chaudhuri, B. B. (1994). An efficient differential box-counting approach to compute fractal dimension of image. IEEE Trans. Syst. Man Cybern. 24, 115–120. doi: 10.1109/21.259692
Sarris, D., Christodoulakis, D., and Körner, C. (2011). Impact of recent climatic change on growth of low elevation eastern Mediterranean forest trees. Clim. Change 106, 203–223. doi: 10.1007/s10584-010-9901-y
Seidel, D. (2018). A holistic approach to determine tree structural complexity based on laser scanning data and fractal analysis. Ecol. Evol. 8, 128–134. doi: 10.1002/ece3.3661
Seidel, D., Annighöfer, P., Ehbrecht, M., Magdon, P., Wöllauer, S., and Ammer, C. (2020). Deriving stand structural complexity from airborne laser scanning data—what does it tell us about a forest? Remote Sens. 12:1854. doi: 10.3390/rs12111854
Seidel, D., Annighöfer, P., Stiers, M., Zemp, C. D., Burkardt, K., Ehbrecht, M., et al. (2019a). How a measure of tree structural complexity relates to architectural benefit-to-cost ratio, light availability, and growth of trees. Ecol. Evol. 9, 7134–7142. doi: 10.1002/ece3.5281
Seidel, D., Ehbrecht, M., Annighöfer, P., and Ammer, C. (2019b). From tree to stand-level structural complexity — which properties make a forest stand complex? Agric. For. Meteorol. 278:107699. doi: 10.1016/j.agrformet.2019.107699
Seidel, D., Ehbrecht, M., Dorji, Y., Jambay, J., Ammer, C., and Annighöfer, P. (2019c). Identifying architectural characteristics that determine tree structural complexity. Trees 33, 911–919. doi: 10.1007/s00468-019-01827-1824
Seidel, D., Leuschner, C., Müller, A., and Krause, B. (2011). Crown plasticity in mixed forests—quantifying asymmetry as a measure of competition using terrestrial laser scanning. For. Ecol. Manag. 261, 2123–2132. doi: 10.1016/j.foreco.2011.03.008
Seidel, D., Schall, P., Gille, M., and Ammer, C. (2015). Relationship between tree growth and physical dimensions of Fagus sylvatica crowns assessed from terrestrial laser scanning. IForest - Biogeosci. For. 8, 735–742. doi: 10.3832/ifor1566-008
Shapiro, S. S., and Wilk, M. B. (1965). An analysis of variance test for normality (Complete Samples). Biometrika 52, 591–611.
Solomon, S., Qin, D., Manning, M., Chen, Z., Marquis, M., Averyt, M., et al. (2007). Climate Change 2007: the Physical Science Basis. Contribution of Working Group I to the Fourth Assessment Report of the Intergovernmental Panel on Climate Change. Cambridge: Cambridge University Press.
Stiers, M., Annighöfer, P., Seidel, D., Willim, K., Neudam, L., and Ammer, C. (2020). Quantifying the target state of forest stands managed with the continuous cover approach - revisiting Möller’s “Dauerwald” concept after 100 years. Trees For. People 1:100004. doi: 10.1016/j.tfp.2020.100004
Stiers, M., Willim, K., Seidel, D., Ehbrecht, M., Kabal, M., Ammer, C., et al. (2018). A quantitative comparison of the structural complexity of managed, lately unmanaged and primary European beech (Fagus sylvatica L.) forests. For. Ecol. Manag. 430, 357–365. doi: 10.1016/j.foreco.2018.08.039
Stöhr, A., and Lösch, R. (2004). Xylem sap flow and drought stress of Fraxinus excelsior saplings. Tree Physiol. 24, 169–180. doi: 10.1093/treephys/24.2.169
TLWF (1997). Die Forstlichen Wuchsbezirke Thüringens. Gotha: Thüringer Landesanstalt für Wald und Forstwirtschaft.
Tomlinson, P. B. (1983). Tree architecture: new approaches help to define the elusive biological property of tree form. Am. Sci. 71, 141–149.
van Mantgem, P. J., Stephenson, N. L., Byrne, J. C., Daniels, L. D., Franklin, J. F., Fulé, P. Z., et al. (2009). Widespread increase of tree mortality rates in the Western United States. Science 323, 521–524. doi: 10.1126/science.1165000
Venäläinen, A., Lehtonen, I., Laapas, M., Ruosteenoja, K., Tikkanen, O., Viiri, H., et al. (2020). Climate change induces multiple risks to boreal forests and forestry in Finland: a literature review. Glob. Change Biol. 26, 4178–4196. doi: 10.1111/gcb.15183
Vicente-Serrano, S. M., Lasanta, T., and Gracia, C. (2010). Aridification determines changes in forest growth in Pinus halepensis forests under semiarid Mediterranean climate conditions. Agric. For. Meteorol. 150, 614–628. doi: 10.1016/j.agrformet.2010.02.002
Walthert, L., Ganthaler, A., Mayr, S., Saurer, M., Waldner, P., Walser, M., et al. (2021). From the comfort zone to crown dieback: sequence of physiological stress thresholds in mature European beech trees across progressive drought. Sci. Total Environ. 753:141792. doi: 10.1016/j.scitotenv.2020.141792
Wickham, H., Averick, M., Bryan, J., Chang, W., McGowan, L., François, R., et al. (2019). Welcome to the tidyverse. J. Open Source Softw. 4:1686. doi: 10.21105/joss.01686
Willim, K., Stiers, M., Annighöfer, P., Ehbrecht, M., Ammer, C., and Seidel, D. (2020). Spatial patterns of structural complexity in differently managed and unmanaged beech-dominated forests in Central Europe. Remote Sens. 12:1907. doi: 10.3390/rs12121907
Worrall, J. J., Egeland, L., Eager, T., Mask, R. A., Johnson, E. W., Kemp, P. A., et al. (2008). Rapid mortality of Populus tremuloides in southwestern Colorado. USA. For. Ecol. Manag. 255, 686–696. doi: 10.1016/j.foreco.2007.09.071
Yeakly, J. A. (1993). Hillslope Soil Moisture Gradients in an Upland Forested Watershed. Dissertation, Charlottesville, VA: University of Virginia.
Keywords: mobile laser scanning, terrestrial laser scanning, quantitative structure models, fractal analysis, deciduous forest, drought
Citation: Heidenreich MG and Seidel D (2022) Assessing Forest Vitality and Forest Structure Using 3D Data: A Case Study From the Hainich National Park, Germany. Front. For. Glob. Change 5:929106. doi: 10.3389/ffgc.2022.929106
Received: 26 April 2022; Accepted: 31 May 2022;
Published: 24 June 2022.
Edited by:
Pedro Álvarez-Álvarez, University of Oviedo, SpainReviewed by:
Elena Canga, Centro Tecnológico y Forestal de la Madera (CETEMAS), SpainCésar Pérez Cruzado, University of Santiago de Compostela, Spain
Copyright © 2022 Heidenreich and Seidel. This is an open-access article distributed under the terms of the Creative Commons Attribution License (CC BY). The use, distribution or reproduction in other forums is permitted, provided the original author(s) and the copyright owner(s) are credited and that the original publication in this journal is cited, in accordance with accepted academic practice. No use, distribution or reproduction is permitted which does not comply with these terms.
*Correspondence: Marius G. Heidenreich, bWFyaXVzZ2Vycml0LmhlaWRlbnJlaWNoQHVuaS1nb2V0dGluZ2VuLmRl