 Margaret Woodbridge
 Tara Keyser1†
- 1US Department of Agriculture, Forest Service Southern Research Station, Asheville, NC, United States
- 2US Department of Agriculture, Forest Service Southern Research Station, Knoxville, TN, United States
There is a growing body of evidence that mesic tree species are increasing in importance across much of the eastern US. This increase is often observed in tandem with a decrease in the abundance and importance of species considered to be better adapted to disturbance and drier conditions (e.g., Quercus species). Concern over this transition is related to several factors, including the potential that this transition is self-reinforcing (termed “mesophication”), will result in decreased resiliency of forests to a variety of disturbances, and may negatively impact ecosystem functioning, timber value, and wildlife habitat. Evidence for shifts in composition provide broad-scale support for mesophication, but we lack information on the fine-scale factors that drive the associated functional changes. Understanding this variability is particularly important as managers work to develop site-and condition-specific management practices to target stands or portions of the landscape where this transition is occurring or is likely to occur in the future. To address this knowledge gap and identify forests that are most susceptible to mesophication (which we evaluate as a functional shift to less drought or fire tolerant, or more shade tolerant, forests), we used data from the USDA Forest Service Forest Inventory and Analysis program to determine what fine-scale factors impact the rate (change through time) and degree (difference between the overstory and midstory) of change in eastern US forests. We found that mesophication varies along stand and environmental gradients, but this relationship depended on the functional trait examined. For example, shade and drought tolerance suggest mesophication is greatest at sites with more acidic soils, while fire tolerance suggests mesophication increases with soil pH. Mesophication was also generally more pronounced in older stands, stands with more variable diameters, and in wetter sites, but plots categorized as “hydric” were often highly variable. Our results provide evidence that stand-scale conditions impact current and potential future changes in trait conditions and composition across eastern US forests. We provide a starting point for managers looking to prioritize portions of the landscape most at risk and developing treatments to address the compositional and functional changes associated with mesophication.
Introduction
There is increasing evidence that forests across the eastern US are changing as a result of altered disturbance regimes, including the cessation of both natural and anthropogenic fire, other periodic, low- to moderate-severity disturbances (e.g., grazing, fuelwood/biomass extraction; Pyle, 1988), coupled with contemporary forest management practices and twentieth century climate patterns. These shifts have facilitated the growth and development of shade-tolerant, mesic tree species in a variety of forest cover types across the region (McEwan et al., 2011; Pederson et al., 2015; Hanberry et al., 2020; Alexander et al., 2021). For example, between 1980 and 2005, Fei and Steiner (2007) reported an increase in the relative importance of the mesic, shade-tolerant species Acer rubrum in 26 of 37 eastern states. Increases in the abundance and importance of these mesic species often occur concomitantly with decreases in the relative abundance, importance, and volume of more disturbance-adapted, xerophytic species that are often intolerant to mid-tolerant of shade, including ecologically and economically valuable Quercus species (Knott et al., 2019). This change in composition is not limited to the US. Spînu et al. (2020) found that fire suppression inhibited recruitment of oak and pine in European forests through time, and there is evidence of a directional trend in recent decades toward greater abundance of Fagaceae relative to Pinaceae in temperate forests worldwide (with the exception of eastern North America; Alfaro Reyna et al., 2018).
Several factors (e.g., climate, fire exclusion, changes in herbivory, introduction of non-native pests, pathogens, and plants) may have resulted in the replacement of disturbance-adapted species with shade-tolerant, mesic species (McEwan et al., 2011), with fire and fire exclusion undoubtedly playing a major role (Hanberry et al., 2020). Regardless of the driving forces behind this shift, the compositional change will have important and far-reaching impacts. Because functional traits exert control over various ecosystem processes and functions, these changes in species composition have the potential to negatively impact a wide array of provisioning (e.g., timber), regulating (e.g., climate; Mushinski et al., 2019), supporting (e.g., nutrient cycling; Alexander, 2010), and cultural (Pezzarossi, 2014) services. The maintenance of xerophytic species across the landscape is particularly important given their tendency to be more resilient to mortality and/or reductions in growth during drought (Abrams, 1990; Kaproth and Cavender-Bares, 2016; Novick et al., 2022); a disturbance forecasted to increase in extent and severity over the next 50 years (Vose et al., 2016). Additionally, there is growing concern that this large-scale transition may be a self-reinforcing process—termed mesophication (Nowacki and Abrams, 2008)—whereby this compositional shift creates conditions in the forest understory that promote the continued establishment and persistence of functionally similar mesic species.
While the mechanisms driving the observed compositional shifts and self-perpetuating conditions require continued study (Allen et al., 2018; Alexander et al., 2021), the literature provides support that the process is ongoing across the four broad ecoregions that comprise the eastern US (Fei et al., 2011; Knott et al., 2019). These broad scale trends in species composition are informative, but there are likely a variety of local factors that exert control over the rate and severity of mesophication in eastern forests. For example, elevation, aspect, and topography are important drivers of mesophication in old-growth forests in eastern Kentucky, where wetter areas experienced greater compositional shifts as xerophytic species failed to recruit (Chapman and McEwan, 2016). In contrast, studies in Ohio have demonstrated that mesic and xeric Quercus/Carya forests do not differ in their resistance to mesophication (Palus et al., 2018; Dyer and Hutchinson, 2019). These studies and their inconsistent results highlight the potential differences—driven, in part, by differences in abiotic and biotic forces, or differing functional drivers—in the mesophication process.
To date, much of the literature related to mesophication has quantified changes in the abundance and/or importance of individual species or genera across large spatial scales (e.g., ecoregions), with little attention given to potential fine-scale variability in mesophication based on functional shifts, and the local, site-specific factors controlling that variation. Although these broad scale analyses are useful in identifying trends, they do little to inform the drivers of mesophication at scales more meaningful to management (e.g., at the stand or watershed-scale). Without ecologically informed forest management practices, the functional transition associated with mesophication will likely continue, and may create conditions (e.g., reduced litter flammability; Kane et al., 2021) that make restoration increasingly difficult without considerable investment of resources, including multiple treatments that may include combinations of harvesting, fire, and herbicide conducted across many years and/or decades (Thomas-Van Gundy et al., 2014; Schweitzer et al., 2019; Keyser and Rodrigue, 2022). By understanding the fine-scale variability in mesophication, managers may begin to prioritize portions of the landscape most at risk and develop treatments that will effectively and efficiently slow or reverse this process. Using a trait-based approach will also improve our understanding of the potential ecological consequences of mesophication.
Our main objective is to identify the factors driving the fine-scale variation in the functional shifts associated with mesophication across forests in the eastern United States. Understanding the variability of mesophication on this scale will inform the development of site- and condition- specific management practices that address compositional, functional, and ecological shifts. This information could also help managers prioritize areas for treatment by providing information on the factors controlling the severity of change. The need for these ecologically informed management tools is becoming increasingly important as mesophication continues across much of the region (Fei and Steiner, 2007; Knott et al., 2019). To address this knowledge gap and identify forests that are most susceptible to mesophication (which we evaluate here as either a taxonomic shift toward species associated with mesophication based on the literature, or a functional shift to less drought or fire tolerant, or more shade tolerant, forests), we used data from the USDA Forest Service Forest Inventory and Analysis program to determine what fine-scale factors impact the rate (change through time) and degree (difference between the overstory and midstory) of change. More specifically, we tested whether factors associated with site quality, such as soil and topographic characteristics, ownership, and/or province make forests prone to mesophication.
Materials and methods
Data
We limited the spatial scope of our study area of interest based on ecological regions and provinces (Bailey, 1980; McNab et al., 2007). This resulted in a study area ranging from the U.S.-Canadian border in the north to the prairie-dominated ecological provinces in the west. This area encompasses 14 ecological provinces in the Central Hardwood Region, the Southern Pine Hardwood Region, the Forest-Prairie Transition Region, and the Northern Hardwood Region (Figure 1).
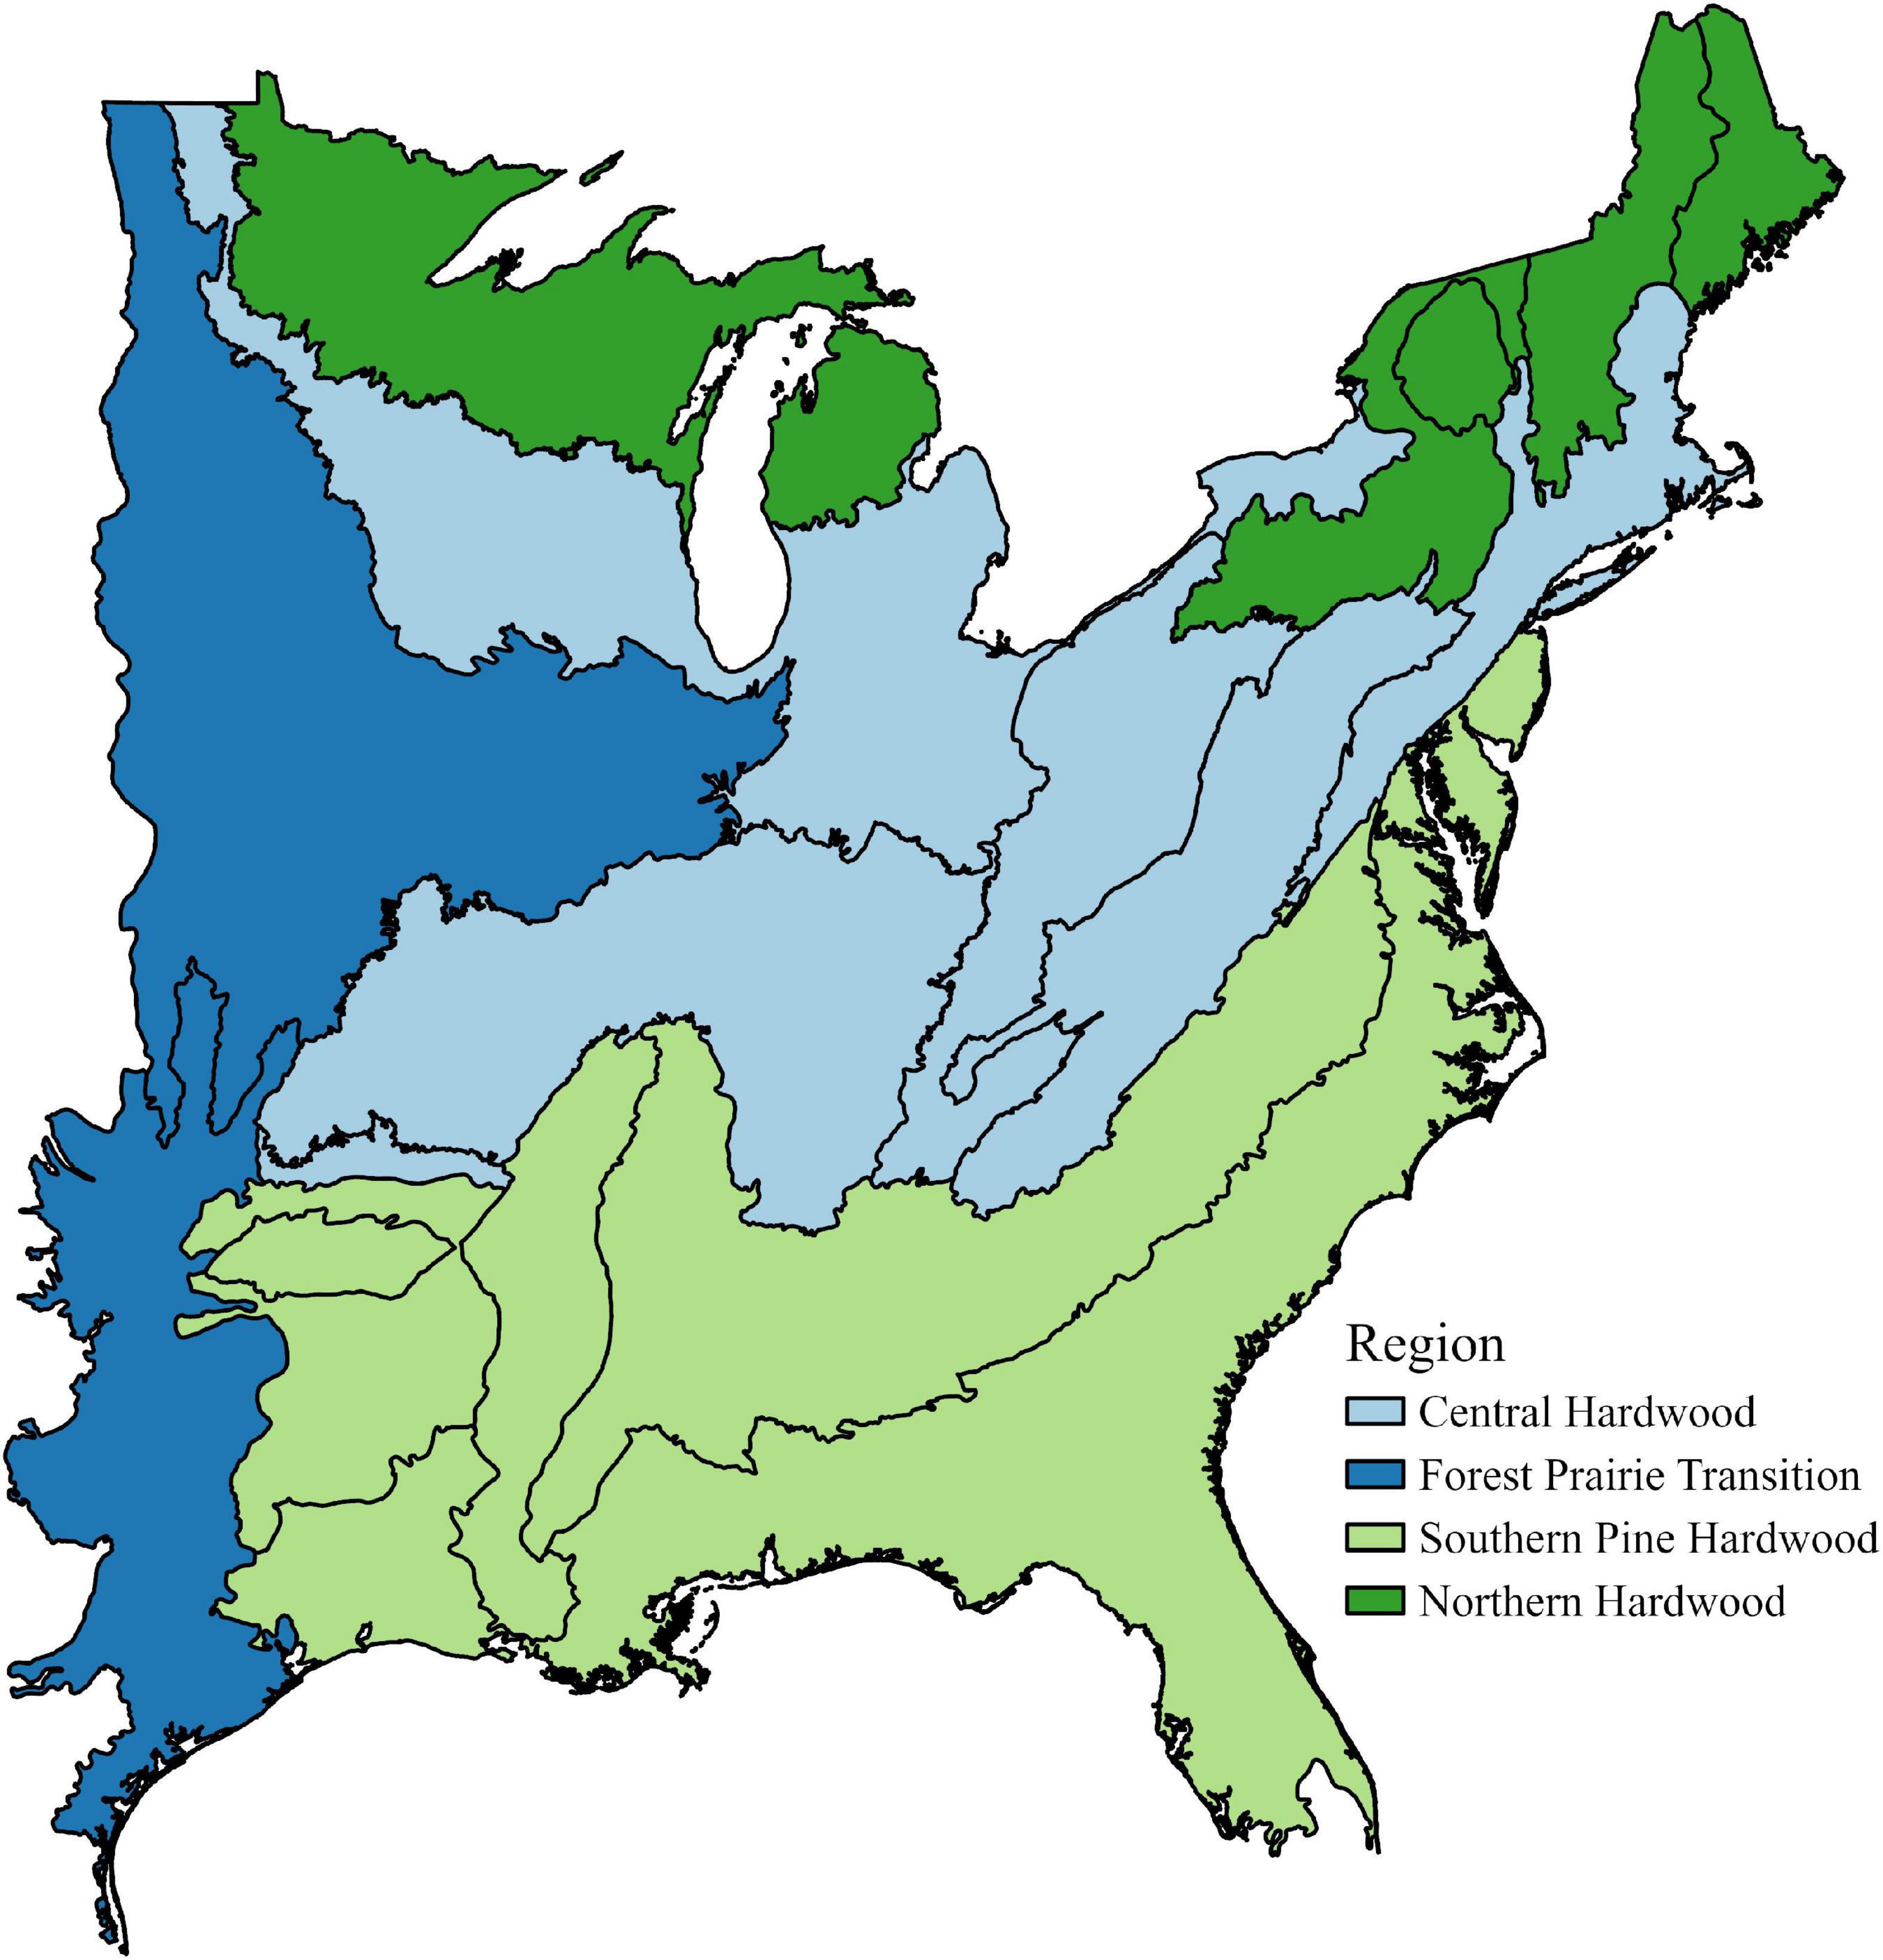
Figure 1. Ecological regions and subregions of the eastern United States included in analysis. Map based on McNab et al. (2007).
We used data from the United States Department of Agriculture (USDA) Forest Service Forest Inventory and Analysis (FIA) plots sampled within this study area. These data are publicly available in the FIA database (FIADB). FIADB represents a long-term record of field measurements distributed across the US. Prior to the late 1990s, FIA plots were sampled periodically and asynchronously. Due to variation in sampling methodology associated with the periodic sampling design, we restricted analysis to plots sampled using the annual design. This design provides a consistent, nation-wide, semi-systematic sampling strategy where a spatially dispersed portion of the plot grid is sampled each year. Plots were planned at an intensity of approximately one per 24.3 km2, but only plots located in accessible forested areas were established in the field as permanent inventory plots. Briefly, these plots consist of four 7.32 m fixed-radius subplots with one center subplot and 3 surrounding subplots arranged 36.6 m apart (total sample area is approximately 675 m2). All standing trees with a diameter at breast height (dbh) of at least 12.7 cm are tallied on each subplot, but field crews collect a myriad of data variables. For a detailed outline of the FIA sampling methodology, see the FIA National Core Field Guide (USDA Forest Service, 2022).
For our analysis, we looked at both current conditions and change through time by comparing two different inventory periods. Time Period 1 (TP1) is the first measurement available for annual sample design plots, while Time Period 2 (TP2) is the most recent plot measurement. We used a subset of plots that met the following criteria: plots that were centered in accessible forest land, that were stocked (i.e., we removed all plots listed as “non-stocked”), and that represented common forest types. In other words, we did not include plots that sampled forest types which were represented by fewer than 350 plots, many of which are dominated by non-native species (for details, see Supplementary Table 1). All other forest types were represented by > 1,700 plots (Supplementary Table 1). For all calculations, we only used values for live trees.
Mesophication metrics
To address our hypotheses, we evaluated change based on (1). current conditions (which we refer to as “degree” of mesophication) and (2). change through time (“rate” of mesophication). The degree of mesophication was calculated as the difference in each metric (described below) between the overstory and the midstory during the most recent sampling period (TP2). This provides an estimate of the discrepancy in identity of the forest canopy layers. Mesophication metrics were calculated for two different canopy strata at each plot: trees ≥ 25.4 cm dbh (hereafter “overstory”) and trees ≥ 12.7 and < 25.4 cm dbh (hereafter “midstory”). Degree was calculated so interpretation of our results is similar to that of change through time-with the current condition (overstory) subtracted from the predicted future condition (midstory). The rate of mesophication was calculated for all trees ≥ 12.7 cm dbh. Because individual states complete inventories at variable rates, the time interval between resampling varies (average time between resampling in our study was 12.9 years). To account for this, and accurately compare across our sampling area, the rate of mesophication was calculated as the change per decade to aid in comparison with Knott et al. (2019). We calculated the rate and degree of mesophication based using three functional traits and by taxonomic group/compositional change, which we collectively refer to as “mesophication metrics.” This resulted in 8 models: (1). Rate based on shade tolerance, (2). Rate based on drought tolerance, (3). Rate based on fire tolerance, (4). Rate based on species change, (5). Degree based on shade tolerance, (6). Degree based on drought tolerance, (7). Degree based on fire tolerance, and (8). Degree based on species change.
For our functional metrics, we used community-weighted means (CWMs; the mean of trait values weighted by the relative abundance of each species) of trait values associated with mesophication. CWMs were calculated separately based on shade tolerance, drought tolerance, and a fire adaptation metric (Table 1). Shade and drought tolerance values were based on Niinemets and Valladares (2006) and range from 1 (low) to 5 (high; Table 1). We wanted our fire metric to be based on a species overall adaptation to fire, which could include adaptations that allow a species to survive or respond following fire (i.e., resprout or reseed). To quantify this, we compared several metrics for fire tolerance and resistance from the TRY trait database (Kattge et al., 2011) to better represent a variety of adaptations to fire (e.g., serotinous cones in jack pine, which is listed as having no fire tolerance and no fire resistant in the USDA Plants trait database). We started with the fire tolerance index from the USDA Plants database (USDA and NRCS, 2020). We assigned numeric values to each level for analysis (e.g., we assigned “None” as 0, “Low” as 1, “Medium” as 2, and “High” as 3; Table 1). When data was not available for a given species, we used the similarly categorized fire tolerance data available via TRY from Liebergesell et al. (2016). We then compared these values to the fire resistance, grass stage, and fire regime data from TRY. When these values suggested an adaptation to fire not represented by the tolerance data (i.e., a species was adapted to surface fires or exhibits a grass stage) we increased the fire metric value by one (but did not go over our max value of 3; Table 1 and Supplementary Table 2). Finally, when a species was listed as adapted to crown fires, we assigned that species the maximum fire metric value (3; Table 1 and Supplementary Table 2). This resulted in a fire metric representing a cumulative quantification of tree species adaptations to fire given the available data.
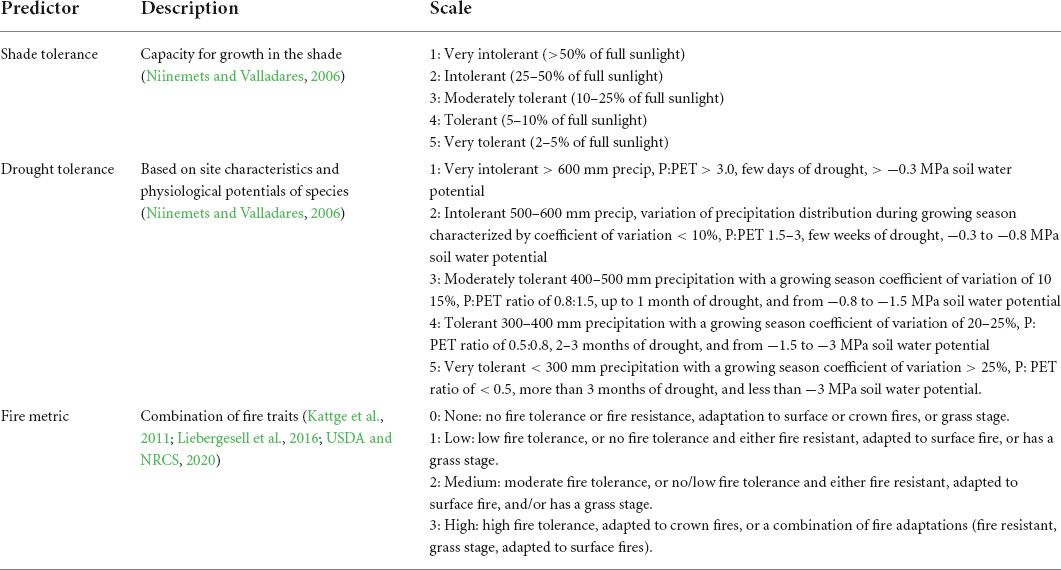
Table 1. Functional metrics used in mesophication models based on community-weighted means of shade tolerance, drought tolerance, and fire adaptations.
In some cases, trait values were not available for a given species found in the FIA plot data. In this case, we used the trait average of all species within the given genus in the applicable trait dataset for that species. In cases where a given individual was identified to genus, but not species, we used the trait average of all species within the given genus present in the subset of FIA data used for analysis (e.g., for an individual listed as “Amelanchier spp.” in the plot data, we used the average trait value for all Amelanchier spp. present in plots in the eastern US and the trait database, but didn’t include trait values for Amelanchier spp. not found in the eastern US when calculating the CWM; Supplementary Table 3). None of our final plot-level functional indices (shade, drought, fire metric) were strongly correlated based on Pearson’s or Spearman’s correlation coefficients (absolute correlation less than 0.37; Supplementary Tables 4, 5).
In addition to CWMs, we calculated the difference in the change in importance value (IV, %) of two species groups, resulting in two models (rate and degree). We calculated IV as the average of the relative density and relative abundance (Knott et al., 2019). We grouped species noted in the literature to benefit from the mesophication process (i.e., mesophication “winners”: Acer rubrum, Acer saccharum, Fagus grandifolia, Betula spp., Prunus serotina, Liriodendron tulipifera, Nyssa sylvatica) and second, we grouped those species that are noted to perform poorly (i.e., mesophication “losers”: Quercus spp., Pinus spp., Carya spp.; Nowacki and Abrams, 2008; Fei et al., 2011; Olson et al., 2014; Alfaro Reyna et al., 2018; Dyer and Hutchinson, 2019; Radcliffe et al., 2020, 2021). We then modeled the difference between the change in IV of mesophication winners and mesophication losers for simplicity, as it represents how the “winners” group is doing compared to the “losers” group.
General linear models with a Gaussian distribution were used to model the rate and degree of mesophication in R. While some of our modeled values are theoretically bounded, no issues were observed with our diagnostic plots, and means rarely, if ever, approached these boundaries. All continuous predictors were centered and scaled. Variance inflation factors for all continuous predictors were less than 4. We compared the effect size of our results from models containing all of our proposed predictors, as opposed to removing predictors and basing conclusions on a final model with a subset of our predictors, as our dataset is very large, making significant relationships likely even when effect sizes are small. In many cases, we were also primarily focusing on particular levels of our categorical predictors (i.e., oak/hickory forest type) and wanted to ensure we didn’t miss ecologically meaningful effects in a subset of the levels of our categorical predictors.
Model predictors
We explored potential drivers of mesophication relating to stand, edaphic, topographic, and disturbance characteristics (Table 2). Predictor data used in our analyses included data collected on FIA plots, data from the publicly available gSSURGO soil database, and ecological region and province (McNab et al., 2007; Table 2). To accurately extract edaphic and topographic variables from GIS layers, we used the actual plot coordinates (Drohan et al., 2003; Prisley et al., 2009). We derived aspect, terrain shape index, and curvature from a 30 m resolution digital elevation model (DEM). Terrain shape index (TSI) and curvature were strongly correlated (Pearson’s 0.94), so we chose to only include TSI.
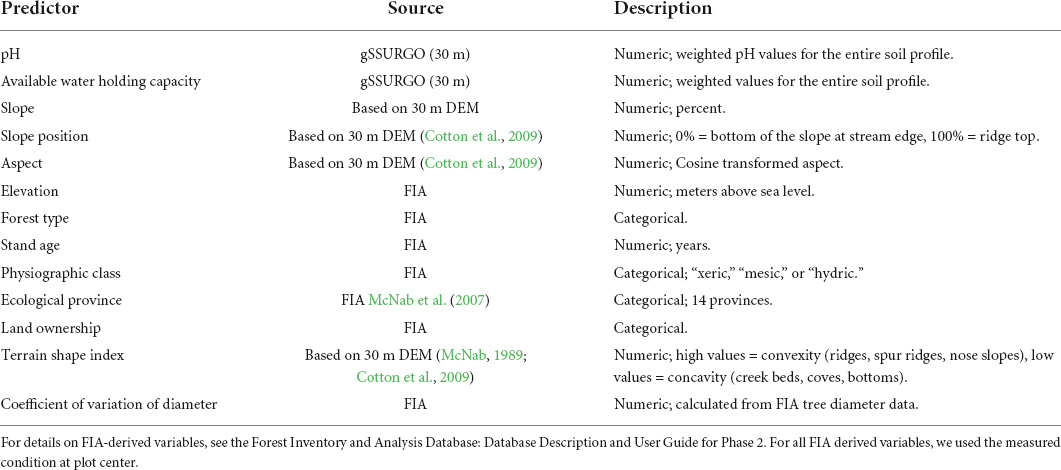
Table 2. Variables included in fine-scale models of mesophication in the eastern US.
We included two-way interactions between a subset of our predictors based on the literature and to better inform management. We included interactions between forest type and all other predictors to better understand how mesophication varies within common forest types of interest (i.e., oak/hickory forests; Oak, 2016). Additionally, to account for the importance of topographic and soil characteristics that strongly control moisture availability, we included two-way interactions between (a) available water holding capacity and slope position, and (b) aspect and slope (Oak et al., 1996; Palus et al., 2018). Analyses were performed in R and figures were produced using the effects and ggplot2 packages (Fox, 2003; Wickham, 2016; R Core Team, 2019).
Results
We found several fine-scale variables were important predictors of mesophication, both in terms of effect size and significance, across our models (Tables 3, 4 and Supplementary Table 6). Stand age and diameter variability were consistently important. Physiographic condition, soil pH, and slope were also significant in at least half of our models. The way in which mesophication is quantified (i.e., based on shade, drought, or fire metrics, or compared as change through time vs. differences between canopy strata) did, in some cases, impact how mesophication changed across environmental gradients.
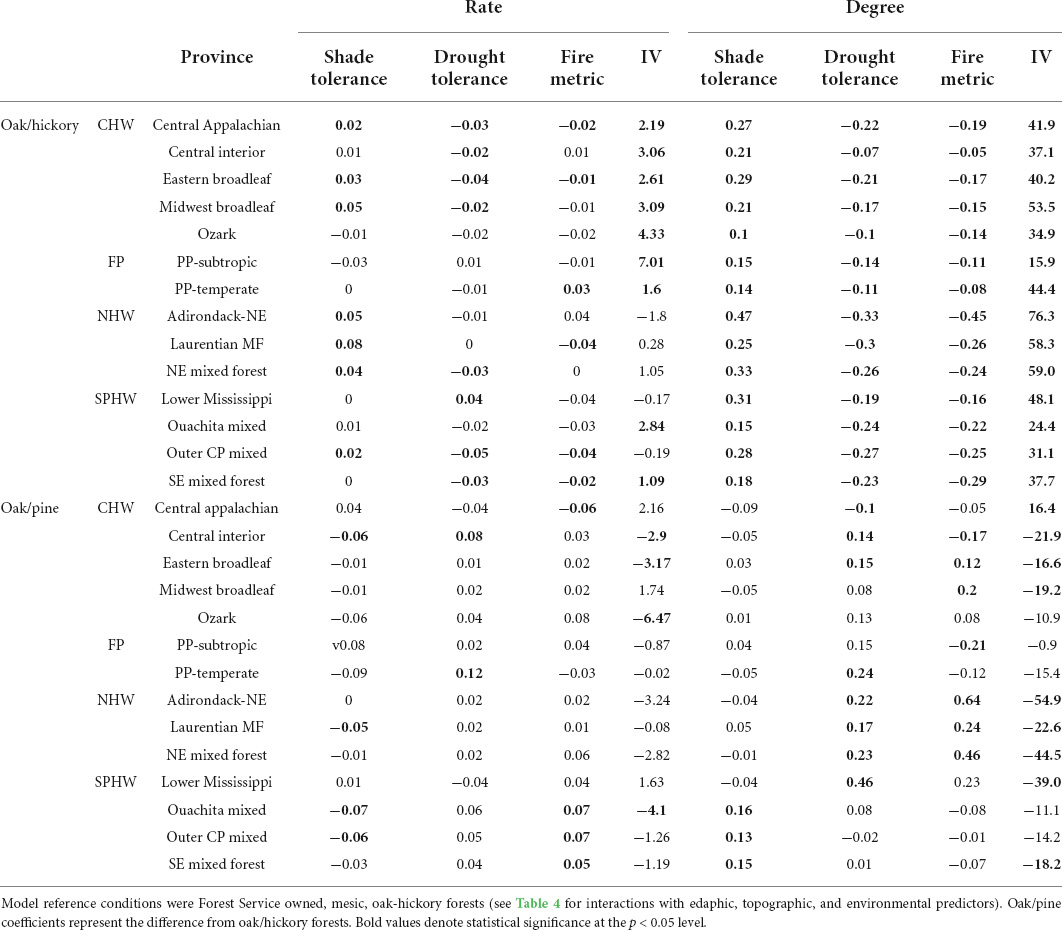
Table 3. Coefficient estimates of interactions between oak/hickory and oak/pine forests and ecological provinces in the eastern US.
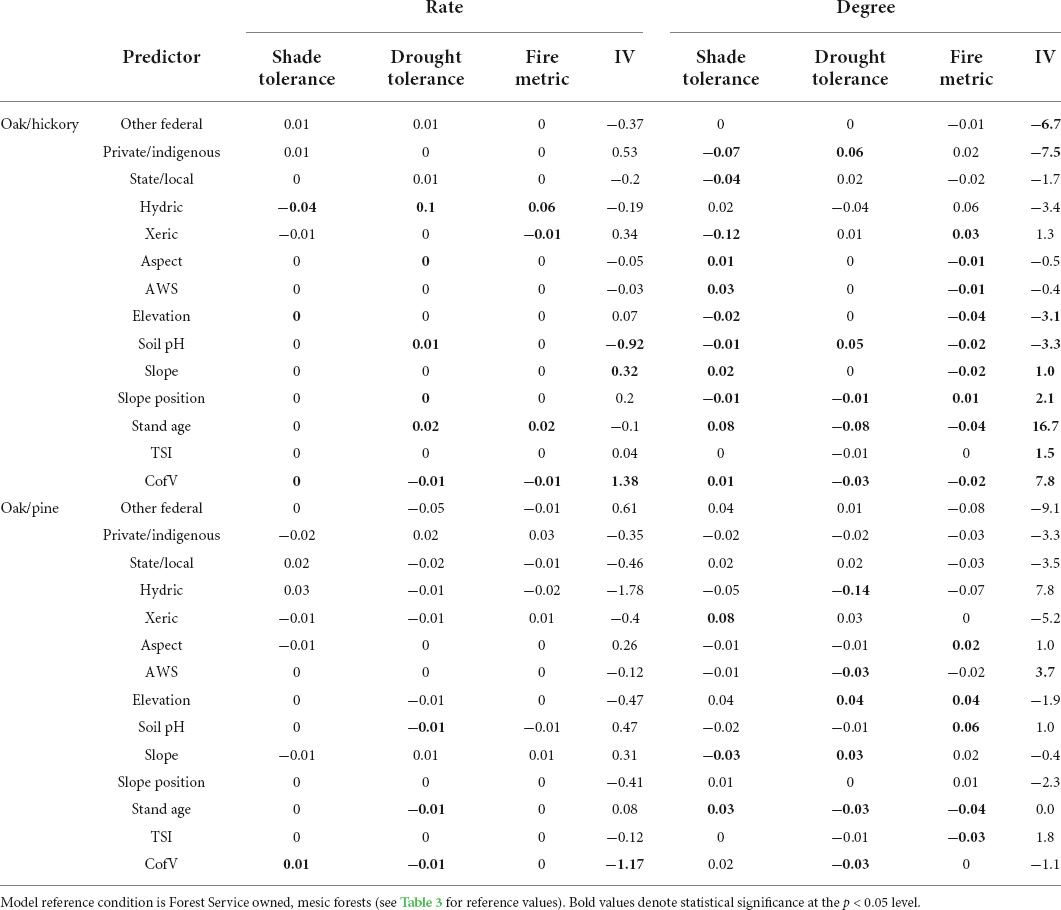
Table 4. Coefficient estimates of interactions between Oak/hickory and Oak/pine forests and edaphic, topographic, and environmental predictors in the eastern US.
Ecological province
Our results suggest that mesophication, when evaluated by comparing the difference in the CWM shade, drought, and fire tolerance between canopy strata (mesophication degree), is occurring in oak/hickory forests in all 14 ecological provinces we included in analysis (p < 0.001; Table 3, Figure 2, and Supplementary Table 6). In other words, midstory tree communities were more shade tolerant, and less drought and fire tolerant, than overstory communities. When comparing change in CWMs through time (mesophication rate), our results were more varied across provinces, but we still generally found evidence for mesophication (Table 3).
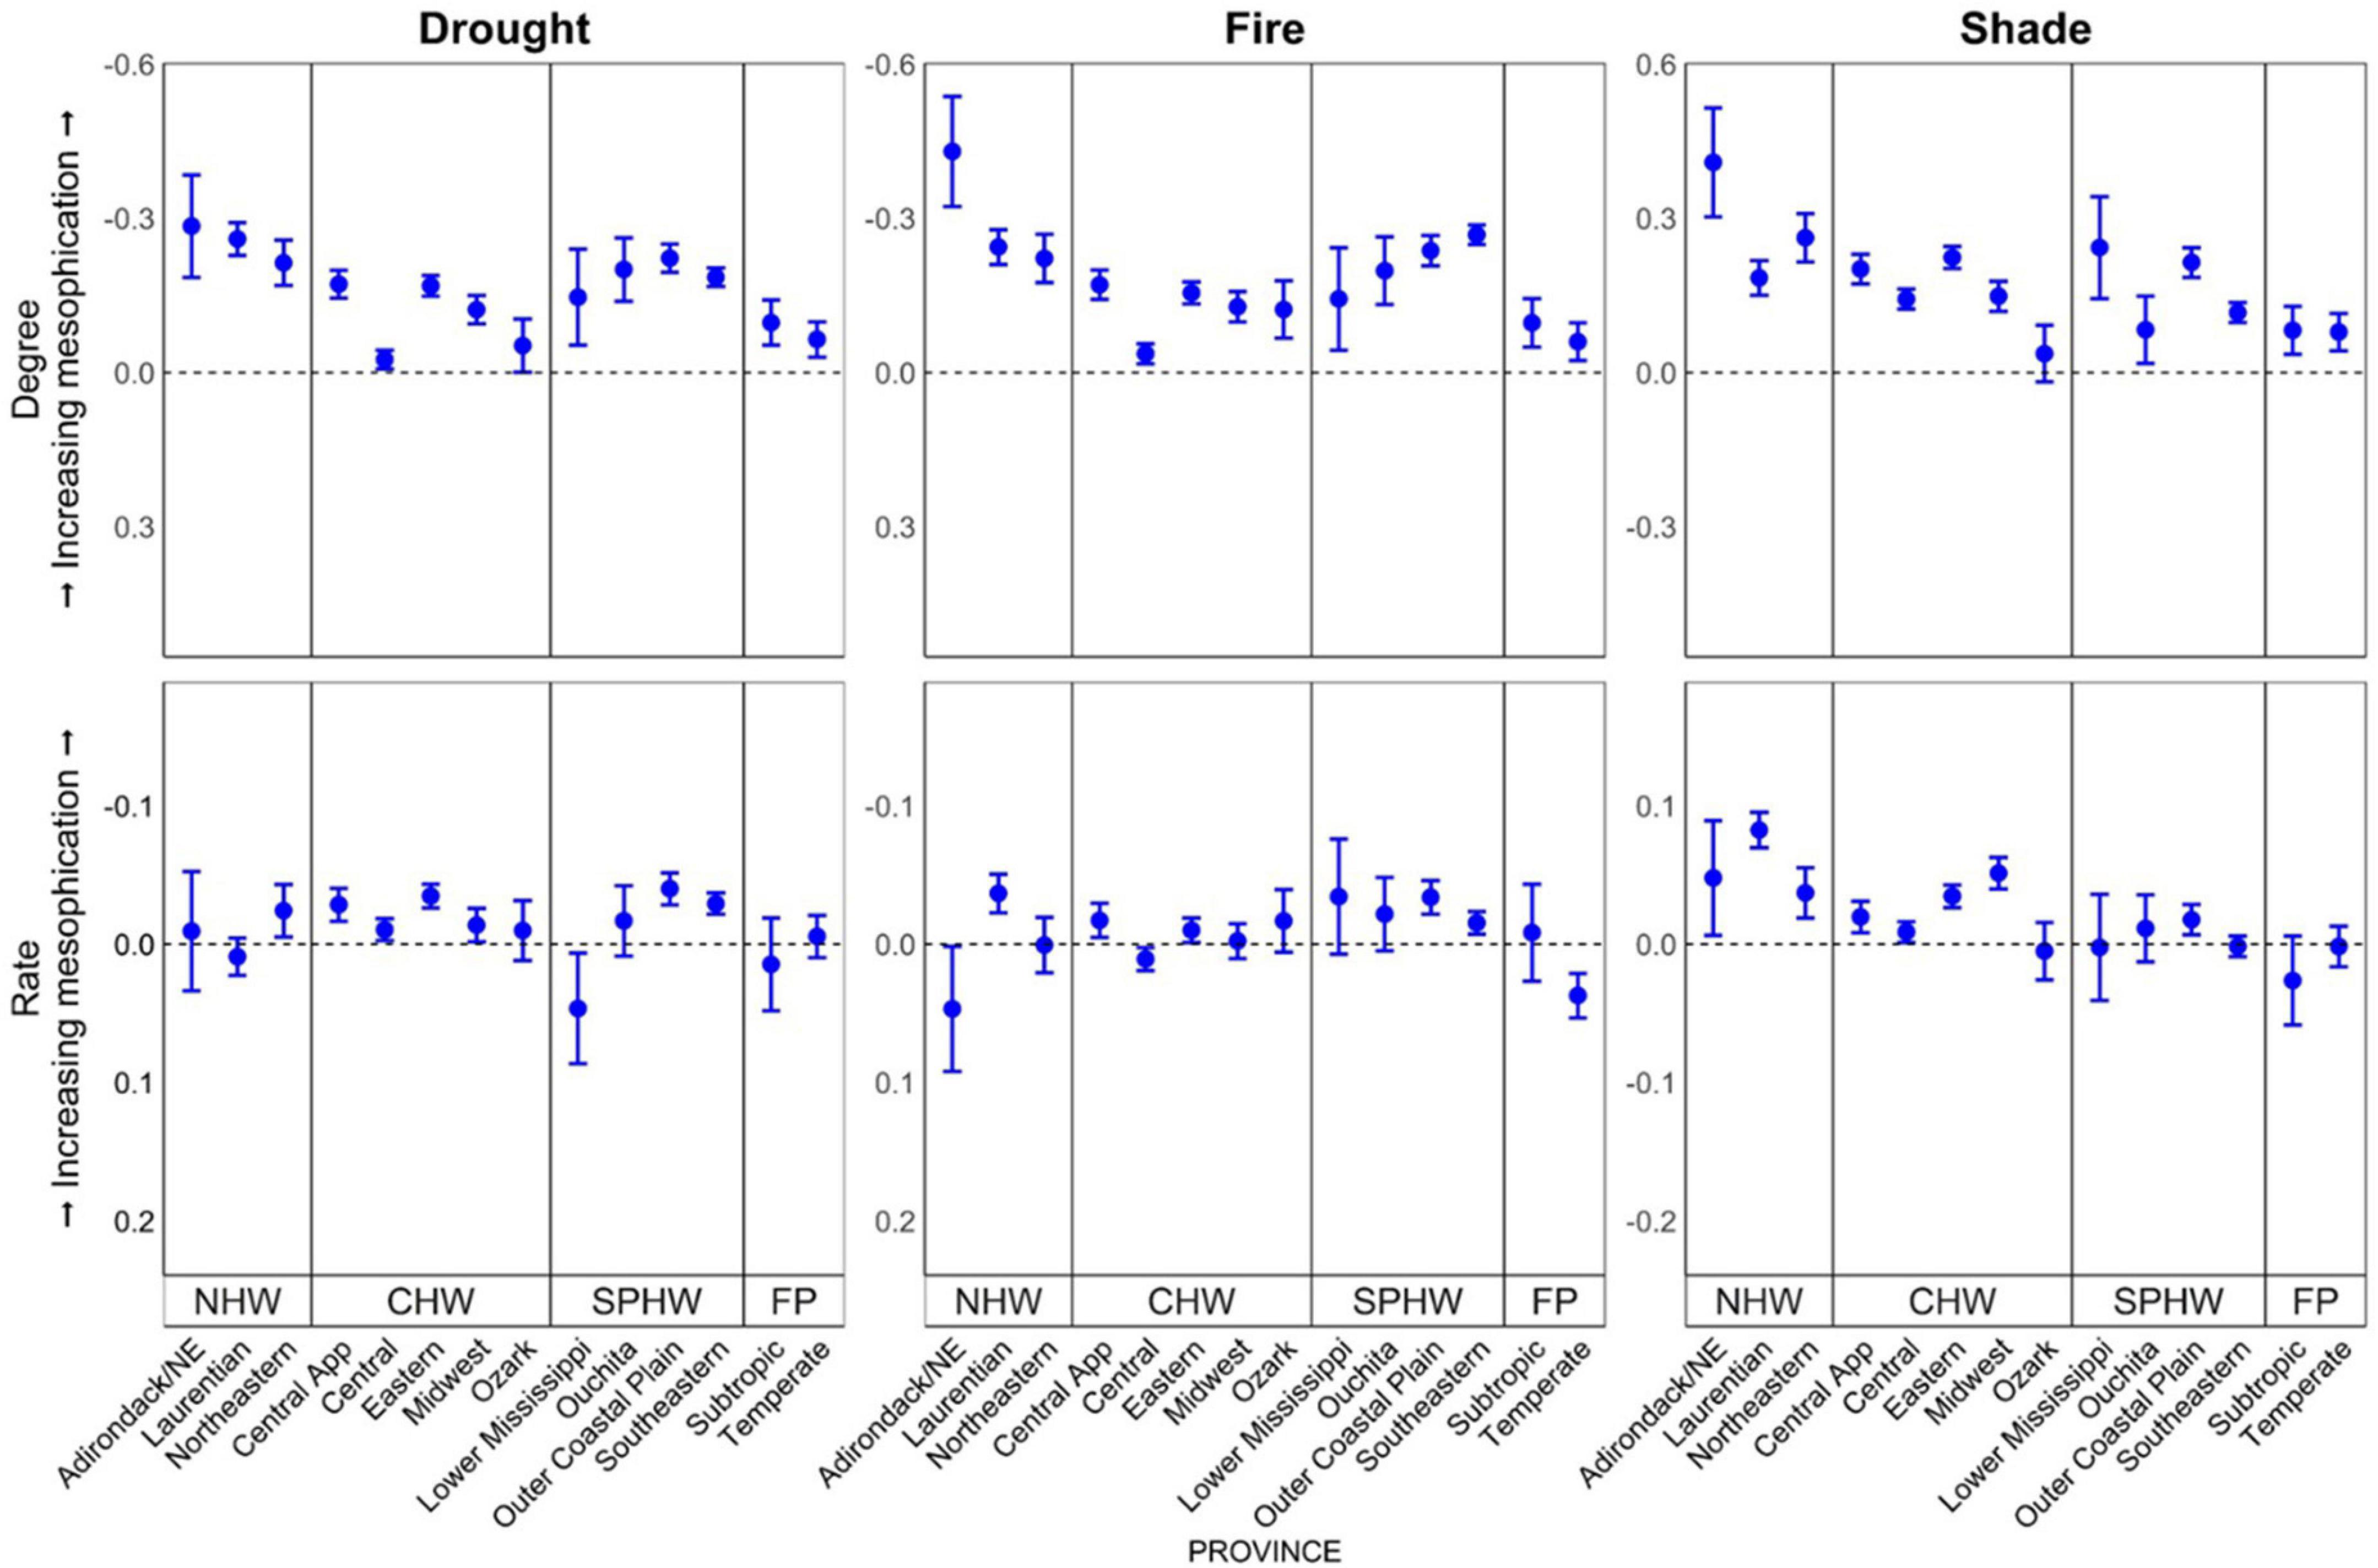
Figure 2. Degree (first row, n = 59,990) and rate (second row, n = 53,533) of mesophication based on functional identity of shade, drought, and fire tolerance by ecological province (McNab et al., 2007) in oak/hickory forests on FIA plots in the eastern US. Degree (midstory-overstory) was calculated as the difference in the community-weighted mean of midstory (≥12.7 and <25.4 cm dbh) and overstory (≥25.4 cm dbh) trees. Rate was calculated as the change in functional identity of trees ≥ 12.7 cm dbh per decade. Provinces are grouped by region (NHW, Northern hardwood; CHW, Central hardwood; SPHW, Southern pine hardwood; and FP, Forest-Prairie transition). Effects were evaluated with continuous predictors held at their mean value and categorical predictors as a weighted average of within-level fitted values, with weights proportional to the number of observations in each factor.
Oak/pine forests exhibited evidence of mesophication, but this forest type was more variable between ecological provinces (Table 3). In several cases, we found differences in the degree and rate of mesophication in oak/pine forests compared to oak/hickory forests (Table 3 and Supplementary Figure 1). Oak/pine forests in the Adirondack-NE mixed/conifer/meadow and NE mixed forest province had greater mean fire tolerance in the midstory compared to the overstory (p < 0.001; 0.64 and 0.46 decrease in degree of mesophication based on fire tolerance). Lower Mississippi riverine oak/pine forests had greater drought tolerance in the midstory (p < 0.001; 0.46 decrease in degree of mesophication compared to oak/hickory forests; Table 3 and Supplementary Figure 1). In a few cases, the degree of mesophication was greater in oak/pine than in oak/hickory forests. In the Southern Pine Hardwood and the Forest-Prairie region, the degree of mesophication was often greater in oak/pine forests when based on fire tolerance (Table 3 and Supplementary Figure 1).
We also compared changes in the importance of suites of species positively and negatively associated with mesophication. Species positively associated with mesophication increased in IV at a greater rate than those negatively associated with mesophication in the Forest-Prairie region, and in much of the Southern Pine-Hardwood and Central Hardwood region (Table 3 and Figure 3). Species negatively associated with mesophication showed similar changes in IV or increased at a greater rate when controlling for other predictors in the Northern Hardwood region, most notably the Adirondack province (decrease of 1.8 and 3.2 IV per decade; Table 3 and Figure 3).
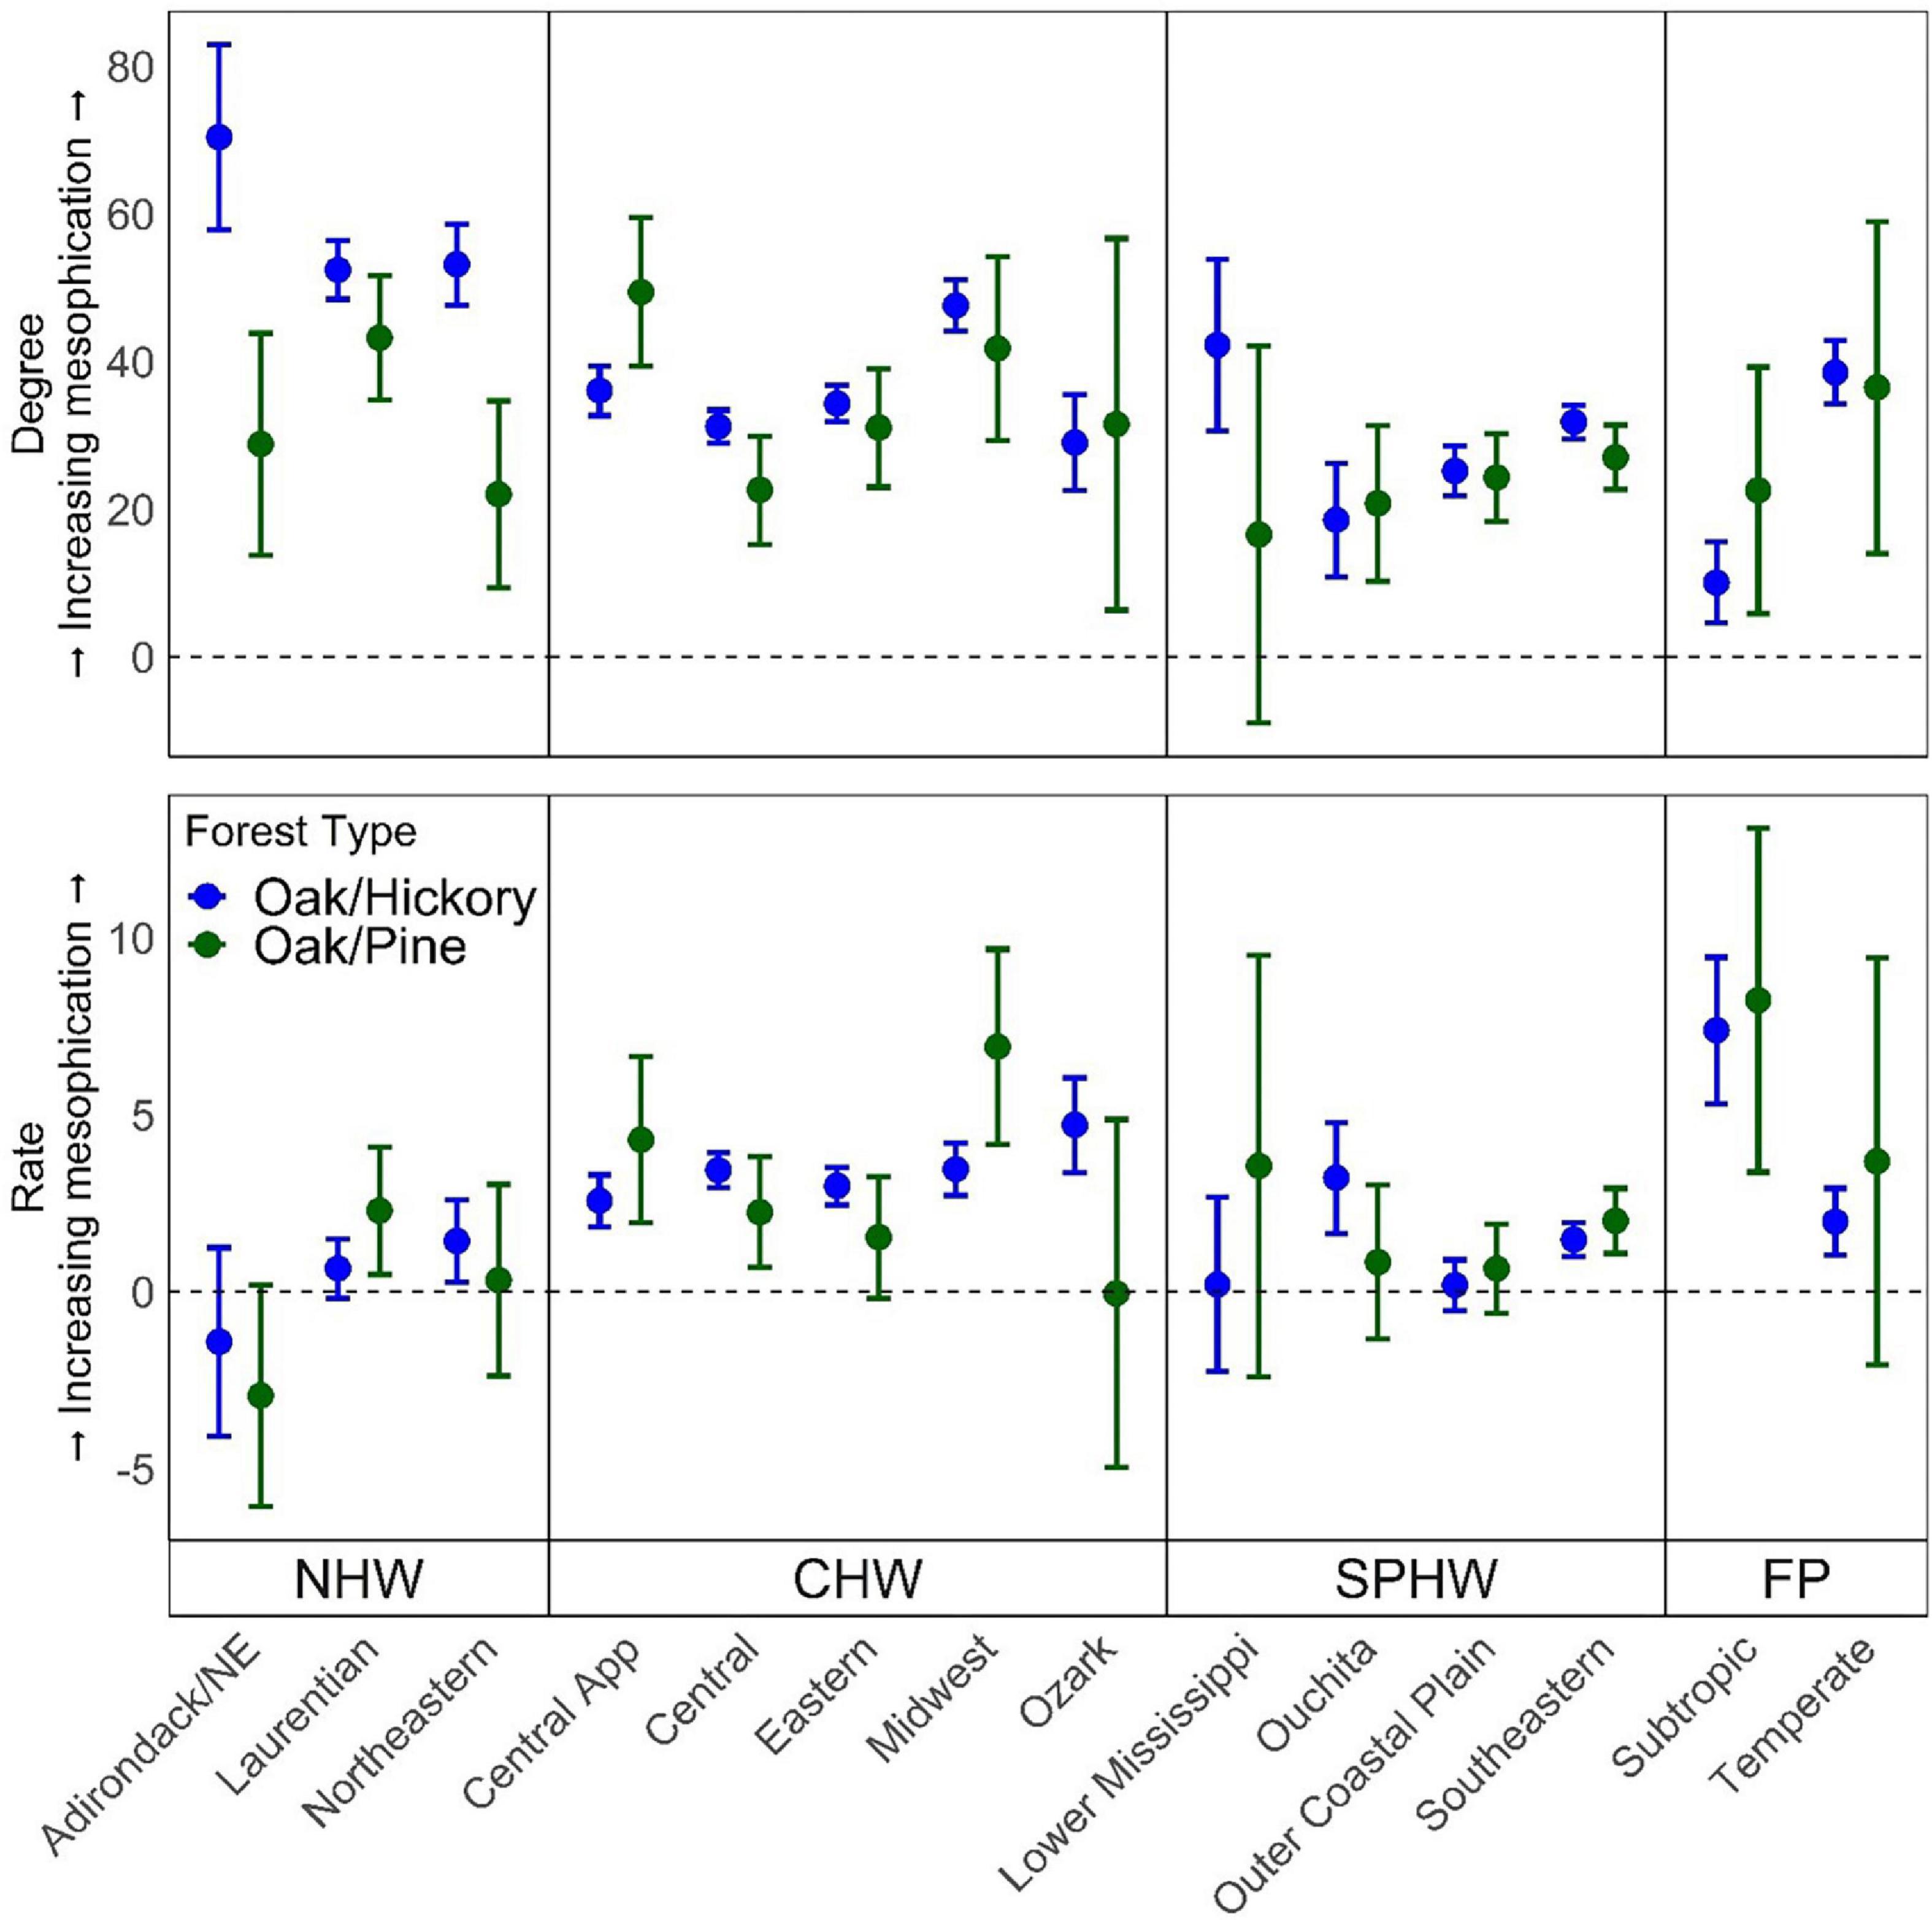
Figure 3. Degree (first row, n = 59,990) and rate (second row, n = 53,533) of mesophication calculated as a function of the difference in the change in importance value (IV) between species positively and negatively associated with mesophication by ecological province (McNab et al., 2007) in oak/hickory and oak/pine forest types on FIA plots in the eastern US. Degree (midstory-overstory) was calculated as the difference in the community-weighted mean of midstory (≥12.7 and <25.4 cm dbh) and overstory (≥25.4 cm dbh) trees. Rate was calculated as the change in functional identity of trees ≥ 12.7 cm dbh per decade. Provinces are grouped by region (NHW, Northern hardwood; CHW, Central hardwood; SPHW, Southern pine hardwood; FP, Forest-Prairie transition). Effects were evaluated with continuous predictors held at their mean value and categorical predictors as a weighted average of within-level fitted values, with weights proportional to the number of observations in each factor.
Owner group
Differences in mesophication between owner groups were small compared to differences between provinces (Tables 3, 4). The degree of mesophication was lower on privately and indigenously owned forests for all our CWMs, and on state/locally owned forests based on drought and shade tolerance compared to Forest Service owned land (Table 4 and Supplementary Figure 2). The rate of mesophication was often greater than other owner groups on non-Forest Service federal lands, but this difference was variable and not significant (Table 4 and Supplementary Figure 2). Mesophication degree based on IV suggest private/indigenous owned and other federally owned lands show less mesophication, but this difference wasn’t significant when mesophication rate was compared (Table 4 and Supplementary Figure 3).
Stand characteristics
Mesophication changed more rapidly along stand age and coefficient of diameter gradients than with other continuous predictors (Table 4, Figure 4, and Supplementary Figure 4). Regardless of whether mesophication was quantified based on shade, drought, or fire tolerance, the degree of mesophication was greater in older stands and more variable stands. In other words, the overstories of older stands and those with more variable tree sizes were more drought and fire tolerant, and less shade tolerant. This was also true when mesophication was quantified based on IV, where species positively associated with mesophication outperformed those negatively associated with mesophication in older and more variable stands (Table 4, Figure 4, and Supplementary Figures 5, 6). However, the rate of mesophication decreased with stand age for all our metrics except shade tolerance (Table 4). The rate and degree of mesophication, regardless of metric, increased with coefficient of diameter (Table 4 and Supplementary Figures 4, 6). Mesophication also varied by forest type. We focus on oak/hickory and oak/pine forests in our results described above, but for results from other forest types see Supplementary Table 6 and Supplementary Figures 7, 8.
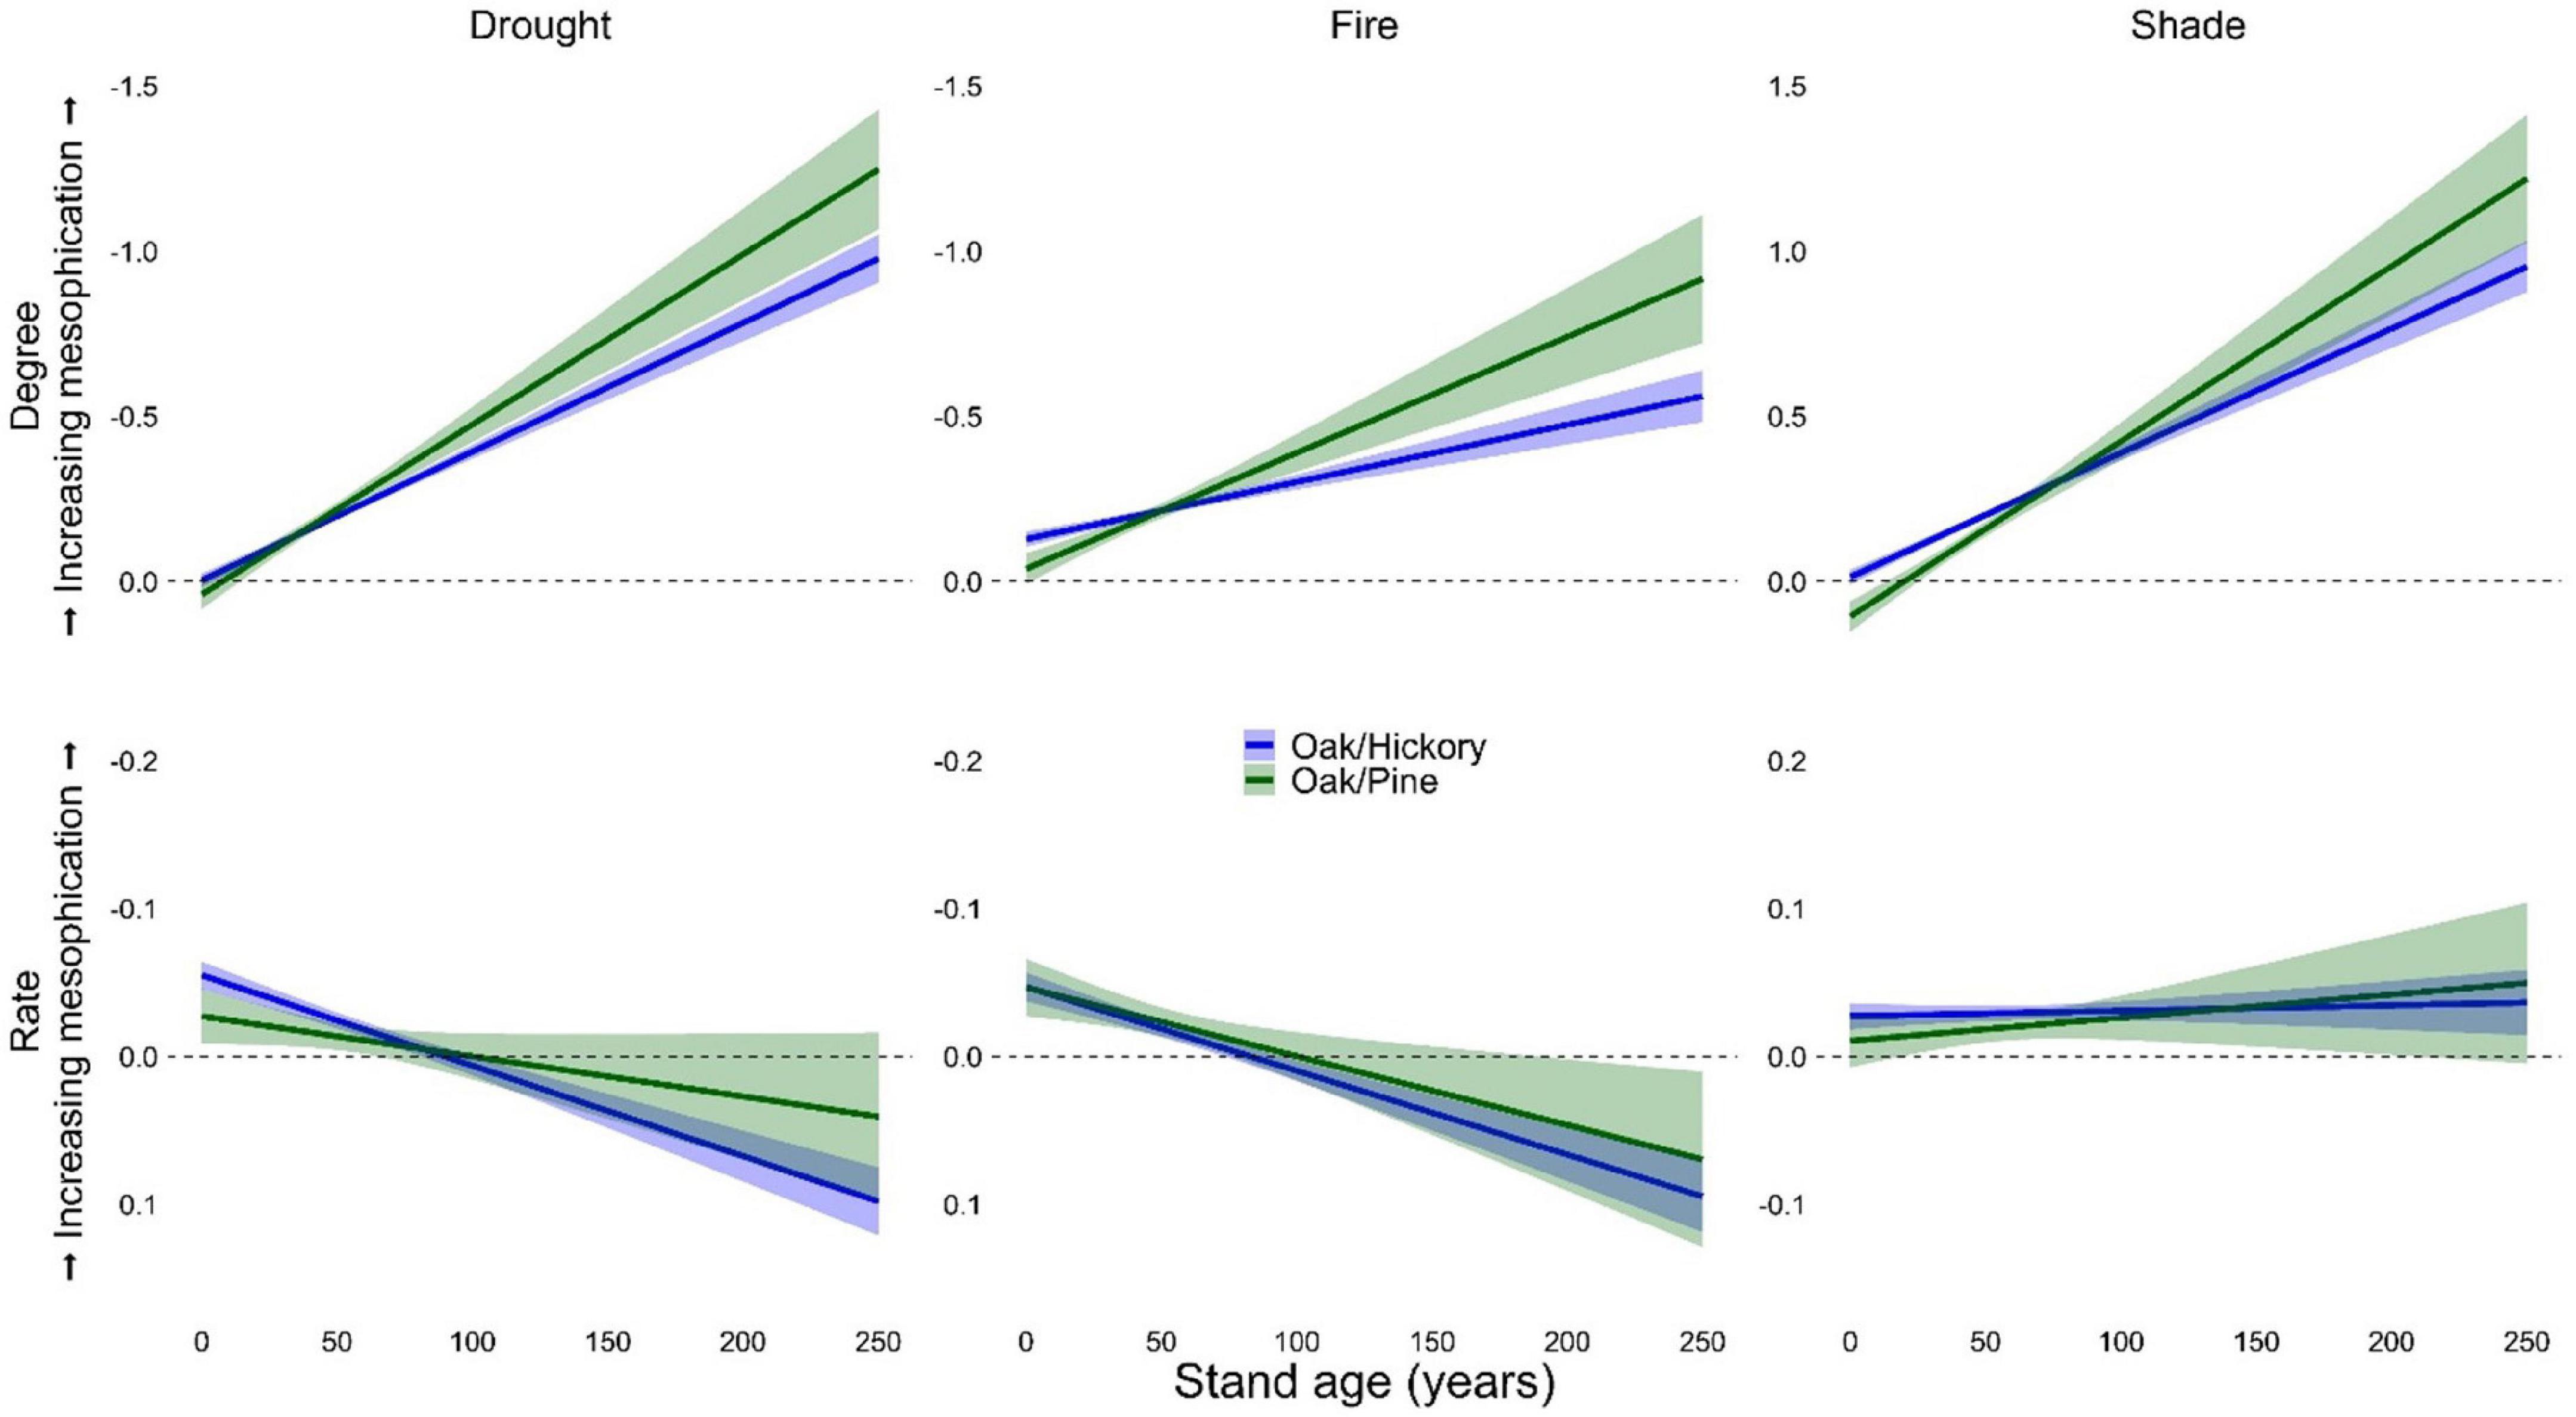
Figure 4. Degree (first row, n = 59,990) and rate (second row, n = 53,533) of mesophication based on functional identity of shade, drought, and fire tolerance as a function of stand age in oak/hickory forests on FIA plots in the eastern US. Degree (midstory-overstory) was calculated as the difference in the community-weighted mean of midstory (≥12.7 and <25.4 cm dbh) and overstory (≥25.4 cm dbh) trees. Rate was calculated as the change in functional identity of trees ≥ 12.7 cm dbh per decade. Effects were evaluated with continuous predictors held at their mean value and categorical predictors as a weighted average of within-level fitted values, with weights proportional to the number of observations in each factor.
Environmental and physiographic conditions
In general, mesophication was greater in areas that accumulate water (Table 4). Mesophication either was similar or was greater in wetter areas based on soil available water holding capacity and terrain shape index (i.e., mesophication, based on drought and fire tolerance, increased as topography changed from convex/ridges to concave/coves, particularly in oak/pine forests; Table 4 and Supplementary Figures 9–12). We found mixed evidence for the relationship between slope and mesophication, with evidence for mesophication not changing or increasing with slope in some cases (in oak/hickory forests) and decreasing in others (in oak/pine forests; Table 4). Mesophication was much more variable at steeper slopes and greater water supply in oak/pine forests (Table 4 and Supplementary Figures 13, 14).
Based on the FIA categorial variable of physiographic condition (hydric, mesic, or xeric), the degree of mesophication was greater in mesic stands (compared to xeric stands) when evaluated based on shade, drought, or fire adaptations (Table 4 and Supplementary Figures 15, 16) in both oak/hickory and oak/pine forests. The rate of mesophication was also generally greater in mesic stands compared to xeric stands (Table 4). Similar to slope and AWS, the rate and degree of mesophication in hydric stands was much more variable regardless of metric (Table 4 and Supplementary Figures 15, 16).
Relationships between mesophication metrics and elevation and soil pH were often highly variable or conflicting (Table 4 and Supplementary Figures 17–19). In oak/hickory forests, fire tolerance and shade tolerance were greater in the overstory (compared to midstory) at higher elevations (suggesting a conflicting relationship between mesophication and elevation; Table 4 and Supplementary Figure 17). Mesophication metrics in oak/pine forests were highly variable at high elevations (Supplementary Figures 17, 18). The relationship between mesophication and pH was generally negative (Table 4, Figure 5, and Supplementary Figure 19). When categorized based on shade tolerance, drought tolerance, or importance value, mesophication decreased with increasing pH (Figure 5 and Supplementary Figure 19). When categorized based on fire tolerance, the relationship between mesophication and pH varied by forest type. In oak/pine forests, like most other models, mesophication decreased with increasing pH. In oak/hickory forests, mesophication increased with increasing pH (Figure 5).
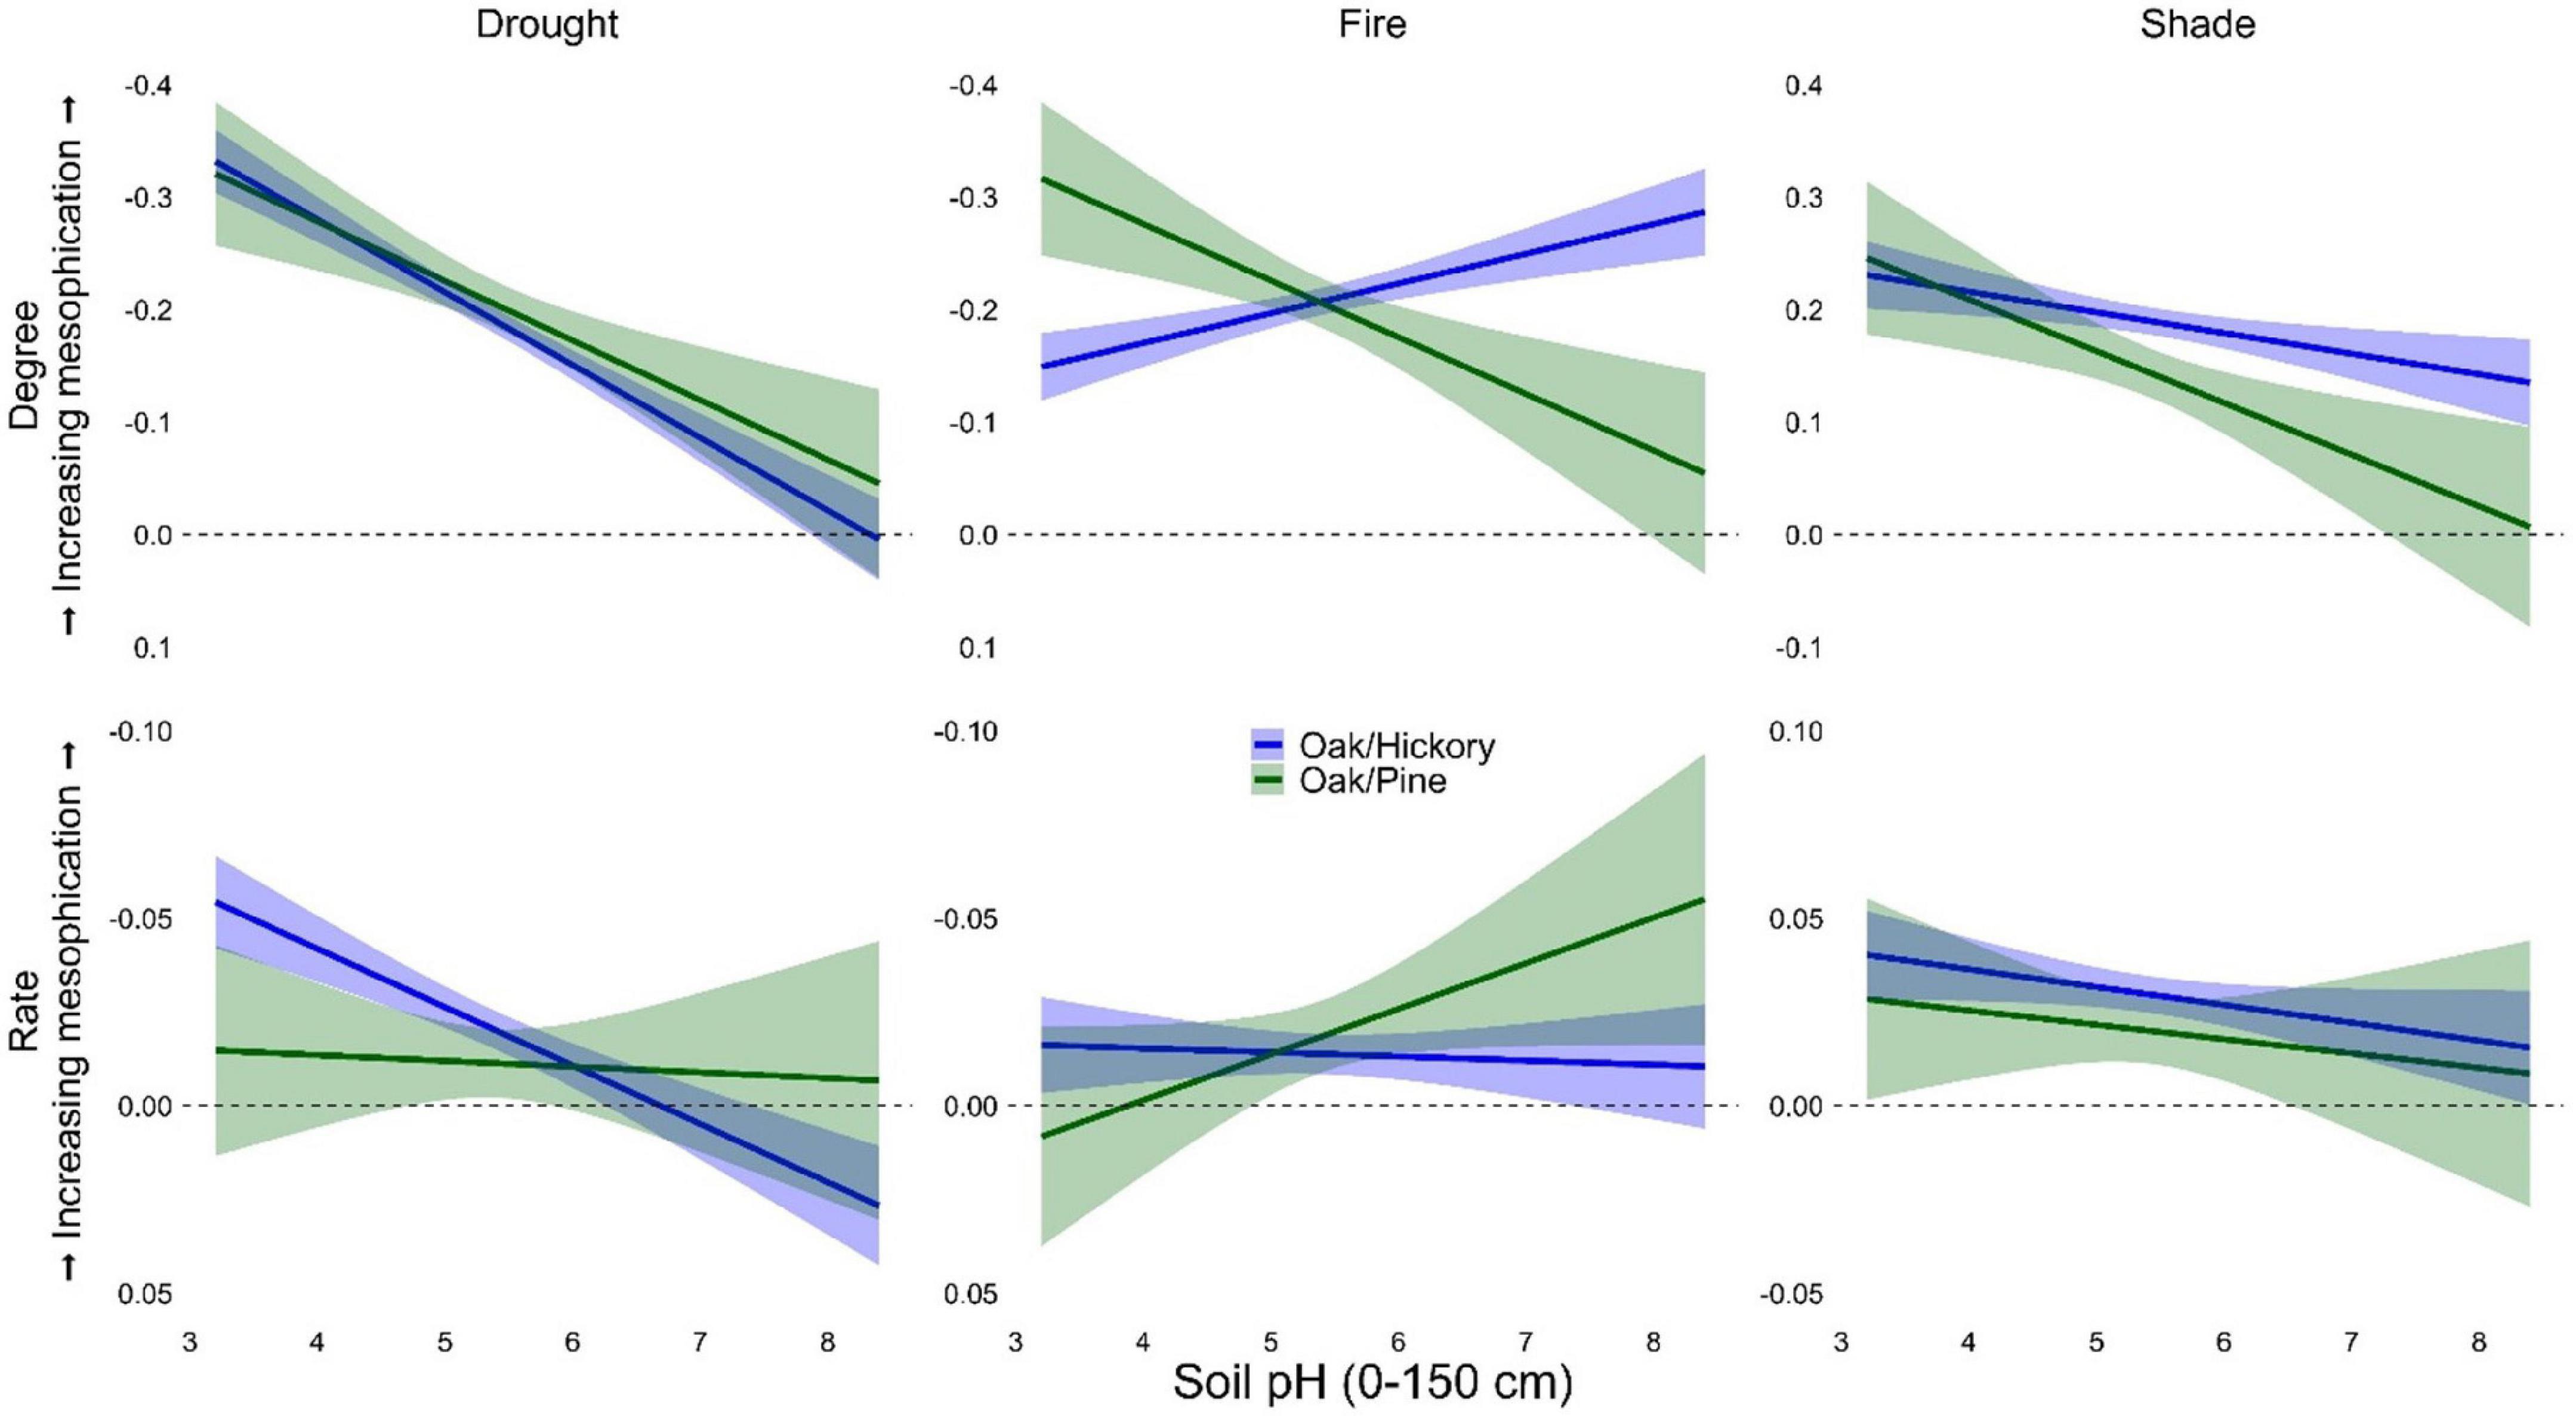
Figure 5. Degree (first row, n = 59,990) and rate (second row, n = 53,533) of mesophication based on functional identity of shade, drought, and fire tolerance as a function of soil pH in oak/hickory and oak/pine forests on FIA plots in the eastern US. Degree (midstory-overstory) was calculated as the difference in the community-weighted mean of midstory (≥12.7 and <25.4 cm dbh) and overstory (≥25.4 cm dbh) trees. Rate was calculated as the change in functional identity of trees ≥ 12.7 cm dbh per decade. Effects were evaluated with continuous predictors held at their mean value and categorical predictors as a weighted average of within-level fitted values, with weights proportional to the number of observations in each factor.
Discussion
In this study, we used multiple functional traits to quantify the extent of mesophication across fine-scale factors in the eastern US. Although mesophication has been explored extensively at broad spatial scales in the region (Fei et al., 2011; Knott et al., 2019), we address the need for an understanding of the stand- and watershed-level variability in mesophication and the site-specific factors controlling that variation. Understanding how mesophication varies, and how functional aspects of forests are changed, is increasingly important for conservation and management, as this transition will likely negatively impact a variety of ecological, social, and economic forest resources (Mcshea et al., 2007; Alexander, 2010; Hanberry and Nowacki, 2016). We found that stand characteristics, such as stand age and diameter variability, and environmental gradients, such as AWS, slope position, and soil pH, are important in driving variation in mesophication; however, functional characteristics (shade/drought/fire tolerance) did not always vary consistently.
Mesophication is often described as a trend toward forests increasingly dominated by shade tolerant species, along with a concurrent decrease in the overall fire tolerance of forests. However, much of the evidence for mesophication has been looking at species- or genera-level changes, and whether these functional metrics are changing consistently is unclear. We used a trait-based approach to assess the rate and degree of mesophication, and found that changes in CWMs of fire, drought, and shade tolerance were not always consistent. For example, we found mesophication was greater at high elevations and at high soil pH when fire tolerance was compared, but mesophication decreased with elevation and pH based on shade tolerance. Other studies have found that the species responsible for mesophication vary across topo-edaphic gradients (Nowacki and Abrams, 1992), even when the severity of mesophication (defined by taxonomic groups) is consistent along those gradients (Dyer and Hutchinson, 2019). In contrast, mesophication may be primarily driven by a single trait, such as shade tolerance, which is a better predictor of changes in forest composition, when evaluated at the genus level, than fire tolerance in the eastern US (Knott et al., 2019). Our comparisons between strata provide evidence for the transition to not just more shade-tolerant, as can be attributed to successional dynamics that predict increasing shade tolerance through time, but also less fire- and drought-tolerant, forests in the region. In short, our models provide evidence for the oak bottleneck (Nowacki and Abrams, 1992; Iverson et al., 2008), in addition to a broader functional bottleneck of shade intolerant, drought tolerant, and fire tolerant species.
While our results provide strong support for mesophication based on differences in forest strata, the results were more variable when comparing change through time (i.e., some provinces and regions didn’t show change through time). For example, we found that the functional differences between the midstory and the overstory increase as stands age, but we didn’t find that functional changes are occurring based on plot remeasurements in older stands. Younger stands are becoming less drought and fire tolerant, while older stands are more variable and are increasing in drought and fire tolerance. In other words, older stands were more resistant to mesophication compared to younger stands when we compared change through time, despite greater differences in functional identity between the midstory and overstory in older stands. Although these results may appear incongruent, rates of change, including changes in species composition, are more rapid during the earlier stages of stand development (Oliver and Larson, 1996). Changes in tree species abundance-and associated compositional changes may be greater in early successional forests (Fei et al., 2017). Steiner et al. (2018) found that some stands, initially dominated by red maple, became increasingly dominated by oak ∼38 years following stand establishment, but this transition varied by region and site characteristics. Additionally, the overstory may be generally stable over the time period of our analysis in older stands, with little mortality occurring in established overstory trees (Chapman and McEwan, 2016), even when compositional shifts are occurring in lower strata (Olson et al., 2014). This persistence may not continue in the absence of large-scale disturbance, but species such but red maple and black cherry may be better positioned to take advantage of canopy openings as individual overstory trees senesce (Allen et al., 2018). Continued monitoring and future analysis utilizing longer periods between remeasurement will allow for modeling of long-term forest change to determine to what extent, and how quickly, the disparity observed between strata is realized in future canopies.
In contrast, we found consistent evidence for mesophication in stands with greater structural diversity, as quantified by more variable diameters, regardless of whether change through time or forest strata were compared. Tree size diversity can vary with stand age depending on stand characteristics such as stand density and site index (Varga et al., 2005). Structural diversity has been both positively and negatively linked to various attributes associated with stand dynamics, including growth, mortality, and recruitment (Liang et al., 2007; Lei et al., 2009; Cordonnier et al., 2018). Bose et al. (2016) reported a positive relationship between tree size inequality and the recruitment of shade-tolerant species. The increase with tree size diversity likely represents the recruitment of more shade-tolerant, mesophytic species into the subcanopy as canopy differentiation and increased stratification occur-contributing to both the rate and degree of mesophication reported.
While we found general evidence for community-level transitions to more shade tolerant, and less drought and fire tolerant, forests, changes in these functional metrics were not strongly correlated (Pearson’s r < 0.4). This suggests that functional shifts are not occurring consistently across traits at the plot level, which is also supported by the observed differences in how mesophication varies along environmental gradients depending on functional trait. This supports the conclusion by Knott et al. (2019) that fire and shade tolerance, and in our case drought tolerance, should not be viewed interchangeably. Discrepancies between trait responses could be due to variation in strategies represented by broad trait categories (i.e., fire tolerance vs. resprout ability, thick bark, or serotinous cones, etc.). For example, red maple is generally considered intolerant of fire, but changes in a variety of interacting factors and disturbance regimes have resulted in current conditions where red maple, and other mesic competitors, persist (Keyser et al., 2017; Black et al., 2018; Schweitzer et al., 2019). While burning may reduce midstory maple presence, as we might expect with low fire tolerance, burning can result in profuse sprouting despite repeated burning (Blankenship and Arthur, 2006). Evaluating mesophication based on more focused functional strategies, as opposed to broader functional groups, as detailed trait information becomes available would allow for a more thorough understanding of these interactions.
It is reasonable to postulate that mesophication in mesic (i.e., high soil moisture holding capacity) and/or more productive areas (i.e., which often exhibit more basic soils), may be greater than in xeric, less productive areas. Mesophication was generally more pronounced in wetter areas, but was often highly variable compared to xeric areas (based on AWS, slope, and physiographic class). On more mesic sites, the severity of mesophication may be more strongly controlled by other variables, such as soil nutrients. Contrary to what might be expected, we often found that mesophication decreased with increasing soil pH. Stands in high pH areas may have already been dominated by more mesic species, and therefore show little change in composition. It is also possible that some prominent species associated with mesophication perform well on low pH sites. Red maple saplings were strongly associated with low pH soil, upper slope positions, and older stands in Ohio (Radcliffe et al., 2020), where we consistently found more pronounced evidence of mesophication. There is also evidence that red maple is becoming increasingly associated with low soil pH, low AWC, and upper slope and ridge sites through time (Palus et al., 2018), while oak and hickory are associated with higher pH sites than they have been in the past (Dyer and Hutchinson, 2019). Red maples increased affinity for low pH sites may be related to nitrogen deposition (Dyer and Hutchinson, 2019), which also favors competitiveness of black cherry (Royo et al., 2021). Ongoing research suggests that red oak mortality is greatest in higher pH areas and older stands (Radcliffe et al., 2021) and variation in oak mortality may also be a driver in our observed trends. In contrast to results based on drought and shade tolerance, fire tolerance models suggest that mesophication increases with soil pH. This was our most notable divergence in predicted response between functional traits and warrants further investigation given the complex relationship between soil characteristics, fire, and mesophication (Quigley et al., 2020).
There are several factors that are likely important in determining the compositional and functional changes we examined that were not present in our models. Disturbance history (Elliott et al., 2020) and plot-level soil and nutrient data, such as information on N deposition (Quinn Thomas et al., 2010), are likely important drivers of compositional and functional change. We are unable to determine how these factors may influence our results. We did not evaluate the interactions between individual environmental gradients and province to simplify interpretation, as our models already encompassed numerous interactions between forest types and topo-edaphic gradients. Future work that includes these interactions as finer-scale data becomes available will further our understanding of mesophication dynamics across the landscape.
Conclusion
Our work provides managers with information needed to prioritize areas for restoration and conservation of xeric species. This is of value given the limited resources available for management and that restoration of xeric species is likely more difficult than previously thought (Keyser et al., 2017; Schweitzer et al., 2019). Using a trait-based approach, our results also improve our understanding of the potential ecological consequences of mesophication. This allows managers to tailor approaches depending on their goals, such as increasing resilience to climate change (i.e., prioritizing stands where drought tolerance is likely to decline), restoring natural disturbance regimes or maintaining diversity (i.e., maintaining or increasing fire tolerance).
We found that the changes attributed to mesophication, whether defined by taxonomic groups, or based on CWMs of shade, drought, or fire tolerance, are occurring throughout the eastern US. This transition was most pronounced when the midstory and overstory were compared, but is also observed when comparing plot remeasurement through time. Our results provide evidence for the widespread presence of oak-hickory forests with shade-intolerant, drought- and fire tolerant overstories and shade-tolerant, drought- and fire-intolerant midstories, which may represent novel ecosystems (Alexander et al., 2021). However, we didn’t always find that this phenomenon occurs across various stand and site conditions, as reported in other studies (Alexander et al., 2021). Mesophication is often discussed as a process that occurs ubiquitously across the landscape, but the many biotic and abiotic factors that control the complex patterns of establishment, recruitment, and mortality dynamics of the diverse suite of species that comprise eastern forests has resulted in a variable functional response along important topo-edaphic gradients.
Data availability statement
Publicly available datasets were analyzed in this study. This data can be found here: https://www.fs.usda.gov/research/products/dataandtools/forestinventorydata.
Author contributions
TK conceived the idea. TK and CO secured funding and developed overarching research questions. MW created and compiled necessary datasets, developed the analytical approach, analyzed all data, and wrote the first draft of the manuscript. All authors contributed to writing and manuscript revision.
Funding
This research was supported in part by an appointment to the United States Forest Service (USFS) Research Participation Program administered by the Oak Ridge Institute for Science and Education (ORISE) through an interagency agreement between the U.S. Department of Energy (DOE) and the U.S. Department of Agriculture (USDA). ORISE is managed by ORAU under DOE contract number DE-SC0014664. This manuscript was written and prepared by one or more U.S. Government employees on official time, and therefore it is in the public domain and not subject to copyright. This research was supported in part by the U.S. Department of Agriculture (USDA) Forest Service.
Acknowledgments
Discussions with Dr. John Kabrick provided valuable insight into soil-mesophication interactions. We would also like to thank two reviewers for their suggestions and comments.
Conflict of interest
The authors declare that the research was conducted in the absence of any commercial or financial relationships that could be construed as a potential conflict of interest.
Publisher’s note
All claims expressed in this article are solely those of the authors and do not necessarily represent those of their affiliated organizations, or those of the publisher, the editors and the reviewers. Any product that may be evaluated in this article, or claim that may be made by its manufacturer, is not guaranteed or endorsed by the publisher.
Author disclaimer
All opinions expressed in this manuscript are the author’s and do not necessarily reflect the policies and views of USDA, DOE, or ORAU/ORISE. The findings and conclusions in this publication are those of the author(s) and should not be construed to represent an official USDA, Forest Service, or U.S. Government determination or policy.
Supplementary material
The Supplementary Material for this article can be found online at: https://www.frontiersin.org/articles/10.3389/ffgc.2022.991934/full#supplementary-material
References
Abrams, M. D. (1990). Adaptations and responses to drought in Quercus species of North America. Tree Physiol. 7, 227–238. doi: 10.1093/treephys/7.1-2-3-4.227
Alexander, H. D. (2010). Implications of a predicted shift from upland oaks to red maple on forest hydrology and nutrient availability. Can. J. For. Res. 40, 716–726. doi: 10.1139/X10-029
Alexander, H. D., Siegert, C., Brewer, J. S., Kreye, J., Lashley, M. A., McDaniel, J. K., et al. (2021). Mesophication of oak landscapes: evidence, knowledge gaps, and future research. BioScience 71, 531–542. doi: 10.1093/biosci/biaa169
Alfaro Reyna, T., Retana, J., and Martínez-Vilalta, J. (2018). Is there a substitution of Pinaceae by Fagaceae in temperate forests at the global scale? Global Plan. Change 166, 41–47. doi: 10.1016/j.gloplacha.2018.04.001
Allen, D., Dick, C. W., Strayer, E., Perfecto, I., and Vandermeer, J. (2018). Scale and strength of oak-mesophyte interactions in a transitional oak-hickory forest. Can. J. For. Res. 48, 1366–1372. doi: 10.1139/cjfr-2018-0131
Bailey, R. G. (1980). Description of the Ecoregions of the United States. Washington, DC: U.S. Department of Agriculture, Forest Service. Miscellaneous Publication no. 1391.
Black, D. E., Poynter, Z. W., Cotton, C. A., Upadhaya, S., Taylor, D. D., Leuenberger, W., et al. (2018). Post-wildfire recovery of an upland oak-pine forest on the Cumberland Plateau, Kentucky, USA. Fire Ecol. 14:14. doi: 10.1186/s42408-018-0013-9
Blankenship, B. A., and Arthur, M. A. (2006). Stand structure over 9 years in burned and fire-excluded oak stands on the Cumberland Plateau. Kentucky. For. Ecol. Manag. 225, 134–145. doi: 10.1016/j.foreco.2005.12.032
Bose, A. K., Weiskittel, A., Wagner, R. G., and Kuehne, C. (2016). Assessing the factors influencing natural regeneration patterns in the diverse, multi-cohort, and managed forests of Maine, USA. J. Veg. Sci. 27, 1140–1150. doi: 10.1111/jvs.12433
Chapman, J. I., and McEwan, R. W. (2016). Thirty years of compositional change in an old-growth temperate forest: the role of topographic gradients in oak-maple dynamics. PLoS One 11:e0160238. doi: 10.1371/journal.pone.0160238
Cordonnier, T., Bourdier, T., Kunstler, G., Piedallu, C., and Courbaud, B. (2018). Covariation between tree size and shade tolerance modulates mixed-forest productivity. Ann. Forest Sci. 75, 1–15. doi: 10.1007/s13595-018-0779-6
Cotton, C. A., Prisley, S. R., and Fox, T. R. (2009). “mapping upland hardwood site quality and productivity with GIS and FIA in the Blue Ridge of North Carolina,” in Proceedings of the. RMRS-P-56CD, (Fort Collins, CO: U.S. Department of Agriculture, Forest Service, Rocky Mountain Research Station).
Drohan, P. J., Ciolkosz, E. J., and Petersen, G. W. (2003). Soil survey mapping unit accuracy in forested field plots in Northern Pennsylvania. Soil Sci. Soc. Am. J. 67, 208–214. doi: 10.2136/sssaj2003.2080
Dyer, J. M., and Hutchinson, T. F. (2019). Topography and soils-based mapping reveals fine-scale compositional shifts over two centuries within a central Appalachian landscape. For. Ecol. Manag. 433, 33–42. doi: 10.1016/j.foreco.2018.10.052
Elliott, K. J., Miniat, C. F., and Medenblik, A. S. (2020). The long-term case for partial-cutting over clear-cutting in the southern Appalachians USA. New Forests 51, 273–295. doi: 10.1007/s11056-019-09731-y
Fei, S., Desprez, J. M., Potter, K. M., Jo, I., Knott, J. A., and Oswalt, C. M. (2017). Divergence of species responses to climate change. Sci. Adv. 3:e1603055. doi: 10.1126/sciadv.1603055
Fei, S., Kong, N., Steiner, K. C., Moser, W. K., and Steiner, E. B. (2011). Change in oak abundance in the eastern United States from 1980 to 2008. For. Ecol. Manag. 262, 1370–1377. doi: 10.1016/j.foreco.2011.06.030
Fei, S., and Steiner, K. C. (2007). Evidence for increasing red maple abundance in the Eastern United States. Forest Sci. 53, 473–477.
Fox, J. (2003). Effect displays in R for generalised linear models. J. Stat. Softw. 8, 1–27. doi: 10.18637/jss.v008.i15
Hanberry, B. B., Abrams, M. D., Arthur, M. A., and Varner, J. M. (2020). Reviewing fire, climate, deer, and foundation species as drivers of historically open oak and pine forests and transition to closed forests. Front. For. Glob. Change 3:56. doi: 10.3389/ffgc.2020.00056
Hanberry, B. B., and Nowacki, G. J. (2016). Oaks were the historical foundation genus of the east-central United States. Quaternary Sci. Rev. 145, 94–103. doi: 10.1016/j.quascirev.2016.05.037
Iverson, L. R., Hutchinson, T. F., Prasad, A. M., and Peters, M. P. (2008). Thinning, fire, and oak regeneration across a heterogeneous landscape in the eastern U.S.: 7-year results. For. Ecol. Manag. 255, 3035–3050. doi: 10.1016/j.foreco.2007.09.088
Kane, J. M., Kreye, J. K., Barajas-Ramirez, R., and Varner, J. M. (2021). Litter trait driven dampening of flammability following deciduous forest community shifts in eastern North America. For. Ecol. Manag. 489:119100. doi: 10.1016/j.foreco.2021.119100
Kaproth, M., and Cavender-Bares, J. (2016). Drought tolerance and climatic distributions of the American oaks. Int. Oaks 27, 49–60.
Kattge, J., Díaz, S., Lavorel, S., Prentice, I. C., Leadley, P., Bönisch, G., et al. (2011). TRY - a global database of plant traits. Glob. Change Bio 17, 2905–2935. doi: 10.1111/j.1365-2486.2011.02451.x
Keyser, T. L., Arthur, M., and Loftis, D. L. (2017). Repeated burning alters the structure and composition of hardwood regeneration in oak-dominated forests of eastern Kentucky, USA. For. Ecol. Manag. 393, 1–11. doi: 10.1016/j.foreco.2017.03.015
Keyser, T. L., and Rodrigue, J. A. (2022). Legacy of thinning on woody species composition and structure in southern Appalachian Mountain hardwood forests: restoration implications. Restoration Ecol. 64:691. doi: 10.1111/rec.13689
Knott, J. A., Desprez, J. M., Oswalt, C. M., and Fei, S. (2019). Shifts in forest composition in the eastern United States. For. Ecol. Manag. 433, 176–183. doi: 10.1016/j.foreco.2018.10.061
Lei, X., Wang, W., and Peng, C. (2009). Relationships between stand growth and structural diversity in spruce-dominated forests in New Brunswick, Canada. Can. J. For. Res. 39, 1835–1847. doi: 10.1139/X09-089
Liang, J., Buongiorno, J., Monserud, R. A., Kruger, E. L., and Zhou, M. (2007). Effects of diversity of tree species and size on forest basal area growth, recruitment, and mortality. For. Ecol. Manag. 243, 116–127. doi: 10.1016/j.foreco.2007.02.028
Liebergesell, M., Reu, B., Stahl, U., Freiberg, M., Welk, E., Kattge, J., et al. (2016). Functional resilience against climate-driven extinctions - comparing the functional diversity of European and North American Tree Floras. PLoS One 11:e0148607. doi: 10.1371/journal.pone.0148607
McEwan, R. W., Dyer, J. M., and Pederson, N. (2011). Multiple interacting ecosystem drivers: toward an encompassing hypothesis of oak forest dynamics across eastern North America. Ecography 34, 244–256. doi: 10.1111/j.1600-0587.2010.06390.x
McNab, W. H. (1989). Terrain shape index: quantifying effect of minor landforms on tree height. Forest Sci. 35, 91–104.
McNab, W. H., Cleland, D. T., Freeouf, J. A., Keys, J. E., Nowacki, G. J., and Carpenter, C. A. (2007). Description of Ecological Subregions: Sections of the Conterminous United States. Washington, DC: U.S. Department of Agriculture, Forest Service. doi: 10.2737/WO-GTR-76B
Mcshea, W. J., Healy, W. M., Devers, P., Fearer, T., Koch, F. H., Stauffer, D., et al. (2007). Forestry matters: decline of oaks will impact wildlife in hardwood forests. J. Wildlife Manag. 71, 1717–1728. doi: 10.2193/2006-169
Mushinski, R. M., Phillips, R. P., Payne, Z. C., Abney, R. B., Jo, I., Fei, S., et al. (2019). Microbial mechanisms and ecosystem flux estimation for aerobic NOy emissions from deciduous forest soils. Proc. Natl. Acad. Sci. U S A. 116:2138. doi: 10.1073/pnas.1814632116
Niinemets, Ü, and Valladares, F. (2006). Tolerance to shade, drought, and waterlogging of temperate northern hemisphere trees and shrubs. Ecol. Monographs 76, 521–547. doi: 10.1890/0012-9615(2006)076[0521:TTSDAW]2.0.CO;2
Novick, K., Jo, I., D’Orangeville, L., Benson, M., Au, T. F., Barnes, M., et al. (2022). The drought response of eastern US Oaks in the context of their declining abundance. BioScience 72, 333–346. doi: 10.1093/biosci/biab135
Nowacki, G. J., and Abrams, M. D. (1992). Community, edaphic, and historical analysis of mixed oak forests of the Ridge and Valley Province in central Pennsylvania. Can. J. For. Res. 22, 790–800. doi: 10.1139/x92-108
Nowacki, G. J., and Abrams, M. D. (2008). The demise of fire and “mesophication” of forests in the Eastern United States. BioScience 58, 123–138. doi: 10.1641/B580207
Oak, S., Tainter, F., Williams, J., and Starkey, D. (1996). Oak decline risk rating for the southeastern United States. Ann. For. Sci. 53, 721–730. doi: 10.1051/forest:19960248
Oak, S. W. (2016). “Oak decline in central hardwood forests: frequency, spatial extent, and scale,” in Natural Disturbances and Historic Range of Variation Managing Forest Ecosystems, eds C. H. Greenberg, B. S. Collins, M. A. Spetich, and R. S. Morin (Cham: Springer International Publishing), doi: 10.1007/978-3-319-21527-3
Oliver, C. D., and Larson, B. C. (eds) (1996). Forest Stand Dynamics. Hoboken, NJ: John WIley & Sons.
Olson, M. G., Stevenson, A. P., Knapp, B. O., Kabrick, J. M., and Jensen, R. G. (2014). “Is there evidence of mesophication of oak forests in the Missouri Ozarks?,” in Proceedings of the 19th Central Hardwood Forest Conference; 2014 March 10-12; Carbondale, IL, eds J. W. Groninger, E. J. Holzmueller, C. K. Nielsen, and D. C. Dey, and Proceedings (Newtown Square, PA: U.S. Department of Agriculture, Forest Service, Northern Research Station).
Palus, J. D., Goebel, P. C., Hix, D. M., and Matthews, S. N. (2018). Structural and compositional shifts in forests undergoing mesophication in the Wayne National Forest, southeastern Ohio. For. Ecol. Manag. 430, 413–420. doi: 10.1016/j.foreco.2018.08.030
Pederson, N., D’Amato, A. W., Dyer, J. M., Foster, D. R., Goldblum, D., Hart, J. L., et al. (2015). Climate remains an important driver of post-European vegetation change in the eastern United States. Glob. Change Biol. 21, 2105–2110. doi: 10.1111/gcb.12779
Pezzarossi, H. L. (2014). Assembling indigeneity: rethinking innovation, tradition and indigenous materiality in a 19th-century native toolkit. J. Soc. Archaeol. 14, 340–360. doi: 10.1177/1469605314536975
Prisley, S. P., Wang, H.-J., Radtke, P. J., and Coulston, J. (2009). “Combining FIA plot data with topographic variables: are precise locations needed?,” in Proceedings of the RMRS-P-56CD, (Park City, UT: U.S. Department of Agriculture, Forest Service, Rocky Mountain Research Station).
Pyle, C. (1988). The type and extent of anthropogenic vegetation disturbance in the Great Smoky Mountains before national-park-service acquisition. Castanea 53, 183–196.
Quigley, K. M., Kolka, R., Sturtevant, B. R., Dickinson, M. B., Kern, C. C., Donner, D. M., et al. (2020). Prescribed burn frequency, vegetation cover, and management legacies influence soil fertility: implications for restoration of imperiled pine barrens habitat. For. Ecol. Manag. 470-471:118163. doi: 10.1016/j.foreco.2020.118163
Quinn Thomas, R., Canham, C. D., Weathers, K. C., and Goodale, C. L. (2010). Increased tree carbon storage in response to nitrogen deposition in the US. Nat. Geosci. 3, 13–17. doi: 10.1038/ngeo721
Radcliffe, D. C., Hix, D. M., and Matthews, S. N. (2021). Predisposing factors’ effects on mortality of oak (Quercus) and hickory (Carya) species in mature forests undergoing mesophication in Appalachian Ohio. For. Ecosyst. 8:7. doi: 10.1186/s40663-021-00286-z
Radcliffe, D. C., Matthews, S. N., and Hix, D. M. (2020). Beyond oak regeneration: modelling mesophytic sapling density drivers along topographic, edaphic, and stand-structural gradients in mature oak-dominated forests of Appalachian Ohio. Can. J. For. Res. 50, 1215–1227. doi: 10.1139/cjfr-2020-0111
Royo, A. A., Vickers, L. A., Long, R. P., Ristau, T. E., Stoleson, S. H., and Stout, S. L. (2021). The forest of unintended consequences: anthropogenic actions trigger the rise and fall of black cherry. BioScience 71, 683–696. doi: 10.1093/biosci/biab002
Schweitzer, C. J., Dey, D. C., and Wang, Y. (2019). White Oak (Quercus alba) response to thinning and prescribed fire in northcentral alabama mixed pine-hardwood forests. Forest Sci. 65, 758–766. doi: 10.1093/forsci/fxz031
Spînu, A. P., Niklasson, M., and Zin, E. (2020). Mesophication in temperate Europe: a dendrochronological reconstruction of tree succession and fires in a mixed deciduous stand in Białowieża Forest. Ecol. Evol. 10, 1029–1041. doi: 10.1002/ece3.5966
Steiner, K. C., Stein, B. S., and Finley, J. C. (2018). A test of the delayed oak dominance hypothesis at mid-rotation in developing upland stands. For. Ecol. Manag. 408, 1–8. doi: 10.1016/j.foreco.2017.10.027
Thomas-Van Gundy, M., Rentch, J., Adams, M. B., and Carson, W. (2014). Reversing legacy effects in the understory of an oak-dominated forest. Can. J. For. Res. 44, 350–364. doi: 10.1139/cjfr-2013-0375
USDA Forest Service (2022). FIA national core field guide volume I: Field data collection procedures for phase 2 plots version 9.2. Washington, DC: USDA Forest Service.
Varga, P., Chen, H. Y., and Klinka, K. (2005). Tree-size diversity between single-and mixed-species stands in three forest types in western Canada. Canadian J. For. Res. 35, 593–601. doi: 10.1139/x04-193
Vose, J., Clark, J. S., Luce, C., and Patel-Weynand, T. (2016). Effects of Drought on Forests and Rangelands in the United States: a Comprehensive Science Synthesis. Washington, DC: U.S. Department of Agriculture, Forest Service. Gen. Tech. Rep. WO-93b. doi: 10.2737/WO-GTR-93b
Keywords: mesophication, FIA, Quercus-Carya forests, functional traits, forest dynamics, restoration
Citation: Woodbridge M, Keyser T and Oswalt C (2022) Stand and environmental conditions drive functional shifts associated with mesophication in eastern US forests. Front. For. Glob. Change 5:991934. doi: 10.3389/ffgc.2022.991934
Received: 12 July 2022; Accepted: 01 September 2022;
Published: 12 October 2022.
Edited by:
Steve Prisley, National Council for Air and Stream Improvement, Inc. (NCASI), United StatesReviewed by:
Georgina DeWeese, University of West Georgia, United StatesJerry F. Franklin, University of Washington, United States
Copyright © 2022 Woodbridge, Keyser and Oswalt. This is an open-access article distributed under the terms of the Creative Commons Attribution License (CC BY). The use, distribution or reproduction in other forums is permitted, provided the original author(s) and the copyright owner(s) are credited and that the original publication in this journal is cited, in accordance with accepted academic practice. No use, distribution or reproduction is permitted which does not comply with these terms.
*Correspondence: Margaret Woodbridge, bWFyZ2FyZXQud29vZGJyaWRnZUB1c2RhLmdvdg==
†These authors have contributed equally to this work