 Oleksandr Melnyk
 Pavlo Manko
 Ansgar Brunn
- 1Department of Geodesy, Landmanagement and Cadastre, Geographical Faculty, Lesya Ukrainka Volyn National University, Lutsk, Ukraine
- 2Faculty of Plastics Engineering and Surveying, University of Applied Sciences, Würzburg-Schweinfurt, Würzburg, Germany
Forest classification is needed to solve a wide range of environmental issues related to of forest classes and succession processes, the extent of afforestation and deforestation and global environmental change. These applications require a very accurate mapping and monitoring of forest types. This article investigates the combination of modern open geographic information systems and remote sensing data in forest management tasks for a specific part of the Ukrainian state area. Based on the existing afforestation plans, the results of the unsupervised classification of Sentinel-2 images and the selection of forest species fragments with closed crowns as training data for supervised classification, classifiers of forest species of the study object were developed with and without taking into account age groups. A supervised classification of research objects is realized and the accuracy of the obtained results is evaluated. It is established that the accuracy of determining forest species on the basis of the proposed method is 90.3 and 91.4%, taking into account age groups and without taking them into account, respectively. Thus, it is found that the modeling of the age groups does not improve the classification result for the test area.
1. Introduction
The total area of the Ukrainian forest reserve is 10.4 mha (mha = million hectare, hectare = 10.000 m2), including 9.6 mha of forested land and 0.8 mha of unforested forestry land. Mountain forests represent 21.8% of the total area. The forests are very unevenly distributed inside the Ukraine. For example, in the Ukrainian Carpathians forests occupy 40.5% of the area, in the Crimean mountains 10.7%, in the Polissya region 26.1%. In the forest steppe zone this indicator is 12.2%, and in the steppe 3.8%. The most forested regions are Zakarpattia, Ivano-Frankivsk, Rivne, Zhytomyr, Volyn and Chernivtsi. The state forests of Ukraine are dominated by young forests, which account for about 44%.
According to The State Agency of Forest Resources of Ukraine (Derzhlisahenstvo, 2020), the forest reserve is dominated by coniferous species, which area is 2916.6 kha (thousand hectares). Hardwoods cover an area of 2578.2 kha, softwoods 624.0 kha, shrubs 11.6 kha, other tree species 21 kha. The largest share of forested area is occupied by pine (33%) and oak (24%).
The area of forest lands in the Volyn region is 696kha, of which 62% are forests of state importance, 37.5% are forests of agricultural enterprises, 0.5% are forests of other users. According to their economic importance, forests are divided into two groups: protective forests—23% of the state reserve (forests near roads, rivers, national parks), operational—77% of the state reserve. The current level of forest cover in Volyn is 34.6%. The largest concentration is in Manevychi (65% of its territory) and Kamin—Kashirsky (41%) districts. The most common are conifers - 60% of forests, mixed (birch, aspen)—24%, hardwood—16%. Forest resources of the region make up 16.2% of the total National resource potential (NRP) and exceed average national value 4 times.
Climate change causes a massive development of forest pests and diseases (Shvidenko et al., 2017), shifts the boundaries of natural areas on the plains and highlands in the mountains. Forests are in unusual, and often adverse environmental conditions, causing significant damage or loss of forests, and, consequently, an increase of sanitary and health-improving measures (Kolstroom et al., 2011; Hlásny et al., 2014).
Special attention needs to the problem of drying of pine, spruce and other plantations, which may be partly caused by the effects of climate change.
The volume of illegal cutting in the forests of the State Forest Agency has tended to decrease in recent years, but still remains significant. The reasons are the difficult socio-economic situation of citizens, especially in the Carpathian region, the lack of opportunity to have a decent legal income, which encourages violations, the presence of a large number of private forest trading points that buy illegally harvested timber and avoid penalties, insufficient work of state forest guards, police, prosecutors and courts to identify and prosecute those who have committed illegal logging, as a result of which more than 62% of illegal logging is committed by undetected violators, and the average compensation in the industry is 7%.
The valid instructions in Ukraine regarding to inventory of forest areas in general and their species composition still do not provide for the use of remote sensing data. The commissions consisting of at least three people perform inventory work, which may include subjective factors.
These specific influences on Ukrainian forests and the importance of forests for the social society and ecology makes a good and an up-to-date knowledge of the forest develepment necessary. The analysis of large data sets is necessary which is only possible with the aid of automatic procedures. In this article, we focus on the Volyn region (near Lutsk), to develop an appropriate method.
2. Test outline
2.1. Scenario
The purpose of this work was to develop a methodology for determining the species structure of the forests of Volyn based on the existing tree species map, remote sensing data and ground observations.
The object of the study was a region of the forest within Osivsky and Verbychansky forests, located in the Turiya district of the Volyn region (Figure 1). The area is 65.61km2.
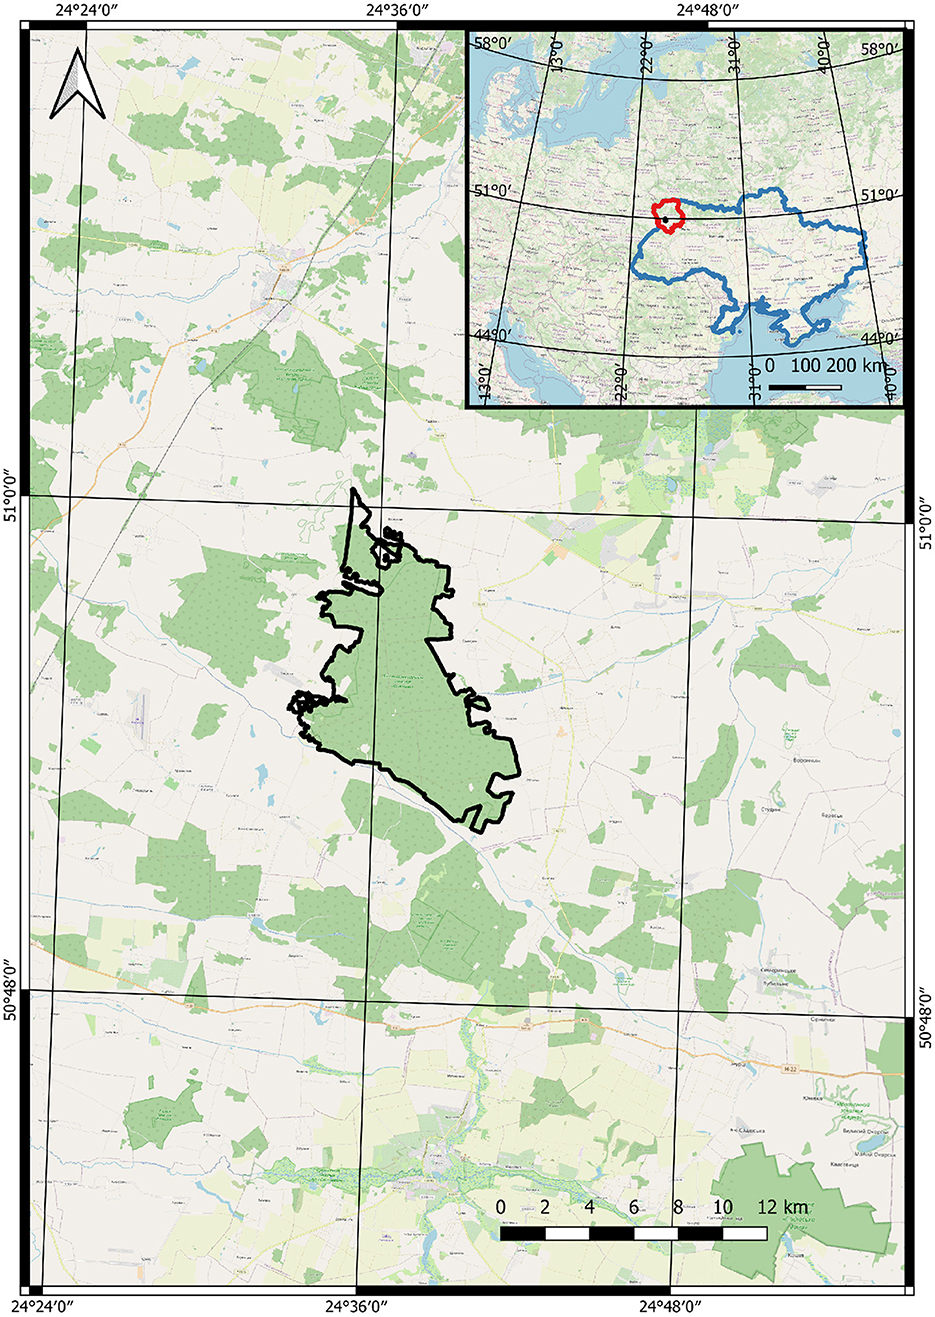
Figure 1. Location of the research area.
The area of Osivske forestry is 4585.0 hectares, covered with forest - 4283.9 hectares. Felling of the formation and rehabilitation of forests is carried out on an area of 132 hectares with the production of 1,666 m3 of wood. The fund of felling of the main use is 2.8 thousand m3. On the territory of forestry in quarters No. 14, 15, 17, 19, 21, 22, and 24–38 on an area of 5137 hectares there is a general zoological reserve of local importance “Osivsky,” created for the purpose of preserving and breeding wild animals and birds, including black stork, gray crane and badger, listed in the Red Book of Ukraine. In quarters No. 3 there is a protected tract of local importance “Bobly” with an area of 25.4 hectares, created in order to preserve valuable forest plantations of petiole oak with an admixture of pine, birch, alder. The village of Vovchak belongs to the Osiv forestry, which was the center of the “Volyn Sich.” The total area of Verbychansk forestry is 3,715 hectares, including 3,523 hectares covered with forest. Felling of the formation and rehabilitation of forests is carried out on an area of 58 hectares with the harvesting of 660 m3 of wood. The annual volume of the main use is 7.3 thousand m3 of wood. The main forest-forming species: pine-40%, alder-16%, oak-30%, birch-9%, spruce-3%, red oak-1%. In quarters No. 7–9, 11, 14, 15, 16, 18–27, and 29–33 on an area of 2,647 hectares there is a general zoological reserve of local importance “Osivsky,” created in order to preserve high-quality plantations, where pine, common oak grows, preservation and reproduction of wild animals and birds (Turiyske Forestry, 2022).
2.2. Satellite data
The Sentinel-2 mission, deployed in June 2015, European Space Agency (2020) has great potential for accurate classification and monitoring (Laurin et al., 2013). Remote sensing capabilities have evolved rapidly over the past quarter century with the development of new satellites and sensors, information management technologies, and image interpretation techniques. Most importantly, the spatial and spectral resolution of imagery has been enhanced, enabling interpreters to discern more attributes of a forest from a given scene. As more satellites are placed in orbit, the revisit cycle decreases, thereby allowing a more real-time measurement capability. In recognition of these developments, many policy initiatives have called for the greater integration of this technology in forest inventory and monitoring programs, not only in the Ukraine.
Remote sensing satellites are capable of collecting and transmitting data on different measures and at varying degrees of detail. The way in which data is collected by a sensor and the processing of that data on the ground have much to do with whether or not that information is applicable to the needs of foresters (Iverson et al., 1989). Satellite sensors with potential applications to forestry can be grouped into two types: electro-optical and synthetic aperture radar. Electro-optical (EO) systems are passive sensors which use an electronic sensor to detect optical signals but operate only when there is sufficient light reflected from the target forthem to form an image. EO systems typically monitor blue, green, and red portions (or bands) of the visible spectrum, as well as near-infrared, and long-wave, or thermal, infrared bands. The near-IR bands have a wide variety of applications, including the ability to detect certain indicators of the health of vegetation. Most EO systems operate in two different regimes: panchromatic (Pan), in which imagery from all portions of the spectrum are recorded as shades of gray (i.e. producing a “black-and-white” image), and multispectral (MS), in which the discrete bands of light are recorded individually, to be analyzed either individually or in composites, producing a color or false-color image.
The Sentinel-2 (Gatti et al., 2018) can combine a high spatial resolution, a wide coverage and a short inspection intervall (about 5 days), providing unprecedented opportunities for clear cutting of ground cover classes. The Sentinel-2 multispectral sensor has 13 bands from 0.443 to 2.190 μm. Multispectral information in the visible and NIR bands, available in 10m ground resolution, as the best additional tools for use in vegetation recognition. Also available are four segments of the red spectrum with a resolution of 20m per pixel, which are suitable for the analysis of chlorophyll content and for parameterization of ecological and physiological large-scale models. Despite this potential, some studies have evaluated the ability of Sentinel-2 in forest mapping and monitoring (Franklin and Wulder, 2022).
Sentinel-2 data contain 13 spectral bands with a spatial resolution of 10, 20, and 60 m at 12-bit radiometric resolution. For further analysis, we focused only on the 10 and 20 m ranges. The three 60m spatial zones were not used in this study because they are primarily related to atmospheric correction.
3. Method
One of the main unresolved issues of remote monitoring of nature reserve landscape systems based on high spatial resolution data is the lack of clear homogeneous boundaries and “noise” of existing areas with other natural objects, which leads to significant errors in a supervised classification based on training (e.g., Baetz et al., 2018). Therefore, the process of classification needs to be improved. Our new classification method of nature reserves is carried out in the following stages:
1. implementation of a preliminary unsupervised classification using one of the widely used methods;
2. comparison of the results of the unsupervised classification with remote sensing decryption data based on existing tree species map;
3. preparing and ground verification of training test samples on the basis of the received unsupervised classification data and existing tree species map for the further supervised classification.
This work used Sentinel 2A data downloaded from Sentinel Hub resource level 1C as of August 30, 2017, which was one of the closest in time to the date of existing tree species map An atmospheric correction and resampling with a resolution of 10 m was performed in QGIS using the extension Semi-Automatic Classification Plugin (Baetz et al., 2018). Subsequently, the resulting images were cropped by the area of interest.
Existing tree species map for the research area served as a basis for selecting sites with characteristic wood species, which were used to create training input for a supervised classification. Based on the image of the Sentinel 2A satellite and the tree species map at a scale of 1:25000 as of 2012, the main elements of the forest of different species were selected and ground verified. Preference in the choice was given to the section of forest with closed crowns of trees. The selection of training areas was performed using GNSS survey and layover on image channels 8-4-2 (Figure 2) with wavelengths of 0.842, 0.665, and 0.490 μm, respectively (Delegido et al., 2011; Grabska et al., 2019), and a resolution of 10m.
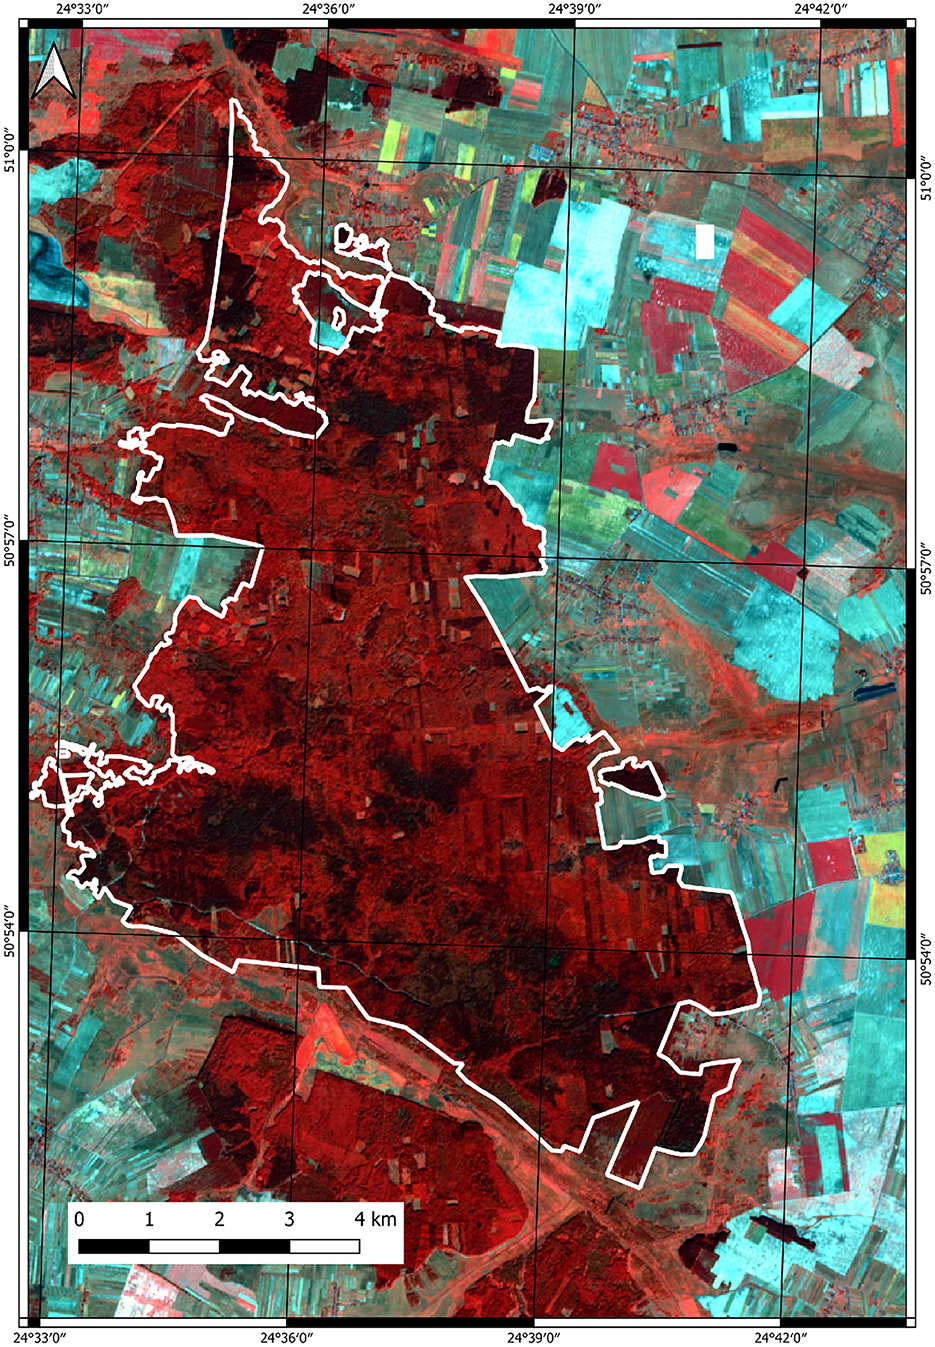
Figure 2. Location of the research area in 8-4-2 channel.
False color composite using near infrared, red and green or blue bands is very popular. It is most commonly used to assess plant density and healht, as plants reflect near infrared and green/blue light, while absorbing red. Since they reflect more near infrared than green/blue, plant-covered land appears deep red. Denser plant growth is darker red. Cities and exposed ground are gray or tan, and water appears blue or black. This colorcomposite allows to visually better analyze the state of forest vegetation.
3.1. Unsupervised algorithms
Due to Abbas et al. (2016), the most popular algorithms of unsupervised classification (clustering) are K-Means and ISODATA.
3.1.1. K-Means
The K-Means method (McCool et al., 2012) is based on dividing the set of values of spectral features of n pixels i, (i ∈ {1, …, n}) by a fixed number of k clusters, which are locally minimized relative to the distance between the current pixel and the center (centroid) of the cluster. xi is the vector of spectral values for pixel i. The objective function of the algorithm is represented by the formula:
where μj is the location vector of the centroid of the cluster j, j = ∈{1, …, k}.
The choice of the appropriate cluster k for a given point in the process of the algorithm is due to the inequality:
Each pixel xi will be assigned to the cluster whose centroid is closest to xi. Finding the centroids of clusters is by the formula:
Further iterations of finding the centroids of each of the clusters are necessary using formulas (2) and (3). The accuracy of determining each cluster in the case of unsupervised classification is determined by:
where Nj is the number of pixels in the j-th cluster, μj the center of the class, b the number of spectral channels (Richards and Xiuping, 2013). The advantages of this method of unsupervised classification are the correlation of each pixel to a particular cluster after finding their centroids.
3.1.2. ISODATA
Iterative Self-Organizing Data Analysis Technique (ISODATA) is an unsupervised classification method that divides the spectral characteristics of a set of pixels into some classes without taking into account a predetermined number of them, taking into account only the measure of the spectral distance (Ball and Hall, 1963).
The ISODATA algorithm uses the same objective function of the spectral distance (1). The iterative process begins with the assignment of an approximate number of clusters. The initial mean values (centroids) of the clusters are evenly distributed along the central vector of the spectral space. During the first iteration of clustering, the space is evenly divided into areas, the center of each is the average values of the clusters. For each pixel, the spectral distance between the pixel and the centroid of the cluster is calculated. Pixels are assigned to a cluster where this distance is minimal. After the iteration, the real value of the cluster centroid is calculated from the spectral characteristics. Iiterations are performed, in the process the clustering is repeated with new centroid values, new cluster boundaries are calculated and the centroids of each cluster is specified. The iterative process is repeated until all the pixels with a given probability fall into one of the already defined clusters or the predetermined number of iterations ends, otherwise new clusters with their centroids are formed.
3.2. Supervised algorithm
Probability distributions for classes are considered as a form of multivariate normal models (Richards and Xiuping, 2013). To perform this algorithm, it requires a sufficient number of pixels to calculate the covariance matrix. The discriminant function is calculated for each pixel as:
where, Cj is the tree species j; x- the spectral signature of the image pixel signal vector; p(Ck) the probability that Cj the correct class (a priori probability); |Σj| the determinant of the covariance matrix of data in the class Cj; the inverse covariance matrix; μk the spectral signature of the centroid j.
Therefore:
For all k ≠ j where, x1 ∉ ga(x), x2 ∉ ga(x). Given the threshold value for the discriminant function to exclude from the classification of pixels below Ti, the state of classification becomes as follows:
For all k ≠ j, and gk(x) > Ti. Classification by the maximum likelihood algorithm is one of the most common supervised classifications, but the classification process may be slower compared to the method of minimum distances.
4. Results
The initial task was to create a classifier that corresponds to the legend of the tree species map of the main elements of the forest without taking into account age groups (Figure 3).
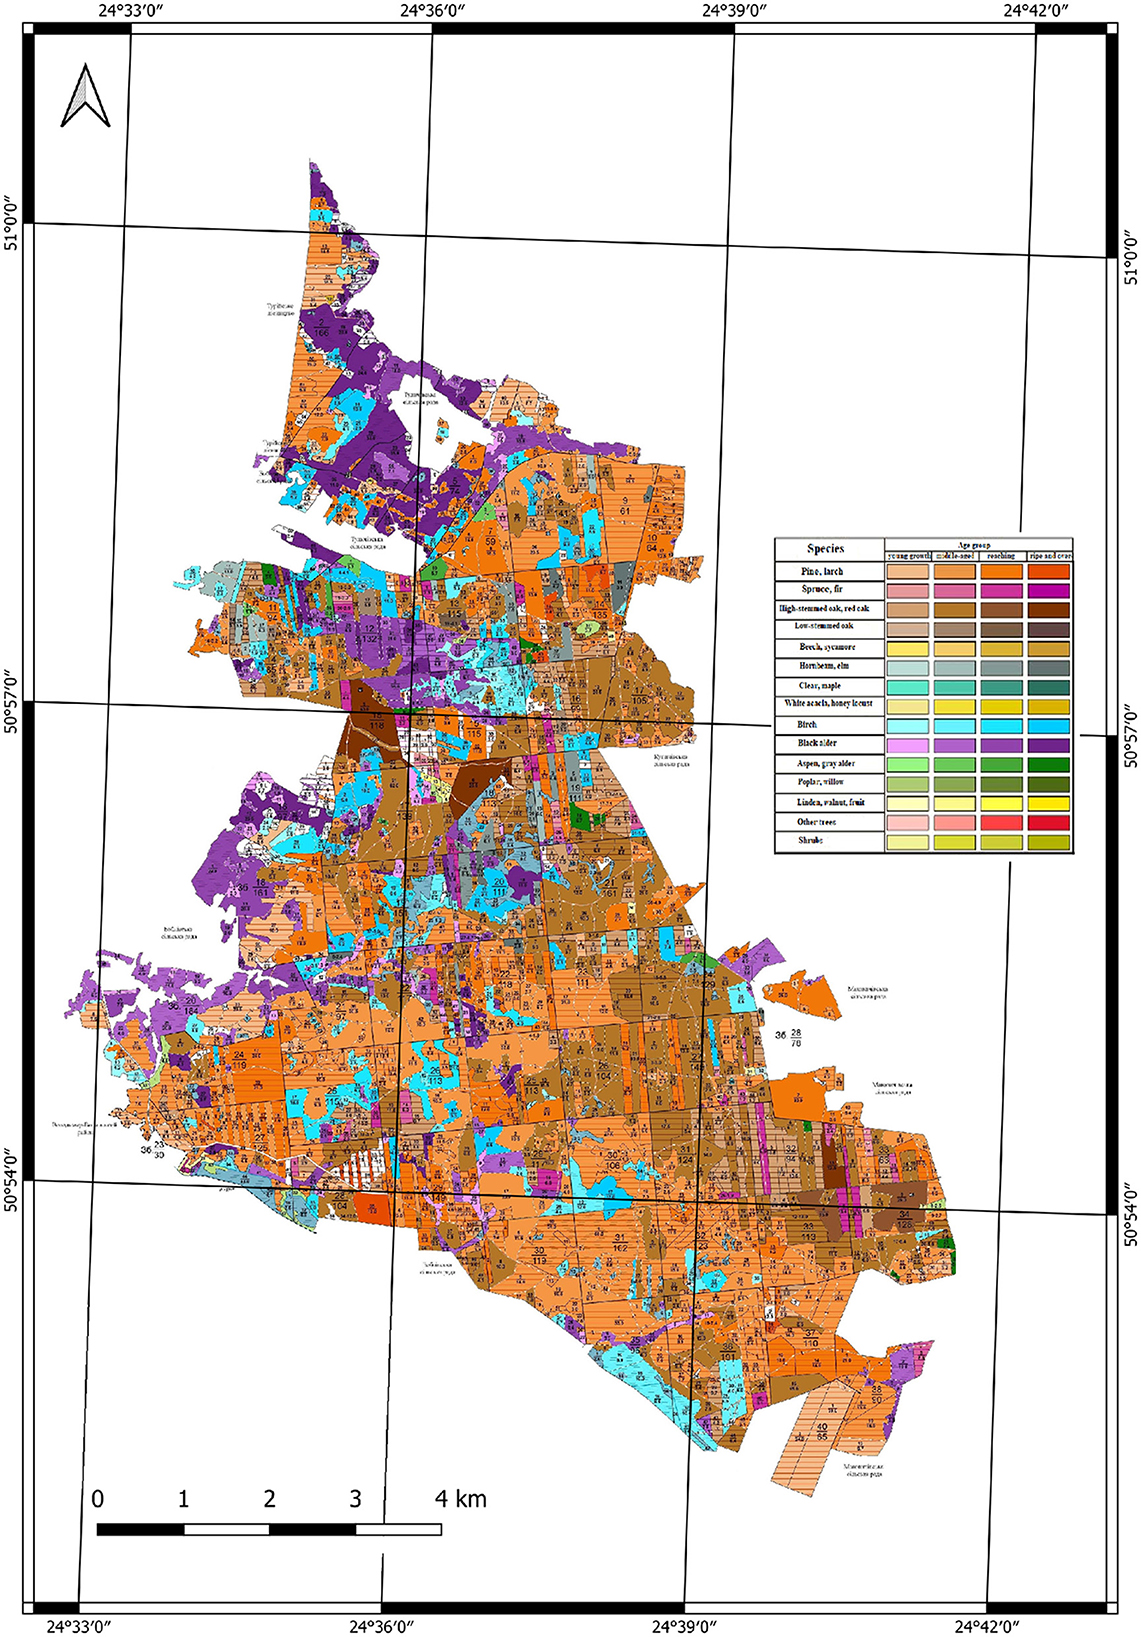
Figure 3. Tree species map.
The image segments that matched the two unsupervised classification methods were compared with the existing forest spices map. Based on this, areas that could be included in the test set for the classifier were selected. Next, ground control of the species structure was conducted and a GNSS survey was performed. Based on this data, the classifier was developed.
Another task was to try to evaluate the forest crops of the studied forestry taking into account age groups. A classifier was developed according to a similar method and on the basis of created macroclasses of forest vegetation, which includes the division into age groups. The correspondence of age groups of vegetation and colors of the classifier is presented in Table 2 and corresponds to the existing tree species map Figure 3.
Spectral signatures for each of the classes were determined for these classifiers. Graphically, the results are presented in Figures 4, 5, respectively and represents spectral reflection for each class within the polygons, which were selected as test sites.
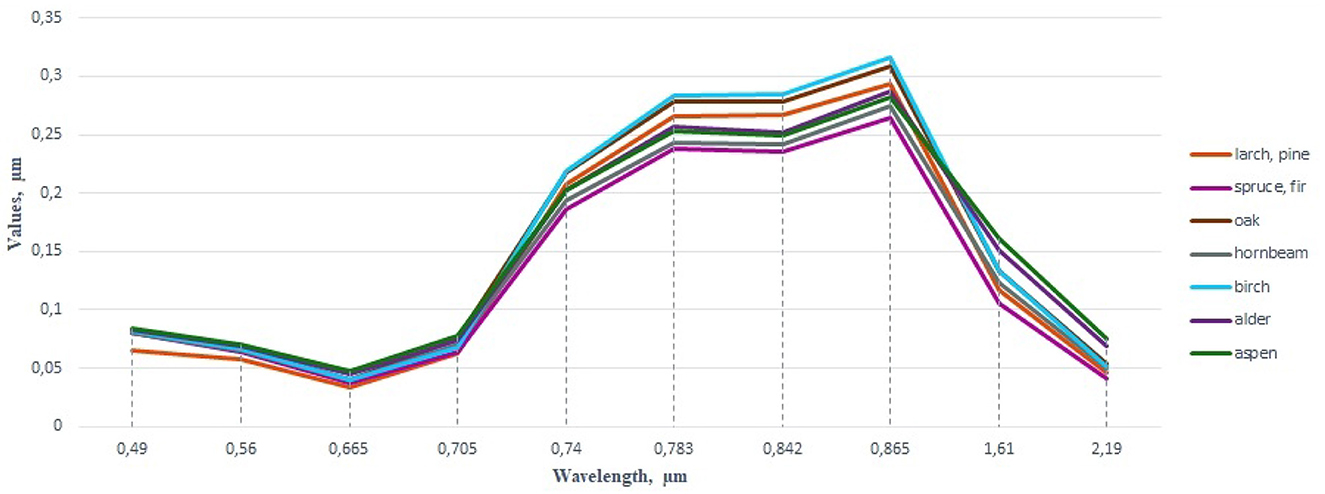
Figure 4. Graph of spectral signatures of the classifier without taking into account age groups.
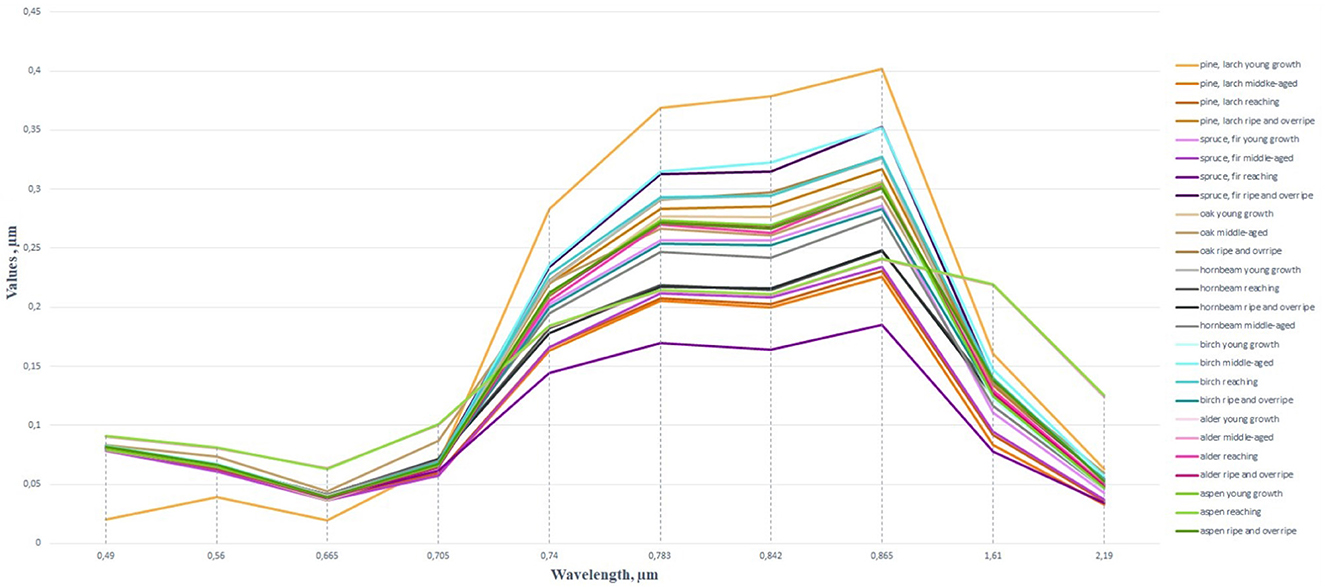
Figure 5. Graph of spectral signatures of the classifier taking into account age groups.
The classification of images was performed using the maximum likelihood algorithm, which calculates the probability distribution for classes according to the Bayes‘ theorem, estimating the belonging of a pixel to the land cover class.
The result of the classification process is a raster image in which the corresponding class identifiers are mapped to the individual pixels of the original image and displayed in a user-selected color scheme. Based on the proposed methodology and the created training samples, a supervised classification of a fragment of the forest area within the Osivske and Verbychanske forests was performed in the QGIS environment using the extension Semi-Automatic Classification Plugin, (Congedo, 2016). Graphically, the results of the supervised classification by the algorithm of maximum likelihood using a ground verified training are presented in Figures 6, 7, respectively.

Figure 6. Classification results without taking into account age groups.
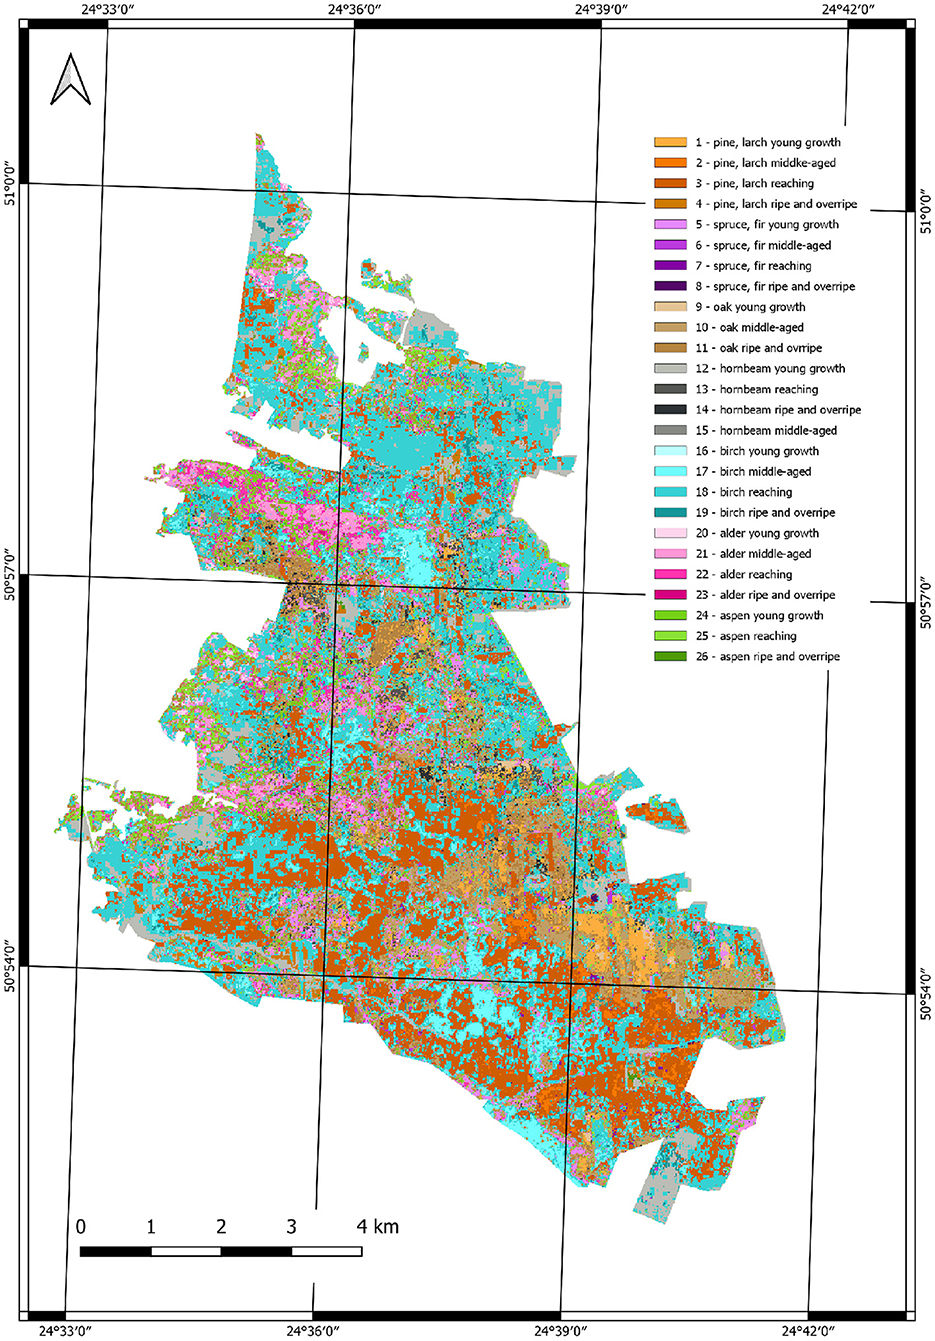
Figure 7. Classification results with taking into account age groups.
5. Accuracy
The most common method of estimating accuracy is the calculation of the error matrix in which the data of the obtained classified image are compared with the ground control data for the corresponding number of classification units. Accordingly, based on the obtained error matrix, the overall accuracy of the classification is calculated as the ratio of correctly classified elements to the total number of sample elements. The corresponding matrices of classification errors of the above methods are presented in Tables 1, 2.
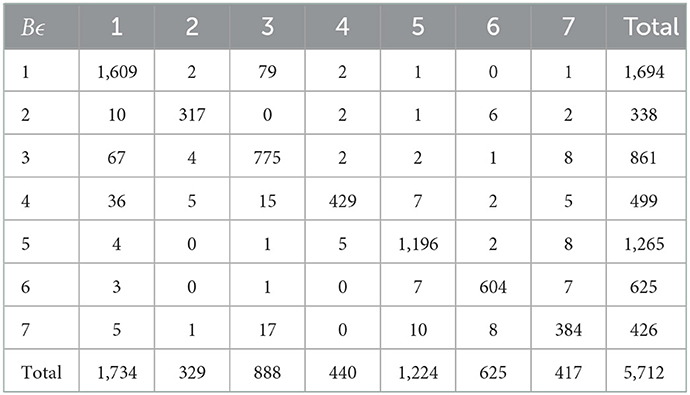
Table 1. Matrix of classification errors without taking into account age groups of forests.
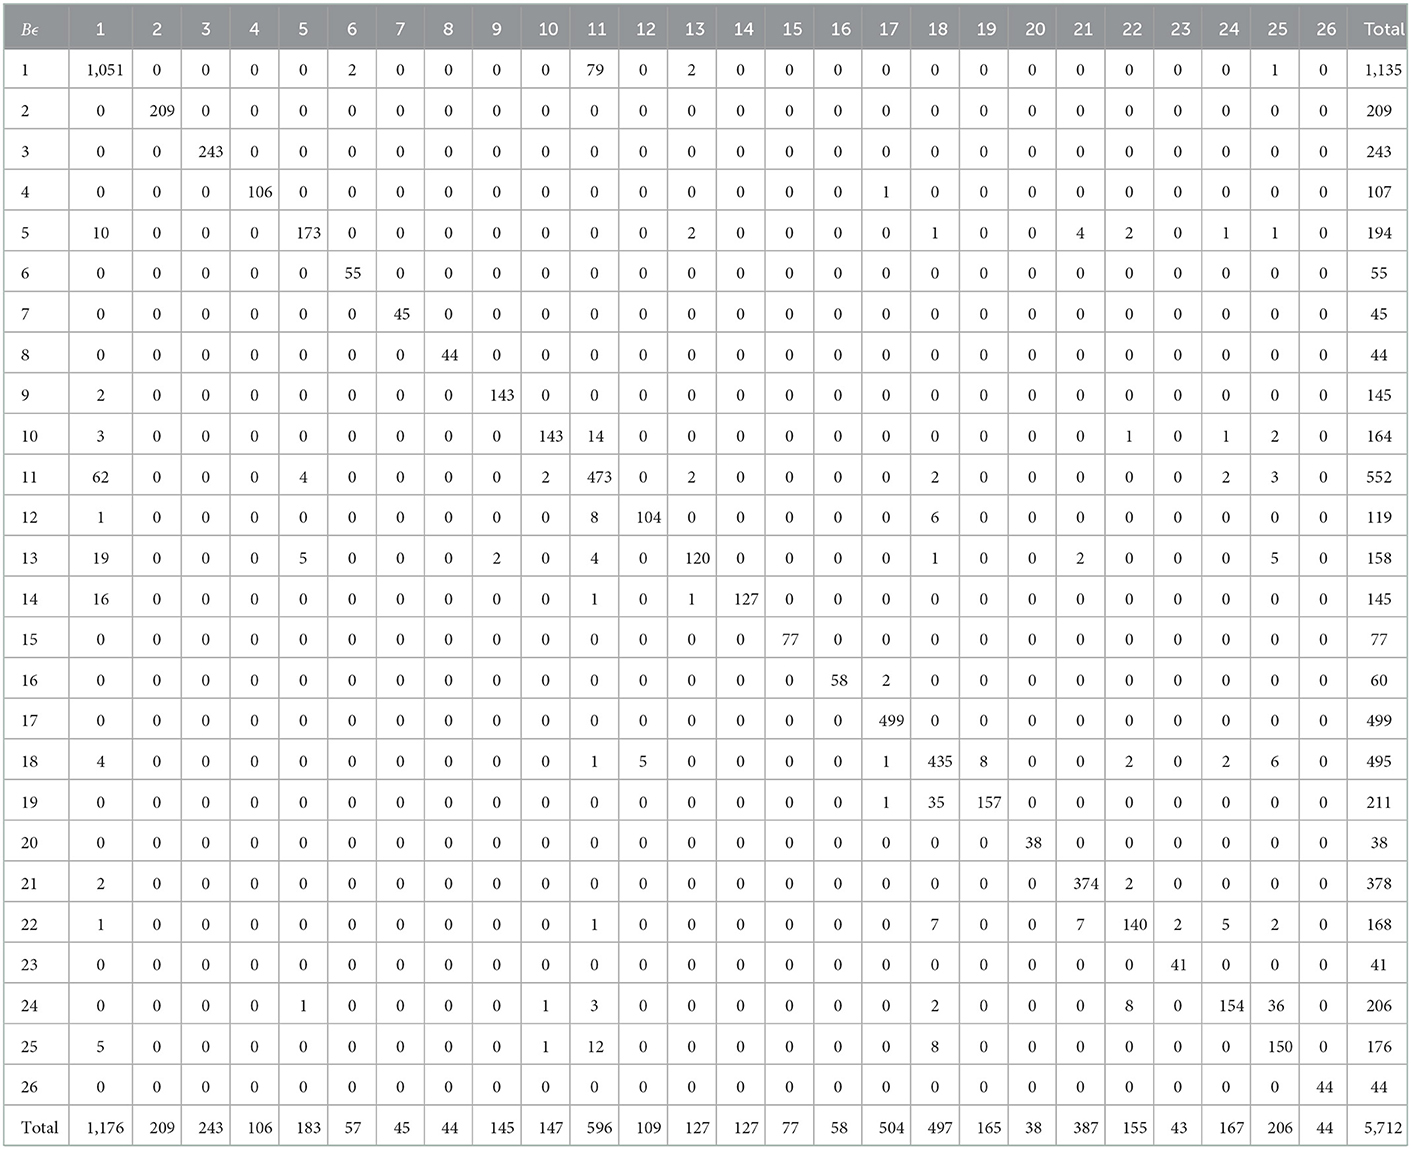
Table 2. Matrix of classification errors taking into account age groups of forests.
The Kappa analysis is a discrete multivariate technique used in accuracy assessment to statistically determine whether one error matrix is significantly different from another (Bishop et al., 2007). The result of performing a Kappa analysis is a KHAT statistic (actually , an estimate of Kappa), which is another measure of agreement or accuracy. This measure of agreement is based on the difference between the actual agreement in the error matrix (i.e. the agreement between the remotely sensed classification and the reference data as indicated by the major diagonal) and the chance agreement that is indicated by the row and column totals (i.e. marginals). The following equations are used for computing the KHAT statistic and its variance (Congalton and Green, 2009).
Let
be the actual agreement, and
with pi+ and p+j as previously defined, the “chance agreement.” The maximum likelihood estimate of Kappa is given by
For computational purposes
With nii, ni+ and n+i as previously defined (Congalton and Green, 2009).
According to the results of the accuracy assessment, it was found that the coefficient for classifications by training sample taking into account age groups and without taking them into account is 90.3 and 91.4%, respectively.
6. Conclusions
Modern open data of remote sensing of the Earth of high resolution, allow to fully improve the method of taxation of forests, in particular the definition of the predominant species. The created classifiers, which were based on the existing tree species map, allow to solve a wide range of tasks related to the definition of forest classes and/or succession processes, the degree of afforestation and deforestation. Based on the results of the accuracy assessment, it can be stated that the results of the classification of forests are identical both with regard to age and without. Based on the obtained graphs of spectral class signatures, it is possible to improve the process of controlled classification by selecting the best channels of the composite image for each type and age group. These results will form the basis of our further research.
A review of forest measurement methods suggests that remote sensing can be cost-effective for updating inventories and possibly for monitoring regeneration and verification of ground data. Many types of changes can be covered in a single scene, and satellite imagery can be archived, but you need to make an effort to preview satellite data on quality—for example, to mark a haze or cloud cover. Another advantage of remote sensing is their high resolution. Using the Sentinel-2 platform, it is possible to create maps at a scale of 1:25,000, which is the standard in forest management in Ukraine, as well as to control illegal logging, afforestation, deforestation, etc. Finally, the availability of a complete set of open and free software for remote sensing data processing and publishing of cartographic materials significantly reduces the use of financial resources, which is an important factor for the implementation of these techniques in everyday production.
An important unresolved issue is the accuracy of determining individual classification samples for species that make up a negligible percentage of the forest.
Data availability statement
The original contributions presented in the study are included in the article/supplementary material, further inquiries can be directed to the corresponding author.
Author contributions
OM: conceptualization, methodology, formal analysis, and data curation. PM: software, validation, investigation, resources, writing—original draft preparation, and visualization. AB: writing—review and editing, supervision, project administration, and funding acquisition. All authors have read and agreed to the published version of the manuscript.
Conflict of interest
The authors declare that the research was conducted in the absence of any commercial or financial relationships that could be construed as a potential conflict of interest.
Publisher's note
All claims expressed in this article are solely those of the authors and do not necessarily represent those of their affiliated organizations, or those of the publisher, the editors and the reviewers. Any product that may be evaluated in this article, or claim that may be made by its manufacturer, is not guaranteed or endorsed by the publisher.
References
Abbas, A. W., Minallh, N., Ahmad, N., Abid, S. A. R., and Khan, M. A. A. (2016). “K-Means and ISODATA clustering algorithms for landcover classification using remote sensing,” Sindh University Research Journal-SURJ, Science Series, Vol. 48.
Baetz, C., Uhl, A., and Brunn, A. (2018). “Satellite based change detection of the volyn region,” in Proceeding of the Conference on Socio-Geographical Factors of the Regions Development, ed S. Pugach.
Ball, G. H., and Hall, D. J. (1963). ISODATA, a novel method of data analysis and pattern classification. Technical report, Stanford research inst Menlo Park CA 1965.
Bishop, Y. M., Fienberg, S. E., and Holland, P. W. (2007). Discrete Multivariate Analysis: Theory and Practice. Springer Science and Business Media.
Congalton, R. G., and Green, K. (2009). Assessing the Accuracy of Remotely Sensed Data: Principles and Practices. CRC Press.
Congedo, L. (2016). Semi-automatic classification plugin documentation. Release 4, 29. doi: 10.13140/RG.2.2.29474.02242/1
Delegido, J., Verrelst, J., Alonso, L., and Moreno, J. (2011). Evaluation of sentinel-2 red-edge bands for empirical estimation of green LAI and chlorophyll content. Sensors 11, 7063–7081. doi: 10.3390/s110707063
Derzhlisahenstvo. (2020). Publichnyi zvit Derzhavnoho ahentstva lisovykh resursiv Ukrainy za 2019 rik. Available online at: https://mepr.gov.ua/news/34682.html (accessed November 06, 2020).
European Space Agency. (2020). European Space Agency - Earth Online. Available online at: https://sentinels.copernicus.eu/web/sentinel/technical-guides/sentinel-2-msi/
Franklin, S., and Wulder, M. (2022). Remote sensing methods in medium spatial resolution satellite data land cover classification of large areas. Progr. Phys. Geogr. 26, 173–205. doi: 10.1191/0309133302pp332ra
Gatti, A., Naud, C., Castellani, C., and Carriero, F. (2018). Sentinel-2 Products Specification Document. Thales Alenia Space.
Grabska, E., Hostert, P., Pflugmacher, D., and Ostapowicz, K. (2019). Forest stand species mapping using the sentinel-2 time series. Remote Sens. 11, 197. doi: 10.3390/rs11101197
Hlásny, T., Mátyás, C., Seidl, R., Kulla, L., Merganičová, K., Trombik, J., et al. (2014). Climate change increases the drought risk in Central European forests: what are the options for adaptation? Central Eur. Forestry J. 60, 5–18. doi: 10.2478/forj-2014-0001
Iverson, L. R., Graham, R. L., and Cook, E. A. (1989). Applications of satellite remote sensing to forested ecosystems. Landscape Ecol. 3, 131–143. doi: 10.1007/BF00131175
Kolstroom, M., Lindner, M., Vilén, T., Maroschek, M., Seidl, R., Lexer, M. J., et al. (2011). Reviewing the science and implementation of climate change adaptation measures in European forestry. Forests 2, 961–982. doi: 10.3390/f2040961
Laurin, G. V., Liesenberg, V., Chen, Q., Guerriero, L., Del Frate, F., Bartolini, A., et al. (2013). Optical and SAR sensor synergies for forest and land cover mapping in a tropical site in West Africa. Int. J. Appl. Earth Observat. Geoinform. 21, 7–16. doi: 10.1016/j.jag.2012.08.002
McCool, M., Reinders, J., and Robison, A. (2012). Structured Parallel Programming: Patterns for Efficient Computation; Elsevier.
Shvidenko, A., Buksha, I., Krakovska, S., and Lakyda, P. (2017). Vulnerability of Ukrainian forests to climate change. Sustainability 29, 1152. doi: 10.3390/su9071152
Turiyske Forestry. (2022). SE “Turiyske Forestry” - Volyn Regional Department of Forestry. Available online at: https://lisvolyn.gov.ua/?p=3329
Keywords: remote sensing, tree species, supervised classification, unsupervised classification, Ukraine
Citation: Melnyk O, Manko P and Brunn A (2023) Remote sensing methods for estimating tree species of forests in the Volyn region, Ukraine. Front. For. Glob. Change 6:1041882. doi: 10.3389/ffgc.2023.1041882
Received: 11 September 2022; Accepted: 09 January 2023;
Published: 26 January 2023.
Edited by:
Ana Cristina Gonçalves, University of Evora, PortugalReviewed by:
Alvaro Fazenda, Federal University of São Paulo, BrazilSyamsu Rijal, Hasanuddin University, Indonesia
Copyright © 2023 Melnyk, Manko and Brunn. This is an open-access article distributed under the terms of the Creative Commons Attribution License (CC BY). The use, distribution or reproduction in other forums is permitted, provided the original author(s) and the copyright owner(s) are credited and that the original publication in this journal is cited, in accordance with accepted academic practice. No use, distribution or reproduction is permitted which does not comply with these terms.
*Correspondence: Oleksandr Melnyk,  aG9ja2luc0BnbWFpbC5jb20=
†These authors have contributed equally to this work
‡ORCID: Oleksandr Melnyk orcid.org/0000-0002-5429-4038
Pavlo Manko orcid.org/0000-0001-7564-2356
Ansgar Brunn orcid.org/0000-0002-8692-3636