Abstract
The role of unmanaged forests is discussed controversially in the context of climate change. One of the key questions is, whether they can contribute to the mitigation of climate change as a carbon sink and storage. However, carbon dynamics of forests after the cessation of management are not well understood. We analyzed a set of 64 forest sites, covering wide gradients of time since abandonment (0–68 years) and stand age (65–261 years) in even-aged, unmanaged beech forests. Five sites that were unmanaged for >100 years complemented the main dataset. We compiled site-specific carbon balances, distinguishing six carbon-compartments: Carbon in aboveground living and dead biomass, carbon in belowground living and dead biomass, and carbon in the organic layer and the mineral topsoil (0–30 cm). We found positive effects of increasing TSA on the carbon stock in living biomass and aboveground dead biomass for up to 50 years after management ceased. The average increase of the total carbon stock over 50 years of TSA was ≈ 80 Mg C ha–1. The effect of stand age on aboveground living biomass showed a convex relation. Aboveground dead biomass increased logistically with TSA, while belowground dead biomass decreased. On average, the five sites unmanaged for >100 years held lower total carbon stocks compared to the observed biomass peak around 50 years of TSA. However, they contained considerably higher amounts of deadwood. Carbon in the mineral soil did neither change with TSA nor with stand age and was driven by pH. Carbon stocks in newly unmanaged forests increased almost linearly for approximately 50 years after cessation of management. Subsequently, a stabilization or medium-term decrease in carbon stock was observed, likely due to the initiating transition from even-aged to multi-aged structures. We conclude that, besides their value for biodiversity and ecosystem functions, the potential of naturally developing forests as a medium-term carbon sink and long-term stable carbon storage should be considered as a valuable contribution to Climate-Smart Forestry.
1. Introduction
The high complexity of policies devised to mitigate climate change requires a sound understanding of natural carbon cycles in different ecosystems (Pan, 2011; IPCC, 2021). In this respect, forests are of particular interest, as they constitute a large terrestrial carbon sink and storage (Carey et al., 2001; Luyssaert et al., 2008; Pan et al., 2013; Pugh et al., 2019), even in intensively managed regions of the world. The type and intensity of management has a strong impact on the level and persistence of forest carbon stocks (Mikoláš et al., 2021; Mackey et al., 2022). In Central Europe, most forests are managed with varying intensity. In Germany, there are no true primeval or virgin forests (Sabatini et al., 2018; see Buchwald, 2005 for context), but an increasing proportion of forest area is being set aside from active management (Meyer et al., 2022).
Deforestation and forest use has caused large carbon debts from European forest ecosystems in the past (Naudts et al., 2016, but see discussion in related eLetters). In recent decades, however, the growing stock, and thus carbon storage, of European forests has increased considerably (Spiecker et al., 1996; Spiecker, 2001; Pan, 2011; Pretzsch et al., 2014). Currently it is, sometimes heatedly, debated whether the mitigation of climate change is better served by the abandonment of forest managment or the intensification of management and utilization of wood (Schulze et al., 2020; but see: Kun et al., 2020; Welle et al., 2020; Ameray et al., 2021; Luick et al., 2021; Schulze et al., 2021, 2022). Already, the scientific debate has advanced towards lobby work and political decision making (Raven, 2021; Irslinger, 2022). Climate change, together with the diverse demands of society on forests and forest management, sets the challenge for Climate-Smart Forestry (CSF) (Bowditch et al., 2020; Verkerk et al., 2020). One important goal of CSF is to optimize carbon uptake and storage in forests and wood products and the substitution of fossil fuels and materials with a large carbon footprint. However, CSF should not be mislabeled as “carbon forestry”, as it also incorporates resilience of forests to climate change, biodiversity and other ecosystem functions and aims to create synergies in forest management (Nabuurs et al., 2018). It is important that Climate-Smart Forestry management decisions are based on scientific evidence.
Naturally developing forests are an important element of the EU Biodiversity Strategy (European Commission, 2020) and the German National Biodiversity Strategy (BMU, 2007). Germany aims at allocating 5% of the national forest area to natural development. Several other European countries are also withdrawing large forest areas from management, in order to conserve and restore the native biodiversity and to mitigate climate change. This has further sparked the debate about the effects of forest management and abandonment on climate change mitigation, as is the case for most approaches of nature-based solutions to climate change (Seddon et al., 2020).
The argument whether to increase biomass harvest or to increase carbon stocks by ceasing management is complex and subject to uncertainty (Ciais et al., 2008; Bellassen and Luyssaert, 2014; Pukkala, 2018). It is crucial to develop a better understanding of carbon dynamics in unmanaged forests, not least in view of the economic trade-offs that go along with abandoning productive forest sites. Empirical data to evaluate the potential mid- and long-term effects of ceasing management are scarce, restricting a factual debate. Better data and understanding should also help to improve strategic planning and the selection of forest stands for strict protection, based on their characteristics and the targeted objectives.
The state of knowledge on aboveground growing stocks and dynamics over the time period of a production cycle is well-established in temperate Europe (Pretzsch, 2010; see Figure 1) Regarding forests where management has ceased and that grow beyond the extent of the typical production cycle (approx. 160 – 180 years), there is uncertainty about future stand development and related ecosystem functions. Strict forest reserves (SFR; bindingly set aside for natural forest development; see Parviainen et al., 2000) have been studied to an extent, but the results are as yet inconclusive. So far, they have only reached the initial phase of transition toward old-growth structures and dynamics, a long process that likely takes centuries. Old forests, abandoned for more than a century, are generally rare and thus not well studied. Even these forests often bear legacies of former management to the present day. It is generally assumed that, if left undisturbed and in the long-run, a forest ecosystem will naturally evolve toward an ecological “steady state” or dynamic equilibrium (Bormann and Likens, 1994; Franklin et al., 2002). This status is believed to resemble the structure of primeval forests. In Europe, there are only few remnants of primeval forest left (Sabatini et al., 2018). Recently, records on wood volume and biomass stocks in primeval beech (Fagus sylvatica) forests of Eastern Europe were published (Hobi et al., 2015; Glatthorn et al., 2018; Stillhard et al., 2022) and several classical studies are available (e.g., Leibundgut, 1978; Korpel’, 1995). Meyer et al. (2021) rated the respective evidence for European primeval forest as “established but incomplete”, i.e., there are only few studies but their findings are similar. Concerning the carbon balance of old forests, opinions differ. Several studies demonstrated a persistent carbon sink in old-growth forests (Janisch and Harmon, 2002; Knohl et al., 2003; Hessenmöller et al., 2008; Luyssaert et al., 2008; Heiri, 2009; Brang et al., 2011), while studies based on modeling approaches assumed steady-state or negative carbon balances (Hasenauer, 2011; Köhl et al., 2011).
FIGURE 1
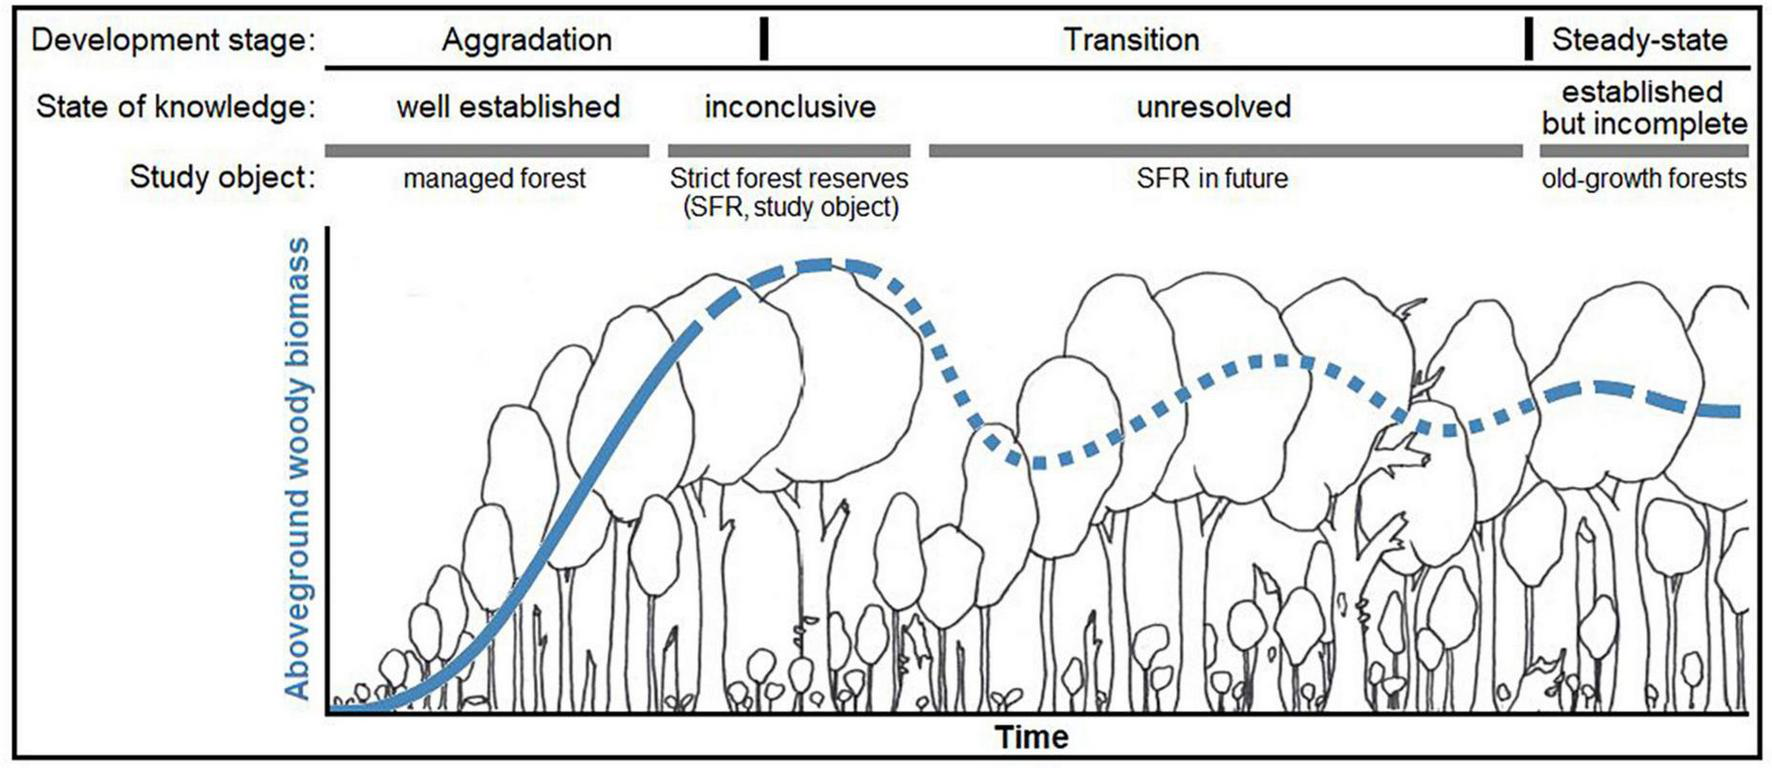
Qualitative representation of our conceptual model [modified graphical abstract from Meyer et al. (2021)*] on the state of knowledge and the hypothesized development of formerly managed forests toward old-growth forests. The figure exemplary represents aboveground woody biomass, as it is the most investigated and reported compartment, however with distinct ambiguity about its long-term development in strict forest reserves. We hypothesized that, after abandonment, carbon stored in aboveground woody biomass increases over time, however approaching an upper limit (“carbon carrying capacity,” defined by environmental conditions, etc.) within an unknown period of time. Structural changes and other processes may induce fluctuations around this capacity over time, however a stable steady-state is approached in the long run. *The referenced article is an open access article under the terms of the Creative Commons Attribution-Non-Commercial-NoDerivs License, which permits use and distribution in any medium, provided the original work is properly cited, the use is non-commercial and no modifications or adaptations are made.© 2021 The Authors. Journal of Ecology published by John Wiley & Sons Ltd on behalf of British Ecological Society.
The largest deficiency in the understanding of forest carbon dynamics concerns strictly protected or re-wilded forests, i.e., formerly managed stands that now develop naturally. Although data on SFR are increasingly available, time-series over longer periods are scarce and not representative (Meyer, 2020). Thus, the medium-term development (i.e. several decades) of formerly managed forests and their transition toward primeval forest structures are not well understood. This is critical, as setting aside forests is regarded as a contribution to the mitigation of climate change in Europe (BMU, 2007; European Commission, 2020). Moreover, across all forest types the state of knowledge regarding the belowground carbon stocks and dynamics is rather poor (Fahey et al., 2010; Ameray et al., 2021).
Against this backdrop we asked how carbon stocks change after the abandonment of managed forests. We hypothesized that the carbon stock would increase with time since abandonment (TSA), eventually reaching a saturation point or carrying capacity (Gupta and Rao, 1994; Keith et al., 2009). Furthermore, we hypothesized that the effect of stand age on carbon stocks would be a convex function. We expected the growth of living biomass and deadwood accumulation to be the main contributors to an increasing carbon stock. We further hypothesized that, similar to the findings of Meyer et al. (2021), a saturation of the carbon sink could become apparent, however only after several decades of TSA. We expected no effects of TSA and stand age on carbon stocks in the mineral soil and organic layer, as partial harvest practices are reported to have only little effect on these compartments (Lal, 2005; Mayer et al., 2020) and we assume these effects of moderate canopy opening to be comparable to natural disturbances.
2. Materials and methods
To test our hypotheses, we collected data from 100 strict forest reserves (SFR) throughout Germany (Figure 2A), covering a large geographical range of Central European temperate forest. As time-series data are rare, especially for the higher range of TSA, we followed a space-for-time substitution approach (Likens, 1989), resulting in a chronosequence (Walker et al., 2010) of sites with differing TSA and stand ages.
FIGURE 2
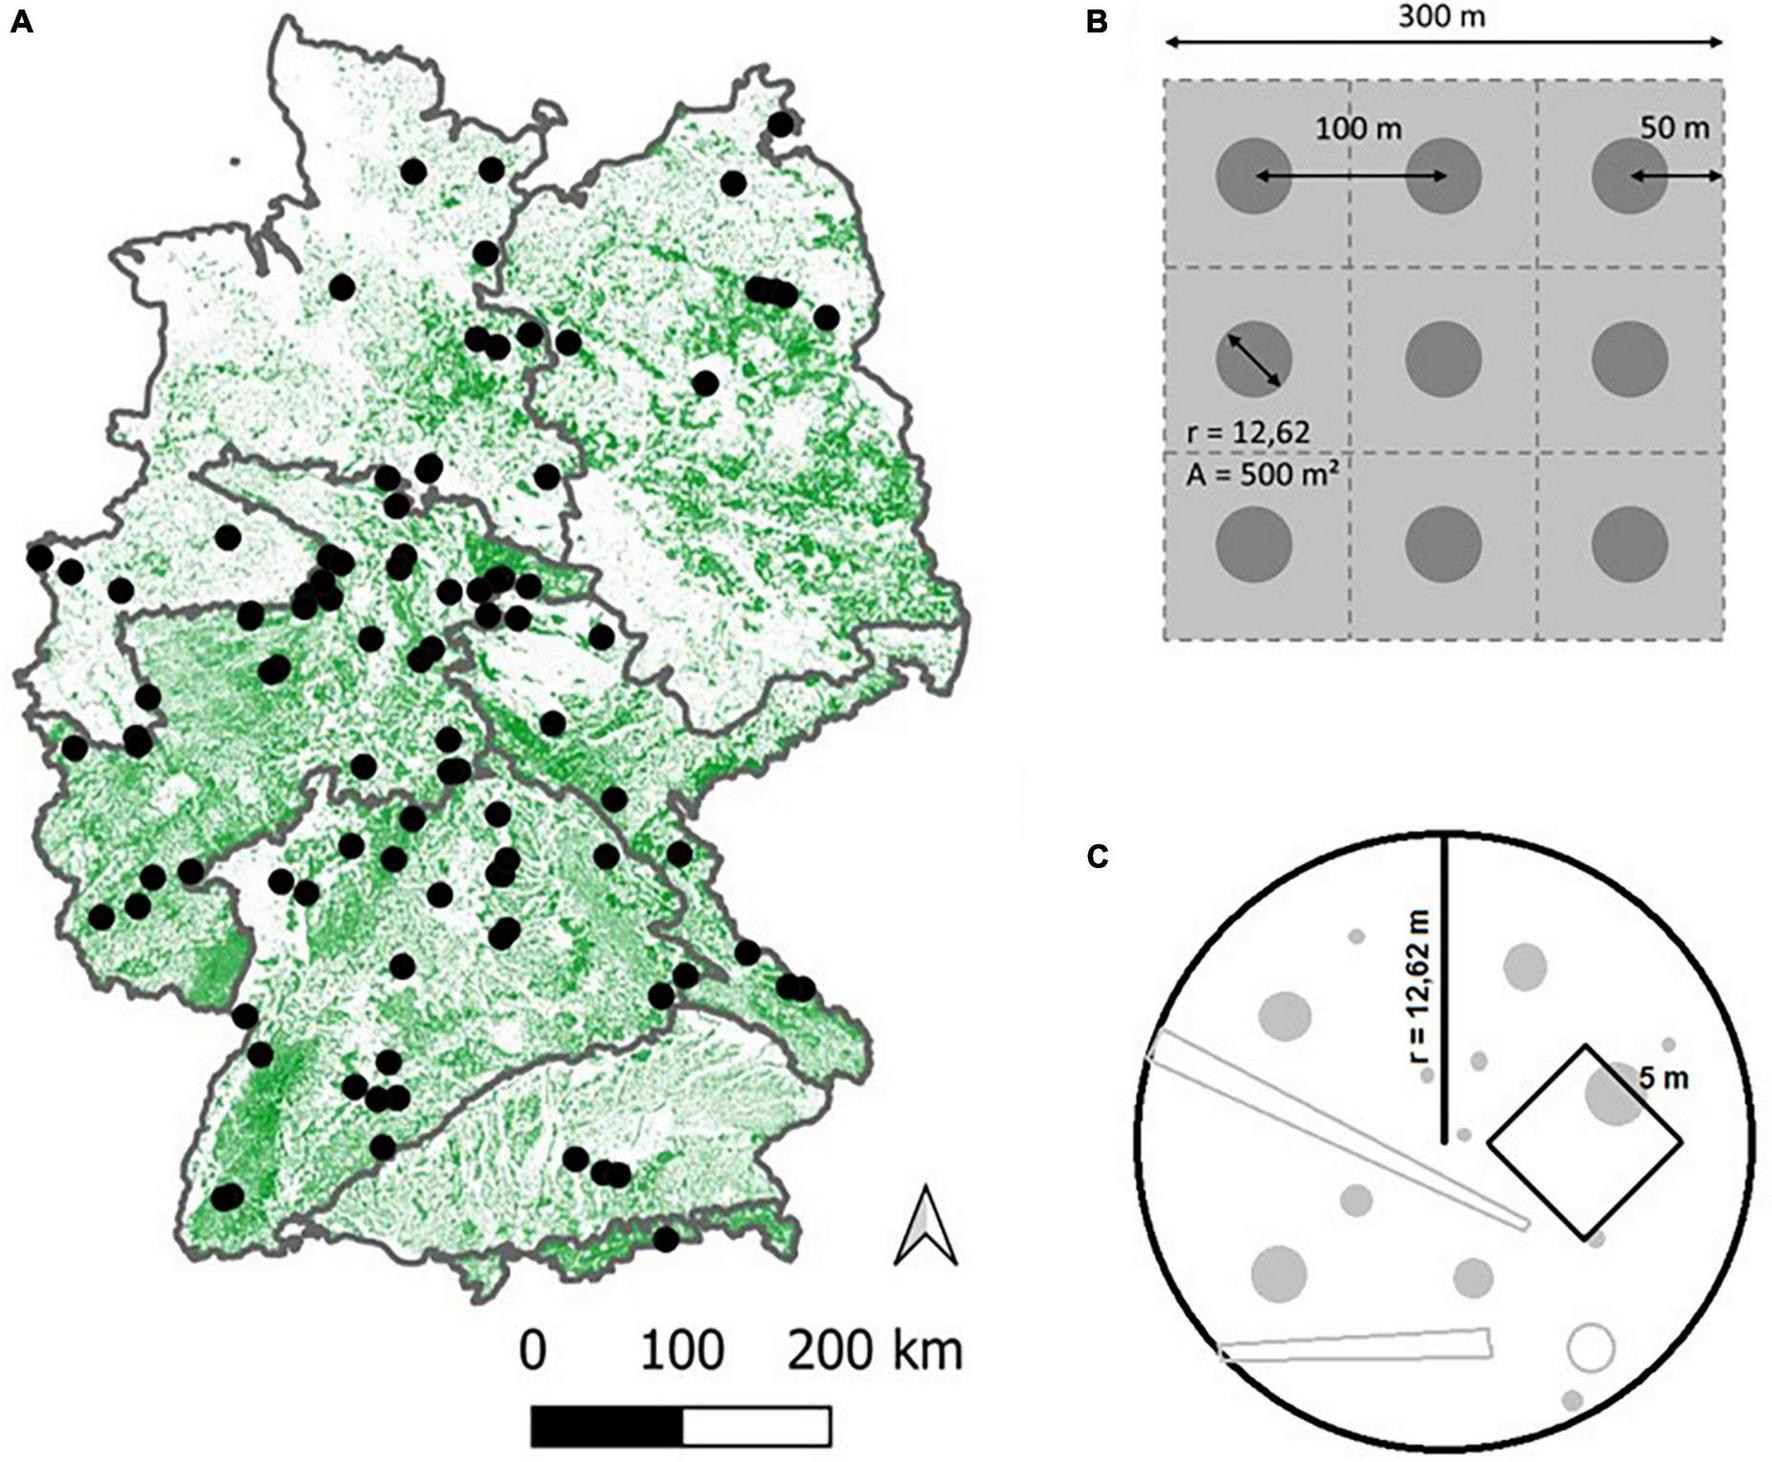
Overview of the 100 site locations across Germany (A). The map depicts forest cover, the boundaries shown encompass the major natural regions of Germany (Meynen et al., 1953). Nine circular plots per site were laid out in a 3 × 3 grid whenever possible (B), covering an area of 9 ha. Distance between plot centers was 100 m and distance from the outer plot centers to the stand boundaries was 50 m. The plot area was 500 m2 (r = 12.62 m) on which all inventory objects were sampled. A sub-area of 5*5 m was laid out to record tree regeneration (C).
2.1. Site selection
Suitable candidate sites were screened from the database of German SFR (Münch, 2007) based on forest type, TSA and stand age. The majority of the candidate site pool was made up of even-aged beech stands, followed by oak (Quercus spp.) dominated stands (Table 1). This reflects that natural forest communities in Germany are dominated by beech and oak forest types (83%) (Schmitz, 2014).
TABLE 1
| Forest type | Nutrient supply | Altitudinal range | N: age-class, (multi-aged) | Range: TSA, (stand age) [yr.] |
| Beech | Poor | colline | 13, (2) | 4 – 65, (91 – 202) |
| Beech | Poor | submontane | 9, (3) | 13 – 55, (140 – 20) |
| Beech | Poor | montane | 6 | 0 – 74, (155 – 261) |
| Beech | rich | colline | 23, (2) | 6 – 68, (65 – 222) |
| Beech | rich | submontane | 10, (4) | 10 – 59, (98 – 173) |
| Beech | rich | montane | 5 | 22 – 48, (160 – 232) |
| Beech (TSA > 100 yr.) | − | − | 5 | 106 – 400 + , (200 – 465) |
| Oak-Hornbeam | − | − | 11 | 13 – 67, (120 – 220) |
| Oak-Hornbeam | − | − | 3 | 20 – 50, (143 – 182) |
| Alder-Elm | − | − | 1 | 70, (176) |
| Spruce | − | montane | 1 | 43, (215) |
| Beech | − | − | 1 | 48, (194) |
| Pine | − | − | 1 | 34, (158) |
Overview over the number of selected sites (N) per forest type and sub-group (nutrient supply, altitudinal range) and the ranges of TSA [y] and stand age [y] (reference year: 2020). Multi-aged sites that were selected, are noted in brackets.
Beech = Fagus sylvatica; Oak = Quercus spp.; Hornbeam = Carpinus betulus; Alder = Alnus spp.; Elm = Ulmus spp.; Spruce = Picea abies; Pine = Pinus sylvestris.
To account for environmental gradients, we stratified the candidate sites of beech and oak dominated stands into sub-groups. Based on soil and site characteristics from the SFR database, beech stands were divided into nutrient poor and nutrient rich sites, as well as the planar to colline, submontane and montane altitudinal range, resulting in six sub-groups of even aged beech forest (Table 1). Mixed oak forest candidate sites were divided into two sub-groups of wet-favorable and dry site conditions. In some cases, beech-forests were managed in group selection systems and thus, a uniform stand age cannot be determined. Therefore, an additional sub-group “multi-aged” stands was added for beech sites.
For the selection of beech and oak sites, we applied an orthogonal site selection procedure to cover the ranges of both TSA and stand age independently, resulting in a two-dimensional chronosequence with multiple combinations of TSA and stand age. For each forest type and sub-group, candidate sites were assigned to classes of TSA (class-width 15 yr.; e.g., 0-15 yr., 16-30 yr., etc.) and stand age (class-width 40 yr.; e.g., 80-120 yr., 121-160 yr., etc.). For each forest type one data point from each occupied class was randomly selected. We applied a weighted random sampling approach (Efraimidis and Spirakis, 2016) to promote underrepresented major natural regions of Germany (Meynen et al., 1953; Figure 2A). Sites located in these regions were assigned with higher selection probabilities. This allowed us to improve the spatial coverage and evenness of selected set of sites, as otherwise over-represented natural regions would dominate the dataset.
Multi-aged beech sites were selected to represent a gradient of TSA only, and we incorporated nutrient conditions as well as the colline and submontane altitudinal range.
SFR representing other forest types (Table 1) are currently not available in sufficient quantity to compile a reasonable selection and thus gather statistically useful data. Hence, only individual sites were selected within similar ranges of TSA and stand age.
Lastly, five beech forest sites that have been unmanaged for more than 100 years completed our set of selected sites. Forests unmanaged for that long are rare in Germany and the best natural reference available for the temporal development of SFR.
Following the site selection process, on-site inspections were conducted, to determine whether the selected sites met the selection criteria and that stands of suitable size were present. We followed a standardized protocol on all sites, assessing forest type and structure, management legacy, deadwood, tree species composition and terrain. Exclusion criteria were, for example, wrong forest type, unsuitable species composition based on pre-established thresholds, management legacy did not fit designated TSA or unfavorable terrain. Excluded sites were replaced by a repeated random pick from the respective TSA/stand-age class and were inspected accordingly.
2.2. Data collection
Nine circular plots (each with r = 12.62 m, A = 500 m2; Figure 2C) were established on each site. Generally, these plots were set up in a 3 × 3 grid, with 100 m distance between plot centers and 50 m internal buffer from the stand boundaries (Figure 2B). In cases where this grid could not be laid out, due to restrictions in the shape of the stand or difficult terrain, the most compact configuration feasible was chosen, to ensure spatial coherence of the plots.
Field data was collected between December 2020 and June 2021. All standing trees with ≥ 7 cm diameter at breast height (DBH) were registered. For each object, DBH, species, object class, position within the plot and individual slope at the base were recorded. Heights were measured for three trees of each species occurring on the plot. Lying objects (longitudinal axis ≤ 10 gon (gradian) to terrain surface) were recorded when their DBH or lower diameter was ≥ 20 cm for dead objects and ≥ 7 cm for living objects. Species, degree of decomposition (five stages), object class, length and their position on the plot were noted. The object class consisted of the life class (living, dead), position class (e.g., upright or hanging) and the compartment class (complete, stem only, etc.). Regeneration was recorded on a 5 × 5 m subsection of the plot, differentiating between species, height class and whether they were browsed. Additionally, the average slope of the plot, as well as exposition and topography were determined.
2.3. Dataset
We revised the initially available site information by contacting the site managers, asking for information on the last management activity and exact stand age. If managers were able to supply detailed information, we adjusted our data accordingly. TSA is generally counted from the year the site became an SFR legally, but the last management activity might date back several years before that. If no information was available we assumed that interventions are usually executed in 10-year cycles and increased TSA by five years, as the average time since the last management activity. We obtained site specific climate data on average annual temperature, annual precipitation and the climatic water balance of a recent drought period (Kaspar et al., 2013; DWD Climate Data Center (CDC), resolution 1 × 1 km, reference period 1991 - 2020, dry years 2018-2020). Site specific data on usable field capacity (uFC) in the upper 30 cm of the soil were calculated based on the soil sample characteristics. Plot specific elevation was acquired from digital elevation models (resolution 25 m, and 1 m if available).
Field data was checked for plausibility and recording errors. Species- and site-specific height curves were fitted using the height measurements taken in the field. They were used to estimate the height of all standing objects without height measurement.
2.4. Carbon content of biomass
Species specific volumetric functions were applied to calculate individual object volume (R-package “nwcalc”, unpublished). These functions yield similar results to the standard calculations used in the German national forest inventory (Riedel and Kändler, 2017; Riedel et al., 2017), however the latter do not allow to consider incomplete objects (i.e., broken trees) or deadwood. Extrapolation factors were applied to account for unmeasured objects below the DBH threshold in the lying deadwood compartment and we further compensated for decay stage (see Supplement in Meyer et al., 2001). Object biomass was derived from the computed and extrapolated volumes by multiplying with species specific wood densities from the global wood density database (Zanne et al., 2009). Regeneration biomass was calculated following Annighöfer et al. (2016). Root biomass was modeled based on DBH, applying the species specific functions from Forrester et al. (2017).
The carbon content was calculated by multiplying biomass with a factor of 0.488 for broadleaved species and 0.508 for conifer species (Thomas and Martin, 2012). Subsequently, all numbers given refer to carbon content (Mg ha–1).
2.5. Soil organic carbon
Volumetric soil samples were taken on a subset of three plots per site. On each of those plots samples were taken at three systematically distributed satellite locations (10 m from the plot center, 0°, 120° and 240° azimuth). Generally, samples were taken with a root auger. It was driven into the soil until a total sample depth of 30 cm in the mineral soil was realized. The sample was divided into four compartments: the organic layer and three depth-classes of the mineral soil (0 – 5 cm, 5 – 10 cm and 10 – 30 cm). On the plot level the samples of each compartment were combined into mixed samples. If the soil conditions were not appropriate for the use of the root auger the organic layer was sampled with a humus pot. Sample rings were used to take samples from the mineral soil accordingly. If the full sampling depth to 30 cm could not be achieved, this was noted and considered in the quantification of the soils carbon content. Detailed information on the soil bulk density and chemical analysis can be found in the Supplementary material 1.
In eight forest stands the root auger method and the sample ring method were applied simultaneously to standardize the comparison of the produced results. As yet, only the latter method is widely accepted. Comparative analysis showed the two methods to deliver similar results. Models for soil organic carbon were built from a data subset of beech age-class stands containing only the sampled plots.
2.6. Data analysis
We distinguished six carbon compartments for our analysis. Separately for above- and belowground, we differentiated living and dead biomass as individual carbon compartments. The other compartments were carbon in the mineral soil (0-30 cm), hence termed “mineral topsoil”, and carbon in the organic layer.
The data were clustered into subsets based on forest type. Age-class beech sites made up the largest subset with n = 64 sites. Previously, one site was excluded from the analysis (“An den zwei Steinen”, ID = 07-005). Here, intense grazing pressure from red deer has led to an open stand structure with a degraded canopy and lack of regeneration or understory development. We assessed this stand development to be very unique. Due to its position at the end of the (continuous) TSA gradient (TSA = 74 yr.) the site significantly reduced model adequacy.
For data analysis, the categorization of forest types by distinguishing between nutrient rich or poor sites, as well as the three altitudinal ranges was replaced by continuous variables. Allowing us to analyze the six different beech forest types collectively. We used the pH values obtained from soil analysis as a proxy for nutrient availability. Abiotic conditions were described by average annual temperature and annual precipitation, average plot slope, topography and exposition. Elevation was significantly correlated to temperature and precipitation and therefore excluded. Additionally, usable field capacity was used to model carbon in living biomass, while the climatic water balance of the recent drought period (years 2018-2020) was used to model carbon in dead biomass. Stand characteristics included were TSA, stand age and the share of beech.
We used the statistics software R (R Core Team, 2016) to apply general additive models (mgcv::gam; GAM) with a “log” link-function from the package “mgcv” (Wood, 2011). Site identity was accounted for as a random effect. Carbon content in the above- and belowground compartments of dead biomass was log-transformed.
Lastly, we combined the GAM models of the six carbon compartments into a predictor function of carbon stock, sensitive to the predictor variables used in the GAMs. Dummy data based on the average environmental conditions were used, with six levels of TSA (10 – 60 yr.) and four levels of stand age (80, 120, 160, and 200 yr.).
It was not possible to fit robust models to the data subsets of multi-aged beech and oak forests due to low sample size. Uniquely represented forest types as well as the five beech reference sites (TSA > 100 y) were included comparatively.
3. Results
3.1. Carbon storage and variability
Across the 100 sites, the site averages of total carbon storage ranged between 186.5 and 493.0 ( = 315.6) Mg C ha–1. Out of the ten sites with the highest total carbon storage, seven were nutrient rich beech stands. Carbon stored in the aboveground living biomass alone varied between 59.0 and 261.9 ( = 151.6) Mg C ha–1, while it was 15.2 – 47.7 ( = 29.7) Mg C ha–1 belowground. Aboveground dead biomass contained between 1.3 and 61.0 ( = 14.1) Mg C ha–1 and carbon in belowground dead biomass ranged from 1.5 to 28.2 ( = 7.7) Mg C ha–1. The soil organic layer held 0.5 to 65.3 ( = 13.5) Mg C ha–1, while the mineral soil had a carbon stock of between 31.9 and 304.8 ( = 97.4) Mg C ha–1.
For even-aged beech stands, the average amount of carbon stored in aboveground living and dead biomass increased for approximately 50 years of TSA as well as with increasing stand age (Table 2). Average values were lower for both high stand age (201 – 240 yr.) and TSA (61 – 75 yr.). The five sites with TSA > 100 yr. had the highest average value. With either increasing TSA or stand age the standard deviation between site average values increased.
TABLE 2
| TSA [yr.] | Carbon: (Mg ha–1) | Carbon: σ (Mg ha–1) | |
| 0 - 15 | 142.7 | 51.6 | |
| 16 - 30 | 150.6 | 58.5 | |
| 31 - 45 | 174.6 | 62.4 | |
| 46 - 60 | 186.6 | 61.1 | |
| 61 - 75 | 152.5 | 72.9 | |
| > 100 | 190.7 | 97.7 | |
| Stand age [yr.] | German forest inventory: (Mg ha–1) | ||
| 41 – 80 | 86.0 | 17.4 | 110.9* |
| 81 - 120 | 189.7 | 60.2 | 144.8* |
| 121 - 160 | 172.2 | 57.3 | 150.6* |
| 161 - 200 | 170.0 | 63.2 | 148.6* |
| 201 - 240 | 145.2 | 62.1 | NA |
| 240 | 175.9 | 97.4 | NA |
Mean and standard deviation of aboveground carbon (Mg ha–1) in dead and living biomass for even-aged beech forests in pooled groups of TSA and stand age (reference year: 2020).
Mean and standard deviation from multiple samples were computed with combinevar() in the R-package “fishmethods” (Nelson, 2022). For comparison with managed forests, we converted the publically available volumes per age class from the German Forest Inventory (Schmitz, 2014; https://bwi.info/) to Mg C ha–1. Managed stand with stand age > 160 yr. are recorded as one group in the German inventory. *As aboveground deadwood is reported independent of stand age, we added the average amount of 21 m3 ha–1 to these values.
3.2. Carbon in living biomass
The 64 age-class beech forest sites stored 80.5 – 261.9 ( = 162.5) Mg C ha–1 in aboveground living biomass. Increasing TSA had a positive effect on carbon stored in the living biomass (Table 3 and Figure 3; see also Supplementary materials 2, 3). While the relationship was linear for approximately 0 – 45 years after abandonment, it subsequently leveled out to 180 – 200 Mg C ha–1 (Table 2 and Figure 3), showing a decreasing effect at higher values of TSA. Over 50 years of TSA, the average increment was 70–80 Mg C ha–1. Stand age showed a convex relationship with carbon content in the living biomass, peaking at 150 yr. The effect of stand age was greatest in the aboveground compartment, while it was not a powerful predictor in the belowground compartment (Supplementary material 3). A higher share of beech trees was associated with higher carbon stocks aboveground, whereas no effect of species mixture was detected belowground. The strongest environmental predictor was annual precipitation, displaying a negative linear relationship with carbon stock. Soil pH (0-5 cm) had a convex relationship to carbon in living biomass, with an optimum around pH = 5.5.
TABLE 3
| Aboveground | Belowground | Organic layer | Mineral topsoil | Total | |||
| Living | Dead | Living | Dead | ||||
| TSA | / | / | / | \ | ∩ | − | / |
| Stand age | ∩ | − | − | − | − | − | ∩ |
| Share beech (Vol.) * | / | \ | − | − | \ * | − | / |
| Plot slope | − | − | / | − | − | − | − |
| Precipitation | \ | ∪ | \ | − | − | − | − |
| Temperature | − | − | − | / | − | \ | − |
| pH | ∩ | − | − | − | \ | / | / |
| uFC | − | NA | − | NA | NA | NA | − |
| Cwb | NA | − | NA | − | NA | NA | NA |
A separate GAM model was built for each carbon compartment and total carbon stock (Supplementary materials 2–9).
The indicated trends per predictor variable are simplified main trends. For the exact fitted spline consult the respective GAM panels (Supplementary materials 2–9). Clear evidence for a relationship is highlighted in dark-gray, weaker evidence in light-gray. Altough the variables may have contributed to the respective GAM, the evidence of their relationship with the carbon compartment is weak. uFC (usable field capacity) was used in models for living biomass, cwb (climatic water balance for dry years 2018–2020) was used in models for dead biomass. *We used the share of non-beech and non-oak tree species in the GAM for the organic layer, to better reflect the higher turnover rate of admixed deciduous species (see discussion in “4.3. Soil.”). (no evidence: −; positive relationship: /; negative relationship: \; convex relationship: ∩; concave relationship: ∪; predictor not used in models of these carbon compartments: NA).
FIGURE 3
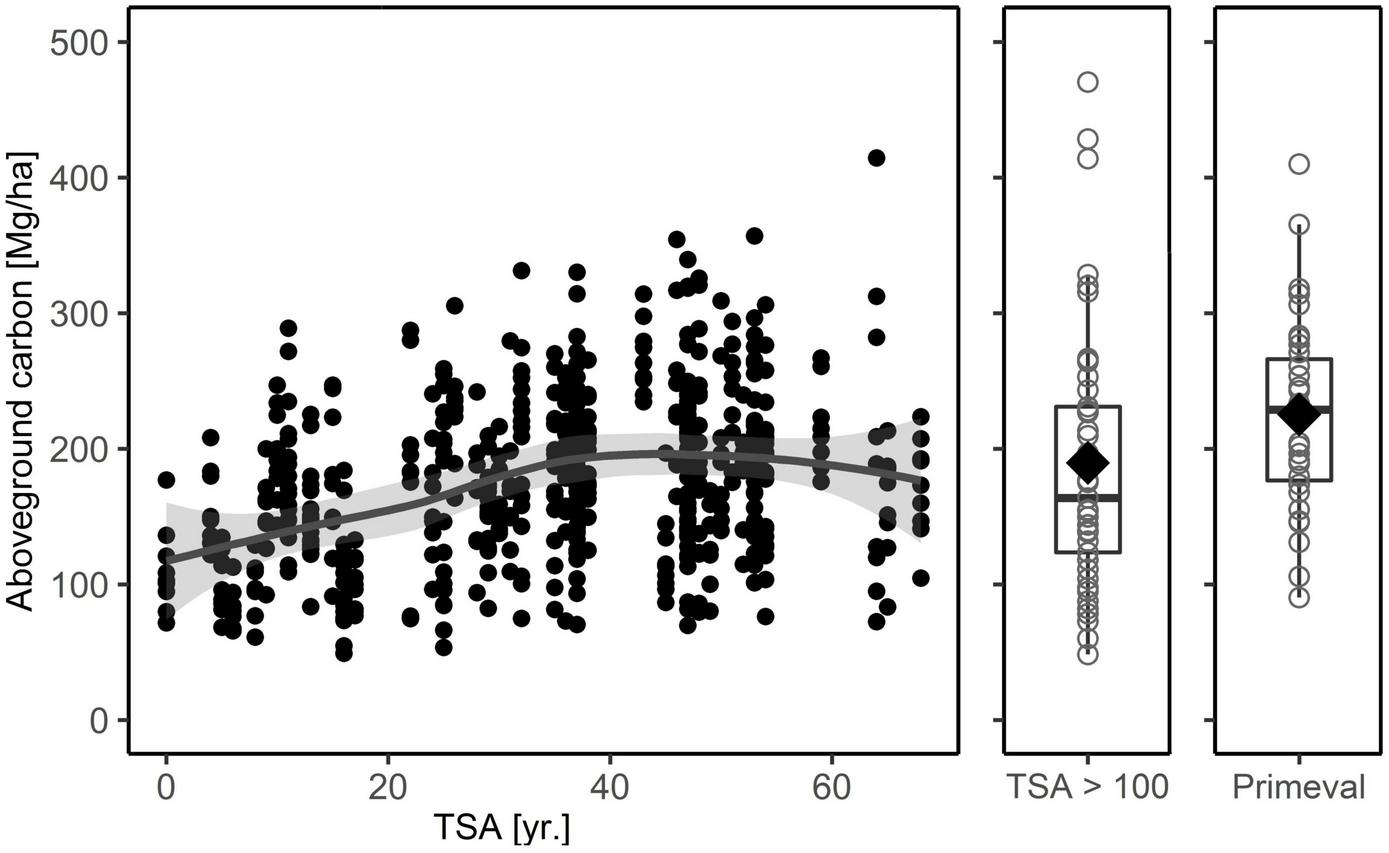
Total carbon in aboveground biomass (living + dead) for the age-class beech forest plots used in the main analysis, the five study sites in forests with TSA > 100 years and the primeval beech forest reference. The latter are plot values from three Slovakian primeval forests (Glatthorn et al., 2018). The solid line depicts a loess smoothing function (aboveground total carbon ∼ TSA + stand age), the gray shaded area is the 95% confidence interval. For forests with TSA > 100 years and the primeval forest we used boxplots, with median (thick black line), 25-and 75-percentiles and the whiskers not exceeding the 1.5-fold of the interquartile range. The mean value is indicated by a diamond.
3.3. Carbon in dead biomass
The 64 age-class beech forest sites stored 1.3 – 46.3 ( = 11.7) Mg C ha–1 in aboveground dead biomass. Model fits were weaker for carbon in dead biomass, compared to living biomass (Table 3). Increasing TSA had a positive effect on carbon in the aboveground deadwood compartment, leveling out around TSA = 50 yr. (Figure 4C; Supplementary material 4). Belowground, TSA correlated negatively with the carbon stock in dead biomass (Supplementary material 5). It was further indicated that higher amounts of precipitation correlated positive with higher amounts of deadwood. Increasing average annual temperature showed a weak positive influence on carbon stock.
FIGURE 4
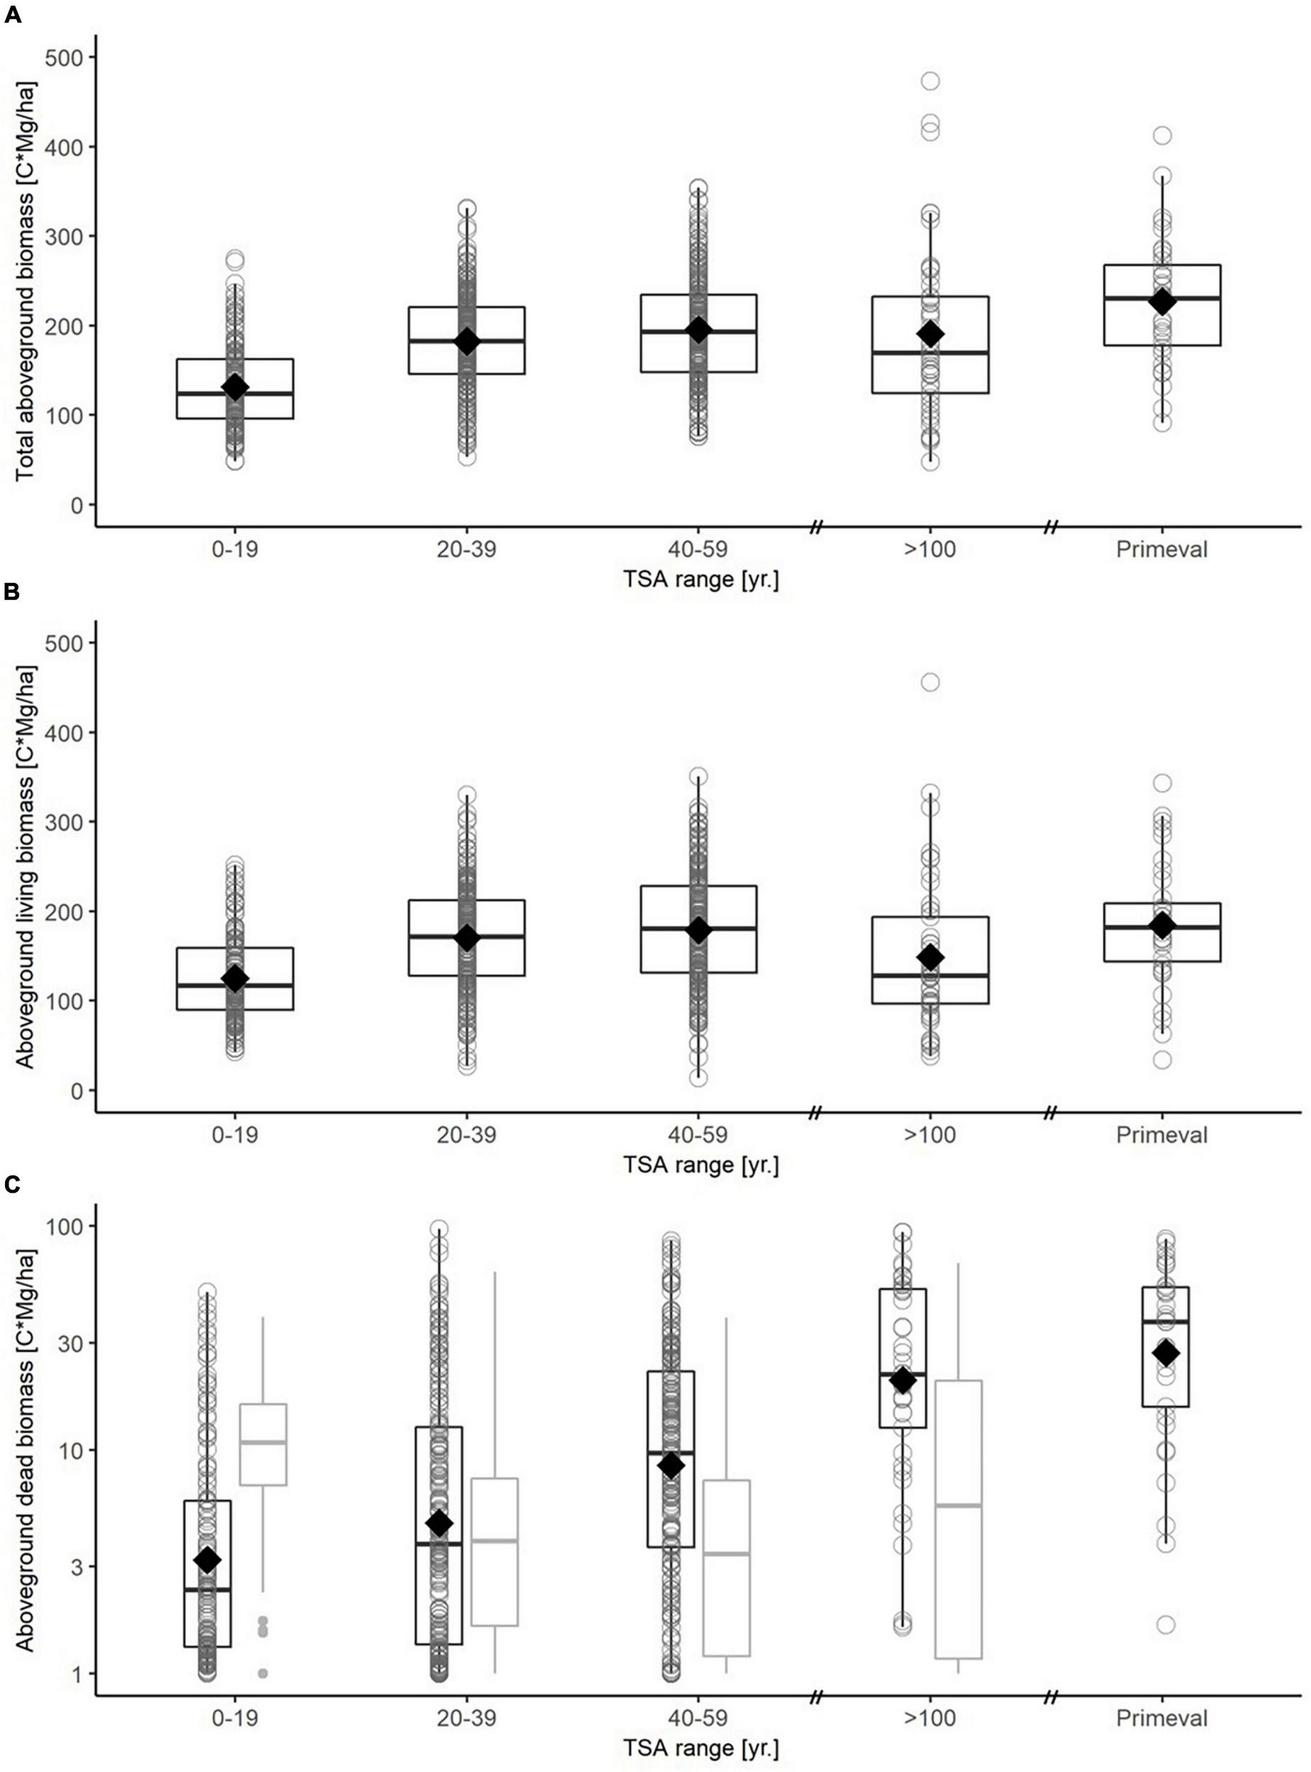
Boxplots for carbon in total aboveground biomass (A), aboveground living biomass (B) and dead biomass (C) for different TSA classes (0-19 yr., 20-39 yr., 40-59 yr., > 100 yr., primeval forest). A boxplot is drawn for each TSA class based on plot-level data, with median (thick black line), 25-and 75-percentiles (box) and whiskers not exceeding the 1.5-fold of the interquartile range. The mean value is indicated with a diamond. Note that carbon in dead biomass is shown on a logarithmic scale. Dead biomass (C) is differentiated between aboveground (black boxplots) and belowground (gray boxplots) carbon stock. The virgin forest reference is based on plot level data from three Slovakian virgin forests (Glatthorn et al., 2018), here data on belowground dead biomass was not available.
3.4. Carbon in the soil
The 64 age-class beech forest sites stored 1.2–65.3 ( = 14.1) Mg C ha–1 in the organic layer and 40.9–266.2 ( = 92.1) Mg C ha–1 in the mineral soil. Carbon in the organic top layer and the mineral soil were most notably dependent on soil pH (Table 3; see also Supplementary material 6, 7). While pH > 5 did not influence the amount of carbon stored in the organic layer, pH values below pH = 5 correlated strongly to increasing amounts of stored carbon. Conversely, the mineral topsoil showed increasing carbon stocks with pH values rising above pH = 5. Carbon storage in the mineral topsoil was additionally affected by a negative linear correlation with average annual temperature. An increasing share of admixed tree species (i.e., broadleaved tree species others than beech and oak) correlated to decreasing amounts of carbon stored in the organic layer. TSA did not affect carbon stock in the mineral topsoil, while a weak convex relationship was found for carbon stock in the organic top layer. However, when only accounting for carbon stock in the topmost layer of the mineral soil (0-5 cm) there was a concave relationship with increasing TSA (Supplementary material 8).
3.5. Beech stands with TSA > 100 yr.
The five beech forest sites with TSA > 100 yr. had a total carbon storage between 266.6–407.2 ( = 327.5) Mg C ha–1. The average total carbon stock was slightly higher in the old beech forest sites than in the age class beech sites (Figures 4, 5). Carbon stored in aboveground deadwood was highest in old beech forest sites 24.6 – 61.0 ( = 39.6) Mg C ha–1.
FIGURE 5
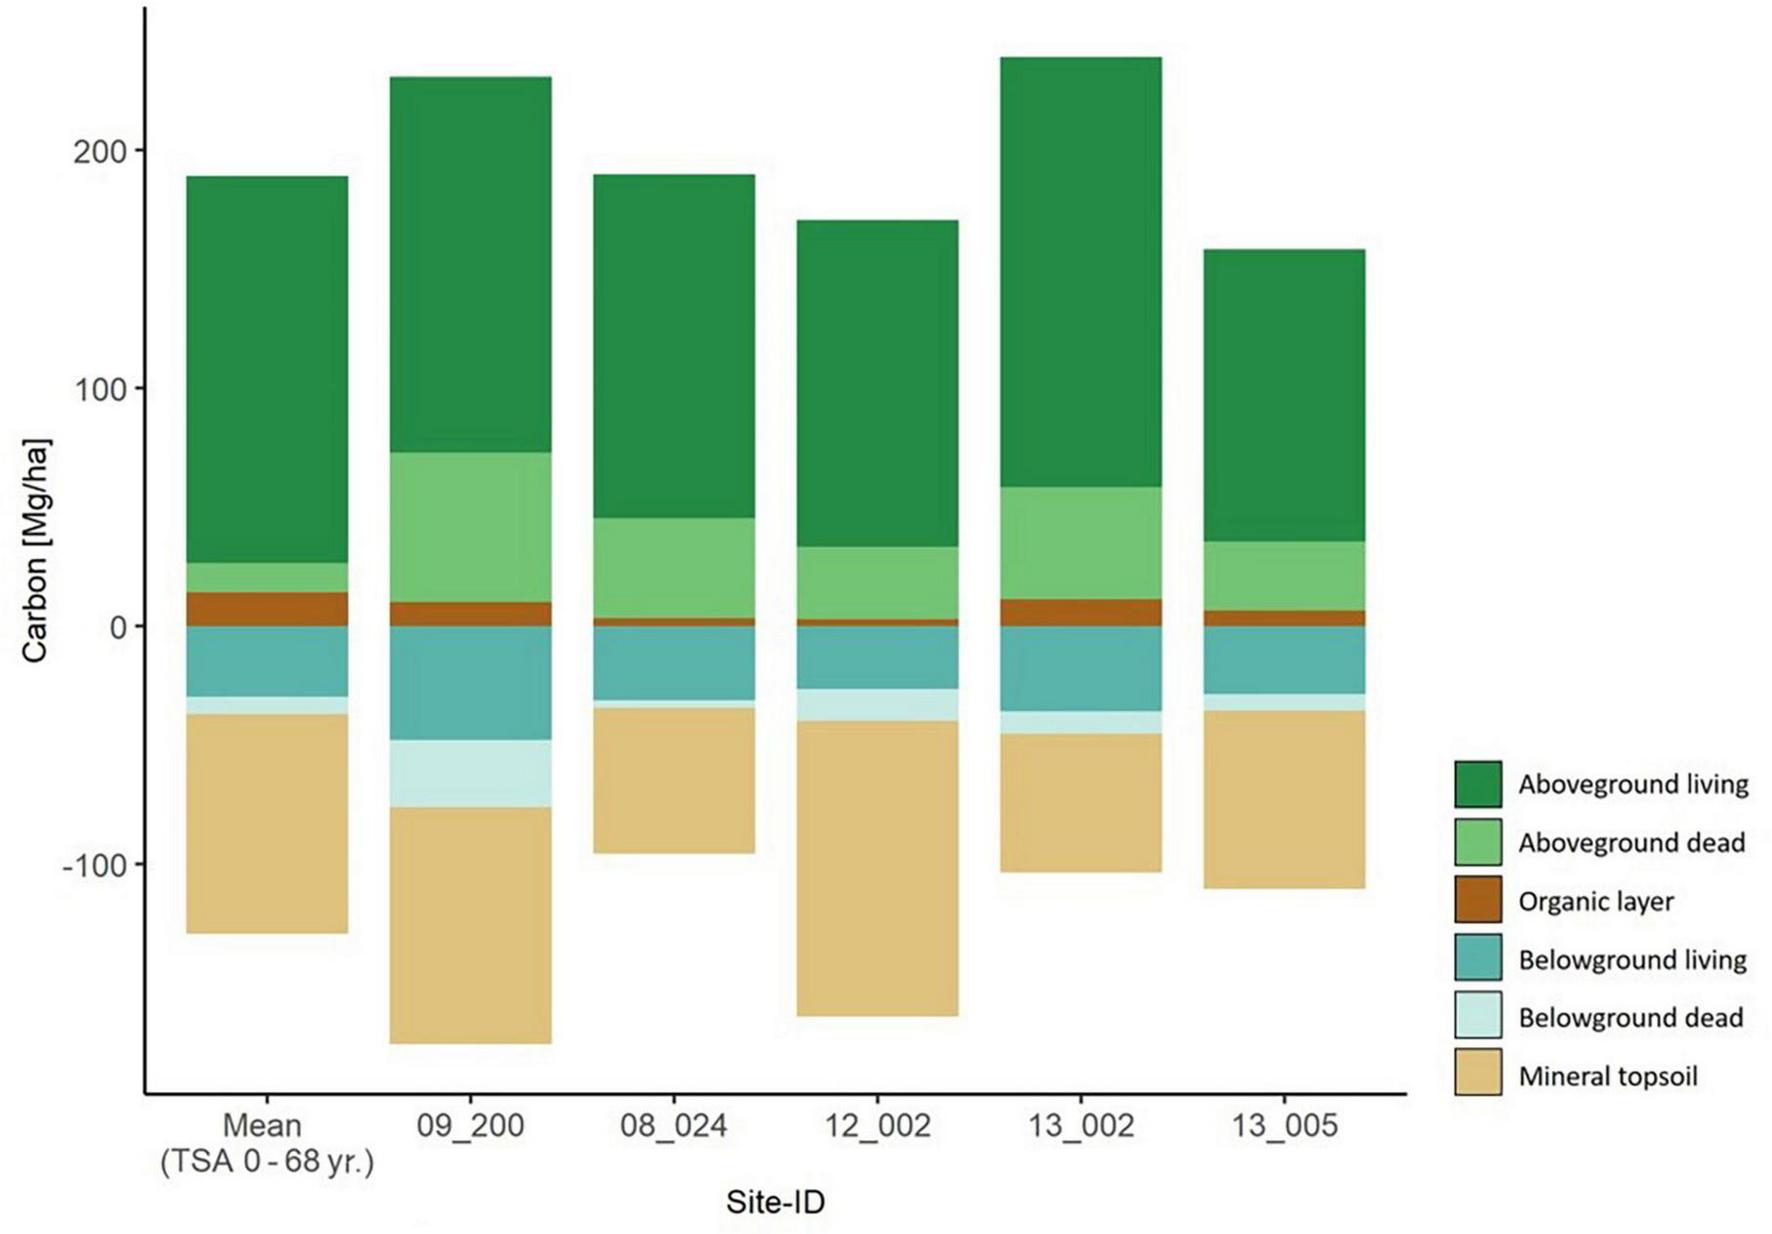
Carbon storage in all six carbon compartments for the five old beech forest sites with TSA > 100 years. They are sorted by ascending TSA from left to right. The mean values per carbon compartment of the main sites (TSA 0 – 68 yr.) are depicted in the left-most column.
3.6. Other forest types
Total carbon stock in multi-aged beech forest ranged between 264.8 and 495.0 ( = 343.0) Mg C ha–1 (Supplementary material 10), the latter value being the highest total carbon stock of all sites. Wet-favorable mixed-oak stands varied between 232 – 326.4 ( = 278.4) Mg C ha–1 of total carbon stock (Supplementary material 11). The additional forest types had a total carbon storage between 210 – 395.8 Mg C ha–1 (Supplementary material 12). Both multi-aged beech stands and wet favorable oak stands did not show an apparent trend in carbon storage with increasing TSA. We presented these sites in S 10-12 and compared their aboveground carbon storage levels with values obtained from our age-class beech forest prediction model.
3.7. Total carbon & carbon prediction model
The 64 age-class beech forest sites stored 208.1 – 444.5 ( = 319.1) Mg C ha–1 in total. The majority of the total carbon pool was made up of the living biomass stock and the carbon stored in the mineral soil (Figures 5, 6). Increasing TSA was a positive driver of the total carbon stock for 50 years, with a decreasing effect at high values of TSA (+ 50 yr.) (Supplementary material 9). Additionally, increasing pH in the mineral soil showed a positive relationship with total carbon stock.
FIGURE 6
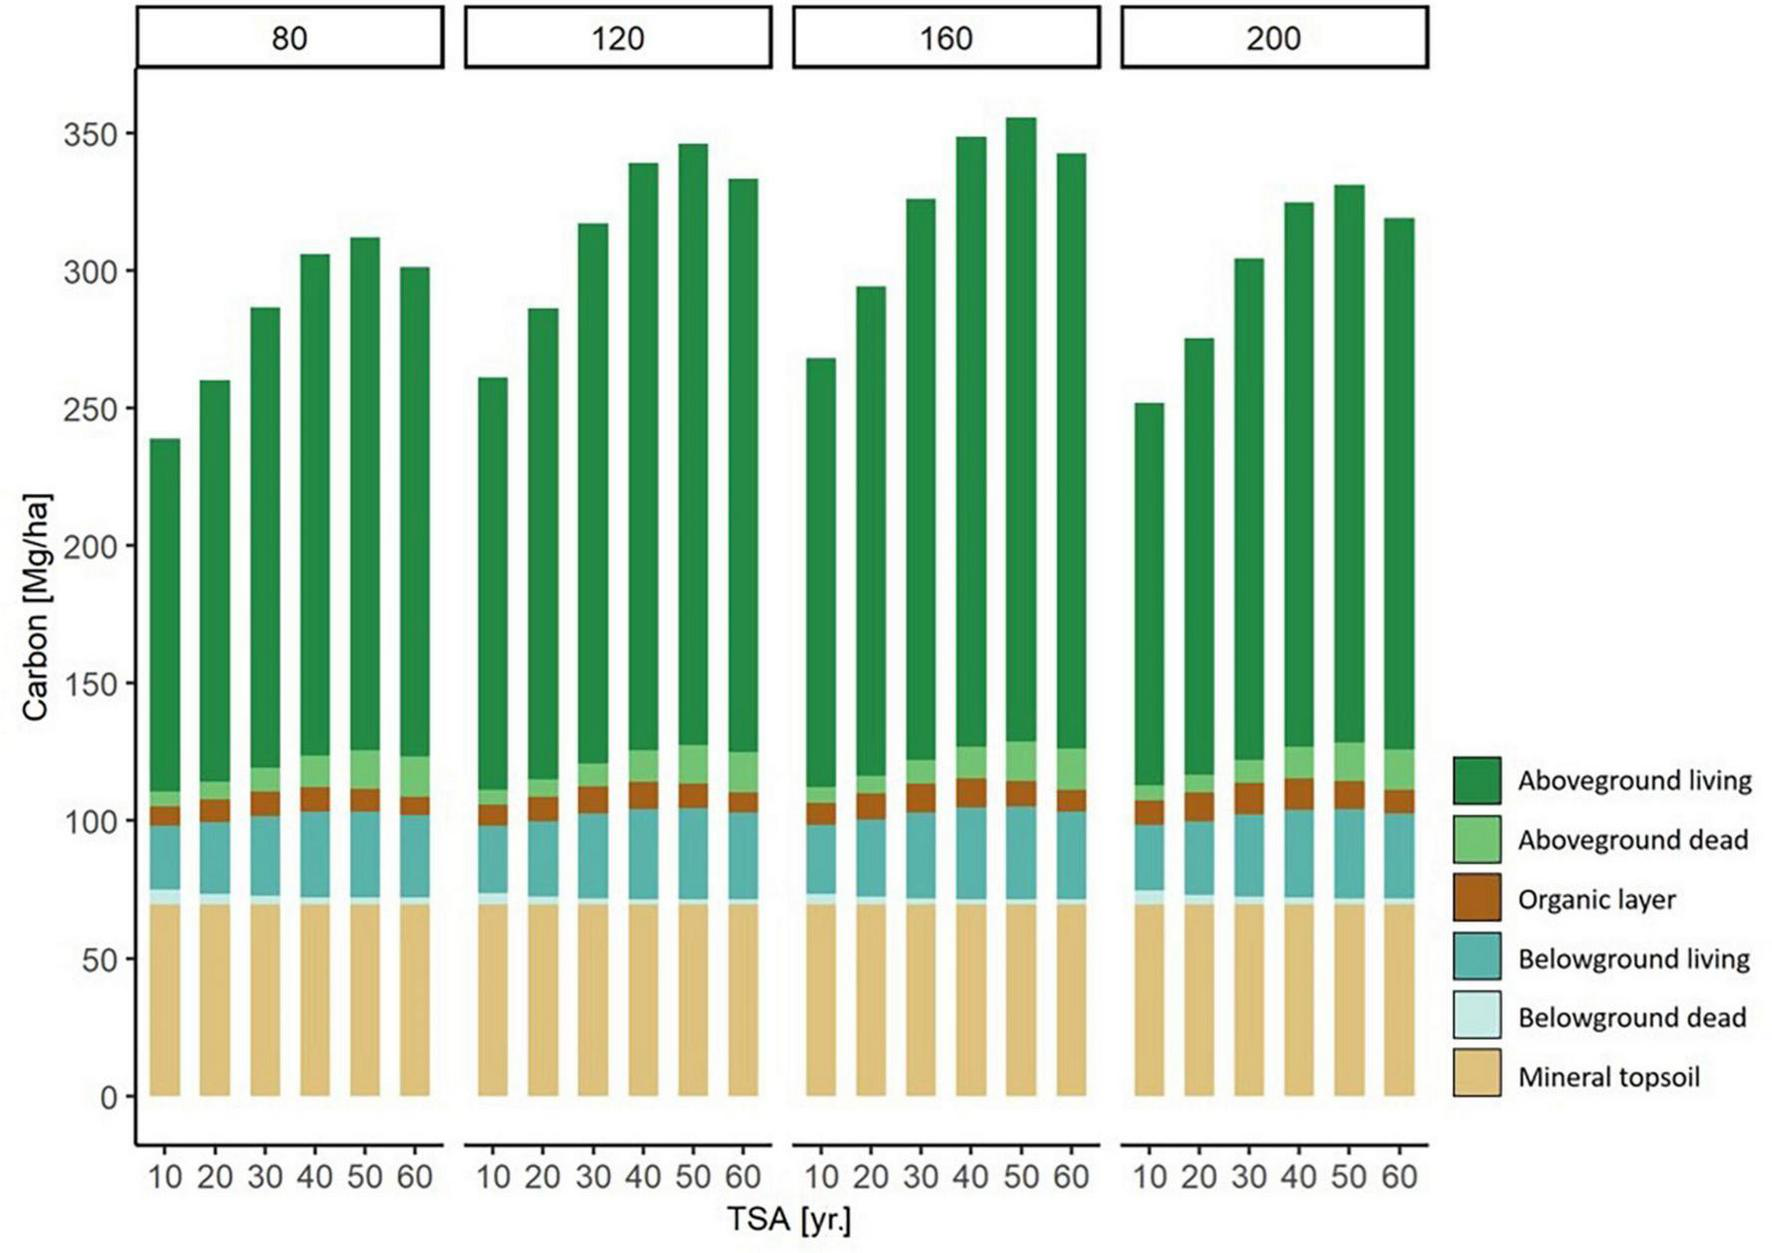
Modeled carbon storage in each carbon compartment for forest stands of different stand age (80, 120, 160, and 200 yr.) along a TSA gradient (10 - 60 yr.). For example, on the left there are six 80 year old beech stands, with a TSA of 10, 20, 30, 40, 50, and 60 years, respectively. The values are modeled based on a fictional stand, under average environmental conditions. Through the separation of stand age and TSA, the effects of the two variables can are expressed simultaneously.
We illustrated the modeled changes of total carbon stock per carbon compartment across TSA and with varying stand age (Figure 6). The highest level of carbon storage was found at a stand age of 160 yr. and TSA = 50 yr. Generally, a stand age of 160 yr. held the highest levels of carbon storage compared to other stand ages at all respective levels of TSA. The major contribution to increasing carbon stocks were the above- and belowground living biomass compartments, followed by aboveground dead biomass.
4. Discussion
4.1. Living biomass
We found independent effects for both TSA and stand age on carbon storage in even-aged, beech dominated stands. The positive linear relationship of TSA on carbon storage for the first 50 years after the end of forest management is consistent with results based on real time series (Meyer et al., 2021). Beside the effects of site conditions and other abiotic factors, reflecting the physiological requirements and constraints of beech (Leuschner and Ellenberg, 2017), stand growth is determined by stand age (Pretzsch, 2010). We observed a peak of living biomass around a stand age of 150 years. Klein et al. (2013) found a maximum for living biomass in unmanaged beech sites at the age of 160 years. On the basis of inventory data from Spain, a maximum carbon stock was found in undisturbed mature stands but not in older stands (Molina-Valero et al., 2021).
The negative influence of young stand age on aboveground living biomass can be explained by the still maturing stand, that is not yet filling its potential growing space. The observed negative effect of high stand age is more complicated to interpret. The textbook opinion is that volume increment in beech stands levels out gradually with stand age (> 150 yr.; Pretzsch, 2010), but this does not explain decreasing stocks of living biomass that we found for TSA > 50 yr. An increase of age-related mortality was not observed, as there was no effect of stand age on the aboveground dead biomass carbon stock. A possible explanation could be found in the management history of the stands. According to our observations in the field, most of the old stands were at least partly harvested before abandonment, resulting in a reduced level of biomass. Brown et al. (1997) showed that forest stands that were harvested in the past had a significant potential to increase aboveground biomass, compared to old-growth forest biomass levels, because they lack large diameter trees (diameter > 70 cm).
However, we want to stress that the observed decrease of carbon stock in living biomass for TSA > 50 yr. and the negative effect of high stand age could be an artefact caused by the space-for-time substitution, lower number of sites with TSA > 50 yr., lack of information on management legacy or inaccuracy of the reported stand age. Correspondingly, time series data from German SFR do not show a negative effect of stand age on biomass stock or increment in unmanaged beech and oak forests (Meyer et al., 2021).
The positive effect of an increasing share of beech on carbon storage in living biomass is in line with findings by Meyer et al. (2021), where pure beech stands reached higher levels of biomass as well as higher net increment in biomass than mixed forest types. This contradicts the consistent reports of a positive biodiversity-productivity relationship in forests (Liang et al., 2016). However, the seemingly emerging trend of higher productivity in pure beech stands would have to be studied in more detail to draw deeper conclusions. It must be stressed that the negative diversity-productivity relationship we found refers solely to the influence of tree species diversity on biomass production in beech forests and does not apply to other important metrics, such as biodiversity or ecosystem resilience.
4.2. Dead biomass
Regarding the opposing effects of TSA on above- and belowground dead biomass, we found that the negative relationship of belowground deadwood with TSA was largely driven by tree stumps. Management induces high frequencies of stumps that, with increasing TSA, successively decrease in frequency and biomass due to decomposition (Figure 4C). For better comparison with the existing literature, we use aboveground deadwood volumes in the following list of values. Across all of our 100 sites inventoried, we found average aboveground deadwood volumes of 4 – 450 ( = 63 m3 ha–1). The 64 age-class beech stands with TSA ≤ 68 yr. had 4 – 180 ( = 51) m3 ha–1 of aboveground deadwood. The five old beech sites (TSA > 100 yr.) had distinctly higher amounts of aboveground deadwood volume with 128 – 450 ( = 206) m3 ha–1. The latter was mostly driven by one particular site, that had an average of 450 m3 ha–1 due to high deadwood input from large silver fir (Abies alba). Excluding this outlier, the remaining four sites had 128 – 161 ( = 145) m3 ha–1 of aboveground deadwood. Siemonsmeier et al. (2020) measured an average of 121 m3 ha–1 in eight German strict forests reserves based on seven sites with TSA = 40 yr. and one site with TSA = 29 yr. For comparison, managed forests in Germany hold an average of 21 m3 ha–1 of deadwood (Schmitz, 2014)1. The primeval beech forest remnants in the Carpathians hold average deadwood volumes of 111 – 177 m3 ha–1 (Commarmot et al., 2005; Feldmann et al., 2018; Stillhard et al., 2022).
An increase in deadwood volumes after cessation of management is a common trend in SFR (Christensen et al., 2005; Vandekerkhove et al., 2009; Meyer and Schmidt, 2011). Deadwood stocks accumulate over time, as the decay of beech deadwood can take up to 50 years (Přívétivý et al., 2016). Based on our data, an exponential increase of aboveground dead biomass can be expected for the first fifty years after abandonment. Later on, the rate of increment likely slows, so that altogether the increase of deadwood follows a logistic course, eventually approaching values similar to primeval beech forests. Meyer and Schmidt (2011) found a mean net increase of 1 m3 ha–1 year–1 in northwestern German SFR with up to 28 years of TSA. However, deadwood formation is largely subject to stochastic events (i.e., natural disturbances) and therefore difficult to predict, especially on the small spatial scale of typical German SFR.
4.3. Soil
The range and distribution of carbon stocks in the organic layer and the mineral top soil we found correspond well to the range reported in the German forest soil inventory (Grüneberg et al., 2019). The carbon stock in the organic layer showed a convex relationship with TSA (Supplementary material 6) and our initial hypothesis had to be rejected (but see below). This pattern might be explained by an inverse relationship of canopy openness (i.e., a driver for mineralization) and TSA, indicated by the rapid decrease in belowground dead tree carbon (i.e., decaying stumps, see section “4.2. Dead biomass”) and the exponential increase in aboveground dead tree carbon (Figure 4C). The share of admixed tree species also had an effect on carbon in the organic layer. An increasing share of other broadleaved tree species caused a decrease in organic layer carbon stocks, which can be explained by a higher turnover rates for most broadleaved species litter compared to beech litter (Vesterdal et al., 2008). However, the strongest predictor for organic layer carbon stock was soil pH, with higher stocks under more acidic conditions. A dominant opposing trend regarding soil pH (i.e., smaller stocks under more acidic conditions) was found for carbon stocks in the mineral topsoil (0–30 cm). This is similar to findings by Grüneberg et al. (2019) and can partly be explained by the positive effect of increasing soil pH on the soil biological activity and bioturbation (i.e., relocation of organic carbon from the organic layer to the mineral topsoil). However, regarding the carbon stock potential in the mineral soil, a characterization based solely on pH seems insufficient. The effect of soil texture (i.e., clay content), was found to have a pronounced effect on carbon storage in the mineral soil (Grüneberg et al., 2019), however these criteria were not determined for our samples. A strong influence of soil type on carbon storage was also documented for primeval beech forests (Pichler et al., 2021).
The negative effect of increasing temperature found for carbon stocks in the mineral topsoil could be explained by the general temperature-induced acceleration of biological and chemical processes causing an increase of the mineralization rate.
In line with our hypothesis, TSA and stand age had no visible effect on carbon stocks in the mineral topsoil. However, there was a concave effect of TSA on carbon stock in the topmost layer (0-5 cm; Supplementary material 8). This effect was inverse compared to the convex effect of TSA on carbon stock in the organic layer, indicating a dynamic tradeoff between these compartments. A similar zero-sum situation was described for artificial canopy gaps in acidic beech forests by Bauhus et al. (2004). Our results suggest that the tradeoff exists in both directions and continues over the course of progressing TSA. In other words, the relatively open canopy conditions after harvest promote mineralization in the organic layer and a shift of carbon to the topmost mineral soil layer. After abandonment, the canopy closes and the mineralization rate decreases, due to lower surface temperatures. In turn, the storage in the organic layer increases, but the input to the mineral soil is reduced and its carbon stock decreases, due to continuing mineralization and carbon leaching. After several decades, disturbances cause canopy openings and mineralization of the organic layer increases again, and so does the input to the topmost mineral soil layer. Further, this tradeoff seems to apply for beech forests across different site conditions. In consequence, the mineral topsoil in total might remain largely unaffected by stand age and TSA, as long as canopy disturbance (in the past, present and future) does not exceed a moderate level.
Other reasons why there were no visible effects of TSA on mineral topsoil in total could be that some important factors were missing, or that our sampling depth was not deep enough. Observed temporal changes in topsoil carbon stocks in German forests in general, differing with soil type and region (mean = 0.75 Mg ha–1 year–1, range = −0.71 – 1.35 Mg ha–1 year–1; Grüneberg et al., 2019), further complicate the interpretation of data from space-for-time approaches. As the site conditions are very individual, it would be appropriate to make direct comparisons on the same site (Gleixner et al., 2009) regarding subtle differences in stand age and TSA. However, in paired plot studies (i.e., forest reserve vs. adjacent managed forest) no significant differences regarding carbon storage in the topsoil were found between managed and lately unmanaged (TSA > 40; Mund, 2004; Krueger et al., 2017; Nord-Larsen et al., 2019) or even primeval beech forests (Leuschner et al., 2022). The latter, however, had a higher carbon storage in the upper subsoil (30-60 cm), confirming that in the neighboring managed stands clear cuts in the past (80-100 years ago) had long-term effects on the carbon stock in the upper subsoil. According to Gleixner et al. (2009), broadleaved forests tend to store a higher fraction of carbon in deeper layers. Nevertheless, this is only an indication toward negative effects from forest management, but not for a persistant carbon sink in the soil of unmanaged forests. According to Wirth et al. (2009), the dynamics of the soil carbon pool are still unclear, as there are no chronosequential studies on deep soil horizons and approaches are blind to the continuous export of dissolved organic carbon.
4.4. Other forest types
Due to the low number of oak and multi-aged beech forest sites it was not possible to conduct a robust statistical exploration of the data. Therefore, the set of sites for our main analysis had to be restricted to age-class beech stands. Furthermore, an unclear management history of the multi-aged beech stands compromised their classification as multi-aged. In fact, some of these sites were formerly managed as even-aged stands but information on stand age was lost or no longer applicable. Initially, the single sites of additional forest types were selected within similar ranges of TSA and stand age to be comparable among themselves. Unfortunately, over the course of our study, several corrections had to be made to the basic attributes and a comparison within a singular range of TSA was not possible.
While the modeled values for age-class beech followed the modeled course with increasing values of TSA, multi-aged beech and wet-favorable oak sites did not appear to display a pattern along the gradient of TSA (Supplementary material 10, 11). Modeled values corresponded well with the values measured in other forest types (Supplementary material 12) that were dominated by broadleaved species. Site typical conifer stands reach lower levels compared to modeled beech stands.
4.5. Carbon storage over time
We found that aboveground carbon storage increased significantly over time for approximately 50 years. This matches the expectations from our hypothesis and the findings of other studies (Halpin and Lorimer, 2016; Meyer et al., 2021). Compared to the values reported for German managed forests (Table 2), SFR had a stronger increment with stand age, while managed forests had stable aboveground volumes for stand ages > 100 (Schmitz, 2014; See text footnote 1), SFR peaked at younger stand ages and maintained high volume levels with further increasing stand age.
Through the combined effect of TSA and stand age, carbon stocks of medium aged stands profited most from abandonment, which is reflected in our prediction model. To test this, we ran a GAM, replacing current stand age with “age at abandonment” (AAA). This model also showed a convex relation between stand age and carbon stored in living biomass, with a peak of AAA at a stand age of 120 years. We interpret this finding as the combination of high annual volume increment and already high levels of biomass stock of medium aged stands, because the main harvest had not been initiated at the time of abandonment. This suggests, that the observed effect of stand age could indeed be an effect of management (see also 4.1). Nevertheless, the age-independent, positive effect of TSA on aboveground living biomass suggests that all stands profit from the cessation of management, independent of stand age.
Halpin and Lorimer (2016) found that aboveground living biomass in unmanaged forests declined when stands transitioned from even-aged to multi-aged structures. The descending aboveground carbon storage with high stand age (Table 2; age class 201 – 240 yr.) and the high standard deviation in old stands (stand age + 240 yr.) may indicate the onset of the terminal phase and overmaturing trees, with the associated structural changes. Our models also show a negative effect of high stand age and decreasing levels of living biomass for TSA > 50 yr. However, DBH-density distributions on our sites suggest that the transition to multi-aged, “old-growth” structures is not very advanced yet. Given the findings of Halpin and Lorimer (2016), it is conceivable that living biomass levels will decrease with further increasing TSA, as our models predict.
A moderate decrease of aboveground living carbon stock (about -15%) is also indicated by the mean value in the five beech forest sites that were unmanaged for > 100 years. In total, the accumulating aboveground deadwood compensated the lower carbon stock in living biomass to an extent (Figure 4). The mean value of carbon in aboveground living biomass on these five sites was similar to the stocks reported for an old forest reserve in Denmark (Nord-Larsen et al., 2019) and top values documented for the Hainich National Park in Germany (Mund, 2004). Past management of these sites may still affect carbon storage and stand structure to the present day. For example, management legacies are still present in the form of old wood pasture oaks, or the underrepresentation of distinct tree cohorts (i.e., dbh 40-70 cm), likely due to unfavorable conditions for regeneration under an even-aged managed stand in the past.
SFR at the peak around 50 years of TSA had similar carbon stocks in living biomass as primeval beech forests in Slovakia (Glatthorn et al., 2018; Figure 4B). This suggests that, in the long run, carbon stocks in living biomass may rise again when tree demography has progressed towards old-growth structures. Considering that the aboveground deadwood carbon stock in primeval forests is even larger than that in our long unmanaged stands (Figure 4), the total aboveground carbon stocks might well exceed those of SFR with TSA around 50 years by then. We want to remark that stock and deadwood volumes in the three Slovakian primeval forests (Figures 3, 4; see also Feldmann et al., 2018) are not exceptionally high but average, compared to other primeval beech forests in this region (Korpel’, 1995; Kucbel et al., 2012; Petritan et al., 2012; Stillhard et al., 2022). Overall, when comparing carbon storage levels of our sites, including the old beech sites, to data from primeval forests it seems reasonable to assume that, after fast initial growth, the carbon stock stabilizes already at early stages of natural forest development (Molina-Valero et al., 2021), at a level relatively close to the site-specific carbon carrying capacity (Gupta and Rao, 1994; Keith et al., 2009).
4.6. Total carbon storage
Our finding that the total carbon stock was mostly driven by TSA and soil pH (Supplementary material 9) highlights that the total carbon pool of a forest stand is dominated by living biomass, and the carbon stock in the mineral soil. Accordingly, the highest total carbon stocks are to be expected on fertile sites with high soil pH and a forest stand that has accumulated biomass for several decades, set aside at a stand age around 120 yr. or younger. It is up to future studies with extended datasets, to further assess the development of the carbon stock in stands with TSA > 50 years.
4.7. Sources of uncertainty
It was noticeable, that our GAMs were not able to predict the extreme levels of carbon storage we measured. This may be due to a lack of information on certain abiotic parameters or management legacies related to productivity and biomass stock in our data. Due to a reduced density of data points, the development of carbon stock beyond 50 years of TSA could not be reliably predicted. SFR with TSA > 50 years are rare and thus, the confidence intervals of our models widen at the high range of TSA. For this reason, we limited our carbon prediction model to 10 – 60 years of TSA (Figure 6) and emphasize the reduced reliability for the highest values of TSA.
As discussed previously, stand age and management legacy were additional sources of uncertainty. Stand age was based solely on silvicultural records, that do not necessarily reflect the true age structure of the stand. For example, two stands may have the same age in the records, but differ greatly in the field as one was harvested intensively before being set aside while the second stand experienced low levels of management intervention.
It is apparent that space-for-time substitution is inferior to time-series data. Better data on management history and stand structure are required to obtain more reliable estimates of carbon stock dynamics and the effects of TSA and stand age.
5. Conclusion
After abandonment, forests increase their carbon stock to notably higher values compared to still managed stands. The central compartment of that increase is the living biomass. Several studies have found that the carbon stock in unmanaged forest can increase over long periods of time (Carey et al., 2001; Knohl et al., 2003; Luyssaert et al., 2008; Klein et al., 2013; Herbst et al., 2015; Gustavsson et al., 2017; Pukkala, 2017; Curtis and Gough, 2018). Within the observed gradient of TSA, our study supports these findings. We found a linear increase of the carbon storage over the first 50 years after abandonment. However, our data remain inconclusive on the expected development of the carbon stock past 50 years of TSA.
In the light of the efforts to mitigate climate change and the heated discussion about whether to set aside forest to natural development or not, it is important to consider that how we manage forests is not only relevant to climate change, but also to biodiversity, ecosystem functions and cultural values (Watson et al., 2018). It is important to continue the observation and collection of data in order to better understand naturally developing forests. Our study shows that long-term time-series data are essential to reliably disentangle specific effects, such as the influence of stand age or soil characteristics.
The coming decades are critical for climate change mitigation. According to the current state of knowledge, unmanaged forests can reliably sequester and store carbon from the atmosphere within a limited timeframe and the constraints of their natural carrying capacity (Keith et al., 2009). Our results suggest, that this timeframe is at least 50 years long. Over time, the sink function diminishes and naturally developing forests become a passive, but stable carbon storage (Nord-Larsen et al., 2019; Stillhard et al., 2022). Half a century of predictable carbon uptake may be utilized in climate-smart forest management planning. This timeframe is well within the range of climate goals formulated by the IPCC (2021). We feel that in some cases the term “Climate-Smart Forestry” is being constrained within the context of bioenergy production and product substitution. However, it is a concept aiming to integrate and optimize multiple forest functions (Nabuurs et al., 2018). We encourage that the potential of naturally developing forests to sequester and store carbon, as well as for biodiversity and other ecosystem functions should be addressed in devising Climate-Smart Forestry (Nabuurs et al., 2018; Bowditch et al., 2020; Verkerk et al., 2020).
Statements
Data availability statement
The dataset used in this study, R-code to reproduce our analysis and metadata are archived in a Figshare data repository (https://doi.org/10.6084/m9.figshare.21967052). Tables with attributes on the object-, plot- and site-level are included.
Author contributions
RN, PM, and EF contributed to the conception and design of the study. RN organized the database, performed the statistical analysis, and drafted the manuscript. EF wrote sections of the manuscript, revised, contributed references, and provided supervision. MB and PM acquired funding, revised the manuscript, and contributed references. All authors contributed to manuscript revision, read, and approved the submitted version.
Funding
The research project “natWald100 – Subsection 1” was funded by the German Federal Ministry of Food and Agriculture through “Fachagentur Nachwachsende Rohstoffe” (FNR) and “Waldklimafonds” (Grant Number: 2218WK31A4).
Acknowledgments
The authors thank Holger Sennhenn-Reulen for significant input to the statistical analysis.
Conflict of interest
The authors declare that the research was conducted in the absence of any commercial or financial relationships that could be construed as a potential conflict of interest.
Publisher’s note
All claims expressed in this article are solely those of the authors and do not necessarily represent those of their affiliated organizations, or those of the publisher, the editors and the reviewers. Any product that may be evaluated in this article, or claim that may be made by its manufacturer, is not guaranteed or endorsed by the publisher.
Supplementary material
The Supplementary Material for this article can be found online at: https://www.frontiersin.org/articles/10.3389/ffgc.2023.1099558/full#supplementary-material
Footnotes
References
1
AmerayA.BergeronY.ValeriaO.Montoro GironaM.CavardX. (2021). Forest carbon management: a review of silvicultural practices and management strategies across boreal, temperate and tropical forests.Curr. Forestry Rep.7245–266. 10.1007/s40725-021-00151-w
2
AnnighöferP.AmezteguiA.AmmerC.BalandierP.BartschN.BolteA.et al (2016). Species-specific and generic biomass equations for seedlings and saplings of European tree species.Eur. J. For. Res.135313–329. 10.1007/s10342-016-0937-z
3
BauhusJ.VorT.BartschN.CowlingA. (2004). The effects of gaps and liming on forest floor decomposition and soil C and N dynamics in a Fagus sylvatica forest.Can. J. For. Res.34509–518. 10.1139/x03-218
4
BellassenV.LuyssaertS. (2014). Managing forests in uncertain times.Nature506153–155. 10.1038/506153a
5
BMU (2007). Bundesministerium für Umwelt, Naturschutz und Reaktorsicherheit (Editor) ed. Nationale Strategie zur Biologischen Vielfalt. 3.Paderborn: Bundesministerium für Umwelt, Naturschutz und Reaktorsicherheit.
6
BormannF. H.LikensG. E. (1994). Pattern and Process in a Forested Ecosystem.Berlin: Springer Verlag.
7
BowditchE.SantopuoliG.BinderF.del RíoM.La PortaN.KluvankovaT.et al (2020). What is Climate-Smart Forestry? a definition from a multinational collaborative process focused on mountain regions of Europe.Ecosyst. Serv.43:101113. 10.1016/j.ecoser.2020.101113
8
BrangP.HeiriC.BugmannH. (eds) (2011). Waldreservate: 50 Jahre Natürliche Waldentwicklung in der Schweiz. 1. Auflage.Bern: Haupt Verlag.
9
BrownS.SchroederP.BirdseyR. (1997). Aboveground biomass distribution of US eastern hardwood forests and the use of large trees as an indicator of forest development.For. Ecol. Manag.9637–47. 10.1016/S0378-1127(97)00044-3
10
BuchwaldE. (2005). A Hierarchical Terminology for More or Less Natural Forests in Relation to Sustainable Management and Biodiversity Conservation.Rome: Third Expert Meeting on Harmonizing Forest-related Definitions.
11
CareyE. V.SalaA.KeaneR.CallawayR. M. (2001). Are old forests underestimated as global carbon sinks?Glob. Change Biol.7339–344. 10.1046/j.1365-2486.2001.00418.x
12
ChristensenM.HahnK.MountfordE. P.OdorP.StandovárT.RozenbergarD.et al (2005). Dead wood in European beech (Fagus sylvatica) forest reserves.For. Ecol. Manag.210267–282. 10.1016/j.foreco.2005.02.032
13
CiaisP.SchelhaasM. J.ZaehleS.PiaoS. L.CescattiA.LiskiJ.et al (2008). Carbon accumulation in European forests.Nat. Geosci.1425–429. 10.1038/ngeo233
14
CommarmotB.BachofenH.BundziakY.BürgiA.RampB.ShparykY.et al (2005). Structures of virgin and managed beech forests in Uholka (Ukraine) and Sihlwald (Switzerland): a comparative study.For. Snow Landsc. Res.7945–56.
15
CurtisP. S.GoughC. M. (2018). Forest aging, disturbance and the carbon cycle.New Phytol.2191188–1193. 10.1111/nph.15227
16
DrößlerL.HauckM.KucbelS.PichlerV.LeuschnerC. (2018). Canopy gap dynamics and tree understory release in a virgin beech forest. slovakian carpathians.For. Ecol. Manag.4138–46. 10.1016/j.foreco.2018.02.022
17
EfraimidisP.SpirakisP. (2016). “Weighted random sampling,” in Encyclopedia of Algorithms, ed.KaoM.-Y. (New York, NY: Springer), 2365–2367. 10.1007/978-1-4939-2864-4_478
18
European Commission (2020). Communication from the Commission to the European Parliament, the Council, the European Economic and Social Committee and the Committee of the Regions. EU Biodiversity Strategy for 2030. Bringing Nature back into Our Lives.Belgium: EU.
19
FaheyT. J.WoodburyP. B.BattlesJ. J.GoodaleC. L.HamburgS. P.OllingerS. V.et al (2010). Forest carbon storage: ecology, management, and policy.Front. Ecol. Environ.8245–252. 10.1890/080169
20
FeldmannE.GlatthornJ.HauckM.LeuschnerC. (2018). A novel empirical approach for determining the extension of forest development stages in temperate old-growth forests. Eur. J. For. Res.137321–335. 10.1007/s10342-018-1105-4
21
ForresterD. I.TachauerI. H. H.AnnighoeferP.BarbeitoI.PretzschH.Ruiz-PeinadoR.et al (2017). Generalized biomass and leaf area allometric equations for European tree species incorporating stand structure, tree age and climate.For. Ecol. Manag.396160–175. 10.1016/j.foreco.2017.04.011
22
FranklinJ. F.SpiesT. A.Van PeltR.CareyA. B.ThornburghD. A.BergD. R.et al (2002). Disturbances and structural development of natural forest ecosystems with slivicultural implications, using douglas-fir forests as an example.For. Ecol. Manag.155399–423. 10.1016/S0378-1127(01)00575-8
23
GlatthornJ.FeldmannE.PichlerV.HauckM.LeuschnerC. (2018). Biomass stock and productivity of primeval and production beech forests: greater canopy structural diversity promotes productivity.Ecosystems21704–722. 10.1007/s10021-017-0179-z
24
GleixnerG.TefsC.JordanA.HammerM.WirthC.NueskeA.et al (2009). “Soil carbon accumulation in old-growth forests,” in Old-Growth Forests: Function, Fate and Value Ecological Studies, edsWirthC.GleixnerG.HeimannM. (Berlin: Springer), 231–266. 10.1007/978-3-540-92706-8_11
25
GrünebergE.SchöningI.RiekW.ZicheD.EversJ. (2019). “Carbon stocks and carbon stock changes in German forest soils,” in Status and Dynamics of Forests in Germany, edsWellbrockN.BolteA. (Cham: Springer). 10.1007/978-3-030-15734-0_6
26
GuptaR. K.RaoD. L. N. (1994). Potential of wastelands for sequestering carbon by reforestation.Curr. Sci.66378–380.
27
GustavssonL.HausS.LundbladM.LundströmA.OrtizC. A.SathreR.et al (2017). Climate change effects of forestry and substitution of carbon-intensive materials and fossil fuels.Renew. Sustain. Energy Rev.67612–624. 10.1016/j.rser.2016.09.056
28
HalpinC. R.LorimerC. G. (2016). Long-term trends in biomass and tree demography in northern hardwoods: an integrated field and simulation study.Ecology8678–93. 10.1890/15-0392.1
29
HasenauerH. (2011). Überlegungen zur CO2-bilanz von waldökosystenen.Austrian J. For. Sci.12833–52.
30
HeiriC. C. (2009). Stand Dynamics in Swiss Forest Reserves: an Analysis Based on Long-Term Forest Reserve Data and Dynamic Modeling.Doctoral dissertation. Switzerland: ETH Zurich.
31
HerbstM.MundM.TamrakarR.KnohlA. (2015). Differences in carbon uptake and water use between a managed and an unmanaged beech forest in central Germany.For. Ecol. Manag.355101–108. 10.1016/j.foreco.2015.05.034
32
HessenmöllerD.SchulzeE.-D.GroßmannM. (2008). Bestandesentwicklung und kohlenstoffspeicherung des naturwaldes “schönstedter holz” im nationalpark hainich.Allg. Forst Jagdzeitung179209–219.
33
HobiM. L.CommarmotB.BugmannH. (2015). Pattern and process in the largest primeval beech forest of Europe (Ukrainian Carpathians).J. Veg. Sci.26323–336. 10.1111/jvs.12234
34
IPCC (2021). “Summary for policymakers,” in Climate change 2021: the physical science basis. contribution of working group i to the sixth assessment report of the intergovernmental panel on climate change, edsMasson-DelmotteV.ZhaiP.PiraniA.ConnorsS. L.PéanC.BergerS.et al (Cambridge: Cambridge University Press), 3–32. 10.1017/9781009157896.001
35
IrslingerR. (2022). Scientist Letter Regarding the Need for Climate Smart Forest Management. Available online at: https://proholz-bayern.de/uploads/2022/10/Open_Scientist_Letter_climate_smart_forest_management.pdf(accessed January 18, 2022).
36
JanischJ. E.HarmonM. E. (2002). Successional changes in live and dead wood carbon stores: implications for net ecosystem productivity.Tree Physiol.2277–89. 10.1093/treephys/22.2-3.77
37
KasparF.Müller-WestermeierG.PendaE.MächelH.ZimmermannK.Kaiser-WeissA.et al (2013). Monitoring of climate change in Germany – data, products and services of Germany’s National climate data centre.Adv. Sci. Res.1099–106. 10.5194/asr-10-99-2013
38
KeithH.MackeyB. G.LindenmayerD. B. (2009). Re-evaluation of forest biomass carbon stocks and lessons from the world’s most carbon-dense forests.PNAS10611635–11640. 10.1073/pnas.0901970106
39
KleinD.HöllerlS.BlaschkeM.SchulzC. (2013). The contribution of managed and unmanaged forests to climate change mitigation—a model approach at stand level for the main tree species in bavaria.Forests443–69. 10.3390/f4010043
40
KnohlA.KolleO.BuchmannN.SchulzeE.-D. (2003). Large carbon uptake by an unmanaged 250 year old deciduous forest in central Germany.Agric. For. Meteorol.118151–167. 10.1016/S0168-1923(03)00115-1
41
KöhlM.KenterB.HildebrandR.OlschofskyK.KöhlerR.RötzerT.et al (2011). Nutzungsverzicht oder holznutzung? - auswirkungen auf die CO2-Bilanz im langfristigen Vergleich.AFZ-DerWald6625–27.
42
Korpel’Š (1995). Die Urwälder der Westkarpaten.Jena: Gustav Fischer Verlag.
43
KruegerI.SchulzC.BorkenW. (2017). Stocks and dynamics of soil organic carbon and coarse woody debris in three managed and unmanaged temperate forests.Eur. J. For. Res.136123–137. 10.1007/s10342-016-1013-4
44
KucbelS.SanigaM.JaloviarP.VernkuricJ. (2012). Stand structure and temporal variability in old-growth beech-dominated forests of the northwestern Carpathians: a 40-years perspective.For. Ecol. Manag.264125–133. 10.1016/j.foreco.2011.10.011
45
KunZ.DellaSalaD.KeithH.KormosC.MercerB.MoomawW. R.et al (2020). Recognizing the importance of unmanaged forests to mitigate climate change.GCB Bioenergy121034–1035. 10.1111/gcbb.12714
46
LalR. (2005). Forest soils and carbon sequestration.For. Ecol. and Manag.220242–258. 10.1016/j.foreco.2005.08.015
47
LeibundgutH. (1978). Über die dynamik europäischer Urwälder.AFZ-DerWald33688–689.
48
LeuschnerC.EllenbergH. (2017). Ecology of Central European Non-Forest Vegetation: Coastal to Alpine, Natural to Man-Made Habitats.Cham: Springer. 10.1007/978-3-319-43042-3
49
LeuschnerC.FeldmannE.PichlerV.GlatthornJ.HertelD. (2022). Forest management impact on soil organic carbon: a paired-plot study in primeval and managed European beech forests.For. Ecol. Manag.512:120163. 10.1016/j.foreco.2022.120163
50
LiangJ.CrowtherT. W.PicardN.WiserS.ZhouM.AlbertiG.et al (2016). Positive biodiversity-productivity relationship predominant in global forests.Science354:aaf8957. 10.1126/science.aaf8957
51
LikensG. E.(ed.). (1989). Long-term studies in ecology, approaches and alternatives.Berlin: Springer.
52
LuickR.HennenbergK.LeuschnerC.GrossmannM.JedickeE.SchoofN.et al (2021). Primeval, natural and commercial forests in the context of biodiversity and climate protection - part 2.Naturschutz und Landschaftsplanung5422–35. 10.1399/NuL.2022.01.02.e
53
LuyssaertS.SchulzeE.-D.BörnerA.KnohlA.HessenmöllerD.LawB. E.et al (2008). Old-growth forests as global carbon sinks.Nature455213–215. 10.1038/nature07276
54
MackeyB.MoomawW.LindenmayerD.KeithH. (2022). Net carbon accounting and reporting are a barrier to understanding the mitigation value of forest protection in developed countries.Environ. Res. Lett.17:054028. 10.1088/1748-9326/ac661b
55
MayerM.PrescottC. E.AbakerW. E.AugustoL.CécillonL.FerreiraG. W.et al (2020). Tamm review: influence of forest management activities on soil organic carbon stocks: a knowledge synthesis.For. Ecol. Manag.466:118127. 10.1016/j.foreco.2020.118127
56
MeyerP. (2020). Stubborn and adaptive – five decades of monitoring and research of self-regulated tree demography in Lower Saxony, Germany.Allg. Forst Jagdztg.190120–135.
57
MeyerP.AckermannJ.BalcarP.BoddenbergJ.DetschR.FörsterB.et al (2001). Untersuchung der Waldstruktur und Ihrer Dynamik in Naturwaldreservaten.Germany: IHW-Verlag.
58
MeyerP.MölderA.FeldmannE.DemantL.SchmidtM. (2022). Neue naturwälder in deutschland. hotspots für forschung und biologische vielfalt im klimawandel.Geographische Rundschau128–31.
59
MeyerP.NagelR.FeldmannE. (2021). Limited sink but large storage: biomass dynamics in naturally developing beech (Fagus sylvatica) and oak (Quercus robur, Quercus petraea) forests of north-western Germany.J. Ecol.1093602–3616. 10.1111/1365-2745.13740
60
MeyerP.SchmidtM. (2011). Dead wood accumulation in abandoned beech (Fagus sylvatica L.) forests in northwestern Germany.For. Ecol. Manag.261342–352. 10.1016/j.foreco.2010.08.037
61
MeynenE.SchmidthüsenJ.GellertJ.NeefE.Müller-MinyH.SchultzeJ. H. (1953). Handbuch der Naturräumlichen Gliederung Deutschlands.Remagen: Bundesanstalt für Landeskunde.
62
MikolášM.SvitokM.BaèeR.MeigsG. W.KeetonW. S.KeithH.et al (2021). Natural disturbance impacts on trade-offs and co-benefits of forest biodiversity and carbon.Proc. R. Soc. B Biol. Sci.288:20211631. 10.1098/rspb.2021.1631
63
Molina-ValeroJ. A.CamareroJ. J.Álvarez-GonzálezJ. G.CerioniM.HeviaA.Sánchez-SalgueroR.et al (2021). Mature forests hold maximum live biomass stocks.For. Ecol. Manag.4801–20. 10.1016/j.foreco.2020.118635
64
MünchE. (2007). Die datenbank der naturwaldreservate in deutschland.forstarchiv78197–201.
65
MundM. (2004). Carbon pools of European beech forests (Fagus sylvatica) under different silvicultural management.Berichte des Forschungszentrums Waldökosysteme A189:256.
66
NabuursG. J.VerkerkP. J.SchelhaasM.González-OlabarriaJ. R.TrasobaresA.CiencialaE. (2018). Climate-Smart Forestry: Mitigation Impacts in Three European Regions.Finland: European Forest Institute. 10.36333/fs06
67
NaudtsK.ChenY.McGrathM. J.RyderJ.ValadeA.OttoJ.et al (2016). Europe’s forest management did not mitigate climate warming.Science351597–600. 10.1126/science.aad7270
68
NelsonG. A. (2022). fishmethods: fishery science methods and models.R package version 1.11-3. Available online at: https://CRAN.R-project.org/package=fishmethods
69
Nord-LarsenT.VesterdalL.BentsenN. S.LarsenJ. B. (2019). Ecosystem carbon stocks and their temporal resilience in a semi-natural beech-dominated forest.For. Ecol. Manag.44767–76. 10.1016/j.foreco.2019.05.038
70
PanY. (2011). A large and persistent carbon sink in the world’s forests.Science333988–993. 10.1126/science.1201609
71
PanY.BirdseyR. A.PhillipsO. L.JacksonR. B. (2013). The structure, distribution, and biomass of the world’s forests.Annu. Rev. Ecol. Evol. Syst.44593–622. 10.1146/annurev-ecolsys-110512-135914
72
ParviainenJ.BuckingW.VandekerkhoveK.SchuckA.PaivinenR. (2000). Strict forest reserves in Europe: efforts to enchance biodiversity and research on forest left for free development in Europe (EU-COST-Action E4).Forestry73107–118. 10.1093/forestry/73.2.107
73
PetritanA. M.BirisI. A.MerceO.TurcuD. O.PetritanI. C. (2012). Structure and diversity of a natural temperate sessile oak (Quercus petraea L.) – European Beech (Fagus sylvatica L.) forest.For. Ecol. Manag.280140–149. 10.1016/j.foreco.2012.06.007
74
PichlerV.GömöryováE.LeuschnerC.HomolákM.AbrudanI. V.PichlerováM.et al (2021). Parent material effect on soil organic carbon concentration under primeval european beech forests at a regional scale.Forests12:405. 10.3390/f12040405
75
PretzschH. (2010). Forest Dynamics, Growth and Yield, from Measurement to Model.Berlin: Springer. 10.1007/978-3-540-88307-4
76
PretzschH.BiberP.SchützeG.UhlE.RötzerT. (2014). Forest stand growth dynamics in Central Europe have accelerated since 1870.Nat. Commun.5:4967. 10.1038/ncomms5967
77
PřívétivýT.JaníkD.UnarP.AdamD.KrálK.VrškaT. (2016). How do environmental conditions affect the deadwood decomposition of European beech (Fagus sylvatica L.)?For. Ecol. Manag.381177–187. 10.1016/j.foreco.2016.09.033
78
PughT. A. M.LindeskogM.SmithB.PoulterB.ArnethA.HaverdV.et al (2019). Role of forest regrowth in global carbon sink dynamics.Proc. Natl. Acad. Sci. USA1164382–4387. 10.1073/pnas.1810512116
79
PukkalaT. (2017). Does management improve the carbon balance of forestry?Forestry90125–135. 10.1093/forestry/cpw043
80
PukkalaT. (2018). Carbon forestry is surprising.For. Ecosyst.5:11. 10.1186/s40663-018-0131-5
81
R Core Team (2016). R: a Language and Environment for Statistical Computing.Austria: R Foundation for Statistical Computing.
82
RavenP. (2021). Letter Regarding Use of Forests for Bioenergy. Available online at: https://www.klimareporter.de/images/dokumente/2021/02/ScientistLetter_WoodBurning_2021.pdf(accessed November 10, 2022).
83
RiedelT.HennigP.KroiherF.PolleyH.SchmitzF.SchwitzgebelF. (2017). Die dritte bundeswaldinventur (BWI 2012). Inventur- und auswertemethoden, 124 S.
84
RiedelT.KändlerG. (2017). Nationale treibhausgasberichterstattung: neue funktionen zur schätzung der oberirdischen biomasse am einzelbaum.Forstarchiv8831–38.
85
SabatiniF. M.BurrascanoS.KeetonW. S.LeversC.LindnerM.PötzschnerF.et al (2018). Where are Europe’s last primary forests?Divers. Distrib.241426–1439. 10.1111/ddi.12778
86
SchmitzF. (2014). Der Wald in Deutschland–ausgewählte Ergebnisse der Dritten Bundeswaldinventur.Berlin: Ministery of food and agriculture.
87
SchulzeE.SierraC.EgenolfV.WoerdehoffR.IrsingerR.BaldamusC.et al (2021). Forest management contributes to climate mitigation by reducing fossil fuel consumption: a response to the letter by Welle et al.GCB Bioenergy13288–290. 10.1111/gcbb.12754
88
SchulzeE. D.BouriaudO.IrslingerR.ValentiniR. (2022). The role of wood harvest from sustainably managed forests in the carbon cycle.Ann. For. Sci.79:17. 10.1186/s13595-022-01127-x
89
SchulzeE.-D.SierraC. A.EgenolfV.WoerdehoffR.IrslingerR.BaldamusC.et al (2020). The climate change mitigation effect of bioenergy from sustainably managed forests in Central Europe.GCB Bioenergy12186–197. 10.1111/gcbb.12672
90
SeddonN.ChaussonA.BerryP.GirardinC. A. J.SmithA.TurnerB. (2020). Understanding the value and limits of nature-based solutions to climate change and other global challenges.Philos. Trans. R. Soc. B Biol. Sci.375:20190120. 10.1098/rstb.2019.0120
91
SiemonsmeierA.FörsterB.BlaschkeM. (2020). Forest structures and carbon storage in managed and unmanaged forests along an altitudinal gradient in a central European low mountain range. Waldökol. Landschaf. Natusc.1971–88.
92
SpieckerH. (2001). Entwicklung der holzressourcen in europa - konsequenzen für die waldwachstumsforschung.Beiträge für Forstwirtschaft und Landschaftsökologie35153–159.
93
SpieckerH.MielikäinenK.KöhlM.SkovsgaardJ. P. (1996). Growth Trends in European Forests.Germany: Fischer Verlag. 10.1007/978-3-642-61178-0
94
StillhardJ.HobiM. L.BrangP.BrändliU.-B.KorolM.PokyncheredaV.et al (2022). Structural changes in a primeval beech forest at the landscape scale.Fore. Ecol. Manag.504:119836. 10.1016/j.foreco.2021.119836
95
ThomasS. C.MartinA. R. (2012). Carbon content of tree tissues: a synthesis.Forests3332–352. 10.3390/f3020332
96
VandekerkhoveK.De KeersmaekerL.MenkeN.MeyerP.VerscheldeP. (2009). When nature takes over from man: dead wood accumulation in previously managed oak and beech woodlands in North-western and central Europe.For. Ecol. Manag.258425–435. 10.1016/j.foreco.2009.01.055
97
VerkerkP. J.CostanzaR.HetemäkiL.KubiszewskiI.LeskinenP.NabuursG. J.et al (2020). Climate-Smart Forestry: the missing link.For. Policy Econ.115:102164. 10.1016/j.forpol.2020.102164
98
VesterdalL.SchmidtI. K.CallesenI.NilssonL. O.GundersenP. (2008). Carbon and nitrogen in forest floor and mineral soil under six common European tree species.For. Ecol. Manag.25535–48. 10.1016/j.foreco.2007.08.015
99
WalkerL. R.WardleD. A.BardgettR. D.ClarksonB. D. (2010). The use of chronosequences in studies of ecological succession and soil development. J. Ecol.98725–736. 10.1111/j.1365-2745.2010.01664.x
100
WatsonJ. E. M.EvansT.VenterO.WilliamsB.TullochA.StewartC.et al (2018). The exceptional value of intact forest ecosystems.Nat. Ecol. Evol.2599–610. 10.1038/s41559-018-0490-x
101
WelleT.IbischP. L.BlumroederJ. S.BohrY. E.LeinenL.WohllebenT.et al (2020). Incorrect data sustain the claim of forest-based bioenergy being more effective in climate change mitigation than forest conservation.GCB Bioenergy13286–287. 10.1111/gcbb.12738
102
WirthC.GleixnerG.HeimannM. (2009). Old-growth Forests - Function, Fate and Value.Berlin: Springer. 10.1007/978-3-540-92706-8
103
WoodS. N. (2011). Fast stable restricted maximum likelihood and marginal likelihood estimation of semiparametric generalized linear models: estimation of Semiparametric Generalized linear models.J. R. Stat. Soc. Ser. B733–36.
104
ZanneA. E.Lopez-GonzalesG.CoomesD. A.IlicJ.JansenS.LewisS. L.et al (2009). Global Wood Density Database. Available online at: https://doi.org/10.5061/dryad.234(accessed October 6, 2009).
Summary
Keywords
Climate-Smart Forestry, time since abandonment, unmanaged forest reserves, carbon storage, carbon sink, climate change, strict forest reserves, soil organic carbon
Citation
Nagel R, Meyer P, Blaschke M and Feldmann E (2023) Strict forest protection: A meaningful contribution to Climate-Smart Forestry? An evaluation of temporal trends in the carbon balance of unmanaged forests in Germany. Front. For. Glob. Change 6:1099558. doi: 10.3389/ffgc.2023.1099558
Received
15 November 2022
Accepted
13 February 2023
Published
16 March 2023
Volume
6 - 2023
Edited by
Brendan George Mackey, Griffith University, Australia
Reviewed by
Brendan Morris Rogers, Woodwell Climate Research Center, United States; Giovanni Santopuoli, Dipartimento di Agricoltura, Ambiente e Alimenti, Università degli Studi del Molise, Italy
Updates
Copyright
© 2023 Nagel, Meyer, Blaschke and Feldmann.
This is an open-access article distributed under the terms of the Creative Commons Attribution License (CC BY). The use, distribution or reproduction in other forums is permitted, provided the original author(s) and the copyright owner(s) are credited and that the original publication in this journal is cited, in accordance with accepted academic practice. No use, distribution or reproduction is permitted which does not comply with these terms.
*Correspondence: Rouven Nagel, rouven.nagel@nw-fva.de
This article was submitted to Forest Management, a section of the journal Frontiers in Forests and Global Change
Disclaimer
All claims expressed in this article are solely those of the authors and do not necessarily represent those of their affiliated organizations, or those of the publisher, the editors and the reviewers. Any product that may be evaluated in this article or claim that may be made by its manufacturer is not guaranteed or endorsed by the publisher.