 Qiaoli Wu
 Shenhui Yang
 Jie Jiang1,2*
- 1School of Geomatics and Urban Spatial Informatics, Beijing University of Civil Engineering and Architecture, Beijing, China
- 2Key Laboratory of Urban Spatial Information, Ministry of Natural Resources of the People’s Republic of China, Beijing University of Civil Engineering and Architecture, Beijing, China
The product of leaf area index (LAI) and clumping index (CI) quantifies the effective leaf abundance and distribution across the landscape, and therefore, governs the radiation absorption, evapotranspiration, and carbon assimilation processes in the terrestrial ecosystems. Previous studies were mainly focused on developing inversion methods applicable to large scale for retrieving LAI and CI from multi-angular satellite observations. However, a few studies focused on quantifying the sensitivity of canopy bidirectional reflectance distribution function (BRDF) to changes in CI in a forward manner, hampering an accurate understanding of the relationship between CI and BRDF. In this study, we simulated how BRDF responds to changes in CI in Qinghai spruce (Picea crassifolia) forests based on a 3D radiative transfer model LESS and ground-measured data. We found that the LESS model effectively simulated the hot-spot, roof, and bowl-edge characteristics of the canopy BRDF by changing the sun-sensor geometry. We constructed forest scenes with variable CI (ranging from 0.4 to 0.8) to investigate the clumping effect on BRDF with different solar and observation angles. The red band bidirectional reflectance factor (BRF) showed higher sensitivity to changes in CI than that in the near-infrared (NIR) band. Canopy BRFs in the red band along the principal plane and cross principal planes measured in different seasons showed consistent sensitivity to changes in CI, suggesting that the red band BRF is helpful for CI inversion for forests with different levels of foliage clumping. In the NIR band, canopy BRFs along the principal plane measured in growing seasons [with solar zenith angle (SZA) <40°] and the cross principal plane measured in non-growing seasons (with SZA >40°) were sensitive to changes in CI in highly clumped forests (with CI ranging from 0.4 to 0.6). However, canopy BRF in the NIR band showed low sensitivity to changes in CI in highly clumped forests (CI <0.6), especially along the cross principal plane when SZA was approximately 10°. The simulated BRFs in the red and NIR bands showed relatively low sensitivity to changes in SZAs at a VZA of 40° and 0°, respectively. We highly recommend including the red band BRF for CI retrievals, and using a VZA of 40° in the red band and 0° in the NIR band may help reduce the CI estimation uncertainty caused by changes in SZA. This research provides a new perspective for understanding the sensitivity of multi-angular satellite data to changes in canopy structural characteristics of vegetation in global ecosystem studies and may help improve CI estimations using the multiangular optical remote sensing data.
1. Introduction
Terrestrial vegetation plays a critical role in regulating the energy, carbon, and water exchanges between terrestrial ecosystems and the atmosphere. Forests account for 30% of the global land area and store approximately 73% of the terrestrial vegetation carbon (Gibbs and Ruesch, 2008), making them the largest carbon reservoir in the terrestrial ecosystem (Dalponte et al., 2019). Leaf area index (LAI) is perhaps the most important biophysical parameter in terrestrial ecosystem models for modeling ecosystem processes, such as radiation interception, evapotranspiration, and photosynthesis. The clumping index (CI) quantifies the degree to which foliage deviates from a random distribution and could convert the LAI to the effective LAI. Thus, the parameterization of CI significantly affects the accuracy of energy, carbon, and water flux simulations in terrestrial ecosystem models.
Remote sensing provides the only viable option for estimating LAI and CI continuously on a global scale (Roth et al., 2020). Multi-angle canopy reflectance recorded by optical satellite sensors is one major data source for the retrieval of global LAI and CI maps. Among the vegetation types with discontinuous canopies, the anisotropy characteristic of forest canopies is most pronounced and has been well documented according to field measurements and model simulations (Ponce de León and Bailey, 2019). The bidirectional reflectance distribution function (BRDF) is defined as the ratio of radiant exitance to incident irradiance at a certain point of the vegetation canopy (Nicodemus et al., 1977). The BRDF describes the directional reflectance properties of the vegetation canopy and determines surface albedo (i.e., the ratio of surface reflection to incident radiation) (Dickinson, 1983). Thus, BRDF is intimately tightly linked with the global energy, carbon, and water cycles (Li et al., 2020) and is an essential remote sensing monitoring parameter for the global Sustainable Development Goals (SDGs). Ignoring the BRDF effect of land surface based on Lambertian surface assumption would lead to inaccuracies of up to 45% (Kimes and Sellers, 1985), while replacing surface albedo by surface reflectance in nadir-view would lead to inaccuracies of approximately 60% (Gao et al., 1998), respectively.
Canopy BRDF is known to be a function of tissue optical properties, vegetation physiological and biochemical parameters, and the canopy structural parameters (e.g., LAI, canopy height, and CI) (Cui et al., 2019; Wei et al., 2019; Pu et al., 2020). The LAI and the CI are two of the most important canopy structure parameters that need to be characterized in state-of-the-art terrestrial ecosystem models (Duthoit et al., 2008; Hill et al., 2011; Ryu et al., 2011; Sprintsin et al., 2011; Fang et al., 2013; Govind et al., 2013). LAI quantifies the abundance of green leaves in canopies. The CI is defined as a ratio of the effective LAI to true LAI (i.e., Ω = LAIe/LAIt) (Croft and Chen, 2018), which quantifies the non-randomness of leaf distribution. If leaves distribute randomly in the canopy, CI equals one. When the vegetation is equally distributed, the value can be more than one. CI decreases when the leaves in a canopy get more clumped, and its value is usually less than one (Chen and Black, 1992). For the same canopy leaf area, the interception of solar radiation and precipitation by the canopy or the distribution of nutrients in the foliage will be distinct due to the different distribution of leaves in space (Chen, 1996). Thus, neglecting the clumping effect of leaves within the canopy will lead to large uncertainties in simulations of water and carbon cycles (Chen and Liu, 2020). It is still largely unknown how canopy reflectance changes with CI in forest ecosystems. As a result, it is essential to evaluate the clumping effect on forest canopy BRDF characteristics and test whether CI and LAI are helpful in representing the realistic 3D structure of the forest canopies.
To study the relationship between BRDF and canopy structural parameters, we need a BRDF model to simulate the radiation transfer process in forest canopies. Typically, empirical (Blinn, 1998), semi-empirical (Roujean et al., 1992), and physical BRDF models are commonly used in literature. Among them, the physical BRDF models generally have a solid theoretical foundation and most of the model parameters have a clear physical meaning. The mainstream physical BRDF models can be classified into three different categories, including the radiative transfer models (Suits, 1971; Verhoef, 1984), the geometric optical models (Li and Strahler, 1992), and the computer simulation models (North, 1996; Gastellu-Etchegorry et al., 2015). The ability of radiative transfer models and geometric optical models in simulating the interaction between solar radiation and vegetation is still limited with small simulation scenarios, simplified scene details, difficulty considering terrain effects, low computational efficiency, and complicated usage (Qi et al., 2017). In contrast, the 3D radiative transfer models can deal with both realistic structural scenarios and simulate large-scale remote sensing data. For example, Qi developed a realistic 3D scene canopy radiative transfer model based on a ray-tracing algorithm using the acceleration framework provided by Mitsuba rendering software (i.e., the LESS BRDF model). The simulation accuracy of the LESS model is reliable, and the calculation efficiency is greatly improved (Qi et al., 2019). Thus, the advancement of the LESS model has provided a new opportunity to quantitatively explore the relationship between forest canopy structural parameters and BRDF characteristics.
Previous studies were mainly focused on developing inversion methods applicable to large scale for retrieving CI from satellite observations. Various multi-angular satellite data (e.g., POLDER, MODIS, and MISR) have been successfully applied to retrieve global and regional CI products (Chen et al., 2005; He et al., 2012, 2016; Jiao et al., 2018; Wei et al., 2019). The CI over a large area can be estimated from remote sensing data through from the normalized difference between the hotspot and darkspot reflectance (NDHD) based on an empirical relationship between NDHD and CI (Chen et al., 2005). The hotspot corresponds to the maximum reflectance in the backward scattering direction on the principal plane when the solar radiation and view directions coincide. The darkspot refers to very low reflectance values on the principal plane in the forward scattering direction when the view directions are away from the direction of illumination (Jiao et al., 2018). In addition, changes in solar zenith angle (SZA) strongly affect the NDHD method for CI estimation; However, current CI products are generally produced based on a constant SZA assumption (Fang, 2021) with only a few exceptions (Wei et al., 2019). Improper configuration of the BRDF model and SZA may introduce uncertainties into CI estimates (Wei and Fang, 2016). Our knowledge about how canopy reflectance in different seasons, bands, and view zenith angles (VZAs) respond to changes in CI is limited, hampering accurate estimation of CI from multi-angle optical remotely sensed data.
While a high value has been placed on the representation of vegetation structure in simulating the response of vegetation dynamics to climate change, the concomitant increase in our understanding of how canopy BRDF respond to changes in CI in forest canopies has only partially been realized. The objective of this study was to quantify how canopy BRDF responds to changes in CI in forest canopies, which provides a theoretical basis for retrieving canopy structural parameters from BRDF remote sensing products. Specifically, we address the following three scientific questions: (1) How does canopy BRDF in the red band and near-infrared (NIR) band change with SZA for canopies with different levels of CIs? (2) Which band is more sensitive to changes in CI? (3) Which VZA should be included when inverting CI from the BRDF data? It is envisaged that a broader impact of this work will be to guide future efforts to retrieve canopy structural parameters using multi-angle satellite observations.
2. Materials and methods
2.1. Study area and field measurements
All the ground measured data used in this study were obtained from the HiWATER program (Li et al., 2013) and were collected in the Dayekou Guantan forest station (10015′E, 3832′N), south of Zhangye city, Gansu province, China. The study area is in the middle valley of the Heihe river basin in the Qilian Mountain area. The main vegetation types in Dayekou also include Qinghai spruce (Picea crassifolia) forests, shrubland, and upland meadow. The Guantan forest station was dominated by Qinghai spruce forests.
Field measurements were obtained in a super sample plot at Guantan forest station in June 2008. The super sample plot was 100 m × 100 m in size and was divided into 16 quadratus subplots with 25 m × 25 m in size (Figure 1). At the Dayekou Guantan forest station, there were 30 field measurement sample plots either with a size of 20 m × 20 m (plot A in Figure 1A) or 25 m × 25 m (plot B in Figure 1A). In this study, only field measurements in the super sample plot were involved (Li et al., 2015). The vertical forest canopy cover for the super sample plot was approximately 70% based on the canopy height model (CHM) image derived from Lidar data and the measured locations and mean crown radius of trees. LAI was measured for the 16 subplots with a size of 25 m × 25 m using Tracing Radiation and Architecture of Canopies (TRAC, Natural Resources Canada, Canada Centre for Remote Sensing, Saint-Hubert, QC, Canada) (Chen and Cihlar, 1995) and the LAI-2000 Plant Canopy Analyzer (LAI-2000, LI-COR Inc., Lincoln, NE, USA) (Gower et al., 1999). LAI-2000 was used to measure the effective LAI (LAIe) and TRAC was used to measure LAIe and the foliage CI (Ω) (Chen, 1996). The true LAI (LAIt) for each subplot was calculated through the equation of LAIt = LAIe/Ω. The field measurements of LAI were used to facilitate the construction of forest scenes in the LESS model with different CIs. In addition, detailed canopy structure parameters were measured for every single tree at the super site. The geometrical structural characteristics measured included tree height, crown base height, diameter at breast height, and crown horizontal radius. A laser altimeter [TruPulse 200, Laser Technology Inc. (LTI), Norristown, PA, USA] was used to measure the tree height. Field-measured canopy structure parameters provide prior knowledge of the stem density and single-tree size for the LESS model. The protocols for each instrument used in the sample plots and the sample plot layouts were described in detail in a previous study (Fu et al., 2011).
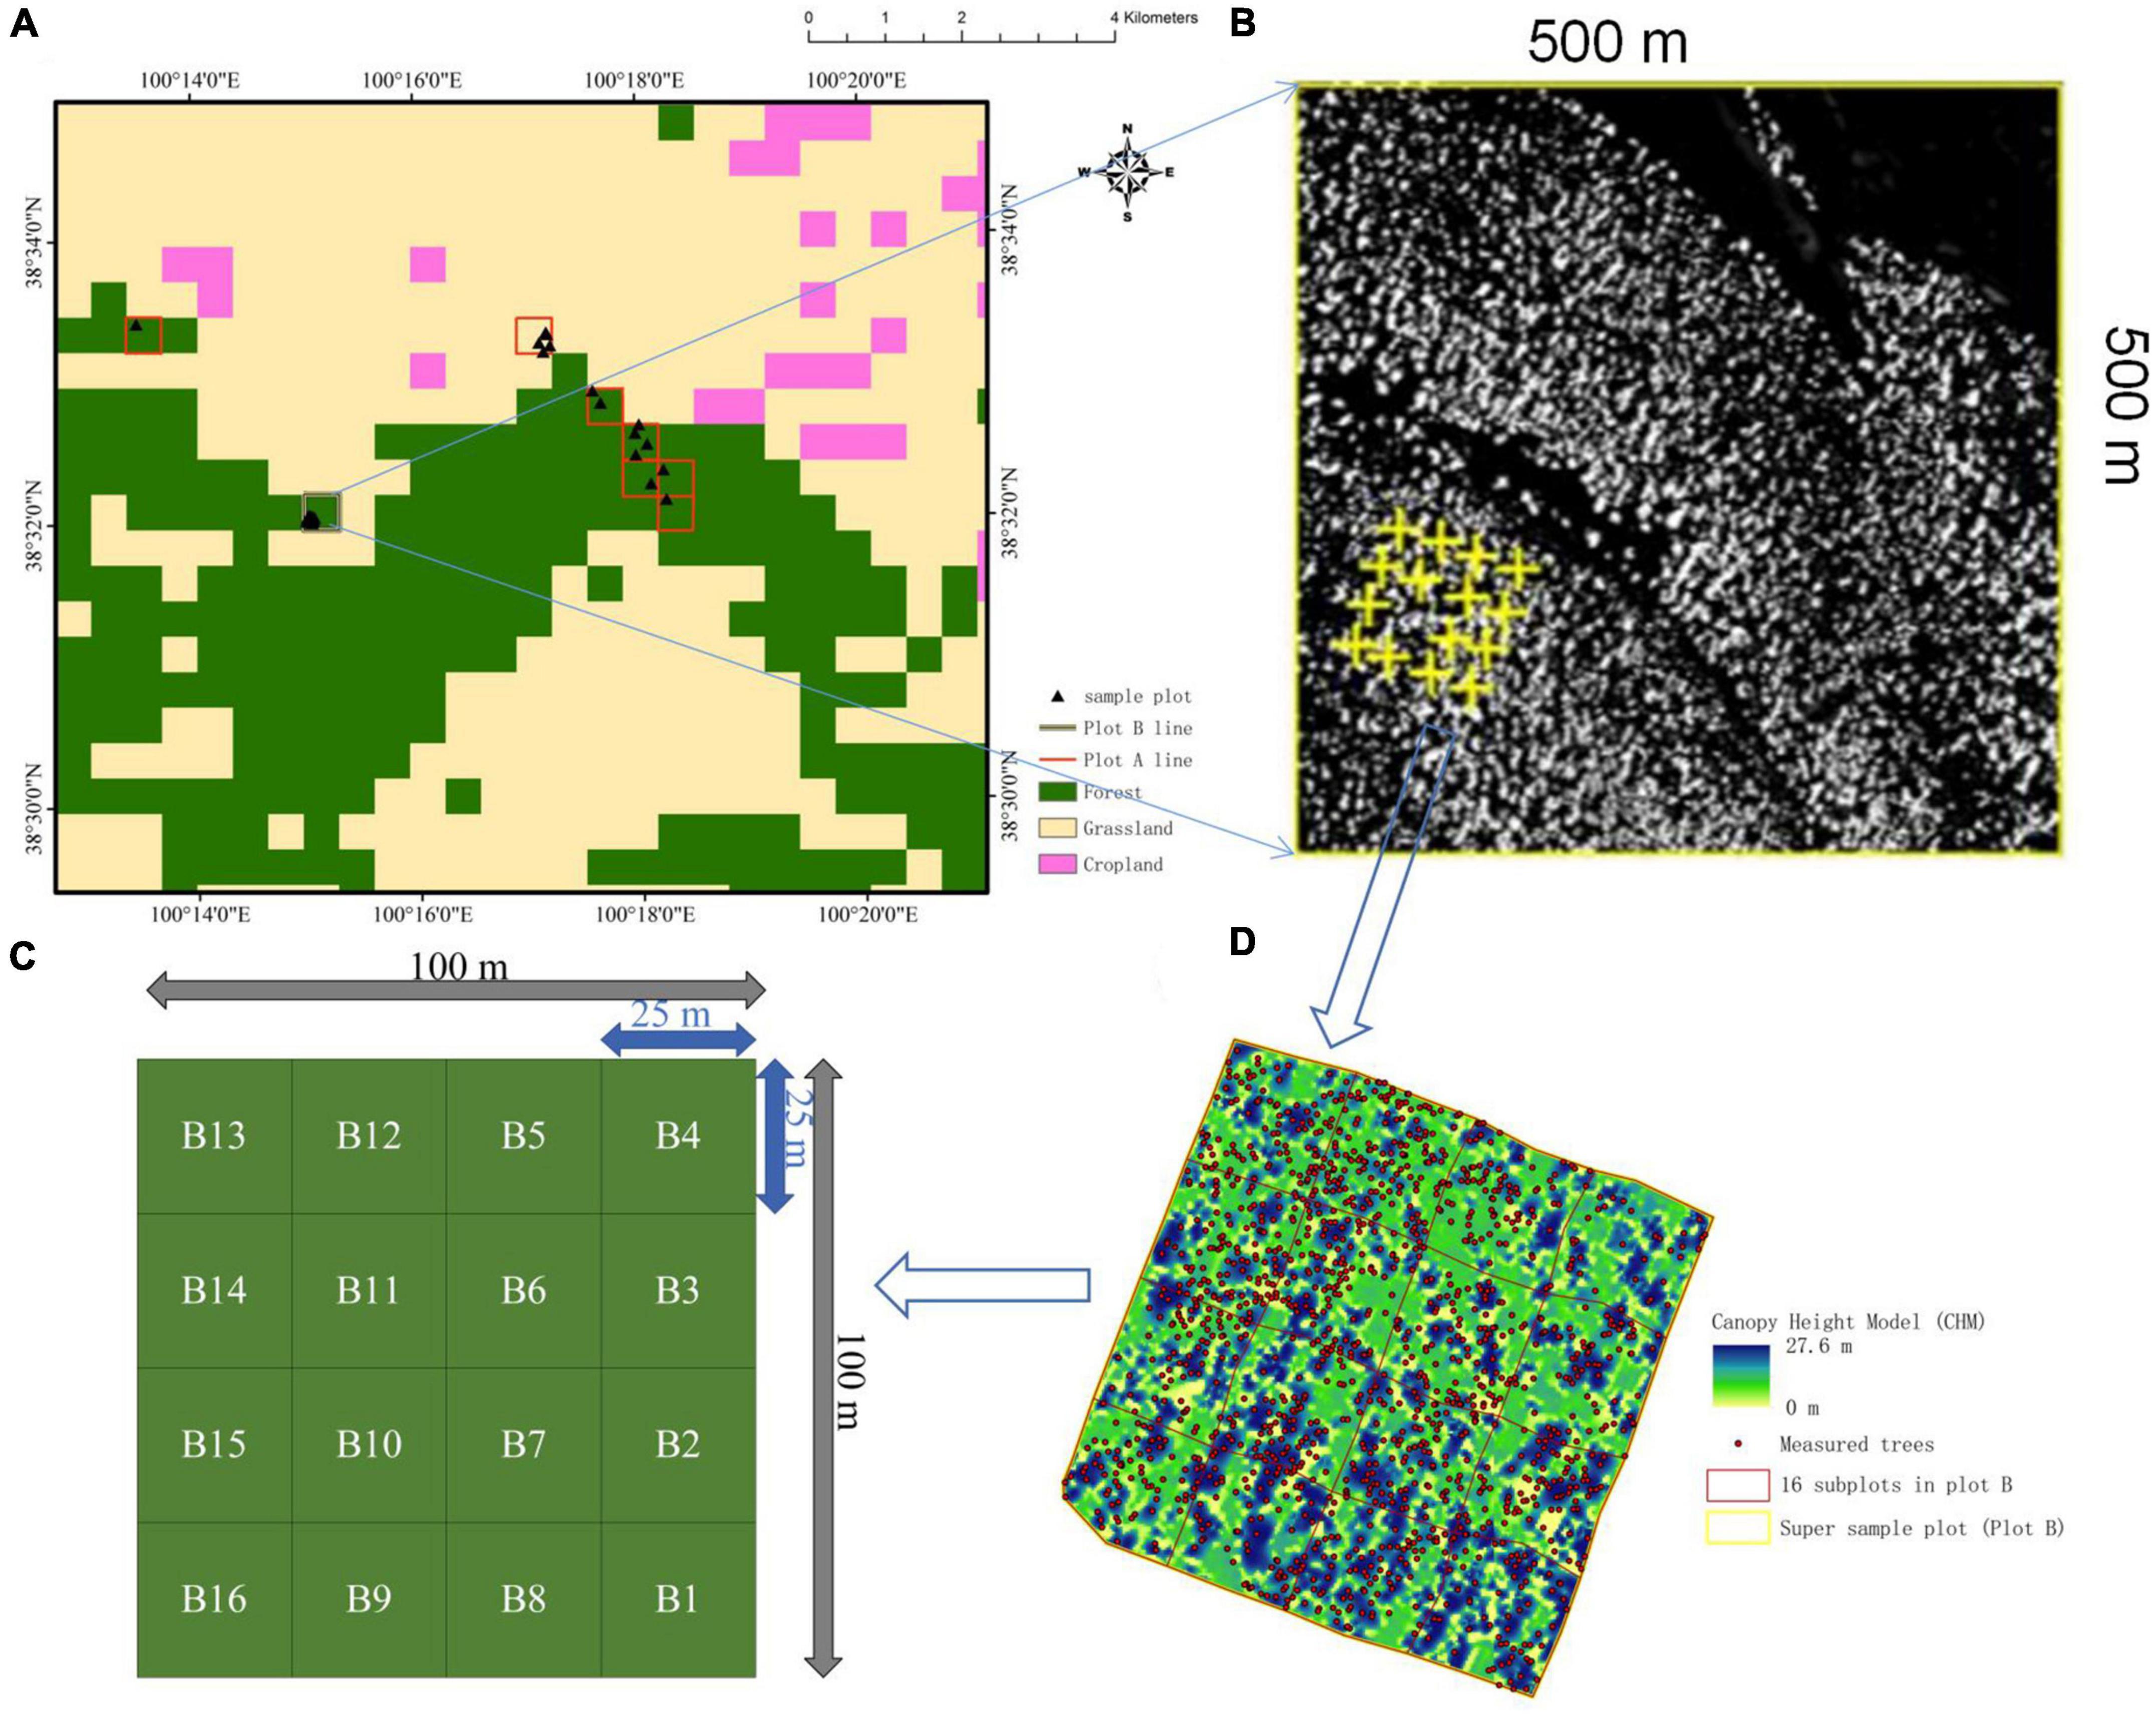
Figure 1. Land cover classification and field plots at the Dayekou Guantan forest station. (A) Field plots with a size of 20 m × 20 m (15 plots A) or 25 m × 25 m (16 plots B) on MODIS land cover data (MCD12Q1) with a spatial resolution of 500 m. Pixels where the A sample plots were located were outlined in red and the pixels where the B sample plots were located are outlined in black in panel (A). (B) Canopy height model (CHM) image for the 500 m × 500 m MODIS pixel where the plots B were located. (C) The 16 plots B with a size of 25 m × 25 m constitute a 100 × 100 m super sample plot. (D) Locations of field inventoried tree height of all trees in the 100 × 100 m super sample plot on the CHM image.
2.2. MODIS BRDF product
The Moderate Resolution Imaging Spectroradiometer (MODIS) MCD43A1 version 6 Bidirectional Reflectance Distribution Function and Albedo (BRDF/Albedo) model parameters dataset is produced at a daily temporal scale and 500-m spatial resolution.1 In this study, long time series MODIS data covering the study area was selected for model inter-comparison purposes. More specifically, MCD43A1 data with good quality between January 2000 and December 2020 was downloaded for model validation purposes. The red band and the NIR band are two typical spectral bands commonly used for vegetation remote sensing. Thus, we selected the red and the NIR bands to study the relationship between canopy BRDF and CI. The canopy BRDF in the NIR and the red band were calculated from MCD43A1 data in band 1 (red, 620–670 nm) and band 2 (NIR, 841–876 nm) using the RossThick-LiSparse-Reciprocal (RTLSR) semi-empirical kernel-driven BRDF model (Schaaf et al., 2002, 2010).
2.3. LESS model
The LESS model is a newly suggested ray-tracing-based 3D RT Model that can properly and effectively simulate multispectral and multiangle images, especially for simulating the radiation properties of complicated realistic landscapes (Qi et al., 2022). We simulate canopy BRDF following specific simulation steps. First, a forest scene of the super study plot (Figure 2) was constructed with cone crown assumption using LESS. Second, several fundamental input parameters were set for LESS, including sun-sensor geometry, illumination conditions, and optical properties of leaf and soil parameters. The input parameter values were set based on the ground-measured data obtained at the Guantan super sample plot, and the specific values are given in Tables 1, 2. Furthermore, Qi et al. (2019) indicated that the performance of the LESS model is steady and reliable compared to other 3D models, such as the DART and Radiosity Applicable to Porous Individual Object (RAPID) models and validated by published field data (Qi et al., 2019). The 3D canopy structure, component spectrum, sun-sensor geometry, and illumination parameters of the scene are the fundamental inputs of the LESS model. Based on a ray-tracing method, LESS can simulate the transmission process of incident light in a scene and output the related simulated variables (such as directional reflectance, albedo, fPAR, and so on) (Yan et al., 2022). The LESS model can serve as a benchmark for various applications in remote sensing with high computation efficiency, solid theoretical foundation, and well-assessed accuracy. In this study, we used the LESS model to construct forest scenes, calculate LAI, and simulate the BRDF characteristics of forest scenes with different CIs. The website2 contains details about the LESS model.
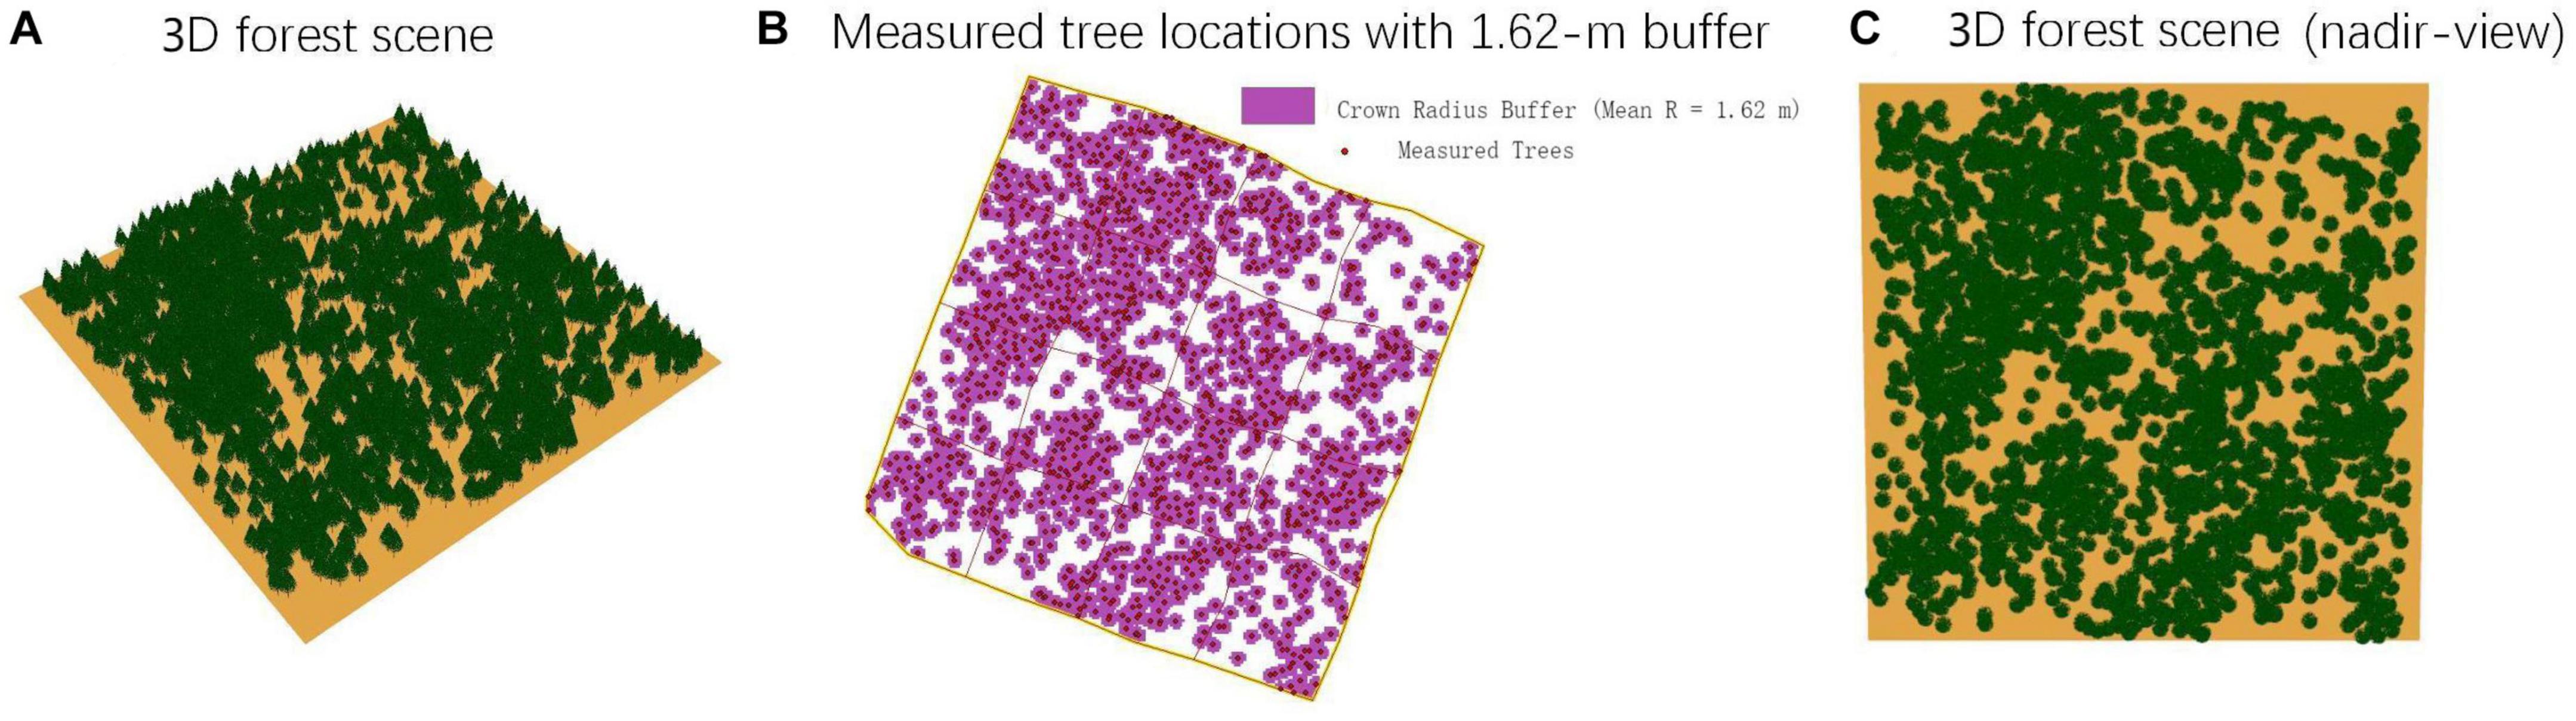
Figure 2. Three-dimensional forest scene generated based on measured tree locations in the super sample plot. (A) Three-dimensional forest scene of 100 m × 100 m simulated by LESS. (B) Locations of the 1,656 measured trees and buffer areas of crown coverage with a mean crown radius of 1.62 m. (C) Top-view of the forest scene in panel (A).
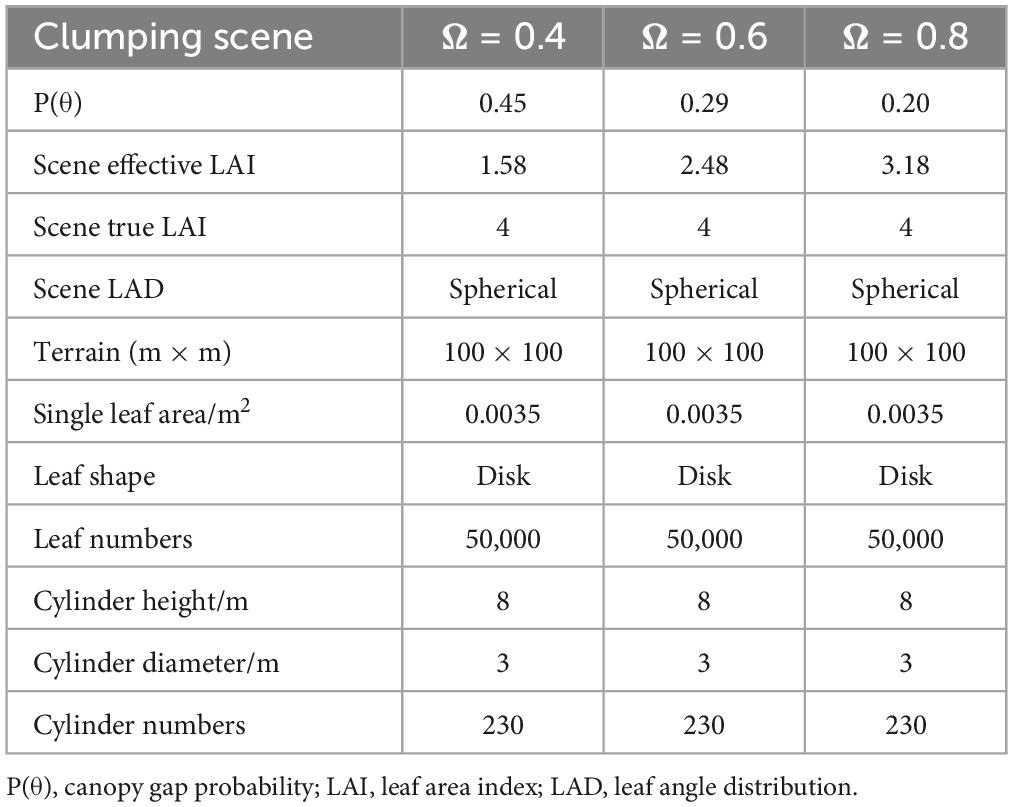
Table 1. Clumping scene parameters of cylindrical canopy.
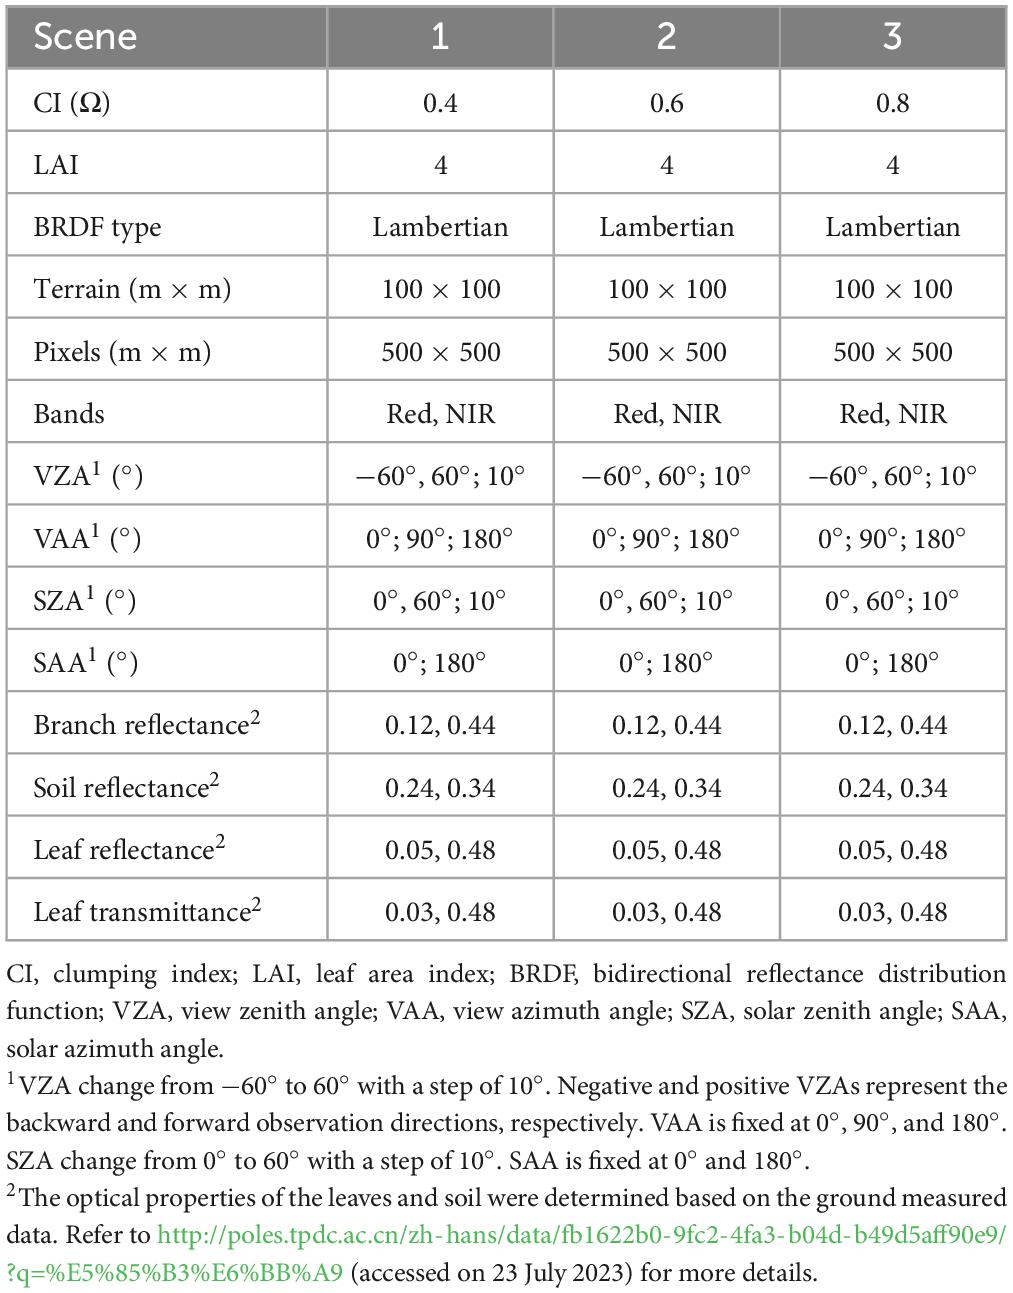
Table 2. Simulation parameter design.
2.4. Simulation design
To accomplish the goal of this study, first, we constructed a 3D scene of a forest canopy and simulated canopy BRDF using the ray-tracing method. Then, the scene reflectance signal was compared with MODIS MCD43A1 products to test the reliability of the LESS model in calculating canopy BRDF. To further understand the relationship between CI and canopy BRDF, the LESS model was used to how canopy reflectance changes with LAI and CI in different SZAs and observational zenith angles.
2.4.1. Model parameters determination
A single tree is the basic unit of the forest. Although there are differences between single trees, the structure of single trees of the same species is similar. To simplify the construction of the forest canopy simulation scene, we use a cone crown shape to represent single trees with similar structures within the scene. In this study, we assumed that the branches and leaves of the same tree species are organized similarly in a single tree crown. In this study, we determined the single tree structural parameters (Wu et al., 2022) based on the ground-measured data obtained at the Guantan super sample plot. Furthermore, two unknown parameters, including the single leaf area and leaf numbers (Wu et al., 2022), were calibrated to optimized values. We set the upper and lower boundary of these two parameters to 250% of the default value in the LESS model. The optimal value of single leaf area and leaf numbers were determined when the LAI for the forest scene simulated by the LESS model was closest to the true LAI based on field measurements.
First, we constructed a 3D scene of a forest canopy and simulated canopy BRDF using the ray-tracing method. Then, the scene reflectance signal was compared with MODIS MCD43A1 products to test the accuracy of the LESS model in calculating canopy BRDF. To further understand the relationship between CI and canopy BRDF, the LESS model was used to how canopy reflectance changes with LAI and CI in different SZAs and observational zenith angles.
2.4.2. Variation of clumping index
To quantitatively analyze the effect of clumping on canopy reflectance, we assumed the forest scenes of the study area to have different CIs in the LESS model. According to Fang et al. (2013), the global CI ranges between 0.4 and 0.9. Therefore, we selected three typical values (i.e., 0.4, 0.6, and 0.8) of the CI to stand for forest canopies with the same true LAI at different clumping scales. Figure 3 shows the simulation of scenes with a true LAI (LAIt) of 4 m2/m2 and a CI of 0.4, 0.6, and 0.8, respectively. The differences between these three scenes could be explained by the mutual shadowing or mutual occlusion effect of crowns (Wang et al., 2020).
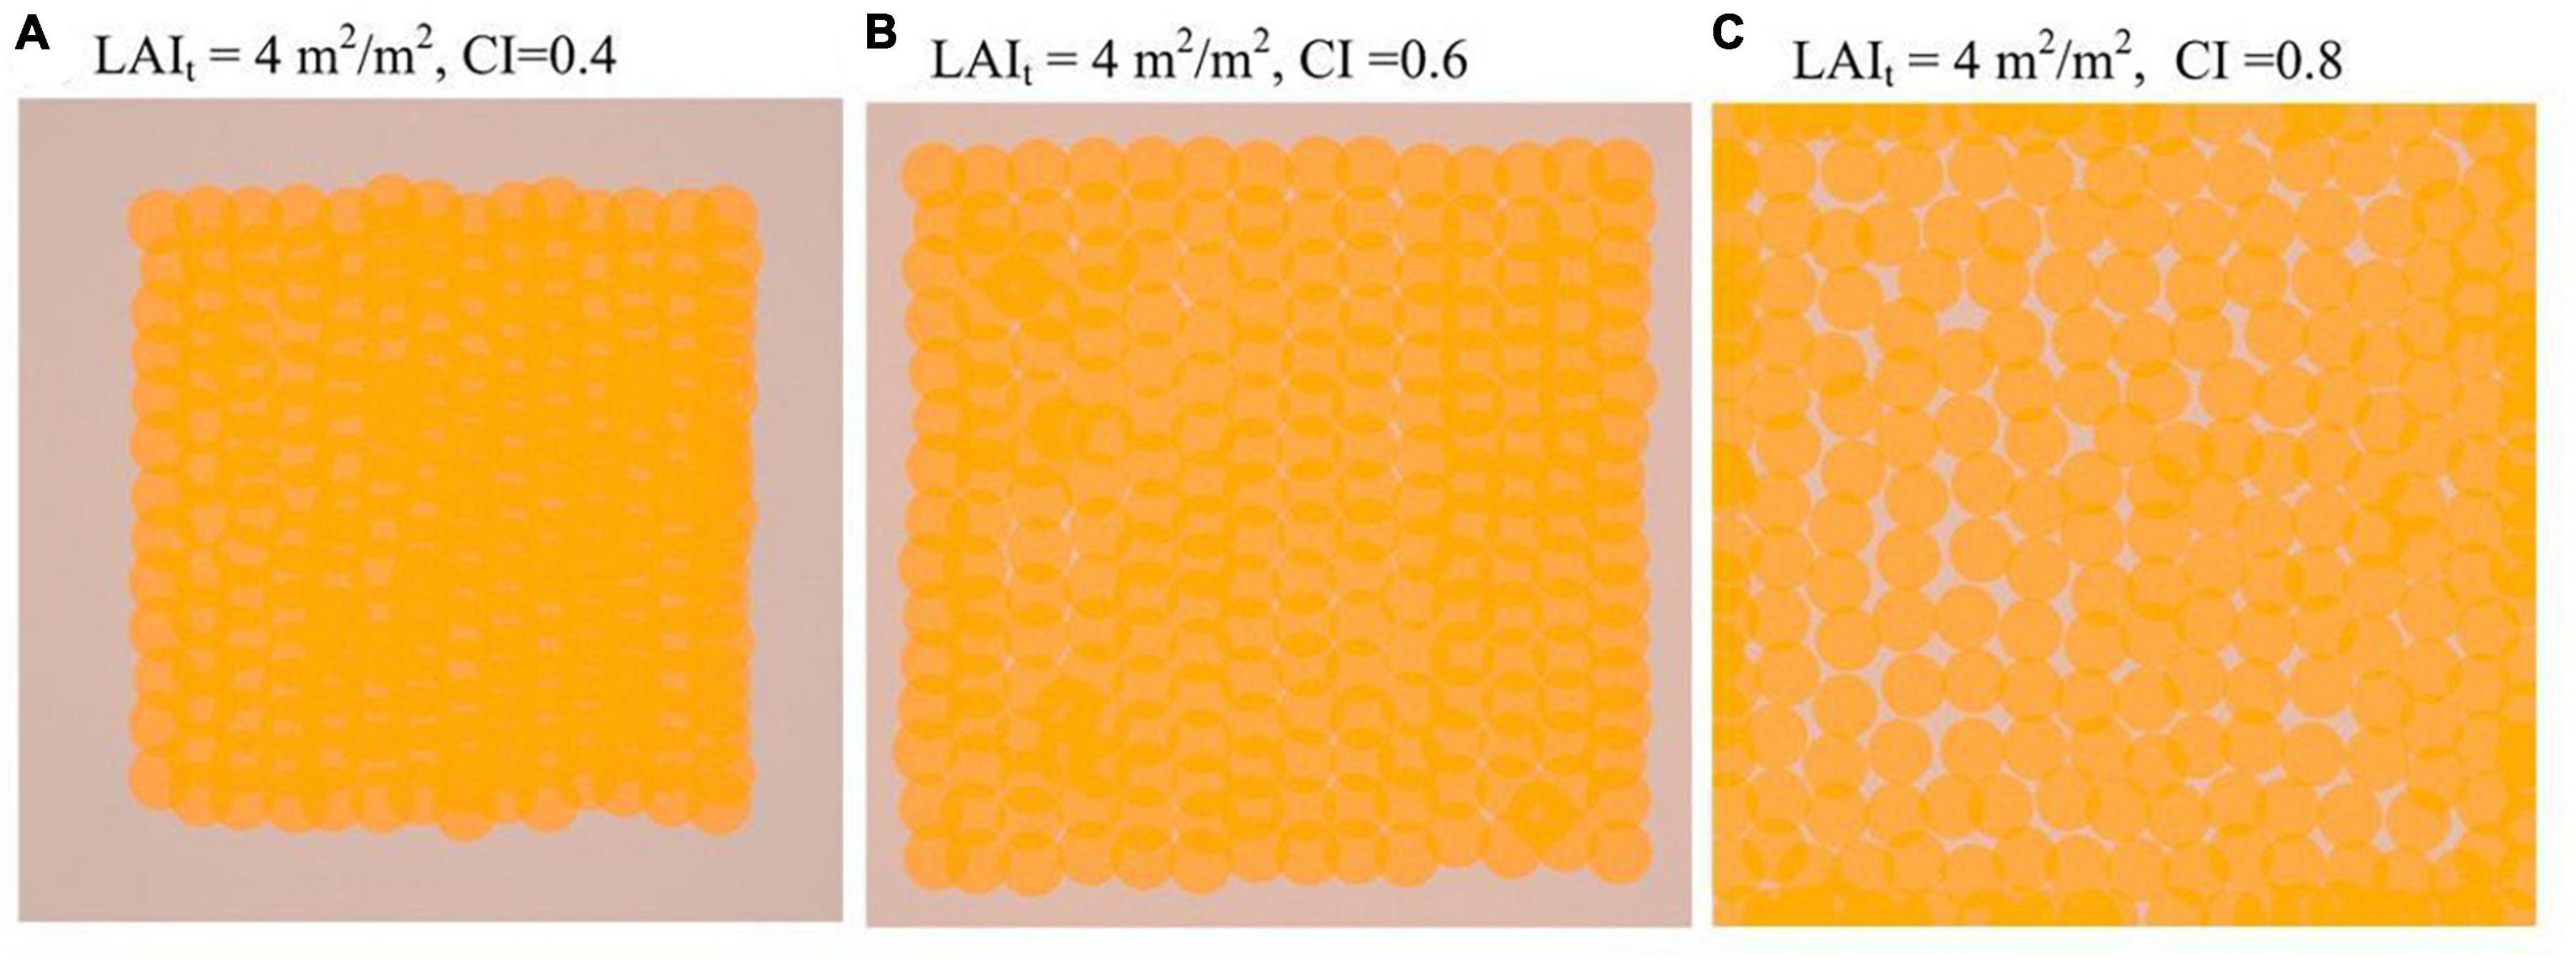
Figure 3. Top-view of the 3D forest scenes generated with a true leaf area index (LAIt) of 4 m2/m2 and a clumping index of (A) 0.4, (B) 0.6, and (C) 0.8.
The CI is calculated as the ratio between effective LAI and true LAI using the following equation (Chen et al., 2019):
where LAIe is the effective LAI and LAIt is the true LAI. The CI, Ω, is therefore a correction factor required to convert LAIe to LAIt. The LESS model calculates the LAIt of the scene, which is also known according to field measurements. To construct forest scenes of three different CIs, we calculated the LAIe from the simulated total gap probability by directly inverting the Beer’s law and using the following equation (Hu et al., 2018):
where θ is the sun zenith angle (SZA), P(θ) is the canopy gap probability, and G(θ) is the leaf projection coefficient.
The average gap probability of forest scenes was calculated from the four-component images using the following equation:
where PixelNum is the total number of pixels in the forest scene, Kg is the fraction of sunlit soil (i.e., band 2) and Kz is the fraction of shaded soil (i.e., band 4) in the four-component images simulated by the LESS model. Detailed model input parameters of the forest scenes with different CIs were given in Table 1.
2.4.3. Directional canopy reflectance simulation
The LESS model is based on ray-tracing algorithms, and the reflectance of the simulated scene can be obtained at each viewpoint. To analyze the influence of clumping on forest canopy reflectance, we simulated canopy reflectance in the red and NIR bands in the principal plane and cross principal plane with different clumping status assumptions. Details about the basic structures, the optical properties of scene components, and the illumination geometry inputs for the LESS model could be found in Table 2.
3. Results
3.1. Comparison of clumping effect on canopy BRDF in the (cross) solar principal planes
The directional canopy reflectance simulated by the LESS model along with the VZA (−60° to 60° with a 10° interval) showed high consistency with the BRDF calculated from MCD43A1 data in the principal plane for the pixel where the sample plot was located, with an R2 of 0.97 and an RMSE of 0.03 in the red band and an R2 of 0.94 and an RMSE of 0.05 in the NIR band (Wu et al., 2022).
The general pattern of how canopy reflectance changes with SZA was similar for canopies with the same canopy structure (Figure 4). However, there was considerable variability in terms of the magnitude and shape of the seasonal variations of BRDF for the same canopy in different observation planes and with different degrees of canopy aggregation. Figure 4 shows how canopy reflectance changes with SZA (−60° to 60° with a 10° interval) for the red and NIR bands along the solar principal plane and cross the solar principal plane with different CIs.
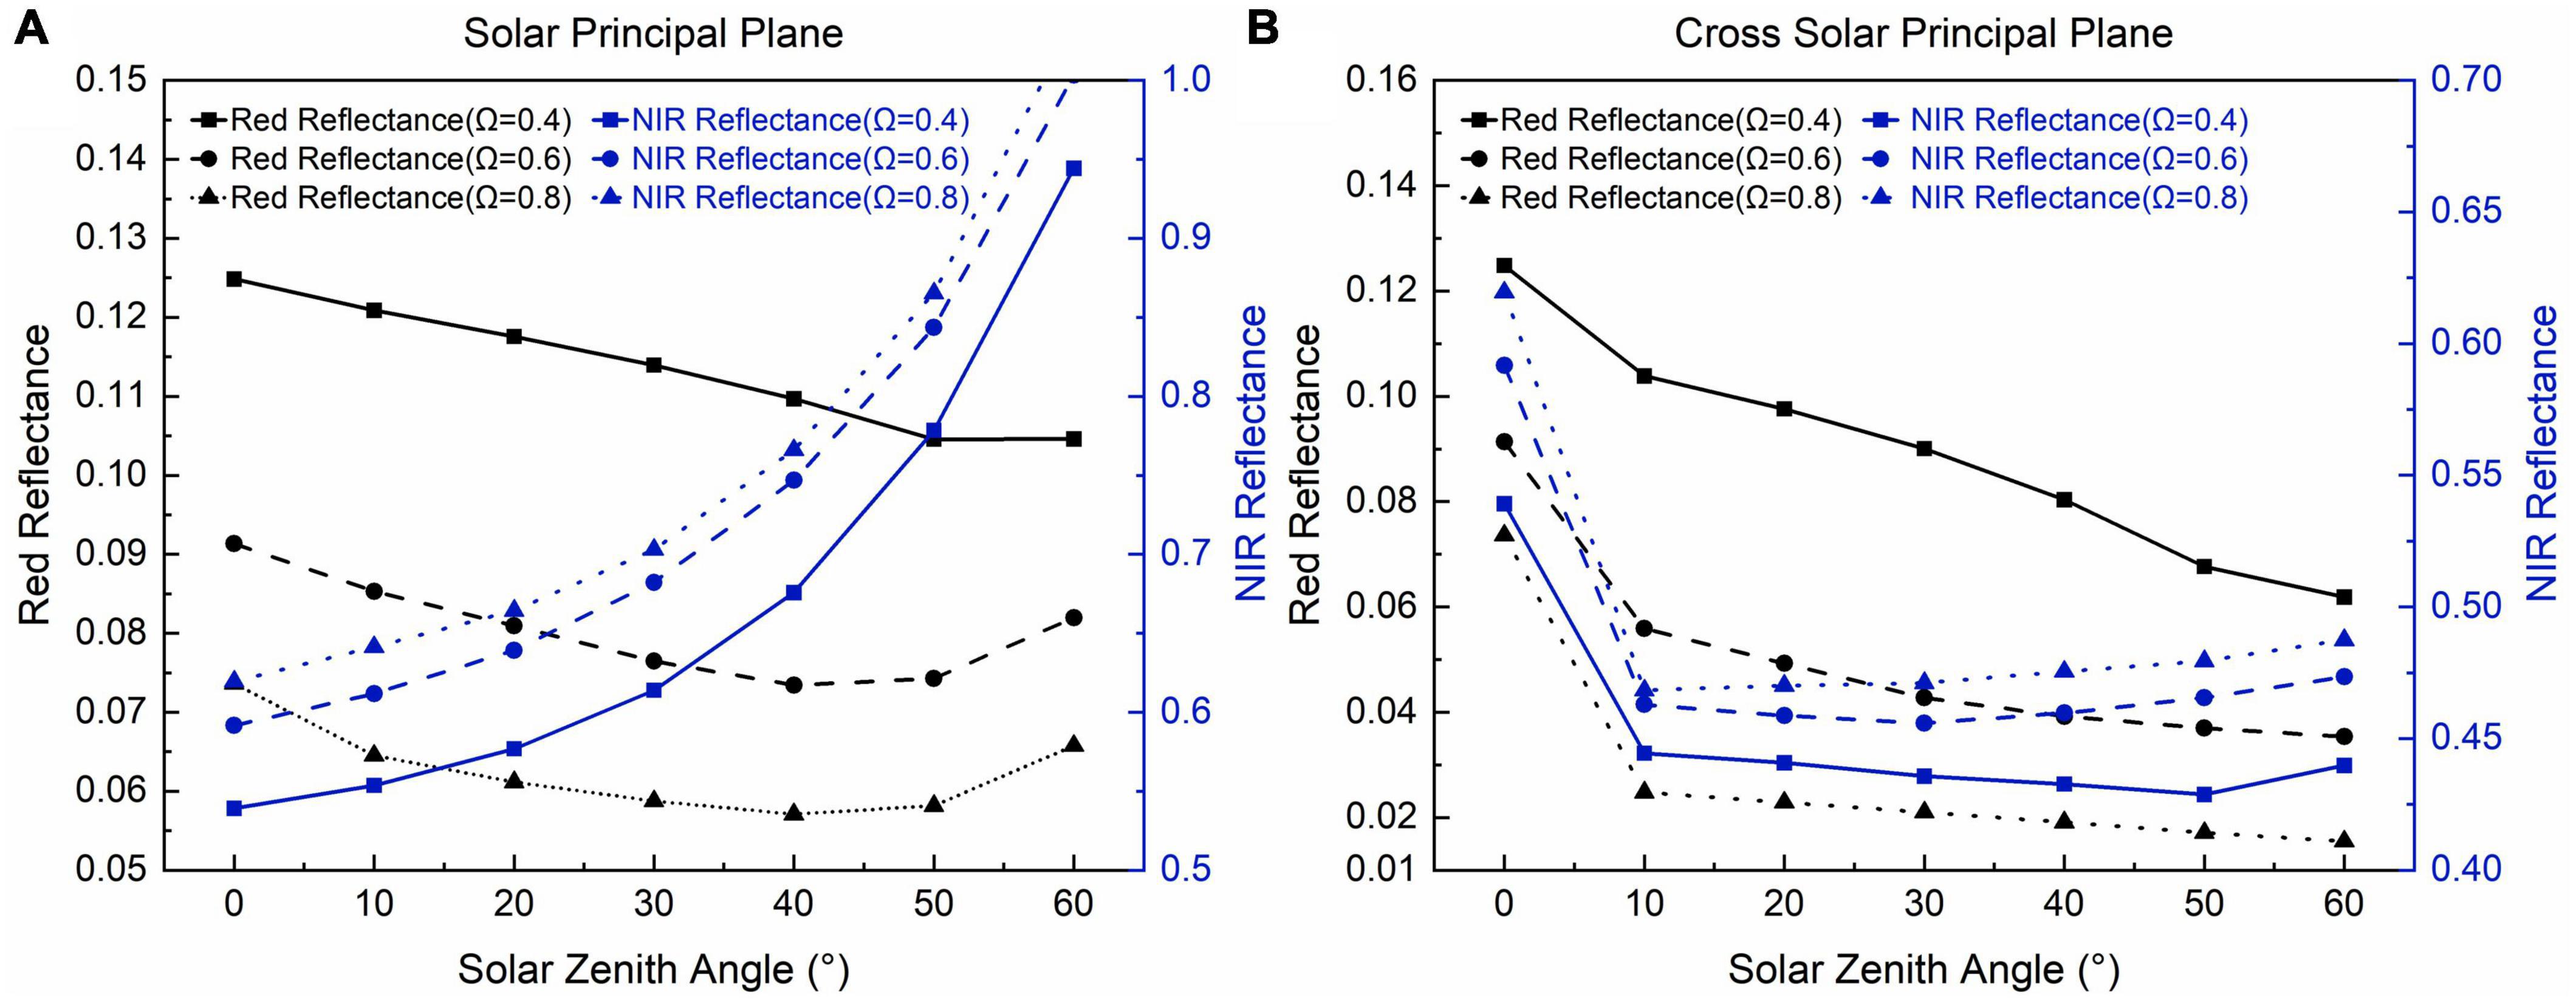
Figure 4. Comparisons of the canopy reflectance in the red and NIR band with different values of sun zenith angle (SZA) and the clumping index (CI) in (A) the solar principal plane and (B) the cross solar principal plane, respectively.
In the solar principal plane, the multi-angle bidirectional reflectance factor (BRF) in the red band decreased with the SZA (Figure 4A). However, canopy reflectance in the red band increased slightly at large SZA (e.g., when SZA increased from 50° to 60°) and such a phenomenon is even more pronounced in less clumped forest canopies (with a CI of 0.6 and 0.8) than highly clumped forests (with a CI of 0.4). In the NIR band, the BRF of highly clumped canopies was higher than that of less clumped forests (Figure 4A). On the contrary, the canopy reflectance in the NIR band in the solar principal plane increased with both the SZA and the CI. In addition, variations in SZA have a stronger influence on the NIR reflectance than on the red reflectance, especially when SZA was larger than 40° (Figure 4A). The canopy reflectance in the NIR band in the principal plane was sensitive to changes in CI only when CI was larger than 0.6 while became insensitive in moderate clumped forests. However, the canopy reflectance in the NIR band become abnormal (>1.0) when the SZA was larger than 50°, which matches with the well-known “edge-bowl” effect of BRDF in forest canopies.
In the cross solar principal plane, as the SZA increased from 0° to 10°, the mean canopy reflectance in the red and the NIR bands dropped by 60% (from 0.1 to 0.04) and 21% (from 0.58 to 0.46), respectively (Figure 4B). The red reflectance decreased rapidly when the SZA increases from 0° to 10° and continued to decrease afterward with a much slower changing speed. In contrast, the NIR reflectance increased with the SZA when SZA was larger than 10°. In the cross solar principal plane, the canopy reflectance in the red band decreased with the CI, while the canopy reflectance in the NIR band increased with the CI, which is consistent with the results in the principal plane.
We calculated the seasonality of SZA for the study site based on the MODIS Aqua satellite transit time (13:29:58 pm daily) and the latitude and longitude (100°15′E, 38°32′N) of the Dayekou Guantan forest station. The SZA first decreased from the maximum value of approximately 60° in January to a minimum value of 15° in June and then increased to larger than 60° in December again (Figure 5).
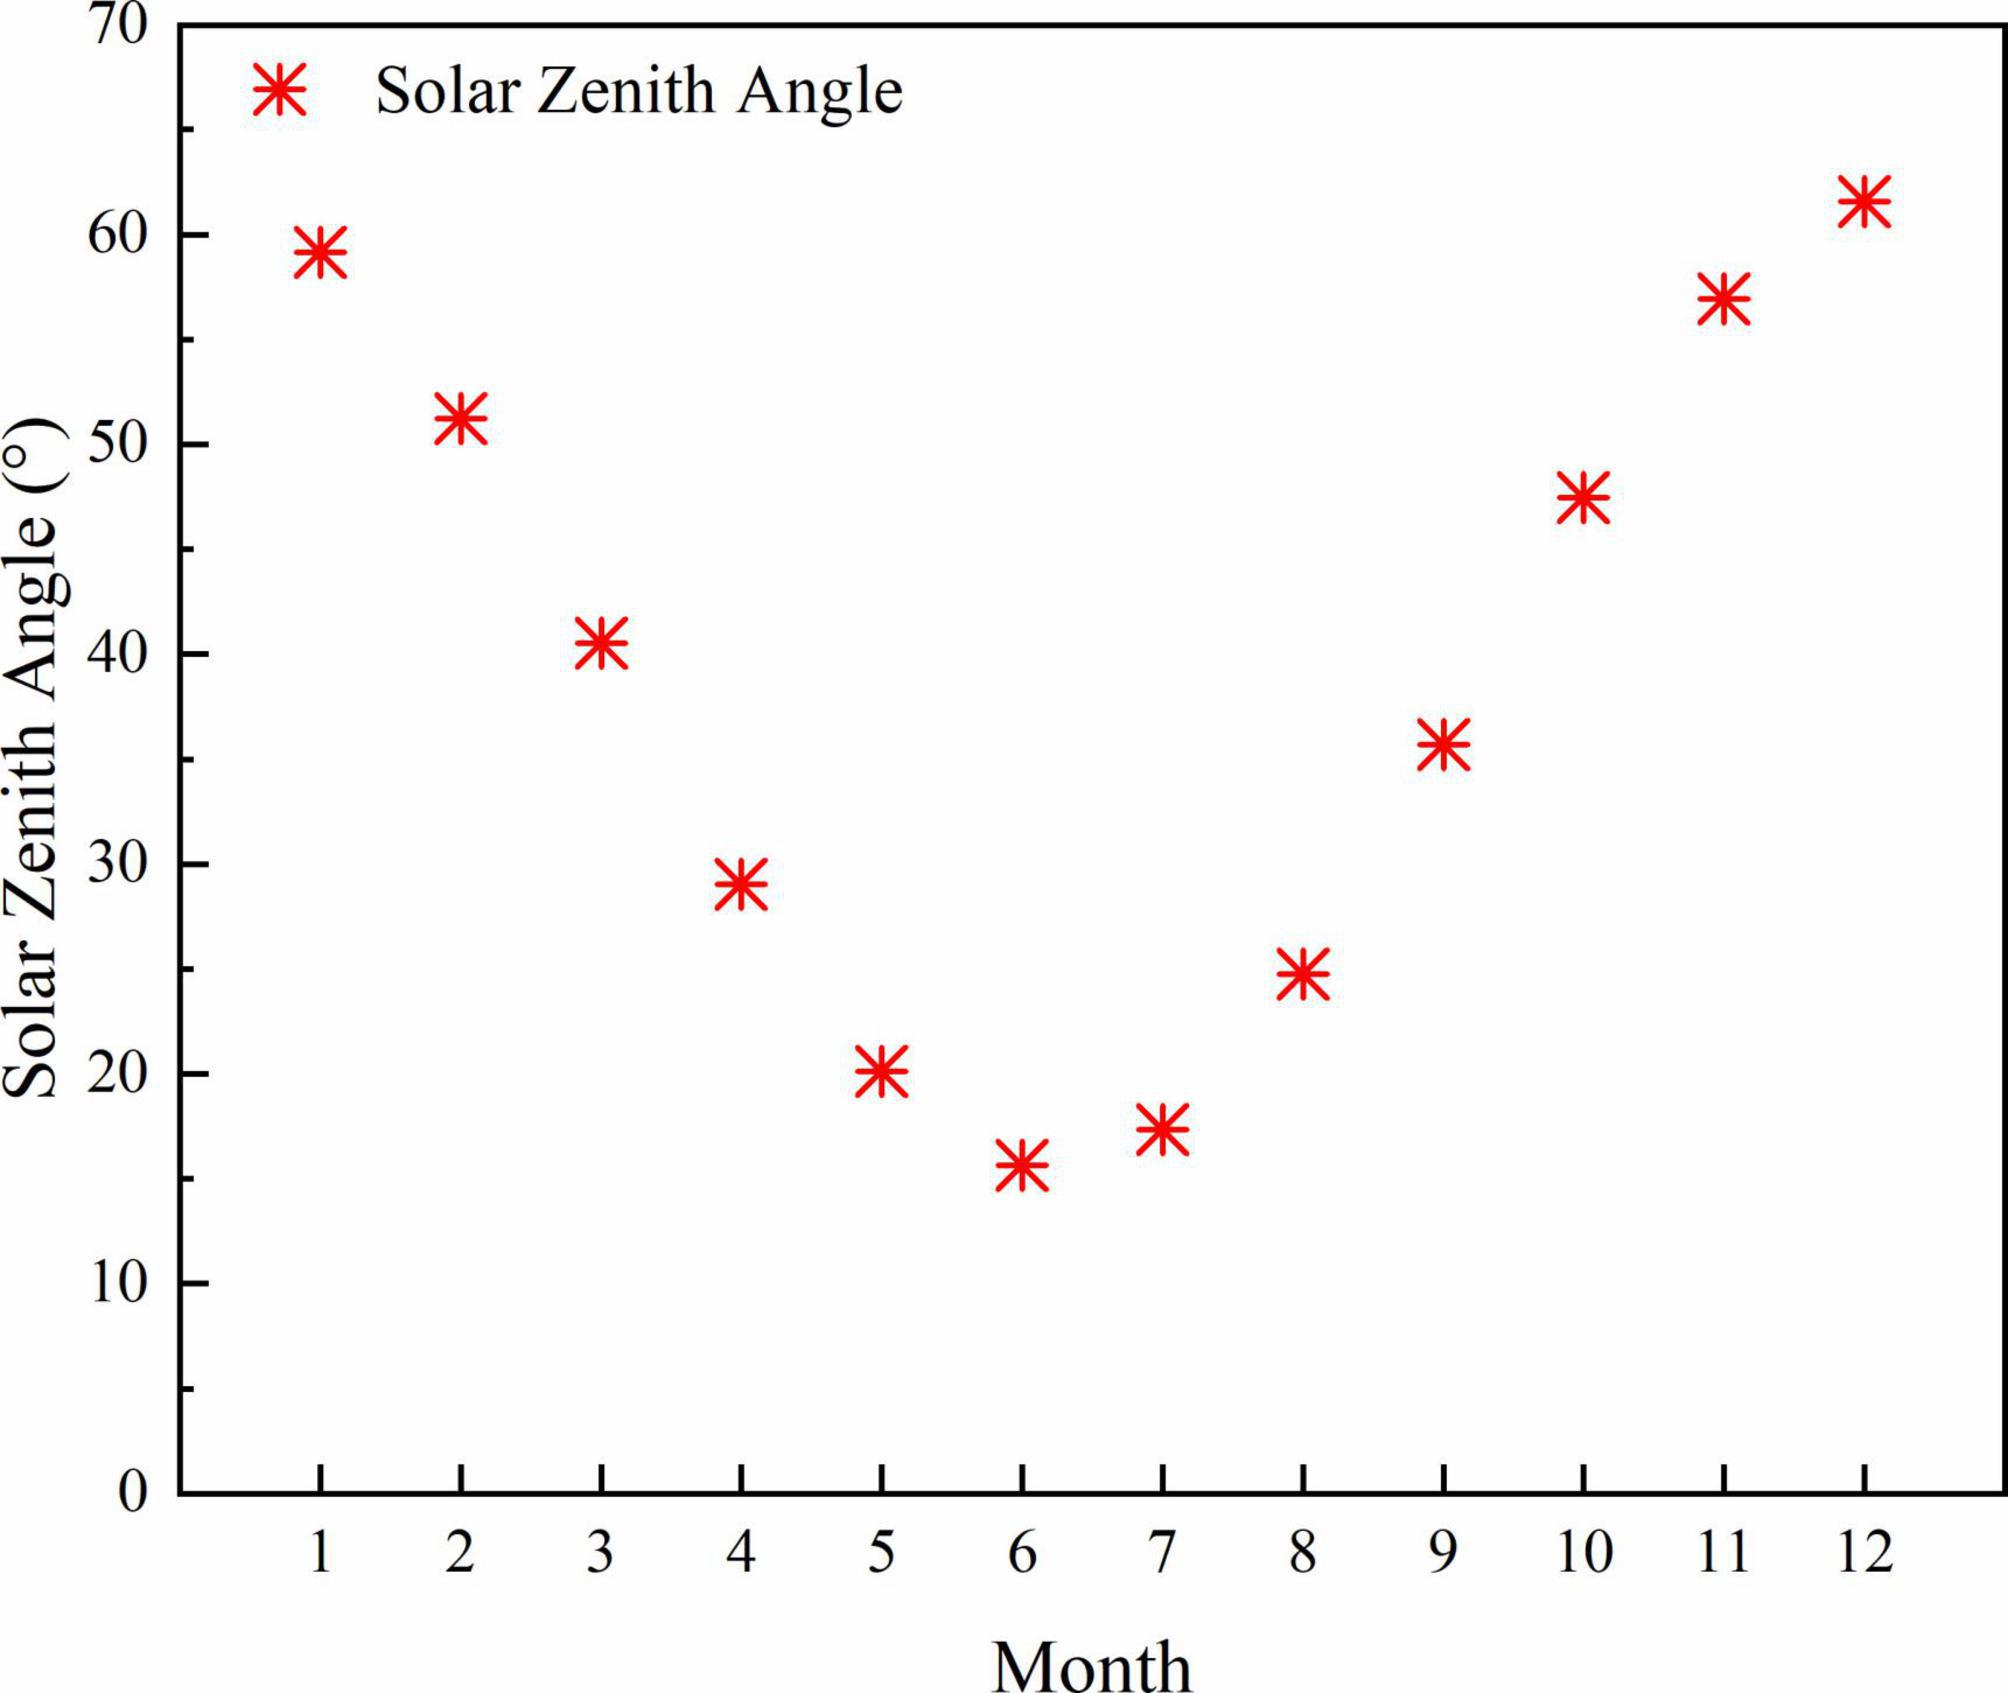
Figure 5. Seasonal variation of the SZA at the Dayekou Guantan forest station.
In the red band, the BRFs in both the principal and the cross principal planes for canopies with different CIs were highly distinctive without overlaps (Figures 4A, B). In the NIR band, the BRFs in the solar principal plane measured with SZA <50° were sensitive to changes in CI for highly clumped forests (CI <0.6) (Figure 3A).
3.2. Impacts of changes in VZA on canopy reflectance at typical solar positions
To illustrate the difference in the red and NIR canopy BRDF with various degrees of canopy aggregation. Figure 6 compares the BRFs in the red and NIR bands for a range of VZAs (i.e., −60° to 60° with an interval of 10°) at four different SZAs (i.e., 0°, 20°, 40°, and 60°) and three different CIs (i.e., 0.4, 0.6, and 0.8) levels. The first three columns in Figure 6 represent BRDF for forest scenes with a CI of 0.4, 0.6, and 0.8, respectively. Overall, there is an enormous deviation of canopy reflectance in terms of the magnitude and shape of canopy BRDF with different SZAs, suggesting that BRDF shows different sensitivity to CI with the season.
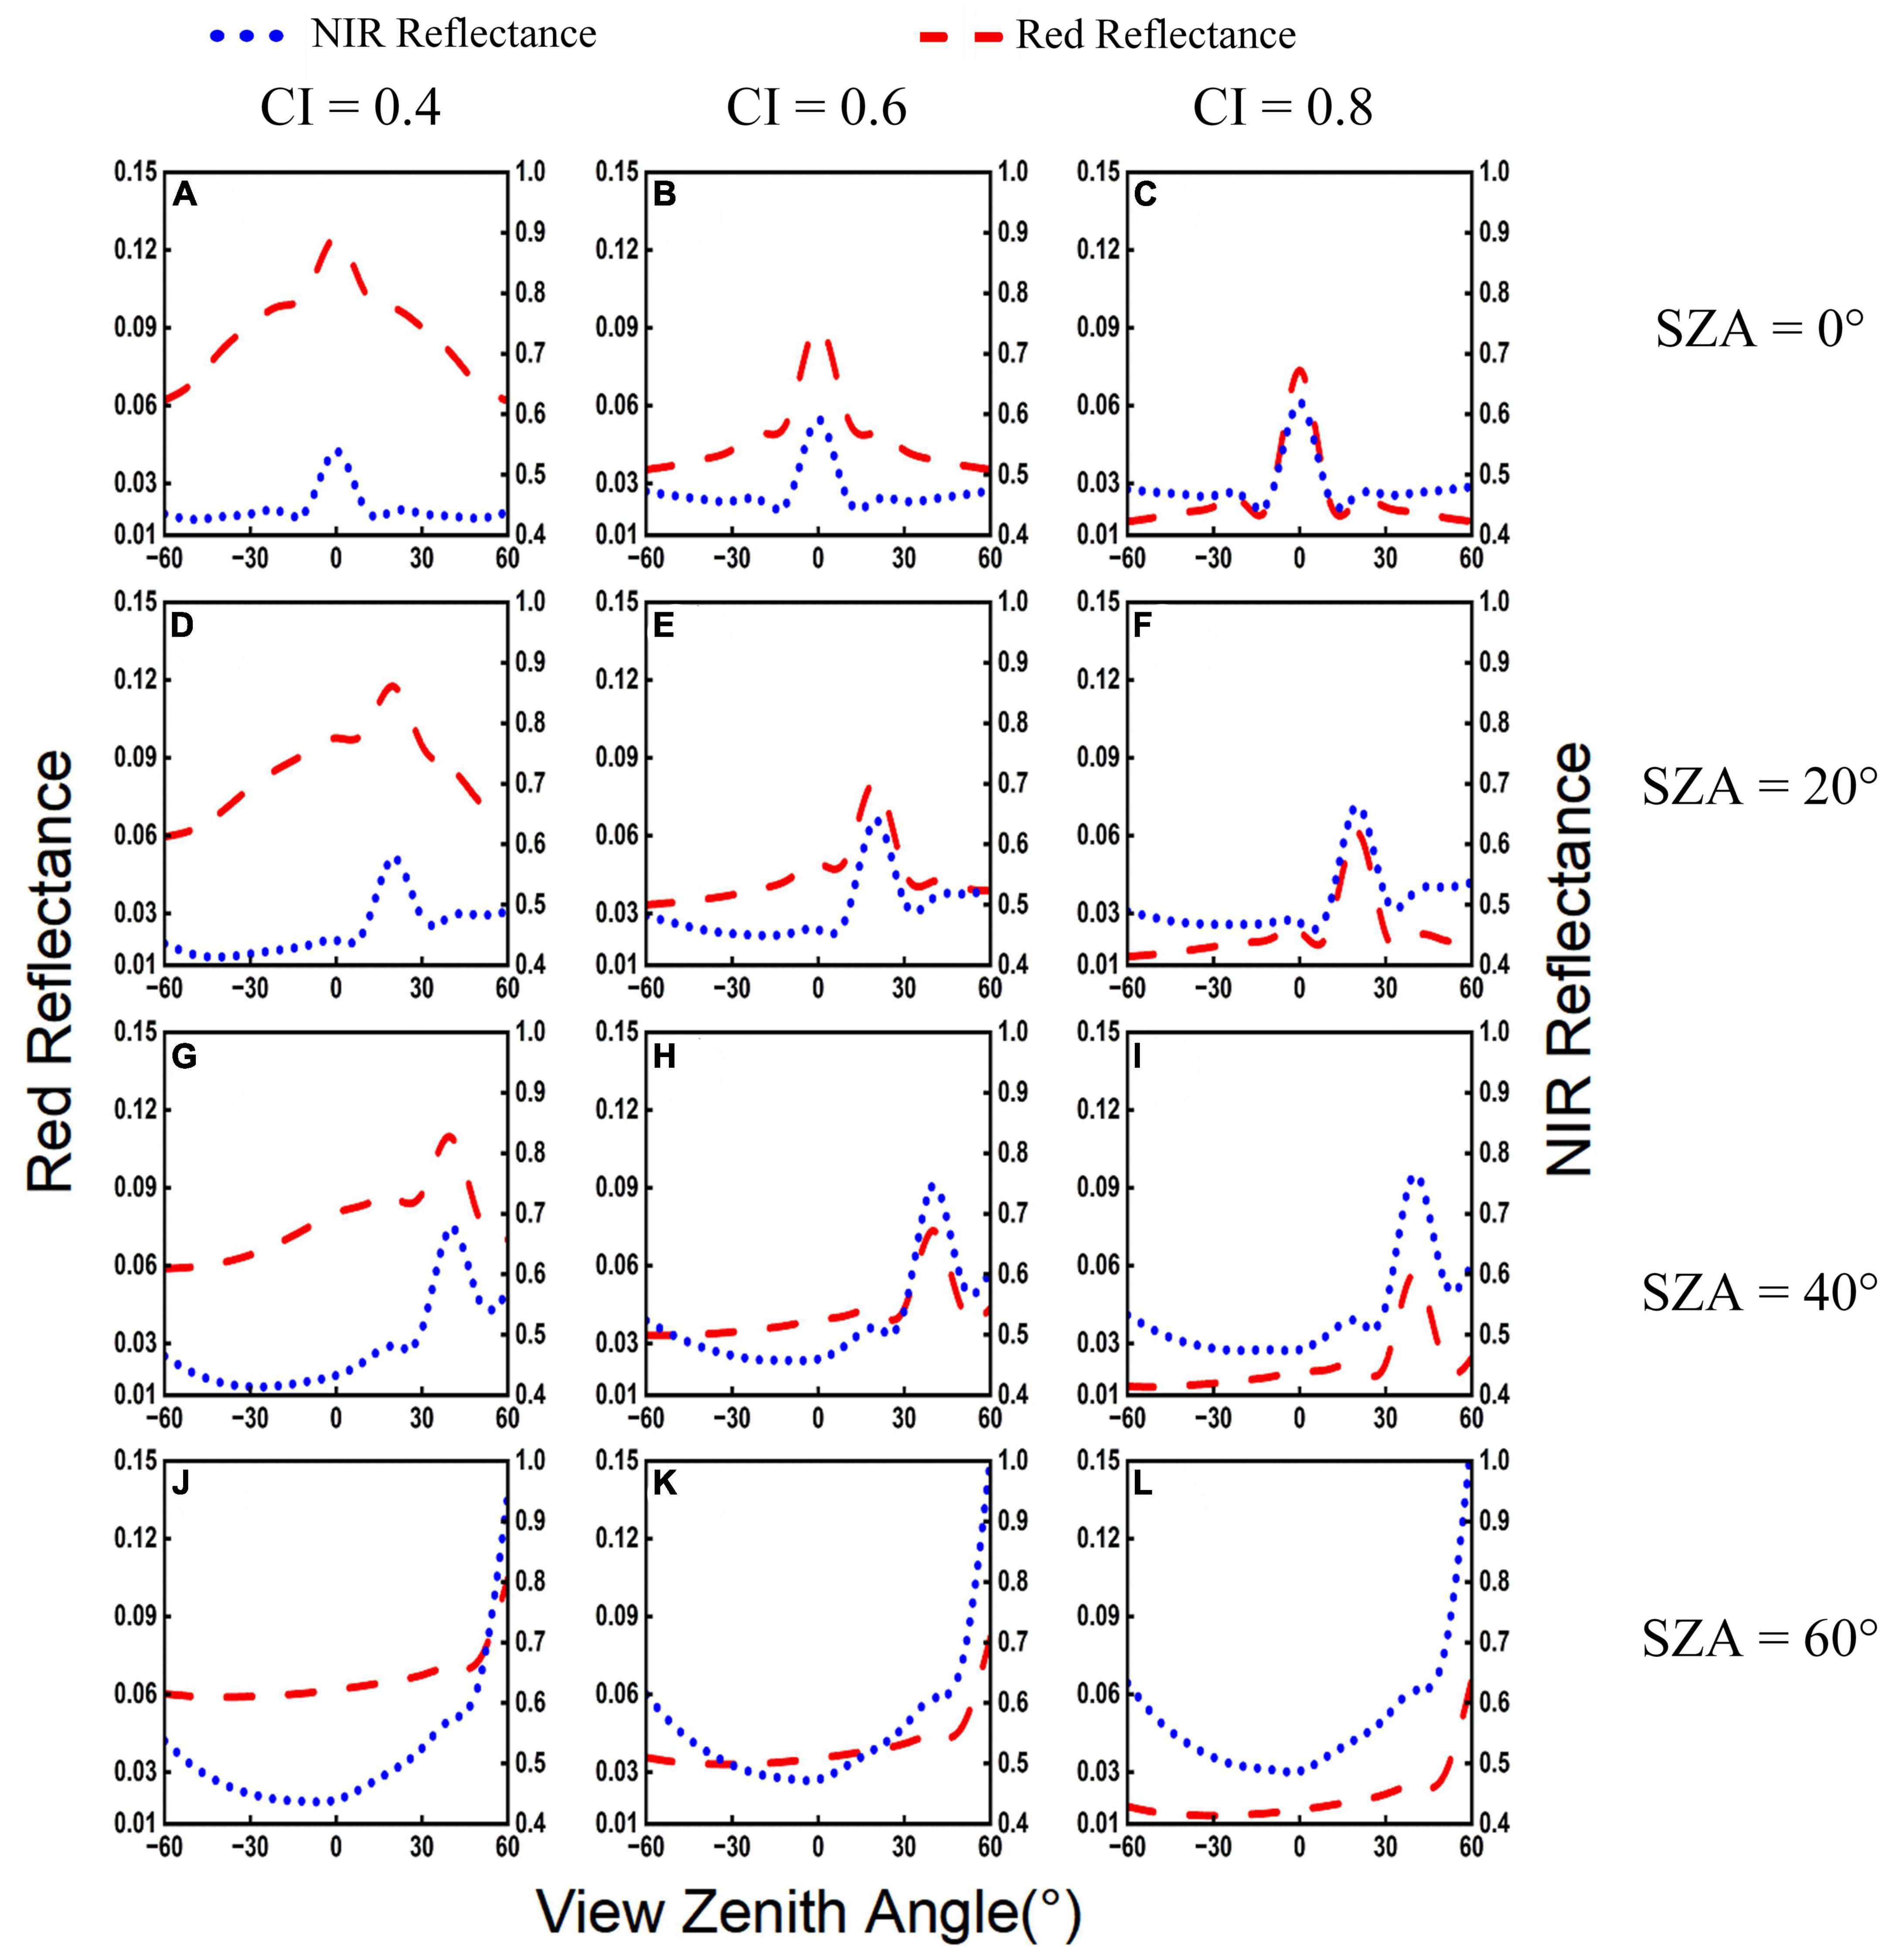
Figure 6. Comparison of the simulated directional canopy reflectance in the red and NIR bands under different clumping indexes (CIs) and solar zenith angles (SZAs): (A) CI = 0.4, SZA = 0°, (B) CI = 0.6, SZA = 0°, (C) CI = 0.8, SZA = 0°, (D) CI = 0.4, SZA = 20°, (E) CI = 0.6, SZA = 20°, (F) CI = 0.8, SZA = 20°, (G) CI = 0.4, SZA = 40°, (H) CI = 0.6, SZA = 40°, (I) CI = 0.8, SZA = 40°, (J) CI = 0.4, SZA = 60°, (K) CI = 0.6, SZA = 60°, and (L) CI = 0.8, SZA = 60°. The top row displays three forest scenes with a CI of 0.4, 0.6, and 0.8, respectively. The rightmost column exhibits corresponding SZAs for the BRDF.
We found that canopy BRDF in the red band was more sensitive to changes in CI than that in the NIR band. According to the LESS simulations, the differences in BRDF were distinguishable in the red band with various VZAs, CIs, and SZAs (Figure 6). In contrast, canopy BRF in the NIR band in the forward direction was insensitive to CI, especially for less clumped forests with higher CI (e.g., CI = 0.8) and when the VZA was larger than 30°. Canopy BRF in the backward direction along the principal plane was sensitive to changes in CI, especially at the hotspot. Canopy reflectance in the NIR band increased significantly at large VZAs when SZA was 60° with a strong “bowl-edge” effect (Yan et al., 2012), suggesting that canopy BRDF data obtained in winter was unsuitable for in-version of canopy CI.
3.3. Sensitivity of seasonal BRDF to changes in view zenith angle
To determine the sensitivity of BRDF to changes in CI, we then calculated the relative deviations of directional canopy reflectance with different CIs (Figure 7). At a specific VZA, Figures 7A, B illustrated how the canopy reflectance at different SZAs (i.e., 0° to 60° with an interval of 10°) deviated from the average value of canopy reflectance in the red and NIR band, respectively.
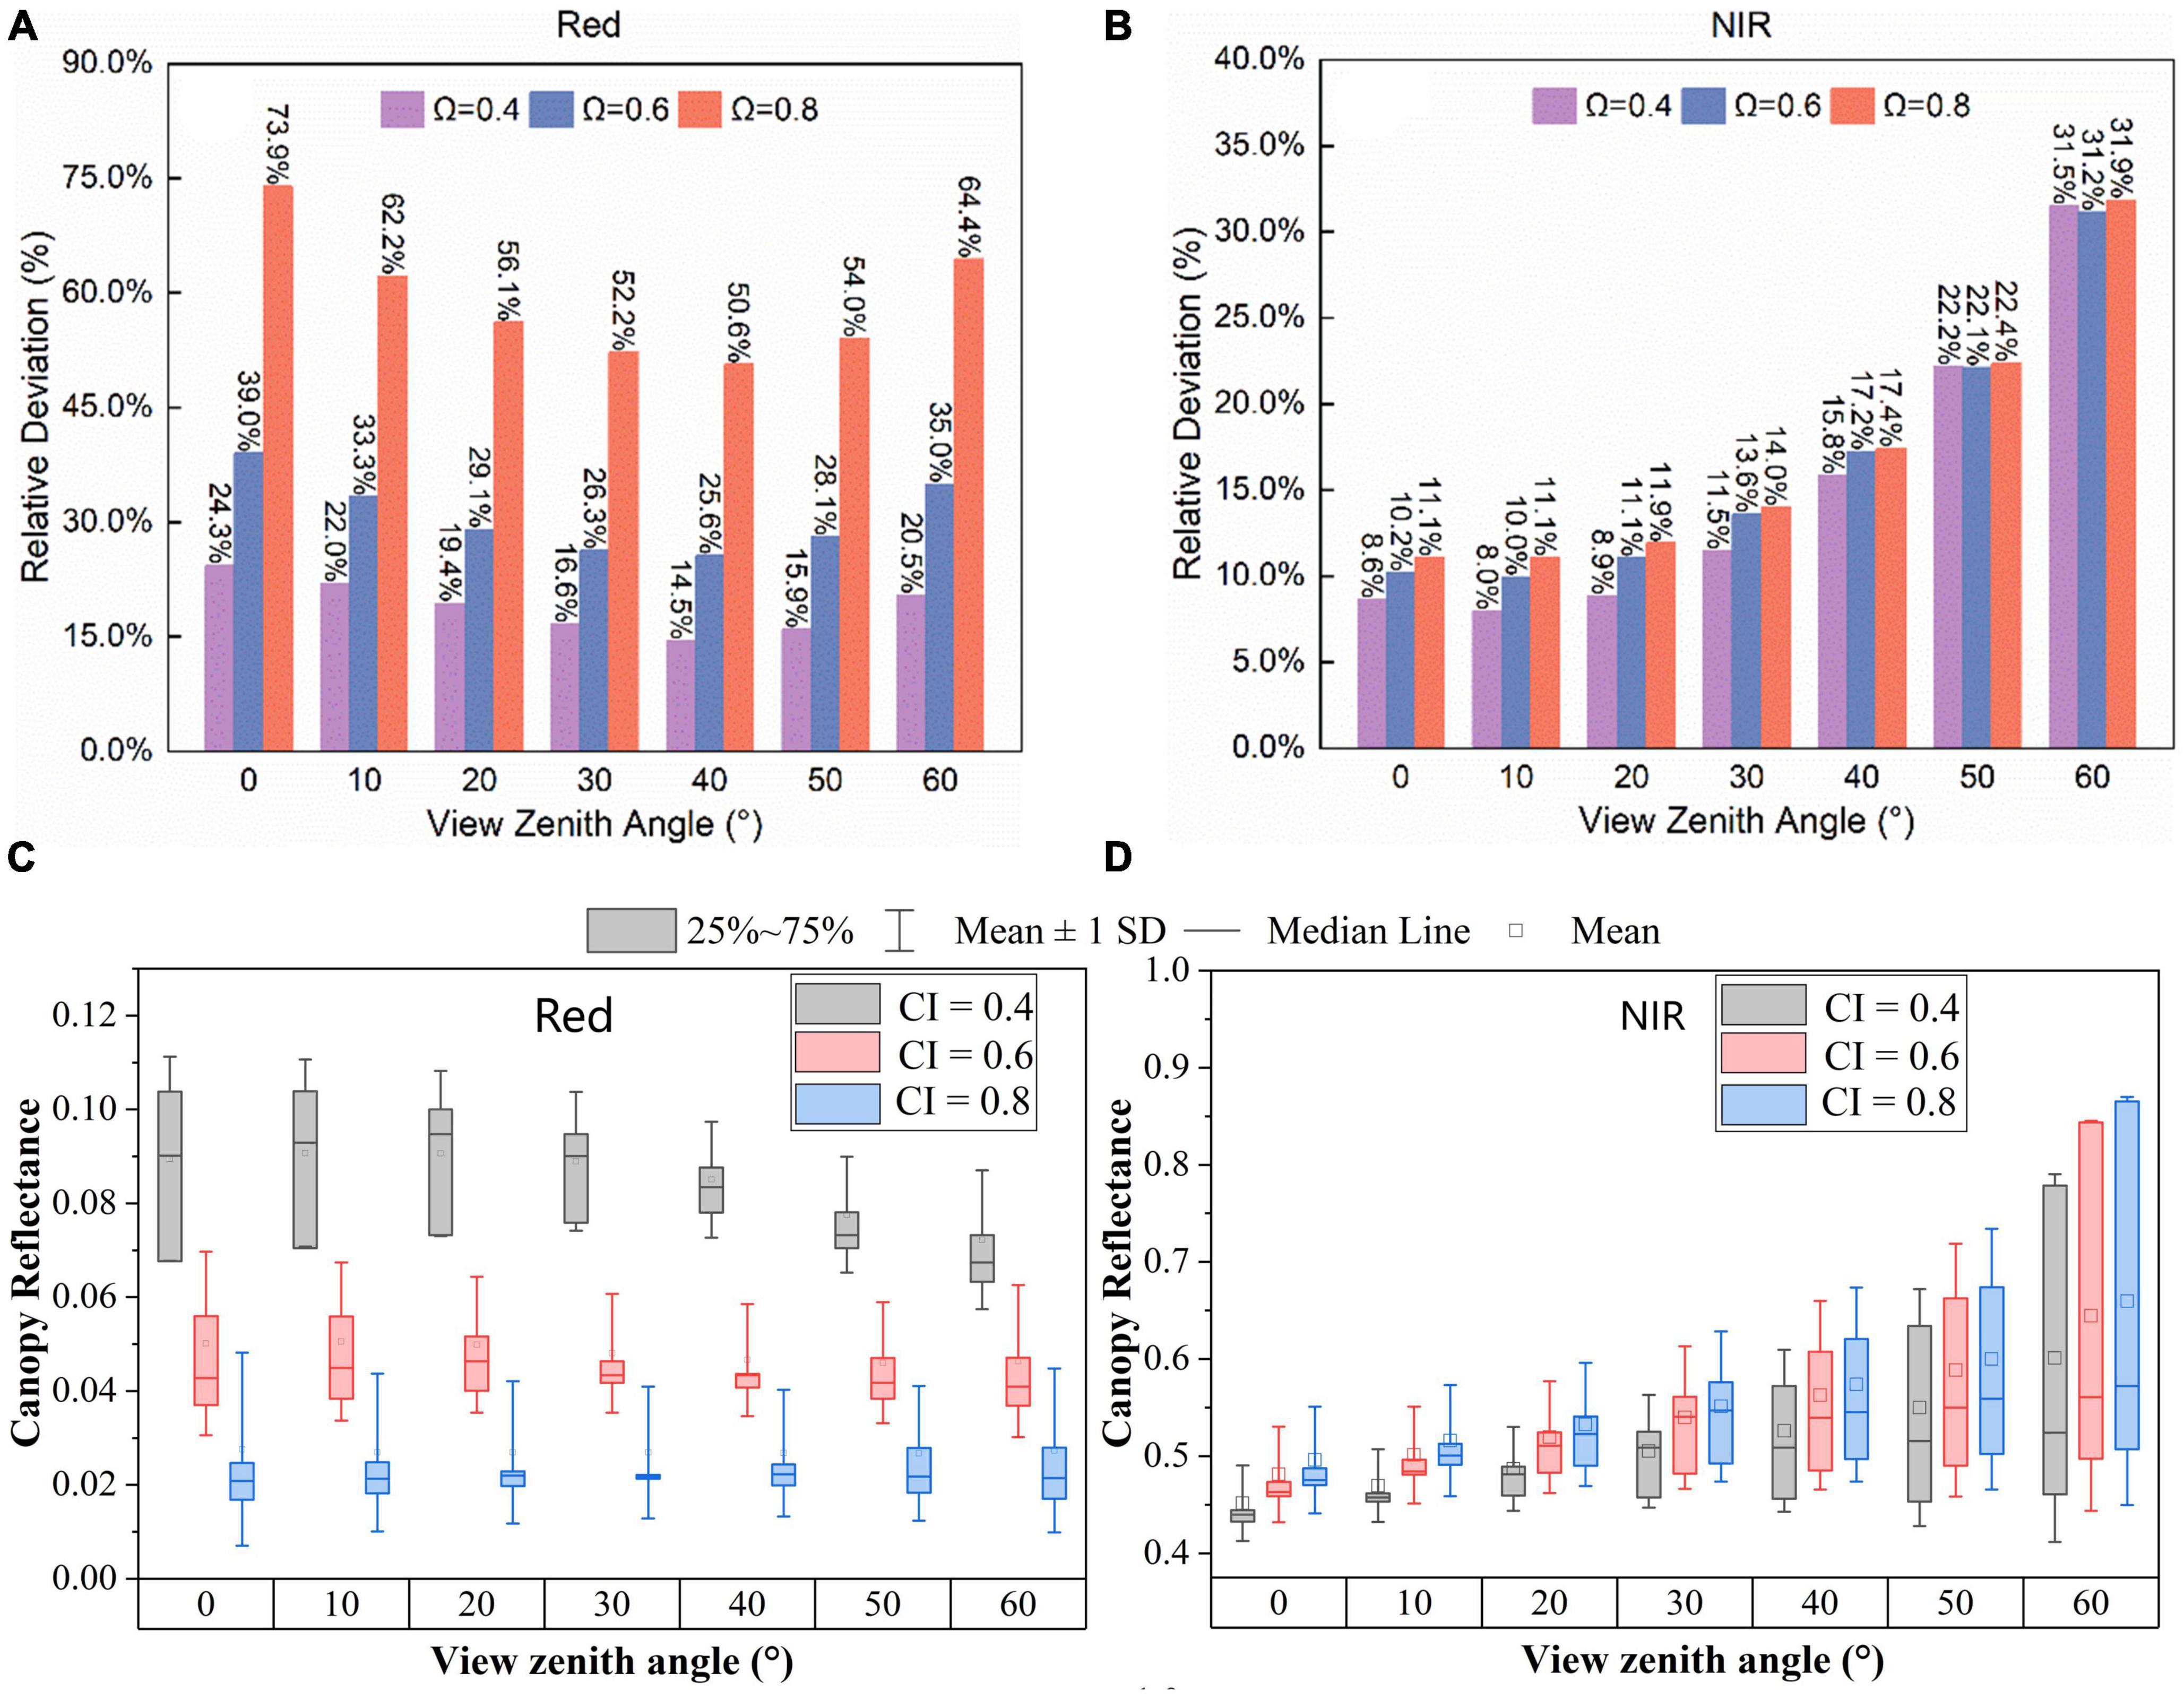
Figure 7. The relative deviation of canopy reflectance along the principal planes with SZA ranges from 0° to 60° for forest canopies with three different clumping indexes in the (A,C) red and the (B,D) NIR bands.
For canopies with different CIs, the relative deviations of canopy reflectance ranged from 14.5 to 73.9% in the red band (Figure 7A) and from 8.0 to 31.9% in the NIR band (Figure 7B). In the red band, the relative deviations of canopy reflectance were largest at the nadir view. Overall, the relative deviation of canopy reflectance in the red band was greater than that in the NIR band. Additionally, the difference in the relative deviation of reflectance between various CI at the same VZA in the red band was greater than that in the NIR band. Figure 7A showed that the relative deviation of the red reflectance decreased with VZA from 0° to 40° and increased with VZA from 40° to 60°. It was worth noting that the relative deviation of the red reflectance almost doubled when CI increased from 0.6 to 0.8 (Figure 7A) since canopy reflectance was relatively low with a mean value of 0.03 (Figure 7C). At a specific VZA, the mean canopy reflectance for highly clumped forests in the red band at different SZAs was lower than that for randomly distributed forests (Figure 7C). The mean canopy reflectance in the red band for forests with CI of 0.4, 0.6, and 0.8 was 0.08, 0.05, and 0.03, respectively (Figure 7C). In addition, the distribution of directional canopy reflectance in the red band almost has no overlaps for canopies with different CIs, suggesting that the canopy reflectance in the red band was sensitive to changes in CI. When VZA was approximately 40°, the relative deviation of the red reflectance reached the minimum value, suggesting that the impacts of changes in SZA on canopy reflectance in the red band were relatively low when viewed from this direction.
As illustrated in Figure 7B, the relative deviation of NIR reflectance gradually increased with VZA. Specifically, the relative deviations of NIR reflectance at various CI increased slowly when the VZA increased from 0° to 20°. When VZA was larger than 30°, the relative deviation of canopy reflectance increased rapidly and reached the maximum value of approximately 31% at a VZA of 60°. Thus, the sensitivity of canopy reflectance to changes in SZA in the NIR band got enhanced with increasing VZAs (Figure 7B). In addition, the canopy reflectance in the NIR band measured in forests with different CIs overlapped at larger VZAs (Figure 7D), suggesting that NIR reflectance measured at large VZAs were sensitive to changes in sun-sensor geometries and insensitive to changes in CIs.
4. Discussion
There still exists some discrepancies between canopy BRDF simulated by the LESS model and that calculated from the MCD43A1 data (Wu et al., 2022). The simulated canopy reflectance was larger than the MCD43A1 BRDF in the NIR band while lower than the MCD43A1 BRDF in the red band (Wu et al., 2022). In terms of the relative magnitude and BRDF shape in evergreen forests, the dependency between the simulated directional canopy reflectance and BRDF calculated from MODIS observations in this study was reasonable compared with the model simulations and satellite observations as reported by previous studies (Jiao et al., 2016). There still exists some uncertainties in the initial input parameters for the LESS model. When simulating canopy BRDF, the input parameters of the LESS model were determined by field data collected in the super sample plot with a size of 100 m × 100 m, which only reflects part of the simulation scene (500 m × 500 m). Thus, the incompatible pixel size of forest scenes could partly explain the differences between model simulations and satellite observations. Furthermore, it is difficult to determine the vegetation-to-bare-soil ratio on the forest floor based on the underlying surface field-measured data. The simulation results of the LESS model might also be impacted by the reflectivity of the underlying vegetation. For example, an overestimation of understory vegetation LAI could result in an overestimation of the simulated BRDF in the NIR band and an underestimation of the simulated BRDF in the red band (Chen et al., 2022).
As one of the main factors that determine sun-sensor geometry, the solar position is crucial to the simulation of canopy reflectance. The lower the SZA, the smaller the heating surface area, the more concentrated light-heat, and the greater the solar radiation intensity; conversely, the higher the SZA, the larger the heating surface area, the more dispersed light-heat, and the lesser the solar radiation intensity. This study investigated how the canopy reflectance change with the SZA by accounting for the clumping effect in the LESS model. Results showed that regardless of the canopy clumping effect, changes in SZA will cause a corresponding difference in canopy BRDF. More specifically, the hotspot would migrate to the sun position (Figure 6). As SZA increased from 0° to 60°, the hotspots for canopy BRDF in the red and NIR band progressively shift from 0° to 60° with a dome or bowl shape. Furthermore, the maximum reflectance at the hotspot displayed a downtrend in the red band and an uptrend in the NIR band as the SZA increased. The main reason was that when the SZA increased, the crown gap probability increased, resulting in greater reflectance in the NIR band.
The canopy reflectance in the red band decreased as the CI increased, whereas the reflectance in the NIR band increased as the CI increased (Figure 4). The difference in canopy BRDF when SZA was 0° and 60° was significant, this could partly explain why SZA observations at 0° and 60° were typically selected to invert CI when employing remote sensing products (Wei and Fang, 2016). The CI change effect on canopy reflectance was substantially stronger in the red band than in the NIR band (Figures 4, 7). This explains why the red band performs better for CI estimation than the NIR band, and why the red band has also been used for global CI estimation (Hill et al., 2011). These results were consistent with the contrasting leaf optical properties in the red and NIR spectrum. Due to the strong multi-scattering effect of leaf reflectance in the NIR band, leaf reflectance in the NIR band was much higher than that in the red band. In contrast, leaf absorption was high, and the leaf reflectance was low in the red band with a marginal multi-scattering effect. However, canopy reflectance tended to be more easily influenced by atmospheric contamination in the red band than in the NIR band. Under the assumption that the BRDF curve is free of atmospheric contamination, simulation using the 5-Scale model indicates that the NIR band performs marginally better than the red band in retrieving CI (Chen and Cihlar, 1995).
As the VZA increased, the magnitude of canopy reflectance in the NIR band changed more significantly than that in the red band. However, the relative deviation of canopy reflectance in the NIR band was lower than that in the red band (Figure 6). These results revealed that the BRDF effect of canopy reflectance differed in the visible and NIR spectrum, with a stronger anisotropy effect in the red band and a lower anisotropy effect in the NIR band. Sandmeier provides a comprehensive analysis of the mechanisms underlying the differences in the spectral impact of canopy reflectance (Sandmeier et al., 1998). Weak absorption and high reflectance and transmittance of vegetation leaves in the NIR band result in enhanced multi-scattering effects within the canopy, reducing the anisotropy of vegetation in this band. The strong absorption of chlorophyll by the vegetation in the red band makes the vegetation more anisotropic in this band. As discussed above, changes in CI and sun-sensor geometries had significant impacts on canopy reflectance in the red band, while changes in VZA were the prominent factor affecting canopy reflectance in the NIR band. Therefore, a more comprehensive analysis was required to better understand canopy BRDF. For example, changes in other canopy structural parameters (Song et al., 2007), leaf optical properties (Wu et al., 2018), the impacts of understory vegetation on background reflectance (Li et al., 2021), and the complicated clumping effect at different scales (e.g., shoot to branch scale) (Chen et al., 2022) could also impact on canopy reflectance and worth for more attention.
Clumping indexes show a strong dependence on SZA (Chen et al., 2012). Previous studies proved that high uncertainties of CI can be introduced when the BRDF model and SZA are not properly configured (Wei and Fang, 2016). Global to regional CI data were generally estimated using a constant SZA (e.g., 0°, 60°, and 45°). For example, the MODIS CI data was estimated from the RossThick-LiSparse Reciprocal model with a fixed SZA at 0° (He et al., 2012, 2016). The MISR regional CI used the Rahman-Pinty-Verstraete model with four parameters and a fixed SZA at 60° (Govind et al., 2013). This BRDF and SZA configuration underestimated CI for small to medium-clumped vegetation, while overestimated the CI for lightly clumped and sparsely vegetated areas (Wei and Fang, 2016). The MODIS CI estimated by Jiao et al. (2018) fixed the SZA at 45° to calculate the normalized difference between hotspot and darkspot reflectance (NDHD). According to the LESS simulations, canopy reflectance measured in the direction of VZA = 40° in the red band (Figure 7A) and VZA = 0° in the NIR band (Figure 7B) showed the lowest sensitivity to changes in SZA compared with other VZAs. This finding may help explain why 45° and 0° are typically selected for CI retrievals. Compared with field measurements of CIs at 48 global validation sites, the MODIS CI derived using the NDHD method with SZA = 45° and VZA = 45° (which is very close to 40°) have the highest accuracy compared with other VZAs (Jiao et al., 2018). Thus, selecting a VZA of approximately 40° in the red band and a VZA of 0° in the NIR band could potentially reduce the estimation uncertainty in CI caused by changes in SZA.
Only the NIR band was used for deriving the first global CI map (Chen et al., 2005). However, our results showed that canopy reflectance in the red band was more sensitive to changes in CI than in the NIR band (Figure 4). Later, the red band BRF has been successfully applied for regional CI mapping based on the MISR data (Govind et al., 2013). He et al. (2012) also reported that CIs retrieved from the red band are more accurate than those from the NIR band for dense forests, which further supports our findings. NIR was less sensitive to vegetation structure because the strong multiple scattering effects in NIR within vegetation decrease the shadow darkness (Chen et al., 2005). In addition, we found that the NIR band shows stronger dependence on SZA than the red band (Figure 4), which is in accordance with Chen et al. (2012). Considering the stronger influence of exposed soil in the red band than the NIR band (Li et al., 2021), a more oblique SZA (e.g., 40−60°) may help suppress the influence of the background when estimating CI for sparse forests.
5. Conclusion
Based on ground-measured data, this paper constructed a 3D forest canopy scene using the LESS model and quantitatively analyzed how canopy reflectance change under different influencing factors, including CI, SZA, and VZA. We found that the BRDF simulated by the LESS model matched well with the BRDF estimated from the MODIS MCD43A1 data based on the RTLSR semi-empirical kernel-driven BRDF model. As the CI increases from 0.4 to 0.6, the canopy reflectance decreased in the red band while increasing in the NIR band. Moreover, we found that canopy reflectance in the red band was more sensitive to changes in CI than in the NIR band. Although the strong atmospheric effect in the red band may lead to uncertainties in CI estimations, we strongly recommend including the clear-sky observations in the red band for CI retrievals considering its high sensitivity to changes in CI. The LESS simulations suggested that the BRFs in the red band measured at different SZAs and VZAs were all helpful for CI inversion, and the BRFs in the NIR band along the solar principal plane measured during growing seasons (from April to September) were sensitive to changes in CI for highly clumped forests (CI <0.6). Canopy BRFs in the NIR band in the backward direction along the principal plane were sensitive to changes in CI, especially at the hotspot. In contrast, canopy BRF in the NIR band in the forward direction was insensitive to CI, especially for less clumped forests with higher CI (e.g., CI = 0.8) and when the VZA was larger than 30°. To take full advantage of satellite data measured in different seasons, changes in SZA need to be considered. The relative deviations of directional canopy reflectance with different CIs at different VZAs showed different sensitivity to changes in SZA. Based on the LESS simulations, we recommend selecting a VZA of approximately 40° in the red band and a VZA of 0° in the NIR band to reduce the estimation uncertainty caused by changes in SZA. The findings of this study contribute to a better understanding of the relationship between forest canopy structural parameters and BRDF characteristics and offer a theoretical basis for the retrieval of canopy structural characteristics from multiangular remote sensing data.
Data availability statement
Publicly available datasets were analyzed in this study. This data can be found here: http://data.tpdc.ac.cn (accessed on 26 July 2023) (Liang and Luo, 2012).
Author contributions
QW: conceptualization, methodology, writing—reviewing and editing, and supervision. SY: visualization, validation, writing—original draft, and software. JJ: conceptualization and methodology. All authors contributed to the article and approved the submitted version.
Funding
This research was funded by the National Natural Science Foundation of China (grant no. 42201381) and the Fundamental Research Funds for Beijing University of Civil Engineering and Architecture (grant no. X21019).
Acknowledgments
Field measurements collected by the Watershed Airborne Telemetry Experimental Research (i.e., WATER) program in China were used in this study. The authors would like to express their appreciation for the valuable data contribution from support from the WATER program and all the researchers who performed the field survey at the super site of the Dayekou Guantan forest station. More details about the LAI change impact on canopy BRDF and comparison of modeled BRDF against MODIS BRDF can be found in our earlier publications (Wu et al., 2022).
Conflict of interest
The authors declare that the research was conducted in the absence of any commercial or financial relationships that could be construed as a potential conflict of interest.
Publisher’s note
All claims expressed in this article are solely those of the authors and do not necessarily represent those of their affiliated organizations, or those of the publisher, the editors and the reviewers. Any product that may be evaluated in this article, or claim that may be made by its manufacturer, is not guaranteed or endorsed by the publisher.
Footnotes
References
Blinn, J. F. (1998). “Models of light reflection for computer synthesized pictures,” in Seminal graphics: pioneering efforts that shaped the field, ed. R. J. Wolfe (New York, NY: Association for Computing Machinery), 103–109.
Chen, G., Liu, T. Y., Zhang, Y., Xu, L., Xie, H., and Qian, Y. (2019). Retrieval of the fraction of radiation absorbed by photosynthetic components (FAPARgreen) for forest using a triple-source leaf-wood-soil layer approach. Remote Sens. 11:2471. doi: 10.3390/rs11212471
Chen, J. M. (1996). Optically-based methods for measuring seasonal variation of leaf area index in boreal conifer stands. Agric. For. Meteorol. 80, 135–163.
Chen, J. M., and Black, T. A. (1992). Foliage area and architecture of plant canopies from sunfleck size distributions. Agric. For. Meteorol. 60, 249–266. doi: 10.1016/0168-1923(92)90040-B
Chen, J. M., and Cihlar, J. (1995). Plant canopy gap-size analysis theory for improving optical measurements of leaf-area index. Appl. Opt. 34:6211. doi: 10.1364/AO.34.006211
Chen, J. M., and Liu, J. (2020). Evolution of evapotranspiration models using thermal and shortwave remote sensing data. Remote Sens. Environ. 237:111594. doi: 10.1016/j.rse.2019.111594
Chen, J. M., Menges, C. H., and Leblanc, S. G. (2005). Global mapping of foliage clumping index using multi-angular satellite data. Remote Sens. Environ. 97, 447–457. doi: 10.1016/j.rse.2005.05.003
Chen, J. M., Mo, G., Pisek, J., Liu, J., Deng, F., Ishizawa, M., et al. (2012). Effects of foliage clumping on the estimation of global terrestrial gross primary productivity. Glob. Biogeochem. Cycles 26:1019. doi: 10.1029/2010GB003996
Chen, J. M., Xu, M., Wang, R., Li, D., Liu, R., Ju, W., et al. (2022). “Next step in vegetation remote sensing: synergetic retrievals of canopy structural and leaf biochemical parameters,” in New thinking GIScience, eds B. Li, X. Shi, A. X. Zhu, C. Wang, and H. Lin (Singapore: Springer), 207–220. doi: 10.1007/978-981-19-3816-0_23
Croft, H., and Chen, J. M. (2018). “Leaf Pigment Content,” in Comprehensive remote sensing, ed. S. Liang (Amsterdam: Elsevier), 117–142. doi: 10.1016/B978-0-12-409548-9.10547-0
Cui, L., Jiao, Z., Dong, Y., Sun, M., Zhang, X., Yin, S., et al. (2019). Estimating forest canopy height using MODIS BRDF data emphasizing typical-angle reflectances. Remote Sens. 11:2239. doi: 10.3390/rs11192239
Dalponte, M., Jucker, T., Liu, S., Frizzera, L., and Gianelle, D. (2019). Characterizing forest carbon dynamics using multi-temporal lidar data. Remote Sens. Environ. 224, 412–420. doi: 10.1016/j.rse.2019.02.018
Dickinson, R. E. (1983). Land surface processes and climate—surface albedos and energy balance. Adv. Geophys. 25, 305–353. doi: 10.1016/S0065-2687(08)60176-4
Duthoit, S., Demarez, V., Gastellu-Etchegorry, J. P., Martin, E., and Roujean, J. L. (2008). Assessing the effects of the clumping phenomenon on BRDF of a maize crop based on 3D numerical scenes using DART model. Agric. For. Meteorol. 148, 1341–1352. doi: 10.1016/j.agrformet.2008.03.011
Fang, H. (2021). Canopy clumping index (CI): A review of methods, characteristics, and applications. Agric. For. Meteorol. 303:108374. doi: 10.1016/j.agrformet.2021.108374
Fang, H., Jiang, C., Li, W., Wei, S., Baret, F., Chen, J. M., et al. (2013). Characterization and intercomparison of global moderate resolution leaf area index (LAI) products: Analysis of climatologies and theoretical uncertainties: Intercomparison of global lai products. J. Geophys. Res. Biogeosci. 118, 529–548. doi: 10.1002/jgrg.20051
Fu, Z., Wang, J., Song, J., Zhou, H., Pang, Y., Chen, B., et al. (2011). Estimation of forest canopy leaf area index using MODIS, MISR, and LiDAR observations. J. Appl. Remote Sens. 5:053530. doi: 10.1117/1.3594171
Gao, B. C., Han, W., Tsay, S. C., and Larsen, N. F. (1998). Cloud detection over the arctic region using airborne imaging spectrometer data during the daytime. J. Appl. Meteorol. Climatol. 37, 1421–1429. doi: 10.1175/1520-04501998037<1421:CDOTAR<2.0.CO;2
Gastellu-Etchegorry, J.-P., Yin, T., Lauret, N., Cajgfinger, T., Gregoire, T., Grau, E., et al. (2015). Discrete anisotropic radiative transfer (DART 5) for modeling airborne and satellite spectroradiometer and LIDAR acquisitions of natural and urban landscapes. Remote Sens. 7, 1667–1701. doi: 10.3390/rs70201667
Gibbs, H. K., and Ruesch, A. (2008). “New IPCC Tier-1 Global Biomass Carbon Map for the Year 2000,” in Environmental system science data infrastructure for a virtual ecosystem (ESS-DIVE), ed. A. Deb (Washington, DC: United States Department of Energy), doi: 10.15485/1463800
Govind, A., Guyon, D., Roujean, J. L., Yauschew-Raguenes, N., Kumari, J., Pisek, J., et al. (2013). Effects of canopy architectural parameterizations on the modeling of radiative transfer mechanism. Ecol. Model. 251, 114–126. doi: 10.1016/j.ecolmodel.2012.11.014
Gower, S. T., Kucharik, C. J., and Norman, J. M. (1999). Direct and indirect estimation of leaf area index, fAPAR, and net primary production of terrestrial ecosystems. Remote Sens. Environ. 70, 29–51. doi: 10.1016/S0034-4257(99)00056-5
He, L., Chen, J. M., Pisek, J., Schaaf, C. B., and Strahler, A. H. (2012). Global clumping index map derived from the MODIS BRDF product. Remote Sens. Environ. 119, 118–130. doi: 10.1016/j.rse.2011.12.008
He, L., Liu, J., Chen, J., Croft, H., Wang, R., Sprintsin, M., et al. (2016). Inter- and intra-annual variations of clumping index derived from the MODIS BRDF product. Int. J. Appl. Earth Observ. Geoinform. 44, 53–60. doi: 10.1016/j.jag.2015.07.007
Hill, M. J., Román, M. O., Schaaf, C. B., Hutley, L., Brannstrom, C., Etter, A., et al. (2011). Characterizing vegetation cover in global savannas with an annual foliage clumping index derived from the MODIS BRDF product. Remote Sens. Environ. 115, 2008–2024. doi: 10.1016/j.rse.2011.04.003
Hu, R., Yan, G., Nerry, F., Liu, Y., Jiang, Y., Wang, S., et al. (2018). Using airborne laser scanner and path length distribution model to quantify clumping effect and estimate leaf area index. IEEE Trans. Geosci. Remote Sens. 56, 3196–3209. doi: 10.1109/TGRS.2018.2794504
Jiao, Z., Dong, Y., Schaaf, C. B., Chen, J. M., Román, M., Wang, Z., et al. (2018). An algorithm for the retrieval of the clumping index (CI) from the MODIS BRDF product using an adjusted version of the kernel-driven BRDF model. Remote Sens. Environ. 209, 594–611. doi: 10.1016/j.rse.2018.02.041
Jiao, Z., Schaaf, C. B., Dong, Y., Román, M., Hill, M. J., Chen, J. M., et al. (2016). A method for improving hotspot directional signatures in BRDF models used for MODIS. Remote Sens. Environ. 186, 135–151. doi: 10.1016/j.rse.2016.08.007
Kimes, D. S., and Sellers, P. J. (1985). Inferring hemispherical reflectance of the earth’s surface for global energy budgets from remotely sensed nadir or directional radiance values. Remote Sens. Environ. 18, 205–223. doi: 10.1016/0034-4257(85)90058-6
Li, C., Song, J., and Wang, J. (2015). Modifying geometric-optical bidirectional reflectance model for direct inversion of forest canopy leaf area index. Remote Sens. 7, 11083–11104. doi: 10.3390/rs70911083
Li, L., Mu, X., Qi, J., Pisek, J., Roosjen, P., Yan, G., et al. (2021). Characterizing reflectance anisotropy of background soil in open-canopy plantations using UAV-based multiangular images. ISPRS J. Photogr. Remote Sens. 177, 263–278. doi: 10.1016/j.isprsjprs.2021.05.007
Li, X., Cheng, G., Liu, S., Xiao, Q., Ma, M., Jin, R., et al. (2013). Heihe watershed allied telemetry experimental research (HiWATER): Scientific objectives and experimental design. Bull. Am. Meteorol. Soc. 94, 1145–1160.
Li, X., and Strahler, A. H. (1992). Geometric-optical bidirectional reflectance modeling of the discrete crown vegetation canopy: Effect of crown shape and mutual shadowing. IEEE Trans. Geosci. Remote Sens. 30, 276–292. doi: 10.1109/36.134078
Li, Z., Ahlström, A., Tian, F., Gärtner, A., Jiang, M., and Xia, J. (2020). Minimum carbon uptake controls the interannual variability of ecosystem productivity in tropical evergreen forests. Glob. Planet. Change 195:103343. doi: 10.1016/j.gloplacha.2020.103343
Liang, D., and Luo, L. (2012). WATER: Dataset of forest structure parameter survey at the super site around the Dayekou Guantan Forest Station. A Big Earth Data Platform Three Poles. doi: 10.3972/water973.0047.db
Nicodemus, F. E., Richmond, J. C., Hsia, J. J., Ginsberg, I. W., and Limperis, T. (1977). Geometrical considerations and nomenclature for reflectance. Gaithersburg, MD: National Bureau of Standards, doi: 10.6028/NBS.MONO.160
North, P. R. J. (1996). Three-dimensional forest light interaction model using a monte carlo. IEEE Trans. Geosci. Remote Sens. 34:11.
Ponce de León, M. A., and Bailey, B. N. (2019). Evaluating the use of Beer’s law for estimating light interception in canopy architectures with varying heterogeneity and anisotropy. Ecol. Model. 406, 133–143. doi: 10.1016/j.ecolmodel.2019.04.010
Pu, J., Yan, K., Zhou, G., Lei, Y., Zhu, Y., Guo, D., et al. (2020). Evaluation of the MODIS LAI/FPAR algorithm based on 3D-RTM simulations: A case study of Grassland. Remote Sens. 12:3391. doi: 10.3390/rs12203391
Qi, J., Xie, D., Guo, D., and Yan, G. (2017). A large-scale emulation system for realistic three-dimensional (3-d) forest simulation. IEEE J. Sel. Top. Appl. Earth Observ. Remote Sens. 10, 4834–4843. doi: 10.1109/JSTARS.2017.2714423
Qi, J., Xie, D., Jiang, J., and Huang, H. (2022). 3D radiative transfer modeling of structurally complex forest canopies through a lightweight boundary-based description of leaf clusters. Remote Sens. Environ. 283:113301. doi: 10.1016/j.rse.2022.113301
Qi, J., Xie, D., Yin, T., Yan, G., Gastellu-Etchegorry, J. P., Li, L., et al. (2019). LESS: LargE-Scale remote sensing data and image simulation framework over heterogeneous 3D scenes. Remote Sens. Environ. 221, 695–706. doi: 10.1016/j.rse.2018.11.036
Roth, B. D., Saunders, M. G., Bachmann, C. M., and van Aardt, J. A. (2020). On Leaf BRDF estimates and their fit to microfacet models. IEEE J. Sel. Top. Appl. Earth Observ. Remote Sens. 13, 1761–1771. doi: 10.1109/JSTARS.2020.2988428
Roujean, J. L., Leroy, M., and Deschamps, P. Y. (1992). A bidirectional reflectance model of the Earth’s surface for the correction of remote sensing data. J. Geophys. Res. 97:20455. doi: 10.1029/92JD01411
Ryu, Y., Baldocchi, D. D., Kobayashi, H., van Ingen, C., Li, J., Black, T. A., et al. (2011). Integration of MODIS land and atmosphere products with a coupled-process model to estimate gross primary productivity and evapotranspiration from 1 km to global scales. Glob. Biogeochem. Cycles 25:GB4017. doi: 10.1029/2011GB004053
Sandmeier, S., Müller, C., Hosgood, B., and Andreoli, G. (1998). Physical mechanisms in hyperspectral BRDF data of grass and watercress. Remote Sens. Environ. 66, 222–233. doi: 10.1016/S0034-4257(98)00060-1
Schaaf, C. B., Gao, F., Strahler, A. H., Lucht, W., Li, X., Tsang, T., et al. (2002). First operational BRDF, albedo nadir reflectance products from MODIS. Remote Sens. Environ. 83, 135–148. doi: 10.1016/S0034-4257(02)00091-3
Schaaf, C. B., Liu, J., Gao, F., and Strahler, A. H. (2010). “Aqua and Terra MODIS Albedo and Reflectance Anisotropy Products,” in Land remote sensing and global environmental change remote sensing and digital image processing, eds B. Ramachandran, C. O. Justice, and M. J. Abrams (New York, NY: Springer New York), 549–561. doi: 10.1007/978-1-4419-6749-7_24
Song, C., Schroeder, T. A., and Cohen, W. B. (2007). Predicting temperate conifer forest successional stage distributions with multitemporal landsat thematic mapper imagery. Remote Sens. Environ. 106, 228–237.
Sprintsin, M., Cohen, S., Maseyk, K., Rotenberg, E., Grünzweig, J., Karnieli, A., et al. (2011). Long term and seasonal courses of leaf area index in a semi-arid forest plantation. Agric. For. Meteorol. 151, 565–574. doi: 10.1016/j.agrformet.2011.01.001
Suits, G. H. (1971). The calculation of the directional reflectance of a vegetative canopy. Remote Sens. Environ. 2, 117–125. doi: 10.1016/0034-4257(71)90085-X
Verhoef, W. (1984). Light scattering by leaf layers with application to canopy reflectance modeling: The SAIL model. Remote Sens. Environ. 16, 125–141. doi: 10.1016/0034-4257(84)90057-9
Wang, X., Zheng, G., Yun, Z., Xu, Z., Moskal, L. M., and Tian, Q. (2020). Characterizing the spatial variations of forest sunlit and shaded components using discrete aerial lidar. Remote Sens. 12:1071. doi: 10.3390/rs12071071
Wei, S., and Fang, H. (2016). Estimation of canopy clumping index from MISR and MODIS sensors using the normalized difference hotspot and darkspot (NDHD) method: The influence of BRDF models and solar zenith angle. Remote Sens. Environ. 187, 476–491. doi: 10.1016/j.rse.2016.10.039
Wei, S., Fang, H., Schaaf, C. B., He, L., and Chen, J. M. (2019). Global 500 m clumping index product derived from MODIS BRDF data (2001–2017). Remote Sens. Environ. 232:111296. doi: 10.1016/j.rse.2019.111296
Wu, Q., Song, C., Song, J., Wang, J., and Yu, B. (2018). Impacts of leaf age on canopy spectral signature variation in evergreen Chinese fir forests. Remote Sens. 10: 262.
Wu, Q., Yang, S., and Jiang, J. (2022). Canopy structural effects on bidirectional reflectance simulated by the less model: A case study of Picea Crassifolia Forests. ISPRS Ann. Photogr. Remote Sens. Spatial Inform. Sci. X-3/W2-2022, 51–57. doi: 10.5194/isprs-annals-X-3-W2-2022-51-2022
Yan, B., Xu, X., and Fan, W. (2012). A unified canopy bidirectional reflectance (BRDF) model for row ceops. Sci. China Earth Sci. 55, 824–836. doi: 10.1007/s11430-012-4380-9
Keywords: LESS, radiative transfer model, BRDF, canopy reflectance, CI, MODIS MCD43A1, LAI
Citation: Wu Q, Yang S and Jiang J (2023) Impacts of clumping effect on canopy reflectance using 3D radiative transfer modeling. Front. For. Glob. Change 6:1106773. doi: 10.3389/ffgc.2023.1106773
Received: 24 November 2022; Accepted: 19 July 2023;
Published: 07 August 2023.
Edited by:
Alexander Shenkin, University of Oxford, United KingdomReviewed by:
Alexander Wait, Missouri State University, United StatesLinyuan Li, Beijing Forestry University, China
Copyright © 2023 Wu, Yang and Jiang. This is an open-access article distributed under the terms of the Creative Commons Attribution License (CC BY). The use, distribution or reproduction in other forums is permitted, provided the original author(s) and the copyright owner(s) are credited and that the original publication in this journal is cited, in accordance with accepted academic practice. No use, distribution or reproduction is permitted which does not comply with these terms.
*Correspondence: Jie Jiang, amlhbmdqaWVAYnVjZWEuZWR1LmNu